2027年3月期 第2四半期決算説明会 質疑応答集
Bull 1
Bear 0
Results
Fiscal year ends March
Quarters are offset from the calendar — Q1 is Apr–Jun
|
Premium Group Co., Ltd. is a holding company that manages a group of subsidiaries providing finance, warranty, and automotive services. The group's finance segment offers installment credit services for new and used vehicles, solar power systems, and all-electric products, utilizing both advance payment and partner loan methods. In the warranty segment, the company provides breakdown guarantee services, including its own brand and OEM products customized for partners such as Recruit's Car Sensor. The automotive services segment includes vehicle wholesale, the sale of business software named GATCH, subscription leasing, and a recycling business for used parts. The group operates in Japan and Southeast Asia, with specific operations in Thailand, Indonesia, and the Philippines through subsidiaries and joint ventures. Notable partnerships include collaborations with Sumitomo Corporation, Mitsui & Co., and local entities like GT Capital Holdings. The company is scheduled to absorb-merge three subsidiaries into its main entity in 2026. Summarised from the annual report, fiscal year ended Mar 2026 |
Industry Credit Services | Homepage premium-group.co.jp |
| Sector Financial Services | IR page premium-group.co.jp | |
|
Tags
auto credit, breakdown warranty, vehicle leasing, auto parts recycling, business software, solar finance, Eastern Commercial Leasing p.l.c., Etomo Financing Corporation, Premium Service (Thailand) Co. Ltd., PT Premium Garansi Indonesia, Premium Warranty Services Philippines Inc., PT Summit Auto Group, GATCH, Car Premium Club, Car Sensor After Warranty, Premium Warranty, Car Premium Warranty, Premium Warranty Service Co. Ltd., Premium Mobility Service Co. Ltd., Car Premium Co. Ltd.
|
Press page premium-group.co.jp/news |
Metrics
| Valuation | |
|---|---|
| Market cap | ¥ 84.257B |
| Market cap (USD) | $ 526.611M |
| P/E | 11.83 |
| PEG | 0.80 |
| P/BV | 3.13 |
| P/S | 1.77 |
| P/OCF | -10.80 |
| P/FCF | -9.11 |
| Dividend yield | 2.6% |
| Turnover / mcap | — |
| Returns | |
|---|---|
| ROE | 27.4% |
| ROI | 24.0% |
| ROIC | 23.4% |
| Profit margin | 13.8% |
| Growth | |
|---|---|
| Revenue growing | Yes |
| Profits growing | Yes |
| Revenue up 3y | Yes |
| Revenue up 5y | Yes |
| Earnings growth 3y (net profit CAGR) | 14.9% |
| Quality | |
|---|---|
| Profitable | Yes |
| Margin expanding | No |
| Buying back stock | No |
| Diluting (TTM) | No |
| Debt/Equity | — |
| Podcast bulls (TTM) | Sign up |
| Podcast bears (TTM) | Sign up |
| Podcast sentiment (TTM) | Sign up |
| Podcast sentiment % (TTM) | Sign up |
| News sentiment (TTM) | 0 |
| Quality score | 27.8% |
| Insiders | |
|---|---|
| Buys, 1w | Sign up |
| Buys, 1m | Sign up |
| Buys, 1y | Sign up |
| Sells, 1w | Sign up |
| Sells, 1m | Sign up |
| Sells, 1y | Sign up |
Sign up to see this company's insider trades
| Figure | FY 2026 | FY 2025 | FY 2024 | FY 2023 | FY 2022 | FY 2021 | FY 2020 | FY 2019 | FY 2018 | FY 2017 | FY 2016 |
|---|---|---|---|---|---|---|---|---|---|---|---|
| Revenue | 44.042B | 36.409B | 31.546B | 25.263B | 21.104B | 18.586B | 16.132B | 12.074B | 9.065B | 7.9B | 5.297B |
| Net profit | 6.069B | 4.651B | 4.608B | 4.005B | 2.941B | 2.383B | 1.466B | 1.346B | 1.293B | 847M | 330.659M |
| Free cash flow | -22.909B | -9.168B | 2.104B | -768M | 1.365B | 110M | -1.938B | -1.371B | — | — | — |
Filed figures
Lines the statements and their notes report beside the headline figures, read from the filings' XBRL as filed (no restatement applied), with figures computed from one filing's own lines. Cash-flow lines carry their cash direction: an outflow is negative. Each period links to its filing; a figure's period, report date and tag are in its tooltip.
| Figure | Mar 2017 | Mar 2018 | Mar 2019 | Mar 2020 | Mar 2021 | Mar 2022 | Mar 2023 | Mar 2024 | Mar 2025 | Mar 2026 |
|---|---|---|---|---|---|---|---|---|---|---|
| Balance sheet detail | ||||||||||
| Cash and deposits (JPY) | 4.49B | 6.47B | 6.4B | 6.29B | 8.05B | 11.4B | 14.9B | 21.2B | 17.2B | 26.1B |
| Intangible assets (JPY) | — | 5.61B | 5.74B | 5.95B | 5.77B | 6.28B | 7.93B | 8.91B | 9.2B | 8.7B |
| Right-of-use assets (JPY) | — | — | — | — | — | 1.9B | 1.41B | 1.01B | 3.47B | 2.98B |
| Cash flow detail | ||||||||||
| Operating cash flow (JPY) | 2.77B | 1.04B | -1.01B | -1.25B | 1.32B | 1.61B | -449M | 2.49B | -7.76B | -21.3B |
| Purchases of property, plant and equipment (JPY) | — | -48.1M | -152M | -692M | -911M | -243M | -319M | -385M | -442M | -757M |
| Purchases of intangible assets (JPY) | — | -181M | -205M | -282M | -300M | -576M | -1.84B | -1.75B | -965M | -869M |
| Dividends paid (cash effect) (JPY) | — | — | -771M | -570M | -567M | -621M | -722M | -934M | -1.33B | -1.82B |
| Share buybacks (cash effect) (JPY) | — | — | -590,000 | -1.2B | 0.00 | -1M | 0.00 | -2.06B | 0.00 | -300M |
| Interest paid (cash effect) (JPY) | — | -89.4M | -94.2M | -164M | -153M | -153M | -207M | -336M | -518M | -1.06B |
| Income taxes paid (cash effect) (JPY) | — | — | -1.05B | -1.66B | -930M | -1.34B | -1.62B | -1.25B | -2.03B | -3.13B |
| Free cash flow (OCF - PPE - intangibles) (JPY) | — | 814M | -1.37B | -2.22B | 110M | 789M | -2.6B | 356M | -9.17B | -22.9B |
| Income detail | ||||||||||
| Total comprehensive income (JPY) | — | 1.33B | 1.38B | 1.38B | 2.45B | 3.01B | 4.1B | 4.74B | 4.75B | 6.33B |
| Comprehensive income to owners (JPY) | 889M | 1.33B | 1.39B | 1.39B | 2.44B | 2.99B | 4.09B | 4.73B | 4.75B | 6.33B |
| Provision for credit losses (JPY) | — | 45.3M | 1.58B | — | — | — | — | — | — | — |
| Reported | Jun 29, 2018 | Jun 27, 2019 | Jun 30, 2020 | Jun 30, 2020 | Jun 30, 2021 | Jun 29, 2023 | Jun 29, 2023 | Jun 27, 2024 | Jun 24, 2025 | Jun 23, 2026 |
Sign up to see institutional holdings
Sign UpPodcast Mentions
Sign up to see podcast mentions and sentiment
Sign UpTimely disclosures published on TDnet, newest first, titles as filed in Japanese. The link opens the disclosure on TDnet. Filings with EDINET (periodic reports, extraordinary reports, offerings, holding and buy-back reports), newest first, titles as filed in Japanese. The link opens the filing on EDINET. Press releases from the company's own website, newest first.
自己株券買付状況報告書(法24条の6第1項に基づくもの)
Bull 0
Bear 0
Routine
(訂正)「2027年3月期 第2四半期 決算説明資料」の一部訂正について
Bull 0
Bear 0
Routine


 ニュースNEWS












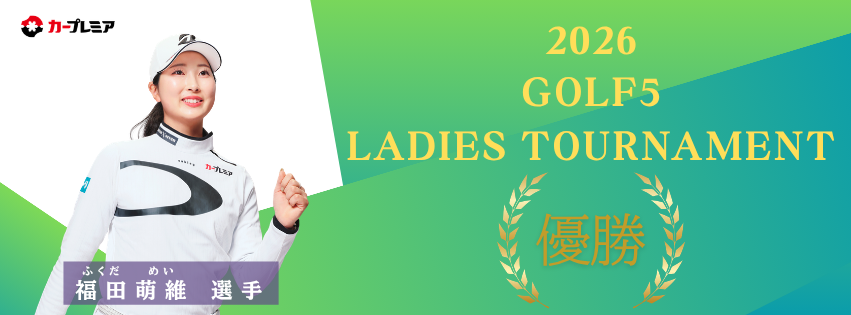





 吉澤選手は、首位タイで迎えた最終日、プレッシャーのかかる最終組でのスタートとなりました。前半から力強いプレーで着実にスコアを伸ばすと、後半も持ち前の粘り強さを発揮。後続からの猛追を力強く振り切り、通算8アンダーでフィニッシュし、プロ3年目にして悲願のJLPGAツアー初優勝をつかみ取りました。
 ■大会概要
Prompts
Click prompts to add them under the company line, click again to take one out, then copy the result into your AI chat. Shared by Asian Century Stocks and Uncovered Thai Stocks. Thank you.
Premium Group Co., Ltd. (ticker 7199), listed in Japan.
Copied
ETFs Holding Premium Group Co., Ltd.
Exchange-traded funds whose newest published daily portfolio holds one of the company's listings, largest weight first.