|
Namura Shipbuilding Co., Ltd. is a Japanese shipbuilding and heavy industry group engaged in the manufacturing and sale of ships, machinery, and steel structures, as well as ship repair services. The company operates through four main business segments: new shipbuilding, ship repair, steel structures and machinery, and other services. Key subsidiaries include Hakodate Dokuk, Sasebo Heavy Industries, Namura Engineering, and Namura Marine, which handle ship construction, repair, technical development, and maintenance. The group also engages in software development, equipment maintenance, and vessel leasing through subsidiaries such as Namura Information Systems, Genkai Tech, and Morning Daidalus Navigation. The company serves customers in the maritime and industrial sectors, providing new vessel construction, repair, and specialized steel fabrication services. Summarised from the annual report, fiscal year ended Mar 2026 |
Industry Marine Shipping | Homepage namura.co.jp |
| Sector Industrials | IR page namura.co.jp/ja/index.html | |
|
Tags
shipbuilding, ship repair, steel structures, machinery manufacturing, vessel leasing, marine engineering, heavy industry, Hakodate Dokuk, Sasebo Heavy Industries, Namura Engineering, Namura Marine, Namura Information Systems, Genkai Tech, Morning Daidalus Navigation, Ivory White Navigation, Cobalt Blue Navigation, Sasebo Marine and Port Service, Hakodate Port Service, Imari Steel Center, Nawa Industry
|
Press page namura.co.jp/ja/news |
Metrics
| Valuation | |
|---|---|
| Market cap | ¥ 331.083B |
| Market cap (USD) | $ 2.069B |
| P/E | 12.98 |
| PEG | 0.53 |
| P/BV | 2.19 |
| P/S | 1.96 |
| P/OCF | 7.16 |
| P/FCF | 9.44 |
| Dividend yield | 1.1% |
| Turnover / mcap | — |
| Returns | |
|---|---|
| ROE | 17.8% |
| ROI | 13.6% |
| ROIC | 13.0% |
| Profit margin | 13.6% |
| Growth | |
|---|---|
| Revenue growing | No |
| Profits growing | No |
| Revenue up 3y | No |
| Revenue up 5y | No |
| Earnings growth 3y (net profit CAGR) | 24.5% |
| Quality | |
|---|---|
| Profitable | Yes |
| Margin expanding | No |
| Buying back stock | No |
| Diluting (TTM) | No |
| Debt/Equity | — |
| Podcast bulls (TTM) | Sign up |
| Podcast bears (TTM) | Sign up |
| Podcast sentiment (TTM) | Sign up |
| Podcast sentiment % (TTM) | Sign up |
| News sentiment (TTM) | 5 |
| Quality score | 5.6% |
| Insiders | |
|---|---|
| Buys, 1w | Sign up |
| Buys, 1m | Sign up |
| Buys, 1y | Sign up |
| Sells, 1w | Sign up |
| Sells, 1m | Sign up |
| Sells, 1y | Sign up |
Sign up to see this company's insider trades
| Figure | FY 2026 | FY 2025 | FY 2024 | FY 2023 | FY 2022 | FY 2021 | FY 2020 | FY 2019 | FY 2018 | FY 2017 | FY 2016 | FY 2015 | FY 2014 | FY 2013 |
|---|---|---|---|---|---|---|---|---|---|---|---|---|---|---|
| Revenue | 159.035B | 159.227B | 135.006B | 124.08B | 83.423B | 98.403B | 111.887B | 124.589B | 134.887B | 137.208B | 147.202B | 135.635B | 124.559B | 118.414B |
| Net profit | 21.59B | 26.245B | 19.954B | 11.194B | -8.419B | -18.778B | -18.03B | 621M | -20.554B | -11.308B | 7.311B | 14.652B | 12.687B | 8.008B |
| Free cash flow | 31.923B | 32.186B | 25.605B | 7.103B | 13.563B | -30.557B | -18.52B | -19.371B | -20.862B | -8.015B | 6.368B | — | — | — |
Filed figures
Lines the statements and their notes report beside the headline figures, read from the filings' XBRL as filed (no restatement applied), with figures computed from one filing's own lines. Cash-flow lines carry their cash direction: an outflow is negative. Each period links to its filing; a figure's period, report date and tag are in its tooltip.
| Figure | Mar 2017 | Mar 2018 | Mar 2019 | Mar 2020 | Mar 2021 | Mar 2022 | Mar 2023 | Mar 2024 | Mar 2025 | Mar 2026 |
|---|---|---|---|---|---|---|---|---|---|---|
| Balance sheet detail | ||||||||||
| Trade receivables (JPY) | 37B | 46.6B | 45B | 28.2B | 34.4B | 24.7B | 33.2B | 45.8B | 40.1B | 43.9B |
| ↳ YoY growth | +1.0% | +25.9% | -3.4% | -37.4% | +22.0% | -28.1% | +34.3% | +38.1% | -12.5% | +9.4% |
| ↳ 5y CAGR | -1.3% | -7.7% | -6.5% | +0.4% | +7.3% | +5.0% | ||||
| Borrowings, current (JPY) | 6.12B | 5.73B | 5.58B | 4.62B | 7.78B | 8.84B | 3.55B | 3.51B | 4.87B | 6.29B |
| Borrowings, non-current (JPY) | 11.6B | 13.4B | 13B | 11.5B | 8.77B | 5.55B | 7.74B | 9.26B | 12.9B | 14.7B |
| Lease liabilities (JPY) | 591M | 417M | 360M | 282M | 973M | 744M | 593M | 532M | 514M | 344M |
| Cash and deposits (JPY) | 98.2B | 77.5B | 66.2B | 44.3B | 13.5B | 25.3B | 29.5B | 55.4B | 90.1B | 122B |
| Intangible assets (JPY) | 457M | 455M | 518M | 487M | 383M | 327M | 358M | 357M | 473M | 657M |
| Net debt (borrowings + leases - cash) (JPY) | -79.9B | -58B | -47.3B | -27.9B | 4.02B | -10.1B | -17.6B | -42.1B | -71.9B | -100B |
| Cash flow detail | ||||||||||
| Operating cash flow (JPY) | -3.14B | -14.2B | -15.6B | -11.6B | -26.6B | 15.1B | 9B | 27.4B | 37.7B | 38.8B |
| Purchases of property, plant and equipment (JPY) | -4.65B | -6.46B | -3.48B | -6.73B | -3.78B | -1.44B | -1.9B | -1.8B | -5.3B | -6.75B |
| Purchases of intangible assets (JPY) | -224M | -161M | -276M | -148M | -142M | -90M | -181M | -133M | -239M | -151M |
| Change in receivables (cash effect) (JPY) | -409M | -9.58B | -1.37B | 16.8B | -6.16B | — | -8.48B | -12.6B | 5.73B | -3.79B |
| Change in inventories (cash effect) (JPY) | 1.61B | 1.4B | 1.36B | -1.73B | -2.03B | -11.3B | 12.5B | -46M | -238M | 447M |
| Change in payables (cash effect) (JPY) | -711M | 2.46B | 2.83B | -4.91B | -7.28B | -3.49B | 763M | 5.09B | -4.02B | -2.23B |
| Dividends paid (cash effect) (JPY) | -1.17B | -897M | -690M | -691M | -207M | — | — | -693M | -2.43B | -3.47B |
| Interest paid (cash effect) (JPY) | -330M | -304M | -321M | -338M | -258M | -225M | -254M | -239M | -205M | -285M |
| Income taxes paid (cash effect) (JPY) | -1.1B | -415M | -443M | -381M | -438M | -305M | -565M | -852M | -3.87B | -4.07B |
| Operating cash flow before change in receivables (JPY) | -2.73B | -4.65B | -14.2B | -28.4B | -20.5B | — | 17.5B | 40B | 32B | 42.6B |
| Free cash flow (OCF - PPE - intangibles) (JPY) | -8.02B | -20.9B | -19.4B | -18.5B | -30.6B | 13.6B | 6.92B | 25.5B | 32.2B | 31.9B |
| Income detail | ||||||||||
| Research and development expense (JPY) | 830M | 883M | 883M | 667M | 462M | 534M | 609M | 643M | 556M | 863M |
| ↳ 5y CAGR | -8.5% | -8.4% | -7.2% | -6.1% | -3.6% | +13.3% | ||||
| Total comprehensive income (JPY) | -10.4B | -21B | -699M | -18.2B | -15.5B | -4.26B | 12.7B | 30.6B | 27.6B | 35.5B |
| Comprehensive income to owners (JPY) | -10B | -20.7B | -668M | -18.2B | -15.3B | -4.26B | 12.7B | 30.4B | 27.3B | 35.4B |
| Segments | ||||||||||
| Steel Structure And Machine · Segment revenue (JPY) | — | — | 11.9B | 6.48B | 6.82B | 5.82B | 6.99B | 6.86B | 6.23B | 6.28B |
| ↳ YoY growth | -45.4% | +5.3% | -14.6% | +20.0% | -1.8% | -9.2% | +0.9% | |||
| Steel Structure And Machine · Segment operating income (JPY) | — | — | 1.11B | 582M | 293M | -17M | 226M | -122M | 115M | 348M |
| Reported | Jun 23, 2017 | Jun 22, 2018 | Jun 25, 2020 | Jun 25, 2020 | Jun 24, 2021 | Jun 24, 2022 | Jun 26, 2024 | Jun 26, 2024 | Jun 25, 2025 | Jun 19, 2026 |
Sign up to see institutional holdings
Sign UpPodcast Mentions
Sign up to see podcast mentions and sentiment
Sign UpTimely disclosures published on TDnet, newest first, titles as filed in Japanese. The link opens the disclosure on TDnet. Filings with EDINET (periodic reports, extraordinary reports, offerings, holding and buy-back reports), newest first, titles as filed in Japanese. The link opens the filing on EDINET. Press releases from the company's own website, newest first.
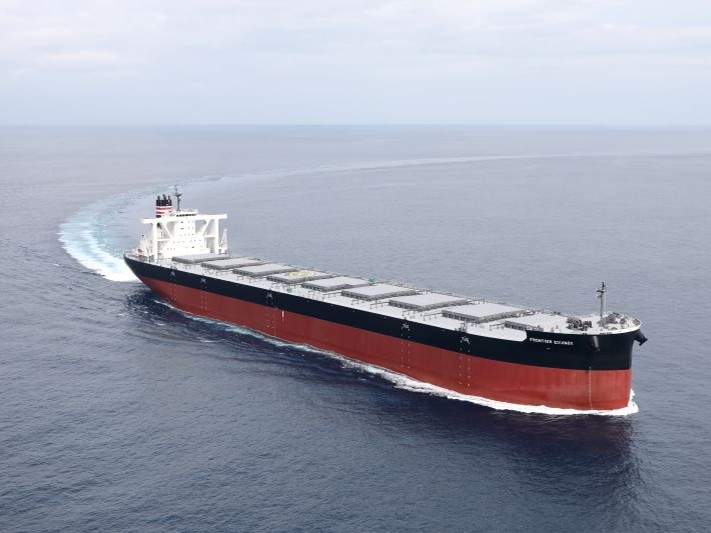
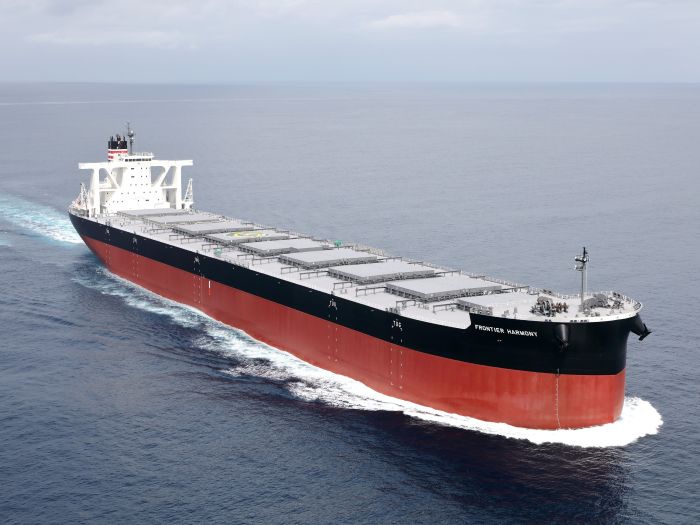 2026/09/15 18 万2千トン型ばら積み運搬船「FRONTIER HARMONY」
 2026/08/07 18 万2千トン型ばら積み運搬船「LIBERTY QUEEN」
 2026/07/08 18 万2千トン型ばら積み運搬船「VERITAS QUEEN」
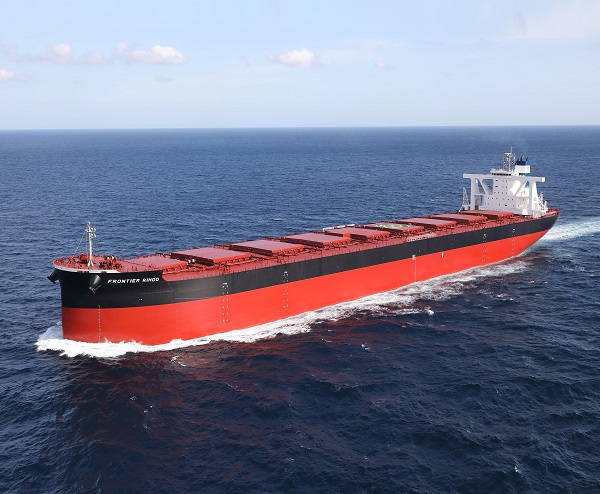
 2026/01/16 18万2千トン型ばら積み運搬船「FRONTIER RINDO」
 2025/11/28 18万2千トン型ばら積み運搬船「AQUABELLA」
 2025/10/29 21万1千トン型LNG/MGO 二元燃料ばら積み運搬船「SG HORIZON」
 2025/06/26 18万2千トン型ばら積み運搬船「GLOBAL FUTURE」
 2025/03/25 21万1千トン型LNG/MGO 二元燃料ばら積み運搬船「SG SUNRISE」
 2024/03/29 18万2千トン型ばら積み運搬船「BO MAY」
 2024/03/01 18万2千トン型ばら積み運搬船「HENG MAY」
 2023/11/30 18万2千トン型ばら積み運搬船「CAPT G」
 2023/11/14 LNG燃料大型石炭専用船「REIMEI(苓明)」
 2023/10/25 18万2千トン型ばら積み運搬船「CAPT TASOS」
 2023/09/13 18万2千トン型ばら積み運搬船「AGIS」
 2023/07/07 18万2千トン型ばら積み運搬船「WORLD SEAFARER」
 2023/03/17 18万2千トン型ばら積み運搬船「AQUAJOY」
 2023/02/10 18万2千トン型ばら積み運搬船「GINA OLDENDORFF」
 2023/01/12 18万2千トン型ばら積み運搬船「OCEAN LEADER」
 2022/11/30 18万2千トン型ばら積み運搬船「ALICE OLDENDORFF」
 2022/10/19 18万2千トン型ばら積み運搬船「CAPE CORMORANT」
 2022/09/13 18万2千トン型ばら積み運搬船「OCEAN ASIA」
 2022/07/26 18万2千トン型ばら積み運搬船「FRONTIER JASMINE」
 2022/06/14 10万トン型ばら積み運搬船「ENERGIA AZALEA」
 2022/05/20 18万2千トン型ばら積み運搬船「FIRST ETERNITY」
 2022/03/29 18万2千トン型ばら積み運搬船「FLORIDA」
 2021/11/26 18万2千トン型ばら積み運搬船「GRAND SAKURA」
 2021/10/14 18万2千トン型ばら積み運搬船「AWAJISAN MARU(淡路山丸)」
 2021/06/02 8万4千トン型ばら積み運搬船「SAIKAI MARU II」
 2021/04/28 10万トン型ばら積み運搬船「KAGAWA MARU」竣工
 2020/12/25 10万トン型ばら積み運搬船「BRILLIANT MERCURY」竣工
 2020/12/07 10万トン型ばら積み運搬船「CAPE ACE」竣工
 2020/06/29 8万5千トン型ばら積み運搬船「CAMELLIA ISLAND」
 2020/06/16 20万8千トン型ばら積み運搬船「METIS HORIZON」竣工
 2020/06/03 18万3千トン型ばら積み運搬船「OCEAN DRAGON」
 2020/05/22 8万5千トン型ばら積み運搬船「ISHIZUCHI Ⅱ」
 2020/01/24 20万8千トン型ばら積み運搬船「SANTA ISABEL」竣工
 2019/12/11 25万トン型鉱石運搬船「NSU BRILLIANCE」
 2019/11/19 18万3千トン型ばら積み運搬船「NIGHTSKY」
 2019/08/29 25万トン型鉱石運搬船「AKAGISAN」
 2019/05/10 25万トン型鉱石運搬船「CAPE ESPERANZA」
 2019/01/25 20万8千トン型ばら積み運搬船「CSK ZEPHYR」
 2019/01/25 18万3千トン型ばら積み運搬船「CAPE OASIS」
 2019/01/25 25万トン型鉱石運搬船「NSU XANADU」
 2019/01/25 9万9千トン型ばら積み運搬船「OI MARU (大井丸)」
 2019/01/25 18万3千トン型ばら積み運搬船「CAPE CLOVER」
 2019/01/25 18万3千トン型ばら積み運搬船「UNITED ETERNITY」
 2019/01/25 9万9千トン型ばら積み運搬船「NAGARA MARU (長良丸)」
 2019/01/25 8万2千トン型ばら積み運搬船「SAKIZAYA LEADER」
 2019/01/25 8万2千トン型ばら積み運搬船「SAKIZAYA KALON」
 2019/01/25 8万2千トン型ばら積み運搬船「XING LE HAI」
 2019/01/25 25万トン型鉱石運搬船「CAPE HAYATOMO」
 2019/01/25 8万2千トン型ばら積み運搬船「XING HUAN HAI」
 2019/01/25 8万2千トン型ばら積み運搬船「SAKIZAYA JUSTICE」
 2019/01/25 8万2千トン型ばら積み運搬船「OLGA V」
 2019/01/25 3万4千トン型ばら積み運搬船「ANDREA ENTERPRISE」
 2019/01/25 3万4千トン型ばら積み運搬船「NARUTO STRAIT」
 2019/01/25 3万4千トン型ばら積み運搬船「NANAIMO BAY」
 2019/01/25 3万4千トン型ばら積み運搬船「AFRICAN HERON」
 2019/01/25 3万4千トン型ばら積み運搬船「AFRICAN EGRET」
 2019/01/25 3万4千トン型ばら積み運搬船「DAIWAN INFINITY」
 2019/01/25 3万4千トン型ばら積み運搬船「DAIWAN HERO」
 2019/01/25 8万2千トン型ばら積み運搬船「AMADEUS」
 2019/01/25 8万2千トン型ばら積み運搬船「CHLOE」
 2019/01/25 8万2千トン型ばら積み運搬船「CORATO」

Prompts
Click prompts to add them under the company line, click again to take one out, then copy the result into your AI chat. Shared by Asian Century Stocks and Uncovered Thai Stocks. Thank you.
ETFs Holding Namura Shipbuilding Co., Ltd.
Exchange-traded funds whose newest published daily portfolio holds one of the company's listings, largest weight first.
| ETF | Weight in ETF | Shares | Market value | As of |
|---|---|---|---|---|
| DFIS | 0.24% | 591,500 | $ 13.983M | Nov 12, 2026 |
| AVDV | 0.18% | 1,596,600 | $ 34.291M | Nov 16, 2026 |
| AVDS | 0.05% | 8,800 | $ 189.002K | Nov 16, 2026 |
| DXIV | 0.02% | 2,300 | $ 54.371K | Nov 12, 2026 |
| DFIC | 0.02% | 126,276 | $ 2.985M | Nov 12, 2026 |
| DFSI | 0.02% | 9,100 | $ 215.122K | Nov 12, 2026 |
| DFAX | 0.01% | 55,100 | $ 1.303M | Nov 12, 2026 |
| AVDE | 0.01% | 101,000 | $ 2.169M | Nov 16, 2026 |
| DFAI | 0.01% | 49,900 | $ 1.18M | Nov 12, 2026 |