Financial Results for First Quarter FY2026 For the year ending March 31, 2027 August 7, 2026 0 Financial Results and Performance Forecast Highlights Consolidated Financial Results for First Quarter FY2026 Business profit increased to ¥35.7bn…
Financial Results for First Quarter FY2026
For the year ending March 31, 2027
August 7, 2026
0
Financial Results and Performance Forecast Highlights
Consolidated Financial Results for First Quarter FY2026
Business profit increased to ¥35.7bn (+¥15.2bn YoY), getting off to a
promising start
PS&E business profit increased significantly YoY, supported by fixed-cost
reductions and IEEPA tariff refunds
Business Profit
FY25Q1
20.5
(Billion Yen)
(Note) Excludes Elimination and corporate
Business Profit
FY26Q1
35.7
ES&M
Precision Machinery
& Robot
PS&E
Total
Earnings forecasts for FY2026
Business profit forecast raised to ¥180.0bn (+¥10.0bn vs previous
forecast), while maintaining the FX assumption of ¥150/USD
External
Factors
Assumed
Middle East situation: Assumes economic activity normalizes by the end of September, while
incorporating a risk buffer for potential production delays and other impacts arising from
material procurement difficulties (see p.17 for details)
U.S. tariff assumptions reflect measures in effect or expected as of Aug. 7, 2026.
© Kawasaki Heavy Industries, Ltd. All Rights Reserved
2
0
Table of Contents
1
Consolidated Financial Results
for first quarter FY2026
3
Summary
Segment
Statement of Profit and Loss
Aerospace Systems
Rolling Stock
Energy Solution & Marine Engineering
21
26
29
Precision Machinery & Robot
Powersports & Engine
33
37
Factors Affecting Changes in Business Profit
Statement of Financial Position
Cash Flows
2
5
6
7
9
11
13
Summary
Factors Affecting Changes in Business Profit
Segment
(ES&M)
(PS&E)
4
Earnings Forecasts for FY2026
16
17
18
Details by Segment
Shareholder Returns and Others
Shareholder Returns
Project Topics
Appendix
42
43
46
Notice
The future figures described in this document in business outlooks, etc., are based on information available at the time and are based on our judgment,
and include risks and uncertainties. Therefore, please refrain from making investment decisions based solely on these earnings forecasts. Please be aware
that actual results may differ significantly from these forecasts due to various important factors caused by changes in both external and internal
environments. Key factors affecting actual performance include the economic conditions surrounding our business domains, the exchange rate of the yen
against the US dollar, tax systems, and various regulations. Furthermore, since the first quarter of fiscal year 2022, our company has been applying IFRS
(International Financial Reporting Standards).
© Kawasaki Heavy Industries, Ltd. All Rights Reserved
3
1
Consolidated Results for First Quarter FY2026
(for the year ending March 31, 2027)
© Kawasaki Heavy Industries, Ltd. All Rights Reserved
4
1
Consolidated Results for First Quarter FY2026
–Summary–
Revenue and profits increased YoY, and Q1 revenue and profits each reached record highs
Strong performance, further supported by IEEPA tariff refunds and yen depreciation
(Billion Yen)
FY25 Q1
FY26 Q1
Quarterly Revenue (billion yen)
Change
749.8
488.4 507.8
Orders Received
446.3
525.7
79.3
Revenue
488.4
543.5
55.1
Business Profit
20.5
35.7
15.2
[4.2%]
[6.6%]
16.8
34.7
[3.4%]
[6.4%]
4.2
15.6
[0.9%]
[2.9%]
143.79
158.05
14.26
20.5
15.1
0.57
0.66
0.09
Q1
Q2
[margin]
Profit Before Tax
Profit Attributable to
Owners of Parent
Weighted-average
exchange rates (USD/JPY)
[margin]
[margin]
US dollar-based transaction (B$)
[+ 2.3pt]
17.9
[+ 2.9pt]
Q1
Q2
565.1
Q3
Q4
FY2025
Q1
FY2026
Quarterly business profit (billion yen), margin
8.3%
4.2%
11.4
3.0%
46.7
[+ 2.0pt]
Q3
8.4%
6.5%
62.6
Q4
FY2025
Q1
FY2026
*1 Excluding the impact of valuation revaluation on foreign currency refund liabilities related to important operational issues of the PW1100G-JM engine.
*2 This is the amount of foreign currency that affects business profits due to exchange rate fluctuations, calculated by deducting dollar-denominated purchases from the dollardenominated sales of Kawasaki Heavy Industries, Kawasaki Railcar Manufacturing, and Kawasaki Motors (including foreign currency sales of loss-allowed projects).
However, each quarter does not include outstanding foreign currency refundable liabilities related to significant operational issues of the PW1100G-JM engine). For the
breakdown of these figures by segment, see p.51
© Kawasaki Heavy Industries, Ltd. All Rights Reserved
5
Consolidated Results for First Quarter FY2026
1
–Segment–
Business Profit increased in PS&E due to fixed cost reductions, IEEPA tariff refunds, and 1
yen depreciation
Revenue increased in Rolling Stock while business profit decreased due to changes in
product mix and temporary cost concentration
2
(billion yen)
Orders Received
FY25 Q1
FY26 Q1
Aerospace Systems
98.9
72.6
Rolling Stock
14.8
42.9
Energy Solution &
Marine Engineering
86.6
Precision Machinery &
Robot
Powersports & Engine
Others
FY25 Q1
FY26 Q1
26.2
101.5
137.6
28.1
55.2
60.1
125.2
38.6
96.6
63.9
89.4
25.5
160.2
170.5
21.7
24.8
446.3
525.7
Elimination and corporate※
Total
Revenue
Change
Business Profit (Loss)
Change
FY25 Q1
FY26 Q1
Change
36.0
0.8
1.6
4.8
3.6
0.4
86.9
9.7
9.7
12.0
56.9
69.5
12.6
2.3
5.2
10.2
160.3
170.7
10.4
8.0
19.2
3.0
17.6
18.5
0.8
1.6
2.2
0.5
0.5
79.3
488.4
543.5
55.1
20.5
35.7
2
2
1
0.8
3.1
2.3
2.9
- Elimination and corporate includes some expenses incurred at head offices which were not allocated to each industry segment for internal reporting
© Kawasaki Heavy Industries, Ltd. All Rights Reserved
6
1
Consolidated Results for First Quarter FY2026
–Statement of Profit and Loss–
(billion yen)
FY25 Q1
%
FY26 Q1
%
Change
Revenue
488.4
100.0
543.5
100.0
55.1
Cost of Sales
396.6
81.2
433.4
79.8
36.8
Gross profit
91.8
18.8
110.0
20.3
18.2
Selling, General and Administrative Expenses
76.9
15.8
83.7
15.4
6.8
1
Salaries and Allowances
20.3
23.9
3.5
R&D Expenses
13.6
13.7
0.1
Others
42.9
46.0
3.1
6.1
7.5
1.3
1.8
2.4
0.0
0.0
0.0
1.8
2.4
15.2
Share of profit (loss) of investments
accounted for using equity method
Other Income and Expenses
Gain on Sale of Property, Plant and Equipment
Others
Business profit (Loss)
© Kawasaki Heavy Industries, Ltd. All Rights Reserved
20.5
4.2
35.7
6.6
Details
① Selling, general and
administrative expenses
increased in line with
revenue growth, but
the SG&A ratio declined
due to disciplined
control of fixed costs
7
1
Consolidated Results for First Quarter FY2026
–Statement of Profit and Loss–
(billion yen)
FY25 Q1
%
FY26 Q1
%
Change
Finance Income and Finance Costs
2.7
Net interest Expense (incl. dividend income)
0.4
Gain and Loss on Foreign Exchange
0.1
4.3
4.1
0.9
17.9
Others
2
Profit Before Tax
16.8
Income Tax Expense
9.5
16.0
6.5
Profit Attributable to Non-Controlling Interests
3.0
3.1
0.0
Profit Attributable to Owners of Parent
4.2
11.4
© Kawasaki Heavy Industries, Ltd. All Rights Reserved
3.4
0.9
34.7
15.6
6.4
2.9
Details
② USD/JPY rate
159.93 end of Q4 FY25
162.45 end of Q1 FY26
Weighted-average
exchange rates
158.05 Q1 FY26
Translation gains were
recognized on foreign
currency-denominated
receivables
8
1
Consolidated Results for First Quarter FY2026
–Details of change in business profit–
Within revenue changes, higher sales volumes in Aerospace Systems and Precision
Machinery & Robot contributed to profit growth
Within product mix and other factors, Aerospace Systems and Rolling Stock temporarily
deteriorated, while PS&E improved due to IEEPA tariff refunds
FY25 Q1
Business
Profit
FY26 Q1
Business
Profit
+15.2 billion yen
Effects of
FX rates*1,2,3
Changes in
revenue
Cost increase
due to U.S.
tariff policies
Share of profit
(loss) of
investments
Change in
accounted for using Change in SG&A
product mix
equity method
expenses*3
and other factors
Breakdown
amount
Price Optimization
IEEPA Tariff Refund
(PS&E)
Inflation, product mix
and other factors
- 7.9
Total
*1 “Effects of FX rates” indicate the direct impact on business profit. Indirect effects (such as the impact of price fluctuations) are included "Change in
product mix and other factors" and "Changes in SG&A expenses”.
*2 “Effects of FX rates” includes the impact of revaluation of refund liabilities denominated in foreign currencies related to the in-service issues of
PW1100G-JM engines(-1.8 billion yen).
*3 “Changes in SG&A expenses” used to indicate changes in the statement of Profit and Loss but has been changed after FY24 Q2 financial results
presentation material to indicate changes after deducting the effects of FX rate(The change factor graphs for each segment shown on page 22 and
later are the same).
© Kawasaki Heavy Industries, Ltd. All Rights Reserved
9
Consolidated Results for First Quarter FY2026
1
–Details of change in business profit–
(billion yen)
FY25 Q1
Business
Profit
(Loss)
Details of change
Effects of Change in
FX rates 1 revenue1
Aerospace Systems
0.8
2.6 *2
3.4
Rolling Stock
3.6
1.2
0.3
Energy Solution &
Marine Engineering
9.7
0.6
Precision Machinery
&Robot
2.3
1.0
2.4
Powersports & Engine
8.0
4.0
Others
1.6
0.0
0.2
Elimination and
corporate
Total
20.5
9.4
2.7
FY26 Q1
Change in
Change in
Cost increase
share of profit (loss) Change in
SG&A
due to U.S. product mix and of investments
1 accounted for using
expenses3
tariff policies other factors
equity method
0.8
1.6
0.4
3.3
1.6
2.3
12.0
1.6
2.9
5.2
10.2
0.0
1.7
11.1
19.2
0.4
0.1
0.5
2.2
0.2
0.3
0.5
9.1
1.3
15.2
35.7
Total
Business
Profit
(Loss)
*1 Effects of foreign exchange rates, change in revenue, and change in product mix are approximate values calculated by our company based on
Certain criteria. In addition, each factor of change is often indivisible, and in particular, it maybe desirable to check the change in revenue and
Change in product mix
*2 Effects of FX rates includes the impact of revaluation of refund liabilities denominated in foreign currencies related to the in-service issues of
PW1100G-JM engine (-1.8 billion yen).
*3 Excluding the effects of FX rates
© Kawasaki Heavy Industries, Ltd. All Rights Reserved
10
1
Consolidated Financial Results for First Quarter FY2026
–Statement of Financial Position-
(billion yen)
End of
End of
Mar 2026
Cash and Cash Equivalents
%
Jun 2026
%
Change
115.4
73.2
1,036.3
939.2
Inventories
822.1
863.8
2+
41.6
Other Current Assets
282.0
311.1
29.0
68.5
Trade Receivables (Incl. contract assets)
Current assets
2,256.0
67.9
2,187.4
1-
67.0
42.1
97.1
PP&E and Intangible assets
625.4
628.6
3.1
Right-of-Use Assets
67.9
65.5
2.3
Deferred Tax Assets
119.4
116.3
3.1
Other Non-Current Assets
255.7
267.6
11.8
Non-Current Assets
1,068.5
32.1
1,078.1
33.0
9.5
Total Assets
3,324.6
100.0
3,265.5
100.0
59.0
PP&E and intangible assets (billion yen)
Turnover of PP&E and intangible assets
508.3
0.69
6/22
Turnover of inventory
594.5
628.6
0.77
0.76
0.82
0.86
6/23
6/24
6/25
6/26
© Kawasaki Heavy Industries, Ltd. All Rights Reserved
① Decreased in PS&E and
Plant
② Increased in Aerospace,
PS&E, and Energy
Inventory (billion yen)
584.1
528.3
Details
661
719.1
775.3
801
863.8
0.53
0.56
0.57
0.61
0.63
6/22
6/23
6/24
6/25
6/26
11
Consolidated Financial Results for First Quarter FY2026
1
–Statement of Financial Position-
(billion yen)
End of
End of
Mar 2026
Jun 2026
%
Trade Payables
549.2
524.0
Interest-Bearing Debt
606.1
671.3
Contract Liability (Advances Received)
386.8
Refund Liability
Details
Change
%
25.1
65.1
376.5
10.3
83.3
76.2
7.0
Retirement Benefit Liability
50.6
50.6
Other Liabilities
699.8
610.1
89.7
67.0
Total Liabilities
2,376.1
Equity Attributable to Owners of Parent
Non-Controlling Interests
Total Equity
Total Liabilities and Equity
Short-term debt (billion yen)
2,309.0
71.5
3
4
70.7
878.1
885.1
7.0
70.3
71.4
1.0
948.4
28.5
956.5
29.3
8.0
3,324.6
100.0
3,265.5
100.0
59.0
Long-term debt (billion yen)
Net D/E Ratio
1,000
800
831.0
666.0
706.0
653.9
732.6
840.0
908.2
851.7
692.5
663.2
710.3
606.1
671.3
600
400
97.1%
109.0%
126.4%
200
88.6%
94.3%
109.6% 115.1%
78.4%
78.7%
Q4
Q1
82.7%
90.5%
54.5%
66.1%
0
Q1
Q2
Q3
FY2023
© Kawasaki Heavy Industries, Ltd. All Rights Reserved
Q4
Q1
Q2
Q3
FY2024
Q2
Q3
FY2025
Q4
Q1
FY2026
③ The increase in borrowings
compared with last year’s
year-end is part of our
normal business cycle
④ Decreased due to
decreased liabilities
associated with factoring
agreements in Aerospace
and PS&E
Appendix
Cash Conversion Cycle (day)
CCC
End of FY2022 Q1
146
End of FY2023 Q1
146
End of FY2024 Q1
159
End of FY2025 Q1
148
End of FY2026 Q1
166
Deteriorated due to longer
receivables and inventory
turnover days, mainly in
Aerospace Systems and PS&E.
12
1
Consolidated Results for First Quarter FY2026
–Cash Flows–
(billion yen)
FY25 Q1
FY26 Q1
Profit Before Tax
16.8
34.7
17.9
Depreciation and Amortization
24.3
26.5
2.2
Increase and Decrease in Working Capital
40.3
18.7
21.6
Trade Receivables※1 (minus notation indicates incr.)
74.7
97.9
23.2
Inventory (minus notation indicates incr.)
7.3
Trade Payables (minus notation indicates decr.)
6.9
Advance Payment (minus notation indicates incr.)
10.6
29.7
41.1
19.2
20.6
Purchase of PP&E and Intangible Assets
0.0
Proceeds from Sales of PP&E and Intangible Assets
0.2
0.0
0.1
6.5
18.7
18.6
2.0
65.4
98.0
Contract Liabilities※2 (minus notation indicates decr.)
Other
Cash Flows from Operating Activities
Other
Cash Flows from Investing Activities
Free Cash Flows
2
3
Change
1
Net Increase and Decrease in Debt and Bonds
(minus notation indicates decr.)
Dividends Paid (Except Payment to Non-Controlling Interests)
2.6
Proceeds and Repayment from Factoring Agreements
3.4
70.5
80.8
5.2
18.0
Other
Cash Flows from Financing Activities
4
*1,2 Accounts receivable include contract assets. The old account name for contract liabilities was Advance Receipts
© Kawasaki Heavy Industries, Ltd. All Rights Reserved
Details
① FY25 Q1:
Although collections of trade
receivables progressed in
Aerospace and Plant,
increased payments such as
corporate income taxes led
to a cash outflow in
operating cash flow
FY26 Q1:
Although collections of trade
receivables progressed in
PS&E and Plant, increased
inventories in Aerospace and
decreased contract liabilities
resulted in a cash outflow
from operating activities
② Including proceeds of ¥7.0
billion from the transfer of
Earth Technica Co., Ltd.
shares in Plant business
③ See Factor Details (3) on p.12
④ Includes 80.0 billion yen in
proceeds from the sale of a
20% stake in Kawasaki Motors,
Ltd., a PS&E operating
company, to ITOCHU
Corporation in FY25 Q1
13
Consolidated Results for First Quarter FY2026
1
–Cash Flows-
Working capital increased significantly, partly due to FX impacts on receivables
and inventories
FCF was slightly negative in Q1, but is expected to turn positive for the full year
(billion yen)
1200
Operating Cash Flow
Investment Cash Flow
Working capital
Free cash flow
Figures in parentheses
indicate profit before tax.
1000
800
(8.5)
547.4
(5.4)
503.4
600
1075.7
710.3
(10.6)
598.2
(17.0)
594.3
(16.8)
880.6
(25.8)
845.9
(14.9)
(- 14.1)
658
(- 4.3)
611.1
(34.7)
400
200
23.6
0
-200
-86.6
FY17 Q1
-74.1
FY18 Q1
-163.7
FY19 Q1
-101.1
FY20 Q1
-29.5
FY21 Q1
-61.9
FY22 Q1
-7.7
-22.4
FY23 Q1
FY24 Q1
-28.4
FY25 Q1
FY26 Q1
IFRS
※ Working capital = Trade receivables + Inventories + Advance payments - Trade payables - Contract Liabilities (advances received)
© Kawasaki Heavy Industries, Ltd. All Rights Reserved
14
2
Forecasts for FY2026
(for the year ending March 31, 2027)
© Kawasaki Heavy Industries, Ltd. All Rights Reserved
15
2
Earnings Forecasts for FY2026
–Summary–
Business profit forecast revised upward on strong Q1 progress
Aiming for further upside while appropriately factoring in risks
(billion yen)
FY2026 Forecast and Progress
FY2025
Actual
Old FCST
New FCST Chg. vs. FY25 Chg. vs. Old FCST Q1 Actual
Orders Received
2,739.1
2,540.0
2,420.0
319.1
Revenue
2,311.2
2,560.0
2,560.0
248.8
145.1
170.0
180.0
34.9
[6.3%]
[6.6%]
[7.0%]
145.5
147.0
157.0
[Margin]
[6.3%]
[5.7%]
[6.1%]
Profit Attributable to
Owners of Parent
[Margin]
108.1
110.0
115.0
[4.7%]
[4.3%]
[4.5%]
After-tax ROIC
9.0%
8.6%
8.6%
Weighted-average
exchange rates (USD/JPY)
149.08
150.00
US dollar-based transaction (B$)
2.20
2.59
2.79
Business Profit
[Margin]
Profit Before Tax
120.0
525.7
1,894.3
543.5
2,016.5
10.0
35.7
144.3
[+ 0.3pt]
[6.6%]
[7.2%]
10.0
34.7
122.3
[+ 0.3pt]
[6.4%]
[6.1%]
5.0
15.6
99.4
[- 0.1pt]
[+ 0.1pt]
[2.9%]
[4.9%]
0.4pt
158.05
150.00
0.20
0.66
2.13
[+ 0.7pt]
11.5
[- 0.1pt]
Q2-4 FCST
6.9
0.59
- The amount of foreign currency impacting operating profit as a result of exchange rate fluctuations, calculated by deducting dollar-denominated purchases from dollardenominated revenue of Kawasaki Heavy Industries, Ltd., Kawasaki Railcar Manufacturing Co., Ltd., and Kawasaki Motors, Ltd., including foreign-currency-denominated
revenue from loss-provisioned projects. See page 51 for a breakdown of these figures by segment
© Kawasaki Heavy Industries, Ltd. All Rights Reserved
16
2
Earnings Forecasts for FY2026
–Factors Affecting Changes in Business Profit*1
External environment improved due to lower tariff burdens, IEEPA refunds and
easing Middle East-related procurement risks, while incorporating a risk buffer
As a result, upward revision in the Robot business largely accounts for the companywide upward revision
Changes in
revenue
Effects of
FX rates
Cost increase
due to U.S. Addressing
tariff policies tariff costs
IEEPA Tariff
Refund
Impact of U.S. tariff policies on profit
Exchange Assumption
USD/JPY 150
EUR/JPY 180
Change in revenue mix,
SG&A Expenses, risk
buffer, and others
Easing of Middle
East Situation
Concerns
Upward revision
in Robot business
forecast※
Impact of Middle East tensions on profit
Segment
May
August
Change
Segment
May
August
Change
Precision Machinery
& Robot
Rolling Stock
PS&E
PS&E
Total
Others
Total
Forecast in May
FY2026 Business Profit
+10.0 billion yen
Exchange Assumption
USD/JPY 150
EUR/JPY 180
Forecast in August
FY2026 Business Profit
*1 The figures for each factor of increase or decrease are approximate values calculated by our company based on certain criteria. The effects of FX rates are calculated
for USD and EUR only; the impact of fluctuations in other currencies is included in Change in revenue mix, SG&A expenses, risk buffer, and others.
*2 U.S. import tariffs included in the calculations are estimated based on regimes and tariff rates that have already been implemented or are expected to be implemented
as of August 7. Even in cases where the Company temporarily bears tariff-related costs, those costs are excluded from the calculation if they can be fully passed on to
customers or other counterparties under contractual arrangements.
© Kawasaki Heavy Industries, Ltd. All Rights Reserved
17
Earnings Forecasts for FY2026
2
-Segment-
Precision Machinery & Robot : Forecast raised due to settlement proceeds 1
and improved profitability
PS&E : Forecast unchanged despite U.S. IEEPA tariff refunds, reflecting
2
market risks and other factors
(billion yen)
Orders Received
FY2026 Forecast
FY2025
Actual
Old FCST New FCST
Aerospace Systems
810.9
600.0
630.0
Rolling Stock
319.1
130.0
130.0
Energy Solution &
Marine Engineering
552.9
650.0
500.0
Precision Machinery &
Robot
278.5
330.0
Powersports & Engine
681.7
Others
Elimination and corporate※
Total
Revenue
FY2025
Actual
Change
Business Profit
FY2026 Forecast
FY2025
Old FCST New FCST
Change
Actual
FY2026 Forecast
Old FCST New FCST
Change
30.0
613.6
720.0
720.0
62.4
72.0
72.0
236.2
230.0
230.0
8.6
10.0
10.0
150.0
433.5
470.0
470.0
55.0
69.0
69.0
330.0
259.1
310.0
310.0
14.3
21.0
31.0
730.0
730.0
682.8
730.0
730.0
22.7
30.0
30.0 2
95.9
100.0
100.0
85.8
100.0
100.0
7.0
4.0
4.0
2,739.1
2,540.0
2,420.0
120.0
2,311.2
2,560.0
2,560.0
145.1
170.0
180.0
1
※ Elimination and corporate includes some expenses incurred at Head Office which were not allocated to each industry segment for internal reporting
© Kawasaki Heavy Industries, Ltd. All Rights Reserved
18
Blank slide
Intentionally blank slide
© Kawasaki Heavy Industries, Ltd. All Rights Reserved
19
3
Details by Segment
© Kawasaki Heavy Industries, Ltd. All Rights Reserved
20
Details by Segment
3
-Aerospace SystemsFY2026 forecast(vs. Forecast in May)
FY2026.Q1(vs. FY2025.Q1)
Orders
received
-¥26.2 Bil.
Orders
received
Down due to reductions in MOD※
allocations
+¥30.0 Bil.
Revenue increased due to increased
shipments for the Ministry of
+¥36.0 Bil. Defense and Boeing
Revenue
Revised up due to higher demand
from the MOD
Forecast unchanged
Revenue
±¥0.0 Bil.
Business
profit
Slightly up due to higher production
ramp-up costs, despite higher
+¥0.8 Bil. revenue
Same as above
Business
profit
±¥0.0 Bil.
※The Ministry of Defense
Revenue(billion yen)
Orders received (billion yen)
882.8
810.9
692.6
FY22
557.4
FY23
FY24
FY25
FY26
Business Profit (billion yen)
55.8
720.0
630.0
345.5
May
Forecast
720.0
May
Forecast
600.0
567.8
348.8
FY22
62.4
72.0
613.6
70.4
14.8
396.1
FY23
May
Forecast
72.0
582.4
FY24
FY25
FY26
FY22
FY24
FY25
FY26
Note: Darker areas in the graphs represent Q1, while lighter areas represent the cumulative total for Q2-Q4
© Kawasaki Heavy Industries, Ltd. All Rights Reserved
21
3
Details by Segment
-Aerospace Systems(billion yen)
FY2025
FY2026
Q1 Actual Q1 Actual
FY2025
Actual
Change
FY2026 Forecast
Old FCST
New FCST
Chg. Vs. FY25 Chg. Vs. Old FCST Q2-4 FCST
Orders Received
98.9
72.6
26.2
810.9
600.0
630.0
180.9
30.0
557.4
Aerospace
65.1
42.0
23.0
570.8
430.0
460.0
110.8
30.0
418.0
Aero Engine
33.8
30.5
3.2
240.1
170.0
170.0
70.1
139.5
101.5
137.6
36.0
613.6
720.0
720.0
106.4
582.4
Aerospace
65.5
93.0
27.5
445.6
525.0
525.0
79.4
432.0
Aero Engine
36.0
44.5
8.5
168.0
195.0
195.0
27.0
150.5
Business Profit
0.8
1.6
0.8
62.4
72.0
72.0
9.6
70.4
[0.8%]
[1.2%]
[+ 0.4pt]
[10.2%]
[10.0%]
[10.0%]
[ー 0.1pt]
[-]
[12.1%]
Revenue
[Margin]
Factors Affecting Changes in Business Profit
Change
in revenue
Change in
(billion yen)
product mix
and other factors
Effects of
FX rates*
FY’25 Q1
FY’26 Q1
Number of aircraft engine component parts
sold (units)
Number of aircraft component parts
sold to Boeing (units)
Change in
SG&A
expenses
- Including the impact of revaluation of refund liabilities
denominated in foreign currencies related to the in-service
issues of PW1100G-JM engine(-1.8 billion yen)
© Kawasaki Heavy Industries, Ltd. All Rights Reserved
Appendix
FY25
Q1
FY26
Full year
Q1
FY25
Change
YoY
Q1
767
7
31
6
▲1
V2500
777
4
21
7
+3
PW1100G
777X
0
7
3
+3
787
5
64
21
FY26
Full year
Q1
Change
YoY
3
21
7
+4
134
666
170
22
3
Details by Segment
-Aerospace SystemsRevenue(billion yen)
Aerospace
224.8
213.3
Aero Engines
160.6
63.4
1Q
93.5
81.5
2Q
3Q
129.1
110.2
4Q
106.3
80.2
48.9
1Q
2Q
3Q
104.9
4Q
1Q
17.9%
Business Profit(billion
yen)
2Q
3Q
16.1%
4Q
1Q
2Q
3Q
137.6
4Q
14.1%
1Q
FY2026
FY2025
12.4%
4.6%
1.1%
146.2
15.9%
12.8%
7.3%
140.9
101.5
FY2024
FY2023
FY2022
120.3
14.1%
6.6%
3.3%
0.8%
1.2%
▲98.1%
© Kawasaki Heavy Industries, Ltd. All Rights Reserved
23
Details by Segment
3
-Aerospace SystemsMarket Overview
Commercial business
– Air passenger demand shifted from recovery to
growth phase, and demand for both aircraft and
engines increased
MOD business
– Against the backdrop of the MOD’s comprehensive
defense enhancement policy, expectations remain
high for further demand growth and improved
profitability, supported by the accelerated increase
in defense spending to 2% of GDP and progress
toward revising the three key defense documents
Specific Efforts
–
Building a Business Expansion Framework
Supply to meet strong demand Reorganization of the
chain and production ramp-up system
–
Operations to acquire new business opportunities
Increased Efficiency and Productivity
–
Promoting the development of defense products and
steady implementation of mass production contracts
Strengthening activities related to defense projects
–
Promoting initiatives in seven priority areas to strengthen defense
capabilities
2
Integrated air and missile defense
capabilities
Stand-off defense capabilities
3
Cross-domain operation capabilities
4
Command and control and
intelligence functions
1
Commercial & Defense Common Areas
– The selection of ‘Aerospace’ and ‘Defense
Industry’ as part of the 17 strategic priority
fields※ is expected to drive market expansion
5
Mobile deployment capabilities
6
Sustainability and resiliency
7
Unmanned defense capabilities
※ Areas to promote priority investment through public-private partnerships as
defined by the Japan Growth Strategy Council established by the
Government of Japan
(Note) About the in-service issues of PW1100G-JM engine
In FY23, the estimated future loss was recorded in a
lump-sum *2, and there is no change at present *3
Our press release on this matter
https://global.kawasaki.com/news_230913-1e.pdf
https://global.kawasaki.com/en/corp/ir/library/pdf/etc_2
31026-1e.pdf
*2 In the fiscal year ending July-September 2023, a loss of ▲58 billion
yen was recorded at the business profit and loss stage
*3 Excluding the impact of valuation due to exchange rate fluctuations
© Kawasaki Heavy Industries, Ltd. All Rights Reserved
Delivery of stand-off electronic
warfare prototypes (June 2026)
–
–
New Anti-Ship Guided Missile for
Island Defense
(Source: Acquisition, Technology &
Logistics Agency website)
KJ300
turbofan engine
Driving Technology Strategies Based on Market Trends
Promoting technological development including the use of
civilian technologies to strengthen defense capabilities
Promoting the development of environmental technologies for
a decarbonized society by utilizing the NEDO Green Innovation
Fund
24
Details by Segment
3
- Rolling Stock FY2026 forecast(vs. Forecast in May)
FY2026.Q1(vs. FY2025.Q1)
Orders
received
+¥28.1 Bil.
Orders
received
Up due to orders received for new
rolling stock for the domestic market
±¥0.0 Bil.
Up due to higher revenue in the U.S. market,
despite lower revenue in the domestic
+¥4.8 Bil. market
Revenue
Business
profit
-¥3.1 Bil.
Down despite higher revenue due to product
mix changes and temporary cost
concentration following a revision of indirect
cost allocation rates
Orders received(billion yen)
±¥0.0 Bil.
251.5
130.0
195.9
Same as above
Business
profit
±¥0.0 Bil.
Revenue (billion yen)
May
Forecast
130.0
Same as above
Revenue
May
Forecast
230.0
319.1
313.2
Forecast unchanged
222.3
236.2
131.9
Business Profit (billion yen)
8.4
230.0
169.9
88.7
May
Forecast
10.0
8.6
10.0
9.6
3.7
1.3
87.1
FY22
FY23
FY24
FY25
FY26
FY22
FY23
FY24
FY25
FY26
FY22
FY23
FY24
FY25
FY26
Note: Darker areas in the graphs represent Q1, while lighter areas represent the cumulative total for Q2-Q4
© Kawasaki Heavy Industries, Ltd. All Rights Reserved
25
3
Details by Segment
- Rolling Stock (billion yen)
FY2025
FY2025
FY2026
Q1 Actual Q1 Actual
Change
FY2026 Forecast
Old FCST New FCST Chg. Vs. FY25
Actual
Q2-4 FCST
Chg. Vs. Old FCST
Orders Received
14.8
42.9
28.1
319.1
130.0
130.0
189.1
87.1
Domestic & Asia
13.4
38.6
25.2
91.3
126.0
126.0
34.7
87.4
North America
1.4
4.3
2.9
227.8
4.0
4.0
223.8
55.2
60.1
4.8
236.2
230.0
230.0
6.2
169.9
Domestic & Asia
17.6
12.2
5.3
81.9
73.5
73.5
8.4
61.3
North America
37.5
47.8
10.2
154.2
156.5
156.5
2.3
108.7
Business Profit
3.6
0.4
3.1
8.6
10.0
10.0
1.4
9.6
[6.6%]
[0.8%]
[ー 5.8pt]
[3.7%]
[4.3%]
[4.3%]
[+ 0.6pt]
[-]
[5.7%]
Revenue
[Margin]
Factors Affecting Changes in Business Profit
Change
Effects of
in revenue
FX rates
(billion yen)
Change in
product mix
and other factors
Appendix
Revenue from components,
overhaul, and after-sales service
(billion yen)
39.5
Progress of the R211 Project for New York City
Subway (as of the end of June 2026)
Base contract
: Full delivery of 535 cars
Option1 contract
Change in
SG & A
expenses
: 430 of 640 cars delivered
Option2 contract
FY25 Q1
© Kawasaki Heavy Industries, Ltd. All Rights Reserved
FY26 Q1
FY22
FY23
FY24
FY25
FY26
(FCST)
: Received an order of 435 cars in Jan. 2025
26
3
Details by Segment
- Rolling Stock Revenue(billion yen)
Domestic & Asia
79.5
North America
64.1
60.1
55.6
51.6
26.4
1Q
32.1
33.7
2Q
3Q
39.5
4Q
43.5
1Q
40.6
2Q
3Q
4Q
43.8
43.2
1Q
2Q
4Q
1Q
FY2024
FY2023
FY2022
3Q
55.2
2Q
57.3
3Q
59.4
4Q
1Q
FY2026
FY2025
7.3%
60.1
6.6%
Business Profit(billion yen)
5.4%
4.4%
4.5%
2.5%
1.5%
© Kawasaki Heavy Industries, Ltd. All Rights Reserved
3.3%
2.1%
1.9%
0.8%
0.3%
3.0%
0.8%
27
3
Details by Segment
Market Overview
Domestic Market
– Continued investment in rolling stock
driven by strong inbound demand
Overseas Market
– Demand is expected to grow as cities
continue investing in urban transit
infrastructure
Medium to long-term forecast
– Stable global growth is expected,
including traffic development in
overseas markets and the demand for
infrastructure in line with economic
development in Asia
(Note) Impact of the Middle East Situation
Production processes were affected by procurement
difficulties for solvents and other materials. The impact is
being mitigated through alternative sourcing, enhanced
global procurement coordination, and delivery schedule
adjustments with customers
© Kawasaki Heavy Industries, Ltd. All Rights Reserved
Specific Efforts
Compliance with delivery schedules for
overseas projects
Project
Status
Dhaka
MRT
Line-6
‣ Final vehicle delivered to customer in
NYCT
R268
MTA
‣ Order for 378 railcars finalized in
–
–
–
FY2024 (144 cars of 24 trains )
Milestone
The final vehicle delivery
FY2024
Handover of base facilities
FY2026
December 2025 (U.S. time), with a total
contract value of approximately ¥225
billion
The final vehicle delivery
FY2030
Achieving quality levels
trusted by customers
Reductions of spoilage and repair costs
Continuation of production management
based on KPS (Kawasaki Production
System) at domestic and overseas
production sites
THG100 Electric diesel
locomotive for Tenryu
Hamanako Railroad Co., Ltd.
(Green DEC)
Expansion of parts & after-sales service, and
growth in maintenance businesses
Promotion of remote track monitoring equipment for
North American market
–
Promotion of railcar condition monitoring equipment for
domestic market
–
Promoting wider adoption of the new electric-diesel
hybrid Green DEC for regional railways, enabling lifecycle
support from introduction through condition monitoring,
operational support, and parts supply
28
Details by Segment
3
- Energy Solution & Marine Engineering FY2026 forecast(vs. Forecast in May)
FY2026.Q1(vs. FY2025.Q1)
Up due to orders for domestic waste
treatment facility construction projects
Orders
received
-¥150.0 Bil.
Revised down due to the
postponement of a large-scale project
in the Plant business
Down due to lower revenue in the Energy
and Marine Engineering businesses
Revenue
Forecast unchanged
Up despite lower revenue, supported by a
gain on the sale of subsidiary shares and
+¥2.3 Bil. higher equity-method earnings
Business
profit
Orders
received
+¥38.6 Bil.
Revenue
-¥9.7 Bil.
±¥0.0 Bil.
Business
profit
May
Forecast
650.0
Orders received (billion yen)
542.0
439.0
552.9
±¥0.0 Bil.
Revenue (billion yen)
May
Forecast
470.0
500.0
401.6
314.5
353.2
Same as above
398.1
433.5
May
Forecast
69.0
Business Profit (billion yen)
69.0
470.0
55.0
44.2
374.8
57.0
31.9
383.1
3.9
FY22
FY23
FY24
FY25
FY26
FY22
FY23
FY24
FY25
FY26
FY22
FY23
FY24
FY25
FY26
Note: Darker areas in the graphs represent Q1, while lighter areas represent the cumulative total for Q2-Q4
© Kawasaki Heavy Industries, Ltd. All Rights Reserved
29
3
Details by Segment
- Energy Solution & Marine Engineering (billion yen)
FY2025
FY2026
Q1 Actual Q1 Actual
FY2025
Change
Actual
FY2026 Forecast
Old FCST New FCST Chg. Vs. FY25
Chg. Vs. Old FCST
Q2-4 FCST
86.6
125.2
38.6
552.9
650.0
500.0
52.9
374.8
81.5
121.4
39.9
456.2
530.0
380.0
76.2
150.0
258.6
5.1
3.7
1.3
96.6
120.0
120.0
23.4
116.3
96.6
86.9
9.7
433.5
470.0
470.0
36.5
383.1
65.4
59.6
5.8
323.9
345.0
345.0
21.1
285.4
31.2
27.2
3.9
109.6
125.0
125.0
15.4
97.8
9.7
12.0
2.3
55.0
69.0
69.0
14.0
57.0
[Margin]
[10.1%]
Share of profit (loss) of investments
6.1
accounted for using equity method
[13.9%]
[+ 3.8pt]
[12.7%]
[14.7%]
[14.7%]
[+ 2.0pt]
[-]
[14.9%]
1.6
23.7
27.5
27.5
3.8
19.7
Orders Received
Energy, Plant &
Marine Machinery
Ship & Offshore Structure
Revenue
Energy, Plant &
Marine Machinery
Ship & Offshore Structure
Business Profit
7.8
Factors Affecting Changes in Business Profit
Change in product mix
and other factors
(billion yen)
Change
in SG & A
expenses
Change
in revenue
Effects of
FX rates
Appendix
Revenue of major products in the energy business
above:components
below:after-sales service
84.3
92.1
(billion yen)
86.5
Change in share of
profit(loss) of
investments
accounted for
using equity method
© Kawasaki Heavy Industries, Ltd. All Rights Reserved
FY26 Q1
92.0
Revenue of municipal waste incineration plants
Net sales
(billion yen)
O&M ratio to net sales
62.1
42.0
73.0
FY25 Q1
61.9
50.0
46.4
33.2
50.0
41.0%
FY22
FY23
FY24
FY25
FY26
(FCST)
FY22
FY23
FY24
FY25
FY26
(FCST)
30
3
Details by Segment
- Energy Solution & Marine Engineering Revenue(billion yen)
Energy, Plant & Marine Machinery
137.1
Ship & Offshore Structure
118.8
102.1
63.5
1Q
70.9
2Q
77.8
3Q
111.9
100.9
70.7
4Q
134.2
1Q
77.0
2Q
86.5
3Q
4Q
80.1
79.8
1Q
2Q
4Q
1Q
FY2024
FY2023
FY2022
3Q
96.6
90.6
2Q
3Q
1Q
FY2026
17.3%
12.9%
12.8%
9.4%
8.3%
4.4%
4Q
FY2025
Business Profit(billion yen)
8.1%
86.9
14.0%
10.1%
7.5%
11.2%
11.7%
13.9%
7.6%
3.5%
© Kawasaki Heavy Industries, Ltd. All Rights Reserved
31
3
Details by Segment
- Energy Solution & Marine Engineering Market Overview
Specific Efforts
Products and services that contribute to a lowcarbon and decarbonized society
Energy, Plant & Marine Machinery
Domestic
– Solid demand for power
generation equipment and
energy infrastructure
– Continued demand for renewal
of aging waste incineration
plants
Overseas
– Strong demand for gas
turbines used in distributed
power generation for data
centers
Case
–
Started demonstration of CO₂ separation and
recovery from waste incineration exhaust gas
at the Fukuyama Clean Center in Koriyama City in Japan
Operational data from actual exhaust gases
helps identify issues and accelerate KCC
commercialization
Submarines and special vessels
Received the Minister of Education, Culture,
Sports, Science and Technology Award at the
55th Japan Industrial Technology Awards
(Nikkan Kogyo Shimbun)
– Shipyards are fully booked,
so deals focus on later
deliveries
₋
Continuous orders for surface
ship main engines and power
generation systems
Awarded for efficient carbon-neutral technology
and scalable modular design
– Ship prices continue to be
high, affected by the soaring
cost of materials and
equipment
₋
Stable orders for submarines
Ship & Offshore Structure
Commercial ships
Topics
Risks
Carbon neutrality
– Logistics and foreign
exchange volatility related to
U.S. tariff policies and the
Middle East situation
Inquiries and requests for
cooperation are increasing
regarding transition solutions
associated with the return to
LNG, as well as decarbonization
solutions such as KCC*
– Concerns about pressure on
profits due to persistently
high raw material, equipment,
and fuel costs
© Kawasaki Heavy Industries, Ltd. All Rights Reserved
Initiatives toward Providing Decarbonization Solutions
Case
Entire segment
- Kawasaki CO2 Capture: CO2 Separation
and Capture system
KCC Demonstration
in Koriyama Fukuyama
Clean Center
–
–
–
Gas turbine cogeneration system with 8MW class
hydrogen co-firing DLE* combustor now in
operation at Teijin's Matsuyama North Plant
Cuts CO₂ emissions and supports
customer decarbonization
Designed for future hydrogen adoption
with scalable infrastructure
Enables a low-cost transition to hydrogen
co-firing
Note: Dry Low Emission : A method that reduces NOx emissions by
controlling the maximum combustion temperature regardless of
water or steam injection
DLE Combustor
Compatible with
hydrogen co-firing
gas turbine
32
Details by segment
3
- Precision Machinery & Robot FY2026.Q1(vs. FY2025.Q1)
Orders
received
+¥25.5 Bil.
Revenue
FY2026 forecast(vs. Forecast in May)
Up due to stronger demand for hydraulic
equipment in the Chinese construction
machinery market and robots for
semiconductor manufacturing equipment
Orders
received
Same as above
Revenue
±¥0.0 Bil.
+¥12.6 Bil.
Business
profit
±¥0.0 Bil.
Business
profit
Up due to revenue growth
+¥2.9 Bil.
+¥10.0 Bil.
May
Forecast
330.0
Orders Received (billion yen)
May
Forecast
310.0
Revenue (billion yen)
213.3
249.2
278.5
FY23
FY24
FY25
252.6
FY26
Revised up due to settlement
proceeds and improved profitability
May
Forecast
21.0
Business Profit (billion yen)
310.0
227.9
241.5
259.1
240.6
FY22
Forecast unchanged as higher sales
of robots for semiconductor
manufacturing equipment offset
lower sales of robots for automobiles
31.0
330.0
262.0
Forecast unchanged
240.5
FY22
FY23
FY24
FY25
FY26
8.7
FY22
14.3
25.8
FY25
FY26
7.0
FY23
FY24
Note: Darker areas in the graphs represent Q1, while lighter areas represent the cumulative total for Q2-Q4
© Kawasaki Heavy Industries, Ltd. All Rights Reserved
33
3
Details by segment
- Precision Machinery & Robot (billion yen)
FY2025
FY2026
Q1 Actual Q1 Actual
FY2025
Change
Actual
FY2026 Forecast
Old FCST New FCST Chg. Vs. FY25
Q2-4 FCST
Chg. Vs. Old FCST
63.9
89.4
25.5
278.5
330.0
330.0
51.5
240.6
43.6
53.8
10.1
173.1
210.0
210.0
36.9
156.2
20.2
35.6
15.4
105.3
120.0
120.0
14.7
84.4
56.9
69.5
12.6
259.1
310.0
310.0
50.9
240.5
38.9
48.9
9.9
166.1
195.0
195.0
28.9
146.1
Robotics
17.9
20.6
2.6
92.9
115.0
115.0
22.1
94.4
Business Profit
2.3
5.2
2.9
14.3
21.0
31.0
16.7
10.0
25.8
[4.1%]
[7.6%]
[+ 3.4pt]
[5.6%]
[6.8%]
[10.0%]
[+ 4.4pt]
[+ 3.2pt]
[10.7%]
0.1
0.3
0.7
0.5
0.5
0.2
0.7
Orders Received
Hydraulic
Components & Systems
Robotics
Revenue
Hydraulic
Components & Systems
[Margin]
Share of profit (loss) of investments
accounted for using equity method
Factors Affecting Changes in Business Profit
Change in
product mix
and other factors*1
(billion yen)
Change in SG&A
expenses
Change
in revenue
Appendix
Revenue from hydraulic components to China
(billion yen)
above: Q2-Q4
below: Q1
52.4
Effects of
FX rates
41.0
Change in share of
profit(loss) of investments
accounted for
using equity method
58.7
YoY
Increase
47.0
*1 Including a negative impact of
¥0.4 billion from U.S. tariff
policies
FY25 Q1
© Kawasaki Heavy Industries, Ltd. All Rights Reserved
FY26 Q1
FY22
FY23
FY24
FY25
FY26
(FCST)
Revenue of robots by segment※
(billion yen)
above: Q1
below: Full Year
FY25
FY26
Automobile assembly
and painting
5.8
36.8
5.0
*39.0
Semiconductor
9.0
37.9
12.5
*53.5
General robots for
industrial use and
others
5.1
27.8
6.2
*35.0
Total
19.9
102.5
23.9
*127.0
※Including intercompany revenue
Change
34
3
Details by segment
- Precision Machinery & Robot Revenue
(billion yen)
Hydraulic Components & Systems
73.5
Robotics
65.0
52.6
1Q
69.2
61.5
49.3
2Q
3Q
4Q
1Q
53.7
2Q
55.6
3Q
52.6
4Q
1Q
56.8
2Q
59.4
3Q
4Q
1Q
60.0
2Q
3Q
3.1%
1.8%
0.5%
3.6%
2.3%
4Q
FY2025
5.2%
3.5%
69.5
65.5
7.4%
6.2%
2.8%
56.9
FY2024
FY2023
FY2022
76.5
72.6
4.1%
1Q
FY2026
6.9%
7.6%
3.2%
Business Profit
(billion yen)
© Kawasaki Heavy Industries, Ltd. All Rights Reserved
35
3
Details by segment
- Precision Machinery & Robot Market Overview
Specific Efforts
Hydraulic Business Growth Strategy
Hydraulic components
China
– Steady demand for large
mining equipment and
export machines for Africa
and Southeast Asia
Other Markets
– U.S.: Pipeline construction
and AI data center
investments are driving
the market
– India: Demand is increasing
after the government’s
announcement of a major
infrastructure spending
increase
Mid- to Long-Term Trends in
the Construction Machinery
– Electrification and
efficiency gains driven by
fuel cost inflation and
environmental regulations,
as well as automation,
autonomy, and remote
operation driven by labor
shortages and harsh
construction-site
conditions
– Increasing trend due to
rapid growth in AI and
rising demand for
general-purpose memory
© Kawasaki Heavy Industries, Ltd. All Rights Reserved
New Product Development / Market Expansion
– Electrification, automation, and remote operation of construction
machinery
– Tough robotics leveraging hydraulics and robotics
– Development of hydrogen compressors, fuel cell systems, and defense
products
Optimizing Global Production
– Expanding cost-competitive
models through production
expansion at Aisaki Precision
Machinery (Suzhou) Co., Ltd.
Strengthening the service
business
– Strengthening the service
business overseas sales
networks
Robotics Business Strategy
Focus on high Value-Added Areas
Robotics
For semiconductor
production
New joystick-type electric
remote control unit “ERUJ”
enters mass production
For general purposes
– Smart factory demand
continues to rise amid
rising labor costs and
labor shortages, despite
heightened geopolitical
risks
–
Development of supply system for
full-scale recovery of
semiconductor market
–
Expansion of new fields (Vacuum
process, Back-end process, EFEM,
factory automation, etc.)
Medical Business Expansion
– European rollout of the
hinotoriTM”(with Medicaroid and
Sysmex)
– Differentiation via Remote
Operation Technologies (with
FORRO/mapxus )
Accelerating Investment in Growth
Areas
–
Enhancing cost competitiveness
through an integrated Japan-China
framework
–
Shifting resources to growth areas
–
Advancing social robotics
(healthcare and nursing care)
Topics
Selected for METI/NEDO Physical AI
project (Japanese only)
Medicaroid Obtains CE Marking
Under the MDR for the hinotoriTM
Surgical Robot System
36
3
Details by segment
- Powersports & Engine FY2026.Q1(vs. FY2025.Q1)
Revenue
+¥10.4 Bil.
Business
Profit
+¥11.1 Bil.
FY2026 forecast(vs. Forecast in May)
Up due to higher general-purpose
engine sales and favorable FX
effects, despite lower motorcycle
sales in developed markets
Revenue
Up due to IEEPA tariff refunds,
lower promotional expenses, fixed
cost reductions, and FX effects
Business
Profit
Orders Received (billion yen)
Qualitative information and graph are
omitted because this segment is mainly
engaged in estimated production, and
orders received are generally the same
as revenue
±¥0.0 Bil.
±¥0.0 Bil.
May
Forecast
730.0
Revenue (billion yen)
591.1
592.4
609.3
682.8
730.0
Forecast unchanged due to higher
revenue of general-purpose
engines, offsetting lower motorcycle
sales in developed markets
Forecast unchanged despite IEEPA
tariff refunds, due to market risks
and other factors
Business Profit (billion yen)
71.5
May
Forecast
30.0
48.0
47.8
559.3
22.7
FY22
FY23
FY24
FY25
FY26
FY22
FY23
FY24
FY25
30.0
10.8
FY26
Note: Darker areas in the graphs represent Q1, while lighter areas represent the cumulative total for Q2-Q4
© Kawasaki Heavy Industries, Ltd. All Rights Reserved
37
3
Details by segment
- Powersports & Engine (billion yen)
FY2025
FY2026
Q1 Actual Q1 Actual
Revenue
Motorcycles for
developed markets
Motorcycles for
emerging markets
Utility Vehicles, ATVs & PWC
General-purpose
gasoline engines
Business Profit
[Margin]
FY2025
Change
Actual
FY2026 Forecast
Old FCST New FCST Chg. Vs. FY25
160.3
170.7
10.4
682.8
730.0
730.0
47.2
64.3
60.3
4.0
261.9
275.0
270.0
8.1
24.8
26.1
1.3
102.6
110.0
110.0
7.4
46.1
49.2
3.0
211.4
240.0
235.0
23.6
24.9
34.9
10.0
106.7
105.0
115.0
8.3
8.0
19.2
11.1
22.7
30.0
30.0
[5.0%]
[11.3%]
[+ 6.2pt]
[3.3%]
[4.1%]
[4.1%]
Q2-4 FCST
Chg. Vs. Old FCST
559.3
5.0
209.7
83.9
5.0
185.8
10.0
80.1
7.3
10.8
[+ 0.7pt]
[-]
[1.9%]
Appendix
Factors Affecting Changes in Business Profit
Wholesale volume by region
FY25 Q1
FY26 Q1
Change
Japan
10
3
-6
North America
23
18
-5
Europe
22
21
-1
Others※
2
2
+0
59
46
Philippines
46
42
-4
Note : The following
table shows the
trend of YoY changes
in motorcycles of
developed and
emerging countries
and regions included
in "Others"
Indonesia
3
5
+1
Australia:
Latin America
4
5
+1
China:
Others※
8
7
-1
Thailand:
63
60
-2
280
19
20
+1
95→90
(billion yen)
Change in product mix
and other factors
Change in
SG&A
expenses
Effects of Change
FX rates in revenue
Developed
countries
Total
Emerging
countries
Cost increase due
to U.S. tariff
policies
FY25 Q1
FY26 Q1
※ Including ¥8.0 billion from IEEPA tariff refunds
© Kawasaki Heavy Industries, Ltd. All Rights Reserved
Total
Four-wheeler
・PWC
(thousand units)
North America
and Others
FY26(FCST)
240→230
38
Details by segment
3
- Powersports & Engine Revenue(billion yen)
1Q
2Q
3Q
4Q
1Q
2Q
3Q
4Q
1Q
3Q
4Q
1Q
2Q
FY2024
FY2023
FY2022
2Q
3Q
4Q
1Q
FY2026
FY2025
17.3%
10.9%
10.2%
10.0%
9.9%
7.2%
Business Profit(billion yen)
8.5%
6.5%
8.4%
8.0%
3.1%
11.3%
10.0%
7.1%
5.0%
0.9%
© Kawasaki Heavy Industries, Ltd. All Rights Reserved
39
Details by segment
3
- Powersports & Engine Market Overview
–
–
–
–
–
–
U.S. (Motorcycles)
Despite a softening retail market, our market share
remains strong
U.S. (Four-wheelers)
The market is expected to grow over the medium to
long term, but sales of recreational models, which are
susceptible to loan interest rates and fuel price
increases, have softened
Expanded market share driven by strong sales of key
models
U.S. (Common to both business above)
Specific Efforts
–
Market-Driven Product Supply
–
Flexible production and sales aligned
with demand and inventory trends
KX327
Kawasaki’s first fuel-injected
Strengthening the four-wheeler
2-stroke model
–
business
Enhance competitiveness and profitability through a
market-in approach tailored to the U.S. market
Respond quickly to market changes through flexible use of
U.S. and Mexico plants
–
Concerns over demand declines caused by tariff
measures
Europe
Launch attractive Kawasaki-brand
models
–
Advancing Decarbonization
Contribute to carbon neutrality through electrification,
hydrogen engines and other solutions leveraging Kawasaki
technologies
Share gains driven by new model launches amid a
gradual market recovery
Collaboration with the ITOCHU Group
Southeast Asia
–
Sports segment remains at low level overall, although
some regions are showing signs of recovery
Status
(Appendix) Impact of the Situation in the Middle East
Procurement risks for solvents and other materials persist;
impact to be mitigated through enhanced procurement
coordination across global sites
Potential demand slowdown due to higher fuel prices, mainly in
emerging markets
© Kawasaki Heavy Industries, Ltd. All Rights Reserved
Plan
–
Established Kawasaki Motors Retail Finance, LLC with
ITOCHU in April 2025 to expand business and strengthen
the customer base
Operations launched in 49 states as of June 2026; nationwide
network established with the Dallas office opening
Leveraging data to develop financing products, increase
financing penetration and build a high-quality asset base
Pursuing new market development opportunities jointly
across Asia, Latin America, the Middle East, and Africa
40
4
Shareholder Returns and Other information
© Kawasaki Heavy Industries, Ltd. All Rights Reserved
41
4
Shareholder Returns
Dividend Policy
ー FY2026 Dividend Outlook ー
Dividend per Share*2(yen)
To enhance long-term shareholder value while
ensuring stable and sustainable shareholder
returns, a dividend policy with a target of
Dividend on Equity*1
DOE 4%
has been adopted
*1 DOE = Total annual dividends ÷ (Equity attributable to owners
of the parent − Other components of equity)The average of the
beginning and end of the fiscal year is used
FY25
FY26 (FCST)
Change
Interim
15.0
20.0
+5.0
Year-end
19.2
20.0
+0.8
Annual
34.2
40.0
+5.8
*2 Converted based on the number of shares after the five-for-one
stock split effective April 1, 2026.
40.0
Transition of Dividends per Share※2 (yen)
12.0
FY16
12.0
FY17
7.0
FY19
Nondividend
FY20
FY24
FY25
10.0
8.0
FY21
FY22
30% Dividend Payout Ratio as a Guideline
© Kawasaki Heavy Industries, Ltd. All Rights Reserved
34.2
18.0
14.0
FY18
30.0
FY23
FY26
DOE4% approach
42
4
Project Topics
Capital Raising through New Shares and CBs*1
ー Strengthening Core Businesses and Investing for Future Growth ー
*1 Zero Coupon Convertible Bonds
*2 Details Approx. ¥20.0 bn (from 2031 CB)
Approx. ¥50.5 bn (from 2033 Transition CB)
Combined PO & CB offering mitigates dilution while preserving financial soundness
and expanding borrowing capacity
Accelerating Monozukuri (Manufacturing) Transformation through Physical AI
Equity
¥97.4bn
Approx.
Capex for production
capacity enhancement
and efficiency
improvements
through Physical AI
Commercial
Aircraft &
Aero Engine
¥101.0bn
Approx.
Strategic investments
in long-term growth
areas
Capacity expansion & productivity improvement
Location
Gifu, Nagoya, Nishi-Kobe and Akashi Works
Social Implementation of
Physical AI
¥30.5bn
Approx.
Gas Turbines Proceeds
Location
Capex to expand production capacity
Proceeds R&D investments and strategic
investments for alliance expansion
Akashi works
Achieve production transformation
Robotics
Shipbuilding
CB
Proceeds
Proceeds
Capacity expansion for semi-equipment robots
Location
Nishi-Kobe Works
Proceeds
Capacity expansion for LH₂, LPG and ammonia
carriers
Location
Sakaide Works
Development of a Liquefied
Hydrogen Supply Chain
Proceeds
© Kawasaki Heavy Industries, Ltd. All Rights Reserved
¥70.5bn
Approx.
Commercialization through investment in Japan Suiso Energy,
the Kawasaki LH₂ Terminal, and liquefied hydrogen carriers
*2
in the short to medium term and
provide cross-business support
Conceptual Image
of Physical AI
NEWS Establishment of a Physical AI development
hub in Silicon Valley (See next page)
43
4
Project Topics
Accelerating the Social Implementation of Physical AI
ー Growth Driven by Physical AI ー
On-site manufacturing expertise and data as
the key to Physical AI development
Kawasaki, a unique robotics manufacturer with diverse
manufacturing sites across its businesses
Advancing the social implementation of Physical AI by
combining our strengths with the capabilities of global AI
leaders
Robotics
Our Strengths
AI
Physical
AI
Partner
Physical AI Growth Pathways
© Kawasaki Heavy Industries, Ltd. All Rights Reserved
1
Internal Deployment
2
Commercial Deployment
3
Product Integration
01 May 2026: Establishment of the Kawasaki
Physical AI Center in Silicon Valley, USA
02 KHI Collaborates with NVIDIA, Analog
manufacturing
site
Related News
Profitability enhancement through manufacturing
optimization and labor savings enabled by Physical
AI robots
Sales of Physical AI robots and AI licensing
services
Value enhancement through AI-enabled
non-robotic products
Devices, Microsoft, and Fujitsu to
Accelerate Development of Physical AI
toward Social Implementation
Partner Collaborations at the Center
Focus on healthcare and elder care, addressing global
challenges such as aging populations and labor
shortages
Development of a “Hospital One-Stop Solution” that
supports the entire patient journey through the
integration of Physical AI and robotics
Expansion into a broad range of industrial sectors,
including semiconductors, automotive, and new
mobility
“ Together, Kawasaki and
Nvidia are building the
foundation for a new
generation of intelligent
machines.
”
Mr. Jensen Huang
NVIDIA CEO
44
4
Project Topics
Building a liquefied hydrogen supply chain connecting North America, Europe, and Japan
— Partnerships Expanding Across Supply, Transportation and Demand —
Supply
Demand
Transportation
New Supply Source Development in North America
Developing new supply candidates in North America
Enhancing Maritime Transport & Terminal
Infrastructure
Expanding into European Demand Markets
Canada–Japan Collaboration Launched to
Explore Liquefied Hydrogen Supply Chain
Strategic Alliance with EcoLog
in Liquefied Hydrogen Midstream
Signed agreement to develop liquefied
hydrogen supply chain to Europe via
Hamburg
Apr. 2026: Signed an MOU with ERHH11, AIHA2 and
May 2026: Signed an MOU with EcoLog on a strategic
May 2026: Signed a Joint Development Agreement
Edmonton Global to explore the development of a
alliance in the liquefied hydrogen supply chain
with MB Energy*3 and Daimler Truck AG to develop a
liquefied hydrogen supply chain in Alberta, Canada.
midstream segment, including maritime
hydrogen supply chain.
Alberta has strong potential as a low-carbon
transportation and terminals.
Aiming to establish a transport route via the Port of
hydrogen supply hub, supported by abundant natural
Leveraging our products and technologies in EcoLog's
gas resources and CCS infrastructure.
liquefied hydrogen corridor project under
Exploring a hydrogen supply chain originating in
development at the Port of Amsterdam. Aiming to
Canada, covering liquefied hydrogen production, rail
and maritime transportation, storage, and utilization
Press release
https://global.kawasaki.com
/news_260422-1e.pdf
*1 Edmonton Region Hydrogen Hub
establish a safe and stable liquefied hydrogen supply
network from global production hubs to demand
centers across Europe.
Press release
https://global.kawasaki.com/news
_260521-1e.pdf
Hamburg to ensure a stable hydrogen supply and
promote hydrogen utilization in the European mobility
sector.
Targeting commercial operation in the early 2030s
through the development of an economically viable
and reliable hydrogen supply chain.
Press release
https://global.kawasaki.com/news
_260511-1e.pdf
*2 Albertaʼs Industrial Heartland Association *3 MB Energy Holding GmbH & Co. KG
© Kawasaki Heavy Industries, Ltd. All Rights Reserved
45
4
Appendix
- CAPEX, Depreciation & Amortization, R&D Expenses, Number of employees (billion yen, persons)
FY2025
FY2026
Q1 Actual Q1 Actual
Change
FCST
Actual
Chg. Vs. FY25
27.8
5.2
143.3
170.0
26.7
24.4
27.0
2.5
103.8
110.5
6.7
13.6
13.7
0.1
56.8
65.5
8.7
41,652
43,450
Domestic
30,062
31,590
1,528
Overseas
11,590
11,860
270
Depreciation and
amortization
R&D expenses
Number of Employees
CAPEX
Depreciation and Amortization
133.7
170.0
141.1
70.4
61.2
77.3
93.4
80.9
103.8
110.5
3.7%
55.6
FY20
FY21
FY22
FY23
FY24
IFRS
© Kawasaki Heavy Industries, Ltd. All Rights Reserved
Depreciation and Amortization Ratio to Net Sales/Revenue
1,641.3
77.6
76.9
Net Sales or revenue (billion yen)
R&D Expense Ratio to Net Sales or Revenue
143.3
96.3
FY19
FY2026
33.0
CAPEX
61.2
FY2025
FY25
FY26
(FCST)
1,488.4 1,500.8
5.1%
4.1%
1,725.6
1,849.2
4.4%
4.4%
3.2%
3.0%
3.0%
2.9%
2.9%
FY19
FY20
FY21
FY22
FY23
2,129.3
2,311.2
2,560.0
4.4%
4.5%
4.3%
2.3%
2.5%
2.6%
FY24
FY25
FY26
(FCST)
IFRS
46
4
Appendix
- Other Information Orders Received by Quarter(billion yen)
FY2024
FY2025
FY2026
Q1
Q2
Q3
Q4
Q1
Q2
Q3
Q4
Q1
88.2
121.7
470.1
202.7
98.9
186.1
301.6
224.1
72.6
Aerospace
54.3
58.4
435.6
151.1
65.1
130.6
256.4
118.6
42.0
Aero Engine
33.9
63.3
34.5
51.5
33.8
55.5
45.1
105.5
30.5
Rolling Stock
17.0
10.7
13.2
210.4
14.8
12.9
257.9
33.3
42.9
121.8
89.2
217.4
113.5
86.6
150.9
77.2
238.0
125.2
56.5
88.4
97.6
111.7
81.5
99.8
62.5
212.3
121.4
Ship & Offshore Structure
65.3
0.7
119.7
1.7
5.1
51.1
14.7
25.7
3.7
Precision Machinery & Robot
61.6
63.0
61.2
63.4
63.9
62.3
74.1
78.1
89.4
Hydraulic Components &
Systems
36.0
38.8
33.7
38.8
43.6
42.1
41.7
45.6
53.8
Robotics
25.6
24.1
27.4
24.5
20.2
20.2
32.3
32.4
35.6
Powersports & Engine
144.7
108.5
163.9
194.3
160.2
132.4
158.7
230.2
170.5
Others
23.3
45.1
0.5
24.2
21.7
24.1
22.8
27.1
24.8
Total
456.8
438.4
926.5
808.8
446.3
569.1
892.6
831.0
525.7
Aerospace Systems
Energy Solution &
Marine Engineering
Energy, Plant & Marine
Machinery
© Kawasaki Heavy Industries, Ltd. All Rights Reserved
47
4
Appendix
- Other Information Orders Received and Revenue for Defense-related Business(billion yen)
FY2025
FY2026
Q1 Actual Q1 Actual
Change
FY2025
FY2026 Forecast
Actual
Old FCST New FCST Chg. Vs. FY25 Chg. Vs. Old FCST
Orders Received
38.0
12.5
25.5
533.9
415.0
442.0
91.9
27.0
Aircraft and others
24.3
6.1
18.2
383.2
228.5
260.5
122.7
32.0
Aero Engines
3.7
2.5
1.2
37.6
15.5
15.5
22.1
10.0
3.9
6.1
113.1
171.0
166.0
52.9
5.0
71.5
83.1
11.6
429.7
508.0
514.5
84.8
6.5
[14.7%]
[15.3%]
[18.6%]
[19.8%]
[20.1%]
Aircraft and others
41.2
54.9
13.7
301.2
349.0
351.5
50.3
2.5
Aero Engines
3.6
6.1
2.5
29.7
33.0
33.0
3.3
26.7
22.1
4.6
98.8
126.0
130.0
31.2
Submarines & Naval propulsions
Revenue
[Ratio to the company's total revenue]
Submarines & Naval propulsions
© Kawasaki Heavy Industries, Ltd. All Rights Reserved
4.0
48
4
Appendix
- Other Information Order Backlog (billion yen)
FY25 Q1
FY26 Q1
Actual
Actual
Change
1,282.7
1,477.9
Rolling Stock
479.5
600.5
Energy Solution &
Marine Engineering
812.6
981.3
Precision Machinery &
Robot
98.3
130.7
32.3
Powersports & Engine
2.1
0.9
1.1
46.0
57.7
11.7
2,721.6
3,249.3
Aerospace Systems
Others
Total
Order Backlog in Ship & Offshore (billion yen)
End of Q1
year-end
228.9
179.4
100.1
85.9
104.6
73.7
110.5 120.7
90.6
164.1
174.6
Orders by Vessel Type and Delivery Year (number of ships)
213.8
200.5
190.4
136.4
© Kawasaki Heavy Industries, Ltd. All Rights Reserved
FY26
Q2~
1
3
LPG Carrier
Submarine
FY27
FY28~
Order
Backlog
2
10
1
2
Plan
4
1
Others
Total
Fiscal Year Fiscal Year Fiscal Year Fiscal Year Fiscal Year Fiscal Year Fiscal Year Fiscal Year
2019
2020
2021
2022
2023
2024
2023
2026
Delivery Year
FY26
Q1
Received FY26
Q1
Orders
Actual Actual
1
0
*1 Delivered in FY26 Q1
*2 Order Backlog
*1
1
4
: 50,400GT
: 453,783GT
4
4
*2
1
13
(Submarines are excluded)
49
4
Appendix
- Other Information Revenue by Region (billion yen)
FY25 Q1
Actual
FY2025 Q1 (billion yen)
Japan
FY26 Q1
Actual
USA
Europe
Asia
Other
Total
Change
Aerospace Systems
49.5
34.7
15.5
1.7
101.5
Rolling Stock
16.3
36.9
1.9
55.2
Energy Solution &
Marine Engineering
70.5
5.9
10.5
9.6
96.6
Precision Machinery & Robot
14.8
4.5
3.7
32.8
0.9
56.9
Powersports & Engine
11.5
83.4
30.1
18.9
16.2
160.3
Others
14.9
0.1
2.0
0.4
17.6
Total
177.7
159.8
55.4
66.3
29.0
488.4
Japan
USA
Other
Total
Japan
177.7
177.7
0.0
USA
159.8
196.8
36.9
Europe
55.4
62.1
6.6
Asia
66.3
70.2
3.9
Other
29.0
36.5
7.5
Total
488.4
543.5
55.1
*Classified by country or region based on
the customer's location
FY2026 Q1 (billion yen)
© Kawasaki Heavy Industries, Ltd. All Rights Reserved
Europe
Asia
Aerospace Systems
70.0
46.2
19.6
1.7
137.6
Rolling Stock
10.1
47.8
2.1
60.1
Energy Solution &
Marine Engineering
56.5
6.3
8.3
15.6
86.9
Precision Machinery & Robot
17.2
5.8
4.3
40.5
1.5
69.5
Powersports & Engine
7.2
96.7
31.6
17.9
17.0
170.7
Others
16.5
0.1
1.2
0.5
18.5
Total
177.7
196.8
62.1
70.2
36.5
543.5
50
4
Appendix
- Other Information Weighted average sales rate
Impact of Foreign Exchange on Business Profit
by Currency*1
Aerospace Systems
FY2025
FY2026
Q1Actual
Q1Actual Q2-4 FCST
*2
Rolling Stock
Solution &
USD Energy
Marine Engineering
Precision Machinery &
Robot
Powersports & Engine
*2
Total
EUR
(EUR/JPY)
0.19
*2 0.25
1.11
0.03
0.08
0.07
0.07
0.09
0.10
0.04
0.05
0.09
0.19
0.19
0.76
0.52
*2 0.66
2.13
0.11
0.08
0.45
FY23 Results
FY24 Results
FY25 Results
FY26 Q1 Results
FY26 Assumption
157.09
163.07
175.17
185.31
180.00
*1 The impact of foreign currencies (USD and EUR only) on business profit due to exchange rate fluctuations
(Calculated by deducting foreign currency denominated purchases from foreign currency denominated revenue of
Kawasaki Heavy Industries, Ltd, Kawasaki Railcar manufacturing Co., Ltd., and Kawasaki Motors, Ltd. (to include
foreign currency denominated revenue from loss-provisioned projects))
(Ex) Business profit increases or decreases by 1 billion yen if the exchange
rate changes to 1 yen weaker or stronger against USD when the foreign currency amount is 1 billion USD
*2 Excluding the impact of valuation revaluation on foreign currency refund liabilities related to important operational
issues of the PW1100G-JM engine
Details of Eliminations and Corporate (billion yen)
Business Profit (Loss)
FY25
FY26
FY25
Q1 Actual Q1 Actual Change
Elimination and corporate
(billion yen)
Business Profit (Loss)
0.5
FY26
Actual
Actual
Change
New Business Investments
(Head Office)
0.5
7.8
Elimination and Adjustments
0.0
3.0
© Kawasaki Heavy Industries, Ltd. All Rights Reserved
[Formulas for Calculating ROIC]
After-tax ROIC = { Profit attributable to owners of
parent + Interest expenses × (1-Tax rate)} ÷
Invested Capital*3
*3 Invested Capital = Average net debt at beginning and end of period
- average equity at beginning and end of period
51
© Kawasaki Heavy Industries, Ltd. All Rights Reserved
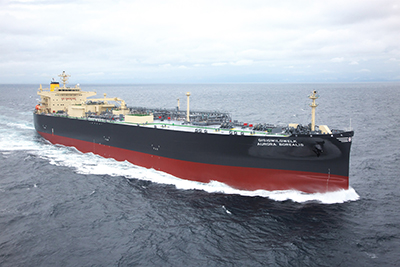




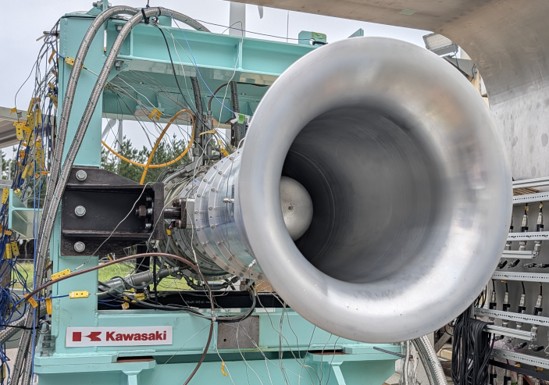


 | |
 |
 | |
 |
 | |
 |