【交付書面】 第 79 期 ■目次 事業報告 1.企業集団の現況に関する事項............1 2.会社の株式に関する事項..................9 3.会社役員に関する事項.....................11 4.会計監査人の状況...........................20…
【交付書面】
第
79
期
■目次
事業報告
1.企業集団の現況に関する事項............1
2.会社の株式に関する事項..................9
3.会社役員に関する事項.....................11
4.会計監査人の状況...........................20
5.業務の適正を確保するための体制等の
整備に関する事項...........................21
6.会社の支配に関する基本方針............25
連結計算書類..........................................26
計算書類................................................41
監査報告書.............................................51
(証券コード 6997)
会社法改正による電子提供制度の施行に伴い株主総会資料をウェブサイトに
掲載して提供することとなりましたが、本定時株主総会及び普通株主様によ
る本種類株主総会につきましては、書面交付請求の有無にかかわらず、従来
どおりすべての株主様に株主総会資料を書面でお送りしております。
報告書
事 業 報 告
(
2025年 4 月 1 日から
2026年 3 月31日まで
)
1. 企業集団の現況に関する事項
(1) 事業の経過及びその成果
当期における世界経済は、米国ではAI関連投資の増加等により設備投資が好調に推移するなど、
景気は総じて堅調に推移いたしました。一方、欧州経済では個人消費が堅調に推移したものの、米国
の関税政策の影響等により輸出が落ち込むなど、景気回復は緩やかなものに留まりました。また、中
国では不動産市場の停滞が継続する中、個人消費は消費刺激策の効果の剥落により弱含みで推移する
など景気は総じて緩やかな減速傾向で推移いたしました。日本国内におきましては、雇用・所得環境
の改善を背景に個人消費が底堅く推移するなど景気は緩やかな回復基調で推移いたしました。
当社グループを取り巻く市場環境につきましては、ICT関連市場では米国IT大手等による旺盛
なデータセンター投資が継続し、AIサーバー及び周辺機器の需要が拡大いたしました。また、自動
車関連市場は米国の政策変更等により電気自動車(BEV)の成長率に鈍化が見られたものの、AD
/ADAS(自動運転/先進運転支援システム)の進展等により総じて緩やかな回復傾向で推移いた
しました。産業機器関連市場でも底打ちの兆しが見られるなど回復基調で推移いたしました。
このような経営環境のもと、当社グループは第10次中期経営計画に定めた重点施策を着実に実行し
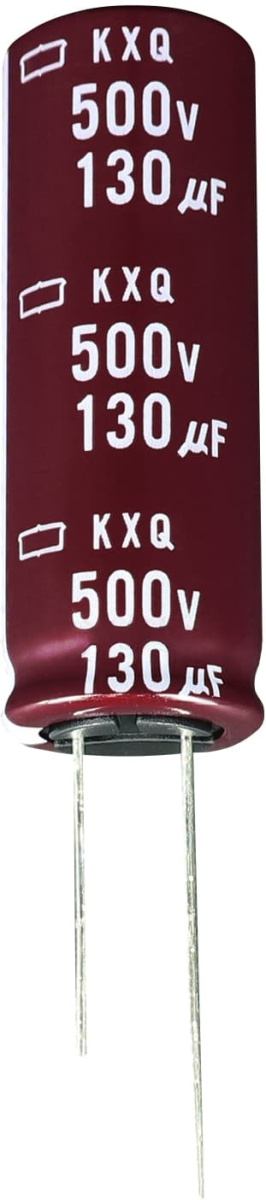
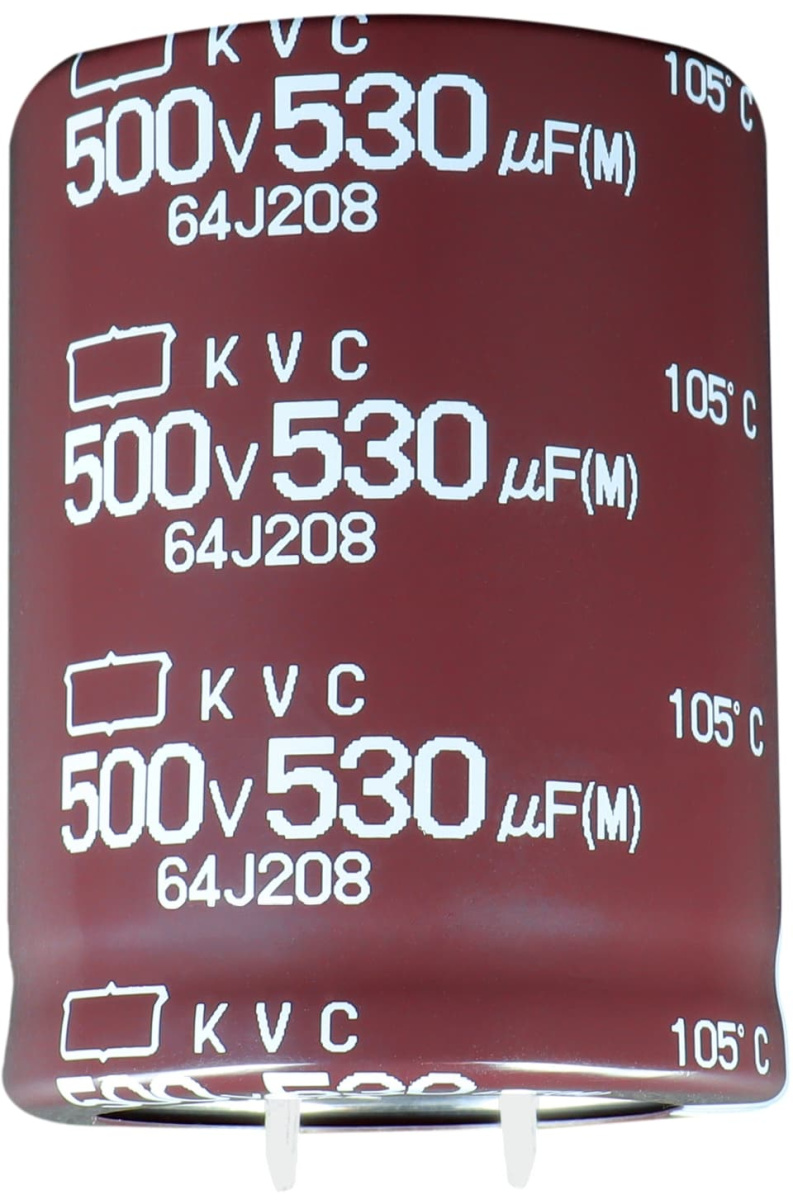
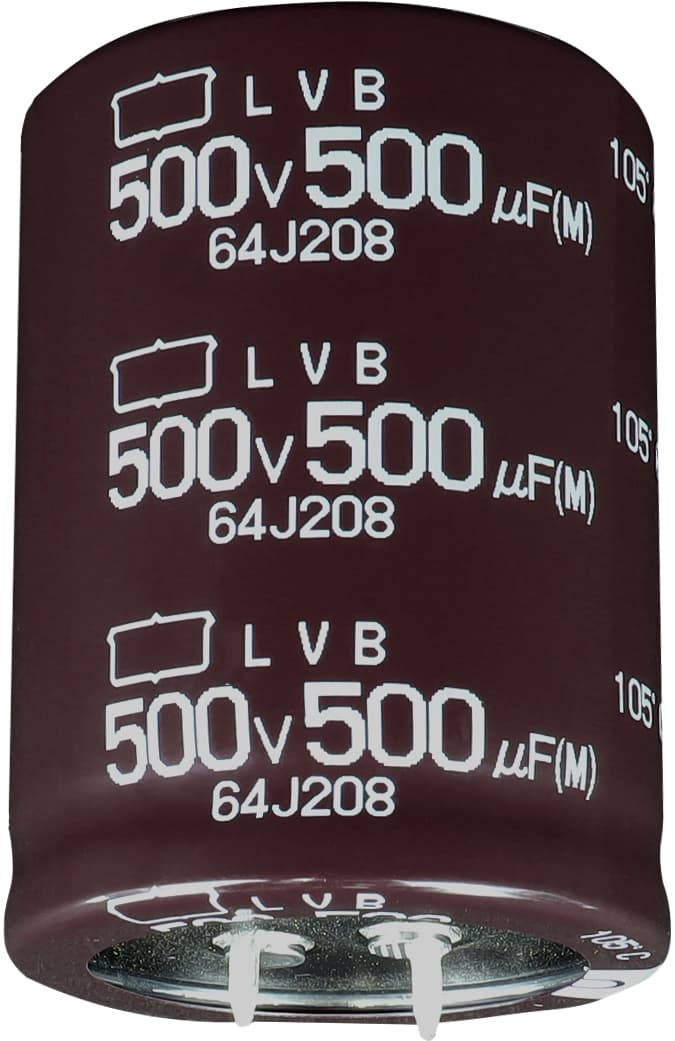
てまいりました。販売面では、急速な成長が続くAIサーバー市場向けに大形アルミ電解コンデンサ
及びハイブリッドコンデンサの重点的な拡販を進めたほか、インダクタを始めとするアルミ電解コン
デンサ以外の製品の拡販にも注力してまいりました。加えて、米国子会社であるUnited Chemi-Con
Inc.に新たな営業拠点を開設したほか、インドに販売子会社であるChemi-Con Electronics (India)
Pvt. Ltd.を設立するなど、新規需要が見込まれる海外市場における販売体制の強化を図ってまいりま
した。生産面では、大形アルミ電解コンデンサの生産能力を増強するなどサーバー関連需要に対応し
た供給体制を整備するとともに、設備故障の未然防止や工程切替時の待ち時間削減を通じて、設備総
合効率(OEE)の向上に継続的に取り組むなど収益性の改善を図ってまいりました。
当期の製品開発においては、AIサーバーを始めとするサーバー用電源向けとして、静電容量を向
上させた基板自立形アルミ電解コンデンサ「KHRシリーズ」を開発いたしました。更に、導電性高
分子ハイブリッドアルミ電解コンデンサにおいても、AIサーバーや自動車への搭載を想定した新製
品を市場投入しております。また、スイッチング電源、インバータ機器、車載機器のノイズフィルタ
向けコモンモードチョークコイルについては、独自の加工プロセスにより透磁率を向上させた「FX
シリーズ」を開発いたしました。
これらの結果、当期の連結業績につきましては、売上高1,368億21百万円(前期比11.5%増)とな
り、 営業利益は33億69百万円(前期比9.9%減)、経常利益は20億94百万円(前期比33.5%増)、
親会社株主に帰属する当期純利益は23億67百万円(前期比23億30百万円増)となりました。
― 1 ―
― 2 ―
ICT・産業機器関連市場の需要が増
加したことなどにより、当部門の売
上高は前期比12.3%の増加となりま
した。
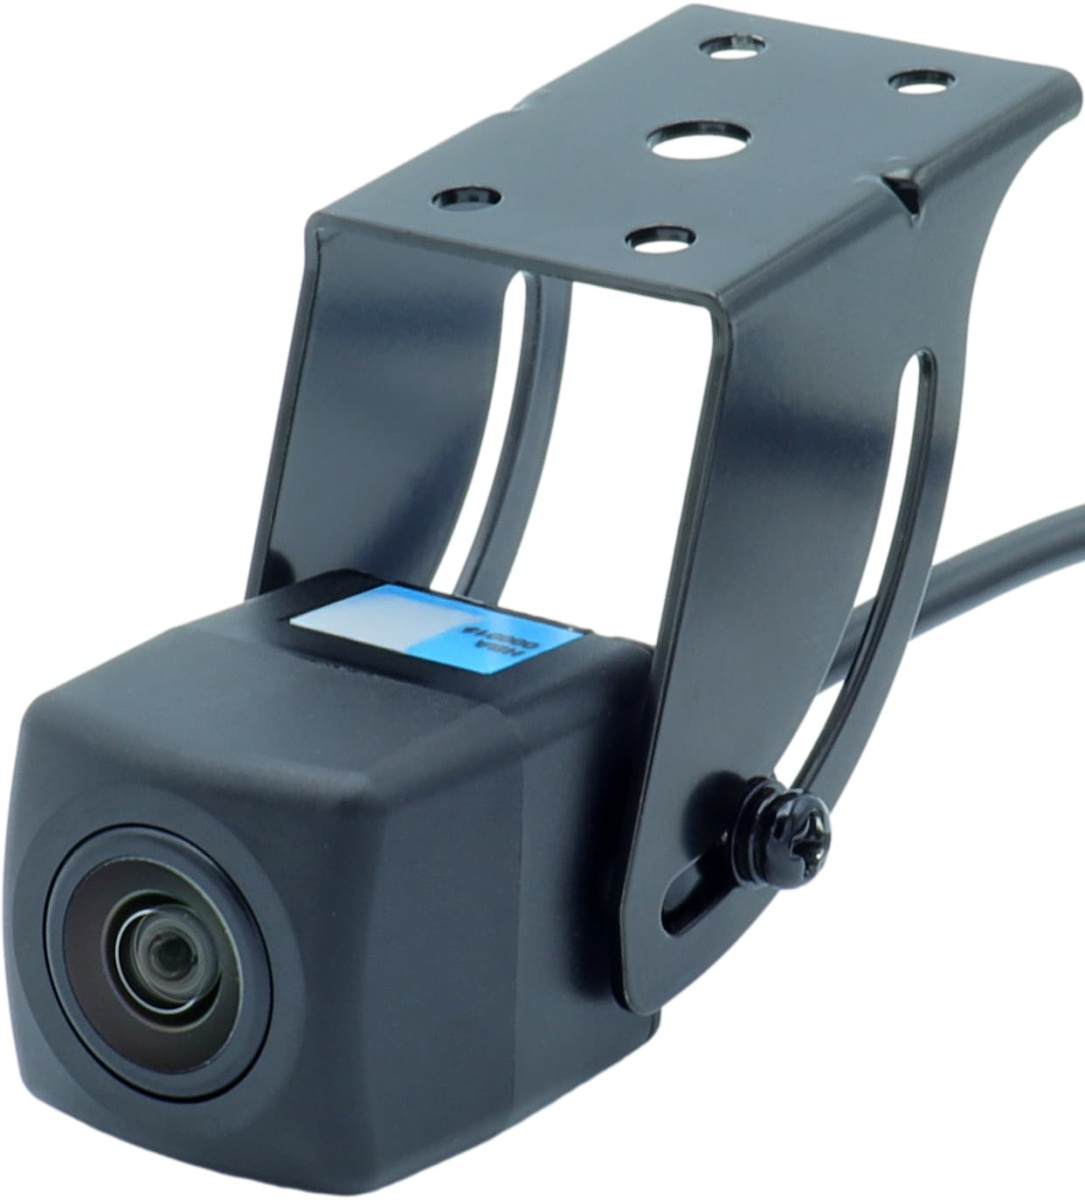
CMOSカメラモジュールの需要
が減少したことなどにより、当部門
の売上高は前期比8.3%の減少とな
りました。
アルミ電解コンデンサ用電極箔の
需要が減少したことなどにより、当
部門の売上高は前期比1.1%の減少
となりました。
リセール品の需要が増加したこと
などにより、当部門の売上高は前期
比50.9%の増加となりました。
なお、当期における事業の部門別の状況は次のとおりであります。
① コンデンサ部門(1,261億80百万円、売上総額の92.2%)
② 機構・その他部品部門(31億55百万円、売上総額の2.3%)
③ コンデンサ用材料部門(56億43百万円、売上総額の4.1%)
④ その他の部門(18億42百万円、売上総額の1.4%)
― 3 ―
(2) 設備投資の状況
当期における設備投資は、総額59億11百万円であり、その主なものはアルミ電解コンデンサ
の生産設備の増強であります。
(3) 資金調達の状況
当期における資金調達につきましては、主にAIサーバー市場向けコンデンサ等の成長分野へ
の設備投資資金や借入金返済のため、当社において長期借入金166億円を調達いたしました。
(4) 対処すべき課題
今後の見通しにつきましては、米国の通商政策等による世界経済への下押し圧力や中東情
勢の緊迫化等の地政学リスクの高まりによるエネルギー価格の上昇、原材料価格の高騰、輸
送経路の限定による物流の混乱など、当社グループを取り巻く経営環境は依然として予断を
許さない状況が続くものと予想されます。
このような状況のもと、当社は2026年度を初年度とする第11次中期経営計画(2026年
度~2028年度)をスタートいたしました。アルミ電解コンデンサ事業を事業の中核に据
え、事業基盤の再構築と収益力の抜本的な改善に取り組んでまいります。
事業戦略においては、市場の高成長が見込まれる「成長市場」と、価格競争が中心となる
「マス(汎用品)市場」に区分し、それぞれの市場特性に応じた販売・生産戦略を展開して
まいります。成長市場であるAIサーバー市場及び車載市場においては、高性能・高品質な
アルミ電解コンデンサを重点製品と位置付け、デザイン・イン活動による安定的な受注の獲
得を目指してまいります。一方、価格競争が激しいマス(汎用品)市場においては、最適地
生産体制の構築、最適地材料調達の推進、物流・在庫マネジメントの高度化などを通じてコ
スト構造改革を推進し、市場競争力の強化と戦略的販売施策によるシェア奪還に取り組んで
まいります。
財務戦略においては、成長市場への重点投資を継続しつつ、収益基盤の強化を図ることで
安定的なキャッシュ・フローの創出により有利子負債の圧縮を進め、資本効率の向上を推進
し財務体質の健全化を図ってまいります。あわせて、自己資本の充実と適正な資本構成の維
持により、事業環境の変化に強い財務基盤を構築し、持続的な企業価値の向上を目指しま
す。
なお、当社、当社の台湾子会社である台湾佳美工股份有限公司及び当社の香港子会社であ
る Hong Kong Chemi-Con Ltd.(以下「当社ら」といいます。)は、2015年12月21日、
アルミ電解コンデンサの取引に関する台湾競争法違反に基づき、台湾公平交易委員会から合
計15億7,150万新台湾ドルの制裁金を課す旨の処分を受け、その後、当該制裁金の処分を
争うために台湾公平交易委員会に対する行政処分取消訴訟を台湾で提起していました。同訴
訟は、台湾の最高裁判所に相当する最高行政法院における破棄、差戻しの判決後、台北高等
行政裁判所における審理が行われていましたが、同裁判所主催の調停手続が実施され、当社
と台湾公平交易委員会とは、2026年1月13日、和解に合意し、同日調停が成立しました。
この結果、当社らは、台湾公平交易委員会から、合計3億4,573万新台湾ドルの返金を受け
― 4 ―
ることになりました。
台湾公平交易委員会との調停成立により、当社グループを当事者とする、アルミ電解コン
デンサ等の取引に関する競争法違反関連の訴訟は、本案件を含めて全て終結いたしました。
また、当社の子会社であるSingapore ChemiーCon (Pte) Ltd.(以下「SCC」といいま
す。)は、Dyson Manufacturing Sdn. Bhd.(以下「Dyson」といいます。)に販売した
部品に関して、2024年12月、Dysonより、シンガポール国際商事裁判所において訴訟を提
起されました。Dysonは、SCCに対して、1億4,554万4,762英ポンドの損害賠償等の権利
があると主張しておりますが、SCCとしては、かかる主張は妥当ではないものと考えてお
り、SCCの責任が否定されるよう、裁判の中で必要な主張・立証を行っております。
区分
2022年 4 月 1 日から
2023年 3 月31日まで
2023年 4 月 1 日から
2024年 3 月31日まで
2024年 4 月 1 日から
2025年 3 月31日まで
2025年 4 月 1 日から
2026年 3 月31日まで
売上高(百万円)161,881150,740122,684136,821
経 常 利 益(百万円)10,9947,9131,5682,094
親会社株主に帰属する
当 期 純 利 益 又 は
親会社株主に帰属する
当 期 純 損 失 (△)
(百万円)2,273△21,291372,367
1株当たり当期純利益又は
1株当たり当期純損失(△)
(円)112.09△1,029.151.75106.29
総資産(百万円)162,741172,921162,702165,985
純資産(百万円)50,67853,61056,66763,135
(5) 財産及び損益の状況の推移
(注)1. 1株当たり当期純利益又は1株当たり当期純損失は、期中平均発行済株式総数(自己株式を控除)に
基づき算出し、小数点第3位を四捨五入して表示しております。
2. 2022年度は、車載関連市場や産業機器関連市場における受注が堅調に推移したほか、構造改革の効
果等により増収増益となりました。
2023年度は、産業機器関連市場やICT関連市場における受注が低調であったことなどにより減収減
益となりました。
2024年度は、ICT関連市場は堅調に推移したものの、自動車関連市場及び産業機器関連市場の低迷
等により、減収減益となりました。
2025年度の状況につきましては、前記「(1) 事業の経過及びその成果」に記載のとおりであります。
― 5 ―
会社名資 本 金当社の出資比率主 要 な 事 業 内 容
ケ ミ コ ン 東 日 本 (株)400百万円100%コ ン デ ン サ の 製 造 販 売
ケ ミ コ ン デ バ イ ス (株)200百万円100%
コ ン デ ン サ 、 電 子 機 器
及 び 部 品 の 製 造 販 売
United Chemi-Con, Inc.US$30,000千
100%
(100%)
コ ン デ ン サ の 製 造 販 売
Chemi-Con Materials CorporationUS$60,000千
100%
(100%)
ア ル ミ 電 解 コ ン デ ン サ 用
電 極 箔 の 製 造 販 売
Europe Chemi-Con (Deutschland) GmbHEURO2,045千100%コ ン デ ン サ の 販 売
Singapore Chemi-Con (Pte) Ltd.S$10,000千100%コ ン デ ン サ の 販 売
P.T.Indonesia Chemi-ConUS$36,000千
90.00%
(10.83%)
コ ン デ ン サ の 製 造 販 売
Chemi-Con (Malaysia) Sdn. Bhd.RM60,000千100%コ ン デ ン サ の 製 造 販 売
台 湾 佳 美 工 股 份 有 限 公 司NT$600,000千100%コ ン デ ン サ の 製 造 販 売
貴 弥 功 ( 無 錫 ) 有 限 公 司US$38,000千
100%
(100%)
コ ン デ ン サ の 製 造 販 売
Hong Kong Chemi-Con Ltd.HK$690,000千100%コ ン デ ン サ の 販 売
上 海 貴 弥 功 貿 易 有 限 公 司US$3,000千
100%
(100%)
コ ン デ ン サ の 販 売
Chemi-Con Electronics (Thailand) Co., Ltd.THB100,000千100%コ ン デ ン サ の 販 売
(6) 重要な子会社の状況
(注)1. 当社の出資比率欄の( )内は、間接所有割合を内数で示しております。
2. Chemi-Con Electronics (Thailand) Co., Ltd.は、事業規模等を勘案して、当期より重要な子会社と
して記載しております。
― 6 ―
部門主 要 な 製 品
コ ン デ ン サ
アルミ電解コンデンサ、積層セラミックコンデンサ、電気二重層キャパシタ、
セラミックバリスタ
機 構 ・ そ の 他 部 品インダクタ(コイル)、CMOSカメラモジュール
コ ン デ ン サ 用 材 料アルミ電解コンデンサ用電極箔
その他その他電子部品等
(7) 主要な事業内容
当社グループは、電子機器用各種コンデンサ、コンデンサ用材料、機構・その他部品等の製
造・仕入・販売を主な事業とし、その製品は民生用電子機器から産業用電子機器に至るまであら
ゆる分野で使用されております。なお、部門別の主要な製品は次のとおりであります。
本 社東京都品川区大崎五丁目6番4号
製造拠点高萩工場(茨城県高萩市)
新潟工場(新潟県北蒲原郡聖籠町)
営業拠点
(営業所)
名古屋(愛知県名古屋市)、大阪(大阪府吹田市)、福岡(福岡県福岡市)
そ の 他福島事業所(福島県西白河郡矢吹町)
神奈川研究所(神奈川県川崎市)
製造拠点国内ケミコン東日本(株)(宮城県大崎市)、ケミコンデバイス(株)(山形県長井市)
海外Chemi-Con Materials Corporation(米国)、P.T.Indonesia Chemi-Con(インドネシア)、
Chemi-Con(Malaysia)Sdn.Bhd.(マレーシア)、台湾佳美工股份有限公司(台湾)、
貴弥功(無錫)有限公司(中国)
営業拠点海外United Chemi-Con,Inc.(米国)、Europe Chemi-Con(Deutschland)GmbH(ドイツ)、
Singapore Chemi-Con(Pte)Ltd.(シンガポール)、Hong Kong Chemi-Con Ltd.(香港)、
上海貴弥功貿易有限公司(中国)、Chemi-Con Electronics (Thailand) Co., Ltd.(タイ)
(8) 主要な営業所及び工場
①当 社
(注)1. 2026年4月16日付で、名古屋営業所を中部日本支店に、大阪営業所を西日本支店に改称い
たしました。
2. 2026年4月16日付で、福岡営業所は福岡県北九州市に移転し、北九州営業所に改称いたし
ました。
②子会社
― 7 ―
部門従業員数前 期 末 比 増 減
コンデンサ4,439名174名減
機 構 ・ そ の 他 部 品82名16名減
コ ン デ ン サ 用 材 料795名12名減
その他32名1名減
合計5,348名203名減
(9) 従業員の状況
(注)1. 従業員数は就業人員であり、臨時従業員を除いて記載しております。
2. 当社の従業員数は、847名(前期末比48名減)であります。
借入先借 入 金 残 高
シ ン ジ ケ ー ト ロ ー ン51,700百万円
株 式 会 社 三 井 住 友 銀 行5,977百万円
株 式 会 社 日 本 政 策 投 資 銀 行5,900百万円
株 式 会 社 三 菱 U F J 銀 行2,434百万円
(10) 主要な借入先
(注)シンジケートローンのうち、39,350百万円は、株式会社三井住友銀行及び株式会社三菱UFJ銀行を
幹事として21社から組成されております。また、12,350百万円は、株式会社三井住友銀行及び株式会
社三菱UFJ銀行を幹事、株式会社みずほ銀行を副幹事として5社から組成されております。
― 8 ―
(1)発行可能株式総数及び発行可能種類株式総数
① 発 行 可 能 株 式 総 数
55,000,000株
②発行可能種類株式総数
普通株式55,000,000株
A種種類株式10,000株
B種種類株式5,000株
(2)発 行 済 株 式 の 総 数
普通株式24,698,450株
A種種類株式10,000株
B種種類株式3,001株
(3)株主数
普通株式13,552名
A種種類株式1名
B種種類株式1名
(4)大株主(上位10名)
株主名
持 株 数
(普通株式)
持 株 比 率
日本マスタートラスト信託銀行株式会社(信託口)
3,113千株12.62%
ジャパン・インダストリアル・ソリューションズ第参号投資事業有限責任組合
1,758千株7.18%
KOREA SECURITIES DEPOSITORY-SAMSUNG
1,640千株6.65%
MSIP CLIENT SECURITIES
1,053千株4.27%
株 式 会 社 日 本 カ ス ト デ ィ 銀 行 ( 信 託 口 )
726千株2.94%
BNY GCM CLIENT ACCOUNT JPRD AC ISG (FE-AC)
647千株2.62%
株 式 会 社 三 菱 U F J 銀 行
524千株2.13%
日 本 生 命 保 険 相 互 会 社
513千株2.08%
セ ン ト ラ ル 短 資 株 式 会 社
409千株1.66%
株 式 会 社 ト ッ プ パ ー ツ
336千株1.36%
2. 会社の株式に関する事項
(注)1. 持株比率は自己株式(41,947株)を除いて算出しております。
2. 第2順位のジャパン・インダストリアル・ソリューションズ第参号投資事業有限責任組合は、上記の
ほか、A種種類株式10,000株及びB種種類株式3,001株を保有しております。同組合を除き、A種種
類株式及びB種種類株式を保有している株主はおりません。
3. A種種類株式及びB種種類株式には、議決権はありません。
4. 第3順位のKOREA SECURITIES DEPOSITORY-SAMSUNG(名義人)の持株数として記載した
1,640千株のうち1,625千株は、三瑩電子工業株式会社が実質株主として保有しております。
― 9 ―
(5)その他株式に関する重要な事項
取得請求権の行使日取得したB種種類株式の数交付した普通株式の数
2025年9月17日363株500,921株
2025年10月28日362株499,541株
2025年12月25日1,274株1,758,055株
当社は、当社が発行するB種種類株式の保有者であるジャパン・インダストリアル・ソリュ
ーションズ第参号投資事業有限責任組合(以下、「JISファンド」という。)より、その保有す
るB 種種類株式の一部について普通株式を対価とする取得請求権の行使を受け、JISファンドに
対し、以下のとおり普通株式を交付いたしました。なお、かかる取得請求権の行使にあたり当
社が取得したB種種類株式1,999株は、2025年12月25日及び2026年2月10日付で消却いた
しました。
(注) 上記取得請求権の行使に伴い当社が交付した普通株式の数に誤りがあったため、
2026年5月7日付で、当社は、JISファンドに対し、本来交付すべき普通株式の数
と実際に交付した普通株式の数の差にあたる普通株式11,888株を交付いたしまし
た。
― 10 ―
氏名地位担当及び重要な兼職の状況
今 野 健 一
代 表 取 締 役 社 長
( 社 長 執 行 役 員 )
経営戦略部担当、監査室担当、
Europe Chemi-Con (Deutschland) GmbH 取締役
上 山 典 男
取締役
( 会 長 執 行 役 員 )
石 井 治
取締役
( 専 務 執 行 役 員 )
CFO、経理部担当、デジタル戦略部担当、
経営戦略部副担当
入 江 峰 年
取締役
( 上 席 執 行 役 員 )
営業本部長、United Chemi-Con, Inc. 代表取締役社長
上海貴弥功貿易有限公司 董事
Hong Kong Chemi-Con Ltd. 取締役
Singapore Chemi-Con (Pte) Ltd. 取締役
Chemi-Con Electronics (Thailand) Co.,Ltd. 取締役
宮 田 鈴 子取締役
吉 田 浩取締役
中 野 智 美取締役
中野智美公認会計士・税理士事務所 代表
日本調剤(株) 社外取締役(監査等委員)
(株)めぶきフィナンシャルグループ 社外取締役(監査等委
員)
ヘルスケア&メディカル投資法人 監督役員
堀 野 俊 一常 勤 監 査 役ケミコン東日本(株) 監査役
市 原 博 和常 勤 監 査 役ケミコンデバイス(株) 監査役
土 居 正 明監査役神鋼鋼線工業(株) 社外監査役
小 川 薫監査役(株)ジャパン・ティッシュエンジニアリング 社外監査役
3. 会社役員に関する事項
(1) 取締役及び監査役の氏名等
(注)1. 入江峰年及び中野智美の両氏は
、2025年6月27日開催の第78期定時株主総会において、新たに取締
役に選任され就任いたしました
。また、市原博和氏は、2025年6月27日開催の第 78期定時株主総会に
おいて、新たに監査役に選任され就任いたしました。
2. 取締役駒形崇及び監査役三浦和人の両氏は、2025年6月27日開催の第78期定時株主総会終結の時
をもって任期満了により退任いたしました。
3. 取締役宮田鈴子、吉田浩及び中野智美の3氏は社外取締役であります。
4. 監査役土居正明及び小川薫の両氏は社外監査役であります。
5. 取締役宮田鈴子、吉田浩及び中野智美並びに監査役土居正明及び小川薫の5氏につきましては、東京
証券取引所に対し独立役員として届け出ております。
6. 監査役堀野俊一氏
は、経理・財務業務に従事し又は当該業務を担当した経験を有しており、財務及び
会計に関する相当程度の知見を有するものであります。また、監査役土居正明及び小川薫の両氏は、公
認会計士
の資格を有しており、財務及び会計に関する相当程度の知見を有するものであります。
― 11 ―
氏名新旧異動年月日
今 野 健 一
代表取締役社長
社長執行役員
監査室担当
Europe Chemi-Con
(Deutschland) GmbH 取締役
取締役
上席執行役員
事業統括 総統括
ケミコン東日本(株) 代表取締役社
長
ケミコンデバイス(株) 取締役
台湾佳美工股份有限公司 董事
貴弥功(無錫)有限公司 董事
2025年
4月1日
代表取締役社長
社長執行役員
経営戦略部担当
監査室担当
Europe Chemi-Con
(Deutschland) GmbH 取締役
代表取締役社長
社長執行役員
監査室担当
Europe Chemi-Con
(Deutschland) GmbH 取締役
2025年
6月27日
上 山 典 男
代表取締役会長
会長執行役員
代表取締役社長
社長執行役員
監査室担当
Europe Chemi-Con
(Deutschland) GmbH 取締役
2025年
4月1日
取締役
会長執行役員
代表取締役会長
会長執行役員
2025年
6月27日
石 井 治
取締役
専務執行役員
CFO、経理部担当、
デジタル戦
略部担当、経営戦略部副担当
取締役
専務執行役員
CFO、経理部担当、
デジタル戦
略部担当、経営戦略部担当
2025年
6月27日
入 江 峰 年
取締役
上席執行役員、営業本部長
United Chemi-Con, Inc. 代表
取締役社長
上海貴弥功貿易有限公司 董事
Hong Kong Chemi-Con Ltd.
取締役
Singapore Chemi-Con (Pte)
Ltd. 取締役
Chemi-Con Electronics
(Thailand) Co.,Ltd. 取締役
執行役員、営業本部長
United Chemi-Con, Inc. 代表
取締役社長
上海貴弥功貿易有限公司 董事
Hong Kong Chemi-Con Ltd.
取締役
Singapore Chemi-Con (Pte)
Ltd. 取締役
Chemi-Con Electronics
(Thailand) Co.,Ltd. 取締役
2025年
6月27日
堀 野 俊 一
常勤監査役
ケミコン東日本(株) 監査役
常勤監査役
2025年
6月25日
7. 当期中における取締役及び監査役の「地位」及び「担当及び重要な兼職の状況」の異動は次のとおり
であります。
― 12 ―
氏名新旧異動年月日
今 野 健 一
代表取締役社長
社長執行役員
経営戦略部担当
監査室担当
代表取締役社長
社長執行役員
経営戦略部担当
監査室担当
Europe Chemi-Con
(Deutschland) GmbH 取締役
2026年
4月1日
入 江 峰 年
取締役
上席執行役員、営業本部長
United Chemi-Con, Inc. 代表
取締役社長
Europe Chemi-Con
(Deutschland) GmbH 取締役
上海貴弥功貿易有限公司 董事
Hong Kong Chemi-Con Ltd.
取締役
Singapore Chemi-Con (Pte)
Ltd. 取締役
Chemi-Con Electronics
(Thailand) Co.,Ltd. 取締役
取締役
上席執行役員、営業本部長
United Chemi-Con, Inc. 代表
取締役社長
上海貴弥功貿易有限公司 董事
Hong Kong Chemi-Con Ltd.
取締役
Singapore Chemi-Con (Pte)
Ltd. 取締役
Chemi-Con Electronics
(Thailand) Co.,Ltd. 取締役
2026年
4月1日
8. 当期末後における取締役の「地位」及び「担当及び重要な兼職の状況」の異動は次のとおりでありま
す。
― 13 ―
(2) 取締役及び監査役の報酬等
①取締役の個人別の報酬等の内容に係る決定方針に関する事項
当社は、取締役の個人別の報酬等の内容についての決定に関する方針(以下、「決定方針」と
いう。)を独立社外取締役が半数以上を占める報酬諮問委員会での諮問・答申を経て、取締役会
で決議しております。
また、取締役会は、当事業年度に係る取締役の個人別の報酬等の内容について、その決定方法
と内容が決定方針と整合しておりかつ報酬諮問委員会での諮問・答申を経ていることから、当該
決定方針に沿うものであると判断しております。
決定方針の内容の概要は以下のとおりです。
1.基本方針
当社の取締役の報酬等は、業績及び株主の長期的利益との連動性と人財の成長・発展促進
の双方を満たす体系となるよう設計・運用し、取締役の企業価値最大化に向けた意欲をより
高めることのできる適切・公正かつバランスの取れたものとすることを基本方針とする。
取締役の報酬等は、固定報酬としての月額報酬と業績連動報酬等としての取締役賞与によ
り構成され、取締役賞与は業務執行の対価であることを鑑み社外取締役には支給しない。
2.月額報酬の個人別の報酬等の額又はその算定方法の決定に関する方針(報酬等を与える時期
又は条件の決定に関する方針を含む。)
当社の取締役の月額報酬は、役位、職責に基づき、従業員給与、当社の業績及び同業他社
の役員報酬の水準等も考慮の上、これらを総合的に勘案して決定し、月例の固定報酬として
支給する。
3.業績連動報酬等としての取締役賞与に係る業績指標の内容及び額又は数の算定方法の決定に
関する方針(報酬等を与える時期又は条件の決定に関する方針を含む。)
当社の業績連動報酬等としての取締役賞与は、客観性・透明性があり、かつ株主と共通の
利益の向上に資する業績指標を採用するものとし、各取締役の業績に対する貢献度、職責等
により算出された額を毎年一定の時期に支給する。
4.月額報酬の額と業績連動報酬等としての取締役賞与の額の取締役の個人別の報酬等の額に対
する割合の決定に関する方針
取締役の種類別の報酬割合は、同業他社水準、当社の事業規模、従業員の給与水準、経済
社会情勢等に加え、定期的に実施される適切な第三者機関による企業経営者の報酬に関する
調査等を参照し、上位の役位ほど業績連動報酬等のウェイトが高まる構成とし、報酬諮問委
員会での協議を経て決定する。
― 14 ―
役員区分
報酬等の総額
(百万円)
報酬等の種類別の総額(百万円)
対象となる
役員の員数
(人)
固定報酬業績連動報酬等非金銭報酬等
取締役
(うち社外取締役)
158
(30)
158
(30)
-
(-)
-
8
(4)
監査役
(うち社外監査役)
58
(15)
58
(15)
--
5
(2)
5.取締役の個人別の報酬等の内容についての決定に関する事項
取締役の個人別の報酬等の内容は、代表取締役会長(代表取締役会長が空席の場合は代表
取締役社長)が決定する。その権限は、各取締役の月額報酬の額及び各取締役の業績に対す
る貢献度を踏まえた取締役賞与の配分決定とする。係る権限が独立性・客観性をもって適切
に行使されるために、半数以上の独立社外取締役で構成される報酬諮問委員会を設置し、同
委員会での協議を経て報酬等を決定する。
6.その他取締役の個人別の報酬等の内容についての決定に関する重要な事項
会社業績が著しく低迷した場合、又は社会的に責任を明らかにすべき事態が生じた場合等
には、取締役会の協議によって、報酬等の減額・一部返上等の措置を取ることがある。
②取締役及び監査役の報酬等についての株主総会の決議に関する事項
当社の役員報酬等に関する株主総会の決議年月日は、2015年6月26日 であり、決議の内容
は、取締役の報酬額を年額3億7,000万円以内(うち社外取締役分3,200万円以内)、監査役の
報酬額を年額1億2,000万円以内とするものです。決議時の取締役の員数は7名(うち社外取締
役2名)、監査役の員数は4名(うち社外監査役2名)です。
③取締役の個人別の報酬等の内容の決定に係る委任に関する事項
当社の取締役会は、代表取締役会長が在任中は代表取締役会長上山典男に対し、同氏が代表権
のない取締役に就任以降は、代表取締役社長今野健一に対し、取締役の個人別の報酬等の内容の
決定を委任しております。委任した権限の内容は、各取締役の月額報酬の額及び各取締役の業績
に対する貢献度を踏まえた取締役賞与の配分決定です。委任した理由は、各取締役の評価にあた
り、取締役の個人別の担当部門における業績が当社全体の業績に貢献した度合いを総合的に評価
することができる代表取締役会長(代表取締役会長が空席の場合は代表取締役社長)が適してい
ると判断したためです。係る権限が独立性・客観性をもって適切に行使されるために、報酬諮問
委員会での協議を経て報酬等を決定しております。
④取締役及び監査役の報酬等の総額等
(注)1. 上記には、2025年6月27日開催の第78期定時株主総会終結の時をもって退任した取締役1名
及び監査役1名を含んでおります。
2. 取締役の報酬等の額には、使用人兼務取締役の使用人分給与は含まれておりません。
3. 当事業年度に係る業績連動報酬としての取締役に対する賞与の支給はありません。支給する場
― 15 ―
取締役会発言状況及び期待される役割に関して行った職務の概要
24回/24回
(出席率100%)
会社経営に関する豊富な経験と見識を活かし、客観的な立場から発言を
行っております。また、独立した客観的な立場からの監督を期待し、指
名諮問委員会の委員及び報酬諮問委員会の委員長として職務を遂行して
いただいております。法務・リスク管理の高い専門性を活かし、ダイバ
ーシティ推進に関する会議にご出席いただき有益な助言をいただいてお
ります。
合の 業績連動報酬の額の算定の基礎として選定した業績指標は、「連結営業利益」と「親会社
株主に帰属する当期純利益」です。客観性・透明性があり、株主の皆様との共通の利益の向上
に資 することから当該指標を採用しております。具体的な業績連動報酬の額の決定にあたって
は、以下の計算式に基づき原資を算出し、この原資の半額をあらかじめ定められた役職ごとの
ポイントにより算出されたポイント単価(原資÷対象者の役職総ポイント数)で配分し、残り
の半分を代表取締役社長による各役員の業績評価により算出されたポイント単価(原資÷対象
者の 業績評価総ポイント数)で配分します。以上のプロセスにより算出された額を基に、報酬
諮問委員会との協議を経て、取締役会で決定しております。
原資=(連結営業利益×対象人数×配分率)+(親会社株主に帰属する当期純利益×対象人数×配分率×配当係数)
なお、当事業年度に係る業績連動報酬の支給はありませんが、2025年度における業績連動報酬
に係る指標の実績は、「1.企業集団の現況に関する事項(1)事業の経過及びその成果」に記載
のとおりです。
(3) 社外役員に関する事項
①社外取締役 宮田鈴子
ア.重要な兼職先と当社との関係
該当事項はありません。
イ.主要取引先等特定関係事業者との関係
該当事項はありません。
ウ.主な活動状況
取締役会への出席状況、発言状況及び期待される役割に関して行った職務の概要
― 16 ―
取締役会発言状況及び期待される役割に関して行った職務の概要
24回/24回
(出席率100%)
会社経営に関する豊富な経験と見識を活かし、客観的な立場から発言を
行っております。また、独立した客観的な立場からの監督を期待し、指
名諮問委員会の委員長及び報酬諮問委員会の委員として職務を遂行して
いただいております。営業・マーケティングの高い専門性を活かし、ア
ルミ電解コンデンサの開発に関する会議にご出席いただき有益な助言を
いただいております。
取締役会発言状況及び期待される役割に関して行った職務の概要
19回/19回
(出席率100%)
公認会計士としての豊富な経験と財務及び会計に関する相当程度の知見
を活かし、客観的な立場から発言を行っております。また、独立した客
観的な立場からの監督を期待し、指名諮問委員会及び報酬諮問委員会の
委員として職務を遂行していただいております。財務・会計の高い専門
性を活かし、各種会議にご出席いただき有益な助言をいただいておりま
す。
②社外取締役 吉田浩
ア.重要な兼職先と当社との関係
該当事項はありません。
イ.主要取引先等特定関係事業者との関係
該当事項はありません。
ウ.主な活動状況
取締役会への出席状況、発言状況及び期待される役割に関して行った職務の概要
③社外取締役 中野智美
ア.重要な兼職先と当社との関係
中野智美氏が代表を務められている中野智美公認会計士・税理士事務所と当社は、取引
関係その他特別な関係はありません。加えて、同氏が社外取締役(監査等委員)を務めら
れている日本調剤(株)及び同氏が監督役員を務められているヘルスケア&メディカル投資法
人と当社は、取引関係その他特別な関係はありません。なお、同氏が社外取締役(監査等
委員)を務められている(株)めぶきフィナンシャルグループと当社との間には借入等の取引
はありません。
イ.主要取引先等特定関係事業者との関係
該当事項はありません。
ウ.主な活動状況
取締役会への出席状況、発言状況及び期待される役割に関して行った職務の概要
― 17 ―
取締役会監査役会発言状況
23回/24回
(出席率96%)
17回/18回
(出席率94%)
公認会計士としての豊富な経験と財務及び会計に
関する相当程度の知見を活かし、客観的な立場か
ら発言を行っております。
取締役会監査役会発言状況
24回/24回
(出席率100%)
18回/18回
(出席率100%)
公認会計士としての豊富な経験と財務及び会計に
関する相当程度の知見を活かし、客観的な立場か
ら発言を行っております。
④社外監査役 土居正明
ア.重要な兼職先と当社との関係
土居正明氏が社外監査役を務められている神鋼鋼線工業(株)と当社は、取引関係その他特
別な関係はありません。
イ.主要取引先等特定関係事業者との関係
該当事項はありません。
ウ.主な活動状況
取締役会及び監査役会への出席状況及び発言状況
⑤社外監査役 小川薫
ア.重要な兼職先と当社との関係
小川薫氏が社外監査役を務められている(株)ジャパン・ティッシュエンジニアリングと当
社は、取引関係その他特別な関係はありません。
イ.主要取引先等特定関係事業者との関係
該当事項はありません。
ウ.主な活動状況
取締役会及び監査役会への出席状況及び発言状況
(4) 責任限定契約の内容の概要
当社は、2014年6月27日開催の第67期定時株主総会で定款を変更し、社外取締役及び社外
監査役の責任限定契約に関する規定を設けており、当該規定に基づき社外取締役全員及び社外監
査役全員と責任限定契約を締結しております。その概要は以下のとおりであります。
(責任限定契約の概要)
契約締結以降、社外取締役及び社外監査役がその任務を怠ったことにより当社に損害を与えた
場合において、その職務を行うにつき善意でかつ重過失がなかったときは、会社法第425条第1
項に定める額を限度として損害賠償責任を負うものとする。
― 18 ―
(5) 役員等賠償責任保険契約の内容の概要
当社は会社法第430条の3第1項に規定する役員等賠償責任保険契約を保険会社との間で締結
し、被保険者が役員としての業務につき行った行為に起因して保険期間中に損害賠償請求を受け
た場合に、被保険者が法律上の損害賠償責任を負担することによって被る損害を填補することと
しております。被保険者は当社及び当社子会社の取締役及び監査役であり、すべての被保険者に
ついてその保険料を当社が全額負担しております。なお、被保険者の犯罪行為、故意の法律違反
等に起因する損害賠償は填補の対象外としております。
― 19 ―
①当社が支払うべき報酬等の額69百万円
②当社及び当社子会社が支払うべき金銭その他の財産上の利益の合計額69百万円
4. 会計監査人の状況
(1) 会計監査人の名称 EY新日本有限責任監査法人
(2) 会計監査人の報酬等の額
(注)1. 当社と会計監査人との間の監査契約においては、会社法上の監査に対する報酬等の額と金融商品
取引法上の監査に対する報酬等の額等を区分しておらず、かつ、実質的にも区分できないため、
上記①の金額をこれらの合計額で記載しております。
2. 当社の重要な子会社のうち、
United Chemi-Con, Inc.、Chemi-Con Materials Corporation、
Europe Chemi-Con(Deutschland)GmbH、Singapore Chemi-Con(Pte)Ltd.、P.T.Indonesia Chemi-
Con、Chemi-Con(Malaysia)Sdn. Bhd.、
台湾佳美工股份有限公司、貴弥功(無錫)有限公司、
Hong Kong Chemi-Con Ltd.、上海貴弥功貿易有限公司、Chemi-Con Electronics(Thailand)Co.,Ltd.
は当社の会計監査人以外の公認会計士又は監査法人の法定監査を受けております。
3. 監査役会は、取締役、社内関係部署及び会計監査人より必要な資料の入手、報告の聴取を通じ
て、会計監査人の監査計画の内容、従前の事業年度における職務遂行状況、報酬見積の算定根拠
について確認し、審議した結果、これらについて適切であると判断したため、会計監査人の報酬
等につき、会社法第399条第1項の同意を行っております。
(3) 会計監査人の解任又は不再任の決定の方針
監査役会は、会計監査人がその職務を適切に遂行することが困難であると認められる場合等、
その解任又は不再任が妥当と判断したときは、株主総会に提出する会計監査人の解任又は不再任
に関する議案の内容を決定いたします。また、会計監査人が会社法第340条第1項各号のいずれ
かに該当すると認められる場合は、監査役全員の同意に基づき、監査役会が会計監査人を解任い
たします。この場合、監査役会が選定した監査役は、解任後最初に招集される株主総会におい
て、会計監査人を解任した旨及びその理由を報告いたします。
― 20 ―
5. 業務の適正を確保するための体制等の整備に関する事項
(1) 業務の適正を確保するための体制
① 当社及び子会社の取締役・使用人の職務の執行が法令及び定款に適合することを確保するた
めの体制
代表取締役社長が、「日本ケミコングループ企業行動憲章」の精神を繰り返し当社グループ
の全役職員に伝えることにより、法令遵守をあらゆる企業活動の前提とすることを徹底する。
また、日常、意識しなければならない心がけを定めた「日本ケミコングループ行動規範」の
徹底を図るため、コンプライアンス体制の整備、充実を推進する。
コンプライアンス統括役員(「役員」には執行役員を含む)が委員長を務めるコンプライアン
ス委員会を中心に、社会規範・企業倫理を遵守した行動及び企業理念に適合した行動の推進を
図るために、教育活動等を行う。
特に、反社会的勢力に対しては、「いかなる国の反社会的勢力・団体の活動も支援しないと
共に、その活動に対しては毅然とした態度で臨む」ことを、当社グループの全役職員に周知徹
底する。
また、平素から警察等の外部専門機関からの情報収集に努めると共に、事案発生時には、外
部専門機関と連携し、速やかに対処できる体制の維持、充実を図る。
代表取締役社長直轄の内部監査部門を設置し、当社グループの業務監査を実施する。
当社グループの財務報告の適正性確保のために、内部監査部門がモニタリングすること等に
より、法令等に従い適切に報告書を提出できる体制の充実を図る。
② 取締役の職務の執行に係る情報の保存及び管理に関する体制
「 文書管理規程」に従い、取締役の職務執行に係る情報を文書又は電磁的媒体(以下「文書」
という)に記録し、保存する。取締役及び監査役は、「文書管理規程」により、常時、これらの
文書を閲覧できるものとする。
③ 当社及び子会社の損失の危険の管理に関する規程その他の体制
企業活動あるいは企業理念実現を阻む様々な要因を排除し、企業が健全に存続・発展するこ
とを目指し、経営トップの方針として「日本ケミコングループリスクマネジメント方針」を当
社グループの全使用人及び関係者に表明すると共に、その徹底を図る。
リスクマネジメント統括役員(「役員」には執行役員を含む)が委員長を務めるリスクマネジ
メント委員会を中心に、会社に重大な影響を与えるリスクを洗い出し、当社グループ共通の管
理を行う体制の整備を進める。特に、地震・風水害等の自然災害、伝染病等の不測の事態が発
生した場合に備え、「事業継続規程」に則り事業継続のために必要な計画を整備し、企業活動
に与える損失を最小限に留めるように努める。
― 21 ―
④ 当社及び子会社の取締役の職務の執行が効率的に行われることを確保するための体制
以下の経営管理システムを用いて、取締役の職務執行の効率化を図る。
ア.「共通職務権限規程」、「分掌職務権限規程」及び「子会社管理規程」
イ.取締役及び執行役員を構成員とする経営委員会
ウ. 取締役会による中期経営計画の策定、中期経営計画に基づく本部、事業統括毎及び部門毎
の目標と予算の設定、ITを活用した月次業績管理の実施
エ.経営委員会及び取締役会による月次業績のレビューと改善策の実施
⑤ 当社及び子会社から成る企業集団における業務の適正を確保するための体制及び子会社の取
締役の職務の執行に係る事項の当社への報告に関する体制
「日本ケミコングループ企業行動憲章」及び「日本ケミコングループ行動規範」に則り、当
社グループ取締役、執行役員、使用人一丸となり、遵法意識の醸成を図る。
当社グループ各社の担当役員及び各社の代表者は、「子会社管理規程」及び各社の「分掌職
務権限規程」、「共通職務権限規程」に基づき各社の業務執行の適正を確保する体制の確立と
運用の権限と責任を有する。
子会社の取締役は「子会社管理規程」及びその他当社グループ共通に適用される規程に基づ
き当社に報告を行う。
⑥ 監査役がその職務を補助すべき使用人を置くことを求めた場合における当該使用人に関する
事項及び当該使用人の取締役からの独立性並びに当該使用人に対する指示の実効性の確保に
関する事項
監査役の職務を補助すべき使用人を1名以上配置し、この使用人の人事異動については、事
前に 監査役会と協議するものとする。この使用人は監査役の指揮命令下で職務遂行し、監査役
の補助に専念するものとする。
⑦ 当社及び子会社の取締役及び使用人並びに子会社の監査役が当社の監査役に報告をするため
の体制その他の監査役への報告に関する体制
当社及び子会社の取締役及び使用人並びに子会社の監査役は、監査役会に対して、法定の事
項に加え、当社及び当社グループに重大な影響を及ぼす事項、内部監査の実施状況、内部通報
制度による通報状況及びその内容を速やかに報告する。報告者、報告時期等報告の方法につい
ては、取締役と監査役会との協議により決定する方法によるものとする。
― 22 ―
⑧ 監査役への報告をした者が当該報告をしたことを理由として不利な取扱いを受けないことを
確保するための体制
「 内部通報の取り扱いに関する規程」に基づき、監査役へ報告した者を当該報告をしたこと
を理由として、解雇その他いかなる不利な取扱いも行わない。また、当該報告者の職場環境が
悪化することのないよう適切な措置を採るように努める。更に、このことを当社グループ全役
職員に周知徹底させるために教育を行う。
⑨ 監査役の職務の執行について生ずる費用の前払又は償還の手続その他の当該職務の執行につ
いて生ずる費用又は債務の処理に係る方針に関する事項
監査役が監査役会で定めた監査方針及び監査計画等に従って支出した監査の費用又はその他
監査に必要な費用について、当社は監査の支障が生じないよう速やかに支払い又は償還を行
う。
⑩ その他監査役の監査が実効的に行われることを確保するための体制
監査役の監査が実効的に行われることを確保するための体制として、監査役会と代表取締役
との定期的な意見交換、監査役会による取締役、執行役員又は重要な使用人への定期的なヒア
リング、会計監査人との定期情報交換、内部監査部門長による内部監査報告を実施する。
(2) 業務の適正を確保するための体制の運用状況
当事業年度における業務の適正を確保するための体制の運用状況の概要は次のとおりであります。
① 取締役会を毎月1回以上開催し、取締役及び監査役は、上程された審議事項について活発な
意見交換を行っています。特に、社外取締役は独立的かつ客観的・専門的立場から意見を表明
すると共に、監査役会と連携し、取締役の業務執行について積極的に提言を行っています。ま
た、 コンプライアンス委員会では、グループ全体を射程として、コンプライアンス方針の策定
並びにコンプライアンスに係る行動計画の策定及び実施状況のモニタリング等を行っています。
また、「日本ケミコングループ企業行動憲章」及び「日本ケミコングループ行動規範」の遵
守状況を確認し、かつ当該遵守を確実なものとするため、各事業所に対し本社管理部門による
CSR監査等の内部監査を実施しています。
更に、当社では、新入社員や各階層の従業員に対して、定期的にコンプライアンス研修を実
施しています。加えて、競争法規制に関しては、同規制に対する従業員の理解を徹底するた
め、 営業部門を始めとした関係各部門を対象に、外部講師(弁護士)によるコンプライアンス
講習会を実施しているほか、社内における遵守体制を確認するために法務担当者による監査を
行っております。
― 23 ―
② 「文書管理規程」等の関連規程に基づき、取締役会等の議事録を始めとする業務執行に関す
る文書を適切に保管しています。また、各取締役及び監査役は、必要に応じて、これらの文書
を閲覧・確認しています。
③ 半期に一度、リスクマネジメント委員会を開催し、会社に重大な影響を与えるリスクの洗い
出しやそれに対処するための体制の整備について議論しました。当該委員会では、品質保証、
環境、知的財産権及び管理(情報セキュリティ、法務・倫理、災害・事故)の各担当部門長よ
り、 対象期間内に発生した重大事故についての報告を行い、各部門間でのリスク意識の共有を
図っています。また、「事業継続計画」を始めとする当社グループ共通のリスク管理体制の整
備を進めています。
④ 機動的な意思決定を可能とするため、経営委員会を設置し、原則として毎月2~4回程度開
催して経営上の重要事項を審議しています。また、当社は、2023年度から2025年度を対象と
する「第10次中期経営計画」を策定しており、各取締役及び執行役員は、当該計画を指標とし
た効率的な経営施策の実行に努めました。経営委員会及び取締役会は、月次業績のレビューを
通じ、適宜経営課題を把握し、必要な是正を行うことで、職務執行の効率化を図っています。
⑤ 当社取締役及び使用人等は、監査役会に対して適切に報告を行っています。具体的には、法
定事項の報告に加え、各部門の業務の執行状況についての報告が行われたほか、後述する監査
室による内部監査の実施状況及び評価報告等が行われました。各報告に対して、監査役は必要
に応じて意見を述べています。
⑥ 法令違反行為や「日本ケミコングループ企業行動憲章」に反する行為の早期発見、早期是
正、 再発防止を目的に、内部通報制度を設けています。社内の窓口に加えて社外窓口を設置
し、 匿名通報を可能とすることで従業員が安心して通報できる環境を整えています。また、
「内部通報の取り扱いに関する規程」や当社グループにおける内部通報処理の仕組みを、社内
イントラネット上で自由に閲覧可能とすることで、内部通報制度の存在及び具体的な処理の仕
組み、並びに監査役等へ報告をした者が、それによって不利な取扱いを受けることのないこと
を、 従業員に周知しています。また、新入社員研修や各階層別研修等において、内部通報制度
についての説明・教育を行っています。
⑦ 監査役会においては、代表取締役との定期的な意見交換を行うと共に、執行役員及び重要な
使用人を対象とした個別の聴聞の機会を設け、また、代表取締役社長直轄の内部監査部門であ
る監査室からその監査結果及び運営状況について報告を受けるなど緊密に連携することで、監
査役としての監査機能の強化を図っています。更に、監査役会は、四半期毎に会計監査人と、
会計監査人による監査報告、監査計画及び監査実施状況等について意見交換を行うほか、期中
においても必要に応じて会合を開催するなど、会計監査人との連携を図っています。
― 24 ―
(注) 本事業報告中の記載数字は表示単位未満の端数を切り捨てて表示しております。
ただし、百分率は四捨五入して表示しております。
6. 会社の支配に関する基本方針
当社は、1931年の創業以来、アルミ電解コンデンサのリーディングカンパニーとしてエレクト
ロニクス市場にアルミ電解コンデンサを始めとする各種電子部品を安定的に供給してまいりまし
た。当社グループの特色は、これらの材料研究から生産設備の設計、製品化に至るまでのあらゆる
プロセスをグループ内で一貫して行うことにあり、これにより当社グループは顧客に対して常に独
創的で信頼性の高い電子部品を供給することが可能になっています。また、当社グループではアル
ミ電解コンデンサ用電極箔等の材料開発や将来を見据えた素材の基礎研究に積極的に取り組んでお
り、これらを活かした新製品の開発・事業化には多くの時間と経営資源を投入しています。このた
め当社は、経営方針の継続性を一定期間維持する必要があり、定期的に3ヵ年の中期経営計画を策
定し経営の効率化に努めています。更に、これらの事業運営にあたっては、「環境と人にやさしい
技術への貢献」を企業理念に掲げ、研究開発から生産活動などの企業活動の全域にわたり地球環境
の保全に取り組んでおり、当社はこの企業理念のもと、各種電子部品の開発・供給を通じてエレク
トロニクス産業の発展に寄与することが当社の企業価値ひいては株主共同の利益の向上につながる
ものと考えています。
従って、当社では、当社の財務及び事業の方針の決定を支配する者とは、以上のような当社グル
ープの経営、企業理念及び様々なステークホルダー(顧客、取引先、従業員、地域社会等)との間
に築かれた関係等、当社の企業価値の源泉を十分に理解し、当社が企業価値ひいては株主共同の利
益を継続的かつ持続的に確保・向上していくことを可能とする者でなければならないと考えており
ます。
当社は、上場会社であり市場の判断に基づく経営支配権の異動を通じた経営革新の効果や企業活
動の 活性化を否定するものではありませんが、当社株式の大量取得を目的とする買付けについて
は、当該買付け行為又は買収提案の当社の企業価値、株主共同の利益への影響を慎重に検討し判断
する必要があると考えています。
現在のところ、当社ではいわゆる「買収防衛策」を予め定めることはしておりません。しかし、
当社と致しましては、株主の皆様から経営を負託された者の責務として、常に当社の株式取引や異
動の状況に重大な関心を持つと共に、有事対応のコンテンジェンシー・プランを策定し、当社株式
を大量に取得しようとする者が出現した場合には、社外の専門家を含めたプロジェクトチームを組
織し、当該買収提案の評価や当該取得者との交渉を行い、当社の企業価値、株主共同の利益に資さ
ないと判断された場合には、直ちに具体的な対抗措置の要否、内容等を速やかに決定し、実行する
体制を整えるなど、当社として最も適切と考えられる措置を講じてまいります。
― 25 ―
連 結 貸 借 対 照 表
科目金額科目金額
資 産 の 部負 債 の 部
流 動 資 産
現 金 及 び 預 金
電 子 記 録 債 権 及 び 売 掛 金
商 品 及 び 製 品
仕掛品
原 材 料 及 び 貯 蔵 品
未収入金
その他
貸 倒 引 当 金
固 定 資 産
有 形 固 定 資 産
建 物 及 び 構 築 物
機 械 装 置 及 び 運 搬 具
工 具 、 器 具 及 び 備 品
土地
リ ー ス 資 産
使 用 権 資 産
建 設 仮 勘 定
無 形 固 定 資 産
投資その他の資産
投 資 有 価 証 券
退 職 給 付 に 係 る 資 産
繰 延 税 金 資 産
その他
貸 倒 引 当 金
87,573
21,291
29,209
11,869
12,297
7,059
5,179
683
△17
78,411
47,548
14,532
16,919
2,686
6,980
881
3,272
2,275
2,568
28,294
15,629
8,704
1,740
2,236
△17
流 動 負 債58,456
支 払 手 形 及 び 買 掛 金8,741
電 子 記 録 債 務4,844
短 期 借 入 金34,640
リ ー ス 債 務633
未払金4,076
未 払 法 人 税 等641
未払費用2,155
賞 与 引 当 金1,493
その他1,228
固 定 負 債44,393
長 期 借 入 金35,871
リ ー ス 債 務3,771
繰 延 税 金 負 債1,715
退 職 給 付 に 係 る 負 債2,215
その他818
負 債 合 計102,850
純 資 産 の 部
株 主 資 本36,954
資 本 金5,452
資 本 剰 余 金56,793
利 益 剰 余 金△24,327
自 己 株 式△963
その他の包括利益累計額25,524
その他有価証券評価差額金196
為 替 換 算 調 整 勘 定15,575
退職給付に係る調整累計額9,752
非 支 配 株 主 持 分656
純 資 産 合 計63,135
資 産 合 計165,985負 債 ・ 純 資 産 合 計165,985
(2026年3月31日現在)
(単位:百万円)
(注) 記載金額は百万円未満を切り捨てて表示しております。
― 26 ―
連 結 損 益 計 算 書
(
2025年 4 月 1 日から
2026年 3 月31日まで
)
科目金額
売上高136,821
売上原価112,376
売上総利益24,444
販 売 費 及 び 一 般 管 理 費21,074
営業利益3,369
営業外収益831
受 取 利 息 及 び 配 当 金116
為替差益173
持 分 法 に よ る 投 資 利 益185
補助金収入225
その他129
営業外費用2,106
支払利息1,508
資金調達費用520
その他76
経常利益2,094
特別利益1,648
固定資産売却益0
受取和解金1,648
特別損失218
固定資産処分損42
減損損失175
税 金 等 調 整 前 当 期 純 利 益3,524
法 人 税 、 住 民 税 及 び 事 業 税840
法 人 税 等 調 整 額252
当期純利益2,432
非 支 配 株 主 に 帰 属 す る 当 期 純 利 益64
親 会 社 株 主 に 帰 属 す る 当 期 純 利 益2,367
(単位:百万円)
(注) 記載金額は百万円未満を切り捨てて表示しております。
― 27 ―
連結株主資本等変動計算書
(
2025年 4 月 1 日から
2026年 3 月31日まで
)
株主資本
資 本 金資本剰余金利益剰余金自 己 株 式株主資本合計
2 0 2 5 年 4 月 1 日 残 高5,45257,343△26,681△96135,153
当 連 結 会 計 年 度 中 の 変 動 額
剰 余 金 の 配 当△550△14△564
親 会 社 株 主 に 帰 属
す る 当 期 純 利 益
2,3672,367
自 己 株 式 の 取 得△2△2
株主資本以外の項目の当連結
会計年度中の
変 動 額 ( 純 額 )
当 連 結 会 計 年 度 中 の
変 動 額 合 計
-△5502,353△21,801
2 0 2 6 年 3 月 3 1 日 残 高5,45256,793△24,327△96336,954
その他の包括利益累計額
非支配株主
持分
純資産合計
その他有価証
券評価差額金
為 替 換 算
調 整 勘 定
退職給付に係る
調 整 累 計 額
その他の包括利益
累 計 額 合 計
2 0 2 5 年 4 月 1 日 残 高△12112,5998,48620,96554856,667
当 連 結 会 計 年 度 中 の 変 動 額
剰 余 金 の 配 当△564
親 会 社 株 主 に 帰 属
す る 当 期 純 利 益
2,367
自 己 株 式 の 取 得△2
株主資本以外の項目の当連結
会計年度中の
変 動 額 ( 純 額 )
3172,9751,2654,5591074,666
当 連 結 会 計 年 度 中 の
変 動 額 合 計
3172,9751,2654,5591076,467
2 0 2 6 年 3 月 3 1 日 残 高19615,5759,75225,52465663,135
(単位:百万円)
(注) 記載金額は百万円未満を切り捨てて表示しております。
― 28 ―
市場価格のない株式等.........移動平均法による原価法
原 材 料.........主として先入先出法又は最終仕入原価法による原価法
連結注記表
(連結計算書類の作成のための基本となる重要な事項の注記)
1. 連結の範囲に関する事項
連結子会社の数20社
主要な連結子会社の名称
ケミコン東日本(株)、ケミコンデバイス(株)、United Chemi-Con,Inc.、Chemi-Con Materials
Corporation、Europe Chemi-Con(Deutschland)GmbH、Singapore Chemi-Con(Pte)
Ltd.、P.T.Indonesia Chemi-Con、Chemi-Con(Malaysia)Sdn.Bhd.、台湾佳美工股份有限公
司、貴弥功(無錫)有限公司、Hong Kong Chemi-Con Ltd.、上海貴弥功貿易有限公司
2. 持分法の適用に関する事項
(1) 持分法適用の非連結子会社の数なし
(2) 持分法適用関連会社の数1社
三瑩電子工業(株)
三瑩電子工業(株)の決算日は12月31日であり、同日現在の計算書類を使用しております。
(3) 持分法を適用しない関連会社の数 1社
(持分法を適用しない理由)
持分法非適用会社は、当期純損益及び利益剰余金等に及ぼす影響が軽微であり、かつ全体としても重
要性がないため、持分法の適用から除外しております。
3. 連結子会社の事業年度等に関する事項
連結子会社のうち、Dong Guang KDK Aluminum Foil Manufacture Ltd.、上海貴弥功貿易有限公
司 、貴弥功(無錫)有限公司、Chemi-Con Electronics(Thailand)Co.,Ltd.、Chemi-Con
Electronics(Korea)Co.,Ltd. 及びChemi-Con Trading(Shenzhen)Co.,Ltd.の決算日は12月31
日であります。連結計算書類の作成にあたっては同日現在の計算書類を使用し、連結決算日との間に生
じた重要な取引は連結上必要な調整を行っております。またChemi-Con Trading(Shenzhen)
Co.,Ltd.については、連結決算日現在で実施した仮決算に基づく計算書類を使用しております。
なお、その他の連結子会社の決算日は、連結決算日と一致しております。
4. 会計方針に関する事項
(1) 有価証券の評価基準及び評価方法
その他有価証券
(2) 棚卸資産の評価基準及び評価方法
製品、仕掛品.........主として総平均法又は先入先出法による原価法
(収益性の低下による簿価切下げの方法により算定)
商品、貯蔵品.........最終仕入原価法による原価法
(収益性の低下による簿価切下げの方法により算定)
(収益性の低下による簿価切下げの方法により算定)
(3) デリバティブ............時価法
― 29 ―
有形固定資産.........
(リース資産及び
使用権資産を除く)
主として定額法によっております。
なお、主な耐用年数は次のとおりであります。
建物.........2~41年
機械装置...2~10年
無形固定資産.........
(リース資産を除く)
主として定額法によっております。ただし、自社利用のソフトウェアについて
は、社内における利用可能期間(5年)に基づく定額法によっております。
(4) 重要な減価償却資産の減価償却の方法
リース資産............所有権移転ファイナンス・リース取引に係るリース資産
自己所有の固定資産に適用する減価償却方法と同一の方法を採用しておりま
す。
所有権移転外ファイナンス・リース取引に係るリース資産
リース期間を耐用年数とし、残存価額を零とする定額法を採用しております。
使用権資産............リース期間を耐用年数とし、残存価額を零とする定額法を採用しております。
(5) 重要な引当金の計上基準
貸 倒 引 当 金......金銭債権の貸倒れによる損失に備えるため、一般債権については貸倒実績率
により、貸倒懸念債権等特定の債権については個別に回収可能性を検討し、
回収不能見込額を計上しております。
賞 与 引 当 金......当社、国内連結子会社及び一部の在外連結子会社では、将来の従業員賞与の
支給に備えるため、支給見込額のうち当連結会計年度の負担に属すると認め
られる額を計上しております。
(6) 収益及び費用の計上基準
当社グループはコンデンサの製造・販売を主な事業とし、製品の販売については製品の引渡時点にお
いて顧客が当該製品に対する支配を獲得し、履行義務が充足されると判断していることから、製品の
引渡時点で収益を認識しております。なお、「収益認識に関する会計基準の適用指針」(企業会計基
準適用指針第30号 2021年3月26日)第98項に定める代替的な取扱いを適用し、商品又は製品の
国内の販売において、出荷時から当該商品又は製品の支配が顧客に移転される時までの期間が通常の
期間である場合には、出荷時に収益を認識しております。
また、収益は顧客との契約において約束された対価から返品、値引き及び割戻し等を控除した金額で
測定しております。
取引の対価は履行義務を充足してから1年以内に受領しており、重要な金融要素は含まれておりませ
ん。
(7) 重要なヘッジ会計の方法
① ヘッジ会計の方法
金利スワップについては特例処理の要件を満たしておりますので、特例処理を採用しております。
② ヘッジ手段とヘッジ対象、ヘッジ方針
当社グループは借入金の金利変動リスクを回避する目的で金利スワップを行っており、ヘッジ対象
の識別は個別契約毎に行っております。
③ ヘッジ有効性評価の方法
特例処理によっている金利スワップについては、有効性の評価を省略しております。
― 30 ―
(8) その他連結計算書類の作成のための重要な事項
① 退職給付に係る負債の計上基準
退職給付に係る負債は、従業員の退職給付に備えるため、当連結会計年度末における見込額に基づ
き、退職給付債務から年金資産の額を控除した額を計上しております。
退職給付債務の算定にあたり、退職給付見込額を当連結会計年度末までの期間に帰属させる方法に
ついては、給付算定式基準によっております。
過去勤務費用は、その発生時の従業員の平均残存勤務期間による定額法により費用処理しておりま
す。
数理計算上の差異は、各連結会計年度の発生時における従業員の平均残存勤務期間による定額法に
より按分した額をそれぞれ発生の翌連結会計年度から費用処理しております。
未認識数理計算上の差異及び未認識過去勤務費用については、税効果を調整の上、純資産の部にお
けるその他の包括利益累計額の退職給付に係る調整累計額に計上しております。
② 消費税等の会計処理
消費税等の会計処理は、税抜方式によっております。
③ グループ通算制度の適用
当社及び国内連結子会社については、グループ通算制度を適用しております。
(会計上の見積りに関する注記)
繰延税金資産の回収可能性
(1) 当連結会計年度の連結計算書類に計上した金額
繰延税金資産(純額)1,740百万円
(繰延税金負債と相殺前の金額は4,034百万円)
(2) 連結計算書類利用者の理解に資するその他の情報
① 算出方法
繰延税金資産は、将来減算一時差異及び税務上の繰越欠損金に対して、課税所得の見積りにより繰
延税金資産の回収可能性を判断しております。課税所得の見積りは翌期の事業計画を基礎としてお
ります。
② 主要な仮定
課税所得の見積りの基礎となる翌期の事業計画における主要な仮定は、販売数量及び販売価格であ
ります。
③ 翌年度の連結計算書類に与える影響
繰延税金資産の回収可能性は将来の課税所得の見積りに依存するため、その見積額の前提とした条
件や仮定に変更が生じ減少した場合は、繰延税金資産の取崩しが発生する可能性があります。
― 31 ―
棚卸資産13,806百万円
建物及び構築物5,383百万円
土地7,222百万円
投資有価証券15,447百万円
計41,860百万円
長期借入金9,350百万円
計9,350百万円
2. 有形固定資産の減価償却累計額...........................................................................185,090百万円
(連結貸借対照表に関する注記)
1. 担保に供している資産及び担保に係る債務
(1) 担保に供している資産
(2) 担保に係る債務
3. 財務制限条項
当社は金融機関とシンジケートローン契約、タームローン契約及びコミットメントライン契約を締結し
ており、本契約には連結貸借対照表等より算出される一定の指標等を基準とする財務制限条項が付され
ております。
4. その他
当社、当社の台湾子会社である台湾佳美工股份有限公司及び当社の香港子会社であるHong Kong
Chemi-Con Ltd.は、アルミ電解コンデンサの取引に関する台湾競争法違反に基づく制裁金を課す旨の
処分について、台湾公平交易委員会に対する行政処分取消訴訟を台湾で提起していました。今般、台北
高等行政裁判所主催の調停手続が実施され、当社と台湾公平交易委員会とは2026年1月13日、和解に
合意し、同日調停が成立しました。
これにより当社及び当社グループを当事者とする、アルミ電解コンデンサ等の取引に関する競争法違反
関連の訴訟は、本案件を含めて全て終結いたしました。
― 32 ―
場所用途種類減損損失
山形県 長井市
事業用資産
機械装置及び運搬具
工具、器具及び備品
74百万円
Cikarang Selatan, Bekasi,
Indonesia
100百万円
(連結損益計算書に関する注記)
1. 受取和解金
当社、当社の台湾子会社である台湾佳美工股份有限公司及び当社の香港子会社であるHong Kong
Chemi-Con Ltd.(以下「当社ら」といいます。)は、アルミ電解コンデンサの取引に関する台湾競争法
違反に基づく制裁金を課す旨の処分について、台湾公平交易委員会に対する行政処分取消訴訟を台湾で提
起していました。今般、台北高等行政裁判所主催の調停手続が実施され、当社と台湾公平交易委員会とは
2026年1月13日、和解に合意し、同日調停が成立しました。
同和解の結果、当社らは台湾公平交易委員会から合計3億4,573万新台湾ドルの返金を受けたことによ
り、2026年3月期において特別利益として16億48百万円計上いたしました。
2. 減損損失
当連結会計年度(自 2025年4月1日 至 2026年3月31日)
当社グループは以下の資産グループについて減損損失を計上しております。
(1) 減損損失を計上した資産グループの概要
(2) 減損損失の認識に至った経緯
当社グループの資産グループは、事業用資産については事業部門の区分毎に、遊休資産については個別
単位でグルーピングを行っております。
上記の事業用資産は、一部製品において収益性の低下が見込まれる一部顧客向けの取引に関連する製造
設備について、帳簿価額を回収可能価額まで減額しております。回収可能価額については使用価値によ
り測定しております。
― 33 ―
株式の種類
当連結会計年度
期首の株式数
当連結会計年度
増加株式数
当連結会計年度
減少株式数
当連結会計年度末
の株式数
普通株式 (注)121,939,933株2,758,517株―24,698,450株
A種種類株式10,000株――10,000株
B種種類株式 (注)25,000株―1,999株3,001株
合 計21,954,933株2,758,517株1,999株24,711,451株
決議株式の種類配当の原資
配当の総額
(百万円)
1株当たり
配当額(円)
基準日効力発生日
2025年6月27日
定時株主総会
A種種類株式資本剰余金55055,0002025年3月31日2025年6月30日
決議株式の種類配当の原資
配当の総額
(百万円)
1株当たり
配当額(円)
基準日効力発生日
2026年6月26日
定時株主総会(予定)
普通株式資本剰余金493202026年3月31日2026年6月29日
2026年6月26日
定時株主総会(予定)
A種種類株式資本剰余金55055,0002026年3月31日2026年6月29日
2026年6月26日
定時株主総会(予定)
B種種類株式資本剰余金4615,514.72026年3月31日2026年6月29日
(連結株主資本等変動計算書に関する注記)
1. 発行済株式の種類及び総数に関する事項
(注)1.普通株式の発行済株式数の増加2,758,517株は、B種種類株式の普通株式を対価とする取得請求権
の行使に伴う交付による増加であります。
2. B種種類株式の発行済株式の株式数の減少1,999株は、B種種類株式の普通株式を対価とする取得
請求権が行使されたことに伴い取得した自己株式を消却したことによる減少であります。
2. 配当に関する事項
(1) 配当金支払額等
(2) 基準日が当連結会計年度に属する配当のうち、配当の効力発生日が翌連結会計年度となるもの
― 34 ―
(金融商品に関する注記)
1. 金融商品の状況に関する事項
(1) 金融商品に対する取組方針
当社グループは、資金運用については短期的な預金に限定し、また、資金調達については主に銀行借
入、社債発行、増資による方針です。デリバティブについては為替リスク及び借入金の金利変動リス
クを回避するために利用しております。
(2) 金融商品の内容及びそのリスク並びに管理体制
電子記録債権及び売掛金は、当社グループにおける得意先等の信用リスクに晒されております。当該
リスクにつきましては売掛債権管理規程等に従い、得意先毎の期日管理及び残高管理を行っておりま
す。
投資有価証券である株式は市場価格変動リスクに晒されていますが、四半期毎に把握された時価が経
営委員会に報告されております。
営業債務である支払手形及び買掛金、電子記録債務並びに未払金は1年以内の支払期日であります。
借入金のうち、短期借入金は営業取引に係る資金調達であり、長期借入金(原則として7年以内)は
主に設備投資に係る資金調達であります。変動金利の借入金は、金利の変動リスクに晒されており、
外貨建ての借入金は為替の変動リスクに晒されております。
デリバティブ取引は、外貨建ての営業債権債務に係る為替の変動リスクに対するヘッジを目的に先物
為替予約取引を行っております。また、借入金に係る金利の変動リスクに対するヘッジを目的に金利
スワップ取引を行っております。
なお、ヘッジの有効性の評価については、金利スワップ取引は特例処理の要件を満たしており、有効
性の評価を省略しております。
― 35 ―
連結貸借対照表計上額時価差額
投資有価証券
関係会社株式
15,44710,626(4,820)
資産計15,44710,626(4,820)
長期借入金35,87134,599(1,272)
負債計35,87134,599(1,272)
デリバティブ取引 ※(67)(67)-
2. 金融商品の時価等に関する事項
2026年3月31日における連結貸借対照表計上額、時価及びこれらの差額については、次のとおりであ
ります。なお、市場価格のない株式等(連結貸借対照表計上額 182百万円)は「関係会社株式」には
含めておりません。「現金及び預金」、「電子記録債権及び売掛金」、「支払手形及び買掛金」、「電
子記録債務」、「未払金」及び「短期借入金」については、現金及び短期間で決済されるため、時価が
帳簿価額に近似することから注記を省略しております。
(単位:百万円)
※ デリバティブ取引によって生じた正味の債権・債務は純額で表示しており、合計で正味の債務となる項目については、
( )表示しております。
(注)時価の算定に用いた評価技法及び時価の算定に係るインプットの説明
金融商品の時価を、時価の算定に係るインプットの観察可能性及び重要性に応じて、以下の3つのレベルに分類して
おります。
レベル 1 の時価:同一の資産又は負債の活発な市場における(無調整の)相場価格により算定した時価
レベル 2 の時価:レベル 1 のインプット以外の直接又は間接的に観察可能なインプットを用いて算定した時価
レベル 3 の時価:重要な観察できないインプットを使用して算定した時価
時価の算定に重要な影響を与えるインプットを複数使用している場合には、それらのインプットがそれぞれ属するレ
ベルのうち、時価の算定における優先順位が最も低いレベルに時価を分類しております。
投資有価証券
上場株式は相場価格を用いて評価しております。上場株式は活発な市場で取引されているため、その時価をレベル1の
時価に分類しております。
デリバティブ取引
為替予約取引の時価については、先物為替相場によっております。金利スワップの特例処理によるものは、ヘッジ対象
とされている長期借入金と一体として処理されているため、その時価は当該長期借入金の時価に含めて記載しておりま
す(下記「長期借入金」参照)。
長期借入金
長期借入金の時価については、元利金の合計額を同様の新規借入を行った場合に想定される利率で割り引いて算定する
方法によっており、レベル2の時価に分類しております。
変動金利による長期借入金は金利スワップの特例処理の対象とされており(上記「デリバティブ取引」参照)、当該金
利スワップと一体として処理された元利金の合計額を、同様の借入を行った場合に適用される合理的に見積られる利率
で割り引いて算定する方法によっております。
― 36 ―
1. 1株当たり純資産額..........................................................................................2,029円52銭
2. 1株当たり当期純利益.......................................................................................106円29銭
(単位:百万円)
報告セグメント
その他計
コンデンサ
売上高
日本22,8513,35326,205
中国45,81322146,034
米州13,6612013,681
欧州14,399414,403
その他35,0971,39736,495
顧客との契約から生じる収益131,8234,998136,821
その他の収益---
外部顧客への売上高131,8234,998136,821
当連結会計年度
顧客との契約から生じた債権29,209 百万円
契約負債29 百万円
(1株当たり情報に関する注記)
(収益認識に関する注記)
1. 顧客との契約から生じる収益を分解した情報
当社グループの主たる地域別の収益の分解と主たる製品との関連は次のとおりであります。
(注)売上高は顧客の所在地を基礎とし、国又は地域に分類しております。
2. 顧客との契約から生じる収益を理解するための基礎となる情報
顧客との契約から生じる収益を理解するための基礎となる情報は「4.会計方針に関する事項 (6)収益及
び費用の計上基準」に同一の内容を記載しているため、記載を省略しております。
3. 当連結会計年度及び翌連結会計年度以降の収益の金額を理解するための情報
契約負債は主に、製品の引渡前に顧客から受け取った対価であり、連結貸借対照表上、流動負債のその
他に含まれております。
顧客との契約から生じた債権及び契約負債は以下のとおりであります。
当連結会計年度に認識された収益のうち、期首現在の契約負債の残高に含まれていた金額に重要性はあ
りません。なお、過去の期間に充足した履行義務から、当連結会計年度に認識した収益の額には重要性
はありません。
― 37 ―
(重要な後発事象に関する注記)
普通株式の発行
当社は、2026年5月11日付で当社が発行するB種種類株式の保有者であるジャパン・インダストリアル・ソ
リューションズ第参号投資事業有限責任組合より、その保有するB種種類株式の一部について普通株式を対価
とする取得請求権が行使され、普通株式を交付いたしました。
B種種類株式の普通株式への転換内容
①取得した株式の種類 B種種類株式
②取得請求権行使日 2026年5月11日
③行使されたB種種類株式の数 901株
④取得請求権の行使に伴い交付する普通株式の数 988,996株
⑤取得請求の効力発生後の発行済普通株式総数 25,687,446株
(その他の注記)
1. 退職給付関係
採用している退職給付制度の概要
当社、国内連結子会社及び一部の在外連結子会社は、確定給付型の制度である確定給付企業年金制度、退
職一時金制度及び確定拠出型の退職給付制度を設けております。なお、従業員の退職等に際して割増退職
金を支払う場合があります。
2. 第三者割当による種類株式の発行、資本金及び資本準備金の額の減少、並びにA種種類株式の取得及び消
却
当社は、2026年3月27日開催の取締役会において、株式会社日本政策投資銀行(以下「割当予定先」と
いいます。)との間で、株式投資契約を締結し、割当予定先に対して、第三者割当の方法により、総額
6,000,000,000円のC種種類株式及び3,000,000,000円のD種種類株式(以下「本種類株式」と総称し
ます。)を発行すること(以下「本第三者割当増資」といいます。)、本第三者割当増資の払込みがなさ
れることを条件に、2026年6月29日を効力発生日として、本第三者割当増資後の資本金及び資本準備金
の額を減少し、その他資本剰余金へ振り替えること(以下「本資本金等の額の減少」といいます。)、並
びにジャパン・インダストリアル・ソリューションズ第参号投資事業有限責任組合が保有するA種種類株
式につき、取得を行うこと、また当該取得を条件として消却を行うこと(以下、併せて「A種種類株式の
取得及び消却」といいます。)を決議いたしました。
(1)本第三者割当増資について
1.C種種類株式
① 払込期日 2026年6月29日
② 発行新株式数 C種種類株式 6,000株
③ 発行価額 1株につき1,000,000円
④ 発行価額の総額 6,000,000,000円
⑤ 募集又は割当方法 第三者割当の方法により株式会社日本政策投資銀行に全てのC種種類株式を
割り当てます。
⑥ その他 C 種種類株式には、累積・非参加型の優先配当金の規定があり、配当率は、
当初年6.5%であり、2029年6月30日以降は年8.5%です。
― 38 ―
2.D種種類株式
① 払込期日 2026年6月29日
② 発行新株式数 D種種類株式3,000株
③ 発行価額 1株につき1,000,000円
④ 発行価額の総額 3,000,000,000円
⑤ 募集又は割当方法 第三者割当の方法により株式会社日本政策投資銀行に全てのD種種類株式を
割り当てます。
⑥ その他 D種種類株式には、累積・非参加型の優先配当金の規定があり、配当率は、
当初年5.0%であり、2029年6月30日以降は年7.0%です。
(2)本資本金等の額の減少について
1.本資本金等の額の減少の目的
今後の機動的かつ柔軟な資本政策に備えるため、本種類株式の発行と併せて本資本金等の額の減少を行
い、分配可能額を構成するその他資本剰余金へ振り替えることといたしました。なお、本資本金等の額の
減少については、本第三者割当増資の払込みがなされることを条件とします。
2.本資本金等の額の減少の内容
会社法第447条第1項及び第3項並びに第448条第1項及び第3項の規定に基づき、資本金及び資本準備金
の額の減少を行い、それぞれの減少額をその他資本剰余金に振り替えるものであります。なお、本資本金
等の額の減少は、「純資産の部」における勘定の振替処理であり、当社の損益及び純資産額の変動は無
く、業績に与える影響はありません。
① 減少する資本金の額
本第三者割当増資後の資本金の額9,952,574,000 円を4,500,000,000 円減少して、5,452,574,000円
とする。
② 減少する準備金の項目及びその額
本第三者割当増資後の資本準備金の額5,022,000,200円を4,500,000,000円減少して、522,000,200円
とする。
③ 増加する剰余金の項目及びその額
その他資本剰余金 9,000,000,000円
3.本資本金等の額の減少の日程
① 取締役会決議日 2026年3月27日
② 債権者異議申述公告 2026年4月7日
③ 債権者異議申述最終期日 2026年5月7日
④ 効力発生日 2026年6月29日(予定)
(3)A種種類株式の取得及び消却について
1.A種種類株式の取得の内容
① 取得株式数 10,000株
② 株式の取得対価の内容 金銭
③ 1株当たりの償還価額 1,103,493.2円
※上記の償還価額は、A種種類株式の1株あたり払込金額相当額(1,000,000円)に償還係数1.085を乗
じた額に、2026年6月29日時点における日割未払優先配当金額を加算した額です。
④ 償還価額の総額 11,034,932,000円
⑤ 取得先 ジャパン・インダストリアル・ソリューションズ第参号投資事業有限責任組合
⑥ 取得予定日 2026年6月29日
なお、A種種類株式の取得については、本第三者割当増資の払込みがなされることを条件とします。
― 39 ―
2.A種種類株式の消却の内容
① 消却する株式数 10,000株
② 消却の効力発生日 2026年6月29日
なお、A種種類株式の消却については、上記「1.A種種類株式の取得の内容」によりA種種類株式を当
社が取得することを条件とします。
3. 連結子会社における訴訟について
当社の子会社であるSingapore Chemi-Con (Pte) Ltd.(以下「SCC」といいます。)は、Dyson
Manufacturing Sdn. Bhd.(以下「Dyson」といいます。)に販売した部品に関して、2024年12月、
Dysonより、シンガポール国際商事裁判所において訴訟を提起されました。Dysonは、SCCに対して、
1億4554万4762英ポンドの損害賠償等の権利があると主張しております。しかしながら、かかる主張
は妥当ではないものと考えており、今後、SCCの責任が否定されるよう、裁判の中で適切に主張・立証し
ていく所存です。
― 40 ―
貸 借 対 照 表
科目金額科目金額
資 産 の 部負 債 の 部
流 動 資 産
現 金 及 び 預 金
電 子 記 録 債 権
売掛金
商 品 及 び 製 品
仕掛品
原 材 料 及 び 貯 蔵 品
未収入金
短 期 貸 付 金
その他
貸 倒 引 当 金
固 定 資 産
有 形 固 定 資 産
建物
構築物
機 械 及 び 装 置
車 両 及 び 運 搬 具
工 具 、 器 具 及 び 備 品
土地
リ ー ス 資 産
建 設 仮 勘 定
無 形 固 定 資 産
ソ フ ト ウ ェ ア
その他
投資その他の資産
関 係 会 社 株 式
長 期 前 払 費 用
繰 延 税 金 資 産
その他
貸 倒 引 当 金
69,822
6,014
1,944
28,310
832
4,701
1,158
9,146
13,260
4,582
△130
66,420
24,199
10,090
416
4,468
3
1,165
6,305
745
1,004
1,977
1,949
28
40,243
35,588
2,944
788
939
△17
流 動 負 債70,081
支払手形23
買掛金26,158
電 子 記 録 債 務4,679
短 期 借 入 金13,471
1年内返済予定の長期借入金21,286
リ ー ス 債 務138
未払金2,149
未 払 法 人 税 等289
未払費用563
賞 与 引 当 金681
その他640
固 定 負 債41,748
長 期 借 入 金37,341
リ ー ス 債 務685
退 職 給 付 引 当 金2,903
その他818
負 債 合 計111,830
純 資 産 の 部
株 主 資 本24,412
資 本 金5,452
資 本 剰 余 金56,793
資 本 準 備 金522
そ の 他 資 本 剰 余 金56,271
利 益 剰 余 金△37,715
そ の 他 利 益 剰 余 金△37,715
繰 越 利 益 剰 余 金△37,715
自 己 株 式△117
純 資 産 合 計24,412
資 産 合 計136,242負 債 ・ 純 資 産 合 計136,242
(2026年3月31日現在)
(単位:百万円)
(注) 記載金額は百万円未満を切り捨てて表示しております。
― 41 ―
損 益 計 算 書
(
2025年 4 月 1 日から
2026年 3 月31日まで
)
科目金額
売上高121,250
売上原価110,529
売上総利益10,720
販 売 費 及 び 一 般 管 理 費10,672
営業利益48
営業外収益1,613
受 取 利 息 及 び 配 当 金1,196
為替差益394
その他22
営業外費用2,240
支払利息1,538
資金調達費用520
その他181
経常損失579
特別利益1,368
固定資産売却益0
受取和解金1,368
特別損失228
固定資産除却損28
関 係 会 社 株 式 評 価 損200
税 引 前 当 期 純 利 益560
法 人 税 、 住 民 税 及 び 事 業 税△44
法人税等調整額17
当期純利益587
(単位:百万円)
(注) 記載金額は百万円未満を切り捨てて表示しております。
― 42 ―
株主資本等変動計算書
(
2025年 4 月 1 日から
2026年 3 月31日まで
)
株主資本
資 本 金
資 本 剰 余 金
資 本
準備金
その他
資 本
剰余金
資 本
剰余金
合 計
2 0 2 5 年 4 月 1 日 残 高5,45246756,87657,343
当 事 業 年 度 中 の 変 動 額
剰 余 金 の 配 当55△605△550
当 期 純 利 益
自 己 株 式 の 取 得
当 事 業 年 度 中 の 変 動 額 合 計-55△605△550
2 0 2 6 年 3 月 3 1 日 残 高5,45252256,27156,793
株主資本
純 資 産 合 計
利 益 剰 余 金
自 己 株 式
株 主 資 本
合計
そ の 他
利益剰余金
利 益
剰余金
合 計
繰 越 利 益
剰 余 金
2 0 2 5 年 4 月 1 日 残 高△38,303△38,303△11524,37624,376
当 事 業 年 度 中 の 変 動 額
剰 余 金 の 配 当△550△550
当 期 純 利 益587587587587
自 己 株 式 の 取 得△2△2△2
当 事 業 年 度 中 の 変 動 額 合 計587587△23535
2 0 2 6 年 3 月 3 1 日 残 高△37,715△37,715△11724,41224,412
(単位:百万円)
(注) 記載金額は百万円未満を切り捨てて表示しております。
― 43 ―
市 場 価 格 の な い 株 式 等.........移動平均法による原価法
原 材 料.........先入先出法による原価法
有形固定資産.........
(リース資産を除く)
定額法によっております。
なお、主な耐用年数は次のとおりであります。
無形固定資産.........
(リース資産を除く)
定額法によっております。ただし、自社利用のソフトウェアについては、社内にお
ける利用可能期間(5年)に基づく定額法によっております。
貸 倒 引 当 金......金銭債権の貸倒れによる損失に備えるため、一般債権については貸倒実績率
により、貸倒懸念債権等特定の債権については個別に回収可能性を検討し、
回収不能見込額を計上しております。
賞 与 引 当 金......将来の従業員賞与の支給に備えるため、支給見込額のうち当期の負担に属す
ると認められる額を計上しております。
退 職 給 付 引 当 金......従業員の退職給付に備えるため、当事業年度末における退職給付債務及び年
金資産の見込額に基づき、当事業年度末において発生していると認められる
額を計上しております。
退職給付債務の算定にあたり、退職給付見込額を当事業年度末までの期間に
帰属させる方法については、給付算定式基準によっております。
過去勤務費用は、その発生時の従業員の平均残存勤務期間による定額法によ
り費用処理しております。
数理計算上の差異は、各事業年度の発生時における従業員の平均残存勤務期
間による定額法により按分した額をそれぞれ発生の翌事業年度から費用処理
しております。
個別注記表
(重要な会計方針に係る事項に関する注記)
1. 有価証券の評価基準及び評価方法
子会社株式及び関連会社株式.........移動平均法による原価法
その他有価証券
2. 棚卸資産の評価基準及び評価方法
製品、仕掛品.........総平均法による原価法
(収益性の低下による簿価切下げの方法により算定)
商品、貯蔵品.........最終仕入原価法による原価法
(収益性の低下による簿価切下げの方法により算定)
(収益性の低下による簿価切下げの方法により算定)
3. デリバティブ............時価法
4. 固定資産の減価償却の方法
建物.........2~41年
機械装置...2~10年
リース資産............所有権移転ファイナンス・リース取引に係るリース資産
自己所有の固定資産に適用する減価償却方法と同一の方法を採用しております。
所有権移転外ファイナンス・リース取引に係るリース資産
リース期間を耐用年数とし、残存価額を零とする定額法を採用しております。
5. 引当金の計上基準
― 44 ―
6. 収益及び費用の計上基準
当社はコンデンサの製造・販売を主な事業とし、製品の販売については製品の引渡時点において顧客が
当該製品に対する支配を獲得し、履行義務が充足されると判断していることから、製品の引渡時点で収
益を認識しております。なお、「収益認識に関する会計基準の適用指針」(企業会計基準適用指針第
30号 2021年3月26日)第98項に定める代替的な取扱いを適用し、商品又は製品の国内の販売にお
いて、出荷時から当該商品又は製品の支配が顧客に移転される時までの期間が通常の期間である場合に
は、出荷時に収益を認識しております。
また、収益は顧客との契約において約束された対価から返品、値引き及び割戻し等を控除した金額で測
定しております。
取引の対価は履行義務を充足してから1年以内に受領しており、重要な金融要素は含まれておりませ
ん。
7. 重要なヘッジ会計の方法
(1) ヘッジ会計の方法
金利スワップについては特例処理の要件を満たしておりますので、特例処理を採用しております。
(2) ヘッジ手段とヘッジ対象、ヘッジ方針
当社は借入金の金利変動リスクを回避する目的で金利スワップを行っており、ヘッジ対象の識別は個
別契約毎に行っております。
(3) ヘッジ有効性評価の方法
特例処理によっている金利スワップについては、有効性の評価を省略しております。
8. その他計算書類の作成のための基本となる重要な事項
(1) 消費税等の会計処理
消費税等の会計処理は、税抜方式によっております。
(2) グループ通算制度の適用
グループ通算制度を適用しております。
(3) 退職給付に係る会計処理
退職給付に係る未認識数理計算上の差異及び未認識過去勤務費用の未処理額の会計処理方法は、連結
計算書類におけるこれらの会計処理の方法と異なっております。
(会計上の見積りに関する注記)
当事業年度の計算書類に計上した金額
繰延税金資産(純額)788百万円
― 45 ―
棚卸資産7,000百万円
建物及び構築物5,061百万円
土地6,303百万円
関係会社株式245百万円
計18,611百万円
1. 担保に供している資産及び担保に係る債務
(1) 担保に供している資産
長期借入金9,350百万円
計9,350百万円
(2) 担保に係る債務
2. 関係会社に対する短期金銭債権...........................................................................47,854百万円
関係会社に対する短期金銭債務...........................................................................23,778百万円
関係会社に対する長期金銭債務...........................................................................1,469百万円
3. 有形固定資産の減価償却累計額...........................................................................76,890百万円
4. 保証債務
関係会社の金融機関からの借入等に対する債務保証.............................................2,522百万円
5. 財務制限条項
当社は金融機関とシンジケートローン契約、タームローン契約及びコミットメントライン契約を締結し
ており、本契約には連結貸借対照表等により算出される一定の指標等を基準とする財務制限条項が付さ
れております。
6. その他
当社、当社の台湾子会社である台湾佳美工股份有限公司及び当社の香港子会社であるHong Kong
Chemi-Con Ltd.は、アルミ電解コンデンサの取引に関する台湾競争法違反に基づく制裁金を課す旨の
処分について、台湾公平交易委員会に対する行政処分取消訴訟を台湾で提起していました。今般、台北
高等行政裁判所主催の調停手続が実施され、当社と台湾公平交易委員会とは2026年1月13日、和解に
合意し、同日調停が成立しました。
これにより当社及び当社グループを当事者とする、アルミ電解コンデンサ等の取引に関する競争法違反
関連の訴訟は、本案件を含めて全て終結いたしました。
(貸借対照表に関する注記)
― 46 ―
売 上 高................................................................................................93,038百万円
仕 入 高................................................................................................89,513百万円
受 取 利 息................................................................................................215百万円
支 払 利 息................................................................................................155百万円
株式の種類当事業年度期首増加減少当事業年度末
普通株式40,535株1,412株-41,947株
退職給付引当金否認額.................................................................................914百万円
関係会社株式評価損....................................................................................1,143百万円
繰越欠損金................................................................................................11,663百万円
その他......................................................................................................775百万円
繰延税金資産小計.......................................................................................14,497百万円
繰越欠損金に係る評価性引当額.....................................................................△11,451百万円
将来減算一時差異等に係る評価性引当額.........................................................△1,334百万円
評価性引当額小計.......................................................................................△12,785百万円
繰延税金資産合計.......................................................................................1,711百万円
前払年金費用.............................................................................................922百万円
繰延税金負債合計.......................................................................................922百万円
差引:繰延税金資産純額....................................................................................788百万円
(損益計算書に関する注記)
1.関係会社との取引高
2.受取和解金
当社、当社の台湾子会社である台湾佳美工股份有限公司及び当社の香港子会社であるHong Kong
Chemi-Con Ltd.(以下「当社ら」といいます。)は、アルミ電解コンデンサの取引に関する台湾競争法
違反に基づく制裁金を課す旨の処分について、台湾公平交易委員会に対する行政処分取消訴訟を台湾で
提起していました。今般、台北高等行政裁判所主催の調停手続が実施され、当社と台湾公平交易委員会
とは2026年1月13日、和解に合意し、同日調停が成立しました。
同和解の結果、当社らは台湾公平交易委員会から合計3億4,573万新台湾ドルの返金を受けたことによ
り、当社は2026年3月期において特別利益として13億68百万円計上いたしました。
(株主資本等変動計算書に関する注記)
当事業年度末日における自己株式に関する事項
自己株式の増加は、単元未満株式の買取りによるものであります。
(税効果会計に関する注記)
繰延税金資産及び繰延税金負債の発生の主な原因別の内訳
繰延税金資産
繰延税金負債
― 47 ―
(子会社)(単位:百万円)
会 社 等 の 名 称
資本金又
は出資金
事 業 の 内 容
又 は 職 業
議決権等
の 所 有
割 合
(注1)
関 係 内 容
取 引 の 内 容取引金額科目期末残高
役 員 の
兼 任 等
事業上の関係
ケミコン東日本(株)
400
百万円
コンデンサの製
造販売
100%
兼任
1人
コンデンサ・
電極箔の仕入
製品仕入55,509買掛金5,725
材料支給等11,670未収入金1,575
受取利息68貸付金6,975
ーー立替金1,357
ケミコン東日本
マテリアル(株)
80
百万円
アルミ電解コン
デンサ用電極箔
の製造販売
100%
(100%)
兼任
1人
電極箔の支給
材料支給等11,479未収入金1,246
受取利息25貸付金2,412
ケミコンデバイス(株)
200
百万円
コンデンサ、電
子機器及び部品
の製造販売
100%
兼任
1人
コンデンサ・
電子機器及び
部品の仕入
受取利息15貸付金1,270
United Chemi-
Con, Inc.
US$
30,000
千
コンデンサの製
造販売
100%
(100%)
兼任
1人
コンデンサの
販売・仕入
製品販売6,754
売掛金1,577
原材料・設備販売318
製品仕入2,891買掛金314
材料支給等259未収入金76
Chemi-Con
Materials
Corporation
US$
60,000
千
アルミ電解コン
デンサ用電極箔
の製造販売
100%
(100%)
―電極箔の仕入
原材料・設備販売1,003売掛金441
製品仕入3,251買掛金2,379
支払利息136借入金3,277
Europe Chemi-Con
(Deutschland)
GmbH
EURO
2,045
千
コンデンサの販
売
100%
兼任
1人
コンデンサの
販売
製品販売11,637売掛金3,704
Singapore Chemi-
Con (Pte) Ltd.
S$
10,000
千
コンデンサの販
売
100%
兼任
1人
コンデンサの
販売
製品販売6,233売掛金1,481
P.T.Indonesia
Chemi-Con
US$
36,000
千
コンデンサの製
造販売
90.00%
(10.83%)
―
コンデンサの
販売・仕入
製品販売79
売掛金230
原材料・設備販売905
製品仕入14,044買掛金2,389
材料支給等2,476未収入金503
Chemi-Con (Malaysia)
Sdn. Bhd.
RM
60,000
千
コンデンサの製
造販売
100%―
コンデンサの
販売・仕入
製品仕入11,791買掛金1,085
材料支給等7,929未収入金2,146
受取利息101貸付金2,446
台湾佳美工股份
有限公司
NT$
600,000
千
コンデンサの製
造販売
100%―
コンデンサの
販売・仕入
製品販売4,819
売掛金1,797
原材料・設備販売1,196
材料支給等907未収入金288
貴弥功(無錫)
有限公司
US$
38,000
千
コンデンサの製
造販売
100%
(100%)
―
コンデンサの
販売・仕入
製品仕入16,762買掛金6,967
材料支給等7,284未収入金823
Hong Kong Chemi-Con
Ltd.
HK$
690,000
千
コンデンサの販
売
100%
兼任
1人
コンデンサの
販売
製品販売26,972売掛金7,434
債務保証2,443ーー
上海貴弥功貿易
有限公司
US$
3,000
千
コンデンサの販
売
100%
(100%)
兼任
1人
コンデンサの
販売
製品販売11,226売掛金1,932
Chemi-Con
Electronics
(Thailand) Co.,Ltd.
THB
100,000
千
コンデンサの販
売
100%
兼任
1人
コンデンサの
販売
製品販売10,605売掛金3,795
(関連当事者との取引に関する注記)
子会社及び関連会社
― 48 ―
(関連会社)(単位:百万円)
会 社 等 の 名 称
資本金又
は出資金
事 業 の 内 容
又 は 職 業
議決権等
の 所 有
割 合
(注1)
関 係 内 容
取 引 の 内 容取引金額科目期末残高
役 員 の
兼 任 等
事業上の関係
三瑩電子工業(株)
WON
10,000
百万
コンデンサ等
の製造販売
35.15%―
コンデンサ等
の販売・仕入
原材料等販売517売掛金39
製品仕入2,226買掛金229
材料支給等1,053未収入金90
1. 1株当たり純資産額.............................................................................................438円61銭
2. 1株当たり当期純利益..........................................................................................25円72銭
(注)1. 議決権等の所有割合欄の( )内は、間接所有割合を内数で示しております。
取引条件及び取引条件の決定方針等
1. 製品等の販売及び仕入については、市場価格、総原価を勘案し、毎期価格交渉の上、決定しております。
2. 資金の貸付及び借入については、市場金利等を勘案して利率を合理的に決定しております。
(1株当たり情報に関する注記)
(収益認識に関する注記)
顧客との契約から生じる収益を理解するための基礎となる情報は、「連結注記表(収益認識に関する注
記)」に記載しておりますので注記を省略しております。
(重要な後発事象に関する注記)
普通株式の発行
当社は、2026年5月11日付で当社が発行するB種種類株式の保有者であるジャパン・インダストリアル・ソ
リューションズ第参号投資事業有限責任組合より、その保有するB種種類株式の一部について普通株式を対価
とする取得請求権が行使され、普通株式を交付いたしました。
B種種類株式の普通株式への転換内容
①取得した株式の種類 B種種類株式
②取得請求権行使日 2026年5月11日
③行使されたB種種類株式の数 901株
④取得請求権の行使に伴い交付する普通株式の数 988,996株
⑤取得請求の効力発生後の発行済普通株式総数 25,687,446株
(その他の注記)
1. 退職給付関係
採用している退職給付制度の概要
当社は、確定給付型の制度である確定給付企業年金制度、退職一時金制度及び確定拠出型の退職給付制度
を設けております。なお、従業員の退職等に際して割増退職金を支払う場合があります。
― 49 ―
2. 第三者割当による種類株式の発行、資本金及び資本準備金の額の減少、並びにA種種類株式の取得及び消
却
当社は、2026年3月27日開催の取締役会において、株式会社日本政策投資銀行(以下「割当予定先」と
いいます。)との間で、株式投資契約を締結し、割当予定先に対して、第三者割当の方法により、総額
6,000,000,000円のC種種類株式及び3,000,000,000円のD種種類株式(以下「本種類株式」と総称し
ます。)を発行すること(以下「本第三者割当増資」といいます。)、本第三者割当増資の払込みがなさ
れることを条件に、2026年6月29日を効力発生日として、本第三者割当増資後の資本金及び資本準備金
の額を減少し、その他資本剰余金へ振り替えること(以下「本資本金等の額の減少」といいます。)、並
びにジャパン・インダストリアル・ソリューションズ第参号投資事業有限責任組合が保有するA種種類株
式につき、取得を行うこと、また当該取得を条件として消却を行うこと(以下、併せて「A種種類株式の
取得及び消却」といいます。)を決議いたしました。
詳細につきましては、「連結注記表 (その他の注記) 2. 第三者割当による種類株式の発行、資本金及
び資本準備金の額の減少、並びにA種種類株式の取得及び消却」に記載のとおりであります。
― 50 ―
独立監査人の監査報告書
2026年5月18日
日 本 ケ ミ コ ン 株 式 会 社
取 締 役 会 御 中
EY新日本有限責任監査法人
東 京 事 務 所
監査意見
当監査法人は、会社法第444条第4項の規定に基づき、日本ケミコン株式会社の2025年4月1日から2026年3月31日までの連結会計
年度の連結計算書類、すなわち、連結貸借対照表、連結損益計算書、連結株主資本等変動計算書及び連結注記表について監査を行った。
当監査法人は、上記の連結計算書類が、我が国において一般に公正妥当と認められる企業会計の基準に準拠して、日本ケミコン株式会
社及び連結子会社からなる企業集団の当該連結計算書類に係る期間の財産及び損益の状況を、全ての重要な点において適正に表示してい
るものと認める。
監査意見の根拠
当監査法人は、我が国において一般に公正妥当と認められる監査の基準に準拠して監査を行った。監査の基準における当監査法人の責
任は、「連結計算書類の監査における監査人の責任」に記載されている。当監査法人は、我が国における職業倫理に関する規定(社会的
影響度の高い事業体の財務諸表監査に適用される規定を含む。)に従って、会社及び連結子会社から独立しており、また、監査人として
のその他の倫理上の責任を果たしている。当監査法人は、意見表明の基礎となる十分かつ適切な監査証拠を入手したと判断している。
その他の記載内容
その他の記載内容は、事業報告及びその附属明細書である。経営者の責任は、その他の記載内容を作成し開示することにある。また、
監査役及び監査役会の責任は、その他の記載内容の報告プロセスの整備及び運用における取締役の職務の執行を監視することにある。
当監査法人の連結計算書類に対する監査意見の対象にはその他の記載内容は含まれておらず、当監査法人はその他の記載内容に対して
意見を表明するものではない。
連結計算書類の監査における当監査法人の責任は、その他の記載内容を通読し、通読の過程において、その他の記載内容と連結計算書
類又は当監査法人が監査の過程で得た知識との間に重要な相違があるかどうか検討すること、また、そのような重要な相違以外にその他
の記載内容に重要な誤りの兆候があるかどうか注意を払うことにある。
当監査法人は、実施した作業に基づき、その他の記載内容に重要な誤りがあると判断した場合には、その事実を報告することが求めら
れている。
その他の記載内容に関して、当監査法人が報告すべき事項はない。
連結計算書類に対する経営者並びに監査役及び監査役会の責任
経営者の責任は、我が国において一般に公正妥当と認められる企業会計の基準に準拠して連結計算書類を作成し適正に表示することに
ある。これには、不正又は誤謬による重要な虚偽表示のない連結計算書類を作成し適正に表示するために経営者が必要と判断した内部統
制を整備及び運用することが含まれる。
連結計算書類に係る会計監査人の監査報告書謄本
― 51 ―
連結計算書類を作成するに当たり、経営者は、継続企業の前提に基づき連結計算書類を作成することが適切であるかどうかを評価し、
我が国において一般に公正妥当と認められる企業会計の基準に基づいて継続企業に関する事項を開示する必要がある場合には当該事項を
開示する責任がある。
監査役及び監査役会の責任は、財務報告プロセスの整備及び運用における取締役の職務の執行を監視することにある。
連結計算書類の監査における監査人の責任
監査人の責任は、監査人が実施した監査に基づいて、全体としての連結計算書類に不正又は誤謬による重要な虚偽表示がないかどうか
について合理的な保証を得て、監査報告書において独立の立場から連結計算書類に対する意見を表明することにある。虚偽表示は、不正
又は誤謬により発生する可能性があり、個別に又は集計すると、連結計算書類の利用者の意思決定に影響を与えると合理的に見込まれる
場合に、重要性があると判断される。
監査人は、我が国において一般に公正妥当と認められる監査の基準に従って、監査の過程を通じて、職業的専門家としての判断を行
い、職業的懐疑心を保持して以下を実施する。
・ 不正又は誤謬による重要な虚偽表示リスクを識別し、評価する。また、重要な虚偽表示リスクに対応した監査手続を立案し、実施す
る。監査手続の選択及び適用は監査人の判断による。さらに、意見表明の基礎となる十分かつ適切な監査証拠を入手する。
・ 連結計算書類の監査の目的は、内部統制の有効性について意見表明するためのものではないが、監査人は、リスク評価の実施に際し
て、状況に応じた適切な監査手続を立案するために、監査に関連する内部統制を検討する。
・ 経営者が採用した会計方針及びその適用方法の適切性、並びに経営者によって行われた会計上の見積りの合理性及び関連する注記事
項の妥当性を評価する。
・ 経営者が継続企業を前提として連結計算書類を作成することが適切であるかどうか、また、入手した監査証拠に基づき、継続企業の
前提に重要な疑義を生じさせるような事象又は状況に関して重要な不確実性が認められるかどうか結論付ける。継続企業の前提に関す
る重要な不確実性が認められる場合は、監査報告書において連結計算書類の注記事項に注意を喚起すること、又は重要な不確実性に関
する連結計算書類の注記事項が適切でない場合は、連結計算書類に対して除外事項付意見を表明することが求められている。監査人の
結論は、監査報告書日までに入手した監査証拠に基づいているが、将来の事象や状況により、企業は継続企業として存続できなくなる
可能性がある。
・ 連結計算書類の表示及び注記事項が、我が国において一般に公正妥当と認められる企業会計の基準に準拠しているかどうかととも
に、関連する注記事項を含めた連結計算書類の表示、構成及び内容、並びに連結計算書類が基礎となる取引や会計事象を適正に表示し
ているかどうかを評価する。
・ 連結計算書類に対する意見表明の基礎となる、会社及び連結子会社の財務情報に関する十分かつ適切な監査証拠を入手するために、
連結計算書類の監査を計画し実施する。監査人は、連結計算書類の監査に関する指揮、監督及び査閲に関して責任がある。監査人は、
単独で監査意見に対して責任を負う。
監査人は、監査役及び監査役会に対して、計画した監査の範囲とその実施時期、監査の実施過程で識別した内部統制の重要な不備を含
む監査上の重要な発見事項、及び監査の基準で求められているその他の事項について報告を行う。
監査人は、監査役及び監査役会に対して、独立性についての我が国における職業倫理に関する規定を遵守したこと、並びに監査人の独
立性に影響を与えると合理的に考えられる事項、及び阻害要因を除去するための対応策を講じている場合又は阻害要因を許容可能な水準
にまで軽減するためのセーフガードを適用している場合はその内容について報告を行う。
利害関係
会社及び連結子会社と当監査法人又は業務執行社員との間には、公認会計士法の規定により記載すべき利害関係はない。
以 上
― 52 ―
独立監査人の監査報告書
2026年5月18日
日 本 ケ ミ コ ン 株 式 会 社
取 締 役 会 御 中
EY新日本有限責任監査法人
東 京 事 務 所
監査意見
当監査法人は、会社法第436条第2項第1号の規定に基づき、日本ケミコン株式会社の2025年4月1日から2026年3月31日までの第
79期事業年度の計算書類、すなわち、貸借対照表、損益計算書、株主資本等変動計算書及び個別注記表並びにその附属明細書(以下「計
算書類等」という。)について監査を行った。
当監査法人は、上記の計算書類等が、我が国において一般に公正妥当と認められる企業会計の基準に準拠して、当該計算書類等に係る
期間の財産及び損益の状況を、全ての重要な点において適正に表示しているものと認める。
監査意見の根拠
当監査法人は、我が国において一般に公正妥当と認められる監査の基準に準拠して監査を行った。監査の基準における当監査法人の責
任は、「計算書類等の監査における監査人の責任」に記載されている。当監査法人は、我が国における職業倫理に関する規定(社会的影
響度の高い事業体の財務諸表監査に適用される規定を含む。)に従って、会社から独立しており、また、監査人としてのその他の倫理上
の責任を果たしている。当監査法人は、意見表明の基礎となる十分かつ適切な監査証拠を入手したと判断している。
その他の記載内容
その他の記載内容は、事業報告及びその附属明細書である。経営者の責任は、その他の記載内容を作成し開示することにある。また、
監査役及び監査役会の責任は、その他の記載内容の報告プロセスの整備及び運用における取締役の職務の執行を監視することにある。
当監査法人の計算書類等に対する監査意見の対象にはその他の記載内容は含まれておらず、当監査法人はその他の記載内容に対して意
見を表明するものではない。
計算書類等の監査における当監査法人の責任は、その他の記載内容を通読し、通読の過程において、その他の記載内容と計算書類等又
は当監査法人が監査の過程で得た知識との間に重要な相違があるかどうか検討すること、また、そのような重要な相違以外にその他の記
載内容に重要な誤りの兆候があるかどうか注意を払うことにある。
当監査法人は、実施した作業に基づき、その他の記載内容に重要な誤りがあると判断した場合には、その事実を報告することが求めら
れている。
その他の記載内容に関して、当監査法人が報告すべき事項はない。
計算書類等に対する経営者並びに監査役及び監査役会の責任
経営者の責任は、我が国において一般に公正妥当と認められる企業会計の基準に準拠して計算書類等を作成し適正に表示することにあ
る。 これには、不正又は誤謬による重要な虚偽表示のない計算書類等を作成し適正に表示するために経営者が必要と判断した内部統制を
整備及び運用することが含まれる。
会計監査人の監査報告書謄本
― 53 ―
計算書類等を作成するに当たり、経営者は、継続企業の前提に基づき計算書類等を作成することが適切であるかどうかを評価し、我が
国において一般に公正妥当と認められる企業会計の基準に基づいて継続企業に関する事項を開示する必要がある場合には当該事項を開示
する責任がある。
監査役及び監査役会の責任は、財務報告プロセスの整備及び運用における取締役の職務の執行を監視することにある。
計算書類等の監査における監査人の責任
監査人の責任は、監査人が実施した監査に基づいて、全体としての計算書類等に不正又は誤謬による重要な虚偽表示がないかどうかに
ついて合理的な保証を得て、監査報告書において独立の立場から計算書類等に対する意見を表明することにある。虚偽表示は、不正又は
誤謬により発生する可能性があり、個別に又は集計すると、計算書類等の利用者の意思決定に影響を与えると合理的に見込まれる場合
に、重要性があると判断される。
監査人は、我が国において一般に公正妥当と認められる監査の基準に従って、監査の過程を通じて、職業的専門家としての判断を行
い、職業的懐疑心を保持して以下を実施する。
・ 不正又は誤謬による重要な虚偽表示リスクを識別し、評価する。また、重要な虚偽表示リスクに対応した監査手続を立案し、実施す
る。監査手続の選択及び適用は監査人の判断による。さらに、意見表明の基礎となる十分かつ適切な監査証拠を入手する。
・ 計算書類等の監査の目的は、内部統制の有効性について意見表明するためのものではないが、監査人は、リスク評価の実施に際し
て、状況に応じた適切な監査手続を立案するために、監査に関連する内部統制を検討する。
・ 経営者が採用した会計方針及びその適用方法の適切性、並びに経営者によって行われた会計上の見積りの合理性及び関連する注記事
項の妥当性を評価する。
・ 経営者が継続企業を前提として計算書類等を作成することが適切であるかどうか、また、入手した監査証拠に基づき、継続企業の前
提に重要な疑義を生じさせるような事象又は状況に関して重要な不確実性が認められるかどうか結論付ける。継続企業の前提に関する
重要な不確実性が認められる場合は、監査報告書において計算書類等の注記事項に注意を喚起すること、又は重要な不確実性に関する
計算書類等の注記事項が適切でない場合は、計算書類等に対して除外事項付意見を表明することが求められている。監査人の結論は、
監査報告書日までに入手した監査証拠に基づいているが、将来の事象や状況により、企業は継続企業として存続できなくなる可能性が
ある。
・ 計算書類等の表示及び注記事項が、我が国において一般に公正妥当と認められる企業会計の基準に準拠しているかどうかとともに、
関連する注記事項を含めた計算書類等の表示、構成及び内容、並びに計算書類等が基礎となる取引や会計事象を適正に表示しているか
どうかを評価する。
監査人は、監査役及び監査役会に対して、計画した監査の範囲とその実施時期、監査の実施過程で識別した内部統制の重要な不備を含
む監査上の重要な発見事項、及び監査の基準で求められているその他の事項について報告を行う。
監査人は、監査役及び監査役会に対して、独立性についての我が国における職業倫理に関する規定を遵守したこと、並びに監査人の独
立性に影響を与えると合理的に考えられる事項、及び阻害要因を除去するための対応策を講じている場合又は阻害要因を許容可能な水準
にまで軽減するためのセーフガードを適用している場合はその内容について報告を行う。
利害関係
会社と当監査法人又は業務執行社員との間には、公認会計士法の規定により記載すべき利害関係はない。
以 上
― 54 ―
監 査 報 告 書
当監査役会は、2025年4月1日から2026年3月31日までの第79期事業年度における取締役の職務の執行に関
して、各監査役が作成した監査報告書に基づき、審議の上、本監査報告書を作成し、以下のとおり報告いたしま
す。
1. 監査役及び監査役会の監査の方法及びその内容
(1) 監査役会は、監査の方針、職務の分担等を定め、各監査役から監査の実施状況及び結果について報告を受け
るほか、取締役等及び会計監査人からその職務の執行状況について報告を受け、必要に応じて説明を求めまし
た。
(2) 各監査役は、監査役会が定めた監査役監査の基準に準拠し、監査の方針、職務の分担等に従い、取締役、内
部監査部門その他の使用人等と意思疎通を図り、情報の収集及び監査の環境の整備に努めるとともに、以下の
方法で監査を実施いたしました。
① 取締役会その他重要な会議に出席し、取締役及び使用人等からその職務の執行状況について報告を受け、
必要に応じて説明を求め、重要な決裁書類等を閲覧し、本社及び主要な事業所において業務及び財産の状
況を調査いたしました。また、子会社については、子会社の取締役及び監査役等と意思疎通及び情報の交
換を図り、必要に応じて子会社から事業の報告を受けました。
② 事業報告に記載されている取締役の職務の執行が法令及び定款に適合することを確保するための体制その
他株式会社及びその子会社から成る企業集団の業務の適正を確保するために必要なものとして会社法施行
規則第100条第1項及び第3項に定める体制の整備に関する取締役会決議の内容及び当該決議に基づき整
備されている体制(内部統制システム)について、取締役及び使用人等からその構築及び運用の状況につ
いて定期的に報告を受け、必要に応じて説明を求め、意見を表明いたしました。
③ 事業報告に記載されている会社の財務及び事業の方針の決定を支配する者の在り方に関する基本方針につ
いては、取締役会その他における審議の状況等を踏まえ、その内容について検討を加えました。
④ 会計監査人が独立の立場を保持し、かつ、適正な監査を実施しているかを監視及び検証するとともに、会
計監査人からその職務の執行状況について報告を受け、必要に応じて説明を求めました。また、会計監査
人から「職務の遂行が適正に行われることを確保するための体制」(会社計算規則第131条各号に掲げる
事項)を「監査に関する品質管理基準」(企業会計審議会)等に従って整備している旨の通知を受け、必
要に応じて説明を求めました。
以上の方法に基づき、当該事業年度に係る事業報告及びその附属明細書、計算書類(貸借対照表、損益計
算書、株主資本等変動計算書及び個別注記表)及びその附属明細書並びに連結計算書類(連結貸借対照表、
連結損益計算書、連結株主資本等変動計算書及び連結注記表)について検討いたしました。
監査役会の監査報告書謄本
― 55 ―
常勤監査役
堀 野 俊 一
㊞
常勤監査役
市 原 博 和
㊞
監 査 役
土 居 正 明
㊞
監 査 役
小 川 薫
㊞
日本ケミコン株式会社 監査役会
― 56 ―
<メ モ 欄>


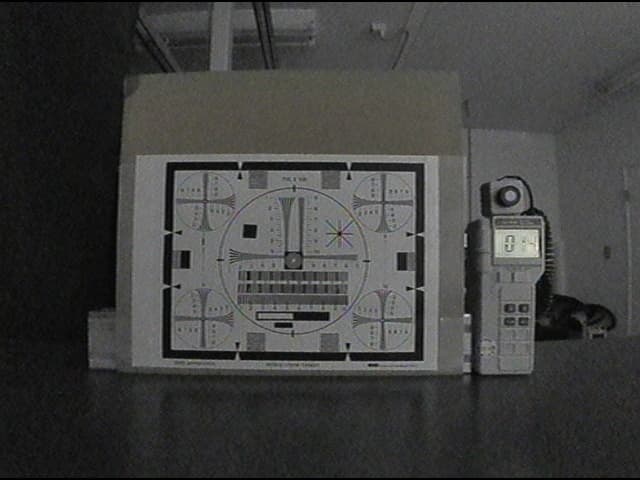
 NCM12-FF(NTSC出力) (0.2lx時) 当社既存カメラ(0.2lx時)