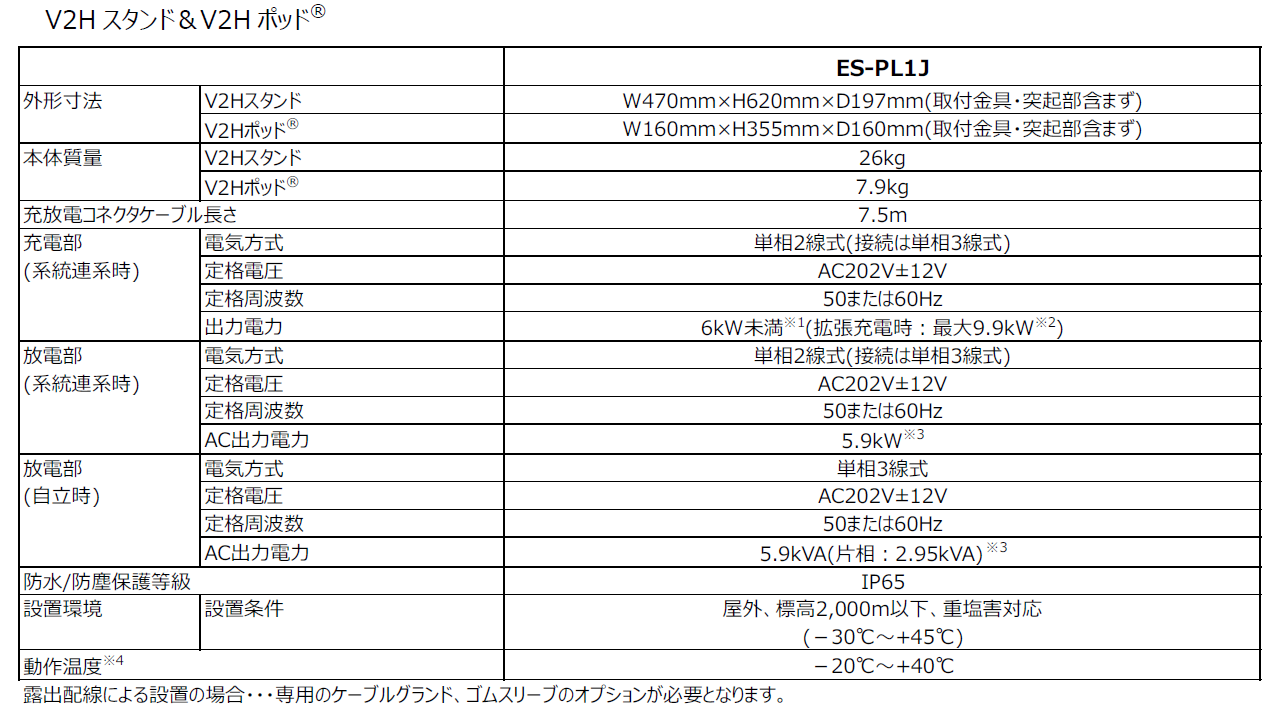
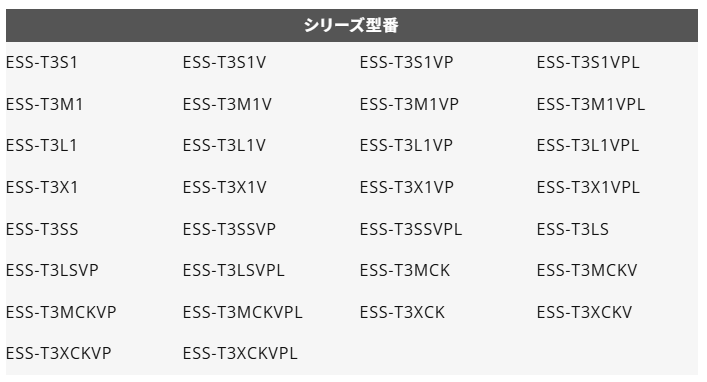
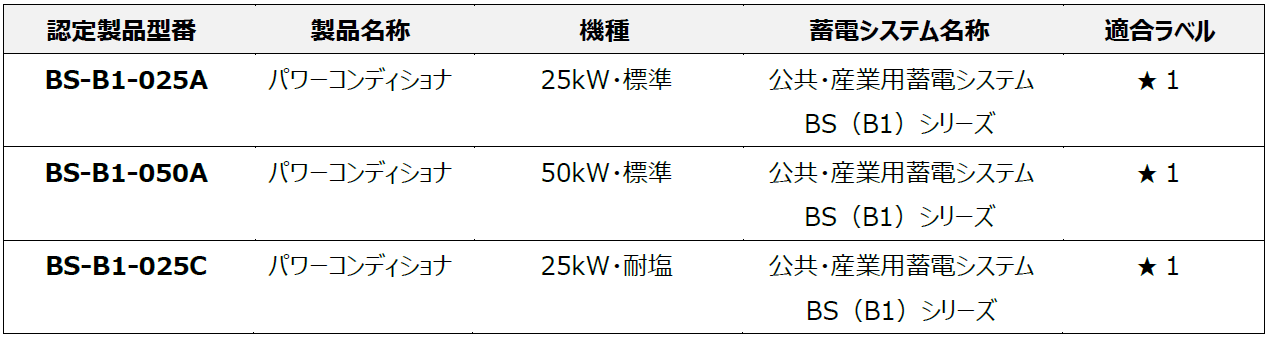
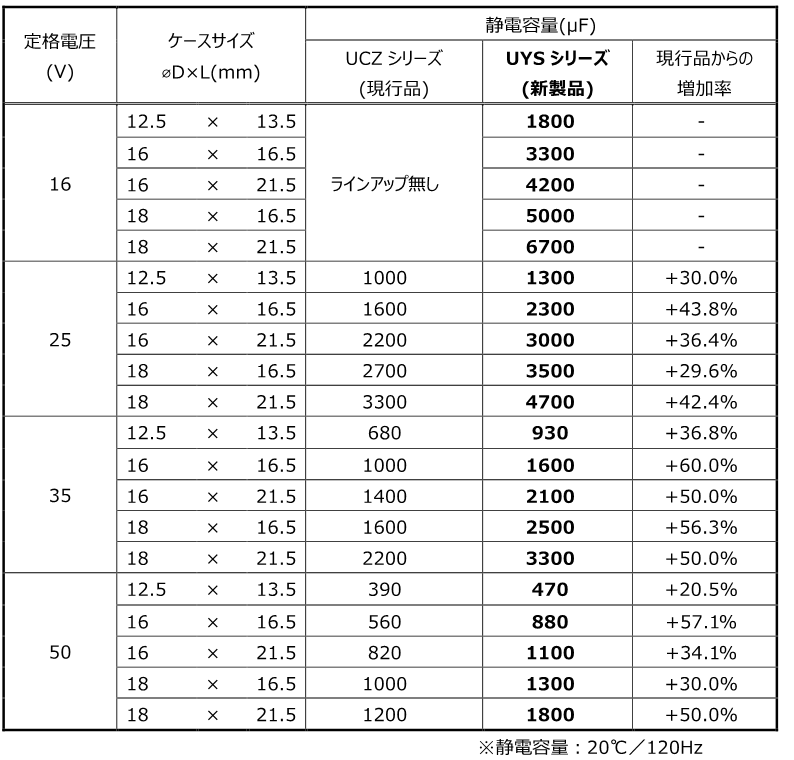
EDINET提出書類 ニチコン株式会社(E01904) 有価証券報告書 【表紙】 【提出書類】 有価証券報告書 【根拠条文】 金融商品取引法第24条第1項 【提出先】 関東財務局長 【提出日】 2026年6月26日 【事業年度】 第91期(自 【会社名】 ニチコン株式会社 【英訳名】…
EDINET提出書類
ニチコン株式会社(E01904)
有価証券報告書
【表紙】
【提出書類】
有価証券報告書
【根拠条文】
金融商品取引法第24条第1項
【提出先】
関東財務局長
【提出日】
2026年6月26日
【事業年度】
第91期(自
【会社名】
ニチコン株式会社
【英訳名】
NICHICON CORPORATION
【代表者の役職氏名】
代表取締役社長
【本店の所在の場所】
京都市中京区烏丸通御池上る二条殿町551番地
【電話番号】
(075)231−8461(代表)
【事務連絡者氏名】
執行役員経理副本部長
【最寄りの連絡場所】
京都市中京区烏丸通御池上る二条殿町551番地
【電話番号】
(075)231−8461(代表)
【事務連絡者氏名】
執行役員経理副本部長
【縦覧に供する場所】
株式会社東京証券取引所
(東京都中央区日本橋兜町2番1号)
2025年4月1日
森
1/110
至
2026年3月31日)
克彦
石見
石見
真士
真士
EDINET提出書類
ニチコン株式会社(E01904)
有価証券報告書
第一部【企業情報】
第1【企業の概況】
1【主要な経営指標等の推移】
(1)連結経営指標等
回次
第87期
第88期
第89期
第90期
第91期
決算年月
2022年3月
2023年3月
2024年3月
2025年3月
2026年3月
売上高
百万円
142,198
184,725
181,643
175,751
169,724
経常利益
百万円
8,594
15,263
11,407
7,511
8,326
親会社株主に帰属する当期純
百万円
利益
7,902
7,814
8,253
5,877
6,310
包括利益
百万円
7,210
8,702
14,767
4,040
12,335
純資産額
百万円
94,652
101,354
113,839
113,814
123,517
総資産額
百万円
170,112
192,339
206,937
192,582
195,570
1株当たり純資産額
円
1,350.76
1,444.66
1,620.98
1,644.33
1,780.91
1株当たり当期純利益
円
115.50
114.22
120.64
86.04
93.97
潜在株式調整後1株当たり当
期純利益
円
104.39
103.21
108.98
−
−
自己資本比率
%
54.3
51.4
53.6
57.3
61.2
自己資本利益率
%
8.8
8.2
7.9
5.3
5.5
株価収益率
倍
10.2
12.1
10.7
14.2
18.3
営業活動によるキャッシュ・
百万円
フロー
5,264
9,186
16,321
18,346
8,163
投資活動によるキャッシュ・
百万円
フロー
△5,974
△8,121
△12,734
△8,361
△6,556
財務活動によるキャッシュ・
百万円
フロー
△2,303
5,435
△571
△14,319
△3,844
現金及び現金同等物の期末残
百万円
高
17,799
25,068
29,387
25,519
24,441
従業員数
5,587
5,408
5,394
5,242
4,982
人
(注)第90期および第91期の潜在株式調整後1株当たり当期純利益については、潜在株式が存在しないため記載し
ていません。
2/110
EDINET提出書類
ニチコン株式会社(E01904)
有価証券報告書
(2)提出会社の経営指標等
回次
第87期
第88期
第89期
第90期
第91期
決算年月
2022年3月
2023年3月
2024年3月
2025年3月
2026年3月
売上高
百万円
112,689
142,216
144,716
140,670
134,719
経常利益
百万円
6,020
12,461
11,980
8,741
7,409
当期純利益
百万円
6,481
6,148
11,777
10,269
5,502
資本金
百万円
14,286
14,286
14,286
14,286
14,286
千株
78,000
78,000
78,000
70,000
70,000
純資産額
百万円
59,952
62,115
74,394
77,116
83,012
総資産額
百万円
118,347
130,273
141,530
140,845
141,302
円
876.28
907.90
1,087.39
1,148.27
1,236.07
27.0
30.0
33.0
35.0
37.0
(13.0)
(14.0)
(16.0)
(17.0)
(18.0)
発行済株式総数
1株当たり純資産額
1株当たり配当額
円
(内1株当たり中間配当額)
1株当たり当期純利益
円
94.73
89.87
172.15
150.34
81.93
潜在株式調整後1株当たり当
期純利益
円
85.59
81.16
155.60
−
−
自己資本比率
%
50.7
47.7
52.6
54.8
58.7
自己資本利益率
%
10.8
10.1
17.3
13.6
6.9
株価収益率
倍
12.4
15.4
7.5
8.1
20.9
配当性向
%
28.5
33.4
19.2
23.3
45.2
従業員数
人
522
538
581
585
623
株主総利回り
%
107.2
128.2
122.7
120.3
167.4
(比較指標:TOPIX)
%
(99.6)
(102.5)
(141.7)
(136.1)
(179.0)
最高株価
円
1,335
1,562
1,549
1,387
2,237
最低株価
円
987
1,039
1,179
877
978
(注)1.2025年2月6日開催の取締役会決議に基づき、自己株式8,000,000株を消却したことにより、第90期の発行
済株式総数は8,000,000株減少しています。
2.第90期および第91期の潜在株式調整後1株当たり当期純利益については、潜在株式が存在しないため記載し
ていません。
3.最高株価および最低株価は、2022年4月4日より東京証券取引所プライム市場におけるものであり、それ以
前については東京証券取引所市場第一部です。
3/110
EDINET提出書類
ニチコン株式会社(E01904)
有価証券報告書
2【沿革】
年月
沿革
1950年8月
1951年12月
1956年7月
1957年4月
1960年10月
資本金3,000千円をもって㈱関西二井製作所を設立し、本社を大阪市に設置
本社を京都市に移転
京都工場を新設し、アルミニウム電解コンデンサの製造を開始
営業部門を分離し、関西二井販売㈱を設立
京都府亀岡市に亀岡工場(現 ニチコン亀岡㈱)を新設操業開始(現・連結子会社)
1961年4月
1961年6月
商号を日本コンデンサ工業㈱に変更(同時に関係会社関西二井販売㈱もニチコン販売㈱に商号変更)
滋賀県草津市に草津工場(現 ニチコン草津㈱)を新設操業開始(現・連結子会社)
1961年10月
1962年4月
1962年6月
東京・大阪証券取引所市場第二部および京都証券取引所に株式を上場
本社を京都市中京区に移転
長野県南安曇郡豊科町(現安曇野市豊科)に長野工場(現 ニチコン大野㈱長野工場)を新設操業開始
1962年9月
1966年8月
1968年10月
名古屋証券取引所市場第二部に株式を上場
東京・大阪・名古屋証券取引所において市場第一部へ指定替え
福井県遠敷郡上中町(現三方上中郡若狭町)にワカサ電機㈱(現 ニチコンワカサ㈱)を設立
1969年7月
(現・連結子会社)
福井県大野市に大野工場(現 ニチコン大野㈱)を新設操業開始(現・連結子会社)
1969年8月
1969年8月
岩手県紫波郡紫波町に岩手工場を新設操業開始
台湾に現地資本との合弁会社タイワン キャパシタ リミテッド(現 タイコン コーポレーション)を設
1970年9月
立(現・持分法適用関連会社)
米国スプラーグ エレクトリック カンパニーとの共同出資により滋賀県高島郡(現高島市)安曇川町
1970年9月
にニチコンスプラーグ㈱を設立
米国シカゴにニチコン(アメリカ)コーポレーションを設立(現・連結子会社)
1972年5月
1973年12月
1978年9月
香港に現地法人ニチコン(香港)リミテッドを設立(現・連結子会社)
大韓民国に現地資本との合弁会社三和電機㈱を設立(現・持分法適用関連会社)
シンガポールにニチコン(シンガポール)プライベート リミテッドを設立(現・連結子会社)
1981年2月
1987年10月
岩手県岩手郡岩手町にニチコン岩手㈱を設立(現・連結子会社)
国内販売会社 ニチコン販売㈱を吸収合併すると共に商号をニチコン㈱に変更
(英文名 NICHICON CORPORATION)
1990年1月
1990年3月
英国ロンドンにニチコン(ヨーロッパ)リミテッドを設立
マレーシアにニチコン(マレーシア)センディリアン バハッドを設立(現・連結子会社)
1991年7月
1999年7月
ニチコンスプラーグ㈱をニチコンタンタル㈱に商号変更
長野県大町市に大町工場(現 ニチコン製箔㈱大町工場)を、福井県大野市に富田工場(現 ニチコン製
2000年2月
箔㈱富田工場)を新設操業開始(現・連結子会社)
福井県大野市にニチコン福井㈱(現 ニチコン大野㈱福井工場)を設立
2000年3月
台湾にニチコン(台湾)カンパニー リミテッドを設立(現・連結子会社)
2000年4月
2001年2月
滋賀県草津市にニチコン滋賀㈱を設立
タイにニチコン(タイランド)カンパニー リミテッドを設立(現・連結子会社)
2001年12月
2001年12月
オーストリアにニチコン(オーストリア)ゲー・エム・ベー・ハーを設立(現・連結子会社)
中国無錫市にニチコン エレクトロニクス(無錫)カンパニー リミテッドを設立(現・連結子会社)
2002年6月
中国上海市にニチコン エレクトロニクス トレーディング(上海)カンパニー リミテッドを設立
2002年12月
(現・連結子会社)
ワカサ電機㈱(現 ニチコンワカサ㈱)上中工場を閉鎖し、小浜工場(福井県小浜市)に集約
2003年4月
2003年10月
2003年10月
2004年7月
亀岡工場(京都府亀岡市)を分社化し、ニチコン亀岡㈱を設立(現・連結子会社)
草津工場(滋賀県草津市)を分社化し、ニチコン草津㈱を設立(現・連結子会社)
諏訪工場(長野県諏訪市)を閉鎖
中国天津市にニチコン エレクトロニクス(天津)カンパニー リミテッドを設立
2004年11月
2005年4月
2006年3月
2008年8月
京都市中京区に本社新社屋を建設
大野工場(福井県大野市)を分社化し、ニチコン大野㈱を設立(現・連結子会社)
ニチコン(ヨーロッパ)リミテッドを清算
中国深圳市にニチコン エレクトロニクス トレーディング(深圳)カンパニー リミテッドを設立
2008年8月
(現・連結子会社)
ニチコン滋賀㈱が、ニチコンタンタル㈱を存続会社とする吸収合併により解散
4/110
EDINET提出書類
ニチコン株式会社(E01904)
有価証券報告書
年月
沿革
2009年1月
2009年4月
ニチコン朝日㈱が、ニチコン岩手㈱(現・連結子会社)を存続会社とする吸収合併により解散
富士通メディアデバイス㈱と締結した事業譲渡契約に基づき、中国蘇州市のエフピーキャップ エレクト
ロニクス(蘇州)カンパニー リミテッドが導電性高分子アルミ固体電解コンデンサの生産を開始
2009年7月
中国無錫市に無錫ニチコン エレクトロニクス R&Dセンター カンパニー リミテッドを設立
2011年2月
中国宿遷市にニチコン エレクトロニクス(宿遷)カンパニー リミテッドを設立(現・連結子会社)
2012年2月
2012年4月
ニチコン福井㈱が、ニチコン大野㈱(現・連結子会社)を存続会社とする吸収合併により解散
インド カルナータカ州にニチコン エレクトロニクス(インディア)プライベート リミテッドを設立
2012年10月
2012年10月
2013年2月
大町工場(長野県大町市)、富田工場(福井県大野市)および穂高工場(長野県安曇野市)を分社化
し、ニチコン製箔㈱を設立(現・連結子会社)
長野工場(長野県安曇野市)を分社化し、ニチコン長野㈱を設立
AVX Corporationとのタンタル固体電解コンデンサ事業の譲渡契約に基づき、事業譲渡が完了
2013年8月
2015年6月
2016年5月
ニチコン長野㈱を清算(同社事業はニチコン大野㈱に統合)
㈱ユタカ電機製作所の事業を譲り受け(現・連結子会社)
エフピーキャップ エレクトロニクス(蘇州)カンパニー リミテッドを清算
2017年4月
2019年12月
2020年11月
2022年4月
株式会社村田製作所との電源事業の譲り受けに関する意向確認書締結
2024年満期ユーロ円建取得条項付転換社債型新株予約権付社債(発行総額120億円)を発行
革新的技術開発等による温室効果ガス排出削減と災害対策における社会貢献活動が評価され、「令和2
年度気候変動アクション環境大臣表彰」を受賞
東京証券取引所の市場区分の見直しに伴いプライム市場へ移行
2022年5月
「気候関連財務情報開示タスクフォース(TCFD)」の提言に賛同
2022年9月
グリーンファイナンス(総額100億円)による資金調達を実施
2023年7月
ニチコン岩手㈱管理棟が竣工
2023年12月
ニチコン亀岡㈱生産棟「ES1」が竣工
2025年10月
ニチコン草津㈱安曇川工場(滋賀県高島市)稼働開始
2026年2月
ニチコン草津㈱安曇川工場の一部を貸与し、京都フュージョニアリング㈱の研究開発拠点の開設に協
2026年4月
力
無錫ニチコン エレクトロニクス R&Dセンター カンパニー リミテッドを清算
5/110
EDINET提出書類
ニチコン株式会社(E01904)
有価証券報告書
3【事業の内容】
当社グループ(当社および当社の関係会社)は、当社(ニチコン㈱)、子会社25社および関連会社3社により構成
されており、その主な事業内容と、主要な会社の当社グループの事業に係る位置付けおよびセグメントとの関連は、
次のとおりです。
なお次の2部門は、「第5 経理の状況 1 連結財務諸表等 (1)連結財務諸表注記事項(セグメント情報
等)」に掲げるセグメントの区分と同一です。
(コンデンサ事業)
当事業では、主にアルミ電解コンデンサ、小形リチウムイオン二次電池、パワーエレクトロニクス用フィルムコン
デンサおよびxEV用フィルムコンデンサ、変圧器の製造販売等を行っています。
(NECST事業)
当事業では、主に家庭用蓄電システム、V2Hシステム、EV・PHEV用急速充電器、スイッチング電源、機能モジュー
ル、公共・産業用蓄電システム、大形特殊電源および医療用/学術用加速器電源、圧力センサの製造販売等を行って
います。
セグメント
コンデンサ
事業
主要な製品
アルミ電解コンデンサ
小形リチウムイオン二次電池
パワーエレクトロニクス用フィ
ルムコンデンサ
xEV用フィルムコンデンサ
変圧器
主要な生産会社
ニチコン製箔㈱
ニチコン大野㈱
ニチコン岩手㈱
ニチコン草津㈱
㈱酉島電機製作所
ニチコン(マレーシア)セン
ディリアン バハッド
ニチコン エレクトロニクス
(無錫)カンパニー リミテッ
ド
ニチコン エレクトロニクス
(宿遷)カンパニー リミテッ
ド
NECST事業
家庭用蓄電システム
V2Hシステム
EV・PHEV用急速充電器
スイッチング電源
機能モジュール
公共・産業用蓄電システム
大型特殊電源
医療用/学術用加速器電源
圧力センサ
ニチコン草津㈱
ニチコン亀岡㈱
ニチコンワカサ㈱
㈱ユタカ電機製作所
日本リニアックス㈱
ニチコン(香港)リミテッド
ニチコン(マレーシア)セン
ディリアン バハッド
ニチコン エレクトロニクス
(無錫)カンパニー リミテッ
ド
6/110
主要な販売会社
当社
ニチコン(アメリカ)コーポレー
ション
ニチコン(オーストリア)
ゲー・エム・ベー・ハー
ニチコン(香港)リミテッド
ニチコン(シンガポール)プラ
イベート リミテッド
ニチコン(台湾)カンパニー
リミテッド
ニチコン(タイランド)カンパ
ニー リミテッド
ニチコン エレクトロニクス ト
レーディング(上海)カンパ
ニー リミテッド
ニチコン(マレーシア)セン
ディリアン バハッド
ニチコン エレクトロニクス
(無錫)カンパニー リミテッ
ド
EDINET提出書類
ニチコン株式会社(E01904)
有価証券報告書
主要な事業系統図は、次のとおりです。
※無錫ニチコン エレクトロニクス R&Dセンター カンパニー リミテッドは、2026年4月20日付で清算が結了して
います。
7/110
EDINET提出書類
ニチコン株式会社(E01904)
有価証券報告書
4【関係会社の状況】
名称
住所
資本金
主要な事業の内容
議決権の所
有割合
(%)
関係内容
(連結子会社)
ニチコン製箔株式会社
ニチコン草津株式会社
(注)2
ニチコン亀岡株式会社
長野県
大町市
(コンデンサ事業)
百万円
コンデンサ用電極箔
80
の製造
滋賀県
草津市
(コンデンサ事業)
パワーエレクトロニ
クス用フィルムコン
デンサおよびxEV用
百万円
フィルムコンデンサ
80
の製造
(NECST事業)
大型特殊電源および
医療用/学術用加速器
電源の製造
京都府
亀岡市
(NECST事業)
V2Hシステム、EV・
百万円
PHEV用急速充電器、
80
機能モジュール、家
100
当社製品の製造等
役員の兼任あり
土地建物の貸与
資金の貸付
100
当社製品の製造等
役員の兼任あり
土地建物等の貸与
資金の貸付
100
庭用蓄電システムお
よびPTCの製造
ニチコン大野株式会社
(注)2
福井県
大野市
(コンデンサ事業)
アルミ電解コンデン
百万円
サおよび小形リチウ
80
ムイオン二次電池の
製造
ニチコン岩手株式会社
(注)2
岩手県
岩手郡
百万円
100
ニチコンワカサ株式会社
当社製品の製造等
役員の兼任あり
土地建物等の貸与
資金の貸付
100
当社製品の製造等
役員の兼任あり
土地建物等の貸与
資金の貸付
(コンデンサ事業)
アルミ電解コンデン
サの製造
100
当社製品の製造等
役員の兼任あり
土地建物等の貸与
資金の貸付
福井県
小浜市
(NECST事業)
百万円
家庭用蓄電システム
84
およびスイッチング
電源の製造
100
当社製品の製造等
役員の兼任あり
株式会社酉島電機製作所
滋賀県
草津市
百万円 (コンデンサ事業)
30
変圧器の製造販売
100
(5.9)
当社製品の製造等
役員の兼任あり
土地建物等の貸与
日本リニアックス株式会社
大阪府
高槻市
百万円
15
(NECST事業)
圧力センサの製造販
売
100
(60.3)
土地建物等の貸与
株式会社ユタカ電機製作所
東京都
中央区
百万円
330
(NECST事業)
スイッチング電源お
よび無停電電源装置
の製造販売
100
役員の兼任あり
資金の貸付
土地建物等の貸与
コーポレーション
米国
イリノイ州
千US$
3,000
当社グループ製品の販
売
100
当社製品の販売
ニチコン(オーストリア)
ゲー・エム・ベー・ハー
オーストリア
ウィーン市
千EUR
1,000
当社グループ製品の販
売
100
当社製品の販売
役員の兼任あり
ニチコン(香港)リミテッ
ド (注)2,7
中国
香港行政区
千HK$
5,000
当社グループ製品の販
売
100
当社製品の販売
ニチコン(アメリカ)
8/110
EDINET提出書類
ニチコン株式会社(E01904)
有価証券報告書
議決権の所
有割合
(%)
関係内容
当社グループ製品の販
売
100
(31.2)
当社製品の販売
役員の兼任あり
千NT$
30,000
当社グループ製品の販
売
100
当社製品の販売
千BAHT
20,000
当社グループ製品の販
売
49
当社製品の販売
役員の兼任あり
千US$
500
当社グループ製品の販
売
100
(20)
当社製品の販売
千US$
300
各種コンデンサおよび
スイッチング電源の販
売に関連するサービス
業務
100
(100)
役員の兼任あり
マレーシア
セランゴール州
(コンデンサ事業)
アルミ電解コンデン
千M$
サの製造販売
63,000 (NECST事業)
スイッチング電源の
製造販売
100
(44.5)
当社製品の製造販売
役員の兼任あり
資金の貸付
中国
無錫市
(コンデンサ事業)
アルミ電解コンデン
千US$
サの製造販売
75,000 (NECST事業)
スイッチング電源の
製造販売
100
当社製品の製造販売
役員の兼任あり
中国
宿遷市
(コンデンサ事業)
千US$
アルミ電解コンデン
55,000
サおよびxEV用フィル
ムコンデンサの製造
100
当社製品の製造等
役員の兼任あり
資金の貸付
中国
無錫市
千RMB
5,000
各種電源およびアルミ
電解コンデンサの設
計・開発
100
(100)
役員の兼任あり
三和電機株式会社
韓国
清州市
百万W
6,613
(コンデンサ事業)
アルミ電解コンデン
サ等の製造販売
22.8
主要原材料の売上、
仕入
役員の兼任あり
タイコン コーポレーション
台湾
台北市
千NT$
473,800
(コンデンサ事業)
アルミ電解コンデン
サの製造販売
35.2
(3.3)
主要原材料の売上
役員の兼任あり
名称
住所
資本金
主要な事業の内容
ニチコン(シンガポール)
プライベート リミテッド
シンガポール
千SP$
8,000
ニチコン(台湾)
カンパニー リミテッド
台湾
台北市
タイ
バンコク
ニチコン(タイランド)
カンパニー リミテッド
(注)5
ニチコン エレクトロニクス
中国
トレーディング(上海)カン
上海市
パニー リミテッド
ニチコン エレクトロニクス
中国
トレーディング(深圳)カン
深圳市
パニー リミテッド
ニチコン(マレーシア)
センディリアン バハッド
(注)2
ニチコン エレクトロニクス
(無錫)カンパニー リミ
テッド
(注)2
ニチコン エレクトロニクス
(宿遷)カンパニー リミ
テッド
(注)2
無錫ニチコン エレクトロニ
クス R&Dセンター カン
パニー リミテッド(注)6
(持分法適用関連会社)
(注)1.「主要な事業の内容」欄には、セグメントの名称等を記載しています。
2.特定子会社に該当しています。
3.有価証券届出書または有価証券報告書を提出している会社はありません。
4.議決権の所有割合の( )内は、間接所有割合で内数です。
5.持分は100分の50以下ですが、実質的に支配しているため連結子会社としています。
6.無錫ニチコン エレクトロニクス R&Dセンター カンパニー リミテッドは、2026年4月20日付で清算が結
了しています。
7.ニチコン(香港)リミテッドについては、売上高(連結会社相互間の内部売上高を除く)の連結売上高に占
める割合が10%を超えています。
主要な損益情報等は次のとおりです。
9/110
EDINET提出書類
ニチコン株式会社(E01904)
有価証券報告書
ニチコン(香港)リミテッド
(1)売上高
(百万円)
24,411
(2)経常利益
(百万円)
94
(3)当期純利益(百万円)
39
(4)純資産額
(百万円)
5,365
(5)総資産額
(百万円)
9,480
10/110
EDINET提出書類
ニチコン株式会社(E01904)
有価証券報告書
第2【事業の状況】
1【経営方針、経営環境及び対処すべき課題等】
当社グループの経営方針、経営環境及び対処すべき課題等は、以下のとおりです。
なお、文中の将来に関する事項は、当連結会計年度末現在において当社グループが判断したものです。
(1)経営方針
当社グループは、「価値ある製品を創造し、明るい未来社会づくりに貢献します。より良い地球環境の実現に努
め、倫理的・社会的責任を果たすとともに、顧客・株主・従業員をはじめ全ての人々を大切に、企業価値の最大化
を目指して、誠心誠意をもって「考働(※)」します。」を経営理念に掲げ、「モノづくりからコトづくり」「製
造業から創造業への変革」の実践と、「品質、コスト、納期、サービス、技術」などあらゆる面で最上級を目指す
トップノッチ経営を打ち出し、積極的な成長戦略を展開し、企業価値の向上を図ります。
※考働:考えて働くという当社の造語
(2)中期的な成長戦略、経営環境と対処すべき課題
当社グループは、アルミ電解コンデンサ、導電性高分子アルミ固体電解コンデンサ、導電性高分子ハイブリッド
アルミ電解コンデンサ、フィルムコンデンサ、小形リチウムイオン二次電池等の電子デバイスを主体としたコンデ
ンサ事業と、家庭用/公共・産業用蓄電システム、EV・PHEV用急速充電器、V2Hシステムの環境関連製品、スイッ
チング電源、機能モジュール、研究・医療・産業用特殊電源等の回路製品を主力製品としたNECST事業を展開し、
「エネルギー・環境・医療機器」、「自動車・車両関連機器」、「白物家電・産業用インバータ機器」、「情報通
信機器」の4市場を重点分野と定め、高信頼性、高安全性、高機能性を追求し、競争力に優れる新製品開発により
社会課題の解決に貢献し、既存事業の拡大と新規事業の創出に努めています。
コンデンサ事業においては、特に車載・車両分野と情報通信分野の成長市場にフォーカスし、戦略的に事業基盤
を強化、拡充します。車載関連機器向けには、導電性高分子ハイブリッドアルミ電解コンデンサおよびチップ形ア
ルミ電解コンデンサの拡販に集中するとともに、xEV向けフィルムコンデンサでは、新規案件増加に伴う生産能力
の拡大とさらなる新規案件獲得に努めます。情報通信向けでは、導電性高分子アルミ固体電解コンデンサ、導電性
高分子ハイブリッドアルミ電解コンデンサおよび大形アルミ電解コンデンサを中心に、AIサーバー市場の立ち上が
りに対して受注拡大と生産体制の確立を図ります。これらを推進するための体制として、マザー工場制と販売統括
制の強化によるワールドワイドでの一気通貫による事業運営に取り組んでまいります。
NECST事業では、カーボンニュートラル社会に向けて貢献する商品群のさらなる拡充とソリューションによる価
値創造ビジネスの拡大を図ります。NECST事業の主力製品である家庭用蓄電システムでは、エネルギー価格の上昇
や家産家消ニーズの拡大を背景に、再エネ・蓄エネに向けて商品ラインアップを拡充します。また、VPP(Virtual
Power Plant:仮想発電所)などのエネルギー事業への展開にも取り組んでまいります。EV機器のうちV2Hでは、日
本車のEV新モデルや輸入車のV2H対応車の増加、商用車のEV化に対応し、用途・販売ルートの拡大に努めるととも
に、急速充電器においては、社会充電インフラとして全方位での事業・商品展開と新しいニーズに対応した充電ソ
リューションシステム製品の導入を図ります。医療用特殊電源や学術用加速器電源等では、需要拡大フェーズに対
応することに加え、核融合などの人類の課題解決に向けた技術確立にも貢献してまいります。
これら両事業の成長を土台から支える全社横断的な取組みとして、5つのマテリアリティ(重要課題)を定めま
した。事業面からは、「製品を通じた脱炭素社会への貢献」と「オンリーワン技術と絶対的品質による顧客満足度
の向上」を掲げ、気候変動などの社会課題の解決を促進することへの挑戦や両事業のシナジーを高めることを通じ
て、競争力を強化してまいります。サステナビリティやガバナンスの面からは、「働きがいを感じチャレンジでき
る職場環境の実現」、「事業活動における環境負荷の低減」、「変化への対応とガバナンス・リスク管理体制の強
化」としました。高度な技術開発やスキルの習得を促進し、価値創造に貢献することで従業員エンゲージメントを
高めること、バリューチェーン全体での環境負荷低減に向けた事業活動と技術革新を推進すること、事業リスクへ
の的確な対応とコンプライアンスの徹底、事業運営の健全性および透明性の確保によるステークホルダーとの信頼
構築に努めることで、持続的な成長基盤の構築に努めてまいります。
11/110
EDINET提出書類
ニチコン株式会社(E01904)
有価証券報告書
2【サステナビリティに関する考え方および取組】
当社グループのサステナビリティに関する考え方および取組は次のとおりです。
なお、文中の将来に関する事項は、当連結会計年度末現在において当社グループが判断したものです。
また、文中に記載の中期成長目標「Vision 2025」は2026年3月期を最終年度とする計画であり、提出日現在は終
了していますが、当該計画において整理された経営課題および取り組みは、現在のサステナビリティ経営に継承され
ています。
(サステナビリティ方針)
私たちは、ニチコングループ経営理念に基づき、価値ある製品の創造を通じて明るい未来社会づくりに貢献すると
ともに、より良い地球環境の実現に努めます。
また、全てのステークホルダーに対し誠心誠意をもって対応し、企業の社会的・倫理的責任を果たすことで、持続
可能な社会の実現と企業価値の向上を目指します。
1.素材開発からシステム設計まで幅広い技術を融合し、デジタルトランスフォーメーションとオープンイノベー
ションの推進により気候変動など社会の課題を解決し、明るい未来社会づくりに貢献します。
2.全てのステークホルダーとの対話と連携を大切にし、共有価値の創造と公正かつ透明性の高い経営を実現しま
す。
3.人権の尊重と多様性の確保、人材の育成、トップノッチ経営(※)によりお客様価値を高め、企業の発展と全
従業員の幸福を目指します。
※品質、コスト、納期、サービス、技術などあらゆる面において最上級を目指すこと。
(1)ガバナンス
(サステナビリティ推進体制)
ニチコングループは2021年11月30日に、中期成長目標「Vision 2025」と同時に、目標の達成を通して持続可能
な社会の実現と企業価値の向上を目指す「サステナビリティ方針」を定めました。この方針に基づく経営を実践し
ていくため、サステナビリティ推進室を設置し(2022年2月)、代表取締役社長を委員長とする「サステナビリ
ティ推進委員会」を運営しています。
サステナビリティ推進委員会は、これまでの「CSR推進委員会」(2003年6月発足)の機能を強化・発展させた
もので、全社的な取り組みの方針検討や決定に加え、進捗管理や改善指示などの機能を担います。そのため、本推
進委員会に紐づく委員会もESGに対応させた「環境・エネルギー」(E)、「ダイバーシティ」(S)、「コンプラ
イアンス・リスク管理」(G)としています。サステナビリティ推進委員会は月1回開催し、3つの委員会で議論
したサステナビリティ課題への検討結果を議論します。
≪サステナビリティ推進体制図≫
(2)リスク管理
サステナビリティ推進委員会は、社長・取締役・執行役員のほか各部門の部長クラスの幹部社員も参加し、現場
の実態を踏まえた意見やアイデアを出すことにより議論の活性化を図っています。各委員会での検討を踏まえた問
題提起や具体的な提案を検討する場として、会議体としての実効性をより高めています。
ダイバーシティ推進やCO2排出削減など、各活動に関するKPIの選定および目標を設定し、目標達成のための課題
などについて議論を重ねるとともに、関連情報の収集・アップデートやベンチマーク設定を進めています。
サステナビリティ推進委員会の活動は「サステナビリティ方針」や中期成長目標「Vision 2025」に基づいたも
ので、根底には当社の経営理念が礎となっています。そのことを常に念頭に置きつつ、総務・人事をはじめ社内の
各部門や他の会議体とも連携を図りながら、スピーディ、かつダイナミックな活動を進めています。
12/110
EDINET提出書類
ニチコン株式会社(E01904)
有価証券報告書
サステナビリティ全般に係るリスク管理は、サステナビリティ推進委員会内にコンプライアンス・リスク管理委
員会を設け、関連部門の責任者がメンバーとなり、コンプライアンス全般、環境安全衛生、情報セキュリティをは
じめ、あらゆるリスクに対して横断的に対処できる体制としています。
≪サステナビリティ経営の概念≫
(3)戦略
①人材の多様性の確保を含む人材の育成
(人材の多様性の確保を含む人材の育成に関する方針)
当社グループにおける≪人事理念≫、≪求める人材像≫、≪人事ポリシー≫と、人材の多様性の確保を含む人
材の育成に関する方針は以下のとおりです。
事業環境が目まぐるしく変化する現状において、情報をわかちあい、適切な判断やアクションをすることが重
要となってきております。求める人材像の1つに「社会の変化を察知し、変化に対応できる人材」を掲げてお
り、人事ポリシーにも同様に「変化に対応し、価値を創造できる人材を育成・支援する」と設定しています。
13/110
EDINET提出書類
ニチコン株式会社(E01904)
有価証券報告書
従業員の働きがい・やりがいを意識した人事施策として、2024年度から1on1ミーティングを実施した結果、
2025年度のエンゲージメント調査において管理職と管理職未満の指数はともに改善されました。今後も上司/部
下や組織の枠を超えたコミュニケーション施策を推進することで、全従業員の「個」の力を高め、チーム力を発
揮し、みなが相互理解のうえで経営理念の実現を目指します。
「階層別研修」「職能別研修」「コンプライアンス研修」「競争法研修」「エチケット・マナー研修」「女性
リーダー研修」等、従業員の育成・成長支援への施策(特に女性が活躍できる施策)を加速するとともに、QC検
定合格や資格取得奨励のほか多彩な通信教育の受講を推奨し、意欲ある従業員の能力向上の機会を充実させてい
ます。また、2024年度より、社員の英会話力向上のため、英会話学習講座プログラムを新設することで、グロー
バルに活躍できる人材育成を推進しています。
他にも、若手技術者育成の一環として、産学連携研究協力協定を締結している東京大学生産技術研究所に若手
技術者を派遣し、最先端技術の共同研究を通して技術者育成支援を積極的に行うとともに、事業本部を跨いだ若
手中心の新規商品開発会議ならびに事業化推進を実施する等、さまざまな人材育成の施策を行っています。
(社内環境整備に関する方針)
当社グループにおける社内環境整備に関する方針は以下のとおりです。
当社グループは2024年度に行動規範の見直しを行い、すべての人の基本的人権・個人の尊厳とプライバシーの
尊重を掲げ、国籍・人種・性別等による差別を行わないことに加え、ハラスメントに関する教育教材を刷新する
ことで、パワーハラスメントやセクシャルハラスメントなどの名誉棄損行為による人権侵害を一切行わないこと
を繰り返し教育しています。また、2025年度には人権方針を策定し、事業活動における人権尊重を徹底し、差別
や侵害を防止するとともに、企業責任を明確化し、持続可能で信頼される組織運営と社会的要請への対応を実現
し、価値創造を高めることを周知しています。
企業の健全な成長のためには従業員一人ひとりが心身ともに健康であることが重要であり、法定健診はもとよ
り、生活習慣病健診や人間ドックの実施により疾病の早期発見、早期治療のための取り組みを行うとともに、健
康障害の予防として、長時間労働の抑制や、一斉有給休暇取得日を設け、休暇取得を促進、また、希望者を対象
にインフルエンザワクチンの費用補助をするなど就業環境の向上に取り組んでいます。
「労働災害・通勤途上災害の発生ゼロを目標に安全指導・教育の徹底」を重点テーマとして、2カ月に一度、
事業所間で活動状況の取組事例を共有し、優れた点については横展開することで、安全衛生活動のレベルアップ
を図っています。
2026年の新卒採用実績は96名で、内女性は19名、外国留学生は10名です。また、2025年の中途採用実績は168
名で、新卒採用に偏ることなく、スキルのある人材を積極的に採用することで、多様な人材が活躍できる組織体
制と組織風土を築いています。
②気候変動
当社グループは1997年12月にニチコングループ環境憲章を制定(2015年8月改訂)し、経営理念として、価値あ
る製品の創造を通じて明るい未来社会づくりに貢献するとともに、より良い地球環境の実現に努めてまいりまし
た。2021年11月にはサステナビリティ方針を定め、取締役会において低炭素社会の実現に向けた事業機会の獲得や
ESG経営の構築と推進について対応方針や施策を決定しています。昨年、特定した5つのマテリアリティ(重要課
題)では「製品を通じた脱炭素社会への貢献」と「事業活動における環境負荷の低減」を掲げ、気候変動などの社
会課題の解決を促進することへの挑戦やバリューチェーン全体での環境負荷低減に向けた事業活動と技術革新を推
進する取り組みを加速しています。また、これらの推進体制として、サステナビリティ推進委員会内に環境・エネ
ルギー委員会を設け、関連部門の責任者がメンバーとなり、横断的な体制としています。
環境・エネルギー委員会においては、気候変動や水セキュリティ、その他、全社の環境保全に関する戦略・方
針・目標・計画・施策などを審議し設定するとともに、毎月のサステナビリティ推進委員会にて環境・エネルギー
委員会による実施状況のレビューを実施しています。また、本社管理本部に環境管理総括責任者、製造事業所に
EMS(環境マネジメントシステム)管理責任者、EMS事務局を置き、環境方針・環境保全計画に沿って活動する体制
としています。加えて、サステナビリティ推進委員会においては、気候関連リスクのほか、同推進委員会内のコン
プライアンス・リスク管理委員会を中心にその他の重要リスクの洗い出しと管理を行っています。事業継続計画
(BCP)や事業継続マネジメント(BCM)に基づくリスク発生時の全社連絡体制を整備しており、危機発生時には、
規模、レベルに応じた対策本部を設置して対策立案と指揮・命令を実行する仕組みとしています。
14/110
EDINET提出書類
ニチコン株式会社(E01904)
有価証券報告書
当社グループは、世界的な地球温暖化抑制のための取り組みに貢献するため、当社グループの事業活動に伴う温
室効果ガス排出量(Scope1、2、3)の削減目標として、2030年に46%削減(2021年度比)、2050年にカーボン
ニュートラルを目指します。また、環境保全や資源維持に向けた水使用量や産業廃棄物排出量の管理、再資源化
量・再資源化率の向上にも積極的に取り組んでいます。
さらに、当社製品やサービスを活用いただくことによって、お客さまの気候変動対策に関する役立ちをわかりや
すくすることにも注力しています。
当社グループは、これらの目標設定を踏まえ、より一層の地球環境の保全に向けた事業活動を推進していくこと
により、サステナブルな社会の実現への貢献と企業価値の向上を図ります。
当社グループの主要事業であるコンデンサ事業およびNECST事業について、気候変動がおよぼすリスクと機会に
ついて事業を取り巻く環境を整理し、ステークホルダーや当社グループにとっての重要性を考慮したうえで、事業
活動への影響を「大」「中」「小」の3段階で評価しています。
15/110
EDINET提出書類
ニチコン株式会社(E01904)
有価証券報告書
③情報セキュリティの強化
情報通信技術の普及により利便性が飛躍的に高まる一方で、近年、企業を標的にしたサイバー攻撃や、従業員に
よる故意または過失の行為による情報漏えいなども多数発生しています。これらに適時適切に対応しなければ、社
会的信用の失墜、システムの修復やお客さまへの補償などの経済的損失、システムダウンによる事業活動の停止な
ど、当社のみならず、取引先や株主・投資家などあらゆるステークホルダーへ悪影響を及ぼす可能性があります。
また、世界各国でデータ保護や個人情報保護の規制・法令の制定・強化が進められており、これらに違反した場合
の罰則が厳罰化している傾向にあります。
当社グループでは、情報セキュリティリスクへの対策として、人的対策と技術的対策の2つの側面からその取り
組みを進めています。人的対策としては、「情報セキュリティ基本方針」「情報システムセキュリティ規程」「個
人情報保護方針」「個人情報管理規程」など、従業員が遵守すべき事項を定めた各種規程を制定し、これらの規程
に基づいた情報セキュリティ教育や、標的型攻撃メールの訓練などを定期的に実施しています。また、昨年度から
開始した情報セキュリティの内部監査については、今年度、対象拠点を増やして展開を図っています。
16/110
EDINET提出書類
ニチコン株式会社(E01904)
有価証券報告書
技術的対策としては、マルウェア対策、パソコンの操作履歴などの各種ログの収集、情報へのアクセスコント
ロール、脆弱性診断の受診、疑似アタックの実施、通信内容の監視による不正侵入の防止、USBメモリ・SDカード
等の記憶媒体の使用制限などを実施しています。
また、従業員が使用するパソコンは外部の専門機関が24時間365日監視しており、不審な挙動を検知した場合に
は、早期に発見・対処する体制を整備しています。その他、情報セキュリティに関する事件・事故の発生に備え、
グループ全体でサイバーセキュリティ保険に加入しています。
(4)指標と目標
当社グループにおけるサステナビリティ(全般、人的資本、情報セキュリティ)に関する方針について、次の指
標を用いており、当該指標に関する目標および実績は次のとおりです。
実績
(前連結会計年度)
実績
(当連結会計年度)
毎月開催
12回
12回
管理的地位にある労働者に占める女
性労働者の割合
(注)1
2027年3月:7%
6.3%
5.3%
従業員エンゲージメント指数の改善
(注)2
前年対比従業員のエンゲージ
メント指数を改善
管理職:△0.13
管理職未満:△0.07
管理職:+0.03
管理職未満:+0.07
度数率(注)3
2026年3月までにゼロを達成
0.89
0.00
温室効果ガス排出量
(Scope1・2・3)(注)4
2030年:46%削減(2021年度
比)
2050年:カーボンニュートラ
ル達成
△10%
(2021年度比)
△18%
(2021年度比)
1回
1回
1回
9拠点/年
5拠点/年
9拠点/年
標的型メール訓練
1回
1回
※全メールユーザが
対象
1回
※全メールユーザが
対象
疑似アタックによるリスク調査
1回
1回
1回
脆弱性診断
1回
1回
1回
指
標
サステナビリティ推進委員会
開催回数
情報セキュリティ教育
情報セキュリティ内部監査
目
標
(注)1.提出会社の目標と2026年3月末時点の実績
管理職に占める女性労働者の割合については、提出会社を対象として記載しています。これは、当社グ
ループにおける人事制度および雇用管理の基盤が提出会社において統一的に整備・運用されており、管
理職登用を含む重要な人事方針の策定・実行も提出会社を中心に行われているため、当該数値がグルー
プ全体の状況を代表する指標として一定の合理性を有すると判断したことによるものです。なお、今後
はグループ各社の実態把握を進め、開示の充実についても検討してまいります。
2.当社独自の従業員エンゲージメント指数
3.100万延べ実労働時間当たりの労働災害による死傷者数をもって災害発生の頻度を表したもの
提出会社を含む国内連結子会社の目標と2025年度の実績
4.2025年3月末時点の実績
17/110
EDINET提出書類
ニチコン株式会社(E01904)
有価証券報告書
3【事業等のリスク】
当社グループの経営成績、株価および財務状況等に影響を及ぼす可能性のあるリスクは以下のようなものがありま
す。
なお、文中における将来に関する事項は、有価証券報告書提出日現在において当社グループが判断したものです。
(1)経済状況について
当社グループは世界各地で、アルミ電解コンデンサ、フィルムコンデンサ、回路製品などの製品を製造・販売
しています。このため、当社グループ製品の需要は、製品を販売している国または地域の経済状況によって事業
運営や経営成績および財務状況に直接的な影響を及ぼす可能性があります。
これに対し当社グループでは、グローバルでの経済状況の変化を毎月開催している経営会議や年1回に開催し
ているグローバルの事業計画推進会議などで注意深く見守り、機動的な販売戦略や生産体制を講じるなど、状況
に応じた対応が取れるように対策を行っています。
2027年3月期の経済環境の見通しは、中東情勢による原材料・諸資材の調達難と価格高騰、エネルギー価格の
高止まりや物流網の混乱をはじめ、経済安全保障体制の懸念、政策金利の上昇や急激な為替変動、さらにロシ
ア・ウクライナ情勢や米国関税問題など不確定要素が多く、世界経済の先行きは極めて不透明な状況が続いてい
ます。引き続き動向には注視するとともに、業績確保に向けた様々な対策、施策を講じていきます。
(2)為替変動によるリスクについて
当社グループの事業、経営成績および財務状況における外貨建ての項目については、連結財務諸表作成のため
円換算されています。これらは、為替レートの変動により、円換算後の価値が影響を受ける可能性があります。
当社グループは、為替リスクを軽減・ヘッジするために必要に応じて為替予約を締結していますが、当社グルー
プの経営成績および財務状況への影響を完全に排除できる保証はありません。
(3)価格競争リスクについて
当社グループは、アルミ電解コンデンサ、フィルムコンデンサ、回路製品などのコア事業の強化とグローバル
体制の構築を目指し、国内外の生産拠点の強化および販売体制の拡充、新製品開発のスピード化を推進していま
す。このような中で、競合他社との間の価格競争激化の影響を受け、当社グループの製品・サービスが価格競争
に直面し、当社グループの事業、経営成績および財務状況に悪影響が及ぶ可能性があります。
これに対し当社グループでは、各事業分野において、競争優位性を高める新製品の企画・開発を継続的に行う
とともに、コスト力の強化と適切な売価マネジメントに注力し、提案型営業を推進することで顧客満足を獲得し
ていきます。
(4)新製品の開発リスクについて
当社グループでは、将来にわたり、ユーザーニーズを先取りした魅力ある新製品を開発し、提供できると考え
ていますが、以下のような能力が不足した場合、当社グループの事業、経営成績および財務状況に悪影響を及ぼ
す可能性があります。
① 多様化・高度化する顧客の要求に対応する能力
② 新製品を適時かつ適正コストで開発し生産する能力
③ 顧客の新製品に当社グループの製品が使用されるようにする能力
④ 新たな製品・サービスおよび技術を使用し展開する能力
⑤ 既存の製品・サービスおよび技術を向上させる能力
⑥ 業界と市場の変化を十分に予測する能力
あらゆる分野での技術革新がグローバル規模で進む中、お客様や社会が直面する課題をいち早く解決できる技
術の重要性がますます高まっています。これらに対応するため、当社グループでは、日本と中国に研究開発拠点
を設け、それぞれの製品分野ごとに、材料開発からの一貫した研究開発体制を構築しています。また、研究開発
部門と生産部門が密接に連携することで、新技術の早期実用化・製品化を実現しています。さらに、変化の激し
い市場環境に対応するために、必要な技術領域において強みのある大学・研究機関・企業と積極的に連携し、研
究開発活動を加速させるオープンイノベーションと、東京大学生産技術研究所との包括的な産学連携研究協定を
通じて、将来の技術経営を担う人材育成にも注力しています。
(5)海外進出の潜在リスク、法的規制の変更・強化について
当社グループが事業を展開する国または地域において、法令または規制の重要な変更、税制または税率の変
更、その他経済的、社会的および政治的変動、為替政策の変更、輸出または輸入に関する法規制などの変更が
あった場合、それらの事象は当社グループの事業、経営成績および財務状況に悪影響を及ぼす可能性がありま
す。
また、当社グループは、中国・無錫市および宿遷市にアルミ電解コンデンサなどの製造拠点を設けています
が、現地で政治、法的環境、経済状況などに予期せぬ事象が発生した場合、事業の遂行に問題が生じ、当社グ
ループの事業、経営成績および財務状況に悪影響を及ぼす可能性があります。
当社グループでは、「(1)経済状況について」において説明のとおり、グローバルでの政治・経済状況の変
化を注意深く見守り、状況に応じた対応が取れるように対策を行っています。
18/110
EDINET提出書類
ニチコン株式会社(E01904)
有価証券報告書
(6)原材料などの購入価格の高騰について
国際市況に大きく影響を受ける当社グループの主要製品に使用する原材料の購入価格の高騰は、当社グループ
の経営成績および財務状況に悪影響を及ぼす可能性があります。
当社グループは、原材料のマーケット変動に柔軟に対応するべく、代替材料の検討や複数購買化を推進すると
ともに、吸収できない調達コスト上昇に関しては、市場価格も見つつ適切に製品売価に反映するようにしていま
す。
(7)製造物責任について
当社グループは、品質管理を徹底し、世界的な品質管理基準に従い製品を製造していますが、提供する製品・
サービスには欠陥が生じる可能性があります。また、製造物賠償責任保険に加入していますが、賠償額を十分に
カバーできるという保証はありません。
欠陥が原因で生じた損失は、多額のコストや当社グループの評価の低下を通じ、当社グループの事業、経営成
績および財務状況に悪影響を及ぼす可能性があります。
当社グループでは、全製造事業所で「いつ」「どこで」「どの製品が」「どのような状況で」つくられたかを
確実にチェックできる生産管理システムを導入しています。これはシステムで品質管理を徹底し、"不良ゼロ"に
よる安定生産を実現するためのものです。このゼロ・ディフェクトに向けた取り組みを毎期、生産事業所ごとに
事業計画として策定するとともに、品質保証システムの国際的規格であるISO9001やIATF16949の取得や更新審査
を通じて、常に最新の品質管理基準と運用体制の構築につなげています。
(8)環境規制などによる影響について
当社グループの事業は様々な環境法令の適用を受けており、過去、現在および将来の生産活動に関し、環境責
任のリスクを抱えています。将来、環境に関する規制が厳しくなり有害物質などを除去する義務が追加された場
合、これにかかる費用が当社グループの事業、経営成績および財務状況に悪影響を及ぼす可能性があります。
地球との共存を目指して、当社は全社・全グループの環境保全活動を進めるために、資源の有効活用、環境汚
染防止を最優先としたニチコングループ環境憲章を1997年12月に制定(2015年8月改定)し、環境保全に向けた
取り組みを推進してきました。現在、国内外の13製造事業所で環境マネジメントシステム規格ISO14001の認証を
取得しており、全社・全グループをあげて、環境に配慮した技術と製品の提供に努めています。
(9)災害などによる影響について
当社グループは、すべての生産設備における定期的な災害防止検査・点検を実施していますが、自然災害、事
故、情勢変化や事件などによる悪影響を完全に阻止または軽減できる保証はありません。それらは、当社グルー
プの事業、経営成績および財務状況に悪影響を及ぼす可能性があります。
当社グループでは、災害等の発生に備え、生命の安全確保・安否確認体制を整備するとともに、重要業務の継
続・中断した場合を想定し、早期復旧を目指せる体制、事業継続計画(BCP)および事業継続マネジメント(BCM)の
見直しと追加構築に取組んでいます。
(10)情報セキュリティについて
当社グループは、事業活動において顧客・取引先から入手した機密情報(取引先情報、個人情報、営業秘密情
報、技術情報など)を保有しています。一方で、近年、企業を標的にしたサイバー攻撃や、社内の従業員による
故意または過失の行為による情報漏えいなども多数発生しています。これらに適時適切に対応しなければ、社会
的信用の失墜、システムの修復やお客様への補償などの経済的損失、システムダウンによる事業活動の停止な
ど、業績に悪影響を及ぼす可能性があります。また、世界各国でデータ保護や個人情報保護の規制・法令の制
定・強化が進められており、これらに違反した場合の罰則が厳罰化している傾向にあります。
当社グループでは、情報セキュリティリスクへの対策として、人的対策と技術的対策の2つの側面からその取
り組みを進めています。人的対策としては、情報セキュリティ基本方針、情報システムセキュリティ規程、個人
情報保護方針、個人情報管理規程など、従業員が遵守すべき事項を定めた各種規程を制定しています。また、こ
れらの規程に基づいた情報セキュリティ教育や、標的型攻撃メールの訓練などを定期的に実施しています。技術
的対策としては、マルウェア対策、パソコンの操作履歴などの各種ログの収集、情報へのアクセスコントロー
ル、脆弱性診断の受診、疑似アタックの実施、通信内容の監視による不正侵入の防止、USBメモリ・SDカード等
の記憶媒体の使用制限などを実施しています。また、従業員が使用するパソコンは外部の専門機関が24時間365
日監視しており、不審な挙動を検知した場合には、早期に発見・対処する体制を整備しています。その他、情報
セキュリティに関する事件・事故の発生に備え、グループ全体でサイバーセキュリティ保険に加入しています。
(11)その他
上記に掲げたリスク要因は、当社グループの事業展開その他に関するリスクの全てを網羅しているものではあ
りません。その他、知的財産権に係る法的リスク、顧客の信用リスク、人材育成・確保に係るリスクなども発生
する恐れがあり、当社グループの事業、経営成績および財務状況に悪影響を及ぼす可能性があります。
これら様々なリスクに対し、当社グループでは「ニチコングループ行動規範」(2002年10月制定・2013年4
月・2024年4月に改訂)を全役職員に徹底し、法令・定款および社内規則はもとより、健全な社会規範、倫理規
19/110
EDINET提出書類
ニチコン株式会社(E01904)
有価証券報告書
範に則った職務を遂行し、企業風土の醸成と教育・啓発活動の推進に努めています。また、これらを確保するた
めの体制として、代表取締役社長を委員長とする「サステナビリティ推進委員会」を設置しています。
4【経営者による財政状態、経営成績及びキャッシュ・フローの状況の分析】
(1)経営成績等の状況の概要
当連結会計年度における当社グループ(当社、連結子会社および持分法適用会社)の財政状態、経営成績及びキャッ
シュ・フロー(以下「経営成績等」という。)の状況の概況は次のとおりです。
①財政状態及び経営成績の状況
当連結会計年度におけるわが国経済は、世界情勢の不確実性に加えてエネルギー価格の高騰や金利上昇等による
景気の下押しリスクが残るものの、雇用・所得環境の改善や、物価高対策を中心とする経済政策への期待感を背景
に、緩やかな回復基調で推移しました。一方で、原材料価格の上昇や人手不足などにより、先行きは依然として不
透明な状況が続きました。米国経済は、関税政策の影響による一部輸出関連の弱さが見られたものの、個人消費お
よび雇用環境の底堅さにより、全体としては堅調に推移しました。中国経済は、内需の減速や不動産市場の低迷を
背景に、景気低迷が続きました。欧州経済は、インフレ圧力の鈍化から緩やかな持ち直しの動きが見られました
が、地域間のばらつきが大きく、鉱工業分野を中心に総じて低調な推移となりました。
これらの結果、当連結会計年度の売上高は169,724百万円と前期比3.4%の減収となりました。また、利益につき
ましては、営業利益は6,456百万円と前期比24.1%の増益、経常利益は8,326百万円と前期比10.9%の増益、親会社
株主に帰属する当期純利益は6,310百万円と前期比7.4%の増益となりました。
セグメントごとの経営成績は次のとおりです。
(コンデンサ事業)
コンデンサ事業における売上高は102,748百万円(前期比3.6%増)、セグメント営業利益は4,598百万円(前期比
196.3%増)と増収増益となりました。
情報通信分野では、生成AIサーバーおよびデータセンター向け設備投資は一段と活発化しており、これを背景に
当社においても導電性高分子アルミ固体電解コンデンサ、導電性高分子ハイブリッドアルミ電解コンデンサならび
にAIサーバー電源用大形アルミ電解コンデンサの需要は拡大傾向となっています。当社は同分野を重点成長市場と
位置づけ、開発から量産までのビジネスサイクルのスピードアップを含む供給体制の強化を継続し、市場拡大に対
応してまいります。同様に、重点市場分野である車載関連機器向けにつきましては、ADAS(先進運転支援システ
ム)および電動化ユニット向けに搭載される導電性高分子ハイブリッドアルミ電解コンデンサの需要が拡大基調を
維持しています。当社は増産体制の整備を継続し、顧客要求に適切に対応してまいります。xEV向けフィルムコンデ
ンサについては、上半期までの調整局面を脱し、新規取り組み案件の量産開始を含め、当下半期より回復へ転じま
した。産業用インバータ機器向けでは、パワーコンディショナー用途の大形アルミ電解コンデンサにおいて顧客在
庫の消化が進捗し、回復傾向が見られます。当社は、需要拡大が見込まれる導電性高分子アルミ固体電解コンデン
サ、導電性高分子ハイブリッドアルミ電解コンデンサおよびAIサーバー電源用大形アルミ電解コンデンサの製品ラ
インアップ拡充に加え、xEV向けフィルムコンデンサの生産能力増強および技術開発体制の強化を進め、車載・車両
および情報通信の重点成長市場における受注拡大と事業の持続的成長の実現に取り組んでまいります。
(NECST事業)
NECST事業における売上高は66,976百万円(前期比12.5%減)、セグメント営業利益は1,860百万円(前期比
49.0%減)と減収減益となりました。
家庭用蓄電システムは、新たなフラッグシップモデルであるトライブリッド蓄電システム®「ESS-T5/T6シリー
ズ」の販売を当下半期から開始したことで、政府・地方自治体が促進する補助事業との相乗効果が得られたもの
の、新製品投入時期の遅れから売上が減少しました。急速充電器では、社会的なEV普及の遅れがあるものの、イン
フラ向けの拡販を進めました。日系完成車メーカーによるEV新モデルの発表が続いていることや、輸入EV車の増
加、昨今のエネルギー価格の高騰から、EVを選択するユーザーは増加すると見込まれ、家庭用蓄電システムと共に
V2Hシステムの伸長が期待されます。スイッチング電源では、主力のドキュメント市場向けが関税問題および中国市
場の停滞で影響が見られ、好調であった遊戯用も足もとでは調整局面となりました。大型特殊電源については、産
業特殊用・学術用・医療用等を中心に計画どおり堅調に推移しました。昨今の国際社会情勢の中でエネルギー価格
に著しい変動が見られることやGX ZEHへの対応などから、蓄電システムやEV関連機器の市場が益々活性化していく
と見られます。当社は、低炭素社会の実現に貢献することとあわせて、エネルギーマネジメントに関するソリュー
ション提供を積極的に展開してまいります。
20/110
EDINET提出書類
ニチコン株式会社(E01904)
有価証券報告書
前連結会計年度
(自
セグメントの名称
当連結会計年度
2024年4月1日
(自
至
2025年3月31日)
至
2026年3月31日)
金
額
金
額
構成比
増
2025年4月1日
構成比
金
額
減
増減比
(百万円)
(%)
(百万円)
(%)
(百万円)
(%)
コンデンサ事業
99,168
56.4
102,748
60.5
3,579
3.6
NECST事業
76,583
43.6
66,976
39.5
△9,606
△12.5
175,751
100.0
169,724
100.0
△6,026
△3.4
合
計
・海外売上高
前連結会計年度(自
2024年4月1日
至
2025年3月31日)
米州
Ⅰ
海外売上高(百万円)
Ⅱ
連結売上高(百万円)
Ⅲ
連結売上高に占める海外売上高の割
合(%)
当連結会計年度(自
2025年4月1日
アジア
13,852
海外売上高(百万円)
Ⅱ
連結売上高(百万円)
Ⅲ
連結売上高に占める海外売上高の割
合(%)
63,042
計
10,003
86,898
175,751
7.9
至
35.8
5.7
49.4
2026年3月31日)
米州
Ⅰ
欧州他
アジア
14,687
欧州他
61,990
計
9,436
86,113
169,724
8.7
36.4
5.6
50.7
②キャッシュ・フローの状況
当連結会計年度末における現金及び現金同等物(以下「資金」という。)の残高は、前連結会計年度末に比べ
1,078百万円減少し24,441百万円となりました。当連結会計年度における各キャッシュ・フローの状況とそれらの要
因は次のとおりです。
(営業活動によるキャッシュ・フロー)
営業活動によるキャッシュ・フローは、前期に比べ10,183百万円収入が減少し、8,163百万円の収入となりまし
た。これは主に、税金等調整前当期純利益が7,201百万円、減価償却費を8,077百万円計上、また、棚卸資産の減少
額が1,794百万円となった一方で、売上債権の増加額が1,204百万円および仕入債務の減少額が5,976百万円となった
ことなどによるものです。
(投資活動によるキャッシュ・フロー)
投資活動によるキャッシュ・フローは、前期に比べ1,804百万円支出が減少し、6,556百万円の支出となりまし
た。これは主に、有価証券・投資有価証券の売却・償還による収入が2,292百万円となりましたが、有形固定資産の
取得による支出が7,099百万円、長期貸付金による支出が790百万円および有価証券・投資有価証券の取得による支
出が700百万円となったことなどによるものです。
(財務活動によるキャッシュ・フロー)
財務活動によるキャッシュ・フローは、前期に比べ10,474百万円支出が減少し3,844百万円の支出となりました。
これは主に、短期借入金の純増加額が1,700百万円となった一方で、長期借入金の返済による支出が2,500百万円、
配当金の支払額が2,417百万円となったことなどによるものです。
21/110
EDINET提出書類
ニチコン株式会社(E01904)
有価証券報告書
③生産、受注及び販売の実績
a.生産実績
当連結会計年度(自 2025年4月1日至 2026年3月31日)におけるセグメント別の生産実績は、次のとおりで
す。
セグメントの名称
当連結会計年度(百万円)
前期比(%)
コンデンサ事業
103,429
105.2
NECST事業
66,569
88.2
169,998
97.8
合計
(注)金額は、販売価格によります。
b.受注実績
当連結会計年度(自 2025年4月1日至 2026年3月31日)におけるセグメント別の受注実績は、次のとおりで
す。
セグメントの名称
受注高(百万円)
前期比(%)
受注残高(百万円)
前期末比(%)
コンデンサ事業
109,775
111.2
38,135
122.6
NECST事業
66,449
88.5
8,556
94.2
176,225
101.4
46,692
116.2
合計
c.販売実績
当連結会計年度(自 2025年4月1日至 2026年3月31日)におけるセグメント別の販売実績は、次のとおりで
す。
セグメントの名称
当連結会計年度(百万円)
前期比(%)
コンデンサ事業
102,748
103.6
NECST事業
66,976
87.5
169,724
96.6
合計
(2)経営者の視点による経営成績等の状況に関する分析・検討内容
文中における将来に関する事項は、当連結会計年度末現在において判断したものです。
①重要な会計方針および見積りに用いた仮定
当社グループの連結財務諸表は、わが国において一般に公正妥当と認められる会計基準に基づいて作成されてい
ます。連結財務諸表の作成にあたって、財政状態および経営成績に影響を与える項目は下記のとおりです。なお、
当社グループの重要な会計方針については、「第5 経理の状況 1 連結財務諸表等注記事項 4.会計方針に
関する事項」に記載しています。また、連結財務諸表の作成にあたって用いた会計上の見積り及び当該見積りに用
いた仮定のうち、重要なものについては、「第5 経理の状況 1 連結財務諸表等注記事項 (重要な会計上
の見積り)」に記載しています。
a.固定資産の減損
当社グループは、事業用の様々な有形固定資産および無形資産を所有しています。毎期、資産または資産グ
ループに減損が生じている可能性を示す事象(減損の兆候)があるかどうかを判定し、減損の兆候がある資産ま
たは資産グループについて、帳簿価額がこれらの資産の継続的使用と使用後の処分によって生ずると見込まれる
割引前の将来キャッシュ・フローの総額を超える場合に、減損損失を認識することとしています。また、資産ま
たは資産グループの継続的使用と使用後の処分によって生ずると見込まれる将来キャッシュ・フローの割引現在
価値と、正味売却価額のいずれか高い方の金額を資産の回収可能価額とし、帳簿価額が回収可能価額を上回る額
を減損損失として測定しています。今後の事業計画との乖離や市況・需要の変化等によって、期待される収益や
キャッシュ・フローが生み出せない可能性を示す事象(減損の兆候)が見られる場合、減損損失の計上が必要と
なる可能性があります。
b.貸倒引当金
当社グループは、売掛債権、貸付金等による損失に備えるため、一般債権については貸倒実績率により、貸倒
懸念債権および破産更生債権については個別に回収可能性を検討し、回収不能見込額を計上しています。顧客の
財政状態が悪化し、その支払能力が低下した場合は追加引当が必要となる可能性があります。
22/110
EDINET提出書類
ニチコン株式会社(E01904)
有価証券報告書
c.投資の減損
当社グループは、長期的な取引関係の維持のために、特定の顧客等および金融機関の株式を所有しています。
これらの株式には価格変動性が高い上場会社の株式と、株価の決定が困難である非上場会社の株式が含まれてい
ます。当社グループは連結会計年度末において、上場会社では株価が取得価額を50%以上下落した場合、非上場
会社では会社の純資産額が欠損により50%以上下落した場合に減損損失を計上しています。また、株価が取得価
額の30〜50%程度下落した場合には、回復可能性等を考慮して必要と認められた額について減損損失を計上して
います。将来の市況悪化または投資先の経営成績不振により、減損損失の計上が必要となる可能性があります。
d.繰延税金資産の回収可能性
「第5 経理の状況 1 連結財務諸表等
注記事項 (重要な会計上の見積り)
2.繰延税金資産の回収
可能性」に記載のとおりです。
e.退職給付に係る負債および年金制度
当社の退職金規程では、勤続年数3年以上の従業員については、原則として退職時に退職一時金の受給資格を
有することになります。この退職給付金は、通常、勤務年数、退職の事由、退職時の算定基礎額により算出され
ています。
当社および一部の国内連結子会社は、従業員の退職給付に関し、確定給付型年金制度および退職一時金制度を
採用しており、当社および在外連結子会社の一部につきましては、確定拠出型年金制度を採用しています。退職
給付に係る負債および退職給付費用の計算は、数理計算上で設定された前提条件に基づいて算出されており、こ
れらの前提条件には割引率、年金資産の長期期待運用収益率、将来の昇給率、退職率、死亡率などが含まれま
す。当社グループが使用した前提条件は妥当なものと考えていますが、実際の結果が異なる場合、または前提条
件が変更された場合は、退職給付に係る負債および退職給付費用に影響を与える可能性があります。
f.製品保証引当金
当社は、製品の販売に係る一定期間内の無償サービスの費用に備えるため、当該費用の発生割合および支出実
績を勘案した見積額を計上していますが、実際の製品不良率や保証費用が見積りと異なる場合には、追加の引当
が必要となる可能性があります。
②当連結会計年度の経営成績等の状況に関する認識および分析・検討内容
イ.財政状態の分析
当連結会計年度末の総資産は、前期末に比べて2,988百万円増加して195,570百万円(前期末比1.6%増)となり
ました。
流動資産は、前期末に比べて586百万円減少して107,667百万円(前期末比0.5%減)となりました。これは主
に、受取手形、売掛金及び契約資産が前期末に比べて3,289百万円増加し42,252百万円、仕掛品が前期末に比べ
て449百万円増加し6,633百万円となった一方で、未収入金を含むその他流動資産が前期末に比べて1,213百万円
減少し3,358百万円、現金及び預金が前期末に比べて1,028百万円減少し24,491百万円、原材料及び貯蔵品が前期
末に比べて947百万円減少し11,318百万円、電子記録債権が前期末に比べて807百万円減少し5,161百万円となっ
たことなどによるものです。
有形固定資産は、前期末に比べて548百万円減少して52,538百万円(前期末比1.0%減)となりました。これは主
に、当連結会計年度における設備投資実施額が7,568百万円となった一方で、減価償却費8,077百万円および減損
損失957百万円を計上したことなどによるものです。
投資その他の資産は、前期末に比べて3,912百万円増加して33,225百万円(前期末比13.3%増)となりました。
これは主に、投資有価証券が前期末に比べて2,687百万円増加して29,376百万円、退職給付に係る資産が前期末
に比べて582百万円増加し920百万円となったことなどによるものです。
流動負債は、前期末に比べて4,353百万円減少して47,204百万円(前期末比8.4%減)となりました。これは主
に、短期借入金が前期末に比べて1,700百万円増加し8,400百万円になった一方で、電子記録債務が前期末に比べ
て3,539百万円減少し10,027百万円、支払手形及び買掛金が前期末に比べて1,623百万円減少し13,270百万円、未
払金が前期末に比べて798百万円減少し2,791百万円となったことなどによります。
固定負債は、前期末に比べて2,360百万円減少して24,848百万円(前期末比8.7%減)となりました。これは主
に、製品保証引当金が前期末に比べて983百万円増加して4,769百万円となった一方で、長期借入金が前期末に比
べて2,500百万円減少し13,250百万円、退職給付に係る負債が前期末に比べて659百万円減少し802百万円となっ
たことなどによるものです。
利益剰余金は、親会社株主に帰属する当期純利益を6,310百万円計上、配当金の支払いを2,417百万円行ったこ
とで、前期末に比べて3,893百万円増加して64,719百万円となりました。その他有価証券評価差額金は、前期末
に比べて2,812百万円増加して13,584百万円となりました。また、為替換算調整勘定は、前期末に比べて2,467百
万円増加して13,655百万円となりました。
23/110
EDINET提出書類
ニチコン株式会社(E01904)
有価証券報告書
自己株式の期末残高は、前期末に比べて0百万円増加して3,498百万円となりました。
以上の結果、純資産は前期末に比べて9,702百万円増加して123,517百万円(前期末比8.5%増)となりました。
直近3事業年度の自己資本比率および時価ベースの自己資本比率は次のとおりです。
2024年3月期
2025年3月期
2026年3月期
自己資本比率(%)
53.6
57.3
61.2
時価ベースの
自己資本比率(%)
42.5
42.7
58.9
(注)1.自己資本比率:自己資本/総資産
2.時価ベースの自己資本比率:株式時価総額/総資産
ロ.経営成績の分析
a.売上高、営業利益
セグメントごとの経営成績は、「(1)経営成績等の状況の概要」に記載のとおりです。
b.親会社株主に帰属する当期純利益
営業外損益項目では、為替差益を964百万円(前期は1,203百万円)計上し、営業利益の増益により経常利益は前期
に比べて815百万円増加し8,326百万円(前期比10.9%増)となりました。
特別損益項目では、特別利益として投資有価証券売却益を958百万円(前期は2,645百万円)計上し、特別損失には
事業構造改革費用を1,252百万円(前期は2,087百万円)、投資有価証券評価損を799百万円(前期はなし)計上しまし
た。これらの結果、親会社株主に帰属する当期純利益は前期に比べ433百万円増加し6,310百万円(前期比7.4%増)
となりました。
ハ.キャッシュ・フローの状況の分析
当連結会計年度末における現金及び現金同等物(以下「資金」という。)の残高は、前連結会計年度末に比べ
1,078百万円減少し24,441百万円となりました。
変動要因は「第2 事業の状況 4経営者による財政状態、経営成績及びキャッシュ・フローの状況の分析
(1)経営成績等の状況の概要 ②キャッシュ・フローの状況」に記載のとおりです。
なお、営業活動によるキャッシュ・フローから投資活動によるキャッシュ・フローを差し引いたフリー・
キャッシュ・フローは、1,606百万円のプラスとなりました。資金調達の方法および状況ならびに資金需要の動
向については次項「ニ.資本の財源及び資金の流動性」に記載のとおりです。
ニ.資本の財源及び資金の流動性
当社グループの主な資金需要は、設備投資、改修等に係る投資資金や、当社製品製造のための人件費や経費、
材料および部品などの製造費用、研究開発費を含む販売費及び一般管理費等の運転資金です。
これらに必要な資金の主な源泉は、営業活動によるキャッシュ・フロー、金融機関からの借入による資金調達
により対応します。
当社グループは、手許資金ならびに間接金融による資金調達を実施し、事業の拡大に必要な資金の流動性を確
保できるものと考えています。
ホ.経営上の目標の達成状況を判断するための客観的な指標等
翌期(2027年3月期)の経済環境の見通しは、中東情勢による原材料・諸資材の調達難と価格高騰、エネル
ギー価格の高止まりや物流網の混乱をはじめ、経済安全保障体制の懸念、政策金利の上昇や急激な為替変動、さ
らにロシア・ウクライナ情勢や米国関税問題など不確定要素が多く、世界経済の先行きは極めて不透明な状況が
続いています。
当社グループにおいては、重点4市場と位置付ける「エネルギー・環境・医療機器」「自動車・車両関連機
器」「白物家電・産業用インバータ機器」「情報通信機器」の各市場ともに、素材価格の上昇圧力があるもの
の、情報通信分野、車載・車両分野、環境関連分野の需要は拡大する見通しです。
24/110
EDINET提出書類
ニチコン株式会社(E01904)
有価証券報告書
当連結会計年度の期初計画の達成状況は以下のとおりです。
指標
当連結会計年度
(計画)
当連結会計年度
(実績)
当連結会計年度
(計画比)
売上高(百万円)
180,000
169,724
△10,275(△5.7%)
営業利益(百万円)
6,000
6,456
456(7.6%)
営業利益率(%)
3.3
3.8
0.5ポイント
経常利益(百万円)
7,000
8,326
1,326(19.0%)
親会社株主に帰属する当期純利益
(百万円)
6,000
6,310
310(5.2%)
当社グループは、2021年11月に公表した中期成長目標「Vision 2025」において、2026年3月期を最終年度と
し、売上高2,000億円および営業利益率10%以上の達成を目標として取り組んできました。最終年度である当連
結会計年度については、売上高は169,724百万円、営業利益率は3.8%となり、いずれも中期成長目標は未達とな
りました。一方で、営業利益、経常利益および親会社株主に帰属する当期純利益については期初計画を達成し、
経常利益は5期連続で計画を達成することができました。中期計画目標に対する当連結会計年度の実績は以下の
とおりです。
指標
2026年3月期
(当連結会計年度)
2026年3月期
(「Vision 2025」最終年度)
売上高(百万円)
169,724
2,000億円
営業利益率(%)
3.8
10%以上
設備投資額(百万円)
7,568
年間100億円以上
連結配当性向(%)
39.4
30%以上
5【重要な契約等】
該当事項はありません。
6【研究開発活動】
当社グループは、アルミ電解コンデンサ、導電性高分子アルミ固体電解コンデンサ、導電性高分子ハイブリッドア
ルミ電解コンデンサ、フィルムコンデンサ、小形リチウムイオン二次電池等の電子デバイスを主体としたコンデンサ
事業と、家庭用/公共・産業用蓄電システム、EV・PHEV用急速充電器、V2Hシステムの環境関連製品、スイッチング電
源、機能モジュール、研究・医療・産業用特殊電源等の回路製品を主力製品としたNECST事業を展開し、「エネル
ギー・環境・医療機器」、「自動車・車両関連機器」、「白物家電・産業用インバータ機器」、「情報通信機器」の
4市場を重点分野と定め、高信頼性、高安全性、高機能性を追求し、競争力に優れる新製品開発により社会課題の解
決に貢献し、既存事業の拡大と新規事業の創出に努めています。
当連結会計年度におけるグループ全体の研究開発費は7,279百万円であり、セグメントごとの内訳は、コンデンサ
事業2,357百万円、NECST事業4,921百万円です。
セグメント区分ごとの研究開発状況は、次のとおりです。
(1)コンデンサ事業
①アルミ電解コンデンサは、カーボンニュートラルを目指して急速に電動化が進む「自動車・車両関連機器」向
け、また高度化するネットワーク社会においては生成AIサーバーなど「情報通信機器」向けで需要が拡大する導
電性高分子アルミ固体電解コンデンサおよび導電性高分子ハイブリッドアルミ電解コンデンサの開発に取り組み
ました。さらに情報通信機器や各種インフラ装置に電力を供給するために不可欠な高性能電源、省力化ロボット
などの産業用インバータ、EV(電気自動車)・PHEV(プラグインハイブリッド)において不可欠なOBC(車載充
電器)に向けたアルミ電解コンデンサにおいては、小形・高容量化、高温度対応、長寿命化による商品力強化に
取り組みました。
これらの研究成果として、導電性高分子アルミ固体電解コンデンサにおいては、AIサーバー、通信基地局など
の情報通信機器で課題になっているデータ処理量増加に伴う消費電力増加、機内温度上昇といった市場ニーズに
対して、業界最高水準の125℃ 12,000時間保証のチップ形導電性高分子アルミニウム固体電解コンデンサ「PCY
シリーズ」を市場投入、情報通信機器におけるデータ処理の高度化、高信頼化に貢献します。
導電性高分子ハイブリッドアルミ電解コンデンサでは、xEV(EV、HEV、PHEV、FCEV)のみならずICE(内燃機
関)も含めて電動化が急速に進んでいます。これら各種ECUでは小形化、高性能化が進んでおり、搭載コンデン
サに対してさらなる高容量化、大電流対応を求めるニーズが高まっており、当社は従来の標準シリーズ「GYAシ
25/110
EDINET提出書類
ニチコン株式会社(E01904)
有価証券報告書
リーズ」から3ランク上の高容量化と最大1.8倍の高リプル化を実現した「GYGシリーズ」を開発しました。特に
大電流対応が求められているEPS(電動パワーステアリング)、EWP(電動ウォーターポンプ)、EOP(電動オイ
ルポンプ)といった用途において機器の小形化、軽量化へ貢献します。
アルミ電解コンデンサでは、車載関連機器用途で要求が高まっている高リプル電流重畳保証のリード線形アル
ミニウム電解コンデンサ「UTFシリーズ」を開発しました。コンデンサに出し入れ可能な充放電電流を表す許容
リプル電流値を最大51.1%向上させました。EV、PHEVに不可欠なOBC(車載充電器)では搭載電池の大容量化を
背景に短時間充電が求められており、大電流対応コンデンサはこの実現に貢献します。また、情報通信分向け製
品として、通信基地局用電源では、部品実装の高密度化およびデータ通信量の増加による高出力化に伴い電源内
部の高温度化が進んでおり、この市場ニーズに対応すべく、従来シリーズに対して2.5倍の長寿命化を図った125
℃ 5,000時間保証の「UBRシリーズ」を開発、市場投入しました。
②小形リチウムイオン二次電池「SLBシリーズ」は、異常時にも発煙発火の可能性が極めて低い特長が評価されて
2019年の販売開始以来、累計5,000万個以上を出荷する小形二次電池市場におけるベストセラー製品です。現
在、カーボンニュートラルに向け、使い捨て一次電池から自然界のエネルギーを電気に変換する「環境発電」と
「二次電池」の組み合わせへの置き換え検討が進行しており、電池には極低温から高温まで対応できる広範な温
度耐久性が求められています。この市場ニーズに対して、製品の使用温度範囲を従来製品の最高使用温度60℃か
ら80℃に高めた高温耐久品を開発しました。従来電池を使用することが難しかった環境、用途への採用拡大を見
込んでいます。
③フィルムコンデンサは、xEVに搭載される走行用モータの駆動インバータに不可欠なDC-LINKコンデンサ用途で需
要が引き続き拡大しています。当社は主要材料である金属蒸着フィルムを自社開発する強みを活かして、高耐電
圧化、大電流対応を実現、車種ごとに形状、搭載性を考慮したモジュール設計技術をさらに進化させたことで、
国内外メーカーの多くの車種に採用されています。大容量電池を搭載するEVでは、充電時間短縮を背景とした
800V以上の高電圧化ニーズ、SiC(シリコンカーバイド)などパワー半導体の進化に伴い、125℃を超える高温度
化ニーズが見込まれることから、当社はフィルム材料の性能向上や蒸着パターン技術の開発、DC-LINKコンデン
サ本体と周辺部品も融合させ高度なモジュール化技術を実現するための製法、設備など、生産技術開発にも注力
しています。
④電力・機器用コンデンサでは、防災形進相コンデンサ「GeoDRY®」をはじめ、受変電高圧側、または末端低圧負
荷側に設置される用途に各種進相コンデンサとその附属機器をラインアップしています。進相コンデンサは、社
会インフラを支えるために製品安全性を最優先に、誘電体絶縁破壊時に自己回復する信頼性の高い「金属蒸着電
極(SH)コンデンサ」を全機種に採用しています。附属機器は、省エネルギー化を目的としてさらに導入が進む
インバータ機器から発生する高調波電流に起因した電力系統の電圧ひずみや、お客さまの配電系統における高調
波電流障害から設備や電気機器を保護するため高調波継電器を市場投入、高調波障害から電気機器を守るととも
に、電力バックアップや電力供給の安定化に寄与する瞬時電圧低下/停電補償装置などの関連装置を取り揃え、
BCP対策をはじめ総合的に高品位な電力の安定化を提案しています。
(2)NECST事業
当社グループは、「価値ある製品を創造し、明るい未来社会づくりに貢献」することを経営理念に掲げ、その
具現化を目指して、再生可能エネルギーの普及、エネルギーの地産地消、EVやPHEVなどの次世代自動車とそのイ
ンフラの普及を目指した取り組みを進めています。
2020年10月に日本政府が発表した方針において、2050年にカーボンニュートラルを目指すことを掲げ、環境関
連政策を重視する姿勢を明確にしました。激しく世界情勢が変化する中で、ガソリン車からEVへのシフトの各国
方針で見直されるケースが見受けられますが、EV化の波は大きくなる方向にあります。日本においてはEVや充電
インフラ設備の購入および設置費用に対して政府や地方自治体から様々な導入支援策が出され、それに伴い
V2H、急速充電器の需要が広がってきています。この状況に対応する製品として当社は、新型EVパワー・ステー
ション(V2H)や大容量の急速充電器の開発、提供を進めています。また、運輸事業者の車両の電動化に対応す
べく、商用EV(EVバス、EVトラック)向け急速充電器「サイクリックマルチ充電器」を開発し、バス事業者への
納入そして運用が始まりました。
TCFDやCDPといった世界的な気候変動対策の広がりを受け、企業各社からはカーボンニュートラルに向けた具
体的な取り組みや計画が開始されており、企業の投資行動を後押しする国の支援策も多くなってきました。この
動向を先取りする製品として、公共・産業用蓄電システムにV2Hを3台直流リンクで接続したシステムを開発
し、再生可能エネルギーを効率よく使える装置として評価され、令和5年度の新エネルギー大賞を受賞すること
ができました。
家庭向けには、トライブリッド蓄電システム®の第3世代モデル「ESS-T5/T6シリーズ」の発売を開始しまし
た。太陽光発電の余剰電力を蓄電池とEV電池に同時充電でき、夜間や天候が悪い日は、それぞれに蓄えていた電
力を業界最大級9.9kWのトライブリッドパワコン®(ES-T6の場合)のパワフル出力で家に使うことが可能となり
ました。これまで当社が提案してきました「家産家消」をさらに進めるフラグシップモデルとして拡販を進めて
いきます。
26/110
EDINET提出書類
ニチコン株式会社(E01904)
有価証券報告書
2026年4月に政府が日本成長戦略会議で「戦略17分野」が公表されました。同分野の1つ「資源・エネルギー
安全保障・GX」分野に係る内容(水素等)として、水を電気分解して水素を製造するPEM型水電解装置の開発を
NEDO(国立研究開発法人新エネルギー・産業技術総合開発機構)の事業として山梨県や関連する複数の企業と共
に6年前から進めています。当社は水電解装置の整流用電源を開発、その成果を「500kWワンパックモデル」と
して製品化し、サントリー天然水南アルプス白州工場およびサントリー白州蒸溜所の脱炭素化に向けた実証を
行うため、日本最大の16MWのグリーン水素製造設備に組み込まれ、設置されました。今後は規模を拡大して効率
よく水素を発生するシステムの開発を進めます。また、同分野の1つ「フュージョンエネルギー」については、
フュージョンエネルギーの実用化を目指した原型炉の重要パーツの1つであるジャイロトロンの大電力電源を受
注し、設計・生産を進めています。
医療関係分野では、がん治療として注目されている粒子線(陽子線・重粒子線)治療向けの医療用加速器電源
の性能向上や、小型化など次世代の粒子線治療装置に求められる電源の開発に引き続き取り組みました。研究用
途の加速器電源では、国立研究開発法人理化学研究所放射光科学研究センター SPring-8(兵庫県)の高輝度化
(世界最高峰の放射光施設)などを目指した「SPring-8 II」計画の電源を受注し、設計に着手しました。
また、事務機器向けスイッチング電源関連では、新たな分野への展開を目指して技術開発を進めています。
(3)産学連携による研究開発
最近は技術の進歩が早く、最新の技術を取り入れた製品の開発には産学連携を効果的に活用することが重要に
なってきています。そうした状況の中、当社は、2016年9月に東京大学生産技術研究所と包括的な産学連携研究
協力協定を締結し、一定額のファンドを原資として複数のテーマをその道の専門家である教授陣と柔軟に共同研
究できる体制を構築しました。この共同研究実施にあたり当社技術者を東京大学生産技術研究所へ派遣し、コン
デンサの素材基礎開発からNECST事業の次世代ビジネスに関わるシミュレーションや、家庭用蓄電システムやV2H
の先進デザインにより、製品価値の向上とブランドイメージ確立を行っていきます。一方、次世代半導体として
期待され、一部に実用化が進んでいるSiCのモジュール化の開発においては、大阪大学などと共同開発を継続的
に行っており、NECST製品やサービスの要素開発やプラットフォーム構築、および製品開発に寄与しています。
また、2024年10月に長崎総合科学大学と「未来志向グリーンエネルギー変換ニチコン共同研究講座」を設置しま
した。電力変換器の効率改善だけでなく、負荷の変動に応じて電力変換器を最適動作させるEMS(エネルギーマ
ネジメントシステム)の開発と機器の開発効率を向上させるためのシミュレーション技術の構築を目指します。
こうした産学連携を継続することで大学の教員と当社社員との交流を通じて知のネットワークが広がりつつあり
ます。
27/110
EDINET提出書類
ニチコン株式会社(E01904)
有価証券報告書
第3【設備の状況】
1【設備投資等の概要】
当社グループは、新規事業の成長を見据えた技術・開発投資や当社のコア事業である車載関連機器向けおよび情報
通信機器向けのアルミ電解コンデンサやxEV向けフィルムコンデンサの生産能力増強、NECST事業の新製品強化などを
中心に7,568百万円の設備投資を実施しました。
当連結会計年度の設備投資(有形固定資産および無形固定資産)は、次のとおりとなりました。
セグメント
当連結会計年度(百万円)
前期比(%)
コンデンサ事業
6,001
65.6
NECST事業
1,566
79.3
7,568
68.0
合計
2【主要な設備の状況】
当社グループ(当社および連結子会社)における主要な設備は、以下のとおりです。
(1)提出会社
関係会社に賃貸している主要な設備は、次のとおりです。
(2026年3月31日現在)
帳簿価額(百万円)
会社名
事業所名
所在地
ニチコン製箔㈱
長野県
大町市他
コンデンサ事業
生産工場土地建物
2,311
−
ニチコン草津㈱
滋賀県
草津市
コンデンサ事業
NECST事業
生産工場土地建物
1,224
−
ニチコン亀岡㈱
京都府
亀岡市
NECST事業
生産工場土地建物・設備
1,357
140
ニチコン大野㈱
福井県
大野市他
コンデンサ事業
生産工場土地建物
430
0
ニチコン岩手㈱
岩手県
岩手郡他
コンデンサ事業
生産工場土地建物
1,216
−
セグメント
設備の内容
建物及び構
築物
土地
機械装置及
び運搬具
(面積千㎡)
その他
1,214
0
3,526
3
1,734
0
1,512
−
988
2
1,397
(140)
507
(97)
14
(37)
557
(90)
合計
177
(68)
(注)帳簿価額のうち「その他」は、工具、器具及び備品、建設仮勘定です。
(2)国内子会社
(2026年3月31日現在)
帳簿価額(百万円)
会社名
事業所名
所在地
ニチコン製箔㈱
長野県
大町市他
コンデンサ事業
ニチコン草津㈱
滋賀県
草津市
ニチコン大野㈱
ニチコン岩手㈱
セグメント
設備の内容
建物及び
構築物
機械装置
及び運搬
具
生産設備など
212
1,687
コンデンサ事業
NECST事業
生産設備など
122
1,615
福井県
大野市他
コンデンサ事業
生産設備など
916
3,410
岩手県
岩手郡他
コンデンサ事業
生産設備など
2,191
6,269
土地
(面積千㎡)
−
(−)
−
(−)
52
(18)
7
(0)
その他
合計
634
2,534
283
341
2,080
418
782
5,162
784
915
9,384
448
(注)帳簿価額のうち「その他」は、工具、器具及び備品、リース資産および建設仮勘定です。
28/110
従業
員数
(人)
EDINET提出書類
ニチコン株式会社(E01904)
有価証券報告書
(3)在外子会社
(2026年3月31日現在)
帳簿価額(百万円)
会社名
事業所名
ニチコン(マ
レーシア)セン
ディリアン バ
ハッド
所在地
セグメント
設備の内容
建物及び
構築物
機械装置
及び運搬
具
マレーシア
セランゴー
ル州
コンデンサ事業
NECST事業
生産設備など
1,986
2,226
中国
無錫市
コンデンサ事業
NECST事業
生産設備など
720
899
中国
宿遷市
コンデンサ事業
生産設備など
2,528
408
土地
(面積千㎡)
−
(−)
その他
合計
従業
員数
(人)
3,003
7,216
486
122
1,742
368
209
3,147
576
ニチコン エレク
トロニクス(無
錫)カンパニー
−
(−)
リミテッド
ニチコン エレク
トロニクス(宿
遷)カンパニー
−
(−)
リミテッド
(注)帳簿価額のうち「その他」は、工具、器具及び備品および建設仮勘定等です。
3【設備の新設、除却等の計画】
当社グループの設備投資計画については、当社の戦略的事業への投資で、中長期的観点から今後とも成長が期待さ
れる自動車関連機器向けや情報通信機器向けなどのアルミ電解コンデンサ、xEV向けフィルムコンデンサおよびNECST
製品を中心に計画しています。
当連結会計年度末現在においては、上記製品に係る新製品開発、合理化、生産能力増強に向けた設備投資計画をコ
ンデンサ事業8,000百万円、NECST事業2,000百万円、合計10,000百万円を予定しています。
(1)重要な設備の新設等の計画
投資予定金額
会社名
事業所名
所在地
ニチコン大野㈱
福井県
大野市他
セグメント
コンデンサ事業
設備の内容
生産設備
着手及び完了予定年月
総額
既支払額
(百万円) (百万円)
1,554
(2)重要な設備の除却等の計画
該当事項はありません。
29/110
−
資金調達
方法
自己資金お
よび借入金
着手
完了
2026.1
2027.5
完成後の
増加能力
20%増加
EDINET提出書類
ニチコン株式会社(E01904)
有価証券報告書
第4【提出会社の状況】
1【株式等の状況】
(1)【株式の総数等】
①【株式の総数】
種類
発行可能株式総数(株)
普通株式
137,000,000
計
137,000,000
②【発行済株式】
事業年度末現在発行数(株)
(2026年3月31日)
種類
提出日現在発行数(株)
(2026年6月26日)
上場金融商品取引所名
又は登録認可金融商品
取引業協会名
内容
普通株式
70,000,000
70,000,000
東京証券取引所 プライム市場
単元株式数
100株
計
70,000,000
70,000,000
−
−
(2)【新株予約権等の状況】
①【ストックオプション制度の内容】
該当事項はありません。
②【ライツプランの内容】
該当事項はありません。
③【その他の新株予約権等の状況】
該当事項はありません。
(3)【行使価額修正条項付新株予約権付社債券等の行使状況等】
該当事項はありません。
(4)【発行済株式総数、資本金等の推移】
年月日
発行済株式
総数増減数
(株)
発行済株式
総数残高
(株)
資本金
増減額
(百万円)
資本金
残高
(百万円)
資本準備金
増減額
(百万円)
資本準備金
残高
(百万円)
2025年2月28日
(注)
△8,000,000
70,000,000
−
14,286
−
17,065
(注)上記の減少は、2025年2月6日開催の取締役会決議に基づく自己株式の消却によるものです。
(5)【所有者別状況】
(2026年3月31日現在)
株式の状況(1単元の株式数100株)
区分
政府およ
び地方公
共団体
金融機関
株主数
(人)
1
所有株式数
(単元)
所有株式数の
割合 (%)
個人
その他
計
単元未満
株式の状
況(株)
28
12,550
12,995
−
157,430
107
152,167
699,325
67,500
22.5
0.0
21.8
100.0
−
外国法人等
金融商品
取引業者
その他の
法人
35
27
167
187
27
311,139
8,380
70,075
0.0
44.5
1.2
10.0
個人以外
個人
(注)自己株式2,841,357株は「個人その他」の欄に28,413単元、「単元未満株式の状況」の欄に57株含まれ
ています。
30/110
EDINET提出書類
ニチコン株式会社(E01904)
有価証券報告書
(6)【大株主の状況】
(2026年3月31日現在)
氏名又は名称
住所
所有株式数
(千株)
発行済株式(自己
株式を除く。)の
総数に対する所有
株式数の割合
(%)
日本マスタートラスト信託銀行株式東京都港区赤坂1丁目8番1号
会社(信託口)
赤坂インターシティAIR
8,778
13.1
株式会社日本カストディ銀行(信託
東京都中央区晴海1丁目8−12
口)
4,758
7.1
ニチコン取引先持株会
京都市中京区烏丸通御池上る二条殿町5
51番地
ニチコン株式会社内
3,851
5.7
株式会社京都銀行
京都市下京区烏丸通松原上る薬師前町7
00番地
3,259
4.9
株式会社みずほ銀行
東京都千代田区大手町1丁目5番5号
2,690
4.0
日本生命保険相互会社
東京都千代田区丸の内1丁目6番6号
日本生命証券管理部内
2,670
4.0
STATE STREET BANK AND TRUST
ONE CONGRESS STREET, SUITE 1,
COMPANY 505001
BOSTON, MASSACHUSETTS
2,355
3.5
(常任代理人
決済営業部)
株式会社みずほ銀行 (東京都港区港南2丁目15−1
品川インターシティ)
株式会社三井住友銀行
東京都千代田区丸の内1丁目1番2号
2,200
3.3
株式会社三菱UFJ銀行
東京都千代田区丸の内1丁目4番5号
2,000
3.0
ニチコン従業員持株会
京都市中京区烏丸通御池上る二条殿町5
51番地
ニチコン株式会社内
1,605
2.4
−
34,168
50.9
計
(注)1.三井住友トラスト・アセットマネジメント株式会社から2022年6月6日付で公衆の縦覧に供されている
大量保有報告書の変更報告書において、同社およびその共同保有者である他1社が、2022年5月31日現
在3,230千株保有している旨、株式会社三菱UFJフィナンシャル・グループから2022年11月8日付で
公衆の縦覧に供されている大量保有報告書の変更報告書において、株式会社三菱UFJ銀行およびその
共同保有者である他2社が、2022年10月31日現在で3,161千株保有している旨、野村證券株式会社から
2023年2月22日付で公衆の縦覧に供されている大量保有報告書の変更報告書において、同社およびその
共同保有者である他2社が、2023年2月15日現在で3,465千株保有している旨、三井住友DSアセット
マネジメント株式会社から2024年4月22日付で公衆の縦覧に供されている大量保有報告書の変更報告書
において、同社およびその共同保有者である他2社が2024年4月15日現在3,236千株保有している旨、
株式会社みずほ銀行から2025年12月5日付で公衆の縦覧に供されている大量保有報告書の変更報告書に
おいて、同社およびその共同保有者である他2社が2025年11月28日現在で5,480千株保有している旨、
ならびにウエリントン・マネージメント・カンパニー・エルエルピーから2026年4月3日付で公衆の縦
覧に供されている大量保有報告書において、同社およびその共同保有者である他1社が、2026年3月31
日現在で2,840千株保有している旨、記載されているものの、いずれも当社として、実質所有株式数の
確認ができないため、2026年3月末日現在の株主名簿に基づき記載しています。
2.上表の日本マスタートラスト信託銀行株式会社(信託口)の所有株式数のうち、信託業務に係る株式数
は4,177千株です。それらの内訳は、年金信託組入分228千株、投資信託組入分3,949千株となっていま
す。株式会社日本カストディ銀行(信託口)の所有株式数のうち、信託業務に係る株式数は2,667千株
です。それらの内訳は、年金信託組入分85千株、投資信託組入分2,582千株となっています。
3.上記には含まれていませんが、当社は自己株式2,841千株を所有しています。
31/110
EDINET提出書類
ニチコン株式会社(E01904)
有価証券報告書
(7)【議決権の状況】
①【発行済株式】
(2026年3月31日現在)
区分
株式数(株)
議決権の数(個)
内容
無議決権株式
−
−
−
議決権制限株式(自己株式等)
−
−
−
議決権制限株式(その他)
−
−
−
完全議決権株式(自己株式等)
普通株式
2,841,300
−
−
完全議決権株式(その他)
普通株式
67,091,200
670,912
−
単元未満株式
普通株式
67,500
−
−
発行済株式総数
70,000,000
−
−
総株主の議決権
−
670,912
−
(注)「完全議決権株式(自己株式等)」欄は、全て当社保有の自己株式です。
②【自己株式等】
(2026年3月31日現在)
所有者の氏名又
は名称
所有者の住所
自己名義所有株
式数(株)
他人名義所有株
式数(株)
所有株式数の合
計(株)
発行済株式総数に対
する所有株式数の割
合(%)
京都市中京区烏丸
ニチコン株式会社
通御池上る二条殿
町551番地
2,841,300
−
2,841,300
4.1
計
−
2,841,300
−
2,841,300
4.1
2【自己株式の取得等の状況】
【株式の種類等】
会社法第155条第7号に該当する普通株式の取得
(1)【株主総会決議による取得の状況】
該当事項はありません。
(2)【取締役会決議による取得の状況】
該当事項はありません。
(3)【株主総会決議又は取締役会決議に基づかないものの内容】
区分
株式数(株)
価額の総額(円)
当事業年度における取得自己株式
602
902,369
当期間における取得自己株式
50
121,050
(注)当期間における取得自己株式には、2026年6月1日からこの有価証券報告書提出日までの単元未満株式の買
取りによる株式は含まれていません。
32/110
EDINET提出書類
ニチコン株式会社(E01904)
有価証券報告書
(4)【取得自己株式の処理状況および保有状況】
当事業年度
区分
当期間
株式数(株)
処分価額の総額
(円)
株式数(株)
処分価額の総額
(円)
引き受ける者の募集を行った取得自己株式
−
−
−
−
消却の処分を行った取得自己株式
−
−
−
−
合併、株式交換、株式交付、会社分割に係る
移転を行った取得自己株式
−
−
−
−
その他
−
−
−
−
2,841,357
−
2,841,407
−
保有自己株式数
(注)1.当期間における処理自己株式には、2026年6月1日からこの有価証券報告書提出日までの単元未満株式
の売渡請求による売渡は含まれていません。
2.当期間における保有自己株式数には、2026年6月1日からこの有価証券報告書提出日までの単元未満株
式の買取りおよび売渡による株式は含まれていません。
3【配当政策】
当社は、株主の皆様への利益還元を経営の重要課題と認識し、株主還元については、連結配当性向30%を目途に持
続的な利益成長に応じて配当を増加させる累進配当(1株当たりの年間配当金の前期実績に応じて、配当の維持また
は増配を行うこと)を基本とし、中間配当と期末配当の年2回の剰余金の配当を行うことを基本方針としています。
これらの剰余金の配当の決定機関は、期末配当については株主総会、中間配当については取締役会としています。
当事業年度の利益配当金につきましては、上記の方針に基づき前事業年度の年間配当35円から2円増配の1株当た
り37円(うち中間配当金18円)の配当を実施することを決定しました。
内部留保資金は、既存コア事業の拡大のための設備投資や顧客ニーズに対応する新製品開発のための研究開発投資
など、将来の企業価値を高めるための投資に活用してまいります。
当社は、「取締役会の決議により、毎年9月30日を基準日として、中間配当を行うことができる。」旨を定款に定
めています。
なお、当事業年度に係る剰余金の配当は以下のとおりです。
決議年月日
配当金の総額
(百万円)
1株当たり配当額
(円)
2025年11月5日
取締役会決議
1,208
18.0
2026年6月26日
定時株主総会決議
1,276
19.0
33/110
EDINET提出書類
ニチコン株式会社(E01904)
有価証券報告書
4【コーポレート・ガバナンスの状況等】
(1)【コーポレート・ガバナンスの概要】
①コーポレート・ガバナンスに関する基本的な考え方
当社は、「経営理念」に基づき、コーポレート・ガバナンスの強化を最重要課題のひとつと位置付け、透明
性・公平性を確保のうえ意思決定の迅速化など経営の効率化を進めています。事業環境や市場の変化に機動的に
対応して経営成績の向上に努めるとともに、内部統制システムの構築・強化およびその実効的な運用を通じて経
営の健全性を維持し、企業価値の継続的な向上と社会的責任を果たすため、次の基本方針に沿って、コーポレー
ト・ガバナンスの充実に取り組んでいます。
(1)株主の権利を尊重し、平等性を確保する。
(2)株主を含むステークホルダーの利益を考慮し、それらステークホルダーと適切に協働する。
(3)会社情報を適切に開示し、透明性を確保する。
(4)取締役会は、株主に対する受託者責任・説明責任を踏まえ、独立社外取締役の役割を重視し、客観的な立
場からの業務執行監督機能の実効化を図る。
(5)会社の持続的成長と中長期的な企業価値の向上に資するよう、株主との間で建設的な対話に努める。
②企業統治の体制の概要および当該体制を採用する理由
会社の経営上の意思決定、執行および監査に係る経営管理組織その他のコーポレート・ガバナンス体制の状況
は下記のとおりです。
イ.会社の機関の内容
当社の取締役会は、社外取締役5名を含む8名で構成されており、取締役会において重要な業務執行の決定
ならびに取締役の職務執行の監督を行っています。
取締役会の運営においては、意思決定の迅速化を図るために取締役会を定期的に開催し、十分な協議により
公正かつ的確な決定を行うとともに、その担当取締役の業務執行の状況を監督しています。また、経営の監督
機能と業務執行機能の役割を明確にするため執行役員制度を導入しており、業務分掌・職務権限の明確化と業
務部門毎の特性に応じた機動的な意思決定により、経営の迅速化と適正かつ効率的な業務執行を図っていま
す。
当社は、取締役の指名および報酬等に関する手続きの公正性・透明性・客観性を確保し、コーポレート・ガ
バナンス体制の一層の充実を図ることを目的に取締役会の諮問機関として指名・報酬委員会を設置していま
す。指名・報酬委員会の委員はその過半数を社外役員で構成しており、指名・報酬決定に係るプロセスの独立
性・客観性の向上を図っています。
社外監査役2名を含む監査役4名(内3名が常勤監査役)は、取締役会その他重要な会議に出席して意見を述
べるほか、取締役の業務執行および当社の業務や財産の状況の調査を基に、適法性監査を行っています。ま
た、監査役が法定の員数を欠くに至った場合に備えるため、あらかじめ補欠監査役制度を導入しています。
ロ.内部統制システムの整備の状況
当社は、会社法第362条第4項第6号および会社法施行規則第100条の規定により、業務の適正を確保するた
めの体制として、取締役会で決議した事項は次のとおりです。
Ⅰ.取締役・使用人の職務の執行が法令および定款に適合することを確保するための体制
a.当社および当社グループ会社の取締役および使用人が「経営理念」を具現化していくために、法令・定
款および社内規則はもとより、健全な社会規範、倫理規範を守り、「ニチコングループ行動規範」
(2002年10月制定・2013年4月・2024年4月に改訂)に則った職務を遂行し、企業風土の醸成と教育・啓
発活動の推進に努めています。なお、改訂後の行動規範では、レスポンシブル・ビジネス・アライアン
ス(RBA)における行動規範(旧:EICC(電子業界行動規範))が求める労働、環境保全、安全衛生、倫
理などの要求事項を反映させています。
これらを確保するための体制として、代表取締役社長を委員長とする「サステナビリティ推進委員会」
を設置しています。
b.コンプライアンス体制は、各種会議や朝礼等による啓発活動・教育を定期的に行い、その確保に努めて
います。また、内部通報制度(コンプライアンス・ホットライン)を設けるとともに、サステナビリティ
推進委員会のコンプライアンス・リスク管理委員会が法令・規程・ルール等の遵守体制の整備と、コン
プライアンスに関わる学習教材を定期的に配布するなどの啓発に努めています。
c.内部監査室は、定期的に当社および当社グループ会社の内部監査を実施する際に、コンプライアンスの
周知徹底と統制環境の確認を行っています。
d.監査役は、当社および当社グループ会社の法令・定款等の遵守体制に問題があると認めたときは、意見
を述べるとともに、改善策の策定を求めることができる体制としています。
34/110
EDINET提出書類
ニチコン株式会社(E01904)
有価証券報告書
e.市民社会の秩序や安全を脅かす反社会的勢力および団体に対しては断固たる態度をとり、一切関係を持
たないこと、活動を助長するような行為をしないことを「ニチコングループ行動規範」に定め、正しく
公正な企業であり続けることを宣言しています。対応統括部署の設置、情報の収集、外部専門機関との
連携および社内での啓発活動などにより、毅然とした態度で臨んでいます。
Ⅱ.取締役の職務の執行に係る情報の保存および管理に関する体制
当社および当社グループ会社の取締役の職務の執行に係る情報の保存および管理については、「情報セ
キュリティ基本方針」に基づく「情報管理規程」「文書管理規程」等の充実化を図っています。これらの
関連規程に基づき、取締役の職務の執行に係る情報が記載された文書(電磁的記録を含む。)を記録する
とともに、その取扱いについては適切に検索性の高い状態で保存および管理の運用を行っています。
Ⅲ.損失の危険の管理に関する規程その他の体制
a.当社および当社グループ会社は、損失・リスクをあらかじめ回避するとともに、万一リスクが発生した
場合にもその被害を最小限に抑制することを目的とした「リスクマネジメント規程」を制定し、運用し
ています。
b.損失・リスクから会社を守り、社会からの信頼を維持するための組織として、代表取締役社長を委員長
とする「サステナビリティ推進委員会」を設置しています。損失やリスクの危険の管理については、当
委員会のコンプライアンス・リスク管理委員会が総務部と連携して全社リスクの定期的な集約・評価を
行い、実施状況の確認を行っています。また、使用人に対するリスクマネジメントに関する教育・訓練
も実施しています。
事業における損失・リスクには法令遵守、人権・労働、安全・衛生、災害、品質、環境、情報、輸出管
理、与信等がありますが、企業経営に重大な影響を及ぼすこれらリスクの排除・軽減を図る体制も構築
しています。
c.また、災害等の発生に備え、生命の安全確保・安否確認体制を整備するとともに、重要業務の継続・中
断した場合を想定し、早期復旧を目指せる体制、事業継続計画(BCP)および事業継続マネジメント(BCM)
の見直しと追加構築に取組んでいます。
d.財務報告の正確性と信頼性を確保するために、関連する法令等に従って内部統制活動の実施状況を評価
し確認することにより、リスク管理を実効性のあるものとしています。これを確保するための体制とし
て、代表取締役社長を委員長とする「内部統制推進委員会」を設置しています。
Ⅳ.取締役の職務の執行が効率的に行われることを確保するための体制
a.当社は、取締役による意思決定の迅速化と効率的な業務執行を行うために、取締役会の少人数化と、会
議の随時開催による迅速かつ適正な決定を図っています。
取締役会は、定期的に業務執行の進捗状況を評価し、改善策を策定し、全社的な業務執行の効率化を実
現する体制を構築しています。
一方、経営の監督機能と業務執行機能の役割を明確にするために、執行役員制度を導入しており、業務
分掌・職務権限の明確化と業務部門毎の特性に応じた機動的な意思決定により、経営の迅速化と適正か
つ効率的な業務執行を図っています。
b.当社および当社グループ会社の取締役および使用人において、各職位の職務および責任権限ならびに各
組織単位の業務分掌について定めた「職務分掌規程」「職務規程」「関係会社管理規程」を制定し効率
的経営を行うとともに、それに従った職務・責任体制で業務が行われているかどうか、定期的に監査し
ています。
Ⅴ.当社および子会社から成る企業集団における業務の適正を確保するための体制
当社および当社グループ会社では、コンプライアンスの推進、遵法精神の啓発、企業倫理意識の育成、
リスクマネジメントの周知徹底および社会的責任の遂行などを、グループ共通の価値観として共有するよ
う努めています。
また、「関係会社管理規程」「財務報告に係る内部統制規程」に基づき、当社とグループ会社間で管
理・指導・報告などの連携を密にし、内部統制システムの推進はもとより、ニチコングループとしての事
業活動の健全性・効率性ならびに財務報告の信頼性の確保のために、業績状況、決算状況などについて、
定期的・継続的に当社へ報告させています。
監査役および内部監査室は、当社および当社グループ会社の業務執行状況について監査や診断等を実施
し、その結果を取締役会に報告しています。
Ⅵ.監査役の職務を補助すべき使用人に関する体制および当該使用人の取締役からの独立性に関する事項なら
びに当該使用人に対する指示の実効性の確保に関する事項
監査役室には、監査役の職務を補助すべき使用人を取締役と監査役会が協議のうえ選任し配置していま
す。当該使用人は監査役の指揮命令下に置くものとし、その人事については、任命・異動・評価・賃金等
も含め、監査役会と事前に協議を行い、同意を得たうえで決定するものとし、取締役からの独立性を確保
しています。
Ⅶ.取締役・使用人が監査役に報告するための体制その他の監査役への報告に関する体制およびその他監査役
の監査が実効的に行われることを確保するための体制
35/110
EDINET提出書類
ニチコン株式会社(E01904)
有価証券報告書
当社および当社グループ会社の取締役および使用人は、会社に著しい影響を及ぼす事実が発生したとき
は、遅滞なく監査役に報告を行うこととしています。
監査役は当社および当社グループ会社の取締役および使用人に対し、必要に応じて随時報告を求めるこ
とができるものとしています。
監査役は当社および当社グループ会社の重要な会議等に出席して意見を述べるほか、必要に応じて取締
役または使用人に重要書類、稟議書等の閲覧、報告を求めることができる体制を確保しています。また、
取締役の業務執行、当社および当社グループ会社の業務や財産の状況の調査、重要案件の稟議書の閲覧な
どにより監査を行っています。
監査役は監査の実効性を高めるため、会計監査人および内部監査室から定期にあるいは必要に応じて内
部監査の状況報告を受けています。
なお、前記に従い監査役への報告を行った当社および当社グループ会社の取締役および使用人に対し
て、不利益な取扱いを行うことはいたしません。
Ⅷ.業務の適正を確保するための体制の運用状況の概要
a.当事業年度において、社外取締役5名を含む取締役8名で構成される取締役会を10回開催し、法令、定
款および取締役会規則に定められた経営上重要な事項の決定および業務執行の報告を行いました。ま
た、重要な全社規程の見直し改訂を行いました。
b.代表取締役会長、代表取締役社長、取締役、執行役員、本社の幹部職員および各拠点長をメンバーとす
る経営会議等を23回開催し、事業計画の推進、進捗管理、重要な業務推進上の報告・討議等を行いまし
た。
c.当事業年度において、社外監査役2名を含む監査役4名で構成される監査役会を12回開催し、監査活動
の報告、意見交換を行いました。監査役は、取締役会をはじめ重要な会議へ出席するほか、当社および
当社グループ会社の経営上重要な事項について、取締役や使用人からの報告や稟議書等の閲覧、実地調
査による監査等により事業課題やリスク等を把握し、必要に応じて助言を行いました。また、三様監査
(監査役監査、会計監査人監査、内部監査)を行っており、監査役、会計監査人および内部監査室は情
報交換を行い、相互の連携を図りました。
d.執行部門から独立した組織である内部監査室は、コンプライアンス強化に資することを目的として当社
および当社グループ会社の内部監査を実施し、取締役会や監査役会に報告を行いました。
e.代表取締役社長を委員長とし、経理本部、管理本部ならびにデジタル化推進本部の幹部職員を委員とす
る内部統制推進委員会は、財務報告の正確性と信頼性を確保するため、「全社統制」「決算財務報告プ
ロセス統制」「業務プロセス統制」「IT全般統制」「IT業務処理統制」の各項目に関して当社および当
社グループ会社の定期的評価を行い、取締役会や監査役会に報告を行いました。
f.サステナビリティ推進委員会は、「環境・エネルギー」「コンプライアンス・リスク管理」「ダイバー
シティ」の3委員会で構成され、毎月合同で会議を開催し当社および当社グループ会社の持続的な成長
や企業の社会的責任に関する課題の進捗の促進を図るとともに、状況等について取締役会や監査役会に
報告を行いました。
36/110
EDINET提出書類
ニチコン株式会社(E01904)
有価証券報告書
当社のコーポレート・ガバナンス体制の整備の状況の模式図は次のとおりです。
③企業統治に関するその他の事項
イ.取締役および監査役の責任免除
当社は、会社法第426条第1項の規定により、取締役会の決議をもって、同法第423条第1項の取締役(取締役
であった者を含む。)および監査役(監査役であった者を含む。)の損害賠償責任を、法令の限度において免除
することができる旨を定款に定めています。これは、取締役および監査役が職務を遂行するにあたり、その能力
を十分に発揮して、期待される役割を果たし得る環境を整備することを目的とするものです。
37/110
EDINET提出書類
ニチコン株式会社(E01904)
有価証券報告書
ロ.取締役の定数
当社の取締役は、10名以内とする旨を定款に定めています。
ハ.取締役の選任および解任の決議要件
当社は、取締役の選任決議は、議決権を行使することができる株主の議決権の3分の1以上を有する株主が出
席し、その議決権の過半数をもって行う旨および累積投票によらない旨を定款に定めています。
また、解任決議は、会社法第309条第2項に定める株主総会の特別決議要件として、議決権を行使することが
できる株主の議決権の3分の1以上を有する株主が出席し、その議決権の3分の2以上をもって行う旨を定款に
定めています。
ニ.株主総会決議事項を取締役会で決議することができることとした事項およびその内容
Ⅰ.当社は、機動的な資本政策を図るため、自己の株式の取得を取締役会決議により行うことができる旨を定款
に定めています。
Ⅱ.当社は、株主への機動的な利益還元を行うため、会社法第454条第5項の規定により、取締役会決議によっ
て毎年9月30日を基準日として、中間配当を行うことができる旨を定款に定めています。
ホ.株主総会の特別決議要件
当社は、会社法第309条第2項に定める株主総会の特別決議要件について、議決権を行使することができる株
主の議決権の3分の1以上を有する株主が出席し、その議決権の3分の2以上をもって行う旨を定款に定めてい
ます。これは、株主総会における特別決議の定足数を緩和することにより、株主総会の円滑な運営を行うことを
目的とするものです。
38/110
EDINET提出書類
ニチコン株式会社(E01904)
有価証券報告書
ヘ.取締役会の活動状況
当事業年度における当社の取締役会の活動状況は次のとおりです。
地位
氏名
一平
出席状況
代表取締役会長
武田
代表取締役社長
森
取締役上席執行役員専務
近野
斉(注2)
100%(2/2回)
取締役執行役員専務
矢野
明弘
100%(10/10回)
社外取締役
松重
和美
100%(10/10回)
社外取締役
相亰
重信(注2)
100%(2/2回)
社外取締役
加藤
治彦
90%(9/10回)
社外取締役
栗本
知子
100%(10/10回)
社外取締役
谷口
宗哉(注1)
100%(8/8回)
社外取締役
池坊
専好(注1)
100%(8/8回)
常勤監査役
吉田
茂雄
100%(10/10回)
常勤監査役
上野
精也
100%(10/10回)
常勤監査役(社外監査役)
中谷
吉彦
100%(10/10回)
社外監査役
伝川
幹
100%(10/10回)
100%(10/10回)
克彦
100%(10/10回)
(注)1.社外取締役谷口宗哉および社外取締役池坊専好は、2025年6月27日開催の第90回定時株主総会に
より選任されており、就任以降開催された出席状況を記載しています。
2.取締役上席執行役員専務近野斉および社外取締役相亰重信は、2025年6月27日開催の第90回定時
株主総会終結の時をもって退任しており、退任までの出席状況を記載しています。
取締役会では、法令、定款および取締役会規則に定められた経営上重要な事項の決定および業務執行の報告を
行いました。また、重要な全社規程の見直し改訂を行いました。
④責任限定契約の内容の概要
当社は、会社法第427条第1項の規定により、社外取締役および社外監査役との間で同法第423条第1項の損害
賠償責任について、同法第425条第1項各号に定める金額の合計額を限度とする旨の契約を締結しています。
イ.被保険者の範囲および保険料
当社および子会社の取締役、監査役および執行役員(契約後に就任した者を含みます)を被保険者としていま
す。保険料については、当社および一部の子会社については、役割に応じて按分した保険料を個人負担とし、そ
れ以外は全額会社負担としています。
ロ.塡補の対象となる保険事故の概要
被保険者が職務遂行に起因して損害賠償請求がなされたことにより、被保険者が被る損害賠償額や争訟費用等
を填補するものです。ただし、贈収賄などの犯罪行為や意図的に違法行為を行った役員自身は補償対象外とする
ことにより、役員等の職務遂行の適正性が損なわれないように措置を講じています。
⑤株式会社の支配に関する基本方針について
当社は、「より良い地球環境の実現に努め、価値ある製品を創造し、明るい未来社会づくりに貢献していくこ
と」を経営理念に掲げています。また、倫理的・社会的責任を果たすとともに、株主の皆様をはじめとする全て
の人々を大切にし、企業価値の最大化を目指して、「誠心誠意」をもって「考働」しています。
この経営理念に基づき、会社の支配に関する基本方針として、当社に対し買収提案が行われた場合は、これを
受け入れるか否かの最終的な判断は、その時点における当社株主の皆様に委ねられるべきであり、またその場合
に株主の皆様が、十分な情報と相当な検討期間に基づき、公正で透明性の高い株主意思の確認手続きを通じた判
断(インフォームド・ジャッジメント)を行えるようにすることが、企業価値および株主共同の利益の確保と向
上のため必要であると考えています。
39/110
EDINET提出書類
ニチコン株式会社(E01904)
有価証券報告書
(2)【役員の状況】
① 役員一覧
男性 10名女性 2名
役職名
代表取締役
会長
(役員のうち女性の比率
氏名
武田
一平
CEO
17%)
生年月日
略歴
1963年3月
当社入社
1978年2月
ニチコン(アメリカ)コーポレーション代表
取締役
1983年6月
1983年12月
当社取締役
当社国際部長
1941年1月11日 1995年7月
生
1997年6月
1998年6月
2003年6月
当社代表取締役社長
当社代表取締役社長執行役員社長
2007年6月
当社代表取締役会長執行役員会長
2013年6月
当社代表取締役会長 CEO(現任)
1991年4月
2003年1月
当社入社
当社東日本営業本部東京支店第一販売部副部
長
当社営業本部海外営業本部部長
ニチコン(台湾)カンパニーリミテッド総経
理
ニチコン(台湾)カンパニーリミテッド董事
長
当社中華圏営業統括
ニチコン(香港)リミテッド董事長
当社執行役員
2004年1月
2004年2月
代表取締役
社長
森
克彦
COO
当社大野工場長兼海外営業担当
当社常務取締役
1968年1月6日
2011年6月
生
2014年1月
2020年7月
任期
所有
株式数
(百株)
(注)3
150
(注)3
70
(注)3
30
(注)3
20
当社コンデンサ事業本部長
2023年6月
当社代表取締役社長 COO(現任)
1980年4月
2001年4月
パイオニア株式会社入社
パイオニア ヨーロッパ エヌ ブイ取締役経営
2005年5月
企画部長
パイオニア エレクトロニクス ドイツランド
ゲー・エム・ベー・ハー 代表取締役社長
取締役
執行役員専務
管理本部長兼
サステナビリティ推進室長
2009年12月
矢野
明弘
2010年10月
1957年12月18日
2011年5月
生
2011年7月
2013年6月
2015年7月
2017年7月
2022年2月
取締役
松重
和美
当社入社生産本部生産管理部副部長
当社企画本部副本部長
当社企画本部長
当社執行役員
当社取締役(現任)
当社執行役員常務
当社上席執行役員常務
当社サステナビリティ推進室長(現任)
2023年7月
2025年7月
当社執行役員専務(現任)
1981年4月
1990年5月
1993年4月
1996年7月
九州大学応用力学研究所助教授
同大学工学部教授
京都大学大学院工学研究科電子工学専攻教授
同大学ベンチャー・ビジネス・ラボラトリー
施設長
2001年4月
1947年8月15日 2004年4月
生
2005年4月
2012年4月
当社管理本部長(現任)
同大学国際融合創造センター長
同大学副学長(産学連携・知財担当)
同大学国際イノベーション機構長
同大学名誉教授(現任)
龍谷大学特別任用教授
2012年6月
当社社外取締役(現任)
2013年4月
四国大学・四国大学短期大学部学長(現任)
2016年6月
阿波製紙株式会社社外取締役
40/110
EDINET提出書類
ニチコン株式会社(E01904)
有価証券報告書
役職名
取締役
氏名
加藤
治彦
生年月日
略歴
1975年4月
大蔵省(現財務省)入省
2007年7月
2009年7月
財務省主税局長
国税庁長官
2010年7月
2011年1月
国税庁長官退官
株式会社証券保管振替機構専務取締役
2011年6月
2013年6月
同社代表取締役社長
トヨタ自動車株式会社社外取締役
1952年7月21日
2014年3月
生
2015年7月
2019年6月
2023年6月
2024年6月
任期
キヤノン株式会社社外取締役
(注)3
株式会社証券保管振替機構取締役兼代表執行
所有
株式数
(百株)
10
役社長
トヨタ自動車株式会社常勤監査役
当社社外取締役(現任)
朝日放送グループホールディングス株式会社
社外取締役(監査等委員)(現任)
取締役
取締役
栗本
谷口
知子
宗哉
2025年6月
中部電力株式会社社外取締役(現任)
2007年12月
大阪弁護士会弁護士登録
1981年2月6日
2014年1月
生
2023年6月
弁護士法人関西法律特許事務所入所
同法人パートナー弁護士(現任)
2024年6月
近畿車輛株式会社社外監査役(現任)
1985年4月
株式会社三菱銀行(現株式会社三菱UFJ
2011年6月
銀行)入行
同行執行役員営業第一本部営業第三部長
2015年5月
2019年4月
同行常務執行役員
同行専務執行役員
1962年6月6日 2019年6月
2021年4月
生
2022年4月
2025年4月
(注)3
10
当社社外取締役(現任)
同行代表取締役専務執行役員
(注)3
同行代表取締役副頭取執行役員
三菱UFJモルガン・スタンレー証券株式会
社副会長
三菱UFJ証券ホールディングス株式会社特
10
別顧問(現任)
2025年6月
当社社外取締役(現任)
1989年11月
華道家元池坊次期家元指名
1995年7月
紫雲山頂法寺(六角堂)副住職(現任)
公益財団法人日本いけばな芸術協会副会長
2007年1月
(現任)
2012年4月
2019年10月
2019年12月
取締役
池坊
専好
1965年9月20日
2021年4月
生
2023年6月
一般財団法人池坊華道会副理事長(現任)
公益社団法人2025年日本国際博覧会協会理事
公益社団法人2025年日本国際博覧会協会理
事・シニアアドバイザー
一般社団法人京都経済同友会副代表幹事(現 (注)3
任)
朝日放送グループホールディングス株式会社
2023年12月
社外取締役(現任)
公益社団法人2025年日本国際博覧会協会副会
長・理事・シニアアドバイザー
2025年6月
2026年4月
当社社外取締役(現任)
公益社団法人2025年日本国際博覧会協会副会
長・理事(現任)
41/110
10
EDINET提出書類
ニチコン株式会社(E01904)
有価証券報告書
役職名
氏名
生年月日
略歴
1982年4月
1988年8月
任期
所有
株式数
(百株)
(注)5
100
(注)5
11
(注)5
10
(注)4
10
当社入社
ニチコン(シンガポール)プライベート リミ
テッド マネージャー
常勤監査役
吉田
茂雄
2003年6月
2004年11月
当社営業本部海外営業部長代理
当社電源センター管理部長
2007年4月
2008年11月
ニチコン(香港)リミテッド董事総経理
当社東アジア販売統括
1959年9月7日 2009年6月
生
当社取締役
当社執行役員
2011年5月
当社営業本部長
当社生産本部長
2011年7月
2012年10月
当社執行役員常務
ニチコン製箔株式会社代表取締役社長
2013年6月
当社代表取締役社長 COO
2023年6月
2024年6月
当社特別顧問
1990年4月
三井信託銀行株式会社(現三井住友信託銀行
2001年1月
株式会社)入社
株式会社日本興業銀行(現株式会社みずほ銀
当社常勤監査役(現任)
行)入行
2004年12月
常勤監査役
上野
精也
1966年1月8日
2015年4月
生
みずほコーポレートアジア(香港)リミテッ
ド資本市場部長
株式会社みずほ銀行ポートフォリオマネジメ
ント部米州室長・同行アセットマネジメント
2018年5月
業務部米州室長
当社入社 コンデンサ事業本部統括部長
2019年9月
当社内部監査室長
2024年6月
当社常勤監査役(現任)
1972年4月
松下電器産業株式会社(現 パナソニックホー
1995年4月
1997年4月
ルディングス株式会社)入社
同社マルチメディア推進室長
同社パナソニック ヨーロッピアン ラボラト
リーズ
1999年9月
常勤監査役
中谷
吉彦
1946年10月7日 2004年10月
2008年4月
生
2009年4月
2012年4月
2018年6月
2020年4月
2020年6月
監査役
伝川
幹
1949年7月18日
生
ゲー・エム・ベー・ハー副社長
同社海外R&D推進センター所長
立命館大学COE推進機構教授
同大学立命館グローバル・イノベーション研
究機構教授
同大学研究部長
同大学大学産学官連携戦略本部副本部長
当社補欠監査役
立命館大学総合科学技術研究機構上席研究員
当社常勤監査役・社外監査役(現任)
1973年4月
2007年6月
2009年6月
2011年6月
2013年6月
株式会社読売新聞社入社
株式会社読売新聞東京本社執行役員制作局長
同社取締役編集局長
讀賣テレビ放送株式会社専務取締役
同社取締役副社長
2014年6月
2016年6月
同社代表取締役副社長
同社代表取締役社長
2019年6月
2020年6月
同社代表取締役会長
同社最高顧問
2022年7月
2023年6月
当社顧問
当社社外監査役(現任)
計
441
(注)1.取締役松重和美、取締役加藤治彦、取締役栗本知子、取締役谷口宗哉ならびに取締役池坊専好は、社
外取締役です。なお、当社は、取締役松重和美、取締役加藤治彦、取締役栗本知子、取締役谷口宗哉な
らびに取締役池坊専好を東京証券取引所の定めに基づく独立役員として指定し、同取引所に届け出ていま
す。
2.監査役中谷吉彦ならびに監査役伝川幹は、社外監査役です。なお、当社は、監査役中谷吉彦ならびに監
査役伝川幹を東京証券取引所の定めに基づく独立役員として指定し、同取引所に届け出ています。
3.2025年6月27日開催の定時株主総会の終結の時から2年間
42/110
EDINET提出書類
ニチコン株式会社(E01904)
有価証券報告書
4.2023年6月29日開催の定時株主総会の終結の時から4年間
5.2024年6月27日開催の定時株主総会の終結の時から4年間
6.所有株式数は、2026年3月末日現在の株主名簿に基づき記載しています。
7.当社では、経営環境の変化に機動的な対応を行うとともに、意思決定の迅速化と業績責任体制の明確化を図
るため、執行役員制度を導入しています。執行役員は前掲の取締役執行役員1名と下記の執行役員11名の12
名で構成されています。
役職名
氏
名
上席執行役員専務
(企画本部長)
近野
斉
執行役員常務
(NECST事業本部長)
桃井
恒浩
執行役員
(NECST事業本部副本部長(営業統括))
眞鍋
政尚
執行役員
(コンデンサ事業本部副本部長兼 コンデンサ営業本部長)
西田
伸之
執行役員
(NECST事業本部技術開発本部長)
高森
信之
執行役員
(コンデンサ事業本部技術センター長)
石田
雅彦
執行役員
(コンデンサ事業本部長)
渡邊
健司
執行役員
(経理本部長)
石見
真士
執行役員(※)
(品質保証本部長)
竹村
博
戸成
秀道
河村
潔
執行役員(※)
(NECST事業本部副本部長(東京開発センター統括) 兼 エネルギー
ソリューショングループ ビジネスグループ長)
執行役員(※)
(デジタル化推進本部長)
(注)2026年6月26日開催の定時株主総会の直後に開催の取締役会決議に基づく、2026年7月1日付の執行役員
を記載しています。また、新たに就任予定の3名には(※)を付けています。
8.当社は、法令に定める監査役の員数を欠くことになる場合に備え、会社法第329条第3項に定める補欠監査
役1名を選任しています。補欠監査役の略歴は次のとおりです。
氏名
置田
文夫
生年月日
1952年5月30日生
略歴
1980年4月
1996年8月
京都弁護士会弁護士登録
2001年4月
2005年4月
2013年12月
京都府医師会監事
京都弁護士会総会議長
株式会社エリッツホールディングス監査役
所有株式数
(百株)
アクシス法律事務所開所所長就任(現任)
−
(現任)
2015年6月
日東薬品工業株式会社監査役(現任)
上原成商事株式会社社外取締役(現任)
2016年8月
②
株式会社井筒八ツ橋本舗監査役(現任)
社外役員の状況
当社の社外取締役は5名、社外監査役は2名です。
社外取締役松重和美は、大学教授・学長としての豊富な学識経験と高い見識を活かし、客観的な立場から助
言・指導を行っています。
社外取締役加藤治彦は、長年財務省において要職を歴任しており、財政や税務および会計に関する相当程度
の知見を有することに加え、金融機関の経営や代表取締役を歴任するほか、自動車メーカーなどの取締役を歴任
された経験を活かし、客観的な立場から助言・指導を行っています。
社外取締役栗本知子は、弁護士としての高い見識を活かし、法律の専門家として、客観的な立場から助言・
指導を行っています。
43/110
EDINET提出書類
ニチコン株式会社(E01904)
有価証券報告書
社外取締役谷口宗哉は、長年金融業務に携わっており、財務および会計に関する高い見識を活かし、客観的
な立場から助言・指導を行っています。
社外取締役池坊専好は、日本を代表する文化・芸術団体での長年にわたる運営経験や諸団体での理事・委員
経験を活かし、客観的な立場から助言・指導を行っています。
社外監査役中谷吉彦は、民間企業における技術経営の実践に加え、学識者としての高い見識と豊富な経験を
活かし、客観的な立場から企業の健全性の確保、透明性の高い監査体制の充実・強化を図っています。
社外監査役伝川幹は、報道機関の取締役を歴任しており、会社経営に関する相当程度の知見を当社経営に活
かし、客観的な立場から企業の健全性の確保、透明性の高い監査体制の充実・強化を図っています。
なお、社外取締役5名および社外監査役2名と当社との間には、特別な利害関係はありません。また、選任さ
れている社外役員の歴任の会社等と当社との間においても特別な利害関係はありません。社外役員の当社株式保
有については、① 役員一覧に記載のとおりです。
③ 社外取締役または社外監査役による監督または監査と内部監査、監査役監査および会計監査との相互連携なら
びに内部統制部門との関係
社外取締役は、取締役会に出席し、各部門の執行状況などを把握し、監督機能を果たしています。
社外監査役は、取締役会および監査役会に出席するとともに、各実務執行部門に対する内部監査を通し、執行
状況の監査および助言を行っています。また、会計監査人との間で四半期ごとの会合を実施し、監査結果、監査
体制、監査計画、監査実施状況等について情報・意見交換を行っています。当社には、社外取締役および社外監
査役の選任にあたり、独立性に関する明確な基準はありませんが、選任にあたっては、株式会社東京証券取引所
の「上場管理等に関するガイドライン」に、一般株主と利益相反が生じるおそれがあると判断する場合の判断要
素が規定されており、当該ガイドラインを参考にしています。
(3)【監査の状況】
①監査役の状況ならびに監査役会および取締役会への出席状況について
当社の監査役会は、常勤監査役3名(うち1名は社外監査役)と社外監査役1名の計4名で構成されていま
す。監査役の個々の経歴等、当事業年度における監査役会および取締役会への出席回数は次のとおりです。
氏名
略歴等
監査役会
取締役会
吉田茂雄
(常勤監査役)
当社代表取締役を務めた経験から、当社事業全
体に精通しています。
100%
(12/12回)
100%
(10/10回)
上野精也
(常勤監査役)
金融機関における国内外での実務経験から財務
および会計に関する豊富な経験と見識を有して
います。
100%
(12/12回)
100%
(10/10回)
中谷吉彦
(常勤/社外監査役)
事業会社での実務経験や大学教授としての見識
から、技術開発の知見を有し技術経営に精通し
ています。
100%
(12/12回)
100%
(10/10回)
伝川幹
(社外監査役)
メディア機関における実務経験および代表取締
役を務めた経験から、マーケティングおよび法
務・リスクマネージメントに関する相当程度の
知見を有しています。
100%
(12/12回)
100%
(10/10回)
各監査役は、取締役会では議事運営、決議内容等を監査し、必要に応じ意見を申し述べました。
これらに加え、代表取締役会長、代表取締役社長とは、監査役監査のポイントの報告等の機会として、月1〜2回
の面談の場を持ち意見交換を行っています。
44/110
EDINET提出書類
ニチコン株式会社(E01904)
有価証券報告書
②監査役会および監査役の活動状況について
監査役会は以下の監査方針を定め監査を推進しました。
1.取締役/執行役員/事業所長の職務の遂行が、法令・定款および当社の経営理念、経営目標、行動指針に
適合しているかの監査
2.内部統制システムの整備、運用が会社法ならびに金融商品取引法のほか、コーポレートガバナンス・
コードに則って実践されているかどうかの監査
3.会計監査人の選任、会計監査の方法/結果が相当であること、会計処理が法令等に則って妥当であるかど
うかの監査
これらに基づき、具体的な監査活動を以下のとおり行いました。
主な担当
被監査者/相手方
監査役全員
本社本部9拠点
常勤監査役・
非常勤の社外監査
役(一部の拠点)
支店・営業所9拠点
事業所、子会社29拠点
活動内容
・監査役監査を、国内外合わせて合計47拠点で実施しました。
・中期計画、事業計画達成に向けた取組みの進捗、新商品の企画・開
発、技術開発などの事業活動の状況を確認するとともに、コンプライ
アンスの遵守、ならびにガバナンスに対する理解、浸透の状況につい
て確認・検証しました。
本社
・経営会議等への出席
・当社では、原則毎月1回国内・海外の事業所とオンラインで結び、
代表取締役以下が出席し「コンデンサ経営会議」、「NECST経営会議」
を開催し、子会社を含む全事業所の経営状況・運営状況を確認してい
ます。
・常勤監査役は当期のコンデンサおよびNECSTの経営会議に全て出席
し、必要に応じ意見を述べました。
本社
・内部統制推進委員会、サステナビリティ推進委員会への出席
・当社はコーポレート・ガバナンスの強化・推進と持続可能な企業価
値の向上を目的に、本社に代表取締役社長直轄の両推進委員会を設置
し、各事業所にも両委員会を設置し活動しています。本社の両推進委
員会に常勤監査役がそれぞれ出席し、必要に応じ意見を述べていま
す。
会計監査人
・会計監査人から報告を受けた会計監査の方法/結果の相当性および会
計監査人の独立性について検証を実施。
・会計監査の方法・内容や体制等の評価および再任/不再任の判断を行
いました。
監査役会
取締役
・毎年4月に子会社の取締役を含む企業集団全ての取締役から「業務
執行確認書」を徴集して職務の執行状況を監査・確認しています。
・監査役監査を実施する事、経営会議等主要会議に出席する事、取締
役会に出席する事を通じて各取締役の職務の執行状況の確認を行うと
ともに、改めて期を通しての活動を確認書方式で自己チェックし、監
査役会に報告することでモニタリングの強化に努めています。
常勤監査役
内部監査室
・内部監査室とは連携を密にし、情報交換・意見交換を行うと共に、
被監査部門の法令遵守・経営方針の浸透度等確認の共有を行い、監査
の実効性と効率性の向上に努めています。
常勤監査役
常勤監査役
監査役全員
③内部監査の状況
a.内部監査の組織、人員および手続き
当社の内部監査機能は、代表取締役直轄の内部監査室がグループ会社の内部統制を充実させるとともに、会
計、業務、制度などに関する内部監査を実施し、各事業部門に対し具体的な助言を行っています。
b.内部監査室、監査役監査および会計監査の相互連携ならびにこれらの監査と内部統制部門との関係
内部監査室は、監査役会に対し内部監査の結果を都度直接報告するなど、監査役と連携することにより、内部
監査の独立性と実効性向上を図っています。会計監査人は監査役会と定期的に会合を持ち、説明・報告等を行
い、意見交換を行っています。
c.内部監査の実効性を確保するための取組
内部監査室は、重要な意思決定の過程および業務の執行状況を把握するため、経営会議等重要な会議に出席し
ています。内部監査を通じて認識された課題等は、都度代表取締役に直接報告を行うとともに半期に一度定期
報告を行っています。また、本社の各本部にもその内容を共有する体制としています。
45/110
EDINET提出書類
ニチコン株式会社(E01904)
有価証券報告書
④会計監査の状況
a.会計監査人の名称
有限責任監査法人トーマツ
b.継続監査期間
19年間
c.業務を執行した公認会計士の氏名
指定有限責任社員業務執行社員
菱本恵子、上田博規
d.監査業務に係る補助者の構成
公認会計士 10名、会計士試験合格者 10名、その他 14名
e.監査法人の選定方針と理由
当社の監査公認会計士等の選定方針は、会計監査人に必要とされる専門性、独立性および監査品質管理体制の
各状況と、監査計画および監査報酬等を総合的に勘案して決定します。
f.監査役および監査役会による監査法人の評価
当社の監査役および監査役会は、会計監査人に対し評価を行っています。この評価については、事業年度末日
において、会計監査人の監査の実施状況ならびにその品質管理や監査チームの専門性、独立性などの評価基準
項目に沿って評価しました。
⑤監査報酬の内容等
a.監査公認会計士等に対する報酬の内容
前連結会計年度
区分
監査証明業務に基づく 非監査業務に基づく報
報酬(百万円)
酬(百万円)
当連結会計年度
監査証明業務に基づく 非監査業務に基づく報
報酬(百万円)
酬(百万円)
提出会社
66
−
67
−
連結子会社
−
0
−
0
66
0
67
0
計
(前連結会計年度)
連結子会社が監査公認会計士等に対して報酬を支払っている非監査業務の主な内容は、重要性が乏しいため
業務内容の記載を省略しています。
(当連結会計年度)
連結子会社が監査公認会計士等に対して報酬を支払っている非監査業務の主な内容は、重要性が乏しいため
業務内容の記載を省略しています。
b.監査公認会計士等と同一のネットワーク(デロイト トウシュ トーマツ)に対する報酬(a.を除く)
前連結会計年度
当連結会計年度
区分
監査証明業務に基づく 非監査業務に基づく報監査証明業務に基づく 非監査業務に基づく報
報酬(百万円)
酬(百万円)
報酬(百万円)
酬(百万円)
提出会社
−
11
−
14
連結子会社
22
5
40
3
22
16
40
17
計
監査公認会計士等と同一のネットワークに属する組織に対する非監査業務の内容
(前連結会計年度)
当社および連結子会社が監査公認会計士等と同一のネットワークに属する組織に対して支払っている非監査
業務の内容は、主に税務アドバイザリー業務です。
(当連結会計年度)
当社および連結子会社が監査公認会計士等と同一のネットワークに属する組織に対して支払っている非監査
業務の内容は、主に税務アドバイザリー業務です。
c.その他の重要な監査証明業務に基づく報酬の内容
該当事項はありません。
46/110
EDINET提出書類
ニチコン株式会社(E01904)
有価証券報告書
d.監査報酬の決定方針
当社の監査公認会計士等に対する監査報酬は、監査計画に基づき、監査日数、規模・業務の特性等の要素を総
合的に勘案して合理的な範囲で決定する方針としています。
e.監査役会が会計監査人の報酬等に同意した理由
監査役会は、報酬の見積が上記の決定方針に照らし合わせ妥当であるかどうかを協議し、同意の判断を行って
います。
(4)【役員の報酬等】
①役員の報酬等の額またはその算定方法の決定に関する方針に係る事項
1.基本方針
当社の取締役の報酬は、企業価値の持続的な向上を図るインセンティブとして十分に機能するよう株主利益と
連動した報酬体系とし、個々の取締役の報酬の決定に際しては各職責を踏まえた適正な水準とすることを基本方
針とする。具体的には、業務執行取締役の報酬は、固定報酬としての基本報酬および業績連動報酬により構成
し、監督機能を担う社外取締役については、その役割と独立性の観点から、固定報酬のみを支払うこととする。
2.基本報酬の個人別の報酬等の額の決定に関する方針
当社の取締役の基本報酬は月例の固定報酬とし、株主総会で決議された取締役の報酬限度額内で、個々の職責
および実績、会社業績や他社動向、中長期業績や過去の支給実績等を総合的に勘案し決定するものとする。
3.業績連動報酬の内容および額の決定に関する方針
当社の業績連動報酬は、事業年度ごとの業績向上に対する意識を高めるため、親会社株主に帰属する当期純利
益の一定の範囲内でその役割や短期および中長期での貢献度合いに応じた額を株主総会で決議された取締役の報
酬限度額内において、指名・報酬委員会の答申を踏まえて決定し、毎年、一定の時期に支給するものとする。
4.基本報酬の額および業績連動報酬の額の取締役の個人別の報酬等の額に対する割合の決定に関する方針
当社の業績連動報酬は親会社株主に帰属する当期純利益の範囲内で支払うものであり、業績により大きく変動
するため、基本報酬との割合については、毎年大きく変動するものである。そのため報酬等の種類ごとの割合の
目安に関しては、事前に定めないものとする。
5.取締役の個人別の報酬等の内容についての決定に関する事項
個人別の報酬額については取締役会の決定にもとづき代表取締役がその具体的内容について委任を受けるもの
とし、その権限の内容は、各取締役の基本報酬の額および業績連動報酬の評価配分について代表取締役による協
議を経て決定するものとする。
取締役会は、当該権限が代表取締役によって適切に行使されるよう、指名・報酬委員会に諮問し答申を得るも
のとし、上記の委任をうけた代表取締役は、当該答申の内容に従って決定をしなければならないこととする。
②役員区分ごとの報酬等の総額、報酬等の種類別の総額および対象となる役員の員数
報酬等の種類別の総額(百万円)
役員区分
報酬等の総額
(百万円)
固定報酬
対象となる
役員の員数
左記のうち、
(人)
業績連動報酬退職慰労金
非金銭報酬等
取締役
(社外取締役を除く)
166
131
35
−
−
4
監査役
(社外監査役を除く)
29
29
−
−
−
2
社外役員
67
67
−
−
−
8
(注)1.株主総会の決議(2007年6月28日)による取締役の報酬等の総額は年額280百万円以内(当該株主総
会終結時点の取締役の員数は7名)、株主総会の決議(2025年6月27日)による監査役の報酬等の総
額は年額80百万円以内(当該株主総会終結時点の監査役の員数は4名)です。
2.取締役の報酬等の額には、当事業年度中に退任した取締役2名(うち社外取締役1名)の報酬額が含
まれています。
3.取締役の報酬等の額には、使用人兼務取締役に対する使用人分給与および賞与は含まれていません。
4.当社は、2007年6月28日開催の第72回定時株主総会終結の時をもって取締役および監査役の役員退職
慰労金制度を廃止し、同株主総会終結後引き続いて在任する取締役および監査役に対しては、役員退
職慰労金制度廃止までの在任期間に対応する役員退職慰労金を各氏の退任時に贈呈することを決議し
ています。
5.各監査役の報酬は、監査役の協議により決定していますが、固定報酬のみとしています。
③報酬等の総額が1億円以上である者の報酬等の総額等
該当事項はありません。
47/110
EDINET提出書類
ニチコン株式会社(E01904)
有価証券報告書
④使用人兼務役員の使用人分給与のうち重要なもの
該当事項はありません。
(5)【株式の保有状況】
① 投資株式の区分の基準及び考え方
当社は、保有目的が純投資目的である投資株式と純投資目的以外の目的である投資株式の区分について、配当
金や値上がり益を目的とした投資を純投資株式とし、純投資目的以外の目的である投資株式は特定投資株式と区
分しています。特定投資株式は、取引先との長期的・安定的な関係の維持・強化や事業運営上の必要性などを総
合的に勘案し、中長期的な企業価値向上に資すると判断する場合に保有しています。なお、純投資株式は保有し
ていません。
②
保有目的が純投資目的以外の目的である投資株式
a. 保有方針および保有の合理性を検証する方法ならびに個別銘柄の保有の適否に関する取締役会等における検
証の内容
特定投資株式は、中長期的な視点に基づいた保有先企業との取引状況や関係性、ならびに保有先企業の
財政状態および株価、配当等の状況について、継続保有の合理性について定期的に検証を行います。保有
意義の薄れてきた銘柄については、取引先等との対話・交渉を実施しながら、縮減を進める方針としてい
ます。
取締役会においては、上記の考え方に基づき、定期的に保有継続の適否について検証を行います。
特定投資株式の議決権は、保有先企業の中長期的な企業価値向上につながるかどうかなど、様々な観点
から検討を行ったうえでその行使について判断します。
b. 銘柄数および貸借対照表計上額の合計額
銘柄数
(銘柄)
貸借対照表計上額の
合計額(百万円)
非上場株式
15
158
非上場株式以外の株式
16
24,322
(当事業年度において株式数が増加した銘柄)
銘柄数
(銘柄)
株式数の増加に係る取得
価額の合計額(百万円)
非上場株式
1
99
取引関係強化を目的として取得
非上場株式以外の株式
−
−
−
株式数の増加の理由
(当事業年度において株式数が減少した銘柄)
銘柄数
(銘柄)
株式数の減少に係る売却
価額の合計額(百万円)
非上場株式
−
−
非上場株式以外の株式
6
1,596
48/110
EDINET提出書類
ニチコン株式会社(E01904)
有価証券報告書
c. 特定投資株式およびみなし保有株式の銘柄ごとの株式数、貸借対照表計上額等に関する情報
特定投資株式
銘柄
当事業年度
前事業年度
株式数(株)
株式数(株)
貸借対照表計上額
(百万円)
貸借対照表計上額
(百万円)
1,743,600
1,743,600
株式会社京都フィナ
ンシャルグループ
7,080
2,329,600
3,967
2,329,600
ニデック株式会社
4,579
5,805
株式会社三菱UFJ
フィナンシャル・グ
ループ
1,090,570
1,090,570
2,835
2,193
芙蓉総合リース株式
会社
(注3)
500,000
191,000
2,129
442,400
2,211
442,400
ローム株式会社
1,350
475,600
631
475,600
ホシデン株式会社
1,210
ダイキン工業株式会
社
50,000
934
因幡電機産業株式会
社
(注4)
277,164
720
945
50,000
807
208,582
792
保有目的、業務提携等の概要、
定量的な保有効果
及び株式数が増加した理由
当社の株式の
保有の有無
当社の主要取引銀行の1つであり、京都
に本社を置く当社にとって、地域密着型
金融に取り組む同行との関係維持・強化
が地域社会に貢献すると判断し、同行株
式を保有しています。
有
コンデンサ事業およびNECST事業におい
て製品販売・原材料仕入等を行っている
重要な取引先で、安定的および長期的な
取引関係の維持・強化を通じて、当社の
中長期的な企業価値の向上に資すると判
断し、同社株式を保有しています。
有
資金調達等金融取引関係の維持・強化を
通じて企業基盤の安定化を図り、中長期
的な企業価値向上のために同社株式を保
有しています。
有
取引関係の維持・強化を通じ、主にリー
ス取引等の財務面における安全性・安定
性を高めるため、同社株式を保有してい
ます。当事業年度中に一部売却しまし
た。
有
コンデンサ事業およびNECST事業におい
て製品販売・原材料仕入等を行っている
重要な取引先で、安定的および長期的な
取引関係の維持・強化を通じて、当社の
中長期的な企業価値の向上に資すると判
断し、同社株式を保有しています。
有
コンデンサ事業およびNECST事業におい
て製品販売・原材料仕入等を行っている
重要な取引先で、安定的および長期的な
取引関係の維持・強化を通じて、当社の
中長期的な企業価値の向上に資すると判
断し、同社株式を保有しています。
有
コンデンサ事業およびNECST事業におい
て製品販売等を行っている重要な取引先
で、安定的および長期的な取引関係の維
持・強化を通じて、当社の中長期的な企
業価値の向上に資すると判断し、同社株
式を保有しています。
有
コンデンサ事業およびNECST事業におい
て製品販売・原材料仕入等を行っている
重要な取引先で、安定的および長期的な
取引関係の維持・強化を通じて、当社の
中長期的な企業価値の向上に資すると判
断し、同社株式を保有しています。当事
業年度中に一部売却しました。
有
49/110
EDINET提出書類
ニチコン株式会社(E01904)
有価証券報告書
銘柄
当事業年度
前事業年度
株式数(株)
株式数(株)
貸借対照表計上額
(百万円)
貸借対照表計上額
(百万円)
67,200
100,200
岡谷鋼機株式会社
株式会社三井住友
フィナンシャルグ
ループ
606
699
114,300
114,300
572
259,200
433
259,200
EIZO株式会社
532
169,700
540
169,700
サンワテクノス株式
会社
SOMPOホール
ディングス株式会社
528
360
78,750
78,750
473
100,500
356
100,500
加賀電子株式会社
株式会社みずほフィ
ナンシャルグループ
370
271
53,856
53,856
327
萩原電気ホールディ
ングス株式会社
(注5)
キヤノン電子株式会
社
18,750
218
18,750
69
61
−
141,000
−
350
保有目的、業務提携等の概要、
定量的な保有効果
及び株式数が増加した理由
当社の株式の
保有の有無
コンデンサ事業およびNECST事業におい
て製品販売・原材料仕入等を行っている
重要な取引先で、安定的および長期的な
取引関係の維持・強化を通じて、当社の
中長期的な企業価値の向上に資すると判
断し、同社株式を保有しています。当事
業年度中に一部売却しました。
有
資金調達等金融取引関係の維持・強化を
通じて企業基盤の安定化を図り、中長期
的な企業価値向上のために同社株式を保
有しています。
有
コンデンサ事業において製品販売等を
行っている重要な取引先で、安定的およ
び長期的な取引関係の維持・強化を通じ
て、当社の中長期的な企業価値の向上に
資すると判断し、同社株式を保有してい
ます。
有
コンデンサ事業およびNECST事業におい
て製品販売・原材料仕入等を行っている
重要な取引先で、安定的および長期的な
取引関係の維持・強化を通じて、当社の
中長期的な企業価値の向上に資すると判
断し、同社株式を保有しています。
有
取引関係の維持・強化を通じ、主に保険
の安定利用等による事業活動の円滑化に
より企業価値の向上を図るため同社株式
を保有しています。
有
コンデンサ事業およびNECST事業におい
て製品販売・原材料仕入等を行っている
重要な取引先で、安定的および長期的な
取引関係の維持・強化を通じて、当社の
中長期的な企業価値の向上に資すると判
断し、同社株式を保有しています。
有
資金調達等金融取引関係の維持・強化を
通じて企業基盤の安定化を図り、中長期
的な企業価値向上のために同社株式を保
有しています。
有
コンデンサ事業およびNECST事業におい
て製品販売等を行っている重要な取引先
で、安定的および長期的な取引関係の維
持・強化を通じて、当社の中長期的な企
業価値の向上に資すると判断し、同社株
式を保有しています。
有
当社の中長期的な企業価値の向上に資す
ると判断し、同社株式を保有していまし
たが、同社からTOBへの応募推奨を受け
全株式を売却。
有
50/110
EDINET提出書類
ニチコン株式会社(E01904)
有価証券報告書
銘柄
新光商事株式会社
オプテックスグルー
プ株式会社
当事業年度
前事業年度
株式数(株)
株式数(株)
貸借対照表計上額
(百万円)
貸借対照表計上額
(百万円)
−
134,000
−
120
−
54,400
−
94
保有目的、業務提携等の概要、
定量的な保有効果
及び株式数が増加した理由
当社の株式の
保有の有無
保有の合理性を検証した結果、全株式を
売却。
無
保有の合理性を検証した結果、全株式を
売却。
無
(注)1.定量的な保有効果は個別の取引条件を開示できないため記載が困難です。
2.保有の合理性は銘柄毎の中長期的な取引関係等による企業価値向上を考慮し、リスク・リターン分析等に
より検証しています。
3.芙蓉総合リース株式会社は、2025年4月1日付で普通株式1株につき3株の割合で株式分割を実施してい
ます。
4.因幡電機産業株式会社は、2025年12月1日付で普通株式1株につき2株の割合で株式分割を実施していま
す。
5.萩原電気ホールディングス株式会社は、2026年4月1日付で佐鳥電機株式会社と経営統合し、MIRAINI
ホールディングス株式会社へ移行しています。
6.「−」は、当該銘柄を保有していないことを示しています。
③
保有目的が純投資目的である投資株式
保有目的が純投資目的である投資株式は保有していません。
51/110
EDINET提出書類
ニチコン株式会社(E01904)
有価証券報告書
5【従業員の状況等】
(1)【人材戦略に関する基本方針等】
①企業の成長戦略と関連付けた人材戦略
当社グループの人材戦略に関する基本方針については、「第2 事業の状況 2サステナビリティに関する考
え方および取組(3)戦略(人材の多様性の確保を含む人材の育成に関する方針)」に記載しています。
「価値ある製品を創造し、明るい未来社会づくりに貢献する」という経営理念のもと、企業の持続的成長に
とって、最も重要な資本は人材(人的資本)と認識しており、両事業の成長戦略と人材戦略を一体的に推進
し、人材ポートフォリオの最適化、重要ポジションの後継者計画(サクセッションプラン)、人的資本に関す
る指標の開示およびモニタリング等により、人材基盤の強化を図ります。
②従業員の給与等の額および内容の決定に関する方針
当社は、従業員一人ひとりを企業価値向上を支える重要な経営資源と位置付け、その能力の発揮および成長
を促進することを重視しています。給与の決定にあたっては、職務内容および役割、業績への貢献度、能力お
よび成長度合いなどを総合的に勘案するとともに、当社の業績および経営環境を踏まえて決定しています。
給与は基本給、手当および賞与により構成し、賞与については会社業績および個人評価に連動させること
で、公平性および透明性を確保しつつ、従業員の働きがいとエンゲージメントの向上を図り、中長期的な企業
価値の向上に資するものとしています。
(2)【従業員の状況】
①連結会社の状況
(2026年3月31日現在)
セグメントの名称
従業員数(人)
コンデンサ事業
3,437
NECST事業
1,278
4,715
報告セグメント計
267
全社(共通)
4,982
合計
(注)全社(共通)として記載している従業員は、管理部門に所属しているものです。
②提出会社の状況
(2026年3月31日現在)
従業員数(人)
平均年齢(歳)
623
45.5
平均勤続年数(年) 平均年間給与(円)
8.9
平均年間給与の
対前事業年度増減率
(%)
6,913,636
0.4
(注)平均年間給与は、賞与および基準外賃金を含んでいます。
(2026年3月31日現在)
セグメントの名称
従業員数(人)
コンデンサ事業
109
NECST事業
388
497
報告セグメント計
126
全社(共通)
623
合計
(注)全社(共通)として記載している従業員は、管理部門に所属しているものです。
③労働組合の状況
提出会社の労働組合はニチコングループ労働組合連合会と称し、全日本電機・電子・情報関連産業労働組合
連合会に加盟しています。
なお、労使関係は安定しています。
52/110
EDINET提出書類
ニチコン株式会社(E01904)
有価証券報告書
④管理的地位にある労働者に占める女性労働者の割合、男性労働者の育児休業取得率及び労働者の男女の賃金の
額の差異
ア 提出会社
当事業年度
管理的地位にある労働者
に占める女性労働者の割
合(%)
(注)1.
男性労働者の育児休業取
得率(%)
(注)2.
5.3
75.0
労働者の男女の賃金の額の差異(%)
(注)1.
全労働者
正規雇用労働者
59.7
パート・有期労働者
61.1
39.6
(注)1.「女性の職業生活における活躍の推進に関する法律」(平成27年法律第64号)の規定に基づき算出し
たものです。
2.「育児休業、介護休業等育児又は家族介護を行う労働者の福祉に関する法律」(平成3年法律第76
イ
号)の規定に基づき、「育児休業、介護休業等育児又は家族介護を行う労働者の福祉に関する法律施
行規則」(平成3年労働省令第25号)第71条の6第1号における育児休業等の取得割合を算出したも
のです。
連結子会社
当事業年度
管理的地位にある労働
男性労働者の育児休
者に占める女性労働者
業取得率(%)
の割合(%)
(注)2.
(注)1.
名称
労働者の男女の賃金の額の差異(%)
(注)1.
全労働者
正規雇用労働者
パート・有期
労働者
ニチコン製箔㈱
3.9
100.0
70.8
72.7
51.1
ニチコン草津㈱
0.0
70.0
70.7
67.3
62.8
ニチコン亀岡㈱
0.0
100.0
66.6
73.8
48.2
ニチコン大野㈱
0.0
81.8
68.2
75.7
89.3
ニチコン岩手㈱
0.0
66.7
75.1
72.0
81.6
ニチコンワカサ㈱
7.7
100.0
73.2
73.7
69.9
(注)1.「女性の職業生活における活躍の推進に関する法律」(平成27年法律第64号)の規定に基づき算出し
たものです。
2.「育児休業、介護休業等育児又は家族介護を行う労働者の福祉に関する法律」(平成3年法律第76
号)の規定に基づき、「育児休業、介護休業等育児又は家族介護を行う労働者の福祉に関する法律施
行規則」(平成3年労働省令第25号)第71条の6第1号における育児休業等の取得割合を算出したも
のです。
3.上記以外の連結子会社は、「女性の職業生活における活躍の推進に関する法律」(平成27年法律第64
号)及び「育児休業、介護休業等育児又は家族介護を行う労働者の福祉に関する法律」(平成3年法
律第76号)の規定による公表義務の対象ではないため、記載を省略しています。
53/110
EDINET提出書類
ニチコン株式会社(E01904)
有価証券報告書
第5【経理の状況】
1.連結財務諸表および財務諸表の作成方法について
(1)当社の連結財務諸表は、「連結財務諸表の用語、様式及び作成方法に関する規則」(昭和51年大蔵省令第28号)
に基づいて作成しています。
(2)当社の財務諸表は「財務諸表等の用語、様式及び作成方法に関する規則」(昭和38年大蔵省令第59号。以下「財
務諸表等規則」という。)に基づいて作成しています。
また、当社は、特例財務諸表提出会社に該当し、財務諸表等規則第127条の規定により財務諸表を作成していま
す。
2.監査証明について
当社は、金融商品取引法第193条の2第1項の規定に基づき、連結会計年度(2025年4月1日から2026年3月31日
まで)の連結財務諸表および事業年度(2025年4月1日から2026年3月31日まで)の財務諸表について、有限責任
監査法人トーマツにより監査を受けています。
3.連結財務諸表等の適正性を確保するための特段の取組について
当社は、連結財務諸表等の適正性を確保するための特段の取組を行っています。具体的には、会計基準等の内容
を適切に把握し、または会計基準等の変更等について的確に対応することができる体制を整備するため、公益財団
法人財務会計基準機構へ加入し、会計基準に関する最新の情報を適時入手しています。
54/110
EDINET提出書類
ニチコン株式会社(E01904)
有価証券報告書
1【連結財務諸表等】
(1)【連結財務諸表】
①【連結貸借対照表】
(単位:百万円)
前連結会計年度
(2025年3月31日)
資産の部
流動資産
現金及び預金
受取手形、売掛金及び契約資産
電子記録債権
有価証券
商品及び製品
仕掛品
原材料及び貯蔵品
その他
貸倒引当金
流動資産合計
固定資産
有形固定資産
建物及び構築物(純額)
機械装置及び運搬具(純額)
土地
リース資産(純額)
建設仮勘定
その他(純額)
有形固定資産合計
無形固定資産
投資その他の資産
投資有価証券
長期貸付金
退職給付に係る資産
繰延税金資産
その他
貸倒引当金
投資その他の資産合計
固定資産合計
資産合計
55/110
当連結会計年度
(2026年3月31日)
25,519
24,491
※2 38,963
※2 42,252
5,969
100
14,766
6,184
12,265
4,572
△86
108,254
5,161
200
14,350
6,633
11,318
3,358
△99
107,667
18,745
18,771
6,073
1,226
5,641
2,628
※3,※4 53,086
18,397
17,913
6,077
904
7,053
2,191
※3,※4 52,538
1,928
2,139
※1 26,688
※1 29,376
2,845
338
84
847
△1,492
29,312
84,328
192,582
3,335
920
517
931
△1,855
33,225
87,903
195,570
EDINET提出書類
ニチコン株式会社(E01904)
有価証券報告書
(単位:百万円)
前連結会計年度
(2025年3月31日)
負債の部
流動負債
支払手形及び買掛金
電子記録債務
短期借入金
1年内返済予定の長期借入金
未払金
未払法人税等
契約負債
賞与引当金
役員賞与引当金
その他
流動負債合計
固定負債
長期借入金
リース債務
繰延税金負債
製品保証引当金
退職給付に係る負債
その他
固定負債合計
負債合計
純資産の部
株主資本
資本金
資本剰余金
利益剰余金
自己株式
株主資本合計
その他の包括利益累計額
その他有価証券評価差額金
為替換算調整勘定
その他の包括利益累計額合計
非支配株主持分
純資産合計
負債純資産合計
56/110
当連結会計年度
(2026年3月31日)
14,894
13,566
※5 6,700
2,500
3,589
1,298
567
1,514
33
6,893
51,558
13,270
10,027
※5 8,400
2,500
2,791
1,336
1,124
1,521
35
6,197
47,204
15,750
913
4,587
3,786
1,462
709
27,209
78,768
13,250
623
4,752
4,769
802
650
24,848
72,053
14,286
16,856
60,826
△3,497
88,471
14,286
16,856
64,719
△3,498
92,364
10,772
11,188
21,960
3,381
113,814
192,582
13,584
13,655
27,239
3,913
123,517
195,570
EDINET提出書類
ニチコン株式会社(E01904)
有価証券報告書
②【連結損益計算書及び連結包括利益計算書】
【連結損益計算書】
(単位:百万円)
前連結会計年度
(自 2024年4月1日
至 2025年3月31日)
売上高
売上原価
売上総利益
販売費及び一般管理費
営業利益
営業外収益
受取利息
受取配当金
持分法による投資利益
為替差益
その他
営業外収益合計
営業外費用
支払利息
減価償却費
貸倒引当金繰入額
和解金
その他
営業外費用合計
経常利益
特別利益
固定資産売却益
投資有価証券売却益
課徴金返還額
特別利益合計
特別損失
固定資産処分損
投資有価証券評価損
事業構造改革費用
特別損失合計
税金等調整前当期純利益
法人税、住民税及び事業税
法人税等調整額
法人税等合計
当期純利益
非支配株主に帰属する当期純利益
親会社株主に帰属する当期純利益
57/110
当連結会計年度
(自 2025年4月1日
至 2026年3月31日)
※1 175,751
※1 169,724
※2,※4 147,425
※2,※4 139,746
28,326
※3,※4 23,122
29,978
※3,※4 23,522
5,203
6,456
289
701
476
1,203
369
3,039
253
742
214
964
441
2,617
167
96
284
78
106
732
7,511
266
60
271
10
138
746
8,326
※5 24
※5 5
2,645
457
3,127
958
−
964
※6 85
※6 37
−
※8 799
※7,※9 2,087
※7,※9 1,252
2,173
8,465
1,710
427
2,138
6,327
450
5,877
2,090
7,201
1,897
△1,527
370
6,830
519
6,310
EDINET提出書類
ニチコン株式会社(E01904)
有価証券報告書
【連結包括利益計算書】
(単位:百万円)
前連結会計年度
(自 2024年4月1日
至 2025年3月31日)
当期純利益
その他の包括利益
その他有価証券評価差額金
為替換算調整勘定
持分法適用会社に対する持分相当額
その他の包括利益合計
包括利益
(内訳)
親会社株主に係る包括利益
非支配株主に係る包括利益
58/110
当連結会計年度
(自 2025年4月1日
至 2026年3月31日)
6,327
6,830
△3,624
1,351
△14
※ △2,287
2,812
2,607
85
※ 5,505
4,040
12,335
3,459
581
11,590
745
EDINET提出書類
ニチコン株式会社(E01904)
有価証券報告書
③【連結株主資本等変動計算書】
前連結会計年度(自 2024年4月1日
至
2025年3月31日)
(単位:百万円)
株主資本
資本金
当期首残高
資本剰余金
14,286
利益剰余金
16,860
自己株式
67,002
株主資本合計
△11,628
86,521
当期変動額
剰余金の配当
親会社株主に帰属する当期
純利益
△2,326
△2,326
5,877
5,877
自己株式の取得
自己株式の消却
△1,600
△1,600
△3
△9,727
9,731
−
−
△3
△6,176
8,130
1,950
14,286
16,856
60,826
△3,497
88,471
株主資本以外の項目の当期
変動額(純額)
当期変動額合計
当期末残高
その他の包括利益累計額
当期首残高
その他有価証券
評価差額金
為替換算調整勘
定
その他の包括利
益累計額合計
14,494
9,884
24,378
非支配株主持分
2,939
純資産合計
113,839
当期変動額
剰余金の配当
△2,326
親会社株主に帰属する当期
純利益
5,877
自己株式の取得
△1,600
自己株式の消却
−
株主資本以外の項目の当期
変動額(純額)
△3,721
1,303
△2,418
442
△1,975
当期変動額合計
△3,721
1,303
△2,418
442
△25
当期末残高
10,772
11,188
21,960
3,381
113,814
59/110
EDINET提出書類
ニチコン株式会社(E01904)
有価証券報告書
当連結会計年度(自
2025年4月1日
至
2026年3月31日)
(単位:百万円)
株主資本
資本金
当期首残高
資本剰余金
14,286
利益剰余金
16,856
自己株式
60,826
株主資本合計
△3,497
88,471
当期変動額
剰余金の配当
親会社株主に帰属する当期
純利益
△2,417
△2,417
6,310
6,310
自己株式の取得
△0
△0
株主資本以外の項目の当期
変動額(純額)
当期変動額合計
当期末残高
−
−
3,893
△0
3,892
14,286
16,856
64,719
△3,498
92,364
その他の包括利益累計額
当期首残高
その他有価証券
評価差額金
為替換算調整勘
定
その他の包括利
益累計額合計
10,772
11,188
21,960
非支配株主持分
3,381
純資産合計
113,814
当期変動額
剰余金の配当
△2,417
親会社株主に帰属する当期
純利益
6,310
自己株式の取得
株主資本以外の項目の当期
変動額(純額)
△0
2,812
2,467
5,279
531
5,810
当期変動額合計
2,812
2,467
5,279
531
9,702
当期末残高
13,584
13,655
27,239
3,913
123,517
60/110
EDINET提出書類
ニチコン株式会社(E01904)
有価証券報告書
④【連結キャッシュ・フロー計算書】
(単位:百万円)
前連結会計年度
(自 2024年4月1日
至 2025年3月31日)
営業活動によるキャッシュ・フロー
税金等調整前当期純利益
減価償却費
事業構造改革費用
有形固定資産処分損益(△は益)
有形固定資産売却損益(△は益)
投資有価証券売却損益(△は益)
投資有価証券評価損益(△は益)
退職給付に係る負債の増減額(△は減少)
受取利息及び受取配当金
支払利息
和解金
課徴金返還額
売上債権の増減額(△は増加)
棚卸資産の増減額(△は増加)
仕入債務の増減額(△は減少)
未払費用の増減額(△は減少)
その他
小計
利息及び配当金の受取額
利息の支払額
法人税等の支払額
事業構造改革費用の支払額
和解金の支払額
課徴金返還額の精算
営業活動によるキャッシュ・フロー
投資活動によるキャッシュ・フロー
定期預金の預入による支出
有価証券の取得による支出
有価証券の売却及び償還による収入
有形固定資産の取得による支出
投資有価証券の取得による支出
投資有価証券の売却による収入
長期貸付けによる支出
長期貸付金の回収による収入
その他
投資活動によるキャッシュ・フロー
財務活動によるキャッシュ・フロー
短期借入金の純増減額(△は減少)
転換社債型新株予約権付社債の償還による支出
長期借入れによる収入
長期借入金の返済による支出
自己株式の取得による支出
配当金の支払額
非支配株主への配当金の支払額
その他
財務活動によるキャッシュ・フロー
現金及び現金同等物に係る換算差額
現金及び現金同等物の増減額(△は減少)
現金及び現金同等物の期首残高
現金及び現金同等物の期末残高
61/110
当連結会計年度
(自 2025年4月1日
至 2026年3月31日)
8,465
8,465
2,087
85
△24
△2,645
−
46
△990
167
78
△457
3,185
3,725
△2,160
191
△514
19,705
990
△167
△1,577
−
△521
△83
18,346
7,201
8,077
1,252
37
△5
△958
799
△661
△995
266
10
−
△1,204
1,794
△5,976
△289
536
9,884
995
△266
△1,896
△544
△10
−
8,163
−
△303
403
△10,650
△593
3,122
−
351
△690
△8,361
△50
△499
695
△7,099
△200
1,596
△790
250
△458
△6,556
△7,300
△12,000
12,000
△2,500
△1,600
△2,326
△136
△455
△14,319
465
△3,868
29,387
※ 25,519
1,700
−
−
△2,500
△0
△2,417
△213
△412
△3,844
1,159
△1,078
25,519
※ 24,441
EDINET提出書類
ニチコン株式会社(E01904)
有価証券報告書
【注記事項】
(連結財務諸表作成のための基本となる重要な事項)
1.連結の範囲に関する事項
(1)連結子会社の数
21社
連結子会社名は、「第1 企業の概況 4 関係会社の状況」に記載しているため省略しています。
(2)非連結子会社の数 4社
非連結子会社の名称 ハーバー電子株式会社、他3社
(連結の範囲から除いた理由)
非連結子会社はいずれも小規模であり、各社の総資産、売上高、当期純損益(持分に見合う額)および利
益剰余金(持分に見合う額)等は、いずれも連結財務諸表に及ぼす影響が軽微であり、かつ重要性がないた
めです。
2.持分法の適用に関する事項
(1)持分法適用会社の数
2社
持分法適用会社の名称三和電機株式会社、タイコン コーポレーション
(2)持分法非適用会社について持分法を適用しない理由
持分法を適用していない非連結子会社および関連会社5社(ハーバー電子株式会社他4社)は、当期純損
益(持分に見合う額)および利益剰余金(持分に見合う額)などからみて持分法の対象から除いても連結財
務諸表に及ぼす影響が軽微であり、かつ全体としても重要性がないため、持分法の適用から除外していま
す。
(3)持分法適用会社の事業年度に関する事項
持分法適用会社2社の決算日は12月31日であるため、その事業年度に係る財務諸表を使用しています。
3.連結子会社の事業年度等に関する事項
連結子会社のうち5社の決算日は連結決算日と異なっています。
ニチコン エレクトロニクス トレーディング(深圳)カンパニー リミテッドの決算日は12月31日であり、
連結財務諸表の作成にあたっては、連結決算日で実施した仮決算に基づく財務諸表を使用しています。
ニチコン エレクトロニクス トレーディング(深圳)カンパニー リミテッドを除く中国子会社4社の決算
日は12月31日であり、連結財務諸表の作成にあたっては、それぞれの連結子会社の決算日現在の財務諸表を使
用し、連結決算日との間に生じた重要な取引については、連結上必要な調整を行っています。
4.会計方針に関する事項
(1)重要な資産の評価基準および評価方法
①有価証券
満期保有目的の債券……償却原価法(定額法)を採用しています。
その他有価証券
(イ)市場価格のない株式等以外のもの:時価法(評価差額は全部純資産直入法により処理し、売却原価は主
として移動平均法により算定)を採用しています。
(ロ)市場価格のない株式等
:主として移動平均法による原価法を採用しています。
②デリバティブ
時価法を採用しています。
③棚卸資産
(イ)商品及び製品・仕掛品:主として総平均法による原価法(貸借対照表価額は収益性の低下に基づく簿価
切下げの方法により算定)を採用しています。
(ロ)原材料及び貯蔵品
:主として移動平均法による原価法(貸借対照表価額は収益性の低下に基づく簿
価切下げの方法により算定)を採用しています。
(2)重要な減価償却資産の減価償却方法
①有形固定資産(リース資産を除く)
主として、定額法を採用しています。
なお、主な耐用年数は以下のとおりです。
建物及び構築物
3年〜50年
機械装置及び運搬具
2年〜13年
②無形固定資産(リース資産を除く)
定額法を採用しています。なお、自社利用のソフトウェアについては、社内における見込利用可能期間
(5年)に基づく定額法を採用しています。
62/110
EDINET提出書類
ニチコン株式会社(E01904)
有価証券報告書
③リース資産
リース期間を耐用年数とし、残存価額を零とする定額法を採用しています。
(3)重要な引当金の計上基準
①貸倒引当金
債権の貸倒れによる損失に備えるため、一般債権については貸倒実績率により、貸倒懸念債権等特定の債
権については個別に回収可能性を検討し、回収不能見込額を計上しています。
②製品保証引当金
製品の販売に係る一定期間内の無償サービスの費用に備えるため、当該費用の発生割合および支出実績を
勘案した見積額を計上しています。
③賞与引当金
従業員に対する賞与の支払に備えるため、主として支給見込額のうち当連結会計年度負担分を計上してい
ます。
④役員賞与引当金
役員に対する賞与の支給に備えるため、支給見込額のうち当連結会計年度に負担すべき額を計上していま
す。
(4)退職給付に係る会計処理の方法
退職給付債務の算定にあたり、退職給付見込額を当期までの期間に帰属させる方法については、給付算定
式基準としています。なお、数理計算上の差異および過去勤務費用の費用処理方法については、当連結会計
年度において一括費用処理しています。
(5)重要な収益および費用の計上基準
①製品の販売
当社グループは、コンデンサおよびその関連製品、家庭用蓄電システム等の製造・販売を行っています。
これらの製品に関する取引については、製品に対する物理的占有、所有に伴う重大なリスクおよび経済価値
の顧客への移転状況といった支配の移転の要件に基づき、製品の引渡時点で履行義務を充足すると判断し、
当該時点で収益を認識しています。製品の販売に関する取引の対価は、概ね6ケ月以内に受領しています。
②請負契約
NECST事業の研究用・医療用等の特殊電源のうち、一部の取引については請負契約を締結しています。当
該契約のうち、他の用途に転用することができないもの、かつ、現在までに完了した部分に対し強制的に支
払いを受ける権利を有しているものは、契約の履行によって生じる資産の支配を一定期間にわたって顧客に
移転するものと考えています。この場合、各会計期間の末日において測定した履行義務の充足に係る進捗に
基づき、契約期間にわたって売上高を認識しています。なお、一定期間での収益認識要件を満たす場合で
あっても、取引開始日から完全に履行義務を充足すると見込まれる時点までの期間がごく短い請負契約につ
いては、履行義務を充足した時点で収益を認識しています。請負契約に関する取引の対価は、別途定める取
引条件により、概ね1年以内に対価を受領しています。
(6)重要な外貨建の資産または負債の本邦通貨への換算基準
外貨建金銭債権債務は、連結決算日の直物為替相場により円貨に換算し、換算差額は損益として処理して
います。なお、在外連結子会社等の資産および負債は、決算日の直物為替相場により円貨に換算し、収益お
よび費用は期中平均相場により円貨に換算し、換算差額は純資産の部における為替換算調整勘定および非支
配株主持分に含めています。
(7)重要なヘッジ会計の方法
①ヘッジ会計の方法
主として、繰延ヘッジ処理を採用しています。なお、為替予約について振当処理の要件を満たしている場
合は、振当処理を採用しています。
②ヘッジ手段とヘッジ対象
当連結会計年度にヘッジ会計を適用したヘッジ手段とヘッジ対象は次のとおりです。
ヘッジ手段 : 為替予約
ヘッジ対象 : 外貨建金銭債権
③ヘッジ方針
為替リスクをヘッジする手段としてのデリバティブ取引を行うこととしており、投機目的のデリバティブ
取引は、行わないこととしています。
④ヘッジ有効性評価の方法
ヘッジ開始時から有効性判定時点までの期間において、ヘッジ対象の相場変動による変動額等を基礎にし
て判断しています。
63/110
EDINET提出書類
ニチコン株式会社(E01904)
有価証券報告書
(8)連結キャッシュ・フロー計算書における資金の範囲
手許現金、随時引出し可能な預金および容易に換金可能であり、かつ、価値の変動について僅少なリスク
しか負わない取得日から3ヶ月以内に償還期限の到来する定期預金からなります。
(重要な会計上の見積り)
1.有形固定資産の減損
(1)当連結会計年度の連結財務諸表に計上した金額
(単位:百万円)
前連結会計年度
(2025年3月31日)
当連結会計年度
(2026年3月31日)
1,820
957
建物及び構築物
機械装置及び運搬具
その他
18,745
18,771
15,569
18,397
17,913
16,227
合計
53,086
52,538
減損損失
有形固定資産
(注)前連結会計年度において、コンデンサ事業の機械装置及び運搬具の事業用資産および遊休資産に係る
減損損失1,820百万円を事業構造改革費用として計上しています。
当連結会計年度において、コンデンサ事業の機械装置及び運搬具他の事業用資産および遊休資産に係る
減損損失957百万円を事業構造改革費用として計上しています。
(2)識別した項目に係る重要な会計上の見積りの内容に関する情報
当社グループは、コンデンサ事業およびNECST事業の各製品の製造・販売のため建物及び構築物、機械装
置及び運搬具などの有形固定資産を有しています。当社グループは、業績管理に利用される製品区分に基づ
き資産および資産グループを識別しています。当連結会計年度において、コンデンサ事業の一部の資産グ
ループに減損の兆候を識別しました。当該資産グループから得られる割引前将来キャッシュ・フローの総額
と帳簿価額を比較した結果、割引前将来キャッシュ・フローが帳簿価額を下回ったことから、減損損失を認
識しました。
割引前将来キャッシュ・フローは、市場動向に基づく販売計画や生産計画などの仮定を含め、経営者によ
り承認された事業計画に基づく使用価値などから算定しており、事業計画の最終年度以降の期間について
は、経営環境を考慮し見積った成長率を用いてキャッシュ・フローを算定しています。
前提とした仮定より市場環境が悪化するなど将来の事業計画の見直しが必要となった場合は、翌連結会計
年度において減損損失を認識する可能性があります。
2.繰延税金資産の回収可能性
(1)当連結会計年度の連結財務諸表に計上した金額
(単位:百万円)
前連結会計年度
(2025年3月31日)
繰延税金資産
繰延税金負債
当連結会計年度
(2026年3月31日)
84
4,587
517
4,752
(注)同一納税主体ごとに繰延税金資産・繰延税金負債は相殺表示しています。
(2)識別した項目に係る重要な会計上の見積りの内容に関する情報
当社グループは、将来減算一時差異及び税務上の繰越欠損金に係る重要な繰延税金資産を計上していま
す。この将来減算一時差異及び税務上の繰越欠損金については、翌期の課税所得(税務上の繰越欠損金控除
前)の見積額に基づき、回収が見込まれる金額を繰延税金資産として計上しています。
翌期の課税所得見積額は、市場動向に基づく販売計画や生産計画などの仮定を含め、経営者により承認さ
れた事業計画に基づいて算定しています。
前提とした仮定より市場環境が悪化するなど将来の事業計画の見直しが必要となった場合は、翌連結会計
年度において回収が見込まれない繰延税金資産を取り崩す可能性があります。
64/110
EDINET提出書類
ニチコン株式会社(E01904)
有価証券報告書
(会計方針の変更)
該当事項はありません。
(未適用の会計基準等)
(リースに関する関係基準等)
・「リースに関する会計基準」(企業会計基準第34号 2024年9月13日企業会計基準委員会)
・「リースに関する会計基準の適用指針」(企業会計基準適用指針第33号 2024年9月13日企業会計基準
委員会) 等
(1)概要
企業会計基準委員会において、日本基準を国際的に整合性のあるものとする取組みの一環として、借手の全
てのリースについて資産および負債を認識するリースに関する会計基準の開発に向けて、国際的な会計基準を
踏まえた検討が行われ、基本的な方針として、IFRS第16号の単一の会計処理モデルを基礎とするものの、IFRS
第16号の全ての定めを採り入れるのではなく、主要な定めのみを採り入れることにより、簡素で利便性が高
く、かつ、IFRS第16号の定めを個別財務諸表に用いても、基本的に修正が不要となることを目指したリース会
計基準等が公表されました。
借手の会計処理として、借手のリースの費用配分の方法については、IFRS第16号と同様に、リースがファイ
ナンス・リースであるかオペレーティング・リースであるかにかかわらず、全てのリースについて使用権資産
に係る減価償却費およびリース負債に係る利息相当額を計上する単一の会計処理モデルが適用されます。
(2)適用予定日
2028年3月期の期首から適用します。
(3)当該会計基準等の適用による影響
「リースに関する会計基準」等の適用による連結財務諸表に与える影響額については、現時点で評価中で
す。
(後発事象に関する会計基準等)
・「後発事象に関する会計基準」(企業会計基準第41号 2026年1月9日企業会計基準委員会)
・「後発事象に関する会計基準の適用指針」(企業会計基準適用指針第35号 2026年1月9日企業会計基
準委員会) 等
(1)概要
「後発事象に関する会計基準」等は、後発事象の定義、会計処理および開示等を取り扱う包括的な会計基準
を設定することを優先的な課題とし、日本公認会計士協会監査・保証基準委員会監査基準報告書560実務
指針第1号「後発事象に関する監査上の取扱い」で示されている会計に関する内容を原則として踏襲して企業
会計基準委員会に移管することを基本的な方針として、表現の見直しおよび後発事象の評価期間の整理を行う
とともに、財務諸表の公表の承認に関する注記を新たに求める等、後発事象に関する会計処理および開示につ
いて定めたものです。
(2)適用予定日
2028年3月期の期首から適用します。
(表示方法の変更)
該当事項はありません。
(追加情報)
該当事項はありません。
65/110
EDINET提出書類
ニチコン株式会社(E01904)
有価証券報告書
(連結貸借対照表関係)
非連結子会社および関連会社に対するものは、次のとおりです。
※1
前連結会計年度
(2025年3月31日)
投資有価証券(株式)
※2
4,673百万円
当連結会計年度
(2026年3月31日)
4,794百万円
受取手形、売掛金及び契約資産のうち、顧客との契約から生じた債権の金額は、それぞれ以下のとおりです。
前連結会計年度
(2025年3月31日)
受取手形
812百万円
37,687
売掛金
554百万円
39,095
462
2,603
前連結会計年度
(2025年3月31日)
当連結会計年度
(2026年3月31日)
契約資産
※3
当連結会計年度
(2026年3月31日)
有形固定資産減価償却累計額(減損損失累計額を含む)
159,504百万円
※4
166,971百万円
有形固定資産の取得価額から控除している圧縮記帳額は、次のとおりです。
前連結会計年度
(2025年3月31日)
建物及び構築物
機械装置及び運搬具
土地他
計
当連結会計年度
(2026年3月31日)
1,859百万円
3,265
1,181
1,855百万円
3,259
1,178
6,305
6,292
※5
当社は、運転資金の効率的な調達を行うため取引銀行4行と当座貸越契約を締結しています。この契約に基づ
く当連結会計年度末の借入未実行残高は次のとおりです。
前連結会計年度
(2025年3月31日)
当座貸越極度額および貸出コミッ
トメントの総額
借入実行残高
差引額
当連結会計年度
(2026年3月31日)
20,000百万円
20,000百万円
6,700
8,400
13,300
11,600
(連結損益計算書関係)
※1 顧客との契約から生じる収益
売上高については、顧客との契約から生じる収益およびそれ以外の収益を区分して記載していません。顧客と
の契約から生じる収益の金額は、連結財務諸表「注記事項(収益認識関係) 1.顧客との契約から生じる収益を
分解した情報」に記載しています。
※2
期末棚卸高は収益性の低下に伴う簿価切下後の金額であり、次の棚卸資産評価損が売上原価に含まれていま
す。なお、当該金額は、戻入額と相殺した後の金額です。
前連結会計年度
(自 2024年4月1日
至 2025年3月31日)
当連結会計年度
(自 2025年4月1日
至 2026年3月31日)
240百万円
66/110
180百万円
EDINET提出書類
ニチコン株式会社(E01904)
有価証券報告書
※3
販売費及び一般管理費の内、主要なものは次のとおりです。
前連結会計年度
(自 2024年4月1日
至 2025年3月31日)
運送費
広告宣伝費
3,547百万円
860
3,398百万円
726
給料手当及び賞与
7,559
7,756
賞与引当金繰入額
409
402
役員賞与引当金繰入額
33
35
349
74
製品保証引当金繰入額
1,082
1,177
研究開発費
1,185
1,363
減価償却費
767
775
支払手数料
1,900
2,231
退職給付費用
※4
当連結会計年度
(自 2025年4月1日
至 2026年3月31日)
販売費及び一般管理費ならびに当期総製造費用に含まれる研究開発費の総額
前連結会計年度
(自 2024年4月1日
至 2025年3月31日)
当連結会計年度
(自 2025年4月1日
至 2026年3月31日)
7,230百万円
※5
7,279百万円
固定資産売却益の内容は次のとおりです。
前連結会計年度
(自 2024年4月1日
至 2025年3月31日)
1百万円
1
20
−
建物及び構築物
機械装置及び運搬具
工具、器具及び備品
その他
計
※6
24
5
固定資産処分損の内容は次のとおりです。
前連結会計年度
(自 2024年4月1日
至 2025年3月31日)
31百万円
51
建物及び構築物
機械装置及び運搬具
その他
計
※7
当連結会計年度
(自 2025年4月1日
至 2026年3月31日)
0百万円
5
0
0
当連結会計年度
(自 2025年4月1日
至 2026年3月31日)
33百万円
0
2
3
85
37
減損損失
前連結会計年度(自 2024年4月1日至 2025年3月31日)
当連結会計年度において、当社グループは以下の資産について減損損失を事業構造改革費用に計上しまし
た。
用
途
場
所
種
類
減損損失
事業用資産
マレーシア
機械装置及び運搬具
1,358百万円
遊休資産
中国
機械装置及び運搬具
297百万円
遊休資産
日本
機械装置及び運搬具
164百万円
当社グループは、原則として、事業用資産については事業部門を基準としてグルーピングを行っており、遊
休資産について個別資産ごとにグルーピングを行っております。
前連結会計年度において、当社の連結子会社であるニチコン(マレーシア)センディリアン バハッドが保
有するコンデンサ事業の製造に係る固定資産の一部について、減損の兆候が認められたことから、当該固定資
産に係る回収可能性を検討した結果、回収可能価額まで減額し当該減少額を事業構造改革費用に計上しまし
た。また、当社の連結子会社であるニチコン大野株式会社、ニチコン岩手株式会社および尼吉康電子(宿遷)
有限公司が保有する一部の遊休資産についても帳簿価額を回収可能額まで減額し当該減少額を事業構造改革費
用に計上しました。なお、遊休資産に係る回収可能価額は、正味売却価額により算定しており、正味売却価額
は零円とみなしています。
67/110
EDINET提出書類
ニチコン株式会社(E01904)
有価証券報告書
当連結会計年度(自 2025年4月1日至 2026年3月31日)
当連結会計年度において、当社グループは以下の資産について減損損失を事業構造改革費用に計上しまし
た。
用
途
場
所
種
類
減損損失
事業用資産
日本
機械装置及び運搬具他
448百万円
事業用資産、
遊休資産
中国
機械装置及び運搬具他
431百万円
遊休資産
マレーシア
機械装置及び運搬具他
78百万円
当社グループは、原則として、事業用資産については事業部門を基準としてグルーピングを行っており、遊
休資産について個別資産ごとにグルーピングを行っています。
当連結会計年度において、当社および連結子会社である尼吉康電子(宿遷)有限公司が保有するコンデンサ
事業の製造に係る固定資産の一部について、減損の兆候が認められたことから、当該固定資産に係る回収可能
性を検討した結果、回収可能価額まで減額し当該減少額を事業構造改革費用に計上しました。なお、当該資産
の回収可能価額は使用価値により測定しており、使用価値については、将来キャッシュ・フローに基づく使用
価値が見込まれないことから零として算定しています。
また、当社の連結子会社であるニチコン(マレーシア)センディリアン バハッドおよびニチコン エレクト
ロニクス(無錫)カンパニー リミテッドが保有するコンデンサ事業の製造に係る固定資産の一部の遊休資産に
ついても帳簿価額を回収可能額まで減額し当該減少額を事業構造改革費用に計上しました。なお、遊休資産に
係る回収可能価額は、正味売却価額により算定しており、正味売却価額を零円とみなしています。
※8
投資有価証券評価損
前連結会計年度(自 2024年4月1日
該当事項はありません。
至
2025年3月31日)
当連結会計年度(自 2025年4月1日至 2026年3月31日)
投資有価証券評価損は、実質価額が著しく下落しその回復が見込めないと判断した投資有価証券について評
価減を行ったものであります。
※9
事業構造改革費用
前連結会計年度(自 2024年4月1日至 2025年3月31日)
事業構造改革費用は、コンデンサ事業の構造改善の一環として実施した人員最適化にともなう特別退職金
267百万円および固定資産の減損損失1,820百万円です。
当連結会計年度(自 2025年4月1日至 2026年3月31日)
事業構造改革費用は、コンデンサおよびNECST事業の構造改善の一環として実施した人員合理化に伴う特別
退職金294百万円および固定資産の減損損失957百万円です。
68/110
EDINET提出書類
ニチコン株式会社(E01904)
有価証券報告書
(連結包括利益計算書関係)
その他の包括利益に係る組替調整額ならびに法人税等及び税効果額
※
前連結会計年度
(自 2024年4月1日
至 2025年3月31日)
当連結会計年度
2025年4月1日
2026年3月31日)
(自
至
その他有価証券評価差額金:
当期発生額
組替調整額
△2,393百万円
△2,645
法人税等及び税効果調整前
5,058百万円
△958
法人税等及び税効果額
△5,039
1,414
4,099
△1,287
その他有価証券評価差額金
△3,624
2,812
1,351
−
2,607
−
法人税等及び税効果額
1,351
−
2,607
−
為替換算調整勘定
1,351
2,607
△14
85
△14
85
△2,287
5,505
為替換算調整勘定:
当期発生額
組替調整額
法人税等及び税効果調整前
持分法適用会社に対する持分相当額:
当期発生額
持分法適用会社に対する持分相当額
その他の包括利益合計
(連結株主資本等変動計算書関係)
前連結会計年度(自 2024年4月1日至 2025年3月31日)
1.発行済株式の種類および総数ならびに自己株式の種類および株式数に関する事項
当連結会計年度期
首株式数(千株)
当連結会計年度増
加株式数(千株)
当連結会計年度減
少株式数(千株)
当連結会計年度末
株式数(千株)
発行済株式
普通株式
(注1)
78,000
−
8,000
70,000
自己株式
普通株式
(注2)
9,584
1,256
8,000
2,840
(注)1 普通株式の発行済株式の減少株式数8,000千株は、2025年2月6日開催の取締役会に基づく自己株式の消却に
よるものです。
2 自己株式の数の増加株式数1,256千株は、2025年2月6日開催の取締役会に基づき2025年2月7日から2025年
3月27日までの期間において取得した1,255千株および単元未満株式の買取り1千株によるものであり、自己株
式の数の減少株式数8,000千株は、2025年2月6日開催の取締役会に基づく自己株式の消却によるものです。
2.新株予約権等に関する事項
区分
新株予約権の内訳
提出会社
(親会社)
2024年満期ユーロ円建取得条
項付転換社債型新株予約権付
社債(2019年12月23日発行)
合計
(注)
新株予約権の目的となる株式の数(千株)
新株予約権の
当連結会計
目的となる株当連結会計当連結会計当連結会計当連結会計年度末残高
式の種類
(百万円)
年度期首
年度増加
年度減少
年度末
普通株式
7,222
−
7,222
−
−
−
−
−
−
−
−
新株予約権の目的となる株式の数の減少7,222千株は、満期償還による減少です。
69/110
EDINET提出書類
ニチコン株式会社(E01904)
有価証券報告書
3.配当に関する事項
(1)配当金支払額
株式の種類
(決議)
配当金の総額
(百万円)
1株当たり配当
額(円)
基準日
効力発生日
2024年6月27日
定時株主総会
普通株式
1,163
17.00
2024年3月31日
2024年6月28日
2024年11月6日
取締役会
普通株式
1,163
17.00
2024年9月30日
2024年12月6日
(2)基準日が当連結会計年度に属する配当のうち、配当の効力発生日が翌連結会計年度となるもの
配当金の総額
(百万円)
配当の原資
1,208
利益剰余金
株式の種類
(決議)
2025年6月27日
定時株主総会
普通株式
1株当たり配
当額(円)
18.00
基準日
効力発生日
2025年3月31日
2025年6月30日
当連結会計年度(自 2025年4月1日至 2026年3月31日)
1.発行済株式の種類および総数ならびに自己株式の種類および株式数に関する事項
発行済株式
普通株式
自己株式
普通株式
(注)
当連結会計年度期
首株式数(千株)
当連結会計年度増
加株式数(千株)
当連結会計年度減
少株式数(千株)
当連結会計年度末
株式数(千株)
70,000
−
−
70,000
2,840
0
−
2,841
(注)
自己株式の数の増加株式数0千株は、単元未満株式の買取りによるものです。
2.新株予約権等に関する事項
該当事項はありません。
3.配当に関する事項
(1)配当金支払額
(決議)
株式の種類
配当金の総額
(百万円)
1株当たり配当
額(円)
基準日
効力発生日
2025年6月27日
定時株主総会
普通株式
1,208
18.00
2025年3月31日
2025年6月30日
2025年11月5日
取締役会
普通株式
1,208
18.00
2025年9月30日
2025年12月5日
(2)基準日が当連結会計年度に属する配当のうち、配当の効力発生日が翌連結会計年度となるもの
(決議)
2026年6月26日
定時株主総会
株式の種類
普通株式
配当金の総額
(百万円)
配当の原資
1,276
利益剰余金
70/110
1株当たり配
当額(円)
19.00
基準日
効力発生日
2026年3月31日
2026年6月29日
EDINET提出書類
ニチコン株式会社(E01904)
有価証券報告書
※
(連結キャッシュ・フロー計算書関係)
現金及び現金同等物の期末残高と連結貸借対照表に掲記されている科目の金額との関係
前連結会計年度
(自 2024年4月1日
至 2025年3月31日)
現金及び預金勘定
当連結会計年度
2025年4月1日
2026年3月31日)
(自
至
25,519百万円
預入期間が3か月を超える定期預金
現金及び現金同等物
24,491百万円
−
△50
25,519
24,441
(リース取引関係)
1.ファイナンス・リース取引
所有権移転外ファイナンス・リース取引
①リース資産の内容
主として、電極箔製造設備および金属蒸着フィルム製造設備(機械装置及び運搬具)です。
②リース資産の減価償却の方法
連結財務諸表作成のための基本となる重要な事項「4.会計方針に関する事項(2)重要な減価償却資産
の減価償却方法」に記載のとおりです。
2.オペレーティング・リース取引
オペレーティング・リース取引のうち解約不能のものに係る未経過リース料
(単位:百万円)
前連結会計年度
(2025年3月31日)
当連結会計年度
(2026年3月31日)
1年内
67
67
1年超
124
56
合計
192
124
(金融商品関係)
1.金融商品の状況に関する事項
①金融商品に対する取組方針
当社グループは、運転資金や設備投資資金は主に銀行借入(グリーンローン含む)により調達していま
す。また、一時的な余資は安全性の高い金融資産で運用しています。デリバティブは、外貨建ての営業債権
に係る為替の変動リスクを回避するために利用し、投機的な取引は行っていません。
②金融商品の内容およびそのリスクならびにそのリスク管理体制
営業債権である受取手形及び売掛金ならびに電子記録債権は、顧客の信用リスクに晒されています。当該
リスクに関しては、当社の与信管理規程に従い、取引先ごとの期日管理および残高管理を行うとともに、信
用状況を1年ごとに把握する体制としています。また、外貨建ての売上債権は為替の変動リスクに晒されて
います。
有価証券及び投資有価証券である満期保有目的の債券は、有価証券管理規程に従い、格付けの高い債券の
みを対象としているため、信用リスクは僅少です。投資有価証券である株式は、業務上の関係を有する企業
の株式であり、市場価格の変動リスクに晒されていますが、定期的に時価や発行体(取引先企業)の財務状
況等を把握し、取引先企業との関係を勘案して保有状況を継続的に見直しています。
短期貸付金及び長期貸付金は、関係会社に対するものであり、定期的に貸付先の財務状況等を把握してい
ます。
営業債務である支払手形及び買掛金ならびに電子記録債務は、1年以内の支払期日です。
短期借入金及び長期借入金は、運転資金および設備投資に必要な資金の調達を目的としたものであり、銀
行借入により調達しています。
デリバティブ取引の執行・管理については、当社のデリバティブ管理規程に従って行っており、また、デ
リバティブの利用にあたっては、信用リスクを軽減するために、格付の高い金融機関とのみ取引を行ってい
ます。
営業債務や借入金は、流動性リスク(支払期日に支払いを実行できなくなるリスク)に晒されています
が、当社グループでは、各社が月次に資金繰計画を作成し、流動性リスクを管理しています。
71/110
EDINET提出書類
ニチコン株式会社(E01904)
有価証券報告書
2.金融商品の時価等に関する事項
連結貸借対照表計上額、時価およびこれらの差額については、次のとおりです。
前連結会計年度(2025年3月31日)
連結貸借対照表計上額
時価(百万円)
(百万円)
(1)有価証券及び投資有価証券
(*2)
①満期保有目的の債券
395
393
②その他有価証券
20,860
20,860
③関連会社株式
1,834
4,465
(2)短期貸付金及び長期貸付金
3,096
(*3)
貸倒引当金(*4)
差額(百万円)
△2
−
2,631
△1,262
1,833
1,833
−
資産計
24,924
27,553
2,628
長期借入金(*5)
18,250
18,042
△207
負債計
18,250
18,042
△207
当連結会計年度(2026年3月31日)
連結貸借対照表計上額
(百万円)
(1)有価証券及び投資有価証券
(*2)
①満期保有目的の債券
②その他有価証券
③関連会社株式
(2)短期貸付金及び長期貸付金
(*3)
299
24,322
1,997
貸倒引当金(*4)
△1,533
時価(百万円)
差額(百万円)
297
24,322
5,281
△2
−
3,283
3,636
2,102
2,102
−
資産計
28,722
32,004
3,281
長期借入金(*5)
15,750
15,210
△539
負債計
15,750
15,210
△539
(*1)現金については注記を省略しており、預金、受取手形、売掛金及び契約資産、電子記録債権、支払手形
及び買掛金、電子記録債務、短期借入金は短期間で決済されるため時価が帳簿価額に近似するものであ
ることから、記載を省略しています。
(*2)市場価格のない株式等は、「(1)有価証券及び投資有価証券」には含めていません。当該金融商品の連
結貸借対照表計上額は以下のとおりです。
区分
前連結会計年度(百万円)
非上場株式
当連結会計年度(百万円)
3,697
2,956
(*3)短期貸付金及び長期貸付金には、流動資産の「その他」に含めて表示している短期貸付金および1年内
回収予定の長期貸付金を含めています。
(*4)長期貸付金に個別に計上している貸倒引当金を控除しています。
(*5)長期借入金には、流動負債の1年内返済予定の長期借入金を含めています。
(注1)金銭債権および満期のある有価証券の連結決算日後の償還予定額
前連結会計年度(2025年3月31日)
1年以内
(百万円)
1年超5年以内
(百万円)
5年超10年以内
(百万円)
10年超
(百万円)
100
250
295
986
−
1,045
−
812
350
1,282
1,045
812
有価証券及び投資有価証券
満期保有目的の債券
短期貸付金及び長期貸付金
合計
72/110
EDINET提出書類
ニチコン株式会社(E01904)
有価証券報告書
当連結会計年度(2026年3月31日)
1年以内
(百万円)
1年超5年以内
(百万円)
5年超10年以内
(百万円)
10年超
(百万円)
200
301
99
1,331
−
1,365
−
637
501
1,431
1,365
637
有価証券及び投資有価証券
満期保有目的の債券
短期貸付金及び長期貸付金
合計
(注2)長期借入金の連結決算日後の返済予定額
前連結会計年度(2025年3月31日)
長期借入金(*)
合計
1年以内
(百万円)
1年超
2年以内
(百万円)
2年超
3年以内
(百万円)
3年超
4年以内
(百万円)
4年超
5年以内
(百万円)
5年超
(百万円)
2,500
2,500
1,250
−
12,000
−
2,500
2,500
1,250
−
12,000
−
(*)長期借入金には、流動負債の1年内返済予定の長期借入金を含めています。
当連結会計年度(2026年3月31日)
長期借入金(*)
合計
1年以内
(百万円)
1年超
2年以内
(百万円)
2年超
3年以内
(百万円)
3年超
4年以内
(百万円)
4年超
5年以内
(百万円)
5年超
(百万円)
2,500
1,250
−
12,000
−
−
2,500
1,250
−
12,000
−
−
(*)長期借入金には、流動負債の1年内返済予定の長期借入金を含めています。
3.金融商品の時価のレベルごとの内訳等に関する事項
金融商品の時価を、時価の算定に用いたインプットの観察可能性および重要性に応じて、以下の3つのレ
ベルに分類しています。
レベル1の時価:観察可能な時価の算定に係るインプットのうち、活発な市場において形成される当該時
価の算定の対象となる資産または負債に関する相場価格により算定した時価
レベル2の時価:観察可能な時価の算定に係るインプットのうち、レベル1のインプット以外の時価の算
定に係るインプットを用いて算定した時価
レベル3の時価:観察できない時価の算定に係るインプットを使用して算定した時価
時価の算定に重要な影響を与えるインプットを複数使用している場合には、それらのインプットがそれぞ
れ属するレベルのうち、時価の算定における優先順位が最も低いレベルに時価を分類しています。
(1)時価で連結貸借対照表に計上している金融商品
前連結会計年度(2025年3月31日)
区分
時価(百万円)
レベル1
レベル2
レベル3
合計
有価証券及び投資有価証券
その他有価証券
資産計
20,860
−
−
20,860
20,860
−
−
20,860
当連結会計年度(2026年3月31日)
区分
時価(百万円)
レベル1
レベル2
レベル3
合計
有価証券及び投資有価証券
その他有価証券
資産計
24,322
−
−
24,322
24,322
−
−
24,322
73/110
EDINET提出書類
ニチコン株式会社(E01904)
有価証券報告書
(2)時価で連結貸借対照表上に計上している金融商品以外の金融商品
前連結会計年度(2025年3月31日)
区分
時価(百万円)
レベル1
レベル2
レベル3
合計
有価証券及び投資有価証券
満期保有目的の債券
関連会社株式
短期貸付金及び長期貸付金
貸倒引当金
資産計
長期借入金
負債計
−
4,465
−
−
393
−
3,096
△1,262
−
−
−
−
393
4,465
3,096
△1,262
−
1,833
−
1,833
4,465
2,226
−
6,692
−
18,042
−
18,042
−
18,042
−
18,042
当連結会計年度(2026年3月31日)
区分
時価(百万円)
レベル1
レベル2
レベル3
合計
有価証券及び投資有価証券
満期保有目的の債券
関連会社株式
短期貸付金及び長期貸付金
貸倒引当金
資産計
長期借入金
負債計
−
5,281
−
−
297
−
3,636
△1,533
−
−
−
−
297
5,281
3,636
△1,533
−
2,102
−
2,102
5,281
2,400
−
7,681
−
15,210
−
15,210
−
15,210
−
15,210
(注) 時価の算定に用いた評価技法及び時価の算定に係るインプットの説明
有価証券及び投資有価証券
社債の時価は、取引金融機関から提示された価格に基づいているため、その時価をレベル2の時価に分類して
います。上場株式の時価は相場価格を用いて評価しています。上場株式は活発な市場で取引されているため、そ
の時価をレベル1の時価に分類しています。
短期貸付金及び長期貸付金
元利金の合計額を同様の新規貸付を行った場合に想定される利率で割り引いて算定する方法によって算出して
おり、その時価をレベル2の時価に分類しています。
長期借入金(1年内返済予定の長期借入金を含む)
元利金の合計額を同様の新規借入を行った場合に想定される利率で割り引いて算定する方法によって算出して
おり、その時価をレベル2の時価に分類しています。
74/110
EDINET提出書類
ニチコン株式会社(E01904)
有価証券報告書
(有価証券関係)
1.満期保有目的の債券
前連結会計年度(2025年3月31日)
連結貸借対照表
計上額
(百万円)
種類
時価が連結貸借対照表
計上額を超えないもの
社債
合計
時価(百万円)
差額(百万円)
395
393
△2
395
393
△2
当連結会計年度(2026年3月31日)
連結貸借対照表
計上額
(百万円)
種類
時価が連結貸借対照表
計上額を超えないもの
社債
合計
時価(百万円)
差額(百万円)
299
297
△2
299
297
△2
2.その他有価証券
前連結会計年度(2025年3月31日)
連結貸借対照表計上額が
取得原価を超えるもの
種類
連結貸借対照表
計上額
(百万円)
株式
20,860
5,277
15,582
20,860
5,277
15,582
合計
取得原価(百万円)
差額(百万円)
(注)非上場株式(連結貸借対照表計上額3,697百万円、うち非連結子会社株式および関連会社株式2,839
百万円)については、市場価格のない株式等であることから、上表の「その他有価証券」には含め
ていません。
当連結会計年度(2026年3月31日)
連結貸借対照表計上額が
取得原価を超えるもの
種類
連結貸借対照表
計上額
(百万円)
株式
24,322
4,640
19,682
24,322
4,640
19,682
合計
取得原価(百万円)
差額(百万円)
(注)非上場株式(連結貸借対照表計上額2,956百万円、うち非連結子会社株式および関連会社株式2,797
百万円)については、市場価格のない株式等であることから、上表の「その他有価証券」には含め
ていません。
3.売却したその他有価証券
前連結会計年度(自 2024年4月1日
種類
売却損の合計額
(百万円)
3,122
2,645
−
3,122
2,645
−
売却額
(百万円)
売却益の合計額
(百万円)
売却損の合計額
(百万円)
1,596
958
−
1,596
958
−
合計
種類
株式
合計
2025年3月31日)
売却益の合計額
(百万円)
株式
当連結会計年度(自
至
売却額
(百万円)
2025年4月1日
至
2026年3月31日)
75/110
EDINET提出書類
ニチコン株式会社(E01904)
有価証券報告書
4.減損処理を行った有価証券
前連結会計年度(自 2024年4月1日
至
2025年3月31日)
該当事項はありません。
当連結会計年度(自 2025年4月1日
至
2026年3月31日)
投資有価証券について、799百万円の減損処理を行っています。
なお、減損処理にあたっては、株式発行会社の財政状態の悪化により実質価値が著しく低下しているも
のについて減損処理を行っています。
(デリバティブ取引関係)
1.ヘッジ会計が適用されていないデリバティブ取引
重要性が乏しいため、記載を省略しています。
2.ヘッジ会計が適用されているデリバティブ取引
重要性が乏しいため、記載を省略しています。
(退職給付関係)
1.採用している退職給付制度の概要
当社および一部の連結子会社は、従業員の退職給付に充てるため、積立型、非積立型の確定給付制度および
確定拠出制度を採用しています。
確定給付企業年金制度および退職一時金制度では、給与と勤務期間に基づいた一時金または年金を支給しま
す。
なお、一部の連結子会社が有する確定給付企業年金制度および退職一時金制度は、簡便法により退職給付に
係る負債および退職給付費用を計算しています。
2.確定給付制度
(1)退職給付債務の期首残高と期末残高の調整表(簡便法を適用した制度を除く。)
前連結会計年度
当連結会計年度
(自 2024年4月1日
(自 2025年4月1日
至 2025年3月31日)
至 2026年3月31日)
退職給付債務の期首残高
11,090百万円
11,483百万円
勤務費用
650
674
利息費用
89
92
数理計算上の差異の発生額
363
△902
退職給付の支払額
△710
△698
退職給付債務の期末残高
11,483
10,648
(2)年金資産の期首残高と期末残高の調整表(簡便法を適用した制度を除く。)
前連結会計年度
当連結会計年度
(自 2024年4月1日
(自 2025年4月1日
至 2025年3月31日)
至 2026年3月31日)
年金資産の期首残高
10,122百万円
10,391百万円
期待運用収益
151
155
数理計算上の差異の発生額
△71
7
事業主からの拠出額
856
941
退職給付の支払額
△668
△688
年金資産の期末残高
10,391
10,807
76/110
EDINET提出書類
ニチコン株式会社(E01904)
有価証券報告書
(3)簡便法を適用した制度の、退職給付に係る負債(△は資産)の期首残高と期末残高の調整表
前連結会計年度
当連結会計年度
(自 2024年4月1日
(自 2025年4月1日
至 2025年3月31日)
至 2026年3月31日)
退職給付に係る負債(△は資産)の期首残高
46百万円
32百万円
退職給付費用
92
104
確定給付の支払額
△69
△55
制度への拠出額
△37
△39
退職給付に係る負債(△は資産)の期末残高
32
40
(注)なお、上記退職給付に係る負債(△は資産)の期末残高の内訳は、退職給付に係る負債(前連結会計年
度181百万円、当連結会計年度175百万円)および退職給付に係る資産(前連結会計年度149百万円、当
連結会計年度134百万円)です。
(4)退職給付債務および年金資産の期末残高と連結貸借対照表に計上された退職給付に係る負債の調整表
前連結会計年度
(2025年3月31日)
積立型制度の退職給付債務
年金資産
11,527百万円
△10,855
当連結会計年度
(2026年3月31日)
10,729百万円
△11,279
671
△550
452
432
連結貸借対照表に計上された負債と資産の純額
1,124
△118
退職給付に係る負債
退職給付に係る資産
1,462
338
802
920
連結貸借対照表に計上された負債と資産の純額
1,124
△118
非積立型制度の退職給付債務
(注)簡便法を適用した制度を含んでいます。
(5)退職給付費用およびその内訳項目の金額
前連結会計年度
当連結会計年度
(自 2024年4月1日
(自 2025年4月1日
至 2025年3月31日)
至 2026年3月31日)
勤務費用
650百万円
674百万円
利息費用
89
92
期待運用収益
△151
△155
数理計算上の差異の費用処理額
435
△909
簡便法で計算した退職給付費用
92
104
確定給付制度に係る退職給付費用
1,115
△195
(注)上記退職給付費用以外に特別退職金を特別損失の「事業構造改革費用」として、前連結会計年度267
百万円、当連結会計年度294百万円計上しています。
(6)退職給付に係る調整額および退職給付に係る調整累計額
該当事項はありません。
(7)年金資産に関する事項
①年金資産の主な内訳
保険資産(一般勘定)
債券
株式
その他
合計
前連結会計年度
(2025年3月31日)
84.0%
15.8
0.2
0.0
100.0
当連結会計年度
(2026年3月31日)
83.5%
16.2
0.2
0.1
100.0
②長期期待運用収益率の設定方法
年金資産の長期期待運用収益率を決定するため、現在および予想される年金資産の配分と、年金資産を構
成する多様な資産からの現在および将来期待される長期の収益率を考慮しています。
77/110
EDINET提出書類
ニチコン株式会社(E01904)
有価証券報告書
(8)数理計算上の計算基礎に関する事項
主要な数理計算上の計算基礎(加重平均で表しています。)
前連結会計年度
(2025年3月31日)
割引率
0.8%
長期期待運用収益率
1.5%
予定昇給率
2.0%
当連結会計年度
(2026年3月31日)
2.3%
1.5%
3.0%
(注)予想昇給率については、前連結会計年度は2024年11月30日、当連結会計年度は2025年11月30日を基
準日として算定した年齢別予定昇給指数を使用しています。
3.確定拠出制度
当社および在外連結子会社の一部の確定拠出制度への要拠出額は、前連結会計年度31百万円、当連結会計
年度33百万円です。
(税効果会計関係)
1.繰延税金資産および繰延税金負債の発生の主な原因別の内訳
前連結会計年度
(2025年3月31日)
当連結会計年度
(2026年3月31日)
4,739百万円
3,431百万円
繰延税金資産
税務上の繰越欠損金(注)
貸倒引当金
494
賞与引当金
製品保証引当金
退職給付に係る負債
有形固定資産
その他
繰延税金資産小計
612
442
455
1,188
1,497
394
39
2,316
1,762
921
1,477
10,498
9,276
税務上の繰越欠損金に係る評価性引当額(注)
△4,050
△2,163
将来減算一時差異等の合計に係る評価性引当額
△5,593
△4,743
評価性引当額小計
△9,643
△6,906
繰延税金資産合計
854
2,370
△4,893
△6,180
繰延税金負債
その他有価証券評価差額金
固定資産圧縮積立金
△24
△24
その他
△440
△400
繰延税金負債合計
△5,357
△6,605
繰延税金負債の純額
△4,502
△4,234
(注)
税務上の繰越欠損金及びその繰延税金資産の繰越期限別の金額
前連結会計年度(2025年3月31日)
1年以内
(百万
円)
1年超
2年以内
(百万
円)
2年超
3年以内
(百万
円)
3年超
4年以内
(百万
円)
4年超
5年以内
(百万
円)
税務上の繰越
欠損金(※1)
1
100
84
3,219
717
616
4,739
評価性引当額
△1
△100
△84
△2,557
△717
△589
△4,050
繰延税金資産
−
−
−
662
−
26
(※2)688
5年超
(百万
円)
合計
(百万円)
(※1)税務上の繰越欠損金は、法定実効税率を乗じた額です。
(※2)税務上の繰越欠損金4,739百万円(法定実効税率を乗じた額)について、主として当社において繰延
税金資産688百万円を計上しています。当該税務上の繰越欠損金については、将来の課税所得の見込みによ
り回収可能と判断しています。
78/110
EDINET提出書類
ニチコン株式会社(E01904)
有価証券報告書
当連結会計年度(2026年3月31日)
1年以内
(百万
円)
1年超
2年以内
(百万
円)
2年超
3年以内
(百万
円)
3年超
4年以内
(百万
円)
4年超
5年以内
(百万
円)
税務上の繰越
欠損金(※1)
11
−
1,718
721
296
682
3,431
評価性引当額
△9
−
△495
△716
△296
△645
△2,163
繰延税金資産
2
−
1,223
5
−
37
(※2)1,268
5年超
(百万
円)
合計
(百万円)
(※1)税務上の繰越欠損金は、法定実効税率を乗じた額です。
(※2)税務上の繰越欠損金3,431百万円(法定実効税率を乗じた額)について、主として当社において繰延
税金資産1,268百万円を計上しています。当該税務上の繰越欠損金については、将来の課税所得の見込みに
より回収可能と判断しています。
2.法定実効税率と税効果会計適用後の法人税等の負担率との間に重要な差異があるときの、当該差異の原因と
なった主要な項目別の内訳
前連結会計年度
(2025年3月31日)
法定実効税率
(調整)
交際費等永久差異
住民税等均等割額
特別控除
貸倒引当金消去に伴う調整
外国源泉税等
海外子会社税率差異
持分法投資損益
評価性引当額の増減
軽減税率適用の差異
その他
税効果会計適用後の法人税等の負担率
30.6%
△0.2
0.2
△6.0
3.4
0.6
△1.2
△1.7
2.3
0.1
△2.8
25.3
当連結会計年度
(2026年3月31日)
30.6%
2.4
0.3
△4.9
6.1
0.9
△1.5
△0.9
△27.6
0.4
△0.6
5.2
3.法人税および地方法人税の会計処理またはこれらに関する税効果会計の会計処理
当社および国内連結子会社は、グループ通算制度を適用しており、「グループ通算制度を適用する場合の
会計処理及び開示に関する取扱い」(実務対応報告第42号 2021年8月12日)に従って、法人税および地方
法人税の会計処理またはこれらに関する税効果会計の会計処理ならびに開示を行っています。
79/110
EDINET提出書類
ニチコン株式会社(E01904)
有価証券報告書
(企業結合等関係)
該当事項はありません。
(資産除去債務関係)
該当事項はありません。
(賃貸等不動産関係)
重要性が乏しいため、記載を省略しています。
(収益認識関係)
1.顧客との契約から生じる収益を分解した情報
前連結会計年度(自 2024年4月1日至 2025年3月31日)
(単位:百万円)
報告セグメント
コンデンサ
NECST
合計
売上高
(所在地)
日本
31,241
58,421
89,662
米国
13,849
2
13,852
アジア
44,073
18,159
62,232
欧州他
10,003
−
10,003
合計
99,168
76,583
175,751
99,168
75,028
174,196
−
1,555
1,555
99,168
76,583
175,751
(収益の認識時期)
一時点で移転される財
一定の期間にわたり移転される財
合計
当連結会計年度(自
2025年4月1日
至
2026年3月31日)
(単位:百万円)
報告セグメント
コンデンサ
NECST
合計
売上高
(所在地)
日本
31,946
52,553
84,499
米国
14,668
18
14,687
アジア
46,696
14,404
61,101
欧州他
9,436
−
9,436
合計
102,748
66,976
169,724
102,748
64,240
166,988
−
2,736
2,736
102,748
66,976
169,724
(収益の認識時期)
一時点で移転される財
一定の期間にわたり移転される財
合計
2.顧客との契約から生じる収益を理解するための基礎となる情報
顧客との契約から生じる収益を理解するための基礎となる情報は、「連結財務諸表作成のための基本となる重
要な事項 4.会計方針に関する事項(5)重要な収益および費用の計上基準」に記載のとおりです。
80/110
EDINET提出書類
ニチコン株式会社(E01904)
有価証券報告書
3.当連結会計年度および翌連結会計年度以降の収益の金額を理解するための情報
契約資産は主に、一定期間にわたり充足した履行義務に係る対価に対する当社グループの権利であり、請求権
が確定した時点で債権に振り替えられます。顧客との契約から生じた債権は、別途定める取引条件により、履行
義務の充足後、概ね1年以内に対価を受領しています。
契約負債は主に、製品の引渡など履行義務の完了前に顧客から受け取った対価です。
(1)契約資産および契約負債の残高等
前連結会計年度
当連結会計年度
顧客との契約から生じた債権(期首残高)
40,159百万円
38,500百万円
顧客との契約から生じた債権(期末残高)
38,500
39,649
契約資産(期首残高)
−
462
契約資産(期末残高)
462
2,603
契約負債(期首残高)
2,902
567
契約負債(期末残高)
567
1,124
当連結会計年度に認識された収益のうち、期首現在の契約負債の残高が含まれている金額は567百万円です。
なお、当連結会計年度において、過去の期間に充足した履行義務から認識した収益の額はありません。
(2)残存履行義務に配分した取引価額
一部顧客との契約における残存履行義務に配分した取引価額の総額および収益の認識が見込まれる期間は、
以下のとおりであります。
前連結会計年度
当連結会計年度
1年以内
1,294百万円
1年超
−
922
1,294
2,724
合計
1,801百万円
当社グループにおいては、上記を除いて個別の契約期間が1年を超える取引がないため、実務上の便法を適
用し、当初に予想される契約期間が1年以内の契約について残存履行義務に関する情報の記載を省略していま
す。また、顧客との契約から生じる対価の中に、取引価格に含まれていない重要な金額はありません。
81/110
EDINET提出書類
ニチコン株式会社(E01904)
有価証券報告書
(セグメント情報等)
【セグメント情報】
1.報告セグメントの概要
当社グループの報告セグメントは、当社グループの構成単位のうち分離された財務情報が入手可能であり、取
締役会や経営会議が、経営資源の配分の決定および経営成績を評価するために、定期的に検討を行う対象となっ
ているものです。
当社グループは、製品・サービス別に事業本部を置き、各事業本部は取り扱う製品・サービスについて国内お
よび海外の包括的な戦略を立案し、事業活動を展開しています。
したがって、当社は、事業本部を基礎とした製品・サービス別のセグメントから構成されており、「コンデン
サ事業」および「NECST事業」の2つを報告セグメントとしています。
「コンデンサ事業」は、主にアルミ電解コンデンサ、フィルムコンデンサ、小形リチウムイオン二次電池、パ
ワーエレクトロニクス用フィルムコンデンサおよびxEV用フィルムコンデンサの製造販売等を行っています。
「NECST事業」は、主に家庭用蓄電システム、V2Hシステム、・トライブリッド蓄電システム、EV・PHEV用急速充
電器、外部給電器、スイッチング電源、機能モジュール、公共・産業用蓄電システム、大型特殊電源、医療用/
学術用加速器電源の製造販売等を行っています。
2.報告セグメントごとの売上高、利益又は損失、資産その他の項目の金額の算定方法
報告されている事業セグメントの会計処理の方法は、「連結財務諸表作成のための基本となる重要な事項」に
おける記載と概ね同一です。
報告セグメントの損益は、営業損益ベースの数値です。セグメント間の内部収益および振替高は市場実勢価格
に基づいています。
3.報告セグメントごとの売上高、利益又は損失、資産、その他の項目の金額に関する情報
Ⅰ 前連結会計年度(自 2024年4月1日至 2025年3月31日)
(単位:百万円)
報告セグメント
コンデンサ事業
NECST事業
調整額
(注1)
計
連結財務諸表計
上額(注2)
売上高
99,168
76,583
175,751
−
175,751
532
94
627
△627
−
計
99,700
76,677
176,378
△627
175,751
セグメント利益
1,551
3,648
5,200
3
5,203
セグメント資産
136,169
49,427
185,597
6,985
192,582
減価償却費
6,767
1,698
8,465
−
8,465
減損損失(注3)
1,820
−
1,820
−
1,820
持分法適用会社への投資額
3,806
−
3,806
−
3,806
有形固定資産および無形固
定資産の増加額
9,153
1,976
11,129
−
11,129
外部顧客への売上高
セグメント間の内部売上高
又は振替高
その他の項目
(注)1
調整額は以下のとおりです。
(1)セグメント売上高の調整額は、セグメント間の取引消去等です。
(2)セグメント資産の調整額6,985百万円には、各報告セグメントに配分していないセグメント間消去△1,129
百万円と全社資産8,115百万円が含まれています。全社資産は、主に本社管理部門などにかかる固定資産
です。
2 セグメント利益は、連結損益計算書の営業利益と調整を行っています。
3 連結損益計算書上、「事業構造改革費用」に含まれています。
82/110
EDINET提出書類
ニチコン株式会社(E01904)
有価証券報告書
Ⅱ
当連結会計年度(自
2025年4月1日
至
2026年3月31日)
(単位:百万円)
報告セグメント
コンデンサ事業
NECST事業
調整額
(注1)
計
連結財務諸表計
上額(注2)
売上高
102,748
66,976
169,724
−
169,724
805
0
805
△805
−
計
103,553
66,977
170,530
△805
169,724
セグメント利益
4,598
1,860
6,458
△2
6,456
セグメント資産
141,072
47,634
188,707
6,863
195,570
6,353
1,724
8,077
−
8,077
投資有価証券評価損
−
799
799
−
799
減損損失(注3)
957
−
957
−
957
持分法適用会社への投資額
3,927
−
3,927
−
3,927
有形固定資産および無形固
定資産の増加額
6,001
1,566
7,568
−
7,568
外部顧客への売上高
セグメント間の内部売上高
又は振替高
その他の項目
減価償却費
(注)1
調整額は以下のとおりです。
(1)セグメント売上高の調整額は、セグメント間の取引消去等です。
(2)セグメント資産の調整額6,863百万円には、各報告セグメントに配分していないセグメント間消去△565百
万円と全社資産7,428百万円が含まれています。全社資産は、主に本社管理部門などにかかる固定資産で
す。
2 セグメント利益は、連結損益計算書の営業利益と調整を行っています。
3 連結損益計算書上、「事業構造改革費用」に含まれています。
【関連情報】
前連結会計年度(自
2024年4月1日
至
2025年3月31日)
1.製品およびサービスごとの情報
(単位:百万円)
コンデンサ事業
外部顧客への売上高
NECST事業
99,168
合
76,583
計
175,751
2.地域ごとの情報
(1)売上高
(単位:百万円)
日本
米州
中華圏
88,853
13,852
アジア
45,622
17,420
欧州他
10,003
合
計
175,751
(注)1.売上高は顧客の所在地を基礎とし、国または地域に分類しています。
2.中華圏に属する主な国または地域は、中国・香港・台湾です。
(2)有形固定資産
日本
40,233
(単位:百万円)
米国
中華圏
357
マレーシア
6,715
5,653
(注)中華圏に属する国または地域は、中国・香港・台湾です。
83/110
その他
126
合
計
53,086
EDINET提出書類
ニチコン株式会社(E01904)
有価証券報告書
3.主要な顧客ごとの情報
当社グループは、連結損益計算書の売上高の10%以上である単一の外部顧客への売上高がないため、主要
な顧客ごとの情報の記載を省略しています。
当連結会計年度(自
2025年4月1日
至
2026年3月31日)
1.製品およびサービスごとの情報
(単位:百万円)
コンデンサ事業
外部顧客への売上高
NECST事業
102,748
合
66,976
計
169,724
2.地域ごとの情報
(1)売上高
(単位:百万円)
日本
米州
中華圏
83,611
14,687
アジア
45,098
欧州他
16,891
合
9,436
計
169,724
(注)1.売上高は顧客の所在地を基礎とし、国または地域に分類しています。
2.中華圏に属する主な国または地域は、中国・香港・台湾です。
(2)有形固定資産
日本
39,641
(単位:百万円)
米国
中華圏
363
マレーシア
5,258
その他
7,216
合
58
計
52,538
(注)中華圏に属する国または地域は、中国・香港・台湾です。
3.主要な顧客ごとの情報
当社グループは、連結損益計算書の売上高の10%以上である単一の外部顧客への売上高がないため、主要
な顧客ごとの情報の記載を省略しています。
【報告セグメントごとの固定資産の減損損失に関する情報】
前連結会計年度(自 2024年4月1日至 2025年3月31日)
(単位:百万円)
報告セグメント
消去
コンデンサ事業
減損損失
NECST事業
1,820
−
合計
計
1,820
−
1,820
(注)減損損失は、特別損失の事業構造改革費用に含まれています。
当連結会計年度(自
2025年4月1日
至
2026年3月31日)
(単位:百万円)
報告セグメント
消去
コンデンサ事業
減損損失
957
NECST事業
−
957
(注)減損損失は、特別損失の事業構造改革費用に含まれています。
【報告セグメントごとののれんの償却額及び未償却残高に関する情報】
該当事項はありません。
【報告セグメントごとの負ののれん発生益に関する情報】
該当事項はありません。
84/110
合計
計
−
957
EDINET提出書類
ニチコン株式会社(E01904)
有価証券報告書
【関連当事者情報】
前連結会計年度(自 2024年4月1日至 2025年3月31日)
1.連結財務諸表提出会社と関連当事者との取引
・連結財務諸表提出会社の非連結子会社及び関連会社等
種類
会社等の名
称又は氏名
所在地
非連結
子会社
ハーバー
電子㈱
長野県諏訪
市
資本金又は
出資金
(百万円)
20
事業の内容
又は職業
製造業
議決権等の所
有(被所有)
割合(%)
(所有)
直接
47.5
間接
31.5
関連当事者
との関係
取引の内取引金額
容
(百万円)
資金の援助
資金の貸
付
−
期末残高
(百万円)
科目
長期貸付
金(注
1.2)
2,644
(注)1.資金の貸付については、市場金利を勘案して利率を合理的に決定しています。なお、担保は受け入れてお
りません。
2.子会社への貸付金に対し、貸倒引当金を計上しています。なお、長期貸付金には1年内回収予定の長期貸
付金を含めています。
2.連結財務諸表提出会社の連結子会社と関連当事者との取引
該当事項はありません。
当連結会計年度(自 2025年4月1日至 2026年3月31日)
1.連結財務諸表提出会社と関連当事者との取引
・連結財務諸表提出会社の非連結子会社及び関連会社等
種類
会社等の名
称又は氏名
所在地
非連結
子会社
ハーバー
電子㈱
長野県諏訪
市
資本金又は
出資金
(百万円)
20
事業の内容
又は職業
議決権等の所
有(被所有)
割合(%)
関連当事者
との関係
取引の内取引金額
容
(百万円)
製造業
(所有)
直接
47.5
間接
52.5
資金の援助
資金の貸
付
資金の回
収
790
198
期末残高
(百万円)
科目
長期貸付
金(注
1.2)
3,236
(注)1.資金の貸付については、市場金利を勘案して利率を合理的に決定しています。なお、担保は受け入れてお
りません。
2.子会社への貸付金に対し、貸倒引当金を計上しています。なお、長期貸付金には1年内回収予定の長期貸
付金を含めています。
2.連結財務諸表提出会社の連結子会社と関連当事者との取引
該当事項はありません。
(1株当たり情報)
前連結会計年度
(自 2024年4月1日
至 2025年3月31日)
1株当たり純資産額
1株当たり当期純利益
当連結会計年度
(自 2025年4月1日
至 2026年3月31日)
1,644.33円
1,780.91円
86.04円
93.97円
(注)1.潜在株式調整後1株当たり当期純利益については、潜在株式が存在しないため記載していません。
2.1株当たり当期純利益および算定上の基礎は、以下のとおりです。
前連結会計年度
(自 2024年4月1日
至 2025年3月31日)
当連結会計年度
(自 2025年4月1日
至 2026年3月31日)
5,877
6,310
−
−
普通株式に係る親会社株主に帰属する当期純利
益(百万円)
5,877
6,310
普通株式の期中平均株式数(千株)
68,309
67,158
1株当たり当期純利益
親会社株主に帰属する当期純利益(百万円)
普通株主に帰属しない金額(百万円)
(重要な後発事象)
該当事項はありません。
85/110
EDINET提出書類
ニチコン株式会社(E01904)
有価証券報告書
⑤【連結附属明細表】
【社債明細表】
該当事項はありません。
【借入金等明細表】
当期首残高
(百万円)
当期末残高
(百万円)
短期借入金
1年以内に返済予定の長期借入金
1年以内に返済予定のリース債務
長期借入金(1年以内に返済予定のものを除く。)
リース債務(1年以内に返済予定のものを除く。)
その他有利子負債
預り保証金
6,700
2,500
392
15,750
913
8,400
2,500
363
13,250
623
1.2
0.3
−
1.0
−
−
−
−
2027年〜2029年
2027年〜2036年
297
274
0.5
−
合計
26,554
25,411
区分
平均利率
(%)
−
返済期限
−
(注)1.平均利率については、当期末残高に対する加重平均利率を記載しています。
2.リース債務の平均利率については、リース料総額に含まれる利息相当額を控除する前の金額でリース債務
を連結貸借対照表に計上しているため、記載していません。
3.1年以内に返済予定のリース債務については、流動負債「その他」へ含めています。
4.長期借入金およびリース債務(1年以内に返済予定のものを除く。)の連結決算日後5年間の返済予定額
は以下のとおりです。
1年超2年以内
(百万円)
2年超3年以内
(百万円)
3年超4年以内
(百万円)
4年超5年以内
(百万円)
長期借入金
1,250
−
12,000
−
リース債務
279
83
73
68
5.預り保証金は、取引先と当社との間で債権等の弁済を担保するために差入れされたものであり、返済期限
はありません。なお、当該科目は、固定負債「その他」へ含めています。
【資産除去債務明細表】
該当事項はありません。
(2)【その他】
当連結会計年度における半期情報等
中間連結会計期間当連結会計年度
売上高(百万円)
80,732
169,724
税金等調整前中間(当期)純利益(百万円)
2,343
7,201
親会社株主に帰属する中間(当期)純利益
(百万円)
1,620
6,310
1株当たり中間(当期)純利益(円)
24.12
93.97
86/110
EDINET提出書類
ニチコン株式会社(E01904)
有価証券報告書
2【財務諸表等】
(1)【財務諸表】
①【貸借対照表】
(単位:百万円)
前事業年度
(2025年3月31日)
資産の部
流動資産
現金及び預金
受取手形
電子記録債権
売掛金
契約資産
商品及び製品
仕掛品
原材料及び貯蔵品
その他
貸倒引当金
流動資産合計
固定資産
有形固定資産
建物
構築物
機械及び装置
車両運搬具
工具、器具及び備品
土地
リース資産
建設仮勘定
有形固定資産合計
無形固定資産
投資その他の資産
投資有価証券
関係会社株式
長期貸付金
その他
貸倒引当金
投資その他の資産合計
固定資産合計
資産合計
87/110
当事業年度
(2026年3月31日)
8,481
719
5,311
※2 37,694
462
5,389
103
1,307
※2 5,356
△52
64,774
6,435
540
4,646
※2 38,583
2,603
4,994
97
1,486
※2 6,459
△62
65,784
9,357
118
1,518
19
871
5,549
17
1,463
※1 18,914
9,004
104
531
15
565
5,549
12
2,524
※1 18,308
1,472
1,799
21,719
15,165
※2 24,588
665
△6,456
55,683
76,071
140,845
24,481
13,138
※2 22,959
754
△5,923
55,410
75,518
141,302
EDINET提出書類
ニチコン株式会社(E01904)
有価証券報告書
(単位:百万円)
前事業年度
(2025年3月31日)
負債の部
流動負債
電子記録債務
買掛金
短期借入金
1年内返済予定の長期借入金
未払金
未払費用
未払法人税等
契約負債
賞与引当金
役員賞与引当金
その他
流動負債合計
固定負債
長期借入金
繰延税金負債
退職給付引当金
製品保証引当金
その他
固定負債合計
負債合計
純資産の部
株主資本
資本金
資本剰余金
資本準備金
資本剰余金合計
利益剰余金
利益準備金
その他利益剰余金
固定資産圧縮積立金
別途積立金
繰越利益剰余金
利益剰余金合計
自己株式
株主資本合計
評価・換算差額等
その他有価証券評価差額金
評価・換算差額等合計
純資産合計
負債純資産合計
88/110
当事業年度
(2026年3月31日)
1,360
1,512
※2 23,213
※2 18,224
※3 6,700
※3 8,400
2,500
2,500
※2 2,576
※2 1,592
629
533
123
441
33
974
39,085
689
665
710
450
35
411
35,191
15,750
4,228
632
3,466
565
24,643
63,729
13,250
4,575
322
4,412
537
23,098
58,290
14,286
14,286
17,065
17,065
17,065
17,065
2,141
2,141
55
16,517
19,858
38,573
△3,497
66,426
54
16,517
22,944
41,657
△3,498
69,510
10,689
10,689
77,116
140,845
13,502
13,502
83,012
141,302
EDINET提出書類
ニチコン株式会社(E01904)
有価証券報告書
②【損益計算書】
(単位:百万円)
(自
至
前事業年度
2024年4月1日
2025年3月31日)
(自
至
当事業年度
2025年4月1日
2026年3月31日)
売上高
※2 140,670
※2 134,719
売上原価
売上総利益
※2 125,517
※2 120,492
15,153
※1 11,820
※1 12,306
3,333
1,921
※2 4,093
※2 3,867
777
634
※2 158
938
625
※2 301
5,663
5,733
119
78
57
255
8,741
219
−
25
244
7,409
※3 2
2,640
2,642
−
958
958
販売費及び一般管理費
営業利益
営業外収益
受取利息及び配当金
為替差益
貸倒引当金戻入額
その他
営業外収益合計
営業外費用
支払利息
和解金
その他
営業外費用合計
経常利益
特別利益
固定資産売却益
投資有価証券売却益
特別利益合計
特別損失
固定資産処分損
投資有価証券評価損
関係会社株式評価損
事業構造改革費用
特別損失合計
税引前当期純利益
法人税、住民税及び事業税
法人税等調整額
法人税等合計
当期純利益
89/110
14,227
※4 0
※4 1
−
−
−
0
11,383
842
270
1,113
10,269
※5 799
※6 2,027
※7,※8 572
3,400
4,967
405
△940
△534
5,502
EDINET提出書類
ニチコン株式会社(E01904)
有価証券報告書
【製造原価明細書】
前事業年度
(自 2024年4月1日
至 2025年3月31日)
注記
番号
区分
Ⅰ
材料費
Ⅱ
労務費
Ⅲ
構成比
(%)
金額(百万円)
※1
当事業年度
(自 2025年4月1日
至 2026年3月31日)
構成比
(%)
金額(百万円)
35,638
87.7
36,077
88.6
2,149
5.3
1,928
4.7
2,708
6.7
40,714
100.0
経費
1.電力・ガス・水道料
33
25
2.旅費交通費
92
85
3.通信費
13
14
4.減価償却費
825
1,872
5.その他
当期総製造費用
992
2,836
7.0
40,624
100.0
437
103
41,062
40,818
103
97
仕掛品期首棚卸高
合計
1,589
仕掛品期末棚卸高
他勘定振替高
※2
928
750
当期製品製造原価
※3
40,030
39,969
原価計算の方法
原価計算の方法は、総合原価計算による実際原価計算を採用しています。
(注)※1.引当金繰入額の内訳は次のとおりです。
(単位:百万円)
前事業年度
当事業年度
退職給付費用
項目
52
21
賞与引当金繰入額
121
137
※2.他勘定振替高の内訳は次のとおりです。
(単位:百万円)
項目
前事業年度
当事業年度
未収入金
786
738
建設仮勘定
−
8
研究費
141
−
その他
0
3
※3.当期製品製造原価と売上原価の調整表
(単位:百万円)
区分
当期製品製造原価
前事業年度
当事業年度
40,030
39,969
製品期首棚卸高
6,041
5,389
当期製品仕入高
83,843
79,180
129,915
124,540
5,389
4,994
合計
製品期末棚卸高
貸与資産原価
売上原価
90/110
991
945
125,517
120,492
EDINET提出書類
ニチコン株式会社(E01904)
有価証券報告書
③【株主資本等変動計算書】
前事業年度(自 2024年4月1日
至
2025年3月31日)
(単位:百万円)
株主資本
資本剰余金
その他利益剰余金
資本金
当期首残高
利益剰余金
資本準備金
その他資本
剰余金
17,065
3
14,286
資本剰余金
利益準備金
合計
17,068
2,141
固定資産圧
別途積立金
縮積立金
55
16,517
繰越利益剰
余金
利益剰余金
合計
21,642
40,357
△2,326
△2,326
0
−
10,269
10,269
△9,727
△9,727
当期変動額
剰余金の配当
固定資産圧縮積立
金の取崩
△0
当期純利益
自己株式の取得
自己株式の消却
△3
△3
株主資本以外の項
目の当期変動額
(純額)
当期変動額合計
当期末残高
−
−
△3
△3
−
△0
−
△1,783
△1,783
14,286
17,065
−
17,065
2,141
55
16,517
19,858
38,573
株主資本
当期首残高
評価・換算差額等
自己株式
株主資本合
計
その他有価
証券評価差
額金
評価・換算
差額等合計
△11,628
60,083
14,310
14,310
純資産合計
74,394
当期変動額
剰余金の配当
固定資産圧縮積立
金の取崩
当期純利益
△2,326
△2,326
−
−
10,269
10,269
自己株式の取得
△1,600
△1,600
△1,600
自己株式の消却
9,731
−
−
株主資本以外の項
目の当期変動額
(純額)
当期変動額合計
当期末残高
△3,620
△3,620
△3,620
8,130
6,342
△3,620
△3,620
2,722
△3,497
66,426
10,689
10,689
77,116
91/110
EDINET提出書類
ニチコン株式会社(E01904)
有価証券報告書
当事業年度(自
2025年4月1日
至
2026年3月31日)
(単位:百万円)
株主資本
資本剰余金
その他利益剰余金
資本金
資本準備金
当期首残高
利益剰余金
14,286
17,065
資本剰余金
利益準備金
合計
17,065
固定資産圧
別途積立金
縮積立金
2,141
55
16,517
繰越利益剰
余金
利益剰余金
合計
19,858
38,573
△2,417
△2,417
0
−
5,502
5,502
当期変動額
剰余金の配当
固定資産圧縮積立
金の取崩
△0
当期純利益
自己株式の取得
株主資本以外の項
目の当期変動額
(純額)
当期変動額合計
当期末残高
−
−
−
−
△0
−
3,085
3,084
14,286
17,065
17,065
2,141
54
16,517
22,944
41,657
株主資本
当期首残高
評価・換算差額等
自己株式
株主資本合
計
その他有価
証券評価差
額金
評価・換算
差額等合計
△3,497
66,426
10,689
10,689
純資産合計
77,116
当期変動額
剰余金の配当
固定資産圧縮積立
金の取崩
当期純利益
自己株式の取得
△0
△2,417
△2,417
−
−
5,502
5,502
△0
△0
株主資本以外の項
目の当期変動額
(純額)
当期変動額合計
当期末残高
2,812
2,812
2,812
△0
3,083
2,812
2,812
5,895
△3,498
69,510
13,502
13,502
83,012
92/110
EDINET提出書類
ニチコン株式会社(E01904)
有価証券報告書
【注記事項】
(重要な会計方針)
1.資産の評価基準および評価方法
(1)満期保有目的の債券………………………償却原価法(定額法)を採用しています。
(2)子会社株式および関連会社株式…………移動平均法による原価法を採用しています。
(3)その他有価証券
市場価格のない株式等以外のもの:時価法(評価差額は全部純資産直入法により処理し、売却原価は移動平
均法により算定)を採用しています。
市場価格のない株式等
:移動平均法による原価法を採用しています。
(4)棚卸資産の評価基準および評価方法
商品及び製品・仕掛品:個別法による原価法(貸借対照表価額は収益性の低下に基づく簿価切下げの方法に
より算定)を採用しています。
原材料及び貯蔵品
:移動平均法による原価法(貸借対照表価額は収益性の低下に基づく簿価切下げの方
法により算定)を採用しています。
2.固定資産の減価償却の方法
(1)有形固定資産(リース資産を除く)
定額法を採用しています。
なお、主な耐用年数は以下のとおりです。
建物
7年〜50年
機械及び装置 4年〜8年
(2)無形固定資産(リース資産を除く)
定額法を採用しています。なお、自社利用のソフトウェアについては、社内における見込利用可能期間
(5年)に基づく定額法を採用しています。
(3)リース資産
リース期間を耐用年数とし、残存価額を零とする定額法を採用しています。
3.引当金の計上基準
(1)貸倒引当金
債権の貸倒れによる損失に備えるため、一般債権については貸倒実績率により、貸倒懸念債権等特定の債
権については個別に回収可能性を検討し、回収不能見込額を計上しています。
(2)製品保証引当金
製品の販売に係る一定期間内の無償サービスの費用に備えるため、当該費用の発生割合および支出実績を
勘案した見積額を計上しています。
(3)賞与引当金
従業員に対する賞与の支払に備えるため、支給見込額のうち当期負担分を計上しています。
(4)役員賞与引当金
役員に対する賞与の支給に備えるため、支給見込額のうち当期に負担すべき額を計上しています。
(5)退職給付引当金
従業員の退職給付に備えるため、当期末における退職給付債務および年金資産の見込額に基づき計上して
います。なお、数理計算上の差異は当期において一括費用処理しています。
4.収益および費用の計上基準
(1)製品の販売
当社は、コンデンサおよびその関連製品、家庭用蓄電システム等の製造・販売を行っています。これらの
製品に関する取引については、製品に対する物理的占有、所有に伴う重大なリスクおよび経済価値の顧客へ
の移転状況といった支配の移転の要件に基づき、製品の引渡時点で履行義務を充足すると判断し、当該時点
で収益を認識しています。製品の販売に関する取引の対価は、概ね6ケ月以内に受領しています。
(2)請負契約
NECST事業の研究用・医療用等の特殊電源のうち、一部の取引については請負契約を締結しています。当
該契約のうち、他の用途に転用することができないもの、かつ、現在までに完了した部分に対し強制的に支
払いを受ける権利を有しているものは、契約の履行によって生じる資産の支配を一定期間にわたって顧客に
移転するものと考えています。この場合、各会計期間の末日において測定した履行義務の充足に係る進捗に
基づき、契約期間にわたって売上高を認識しています。なお、一定期間での収益認識要件を満たす場合で
あっても、取引開始日から完全に履行義務を充足すると見込まれる時点までの期間がごく短い請負契約につ
いては、履行義務を充足した時点で収益を認識しています。請負契約に関する取引の対価は、別途定める取
引条件により、概ね1年以内に対価を受領しています。
5.外貨建の資産および負債の本邦通貨への換算基準
93/110
EDINET提出書類
ニチコン株式会社(E01904)
有価証券報告書
外貨建金銭債権債務は、期末日の直物為替相場により円貨に換算し、換算差額は損益として処理していま
す。
6.重要なヘッジ会計の方法
(1)ヘッジ会計の方法
主として、繰延ヘッジ処理を採用しています。なお、為替予約について振当処理の要件を満たしている場
合は、振当処理を採用しています。
(2)ヘッジ手段とヘッジ対象
ヘッジ手段: 為替予約
ヘッジ対象: 外貨建金銭債権
(3)ヘッジ方法
為替リスクをヘッジする手段としてのデリバティブ取引を行うこととしており、投機目的のデリバティブ
取引は、行わないこととしています。
(4)ヘッジの有効性評価の方法
ヘッジ開始時から有効性判定時点までの期間において、ヘッジ対象の相場変動による変動額等を基礎にし
て判断することとしています。
7.グループ通算制度の適用
グループ通算制度を適用しています。
(重要な会計上の見積り)
繰延税金資産の回収可能性
(1)当事業年度の財務諸表に計上した金額
(単位:百万円)
区分
前事業年度
(2025年3月31日)
繰延税金負債
4,228
当事業年度
(2026年3月31日)
4,575
(注)繰延税金資産と繰延税金負債は、双方を相殺して表示しており、相殺前の繰延税金資産の金額は、
前事業年度688百万円、当事業年度1,629百万円です。
(2)識別した項目に係る重要な会計上の見積りの内容に関する情報
(1)の金額の算出方法は、連結財務諸表「注記事項(重要な会計上の見積り)2.繰延税金資産の回収
可能性」の内容と同一です。
(会計方針の変更)
該当事項はありません。
(表示方法の変更)
該当事項はありません。
(追加情報)
該当事項はありません。
94/110
EDINET提出書類
ニチコン株式会社(E01904)
有価証券報告書
(貸借対照表関係)
有形固定資産の取得価額から控除している圧縮記帳額は、次のとおりです。
※1
前事業年度
(2025年3月31日)
建物
土地
計
※2
当事業年度
(2026年3月31日)
1,263百万円
1,048
1,263百万円
1,048
2,311
2,311
関係会社に対する金銭債権および金銭債務
前事業年度
(2025年3月31日)
短期金銭債権
長期金銭債権
短期金銭債務
20,277百万円
24,913
17,763
当事業年度
(2026年3月31日)
20,498百万円
22,958
13,211
※3
当社は、運転資金の効率的な調達を行うため取引銀行4行と当座貸越契約を締結しています。これらの契約に
基づく当事業年度末の借入未実行残高は次のとおりです。
前事業年度
(2025年3月31日)
当座貸越極度額および貸出コミットメ
ントの総額
借入実行残高
差引額
4
当事業年度
(2026年3月31日)
20,000百万円
20,000百万円
6,700
8,400
13,300
11,600
保証債務
関係会社の電子記録債務(設備電子記録債務含む)について次のとおり金融機関に対して併存的債務を引受け
ています。
前事業年度
(2025年3月31日)
ニチコン製箔株式会社
ニチコン大野株式会社
ニチコン草津株式会社
ニチコン亀岡株式会社
ニチコン岩手株式会社
ニチコンワカサ株式会社
その他
計
当事業年度
(2026年3月31日)
781百万円
2,124
2,309
944
1,251
1,863
988
1,638百万円
1,363
1,242
1,028
731
656
830
10,263
7,491
(表示方法の変更)
前連結会計年度において、「その他」に含めて表示していた「ニチコン製箔株式会社」は、相対的に金額的
重要性が増したため、当連結会計年度より区分掲記することとしました。この表示方法の変更を反映させるた
め、前連結会計年度の注記の組替えを行っています。
この結果、前連結会計年度の注記において、「その他」に表示していた1,770百万円は、当連結会計年度の
注記において、「ニチコン製箔株式会社」781百万円および「その他」988百万円として組替えています。
95/110
EDINET提出書類
ニチコン株式会社(E01904)
有価証券報告書
(損益計算書関係)
販売費に属する費用のおおよその割合は前事業年度41%、当事業年度40%、一般管理費に属する費用のおおよ
その割合は前事業年度59%、当事業年度60%です。
販売費及び一般管理費のうち主要な費目および金額は次のとおりです。
※1
(自
至
前事業年度
2024年4月1日
2025年3月31日)
給料手当及び賞与
3,432百万円
319
賞与引当金繰入額
当事業年度
2025年4月1日
2026年3月31日)
3,525百万円
312
役員賞与引当金繰入額
33
退職給付費用
325
60
貸倒引当金繰入額
−
102
1,027
1,140
879
1,043
製品保証引当金繰入額
研究開発費
※2
(自
至
35
減価償却費
323
380
支払手数料
1,306
1,603
関係会社との取引高
(自
至
前事業年度
2024年4月1日
2025年3月31日)
(自
至
当事業年度
2025年4月1日
2026年3月31日)
営業取引による取引高
売上高
仕入高
営業取引以外の取引高
※3
55,645百万円
81,156
3,466
固定資産売却益の内容は次のとおりです。
(自
至
建物
車両運搬具
工具、器具及び備品
他
前事業年度
2024年4月1日
2025年3月31日)
1百万円
0
0
計
※4
(自
至
2
当事業年度
2025年4月1日
2026年3月31日)
−百万円
−
−
−
固定資産処分損の内容は次のとおりです。
(自
至
建物
構築物
機械及び装置
工具、器具及び備品
他
前事業年度
2024年4月1日
2025年3月31日)
−百万円
0
0
−
計
※5
53,349百万円
79,945
3,990
投資有価証券評価損
前事業年度(自 2024年4月1日
該当事項はありません。
0
至
(自
至
当事業年度
2025年4月1日
2026年3月31日)
1百万円
−
0
0
1
2025年3月31日)
当事業年度(自 2025年4月1日至 2026年3月31日)
投資有価証券評価損は、実質価額が著しく下落しその回復が見込めないと判断した投資有価証券について評
価減を行ったものです。
96/110
EDINET提出書類
ニチコン株式会社(E01904)
有価証券報告書
※6
関係会社株式評価損
前事業年度(自 2024年4月1日
該当事項はありません。
至
2025年3月31日)
当事業年度(自 2025年4月1日至 2026年3月31日)
関係会社株式評価損は、ニチコン(マレーシア)センディリアン バハッドおよびニチコン エレクトロニクス
(宿遷)カンパニー リミテッドの株式減損処理に伴う評価損です。
※7
減損損失
前事業年度(自 2024年4月1日
該当事項はありません。
至
2025年3月31日)
当事業年度(自 2025年4月1日至 2026年3月31日)
当事業年度において、以下の資産について減損損失を計上しています。
用
事業用資産
途
場
所
種
福井県大野市
類
機械及び装置他
減
損
損
失
448百万円
当社は、原則として、事業用資産については事業部門を基準としてグルーピングを行っており、遊休資産に
ついて個別資産ごとにグルーピングを行っております。
当事業年度において、保有するコンデンサ事業の製造に係る固定資産の一部について、減損の兆候が認めら
れたことから、当該固定資産に係る回収可能性を検討した結果、回収可能価額まで減額し当該減少額を事業構
造改革費用に計上しました。なお、当該資産の回収可能価額は使用価値により測定しており、使用価値につい
ては、将来キャッシュ・フローに基づく使用価値が見込まれないことから零として算定しています。
※8
事業構造改革費用
前事業年度(自 2024年4月1日
該当事項はありません。
至
2025年3月31日)
当事業年度(自 2025年4月1日至 2026年3月31日)
事業構造改革費用は、NECST事業の構造改善の一環として実施した人員合理化に伴う特別退職金123百万円お
よびコンデンサ事業に係る固定資産の減損損失448百万円です。
97/110
EDINET提出書類
ニチコン株式会社(E01904)
有価証券報告書
(有価証券関係)
前事業年度(2025年3月31日)
子会社株式および関連会社株式
貸借対照表計上額
(百万円)
関連会社株式
時価(百万円)
192
差額(百万円)
4,465
4,272
(注)上記に含まれない市場価格のない株式等の貸借対照表計上額
区
分
貸借対照表計上額(百万円)
子会社株式
14,264
関連会社株式
708
当事業年度(2026年3月31日)
子会社株式および関連会社株式
貸借対照表計上額
(百万円)
関連会社株式
時価(百万円)
192
差額(百万円)
5,281
5,088
(注)上記に含まれない市場価格のない株式等の貸借対照表計上額
区
分
貸借対照表計上額(百万円)
子会社株式
12,237
関連会社株式
708
(税効果会計関係)
1.繰延税金資産および繰延税金負債の発生の主な原因別の内訳
前事業年度
(2025年3月31日)
繰延税金資産
税務上の繰越欠損金
貸倒引当金
賞与引当金
退職給付引当金
製品保証引当金
関係会社株式評価損
その他
繰延税金資産小計
税務上の繰越欠損金に係る評価性引当額
将来減算一時差異等の合計に係る評価性引当額
評価性引当額小計
繰延税金資産合計
繰延税金負債
その他有価証券評価差額金
その他
繰延税金負債合計
繰延税金負債の純額
98/110
当事業年度
(2026年3月31日)
2,712百万円
2,043
134
198
1,082
4,067
355
10,594
△2,023
△7,882
△9,905
688
1,487百万円
1,879
141
101
1,385
4,708
857
10,561
△231
△8,700
△8,931
1,629
△4,893
△24
△4,917
△4,228
△6,180
△24
△6,205
△4,575
EDINET提出書類
ニチコン株式会社(E01904)
有価証券報告書
2.法定実効税率と税効果会計適用後の法人税等の負担率との間に重要な差異があるときの、当該差異の原因と
なった主要な項目別の内訳
前事業年度
当事業年度
(2025年3月31日)
(2026年3月31日)
法定実効税率
30.6%
30.6%
(調整)
受取配当金等永久差異
△7.7
△15.9
住民税等均等割額
0.1
0.3
外国税額等
0.2
0.9
評価性引当額の増減
△10.0
△19.6
特別控除
△3.0
△3.5
その他
△0.4
△3.6
9.8
△10.8
税効果会計適用後の法人税等の負担率
(表示方法の変更)
前事業年度において、「その他」に含めて表示しておりました「特別控除」は、金額的重要性が増したた
め、当事業年度により独立掲記しております。この結果、前事業年度の注記において、「その他」に表示して
いた△3.4%は、「特別控除」△3.0%、「その他」△0.4%として組替えております。
3.法人税および地方法人税の会計処理またはこれらに関する税効果会計の会計処理
当社は、グループ通算制度を適用しており、「グループ通算制度を適用する場合の会計処理及び開示に関す
る取扱い」(実務対応報告第42号 2021年8月12日)に従って、法人税および地方法人税の会計処理またはこ
れらに関する税効果会計の会計処理ならびに開示を行っています。
(収益認識関係)
顧客との契約から生じる収益を理解するための基礎となる情報は、連結財務諸表「注記事項(収益認識関
係)」に同一の内容を記載しているため、記載を省略しています。
(重要な後発事象)
該当事項はありません。
99/110
EDINET提出書類
ニチコン株式会社(E01904)
有価証券報告書
④【附属明細表】
【有形固定資産等明細表】
(単位:百万円)
区
分
当期首
残高
資産の種類
当期
減少額
建物
9,357
324
構築物
118
当期
償却額
減価償却
累計額
当期末
残高
1
675
9,004
18,747
10
12
12
104
1,246
1,518
144
857
(429)
273
531
12,462
車両運搬具
19
−
−
3
15
32
工具、器具及び備品
871
86
18
(18)
373
565
4,642
5,549
−
−
−
5,549
−
機械及び装置
有
形
固
定
資
産
当期
増加額
土地
リース資産
17
−
−
4
12
24
建設仮勘定
1,463
1,261
200
−
2,524
−
計
18,914
1,827
1,090
(448)
1,343
18,308
37,155
1,472
1,062
75
660
1,799
4,312
無形固定資産
(注)1.
「当期減少額」欄の( )内は内書きで、減損損失の計上額であります。なお、「減価償却累計額」は減損損
失累計額を含んでおります。
2. 「当期増加額」の主な内容
建物
: 貸与建物および建物附属物
316百万円
機械及び装置
:
小形リチウムイオン二次電池生産設備
50百万円
機械及び装置
:
アルミ電解コンデンサ用電極箔生産設備
44百万円
工具、器具及び備品:
家庭用蓄電システム用金型
45百万円
建設仮勘定
:
積層型アルミ電解コンデンサ生産設備
無形固定資産
:
家庭用蓄電システム用販売目的ソフトウェア
1,240百万円
619百万円
「当期減少額」の主な内容
機械及び装置
: 小形リチウムイオン二次電池生産設備
429百万円
機械及び装置
アルミ電解コンデンサ用電極箔生産設備
421百万円
工具、器具及び備品:
:
小形リチウムイオン二次電池生産設備
18百万円
建設仮勘定
:
貸与建物および建物附属物
110百万円
建設仮勘定
:
家庭用蓄電システム生産設備
41百万円
【引当金明細表】
(単位:百万円)
科目
当期首残高
当期増加額
当期減少額
当期末残高
貸倒引当金
6,508
102
625
5,985
賞与引当金
441
450
441
450
役員賞与引当金
33
35
33
35
製品保証引当金
3,466
1,140
194
4,412
(2)【主な資産及び負債の内容】
連結財務諸表を作成しているため、記載を省略しています。
(3)【その他】
該当事項はありません。
100/110
EDINET提出書類
ニチコン株式会社(E01904)
有価証券報告書
第6【提出会社の株式事務の概要】
事業年度
4月1日から3月31日まで
定時株主総会
6月中
基準日
3月31日
剰余金の配当の基準日
9月30日
3月31日
1単元の株式数
100株
単元未満株式の買取り・売渡し
取扱場所
(特別口座に記録された単元未満株式に関する取扱い)
東京都千代田区丸の内一丁目3番3号
みずほ信託銀行株式会社本店証券代行部
(特別口座以外の振替口座に記録された単元未満株式に関する取扱い)
振替口座を開設した口座管理機関(証券会社等)
株主名簿管理人
(株主名簿管理人および特別口座の口座管理機関)
東京都千代田区丸の内一丁目3番3号
みずほ信託銀行株式会社
買取・売渡手数料
公告掲載方法
株式の売買の委託に係る手数料相当額として別途定める金額
電子公告により行う。ただし、事故その他やむを得ない事由によって電子公
告による公告をすることができない場合は、日本経済新聞に掲載して行う。
公告掲載URL
https://www.nichicon.co.jp/
株主に対する特典
なし
(注)当社定款の定めにより、単元未満株主は、会社法第189条第2項各号に掲げる権利、会社法第166条第1項の規
定による請求をする権利、株主の有する株式数に応じて募集株式の割当ておよび募集新株予約権の割当てを受
ける権利ならびに単元未満株式の売渡請求をする権利以外の権利を有していません。
101/110
EDINET提出書類
ニチコン株式会社(E01904)
有価証券報告書
第7【提出会社の参考情報】
1【提出会社の親会社等の情報】
当社は、金融商品取引法第24条の7第1項に規定する親会社等はありません。
2【その他の参考情報】
当事業年度の開始日から有価証券報告書提出日までの間に、次の書類を提出しています。
(1)有価証券報告書およびその添付書類ならびに確認書
事業年度(第90期)(自 2024年4月1日至 2025年3月31日)2025年6月27日関東財務局長に提出
(2)内部統制報告書およびその添付書類
2025年6月27日関東財務局長に提出
(3)半期報告書および確認書
(第91期中)(自 2025年4月1日
至
2025年9月30日)2025年11月13日関東財務局長に提出
(4)臨時報告書
企業内容等の開示に関する内閣府令第19条第2項第9号の2(株主総会における議決権行使の結果)に基づく臨
時報告書
2025年6月30日関東財務局長に提出
102/110
EDINET提出書類
ニチコン株式会社(E01904)
有価証券報告書
第二部【提出会社の保証会社等の情報】
該当事項はありません。
103/110
EDINET提出書類
ニチコン株式会社(E01904)
有価証券報告書
独立監査人の監査報告書及び内部統制監査報告書
2026年6月25日
ニチコン株式会社
取締役会
御中
有限責任監査法人トーマツ
京都事務所
指定有限責任社員
業務執行社員
公認会計士
菱本
恵子
指定有限責任社員
業務執行社員
公認会計士
上田
博規
<連結財務諸表監査>
監査意見
当監査法人は、金融商品取引法第193条の2第1項の規定に基づく監査証明を行うため、「経理の状況」に掲げられてい
るニチコン株式会社の2025年4月1日から2026年3月31日までの連結会計年度の連結財務諸表、すなわち、連結貸借対照
表、連結損益計算書、連結包括利益計算書、連結株主資本等変動計算書、連結キャッシュ・フロー計算書、連結財務諸表
作成のための基本となる重要な事項、その他の注記及び連結附属明細表について監査を行った。
当監査法人は、上記の連結財務諸表が、我が国において一般に公正妥当と認められる企業会計の基準に準拠して、ニチ
コン株式会社及び連結子会社の2026年3月31日現在の財政状態並びに同日をもって終了する連結会計年度の経営成績及び
キャッシュ・フローの状況を、全ての重要な点において適正に表示しているものと認める。
監査意見の根拠
当監査法人は、我が国において一般に公正妥当と認められる監査の基準に準拠して監査を行った。監査の基準における
当監査法人の責任は、「連結財務諸表監査における監査人の責任」に記載されている。当監査法人は、我が国における職
業倫理に関する規定(社会的影響度の高い事業体の財務諸表監査に適用される規定を含む。)に従って、会社及び連結子
会社から独立しており、また、監査人としてのその他の倫理上の責任を果たしている。当監査法人は、意見表明の基礎と
なる十分かつ適切な監査証拠を入手したと判断している。
監査上の主要な検討事項
監査上の主要な検討事項とは、当連結会計年度の連結財務諸表の監査において、監査人が職業的専門家として特に重要
であると判断した事項である。監査上の主要な検討事項は、連結財務諸表全体に対する監査の実施過程及び監査意見の形
成において対応した事項であり、当監査法人は、当該事項に対して個別に意見を表明するものではない。
104/110
EDINET提出書類
ニチコン株式会社(E01904)
有価証券報告書
有形固定資産の減損
監査上の主要な検討事項の内容及び決定理由
監査上の対応
会社グループは、コンデンサ及びその関連製品の製造・
販売に係る有形固定資産を所有しており、当連結会計年度
の連結貸借対照表において、有形固定資産52,538百万円を
計上している。また、当連結会計年度において、コンデン
サ事業の機械装置及び運搬具の事業資産および遊休資産に
係る減損損失957百万円を計上している。
注記事項(重要な会計上の見積り)に記載のとおり、会
社グループは業績管理に利用される事業区分に基づき資産
及び資産グループを識別し、当該資産グループにつき減損
の兆候の有無を検討した結果、コンデンサ事業の一部の資
産グループについて、減損の兆候を識別した。減損の兆候
がある資産又は資産グループについて、当該資産又は資産
グループから得られる割引前の将来キャッシュ・フローの
総額と帳簿価額を比較した結果、割引前将来キャッシュ・
フローが帳簿価額を下回っていたことから、減損損失を認
識した。
なお、減損要否の判定にあたって割引前将来キャッ
シュ・フローは、市場動向に基づく販売計画や生産計画等
の仮定を含め、経営者が承認した事業計画を基礎とし、事
業計画の最終年度以降の期間については経営環境を考慮し
て見積もった成長率を用いて算定している。
事業計画の作成の基礎となる販売計画や生産計画、成長
率等の仮定については、市況や需要の変化等の経営者によ
る判断が必要なものであり、不確実性が高い領域である。
以上の理由により、当監査法人は当該事項を監査上の主
要な検討事項に該当するものと判断した。
当監査法人は、将来キャッシュ・フローの前提となる事
業計画の妥当性を検討するにあたり、主として以下の監査
手続を実施した。
・会社が構築した、事業計画の策定に関する内部統制を含
む、経営者による固定資産の減損検討プロセスに関する内
部統制の整備・運用状況の有効性を評価した。
・過去の事業計画と実績の乖離を分析することにより、経
営者の見積りプロセスの有効性及び事業計画の精度を評価
した。
・算定された将来キャッシュ・フローについて、事業計画
との整合性の検討を実施した。
・事業計画の作成の基礎となる販売計画や生産計画、成長
率等の重要な仮定について、経営者との協議を実施して、
各種施策を理解した。また、市場動向を外部機関が作成し
た分析資料及び会社が作成した受注見通しを閲覧し、妥当
性を評価した。
・これらの手続を実施することにより、過去の実績推移と
将来の推移の合理性を検討することで、経営者の実施した
不確実性の評価を含む、事業計画の妥当性を評価した。
その他の記載内容
その他の記載内容は、有価証券報告書に含まれる情報のうち、連結財務諸表及び財務諸表並びにこれらの監査報告書以
外の情報である。経営者の責任は、その他の記載内容を作成し開示することにある。また、監査役及び監査役会の責任
は、その他の記載内容の報告プロセスの整備及び運用における取締役の職務の執行を監視することにある。
当監査法人の連結財務諸表に対する監査意見の対象にはその他の記載内容は含まれておらず、当監査法人はその他の記
載内容に対して意見を表明するものではない。
連結財務諸表監査における当監査法人の責任は、その他の記載内容を通読し、通読の過程において、その他の記載内容
と連結財務諸表又は当監査法人が監査の過程で得た知識との間に重要な相違があるかどうか検討すること、また、そのよ
うな重要な相違以外にその他の記載内容に重要な誤りの兆候があるかどうか注意を払うことにある。
当監査法人は、実施した作業に基づき、その他の記載内容に重要な誤りがあると判断した場合には、その事実を報告す
ることが求められている。
その他の記載内容に関して、当監査法人が報告すべき事項はない。
連結財務諸表に対する経営者並びに監査役及び監査役会の責任
経営者の責任は、我が国において一般に公正妥当と認められる企業会計の基準に準拠して連結財務諸表を作成し適正に
表示することにある。これには、不正又は誤謬による重要な虚偽表示のない連結財務諸表を作成し適正に表示するために
経営者が必要と判断した内部統制を整備及び運用することが含まれる。
連結財務諸表を作成するに当たり、経営者は、継続企業の前提に基づき連結財務諸表を作成することが適切であるかど
うかを評価し、我が国において一般に公正妥当と認められる企業会計の基準に基づいて継続企業に関する事項を開示する
必要がある場合には当該事項を開示する責任がある。
監査役及び監査役会の責任は、財務報告プロセスの整備及び運用における取締役の職務の執行を監視することにある。
連結財務諸表監査における監査人の責任
監査人の責任は、監査人が実施した監査に基づいて、全体としての連結財務諸表に不正又は誤謬による重要な虚偽表示
がないかどうかについて合理的な保証を得て、監査報告書において独立の立場から連結財務諸表に対する意見を表明する
ことにある。虚偽表示は、不正又は誤謬により発生する可能性があり、個別に又は集計すると、連結財務諸表の利用者の
意思決定に影響を与えると合理的に見込まれる場合に、重要性があると判断される。
105/110
EDINET提出書類
ニチコン株式会社(E01904)
有価証券報告書
監査人は、我が国において一般に公正妥当と認められる監査の基準に従って、監査の過程を通じて、職業的専門家とし
ての判断を行い、職業的懐疑心を保持して以下を実施する。
・不正又は誤謬による重要な虚偽表示リスクを識別し、評価する。また、重要な虚偽表示リスクに対応した監査手
続を立案し、実施する。監査手続の選択及び適用は監査人の判断による。さらに、意見表明の基礎となる十分かつ
適切な監査証拠を入手する。
・連結財務諸表監査の目的は、内部統制の有効性について意見表明するためのものではないが、監査人は、リスク
評価の実施に際して、状況に応じた適切な監査手続を立案するために、監査に関連する内部統制を検討する。
・経営者が採用した会計方針及びその適用方法の適切性、並びに経営者によって行われた会計上の見積りの合理性
及び関連する注記事項の妥当性を評価する。
・経営者が継続企業を前提として連結財務諸表を作成することが適切であるかどうか、また、入手した監査証拠に
基づき、継続企業の前提に重要な疑義を生じさせるような事象又は状況に関して重要な不確実性が認められるかど
うか結論付ける。継続企業の前提に関する重要な不確実性が認められる場合は、監査報告書において連結財務諸表
の注記事項に注意を喚起すること、又は重要な不確実性に関する連結財務諸表の注記事項が適切でない場合は、連
結財務諸表に対して除外事項付意見を表明することが求められている。監査人の結論は、監査報告書日までに入手
した監査証拠に基づいているが、将来の事象や状況により、企業は継続企業として存続できなくなる可能性があ
る。
・連結財務諸表の表示及び注記事項が、我が国において一般に公正妥当と認められる企業会計の基準に準拠してい
るかどうかとともに、関連する注記事項を含めた連結財務諸表の表示、構成及び内容、並びに連結財務諸表が基礎
となる取引や会計事象を適正に表示しているかどうかを評価する。
・連結財務諸表に対する意見表明の基礎となる、会社及び連結子会社の財務情報に関する十分かつ適切な監査証拠
を入手するために、連結財務諸表の監査を計画し実施する。監査人は、連結財務諸表の監査に関する指揮、監督及
び査閲に関して責任がある。監査人は、単独で監査意見に対して責任を負う。
監査人は、監査役及び監査役会に対して、計画した監査の範囲とその実施時期、監査の実施過程で識別した内部統制の
重要な不備を含む監査上の重要な発見事項、及び監査の基準で求められているその他の事項について報告を行う。
監査人は、監査役及び監査役会に対して、独立性についての我が国における職業倫理に関する規定を遵守したこと、並
びに監査人の独立性に影響を与えると合理的に考えられる事項、及び阻害要因を除去するための対応策を講じている場合
又は阻害要因を許容可能な水準にまで軽減するためのセーフガードを適用している場合はその内容について報告を行う。
監査人は、監査役及び監査役会と協議した事項のうち、当連結会計年度の連結財務諸表の監査で特に重要であると判断
した事項を監査上の主要な検討事項と決定し、監査報告書において記載する。ただし、法令等により当該事項の公表が禁
止されている場合や、極めて限定的ではあるが、監査報告書において報告することにより生じる不利益が公共の利益を上
回ると合理的に見込まれるため、監査人が報告すべきでないと判断した場合は、当該事項を記載しない。
<内部統制監査>
監査意見
当監査法人は、金融商品取引法第193条の2第2項の規定に基づく監査証明を行うため、ニチコン株式会社の2026年3月31
日現在の内部統制報告書について監査を行った。
当監査法人は、ニチコン株式会社が2026年3月31日現在の財務報告に係る内部統制は有効であると表示した上記の内部
統制報告書が、我が国において一般に公正妥当と認められる財務報告に係る内部統制の評価の基準に準拠して、財務報告
に係る内部統制の評価結果について、全ての重要な点において適正に表示しているものと認める。
監査意見の根拠
当監査法人は、我が国において一般に公正妥当と認められる財務報告に係る内部統制の監査の基準に準拠して内部統制
監査を行った。財務報告に係る内部統制の監査の基準における当監査法人の責任は、「内部統制監査における監査人の責
任」に記載されている。当監査法人は、我が国における職業倫理に関する規定(社会的影響度の高い事業体の財務諸表監
査に適用される規定を含む。)に従って、会社及び連結子会社から独立しており、また、監査人としてのその他の倫理上
の責任を果たしている。当監査法人は、意見表明の基礎となる十分かつ適切な監査証拠を入手したと判断している。
106/110
EDINET提出書類
ニチコン株式会社(E01904)
有価証券報告書
内部統制報告書に対する経営者並びに監査役及び監査役会の責任
経営者の責任は、財務報告に係る内部統制を整備及び運用し、我が国において一般に公正妥当と認められる財務報告に
係る内部統制の評価の基準に準拠して内部統制報告書を作成し適正に表示することにある。
監査役及び監査役会の責任は、財務報告に係る内部統制の整備及び運用状況を監視、検証することにある。
なお、財務報告に係る内部統制により財務報告の虚偽の記載を完全には防止又は発見することができない可能性があ
る。
内部統制監査における監査人の責任
監査人の責任は、監査人が実施した内部統制監査に基づいて、内部統制報告書に重要な虚偽表示がないかどうかについ
て合理的な保証を得て、内部統制監査報告書において独立の立場から内部統制報告書に対する意見を表明することにあ
る。
監査人は、我が国において一般に公正妥当と認められる財務報告に係る内部統制の監査の基準に従って、監査の過程を
通じて、職業的専門家としての判断を行い、職業的懐疑心を保持して以下を実施する。
・内部統制報告書における財務報告に係る内部統制の評価結果について監査証拠を入手するための監査手続を実施
する。内部統制監査の監査手続は、監査人の判断により、財務報告の信頼性に及ぼす影響の重要性に基づいて選択
及び適用される。
・財務報告に係る内部統制の評価範囲、評価手続及び評価結果について経営者が行った記載を含め、全体としての
内部統制報告書の表示を検討する。
・内部統制報告書における財務報告に係る内部統制の評価結果に関する十分かつ適切な監査証拠を入手するため
に、内部統制の監査を計画し実施する。監査人は、内部統制報告書の監査に関する指揮、監督及び査閲に関して責
任がある。監査人は、単独で監査意見に対して責任を負う。
監査人は、監査役及び監査役会に対して、計画した内部統制監査の範囲とその実施時期、内部統制監査の実施結果、識
別した内部統制の開示すべき重要な不備、その是正結果、及び内部統制の監査の基準で求められているその他の事項につ
いて報告を行う。
監査人は、監査役及び監査役会に対して、独立性についての我が国における職業倫理に関する規定を遵守したこと、並
びに監査人の独立性に影響を与えると合理的に考えられる事項、及び阻害要因を除去するための対応策を講じている場合
又は阻害要因を許容可能な水準にまで軽減するためのセーフガードを適用している場合はその内容について報告を行う。
<報酬関連情報>
当監査法人及び当監査法人と同一のネットワークに属する者に対する、会社及び子会社の監査証明業務に基づく報酬及
び非監査業務に基づく報酬の額は、「提出会社の状況」に含まれるコーポレート・ガバナンスの状況等(3)【監査の状
況】に記載されている。
利害関係
会社及び連結子会社と当監査法人又は業務執行社員との間には、公認会計士法の規定により記載すべき利害関係はな
い。
以
(注)1.上記の監査報告書の原本は当社(有価証券報告書提出会社)が別途保管しています。
2.XBRLデータは監査の対象には含まれていません。
107/110
上
EDINET提出書類
ニチコン株式会社(E01904)
有価証券報告書
独立監査人の監査報告書
2026年6月25日
ニチコン株式会社
取締役会
御中
有限責任監査法人トーマツ
京都事務所
指定有限責任社員
業務執行社員
公認会計士
菱本
恵子
指定有限責任社員
業務執行社員
公認会計士
上田
博規
<財務諸表監査>
監査意見
当監査法人は、金融商品取引法第193条の2第1項の規定に基づく監査証明を行うため、「経理の状況」に掲げられてい
るニチコン株式会社の2025年4月1日から2026年3月31日までの第91期事業年度の財務諸表、すなわち、貸借対照表、損益
計算書、株主資本等変動計算書、重要な会計方針、その他の注記及び附属明細表について監査を行った。
当監査法人は、上記の財務諸表が、我が国において一般に公正妥当と認められる企業会計の基準に準拠して、ニチコン
株式会社の2026年3月31日現在の財政状態及び同日をもって終了する事業年度の経営成績を、全ての重要な点において適
正に表示しているものと認める。
監査意見の根拠
当監査法人は、我が国において一般に公正妥当と認められる監査の基準に準拠して監査を行った。監査の基準における
当監査法人の責任は、「財務諸表監査における監査人の責任」に記載されている。当監査法人は、我が国における職業倫
理に関する規定(社会的影響度の高い事業体の財務諸表監査に適用される規定を含む。)に従って、会社から独立してお
り、また、監査人としてのその他の倫理上の責任を果たしている。当監査法人は、意見表明の基礎となる十分かつ適切な
監査証拠を入手したと判断している。
監査上の主要な検討事項
監査上の主要な検討事項とは、当事業年度の財務諸表の監査において、監査人が職業的専門家として特に重要であると
判断した事項である。監査上の主要な検討事項は、財務諸表全体に対する監査の実施過程及び監査意見の形成において対
応した事項であり、当監査法人は、当該事項に対して個別に意見を表明するものではない。
108/110
EDINET提出書類
ニチコン株式会社(E01904)
有価証券報告書
繰延税金資産の回収可能性
監査上の主要な検討事項の内容及び決定理由
監査上の対応
会社は、当事業年度の貸借対照表において繰延税金負債
4,575百万円を計上している。注記事項(税効果会計関
係)に記載のとおり、繰延税金資産と繰延税金負債の相殺
前の繰延税金資産の金額は1,629百万円であり、将来減算
一時差異及び税務上の繰越欠損金に係る繰延税金資産の総
額10,561百万円から評価性引当額△8,931百万円が控除さ
れている。なお、評価性引当額控除前の繰延税金資産のう
ち、1,487百万円が税務上の繰越欠損金に係る繰延税金資
産である。
会社は、繰延税金資産の回収可能性につき、翌期の課税
所得(税務上の繰越欠損金考慮前)の見積額に基づき、回
収が見込まれる金額を繰延税金資産として計上している。
なお、会社はグループ通算制度を適用している。
回収可能性の判断の前提となる将来の課税所得見積額に
ついては、市場動向に基づく販売計画や生産計画等の仮定
を含め、経営者が承認した事業計画に基づいて算定してい
る。
事業計画の作成の基礎となる販売計画や生産計画等の仮
定については、市況や需要の変化等の経営者による判断が
必要なものであり、不確実性が高い領域である。
以上の理由により、当監査法人は当該事項を監査上の主
要な検討事項に該当するものと判断した。
当監査法人は、将来課税所得の前提となる事業計画の妥
当性を検討するにあたり、主として以下の監査手続を実施
した。
・会社が構築した、事業計画の策定に関する内部統制を含
む、経営者による繰延税金資産の回収可能性の検討プロセ
スに関する内部統制の整備・運用状況の有効性を評価し
た。
・過去の事業計画と実績の乖離を分析することにより、経
営者の見積りプロセスの有効性及び事業計画の精度を評価
した。
・算定された見積課税所得について、事業計画との整合性
の検討を実施した。
・事業計画の作成の基礎となる販売計画や生産計画、成長
率等の重要な仮定について、経営者との協議を実施して、
各種施策を理解した。また、予実分析を通じて業績の不確
実性の高い事業部の販売計画については市場動向の分析資
料を閲覧し、妥当性を評価した。
・これらの手続を実施することにより、過去の実績推移と
将来の推移の合理性を検討することで、経営者の実施した
不確実性の評価を含む、事業計画の妥当性を評価した。
その他の記載内容
その他の記載内容は、有価証券報告書に含まれる情報のうち、連結財務諸表及び財務諸表並びにこれらの監査報告書以
外の情報である。経営者の責任は、その他の記載内容を作成し開示することにある。また、監査役及び監査役会の責任
は、その他の記載内容の報告プロセスの整備及び運用における取締役の職務の執行を監視することにある。
当監査法人の財務諸表に対する監査意見の対象にはその他の記載内容は含まれておらず、当監査法人はその他の記載内
容に対して意見を表明するものではない。
財務諸表監査における当監査法人の責任は、その他の記載内容を通読し、通読の過程において、その他の記載内容と財
務諸表又は当監査法人が監査の過程で得た知識との間に重要な相違があるかどうか検討すること、また、そのような重要
な相違以外にその他の記載内容に重要な誤りの兆候があるかどうか注意を払うことにある。
当監査法人は、実施した作業に基づき、その他の記載内容に重要な誤りがあると判断した場合には、その事実を報告す
ることが求められている。
その他の記載内容に関して、当監査法人が報告すべき事項はない。
財務諸表に対する経営者並びに監査役及び監査役会の責任
経営者の責任は、我が国において一般に公正妥当と認められる企業会計の基準に準拠して財務諸表を作成し適正に表示
することにある。これには、不正又は誤謬による重要な虚偽表示のない財務諸表を作成し適正に表示するために経営者が
必要と判断した内部統制を整備及び運用することが含まれる。
財務諸表を作成するに当たり、経営者は、継続企業の前提に基づき財務諸表を作成することが適切であるかどうかを評
価し、我が国において一般に公正妥当と認められる企業会計の基準に基づいて継続企業に関する事項を開示する必要があ
る場合には当該事項を開示する責任がある。
監査役及び監査役会の責任は、財務報告プロセスの整備及び運用における取締役の職務の執行を監視することにある。
財務諸表監査における監査人の責任
監査人の責任は、監査人が実施した監査に基づいて、全体としての財務諸表に不正又は誤謬による重要な虚偽表示がな
いかどうかについて合理的な保証を得て、監査報告書において独立の立場から財務諸表に対する意見を表明することにあ
る。虚偽表示は、不正又は誤謬により発生する可能性があり、個別に又は集計すると、財務諸表の利用者の意思決定に影
響を与えると合理的に見込まれる場合に、重要性があると判断される。
監査人は、我が国において一般に公正妥当と認められる監査の基準に従って、監査の過程を通じて、職業的専門家とし
ての判断を行い、職業的懐疑心を保持して以下を実施する。
・不正又は誤謬による重要な虚偽表示リスクを識別し、評価する。また、重要な虚偽表示リスクに対応した監査手
続を立案し、実施する。監査手続の選択及び適用は監査人の判断による。さらに、意見表明の基礎となる十分かつ
適切な監査証拠を入手する。
109/110
EDINET提出書類
ニチコン株式会社(E01904)
有価証券報告書
・
財務諸表監査の目的は、内部統制の有効性について意見表明するためのものではないが、監査人は、リスク評価
の実施に際して、状況に応じた適切な監査手続を立案するために、監査に関連する内部統制を検討する。
・経営者が採用した会計方針及びその適用方法の適切性、並びに経営者によって行われた会計上の見積りの合理性
及び関連する注記事項の妥当性を評価する。
・経営者が継続企業を前提として財務諸表を作成することが適切であるかどうか、また、入手した監査証拠に基づ
き、継続企業の前提に重要な疑義を生じさせるような事象又は状況に関して重要な不確実性が認められるかどうか
結論付ける。継続企業の前提に関する重要な不確実性が認められる場合は、監査報告書において財務諸表の注記事
項に注意を喚起すること、又は重要な不確実性に関する財務諸表の注記事項が適切でない場合は、財務諸表に対し
て除外事項付意見を表明することが求められている。監査人の結論は、監査報告書日までに入手した監査証拠に基
づいているが、将来の事象や状況により、企業は継続企業として存続できなくなる可能性がある。
・財務諸表の表示及び注記事項が、我が国において一般に公正妥当と認められる企業会計の基準に準拠しているか
どうかとともに、関連する注記事項を含めた財務諸表の表示、構成及び内容、並びに財務諸表が基礎となる取引や
会計事象を適正に表示しているかどうかを評価する。
監査人は、監査役及び監査役会に対して、計画した監査の範囲とその実施時期、監査の実施過程で識別した内部統制の
重要な不備を含む監査上の重要な発見事項、及び監査の基準で求められているその他の事項について報告を行う。
監査人は、監査役及び監査役会に対して、独立性についての我が国における職業倫理に関する規定を遵守したこと、並
びに監査人の独立性に影響を与えると合理的に考えられる事項、及び阻害要因を除去するための対応策を講じている場合
又は阻害要因を許容可能な水準にまで軽減するためのセーフガードを適用している場合はその内容について報告を行う。
監査人は、監査役及び監査役会と協議した事項のうち、当事業年度の財務諸表の監査で特に重要であると判断した事項
を監査上の主要な検討事項と決定し、監査報告書において記載する。ただし、法令等により当該事項の公表が禁止されて
いる場合や、極めて限定的ではあるが、監査報告書において報告することにより生じる不利益が公共の利益を上回ると合
理的に見込まれるため、監査人が報告すべきでないと判断した場合は、当該事項を記載しない。
<報酬関連情報>
報酬関連情報は、連結財務諸表の監査報告書に記載されている。
利害関係
会社と当監査法人又は業務執行社員との間には、公認会計士法の規定により記載すべき利害関係はない。
以
(注)1.上記の監査報告書の原本は当社(有価証券報告書提出会社)が別途保管しています。
2.XBRLデータは監査の対象には含まれていません。
110/110
上