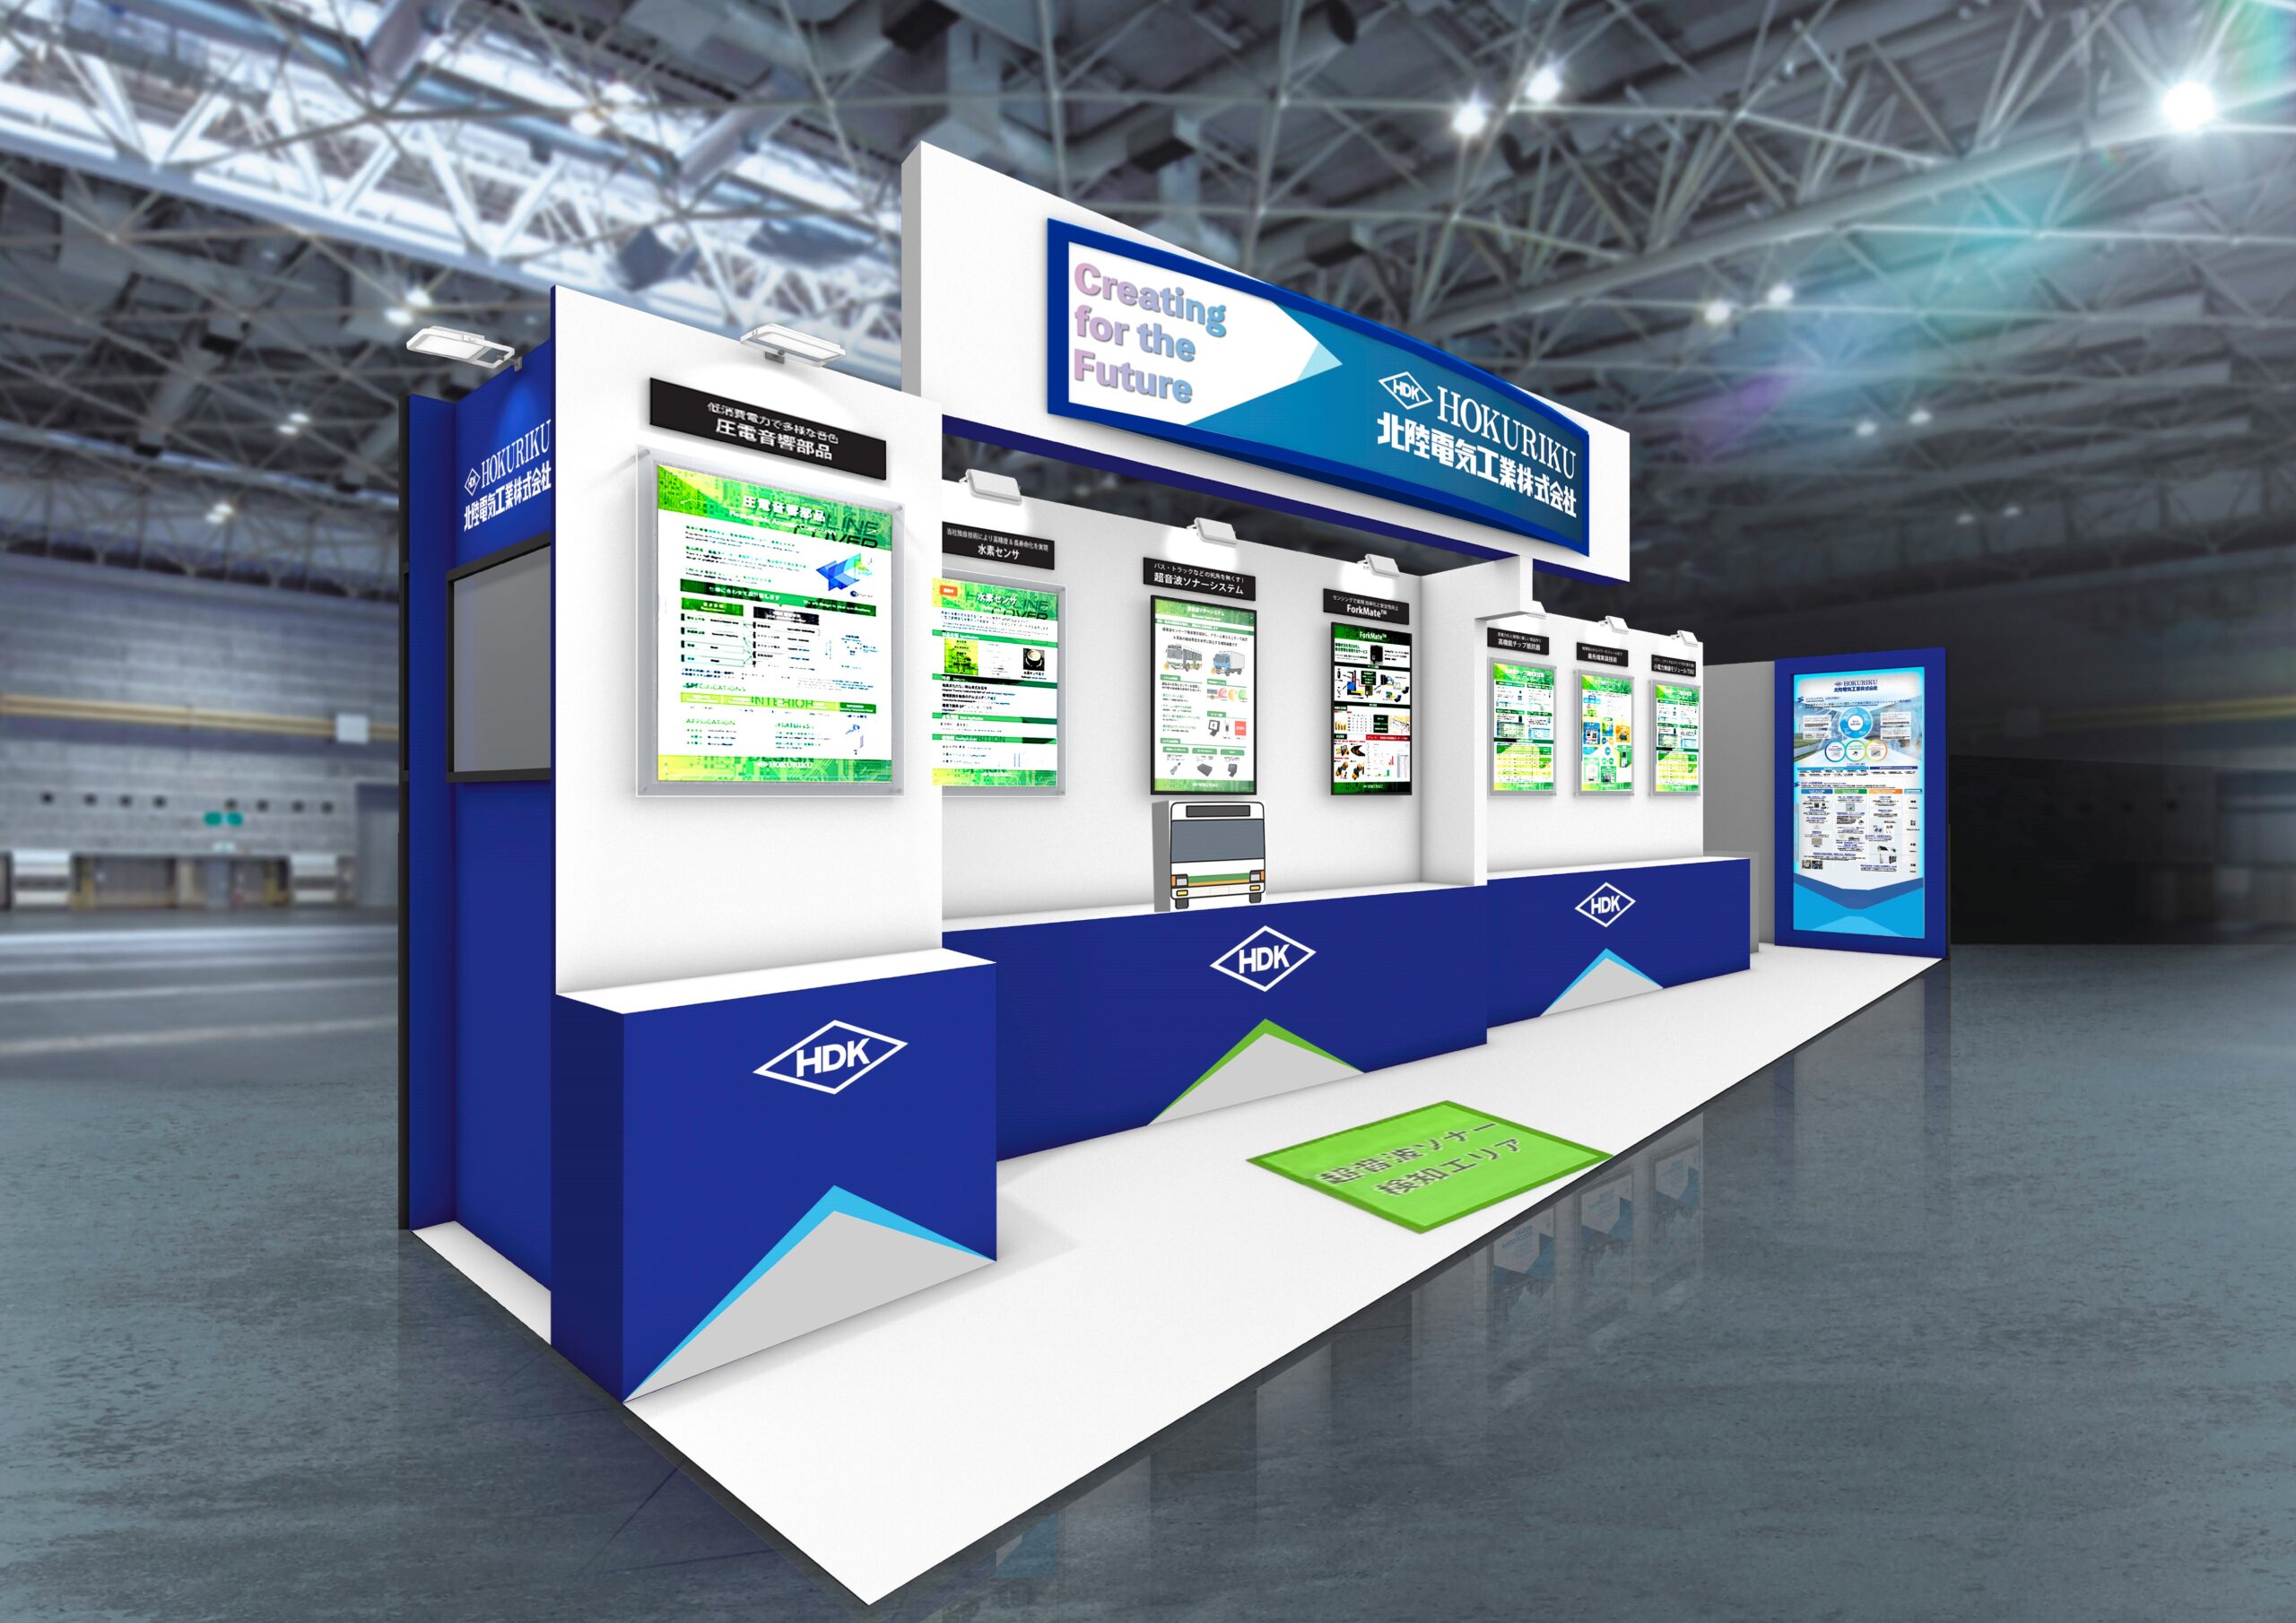
EDINET提出書類 北陸電気工業株式会社(E01817) 有価証券報告書 【表紙】 【提出書類】 有価証券報告書 【根拠条文】 金融商品取引法第24条第1項 【提出先】 関東財務局長 【提出日】 2026年6月25日 【事業年度】 第92期(自 【会社名】 北陸電気工業株式会社…
EDINET提出書類
北陸電気工業株式会社(E01817)
有価証券報告書
【表紙】
【提出書類】
有価証券報告書
【根拠条文】
金融商品取引法第24条第1項
【提出先】
関東財務局長
【提出日】
2026年6月25日
【事業年度】
第92期(自
【会社名】
北陸電気工業株式会社
【英訳名】
HOKURIKU ELECTRIC INDUSTRY CO.,LTD.
【代表者の役職氏名】
代表取締役社長
【本店の所在の場所】
富山県富山市下大久保3158番地
【電話番号】
076-467-1111(代表)
【事務連絡者氏名】
財務部長
【最寄りの連絡場所】
東京都品川区西五反田5-2-4
レキシントン・プラザ西五反田8階
【電話番号】
03-5437-2201(代表)
【事務連絡者氏名】
執行役員営業マーケティング本部長
【縦覧に供する場所】
株式会社東京証券取引所
2025年4月1日
三輪
下坂
至
2026年3月31日)
立正
浩司
(東京都中央区日本橋兜町2番1号)
1/97
飯山
康太
EDINET提出書類
北陸電気工業株式会社(E01817)
有価証券報告書
第一部【企業情報】
第1【企業の概況】
1【主要な経営指標等の推移】
(1) 連結経営指標等
回次
第88期
第89期
第90期
第91期
第92期
決算年月
2022年3月
2023年3月
2024年3月
2025年3月
2026年3月
売上高
(百万円)
40,448
45,459
40,811
43,185
43,128
経常利益
(百万円)
2,548
3,581
3,107
2,849
2,742
親会社株主に帰属する当期純利益
(百万円)
1,949
647
2,538
2,194
1,986
包括利益
(百万円)
2,916
1,530
3,619
3,461
3,939
純資産額
(百万円)
15,950
17,107
20,106
22,713
25,817
総資産額
(百万円)
40,959
42,979
41,645
43,195
46,177
1株当たり純資産額
(円)
1,906.08
2,043.56
2,463.43
2,863.49
3,290.86
1株当たり当期純利益金額
潜在株式調整後
1株当たり当期純利益金額
自己資本比率
(円)
232.89
77.36
307.33
270.78
253.15
(円)
−
−
−
−
−
(%)
38.9
39.8
48.3
52.6
55.9
自己資本利益率
(%)
13.3
3.9
13.6
10.3
8.2
株価収益率
営業活動による
キャッシュ・フロー
投資活動による
キャッシュ・フロー
財務活動による
キャッシュ・フロー
現金及び現金同等物の期末残高
(倍)
5.1
17.6
4.6
5.5
10.5
(百万円)
△909
629
4,519
4,124
1,397
(百万円)
△1,064
△1,045
△737
△1,471
△134
(百万円)
23
773
△2,476
△1,905
△644
(百万円)
5,404
6,253
8,018
9,303
10,210
1,888
1,907
1,877
1,801
1,833
(439)
(389)
(356)
(340)
(371)
従業員数
(外、平均臨時雇用者数)
(人)
(注)潜在株式調整後1株当たり当期純利益金額については、潜在株式が存在しないため記載しておりません。
2/97
EDINET提出書類
北陸電気工業株式会社(E01817)
有価証券報告書
(2) 提出会社の経営指標等
回次
第88期
第89期
第90期
第91期
第92期
決算年月
2022年3月
2023年3月
2024年3月
2025年3月
2026年3月
売上高
(百万円)
34,649
38,720
33,996
36,361
37,197
経常利益
(百万円)
1,440
1,963
2,425
2,260
2,421
当期純利益又は当期純損失(△)
(百万円)
1,106
△545
2,361
1,845
1,904
資本金
(百万円)
5,200
5,200
5,200
5,200
5,200
(千株)
9,250
9,250
9,250
8,450
8,450
純資産額
(百万円)
13,323
12,446
14,321
15,316
16,945
総資産額
(百万円)
35,799
35,468
34,093
34,104
36,109
(円)
1,592.13
1,486.78
1,754.57
1,930.98
2,159.92
45.00
55.00
60.00
90.00
95.00
(−)
(−)
(−)
(−)
(−)
(円)
132.24
△65.16
285.90
227.74
242.70
(円)
−
−
−
−
−
(%)
37.2
35.1
42.0
44.9
46.9
(%)
8.6
△4.2
17.6
12.5
11.8
株価収益率
(倍)
9.0
−
5.0
6.5
11.0
配当性向
(%)
34.0
−
21.0
39.5
39.1
538
529
662
639
644
(18)
(12)
(16)
(16)
(21)
発行済株式総数
1株当たり純資産額
1株当たり配当額
(うち1株当たり中間配当額)
1株当たり当期純利益金額又は1株
当たり当期純損失金額(△)
潜在株式調整後
1株当たり当期純利益金額
自己資本比率
自己資本利益率
従業員数
(外、平均臨時雇用者数)
(円)
(人)
株主総利回り
(%)
128.7
152.6
164.7
180.3
313.5
(比較指標:TOPIX(配当込み))
(%)
(102.0)
(107.9)
(152.5)
(150.2)
(202.2)
最高株価
(円)
1,456
1,488
1,542
1,660
3,070
最低株価
(円)
914
1,010
1,157
1,106
1,290
(注)1.第88期、第90期および第91期、第92期における潜在株式調整後1株当たり当期純利益金額については、潜在
株式が存在しないため記載しておりません。また、第89期における潜在株式調整後1株当たり当期純利益金
額は、潜在株式が存在しておらず、また、1株当たり当期純損失金額であるため記載しておりません。
2.第89期における株価収益率は、1株当たり当期純損失金額であるため記載しておりません。
3.第89期における配当性向は、当期純損失のため記載しておりません。
4.最高株価及び最低株価は、2023年10月20日より東京証券取引所スタンダード市場、2022年4月4日より東京
証券取引所プライム市場におけるものであり、それ以前については東京証券取引所市場第一部におけるもの
であります。
3/97
EDINET提出書類
北陸電気工業株式会社(E01817)
有価証券報告書
2【沿革】
1943年4月
1944年4月
1961年12月
1962年8月
1969年7月
1979年11月
1980年7月
1982年1月
1982年4月
1984年4月
1986年9月
1986年10月
1987年9月
1990年2月
1990年4月
1994年7月
1994年7月
1995年2月
1996年9月
1997年2月
1997年3月
1998年9月
2001年3月
2001年3月
2002年10月
2002年12月
2002年12月
2003年1月
2003年2月
2003年2月
2003年8月
2003年10月
2004年9月
2004年9月
2004年12月
2005年10月
2006年3月
2006年3月
2007年10月
2008年2月
2008年3月
2008年10月
2009年9月
2009年10月
2010年8月
2010年8月
2011年10月
2011年11月
2017年6月
2018年10月
2022年4月
2023年10月
2023年10月
富山県大沢野町(現・富山市)に資本金15万円をもって北陸電気科学工業株式会社を設立
社名を北陸電気工業株式会社に変更
北陸精機株式会社(現・連結子会社)を設立
株式を東京証券取引所市場第二部に上場
北日本電子株式会社を設立
シンガポールに北陸シンガポール株式会社(現・連結子会社)を設立
北陸興産株式会社を設立
株式会社大泉製作所と資本提携を行い、非直線素子(センサなど)を当社にて販売
北陸アイシー株式会社(現・連結子会社)及び黒瀬電子株式会社(現・連結子会社朝日電子株式会
社)を設立
一般募集による新株式発行(発行株式数4,000千株、払込金の総額4,992百万円)
株式を東京証券取引所市場第一部に指定替え上場
中華民国に台湾北陸電子株式会社を設立
ダイワ電機精工株式会社(現・連結子会社)と資本提携
カナダのレキシカンサーキット株式会社と資本提携
マレーシアに北陸マレーシア株式会社を設立
マレーシアに北電マレーシア株式会社(現・連結子会社)を設立
株式会社光陽精密と資本提携を行い、水晶関連製品を当社にて販売
中華人民共和国に蘇州大和精密模具有限公司を設立
米国にHDKアメリカ株式会社(現・連結子会社)を設立
香港にHDKチャイナ株式会社(現・連結子会社)を設立
シンガポールに北陸アジアホールディング株式会社を設立
経営改善3ヶ年計画による構造改革開始
北日本電子株式会社がその製造・販売部門を株式会社北陸フロリストに譲渡
第三者割当による新株式発行(発行株式数5,553千株、発行価額の総額1,082百万円)
中華人民共和国に北陸(上海)国際貿易有限公司(現・連結子会社)を設立
「HDK再生プログラム」による財務リストラの総仕上げと早期復配のための諸施策を公表
当社保有の株式会社光陽精密の株式を譲渡
当社保有の株式会社大泉製作所の株式を譲渡
北陸興産株式会社と北日本電子株式会社は合併し、北陸興産株式会社(現・連結子会社)が存続会社
となる
カナダのレキシカンサーキット株式会社がカナダ・オンタリオ州破産裁判所に破産の申立
形式的資本減少(第69回定時株主総会決議)の効力が発生し資本金が9,669百万円減少し3,000百万円
となる
第1回無担保社債発行(発行総額20億円、償還方法 2008年10月17日満期一括償還)
当社保有の北陸マレーシア株式会社の株式を譲渡
中華人民共和国に天津北陸電気有限公司(現・連結子会社)を設立
中期経営計画「V-PLAN 07」による価値創造型企業への変身を図るための諸施策を公表
第2回無担保社債発行(発行総額10億円、償還方法 2009年10月30日満期一括償還)
一般募集による新株式発行(発行株式数8,000千株、発行価額の総額2,373百万円)
第三者割当による新株式発行(発行株式数800千株、発行価額の総額237百万円)
タイにHDKタイランド株式会社(現・連結子会社、モジュール製品の製造子会社)を設立
中期経営計画「G-PLAN 10」による成長への再チャレンジを目指すための諸施策を公表
北陸アジアホールディング株式会社は解散し清算結了
第1回無担保社債満期一括償還(償還額20億円)
電子モジュール製品分野における株式会社住友金属マイクロデバイスとの資本・業務提携公表
第2回無担保社債満期一括償還(償還額10億円)
株式会社住友金属マイクロデバイス(2010年8月2日にHDKマイクロデバイス株式会社(現・連結
子会社)に商号変更。)株式を取得し同社を子会社化するとともに当社電子モジュール事業を吸収分
割し同社に承継(逆取得)し、これにより、中華人民共和国の上海北陸微電子有限公司(現・連結子
会社)及びフィリピンのHDKフィリピン株式会社が子会社となる
台湾北陸電子株式会社は2008年3月解散し清算結了
中華人民共和国に北陸電気(広東)有限公司(現・連結子会社)を設立
タイに北陸インターナショナルタイランド株式会社(現・連結子会社)を設立
HDKマイクロデバイス株式会社保有のHDKフィリピン株式会社の株式を譲渡
野村エンジニアリング株式会社(現・連結子会社)の株式を取得し、子会社化
東京証券取引所の市場区分の見直しにより、東京証券取引所の市場第一部からプライム市場に移行
HDKマイクロデバイス株式会社を吸収合併
プライム市場からスタンダード市場に移行
4/97
EDINET提出書類
北陸電気工業株式会社(E01817)
有価証券報告書
3【事業の内容】
当社グループ(当社及び当社の関係会社)は、当社(北陸電気工業株式会社)、子会社17社(2026年3月31日現
在)により構成されており、主として電子部品(抵抗器、モジュール製品、電子デバイス及びその他の電子部品)の
製造・販売を事業としております。
当社グループの事業内容および当社と関係会社の当該事業に係る位置付けは次のとおりであります。
なお、次の2部門は、「第5 経理の状況1(1)連結財務諸表注記事項」に掲げるセグメント情報の区分と同一で
あります。
(1) 電子部品
当部門においては、抵抗器(皮膜抵抗器及び可変抵抗器等)、モジュール製品(混成集積回路及びユニット製
品等)、電子デバイス(センサ及び圧電部品等)およびその他電子部品(回路基板等)を製造・販売しておりま
す。
〔主な関係会社〕
(製造・販売)北電マレーシア㈱、上海北陸微電子㈲、HDKタイランド㈱、野村エンジニアリング㈱
(製
造)朝日電子㈱、天津北陸電気㈲、北陸アイシー㈱、北陸電気(広東)㈲
(販
売)北陸シンガポール㈱、HDKチャイナ㈱、HDKアメリカ㈱、北陸(上海)国際貿易㈲、北陸イン
ターナショナルタイランド㈱
(2) 金型・機械設備
当部門においては、金型及び機械設備の製造・販売に携わっております。
〔主な関係会社〕
(製造・販売)ダイワ電機精工㈱、北陸精機㈱
(3) その他
商品仕入(㈱大泉製作所製品)および不動産・保険代理業(北陸興産㈱)に係る事業であります。
〔事業系統図〕
以上述べた事項を事業系統図によって示すと、次のとおりであります。
5/97
EDINET提出書類
北陸電気工業株式会社(E01817)
有価証券報告書
4【関係会社の状況】
連結子会社
名称
北陸興産㈱
住所
富山県
富山市
資本金
80
百万円
議決権の
主要な事業
所有割合
の内容
(%)
その他
不動産賃貸及び保険代理業を行っており
ます。不動産の賃借あり。
債務保証あり。役員の兼任あり。
朝日電子㈱
富山県
50 電子部品
100.0 チップ抵抗器を製造しております。不動
朝日町
百万円
産及び機械の賃貸あり。
役員の兼任あり。
北陸アイシー㈱
富山県
10 電子部品
100.0 モジュール製品を製造しております。
富山市
百万円
役員の兼任あり。
ダイワ電機精工㈱
滋賀県
80
金型・
94.9 金型を製造・販売しております。
長浜市
百万円機械設備
資金援助あり。債務保証あり。
役員の兼任あり。
北陸精機㈱
富山県
10
金型・
100.0 機械設備を製造・販売しております。
富山市
百万円機械設備
役員の兼任あり。
野村エンジニアリング 神奈川県
30 電子部品
100.0 無線モジュールを設計・販売しておりま
㈱
大和市
百万円
す。資金援助あり。役員の兼任あり。
北陸シンガポール㈱
シンガポール
13 電子部品
100.0 ASEAN地区に当社グループの電子部
(注)2
ジュロン
百万S$
品を販売しております。役員の兼任あ
り。
北電マレーシア㈱
マレーシア
125 電子部品
100.0 回路基板を製造・販売しております。
(注)2
ジョホール州
百万M$
(21.0) 役員の兼任あり。
HDKアメリカ㈱
アメリカ
6 電子部品
100.0 北米地区に当社グループの電子部品を販
アラバマ州
千US$
売しております。役員の兼任あり。
HDKチャイナ㈱
中華人民共和国
23,360 電子部品
100.0 香港、中国地区に当社グループの電子部
香港特別行政区
千HK$
品を販売しております。
役員の兼任あり。
北陸(上海)国際貿易㈲中華人民共和国
4,200 電子部品
100.0 中国地区に当社グループの電子部品を販
(注)2、6
上海市
千US$
売しております。役員の兼任あり。
天津北陸電気㈲
中華人民共和国
4,725 電子部品
100.0 電子デバイスを製造しております。
(注)2
天津市
千US$
役員の兼任あり。
HDKタイランド㈱
タイ
152 電子部品
100.0 モジュール製品を製造・販売しておりま
(注)2
アユタヤ県
百万THB
す。債務保証あり。役員の兼任あり。
上海北陸微電子㈲
中華人民共和国
27,300 電子部品
100.0 モジュール製品を製造・販売しておりま
(注)2
上海市
千US$
す。役員の兼任あり。
北陸電気(広東)㈲
中華人民共和国
6,500 電子部品
100.0 抵抗器を製造しております。
(注)2
広東省
千US$
役員の兼任あり。
北陸インターナショナ タイ
10 電子部品
100.0 タイ地区に当社グループの電子部品を販
ルタイランド㈱
バンコク市
百万THB
(0.0) 売しております。役員の兼任あり。
(注)1.主要な事業の内容欄には、セグメントの名称を記載しております。
2.特定子会社であります。
3.有価証券届出書又は有価証券報告書を提出している会社はありません。
4.議決権の所有割合欄の( )内は、間接所有割合で内数であります。
5.当社の関係会社においては、親会社、持分法を適用した関連会社及びその他の関係会社はありません。
6.当該連結子会社は、売上高(連結会社相互間の内部売上高を除く。)の連結売上高に占める割合が10%を超
えております。
主要な損益情報等
北陸(上海)国際貿易㈲
(1) 売上高
8,434百万円
(2) 経常利益
△19百万円
(3) 当期純利益
△22百万円
(4) 純資産額
980百万円
(5) 総資産額
3,096百万円
6/97
100.0
関係内容
EDINET提出書類
北陸電気工業株式会社(E01817)
有価証券報告書
第2【事業の状況】
1【経営方針、経営環境及び対処すべき課題等】
当社グループの経営方針、経営環境および対応すべき課題等は以下のとおりであります。
なお、文中の将来に関する事項は、当連結会計年度末現在において当社グループが判断したものであります。
(1)経営方針
当社は「Creating for the Future」をスローガンに掲げ、以下の企業理念、価値観、ビジョン、行動指針を経
営方針としております。
〈企業理念〉
社是、社訓に謳っております“明日をつくろう”“誠実をもって仕事に励もう”“責任を自覚しお互いに協力し
よう”“良い製品をつくり社会の発展に尽くそう”という創業以来のモノ造りへの精神は不変です。
〈価値観〉
“「環境」「安心・安全」「幸福」「共感」をキーワードに、豊かな社会に寄与する価値および従業員のウェル
ネスにつながる価値を創造し実現していきます”と定め、価値創造を目指しております。
〈ビジョン〉
モノ造りを通じて未来を開くイノベーションに挑戦し心豊かな社会の発展に貢献します。
〈行動指針〉
「挑戦と創造」「誠実な行動」「共栄と調和」を指針としております。
(2)事業環境
以下のとおり、各国政策動向の変化などによる地政学的リスクの高まりに加え、GX/DXの潮流やAIの本格
普及など、取り巻く事業環境は大きく変化しております。
事業環境の変化に対し、リスクと機会を的確に捉えて戦略を策定・実行します。
事業環境
エレクトロニクス業界
地政学リスクの高まり
・貿易摩擦による需要の変化
・サプライチェーンの分散化
脱炭素社会の進展
・電動化、自動運転の進展
・再生可能エネルギー利用の加速
社会・産業のデジタル変革
・AI、IT関連需要の増大
・ソリューションサービスの拡大
労働人口の減少
・スマートファクトリー化の進展
・ロボティクスの活用
(3)事業戦略等
当社グループは以下のとおり3つのコア事業へ展開しております。
・多種多様なコンポーネント電子部品
・MEMS・有機材料技術を活かしたセンサ群
・グローバル拠点による実装モジュール
社会課題を認識したうえで、これら事業におけるコア技術の進化により新製品を創造し、価値を提供するといっ
た価値創造プロセスをビジネスモデルの基本として、電子部品デバイス、実装、ソフト設計といったコア技術の融
合によるソリューション製品の提供を事業戦略の柱としております。
また、「モビリティ」「GX/DX」「産業・インフラ」「スマート家電・医療」といった4つのドメインおよ
びネクストフロンティア(次世代成長市場)において、コア事業の進化と新製品創出に向け経営資源を集中させ、
事業領域の拡大を目指してまいります。
(4)優先的に対処すべき事業上及び財務上の課題
2025年5月公表の「中期経営計画2027」におきまして、これからの3年間を成長軌道へ舵を切る期間と位置づ
け、以下の基本方針で取り組んでおります。
(コア事業の進化)
・抵抗器等 : 市場ニーズにマッチした高付加価値製品の開発、提供による収益拡大
・センサ等 : 環境や安心・安全に貢献する製品の需要を取り込み、着実に成長
・モジュール: モビリティ分野の電動化ニーズを捉え、ソリューションビジネス展開で成長軌道を確立
・ASEAN地域の生産体制およびインドでの販売体制を強化
・DXによる生産性の向上
(新製品、新規事業の推進)
・IoTフォークリフトサービス、超音波ソナーシステム、広帯域ピエゾブザー、小型高電力チップ抵抗器など
の事業化
7/97
EDINET提出書類
北陸電気工業株式会社(E01817)
有価証券報告書
(経営基盤のさらなる強化)
・CO2排出量削減および環境配慮型製品の拡大
・人的資本経営および事業戦略と連動した人材戦略の推進
・リスクマネジメントの継続的改善
(キャピタルアロケーション)
・安定的な営業キャッシュ・フローの創出による新製品およびコア事業への成長投資の推進
・充実した株主還元の実施による持続的な企業価値の向上
(5)経営上の目標の達成状況を判断するための客観的な指標等
中期経営計画2027において、2027年度の目標として掲げた指標は以下のとおりです。
経済価値
売上高
480億円
社会価値
環境
・CO2排出量
・環境配慮型製品の売上比率
2017年度比40%削減
30%
70%以上
8%
重大事故0件
営業利益率
7%以上
社会
人的資本経営の推進
・従業員エンゲージメントスコア
・女性管理職比率
ROE
10%以上
ガバナンス
コーポレートガバナンス体制の強化
・リスクマネジメントの継続的改善
・情報セキュリティの強化
また、資本の効率化を図るため、2024年11月に「資本コストや株価を意識した経営の実現に向けた対応状況につ
いて」を公表し、PBR1倍以上に向けた取り組みおよび剰余金の配当基準引上げを明示しており、それらの指標
は以下のとおりです。
PBR1倍以上
ROE10%以上
PER10倍以上
剰余金の配当基準
純資産配当率(DOE)3%以上
配当性向35%目処
8/97
EDINET提出書類
北陸電気工業株式会社(E01817)
有価証券報告書
2【サステナビリティに関する考え方及び取組】
当社グループのサステナビリティに関する考え方および取組みは、次のとおりであります。
なお、文中の将来に関する事項は、当連結会計年度末現在において当社グループが判断したものであります。
(1) サステナビリティについてのガバナンスおよびリスク管理に関する事項
①ガバナンス
サステナビリティの取組みを推進するための取締役会直属の組織として「サステナビリティ委員会」を2022年5
月に設置しました。サステナビリティ統括責任者である代表取締役を委員長とし、執行役員および事業本部長を中
心に委員を構成しています。同委員会にてサステナビリティに関する方針や目標、実行計画の策定、目標に対する
進捗管理や評価、個別施策の審議等を行い、定期的に取締役会に報告や提言を行うこととし、サステナビリティ推
進に取り組んでいます。
②リスク管理
サステナビリティ委員会の下部組織としてサステナビリティ部会を設置し、環境、社会貢献、ガバナンス/コン
プライアンスの各部会でリスクや機会について情報収集し、リスクへの取組方針や対応策を作成し、サステナビリ
ティ委員会で議論し取締役会へ報告することとし、リスク管理委員会にもリスクについて提言し、全社リスクの管
理状況について確認し、取締役会に報告することとしています。なお、取組方針や対応策を中期経営計画に組み込
み、戦略への組み込みと実行につなげる体制としております。また、2023年6月から女性活躍の推進とエンゲージ
メント向上を目的として意見交換会を開催しております。2026年4月からは、女性活躍推進会議として社会貢献部
会の下部組織として発展的に改変いたしました。
サステナビリティ・マネジメント体制
9/97
EDINET提出書類
北陸電気工業株式会社(E01817)
有価証券報告書
(2) 気候関連リスク
①ガバナンス
<気候関連リスクと機会にかかわるガバナンス>
当社グループの主力製品である電子部品は、様々な分野で使われており、製品製造にあたり、サプライチェーン
全体では相当のCO2排出量になると認識しています。その認識のもと、気候変動問題を当社グループが社会的責
任を果たし持続的に発展していくための重要課題の一つと捉え、サステナビリティ委員会でマネジメントしており
ます。サステナビリティ委員会は、コーポレートガバナンス体制の一画を担う委員会として取締役会が設置してお
り、代表取締役が委員長を務め、サステナビリティに関する方針や目標、実行計画の策定、目標に対する進捗管理
や評価、個別施策の審議等を行い、定期的に取締役会に報告や提言を行うこととし、サステナビリティ推進に取り
組んでいます。
②戦略
<組織の事業・戦略・財務に対する気候関連リスクと機会の影響>
サプライチェーン全体でのCO2排出削減が求められる中、当社グループ全体の排出量を削減できなければ、当
社グループにとってリスクとなり得ます。一方、当社全体の排出量を削減することに加え、排出削減に寄与する製
品の開発販売による貢献ができれば、事業拡大の機会となり得ます。
中期経営計画の中で、環境性能に優れた製品の拡大などにより、2030年度までに温室効果ガスの排出量を2017年
度比46%削減すること、2050年度に自社事業による温室効果ガスの排出量実質ゼロを目指すことを掲げています。
シナリオ分析の詳細
以下のシナリオを使用し、将来にわたり当社グループの業績に影響する事業リスクと、気候変動の課題解決に対
応して創出できる事業機会を特定しています。
・IEA Net Zero Emissions Scenario(NZE)
1.6℃/2050 1.5℃/2100
・IEA
Stated Policies Scenario(STEPS)
1.9℃/2050 2.6℃/2100
・IPCC
AR6
SSP1−2.6
1.7℃/2050 1.8℃/2100
・IPCC
AR6
SSP2−4.5
2.0℃/2050 2.7℃/2100
シナリオA
世界各国の協調による脱炭素化社会が進む
1.5℃シナリオ
シナリオB
世界各国の気候変動対策の取組みが二極化し脱炭素化
が進まない3℃シナリオ
温室効果ガスの削減・吸収・貯蓄・再利用に関する
技術(CCS、CCUSなど)、太陽光発電や蓄電シ
ステムの低価格化・高性能化等、新技術が新たな経済
成長の原動力になりうることが明確となり、国際協調
による脱炭素化が進み気温上昇に歯止めがかかる。
当社グループを取り巻く環境においても脱炭素化に
向けた動きが主流となり、車・家電・産業機器など全
般的に軽薄短小、環境配慮型、貢献型の付加価値製品
が増加し、電子部品業界は需要がさらに高まる。一
方、製品に関する規制が高まる。
各国でEV化、太陽光発電、風力発電などの脱炭素
インフラへの移行が進むものの、新技術が脱炭素化に
与える影響は小さく、更なる気温上昇を招き、異常気
象による自然災害の頻発化、激甚化が進む。
当社グループへの影響についても相次ぐ自然災害に
よりサプライチェーンが分断され、安定的な生産、供
給が困難になり、物不足が常態化しインフレが進んで
いる。
10/97
EDINET提出書類
北陸電気工業株式会社(E01817)
有価証券報告書
③リスク管理
<気候関連リスクを識別・評価・管理するために用いるプロセス>
気候変動に伴うリスクには、政策・規制の強化や技術の進展、市場や評判の変化など脱炭素社会への移行に起因
するものと、急性的な異常気象の激甚化や慢性的な気温・海面上昇など気候変動の物理的な影響に起因するものが
考えられます。また、機会には、資源の効率性向上、再生可能エネルギー化、製品品質の向上、レジリエンス(強
靭性)といった側面が考えられます。
当社グループは、気候関連のリスク・機会の重要性評価に向け、「移行リスク」「物理的リスク」「機会」の区
分で当社グループへの影響を検討し、発生の可能性や財務上の影響を3段階で評価し、重要なリスクと機会を特定
しています。
「移行リスク」「物理的リスク」「機会」とも、重要リスク・機会を特定したうえで、取組方針や対応策を検討
し、取締役会にて決議しました。
また、気候関連リスクを、当社グループの事業戦略に大きな影響を与えるリスクの一つとしてリスク管理委員会
に提言し、同委員会で全社リスクの管理状況について確認し、取締役会に報告しております。取締役会では気候変
動への対応に関する計画の進捗について定期的に報告を受け、その執行状況を監督しています。
気候関連リスク・機会
分類
移行
リスク
物理的
資源の効率性
機会
製品/サービス
発生の可能性
財務上の影響
再生可能エネルギーの調達の要求などによる調
達・製造コストの上昇
当社グループへの影響
高
中
炭素税、燃料・エネルギー消費への課税、排出権
取引などの導入に伴うコストの増加
高
中
製品の技術開発の遅れによる販売機会の逸失や既
存製品の陳腐化による売上減少
中
大
中
中
より効率的な生産・物流プロセスの構築によるコ
ストの削減
中
中
環境配慮型、貢献型製品の販売拡大が期待される
高
大
EVや自動運転用の電子部品需要の拡大が期待さ
れる
高
大
生産拠点の損壊、台風などによる洪水で自社工場
の浸水などが起こり操業停止になる可能性や、部
品調達取引先の操業不能による部品供給停止の可
能性がある
④指標と目標
<気候関連リスクと機会を評価・管理するための指標と目標>
取締役会で決議した温室効果ガスの排出削減目標を中期経営計画に組み込むとともに、当社グループの重要課題
として特定し、KPIを設定して進捗を管理しています。
a.2050年度目標:温室効果ガスの実質排出量ゼロを目指す
事業に必要な電力を100%再生可能エネルギーに切り替える
b.2030年度目標:Scope1,2 46%削減(2017年度比、国内)
電力の再生可能エネルギー比率:30%(国内)
c.CO2排出量(Scope1,2)2028年度に2022年度比22.6%、年率3.7%削減(海外主要工場含む)
■実績は以下のとおりです。
・2025年度CO2排出量実績は、2017年度比で68.6%削減(国内、再生可能エネルギー含む)、
2022年度比で16.7%削減(海外主要工場含む、再生可能エネルギー含まず)
・2025年度使用電力の再生可能エネルギー導入比率は、48.2%(国内)
※2025年度のCO2排出量削減実績等は2026年6月時点での暫定値です。
11/97
EDINET提出書類
北陸電気工業株式会社(E01817)
有価証券報告書
(3) 多様性の確保に向けた人材育成方針と社内環境整備方針
①戦略
a.人材育成方針
通信教育、集合研修、eラーニングなど学びの形態は増えてきています。様々な形態の中で語学教育やデジタ
ル人材の育成研修、リーダーシップ研修、意識改革研修のトレーニングなど、教育体系に基づく年度計画により
教育を実施するとともに、時代にマッチしたタイムリーな教育を受けられるよう、年度計画に入っていない教育
についても各事業本部の裁量で受講を進められるなど、柔軟な対応を進めます。
また、デジタル変革(DX)を加速させる強い事業体質への変革を目指し、これまでの生産・業務DXの成功
事例を足掛かりに、デジタル人材の育成を強化します。さらに、新入社員の定着促進に向けたメンター制度とし
て「ブラザーシスター(BS)制度」を活用し、一人ひとりが自律的に行動できる力の醸成に向けた教育プログ
ラムを拡充します。
今後も、「働き方改革」「ダイバーシティ推進」に向けて業務改革を推進できるよう、個々のスキルを高める
ための教育を継続してまいります。
b.社内環境整備方針
人種・国籍・性別・年齢・宗教・心身障がいの有無等に関わらず、多様な人材がライフスタイルにあった働き
方で個性と能力を発揮できる企業風土づくりを推進します。
多様な人材を尊重するとともに様々な視点を受容し、活躍の場を提供することで、変化し続けるビジネス環境
に対応し企業価値を高めていきます。これまでも中途採用者の拡大、女性登用などを推進してきましたが、あわ
せて、外国人採用の推進や、シニア層の活躍のための「定年延長」および「継続雇用条件の見直し」により、次
世代への確実な技能継承体制を構築します。
また、女性管理職比率の向上に向け、女性担当取締役が参画する女性活躍推進会議を設置し、部門間交流会の
定期開催等を通じて、女性従業員自らが中心となって職場の問題点の調査や提案、改善に取り組みます。
出産・育児・介護、その他の様々なライフイベントが発生しても仕事と両立できるよう支援制度を整えること
で、全ての社員が継続して働きやすい職場となるよう「育児休業」や「介護休業」だけでなく、復職後の「短時
間勤務」なども含めて環境整備を進めております。
とりわけ育児支援においては、「育児休業は2歳まで」、「短時間勤務制度は小学校卒業まで」に期間を拡大
するとともに、「社内育児休職取得助成金制度」を新たに創設・運用しており、これらの支援策の展開により、
男性従業員の育児休業取得率100%となりました。
こうした環境を維持・発展させるため、定期的に個人別の面談を実施するとともに、労使会議も開催するな
ど、多様な目線からの意見聴取等を継続して風通しの良い企業風土を構築いたします。
②指標と目標
主な指標と目標は以下のとおりです。
なお、現状におきましては、単体を主として取り組みを進めております。
指標
目標
管理職に占める女性労働者の割合(連結)
未設定
17.7%
管理職に占める女性労働者の割合(単体)
2030年10%
6.0%
男性の育児休業等取得率
目標は定めず改善を図る
100.0%
男女の賃金の格差
目標は定めず改善を図る
77.7%
12/97
実績(当連結会計年度)
EDINET提出書類
北陸電気工業株式会社(E01817)
有価証券報告書
3【事業等のリスク】
有価証券報告書に記載した事業の状況、経理の状況等に関する事項のうち、投資家の判断に重要な影響を及ぼす可
能性のある事項には、次のようなものがあります。
なお、文中の将来に関する事項は、当連結会計年度末現在において当社グループが判断したものであります。
(1) 経済情勢の急激な変動によるリスク
当社グループは世界の電子機器メーカー等に抵抗器、モジュール製品等の電子部品を製造販売しておりますが、
電子機器の需要動向は、日本、欧米、アジアの各市場における経済情勢に大きく左右されます。そのため、各市場
における景気後退のほか、関税引き上げや輸出入制限といった法規則の変更など経済情勢の急激な変動は、当社グ
ループの業績および財務状況に悪影響を及ぼす可能性があります。
(主な対応策)
当社グループは、安定的な受注の確保を図るため、ライフサイクルの長い自動車向けの拡販を進めるとともに、
幅広い分野で使用されるよう製品開発および拡販を進めております。また、急激な受注の減少に伴い発生する余剰
コストを抑制するため、製販拠点の綿密な連携により市場および顧客の生産動向を迅速に把握するとともに、生産
拠点の分散化や稼働日数の柔軟な調整等により機動的に対応しております。
(2) 原材料等の調達におけるリスク
原材料等の調達におけるリスクとしては、各国の輸出入規制や治安悪化、感染症の蔓延、戦争や災害などによる
原材料等の供給中断、資源の枯渇による供給停止や、市況の変化等による価格の高騰が生じる可能性があります。
これらの場合、製造原価の上昇、生産調整さらには生産停止を招く等、業績および財務状況に悪影響を及ぼす可能
性があります。
また、当社グループは、技術革新のスピードが速く、価格競争が激しい電子部品業界に属しており、想定外の市
場環境の変化などにより過剰在庫が生じる可能性があります。当該過剰在庫に係る評価損の計上により業績および
財務状態に悪影響を及ぼす可能性があります。
(主な対応策)
原材料の調達状況については随時モニタリングを行い、適正在庫の確保、複数のサプライヤーからの調達、複数
国からの調達を進めております。また、過剰在庫が生じないよう、顧客からの発注及び発注見通しならびに市場動
向の分析に基づき生産計画を決定しています。
(3) 新技術・製品開発に関するリスク
当社グループが扱う電子部品事業は、技術革新のスピードが速く、顧客要求の変化も激しくなっており、将来に
わたって当社グループの企業価値や企業収益を維持・拡大していくためには市場の需要に応え適切なタイミングで
価値ある新製品の開発を進めていくことが、益々重要になっております。しかし、変化の激しいエレクトロニクス
業界の将来の需要を的確に予測し、技術革新による魅力的な新製品をタイムリーに開発・供給し続けることができ
るとは限りません。市場の急激な変化や急速な技術革新に当社が遅れを取った場合には、当社グループの事業・業
績及び財務状況に悪影響を及ぼす可能性があります。
(主な対応策)
新製品開発にあたっては開発活動の各段階で、マーケティング部門が新製品の市場性の分析や技術動向の予測を
フィードバックし、市場変化への対応を進めております。また、新規事業を推進するための機能を強化し、開発成
果の評価・検証を行い開発の実効性と効率性を高めております。さらに、現有技術分野における新商品開発に加
え、これらを活用したソフトウエア技術を含むサービス分野にまで幅を広げた商品の開発を進めております。
(4) 為替相場および株価の急激な変動に伴うリスク
当社グループの連結ベースでの海外売上高比率は、当期45.6%(前期は49.6%)と高水準にあり、生産拠点も海
外に展開していることから、為替変動は当社グループの外貨建取引から発生する収益・費用や資産・負債の評価額
を変動させ、業績および財務状況に影響を及ぼします。また、当社グループでは時価のある有価証券を保有してお
り、株価の下落や低迷により、有価証券の減損が必要となるリスクがあります。これらのリスクにより、当社グ
ループの業績および財務状況に悪影響を及ぼす可能性があります。
(主な対応策)
米ドル建ての製品販売が多いこと、また、米ドルおよびアジア通貨に対する円との為替相場の変動が大きいこと
を踏まえ、当社と海外子会社との取引(部材の支給、製品の仕入、製品の販売)は原則米ドル建てとし、海外子会
社の為替変動リスク低減を図っております。一方、日本サイドは資材調達において米ドル建てを活用することで、
米ドル建て収益との相殺を図るとともに、米ドル円相場の変動に伴うリスクに対し、為替予約等を行い低減に努め
ております。また、有価証券のうち政策保有株式については、リターンを踏まえた中長期的な観点から、毎期、保
有継続の是非を判断しており、保有意義が希薄化した株式は順次売却・縮減していく方針としております。
13/97
EDINET提出書類
北陸電気工業株式会社(E01817)
有価証券報告書
(5) 固定資産の減損リスク
当社グループは主として電子部品の製造のために固定資産を保有しておりますが、減損の兆候を把握し、将来の
キャッシュ・フローにより固定資産の簿価を回収できないと判断される場合には、減損損失の計上により、当社グ
ループの業績および財務状況に悪影響を及ぼす可能性があります。
(主な対応策)
当社グループは、従来の家電や情報通信機器向けから、今後成長および安定した収益が見込める自動車向けに事
業の主体を移しており、現時点では、事業収益の構造的な悪化は見込んでおりません。また、設備投資に当たって
は、複数の生産拠点および多品種で使用できるよう汎用性を高めるなど、回収不能リスクも踏まえて開発・検討を
行うことで、将来の減損回避に努めております。
(6) 税務に関するリスク
当社グループは、国内外に製造拠点、販売拠点を有しており、グループ会社間の取引も多く発生しております。
グループ会社間の国際的な取引価格に関しては、適用される各国の移転価格税制等の観点からも適切な取引価格と
なるよう留意しております。しかしながら、税務当局との見解の相違等により、取引価額が不適切であるとの指摘
を受け追加の税負担が生じる可能性があり、このような事態が生じた場合、当社グループの業績および財務状況に
悪影響を及ぼす可能性があります。また、繰延税金資産について、業績の悪化等により評価性引当額の積み増しが
必要となった場合、当社グループの業績および財務状況に悪影響を及ぼす可能性があります。
(主な対応策)
毎期、同期文書の作成を通してリスク分析を行うとともに、商流の変更時や新規取引開始時には、外部専門家へ
の相談を行うなど、リスクの回避に努めております。また、繰延税金資産の回収可能額算定に使用する将来の課税
所得については、事業計画だけではなく、過年度の業績を加味し、未達成リスクも織り込むことで、評価性引当額
積み増しリスクの低減を図っております。
(7) 特定の取引先、製品、技術等への依存度が高いモジュール製品の動向
モジュール製品の販売は、回路設計技術、高密度実装技術を背景として顧客の開発段階から参入し、資材調達、
製造も含めた総合的な製品力をもって拡販するため、経営資源(人、物、金)投入の観点から、特定顧客への依存
度が高くなっております。また、モジュール製品の販売は、特に自動車市場向けの売上比率が高く、その市場動向
によって当社グループの業績および財務状況に影響を及ぼす可能性があります。
(主な対応策)
当社グループの製品を幅広い用途、顧客に販売するなど、特定の顧客への依存度を下げる取組みを実施しており
ます。また、サステナビリティ関連やDX関連のニーズが高まることにより、当社の技術を活かした製品の開発・
販売を進め、特定の製品への依存度を下げる取組みを進めております。
(8) 新製品の拡販
当社グループは、成長分野であるカーエレクトロニクス、IT関連をターゲットにMEMSセンサ、小型湿度セ
ンサ、超薄型圧電積層素子、極小チップ部品、無線モジュールなどの新製品の拡販を図っております。また、今後
成長が見込まれているIoT関連向けでは無線システムの引き合いが多くなっております。こうした成長分野にお
いては、グローバルな競争がより激化し、過度な価格競争に巻き込まれる可能性があります。また、同業他社が当
社より優位な製品を先駆けて販売する可能性もあります。
上記リスクをはじめとして、将来、当社グループが予測していない状況変化が生じ、新製品の拡販が未達となっ
た場合、業績および財務状況に悪影響を及ぼす可能性があります。
(9) 海外(中国)依存による事業展開リスク
当社グループは、中国及び東南アジアに生産拠点を展開しており、それぞれの地域・国における経済動向および
政治・社会情勢に変化が起こった場合あるいは予期せぬ災害等が発生した場合、事業の遂行に問題が生じ、業績に
悪影響を及ぼす可能性があります。近年は中東やウクライナ情勢、感染症の拡大など、国際情勢の変化が大きく
なっていると認識しております。
(主な対応策)
当社はグローバルな地政学リスクの影響を勘案し、多方面から情報を収集し有事に対応できる体制を整えるとと
もに、東南アジアでの生産体制を増強するとともに安定生産を図り、リスクの分散を進めております。
(10)法規制等のリスク
当社グループが事業を展開する国内外において、商取引、反トラスト、知的財産権、製造物責任、環境、労務、
税制、事業投資の認可、輸出入規制等の様々な規制を受けております。当社グループではこれらの規制を遵守し事
業活動を行っておりますが、関連する規制への抵触、役員・従業員による不正行為が完全に回避できない可能性が
あります。このような事象が発生した場合、法的な処分、訴訟の提起、さらには事業停止に至るリスクや企業ブラ
ンドの低下、社会的信用の失墜等のリスクがあります。また、規制が強化された場合、規制対応のための多額な費
用負担等で事業に影響を及ぼす可能性があります。
14/97
EDINET提出書類
北陸電気工業株式会社(E01817)
有価証券報告書
(主な対応策)
当社グループでは、コンプライアンスに関するリスク低減とコンプライアンス意識向上に向け、以下の活動を実
施しております。
・サステナビリティ委員会にガバナンス/コンプライアンス部会を設置し、コンプライアンス情報の収集、分析
を進め取締役会に報告
・グループ会社を含めた社内コンプライアンス教育の実施
(11)気候変動リスク
気候変動リスクには、政策・規制の強化、技術の進展、市場や評判の変化など脱炭素社会への移行に起因する
「移行リスク」および急性的な異常気象の激甚化、慢性的な気温・海面上昇など気候変動による物理的な影響に起
因する「物理的リスク」があります。
当社における「移行リスク」および「物理的リスク」は以下のとおりです。
「移行リスク」
・再生可能エネルギーの調達要求などによるコストの増加
・炭素税、燃料・エネルギー消費への課税、排出権取引などに伴うコストの増加
・製品開発の遅れによる販売機会の逸失や既存製品の陳腐化による売上高の減少
「物理的リスク」
・気候変動に伴う台風や洪水などの災害により、グループ会社が操業できなくなるリスクおよび仕入先の操業停
止や交通インフラの麻痺などで部品調達ができなくなるリスク
(主な対応策)
移行リスクについては、事業活動において発生する温室効果ガスの排出を削減するために、省エネの推進、再生
可能エネルギーの導入および環境配慮型製品の開発に取組んでおります。物理的リスクについては、BCP管理体
制を強化するとともに、BCP運用状況の評価を年1回以上実施しております。
(12)情報セキュリティに関するリスク
当社グループは、取引先の機密情報や個人情報を有しております。これらの情報は、グループ全体で管理体制を
構築し、運用管理と情報セキュリティの強化を実施しております。しかしながら、複雑化するサイバー攻撃や不正
アクセス、内部の過失等により、これら情報の破壊や改ざん、流出、または情報システムの停止等が発生する可能
性があります。
(主な対応策)
当社グループでは、情報セキュリティシステムによる不正アクセスの制限と監視、外部機関による情報セキュリ
ティの脆弱性診断を実施し、管理体制の強化に努めております。また、当社情報セキュリティ規定に基づくソフト
ウエアや情報機器持出し制限や監視、情報リテラシーを高める目的での社員セキュリティ教育、万が一の脅威に備
え迅速に対応するためのウイルス対策訓練等、事業活動停止を回避する対策の実施に取り組んでおります。
(13)知的財産権に関するリスク
当社グループは、知的財産権を重要な経営資源と捉え、事業活動を支える技術を保護し、他社との差別化を図
り、事業を拡大するために、特許・意匠・商標等の知的財産権を獲得しております。しかし、競合他社が同様の技
術を開発することで当社の独自性が低下したり、海外において充分な保護の措置が取られなかったり、当社の製品
が模倣され商機を失うようなリスクがあります。また、当社が第三者の知的財産権を侵害するとして、第三者から
販売の差し止めや損害賠償の請求を受けたり、実施許諾料を求められたり、あるいは訴訟を提起されるリスクがあ
ります。さらに他社との協業や共同研究・共同開発が活性化している中、知的財産権に関する契約のトラブルなど
が発生すると、当社事業に悪影響を与えるリスクがあります。
(主な対応策)
当社グループでは、特許などの出願前に、先行技術調査を徹底するとともに、各国の知的財産に関する法律・審
査基準やプロセスを把握し、更に、海外での特許取得の効果・意義の検討を加え、知的財産権取得の精度アップ、
効率向上に努めております。また、自社製品・サービスの開発段階から、第三者の知的財産権の調査を行い、自社
製品・サービスとの比較検討を行うことで、第三者の知的財産権を侵害するリスクを低減することや、開発効率の
向上に努めております。製品・サービスの開発に関わる技術者全員には、知的財産の重要性や第三者の知的財産権
侵害リスク等について啓蒙を図ることのみならず、技術者自らが先行技術を調査できるよう教育を進めておりま
す。さらに、他社との協業や共同研究・共同開発においては、事前の契約内容について、専門部署を含めた精査を
充分に行った上で事業を進めております。
(14)感染症に関わるリスク
当社グループは、全世界的な感染症の流行に備え、従業員の安全と社内外への感染拡大抑止を第一に対策を講じ
ておりますが、感染症の拡大や長期化の状況によっては、当社グループが事業を展開している国・地域における活
動規制や企業活動の停滞等により当社グループ全体の事業活動、業績および財務状況に影響を及ぼす可能性があり
ます。
(主な対応策)
15/97
EDINET提出書類
北陸電気工業株式会社(E01817)
有価証券報告書
当社グループは、事業継続計画(BCP)を策定しており、リスク低減策を講じております。また、今後、感染
症などのリスクが顕在化した場合には、これまでの経験を活かして具体的な対応策を策定し、感染予防・拡大防止
策の実施に努めてまいります。
(15)顧客の信用リスク
当社は世界各地の機器メーカーを中心に電子部品を供給しておりますが、顧客の業績が悪化した場合、売上債権
等の回収ができず、当社グループの業績及び財政状態に重大な影響を及ぼす可能性があります。
(主な対応策)
当社グループは、新規取引時には外部信用リスク評価も参考にして取引条件等の設定を行い、顧客の財務状況の
定期的確認や随時、売上債権の状況を把握すること等により、債権回収リスクの低減に努めております。
また、諸規定を見直し、与信状況の監督を強化するとともにリスクマネジメント会議を定例開催し、経営への影
響が大きいリスクに関して議論しております。
(16)M&A、業務提携、戦略的投資に係るリスク
当社グループは、持続的な成長と企業価値向上に向けた新技術の獲得、新規事業領域への参入、既存事業の競争
力強化を目的として、必要に応じてM&A、業務提携、戦略的投資を実施しております。しかしながら、市場環境
や競争環境に著しい変化が発生した場合は、事業計画通りに投資効果を得られず、当社グループの業績や成長に影
響を及ぼす可能性があります。
(主な対応策)
検討に際しては、当社の事業計画に照らし合わせ、市場、新規技術の動向や顧客ニーズ、相手先企業の経営状況
等のリスク分析を行ったうえで判断しております。また実行された案件についての定期的な検証を行い、戦略の見
直しを実施しております。
(17)人材の採用・確保に係るリスク
当社グループは、品質と技術を重視した製品づくりを進めておりますが、事業を拡大していく上で、専門性や多
様な能力を有する人材確保の必要性がますます高まっています。一方、少子高齢化や労働人口の減少等、雇用環境
の変化が進んでおり、人材確保が進まなかった場合、事業展開、業績及び成長に大きな影響を及ぼす可能性があり
ます。
(主な対応策)
人材確保のために、計画的な新規採用や経験者の中途採用に積極的に取り組んでおります。また、公正な評価で
の登用・処遇を行うことで、従業員エンゲージメントを高め、多様な人材が中核人材として活躍できるよう、人材
の定着を図っております。
(18)製品の品質、製造物責任に関するリスク
当社グループは、至誠の精神に基づく「お客様第一」「品質重点」を基本方針とし、国内外製造拠点において国
際品質マネジメント規格(ISO9001、IATF16949他)に従い、徹底した品質管理を行い多様な製品を製造しておりま
す。しかしながら、全ての製品において欠陥が発生しないという保証はなく、将来において予期せぬ不具合が発生
すること等により、製造物賠償責任保険の範囲を超える賠償責任を問われる可能性があります。その結果、当社グ
ループの事業、業績、財務状況に大きな影響を及ぼす可能性があります。
(主な対応策)
当社グループでは、製品の開発段階より設計審査でのデザインレビューを十分に重ねた信頼のおける製品を量産
化し、工程パトロール、内部品質監査、購入先監査、信頼性試験等を通じて品質保証体制の向上に努めておりま
す。
16/97
EDINET提出書類
北陸電気工業株式会社(E01817)
有価証券報告書
4【経営者による財政状態、経営成績及びキャッシュ・フローの状況の分析】
(1) 経営成績等の状況の概要
当連結会計年度における当社グループ(当社及び連結子会社)の財政状態、経営成績及びキャッシュ・フロー
(以下「経営成績等」という。)の状況の概要は次のとおりであります。
①財政状態及び経営成績の状況
当連結会計年度の世界経済は、米国では個人消費の下支えにより景況は底堅く推移し、中国では輸出が米国以外
向けに増加したものの、不動産不況や政府補助金の効果低減に伴い内需の減速が鮮明になりました。
わが国におきましては、自動車関連の輸出が減少するなど米国関税による影響を受けましたが、個人消費および
設備投資は底堅さを維持しました。
そのような環境下、エレクトロニクス市場におきましては、AIの拡大を背景にデータセンター向けが増加しま
したが、EV向けが失速したことから、電子部品需要は総じて弱含みで推移しました。また、年度後半にかけて貴
金属相場が高騰し、原材料価格が上昇いたしました。
こうした状況のなかで、当社グループにおきましては、付加価値率の高い新分野への拡販を図る一方、生産効率
の改善に努めました。
その結果、当連結会計年度の業績は、売上高が43,128百万円(前期比△0.1%)、営業利益は2,311百万円(同△
11.1%)となり、経常利益は2,742百万円(同△3.7%)、親会社株主に帰属する当期純利益は1,986百万円(同△
9.5%)となりました。
セグメントの業績は、次のとおりであります。
・電子部品
電子部品は、売上高は42,275百万円(前期比+0.2%)となりましたが、貴金属相場の高騰に伴い材料コストが
増加し、営業利益は3,467百万円(同△5.1%)となりました。
・金型・機械設備
金型・機械設備は、機械設備の外販が振るわなかったものの、金型においてアミューズメント向けが増加し、売
上高765百万円(同+9.6%)、営業利益110百万円(同+101.7%)となりました。
・その他
その他は、商品仕入及び不動産業等にかかる事業であり、売上高536百万円(同△6.5%)、営業利益57百万円
(同△49.7%)となりました。
②キャッシュ・フローの状況
当連結会計年度末における連結ベースの現金及び現金同等物(以下「資金」という。)は、前連結会計年度末に
比べ906百万円増加し、10,210百万円となりました。
当連結会計年度における各キャッシュ・フローの状況とそれらの要因は次のとおりです。
(営業活動によるキャッシュ・フロー)
営業活動の結果得られた資金は1,397百万円となりました。これは、税金等調整前当期純利益2,792百万円、減価
償却費1,158百万円のほか、棚卸資産の増加、仕入債務および退職給付に係る負債の減少、法人税等の支払いなど
によるものであります。
(投資活動によるキャッシュ・フロー)
投資活動の結果使用した資金は134百万円となりました。これは、固定資産の取得による支出825百万円のほか、
投資有価証券の売却による収入などによるものであります。
(財務活動によるキャッシュ・フロー)
財務活動の結果使用した資金は644百万円となりました。これは、借入金の純増298百万円、配当金の支払い713
百万円、自己株式の取得による支出131百万円などによるものであります。
17/97
EDINET提出書類
北陸電気工業株式会社(E01817)
有価証券報告書
③生産、受注及び販売の実績
a.生産実績
当連結会計年度における生産実績をセグメントごとに示すと、次のとおりであります。
当連結会計年度
セグメントの名称
(自 2025年4月1日
前年同期比(%)
至 2026年3月31日)
電子部品(百万円)
41,772
0.2
420
△8.9
42,193
0.1
金型・機械設備(百万円)
合計(報告セグメント)(百万円)
(注)金額は販売価格によっており、セグメント間の内部振替前の数値によっております。
b.商品仕入実績
当連結会計年度の報告セグメントに属していない「その他」に含まれる商品仕入実績を示すと、次のとおりであ
ります。
当連結会計年度
セグメントの名称
(自 2025年4月1日
前年同期比(%)
至 2026年3月31日)
その他(㈱大泉製作所商品仕入)
280
△13.8
(百万円)
(注)金額は販売価格によっております。
c.受注実績
当連結会計年度における受注実績をセグメントごとに示すと、次のとおりであります。
セグメントの名称
受注高(百万円)
前年同期比(%)
受注残高(百万円)
前年同期比(%)
43,215
1.3
13,007
7.8
414
3.1
40
△43.7
43,630
1.3
13,048
7.5
430
△4.1
93
33.9
44,060
1.3
13,141
7.6
電子部品
金型・機械設備
報告セグメント計
その他
合計
(注)為替換算による差額等は、受注高に含めて調整しております。
d.販売実績
当連結会計年度における販売実績をセグメントごとに示すと、次のとおりであります。
当連結会計年度
セグメントの名称
(自 2025年4月1日
前年同期比(%)
至 2026年3月31日)
電子部品(百万円)
42,275
0.2
445
△15.4
42,721
0.0
407
△9.7
43,128
△0.1
金型・機械設備(百万円)
報告セグメント計(百万円)
その他(百万円)
合計(百万円)
(注)1.セグメント間の取引については相殺消去しております。
2.主な相手先別の販売実績及び当該販売実績の総販売実績に対する割合は、次のとおりであります。
前連結会計年度
当連結会計年度
(自 2024年4月1日
(自 2025年4月1日
相手先
至 2025年3月31日)
至 2026年3月31日)
金額(百万円)
割合(%)
金額(百万円)
割合(%)
無錫夏普電子元器件㈲
7,777
18.0
6,592
15.3
18/97
EDINET提出書類
北陸電気工業株式会社(E01817)
有価証券報告書
(2) 経営者の視点による経営成績等の状況に関する分析・検討内容
経営者の視点による当社グループの経営成績等の状況に関する認識及び分析・検討内容は次のとおりでありま
す。
なお、文中の将来に関する事項は、当連結会計年度末現在において判断したものであります。
①財政状態及び経営成績の状況に関する認識及び分析・検討内容
(事業全体の経営成績)
・売上高
売上高は、モジュール製品がディスプレイパネル向けに減少したことを主因に、前期に対し57百万円減少(前
期比△0.1%)し、43,128百万円となりました。
・売上原価
売上原価は、前期に対し9百万円増加(同+0.0%)し、34,616百万円となり、売上原価率は下期からの貴金属
相場高騰の影響を主因に、80.3%と、前期(80.1%)に対し上昇しました。
・販売費及び一般管理費
販売費及び一般管理費におきましては、人件費の増加および海外子会社分の円安に伴う円換算額の増加を主因
に、前期に対し222百万円増加(同+3.7%)し、6,201百万円となり、販管費率は、14.4%と、前期(13.8%)
に対し上昇しました。
・営業外損益(営業外収益及び営業外費用)
営業外損益の純額は431百万円の益(前期は248百万円の益)となりました。前期は期末にかけて米ドル安円高
にシフトしましたが、当期は下期から米ドル高円安が進行したことから、為替差益が、前期81百万円に対し、当
期は277百万円と増加しました。
・経常利益
営業利益の減少および為替差益の増加を主因に、前期に対し106百万円減少し、2,742百万円(前期比△
3.7%)となりました。
・特別損益(特別利益及び特別損失)
特別損益の純額は49百万円の益(前期は81百万円の損)となりました。前期は事業用資産の減損損失233百万
円および取引先関連事業損失戻入益155百万円を計上しましたが、当期は投資有価証券売却益107百万円、事業用
資産の減損損失41百万円等を計上しました。
・税金費用(法人税、住民税及び事業税並びに法人税等調整額)
税金等調整前当期純利益は、2,792百万円となり、前期に対し24百万円増加(前期比+0.9%)し、法人税、住
民税及び事業税と法人税等調整額を合算した税金費用合計としては、前期に対し232百万円増加(同+40.6%)
し、805百万円となりました。
税金等調整前当期純利益に対する税金費用合計の比率は、前期20.7%に対し、当期は28.9%と親会社の法定実
効税率30.5%に近い水準となりました。これは、2022年度において顧客の民事再生手続開始の申立てに伴う取引
先関連事業損失2,004百万円が税務上損金不算入となり、かつ、一時差異に係る繰延税金資産についても全額評
価性引当となりましたが、前期はその一時差異が解消したことにより比率が低下しましたが、当期は特段の変動
要因がなかったためであります。
・親会社株主に帰属する当期純利益
親会社株主に帰属する当期純利益は、経常利益、特別損益(益)、税金費用の計上などから、1,986百万円
(同△9.5%)となり、1株当たり当期純利益金額は253.15円(前期は270.78円)となりました。
(事業全体の財政状態)
・現金及び預金
利益の計上を主因に現金及び預金は前期末に対し1,148百万円増加(前期比+9.6%)し、13,079百万円となり
ました。
・売上債権(受取手形及び売掛金、電子記録債権)
期末にかけての売上高が、当期は前期より高い水準となったため、当期末の売上債権は、前期末に対し124百
万円増加(同+1.4%)し、8,774百万円となりました。
・棚卸資産
当期は後半から生産水準が高まったことや貴金属相場高騰により資材価格が上昇したことなどから、当期末の
棚卸資産は、前期末に対し759百万円増加(同+9.4%)し、8,868百万円となりました。
・有形固定資産及び無形固定資産
減価償却費1,158百万円および減損損失41百万円に対し、設備投資は1,890百万円となったことなどから、有形
固定資産及び無形固定資産の合計は、前期末に対し897百万円増加(同+10.2%)し、9,699百万円となりまし
た。
・繰延税金資産
繰延税金資産は、法人税等調整額が32百万円(損)となったほか、その他有価証券評価差額(益)に係る繰延
税金負債(相殺)が248百万円増加したことおよび未認識退職給付残高(△)に係る繰延税金資産が84百万円減
少したことを主因に、前期末に対し354百万円減少(同△34.0%)し、687百万円となりました。
・仕入債務(電子記録債務、買掛金)
仕入債務は中小受託取引適正化法などにより支払サイトが短縮したことから、前期末に対し622百万円減少
(同△10.7%)し、5,180百万円となりました。
19/97
EDINET提出書類
北陸電気工業株式会社(E01817)
有価証券報告書
・退職給付に係る負債
定年退職の増加に伴い退職給付の支払いが退職給付費用を上回ったこと、定年延長の決定に伴い過去勤務費用
(△)が発生したこと、および割引率の上昇に伴い数理計算上の差異(△)が発生したことから、当期末の退職
給付に係る負債は、前期末に対し471百万円減少(同△14.0%)し、2,891百万円となりました。
・有利子負債(短期借入金、長期借入金)
有利子負債は、長期借入金が減少したものの、短期借入金が増加し、前期末に比べ298百万円増加(同+
3.4%)し、9,035百万円となりました。
・純資産の部
純資産の部の合計は、前期末に対し3,104百万円増加(同+13.7%)し、25,817百万円となりました。
純資産の部の増減の概要は次のとおりであります。
株主資本は、親会社株主に帰属する当期純利益により1,986百万円増加しましたが、剰余金の配当により713百
万円減少したほか、自己株式の取得および処分により121百万円減少したことなどから、前期末に対し1,150百万
円増加(同+6.3%)し、19,303百万円となりました。
その他の包括利益累計額は、アジア通貨高・円安により為替換算調整勘定が1,208百万円増加したことおよび
株高を背景にその他有価証券評価差額金が558百万円増加したことを主因に、前期末に対し1,953百万円増加し、
6,513百万円となりました。
(セグメントごとの経営成績等)
・電子部品
売上高は微増となりましたが、貴金属相場の高騰に伴い材料コストが増加し、営業利益は減少しました。
・金型・機械設備
機械設備の外販が振るわなかったものの、金型においてアミューズメント向けが増加し、前期比増収増益とな
りました。
・その他
㈱大泉製作所製品の減少などにより、前期比減収減益となりました。
(経営方針・経営戦略、経営上の目標の達成状況を判断するための客観的な指標等)
2025年5月に中期経営計画 2027を公表し、2025年度〜2027年度を成長軌道へ舵を切る期間と位置づけ、2027年
度目標として以下の指標を掲げました。
・売上高 480億円、営業利益 34億円、営業利益率 7%
・自己資本利益率(ROE) 10%
・新製品、新規事業の売上比率 20%
・設備投資として3年間で58億円
・純資産配当率(DOE)3%以上、配当性向35%目処
これらの指標について2025年度は以下の進捗状況となっております。
売上高につきましては、モジュール製品においてディスプレイパネル向けが減少したことから、前期比微減とな
りました。ただし、モビリティ分野の電動化の進展に伴い、BMS·電動コンプレッサー用モジュール製品は確実
に伸長しております。また、AIの普及に伴いデータセンタ向けに抵抗器等が増加し、2輪車向けにピエゾ製品が
拡大基調にあります。
営業利益は貴金属相場高騰の影響を主因に前期比約3億円減の約23億円、営業利益率5.4%に留まりました。顧
客に対し資材コストの増加分を売価に反映していただくよう交渉を進めているほか、生産効率の改善など原価改善
に取り組んでおりますが、回復時期につきましては2026年度下期からと見込んでおります。
自己資本利益率(ROE)は8.2%となりました。営業利益の減少に加え、アジア通貨高円安および株高の影響で
自己資本が増加したことから、10%には届きませんでした。
新製品、新規事業の売上比率は15%となっております。モビリティ分野で抵抗器やサンサ等の高付加価値製品の
開発を進めているほか、IoTフォークリフトサービス、超音波ソナーシステムなど、ソリューション製品のビジ
ネス拡大を推進中であります。
設備投資額はモジュール製品およびセンサーの増産を主体に、全体で約19億円実施いたしました。2026年度は、
ASEAN拠点の拡充など生産設備の増強を中心に30億円を計画しております。
株主還元につきましては、当期は5期連続の増配を決定し、DOE、配当性向とも基準を上回っております。今
後もこの方針で対応してまいります。
②キャッシュ・フローの状況の分析・検討内容並びに資本の財源及び資金の流動性に係る情報
a.キャッシュ・フロー
当連結会計年度は、営業活動によるキャッシュ・フローが、利益の計上、仕入債務の減少などにより、1,397
百万円となりました。また、投資活動によるキャッシュ・フローは設備投資などにより、△134百万円となり、
財務活動によるキャッシュ・フローは、配当金の支払い△713百万円、自己株式の取得による支出△131百万円、
借入金の純増298百万円などにより△644百万円となったことなどから、当期末における連結ベースの現金及び現
金同等物は、前期末に対し906百万円増加(同+9.7%)し、10,210百万円となりました。
b.財務政策
運転資金は、自己資金および金融機関からの短期借入を基本としており、設備投資などの長期資金は、自己資
金および金融機関からの長期借入を基本としております。
c.重要な資本的支出の予定およびその資金の調達源
当期後1年間の設備投資は、総額3,000百万円を計画しておりますが、その所要資金は主として、自己資金お
よび金融機関からの長期借入金をもって充当する予定であります。
③重要な会計上の見積りおよび当該見積りに用いた仮定
20/97
EDINET提出書類
北陸電気工業株式会社(E01817)
有価証券報告書
連結財務諸表の作成に当たって用いた会計上の見積りおよび当該見積りに用いた仮定のうち、重要なものについ
ては、「第5 経理の状況 1連結財務諸表等(1)連結財務諸表注記事項(重要な会計上の見積り)」に記載の
とおりであります。
5【重要な契約等】
該当事項はありません。
6【研究開発活動】
当社グループ(当社及び連結子会社)の研究開発体制は、電子部品事業を主体にグローバルに展開する顧客の声を
第一として、市場ニーズの変化に迅速に対応し、スピーディーに新製品を送り出すため、(1)センサ・デバイス開発
およびセンサ・デバイスに回路やソフトウエアを含めたトータルソリューションとしての商品展開や、各事業本部に
またがる案件のプロジェクト推進を図る開発部門、(2)既存製品の応用開発および製造技術の改善を図る当社ならび
に子会社の開発部門の2組織で構成されております。
なお、当連結会計年度の研究開発費の総額は、1,583百万円となっております。
(1) 電子部品
当社では、「モビリティ」「GX/DX」「産業・インフラ」「スマート家電・医療」の4つの成長領域をター
ゲット市場に定め、市場ニーズをいち早く察知し社会課題解決型の製品開発を強力に推進しております。
IoTソリューションHOKURIoT(ホクリオ)TMは、「安心・安全」な社会への貢献と省力化・効率化・安全性向
上・リアルタイム性の向上などの課題の解決を目指し、工事現場の見守りシステムや消雪装置監視システム、登山者
見守りシステム(YAMASSIST ヤマシスト™)などの開発に積極的に取り組んできておりましたが、新たに専用端末機を
フォークリフトに取り付けることで位置情報、稼働情報、危険運転操作情報等を把握することができるサブスク型の
IoTサービスであるForkMate TMの提供を開始しました。
更に、車両の接触事故を未然に防止する補助装置として、バス等に後付け可能な超音波ソナー障害物検知システム
の開発に取り組んでいます。超音波センサで障害物の接近を検知し、アラーム音とモニターで表示します。超音波セ
ンサーモジュール、コントロールユニット、モニターで構成され、最大12個の超音波センサを取り付け可能です。
無線モジュールは、429MHz帯、920MHz帯、2.4GHz帯をはじめ各種周波数帯を揃えており、更に太陽電池と無線ネッ
トワーク+センサをワンパッケージにした商品を製品化しています。
システム開発に関しては、さらに用途開発を推進し、今後とも拡大が予想されるIoT分野への用途展開を推進し
ております。
センサ関連では、応答速度が世界最速の容量式湿度センサを開発しました。応答速度が従来品の10秒に比べ1秒と
大幅に短縮した上、大きさは2.0×2.0×1.25ミリと業界最小クラスであり、自動車のエアコンの省エネ用途やヘルス
ケア分野等各種分野への用途開発を図っております。また、シートベルトリマインダセンサはシート形状に合わせた
センサ形状の設計や防水設計などに取り組んでいます。
MEMS製品では、従来からの主力製品である半導体圧力センサの応用展開として、給湯器や白物家電向けの省エ
ネ対応機器用に水位センサを製品化しております。
圧電部品は、モビリティ向け発音機能のニーズ多様化に対応すべく「広帯域化・音圧フラット化・高音圧化」を可
能にした広帯域ピエゾブザーを開発しております。
安全部品では、独自の素材、構造によって強力なアーク抑制特性を実現した速断タイプのチップヒューズを開発し
ました。サイズは1608サイズの小型低背でありながら、定格電圧が75Vと高電圧です。優れた耐アーク性能により、
過電流・過電圧が印加されても溶断時の発煙・発火の危険性が極めて少ないことが特長であり、高電圧が加わる二次
側回路の保護や、小サイズ・低コストが求められるセンサ回路の過電流・過電圧保護に最適です。また、回路保護用
にチップヒューズを製品化しております。各種電子機器に対応できるように、1005、1608、2012の各サイズをライン
ナップしております。更に、静電気放電の回路保護素子として、表面実装タイプのESDプロテクタを製品化しまし
た。1005、1608、2012サイズを取り揃えております。
抵抗器は、信頼性が要求されるHEV、EV等の車載分野やパワーエレクトロニクス分野向けに高電力チップ抵抗
器や耐サージ形高電力チップ抵抗器等の高機能チップ部品を開発し、展開しております。耐サージ形高電力チップ抵
抗器は、新たに0603サイズを開発中であり、抵抗体材料やトリミング形状等の検討により、汎用1005サイズと同等性
能の定格電力0.1Wを実現できます。耐サージチップ抵抗器及び高電力チップ抵抗器は、宇宙開発用信頼性保証チッ
プ形皮膜抵抗器として宇宙航空研究開発機構(JAXA)の認定も取得しております。また、さらなる高電力の要求
に対応すべく3W、5Wタイプのハイワッテージタイプもシリーズ化しました。このほか、ますます用途が拡大して
いる電流検出用のチップ金属板抵抗器は、2012サイズの0.5W品から、11.4×6.9ミリの5W品迄を取り揃えており
ます。スイッチは、洗濯機に代表される白物家電向けを主な用途とした防水型タクティールスイッチに新たにSMD
タイプを追加し、ラインナップを強化しました。
新製品の開発に当たっては、大学等の公共研究機関をはじめ、ソフトウエアメーカーや材料メーカー、その他メー
カーとのコラボレーションを積極的に実施し、高機能化と市場ニーズにあった製品の開発をスピーディーに推進して
おります。
なお、当事業に係る研究開発費は、1,583百万円となっております。
(2) 金型・機械設備
金型分野においても、ユーザーのプレス・成形部品の小型化、多層化、高密度化及びマルチ化等の構造的変化が著
しく、これに対応すべく金型製造技術の高度化を図っておりますが、研究開発費としては金額的に重要性が乏しく区
分管理は行っておりません。
(3) その他
主として仕入販売事業であり、当社グループとしては特に研究開発活動は行っておりません。
21/97
EDINET提出書類
北陸電気工業株式会社(E01817)
有価証券報告書
第3【設備の状況】
1【設備投資等の概要】
当社グループ(当社および連結子会社)は、製造設備の更新、保全を主体に、全体で1,890百万円の設備投資(内
110百万円は全社資産に対するものであります。)を実施いたしました。
セグメントごとの主な内容は次のとおりであります。
①電子部品
モジュール製品および電子デバイスの増産設備を主体に、1,677百万円の設備投資を実施しており、その所要資
金は自己資金および借入金によっております。
②金型・機械設備
機械設備に係る事業を主体に、16百万円の設備投資を実施しており、その所要資金は自己資金によっておりま
す。
③その他
不動産・保険代理業に係る事業において、87百万円の設備投資を実施しており、その所要資金は自己資金および
借入金によっております。
なお、設備投資の額には無形固定資産を含めております。
2【主要な設備の状況】
当社グループ(当社及び連結子会社)における主要な設備は、次のとおりであります。
(1) 提出会社
2026年3月31日現在
事業所名
(所在地)
本社工場
(富山県富山市)
モジュール工場
設備の内容
電子部品
皮膜・可変抵抗器
及び電子デバイス
製造設備
電子部品
(富山県富山市)
楡原工場
(富山県富山市)
PRC工場
(富山県中新川郡立山町)
朝日電子㈱
(富山県朝日町)(注)4
本社
(富山県富山市)
東京営業所他8営業部門
(東京都品川区他)
その他
土地
建物及び 機械装置
構築物及び運搬具 (面積千㎡)
モジュール製品製
造設備
358
315
8
318
電子部品
可変抵抗器及び圧
電部品製造設備
103
265
電子部品
回路基板製造設備
46
7
電子部品
チップ抵抗器製造
設備
204
499
電子部品
及び全社
本社業務・技術・
研究設備
365
450
電子部品
電子部品
及び全社
(富山県富山市他)
帳簿価額(百万円)
セグメント
の名称
販売設備
18
福利厚生施設他
180
0
−
その他
467
(15)
−
(−)
28
(12)
62
1,204
45
372
12
410
0
159
8
941
192
1,213
12
198
−
792
104
(11)
230
(35)
205
(6)
166
(1)
611
(61)
従業員数
(人)
合計
250
(12)
132
(2)
46
(−)
4
(−)
−
(−)
132
(6)
80
(1)
−
(−)
(2) 国内子会社
2026年3月31日現在
事業所名
(所在地)
会社名
設備の内容
その他
不動産賃貸・保険
代理業設備
618
電子部品
チップ抵抗器製造
設備
−
0
−
0
無線モジュールの
設計・販売設備
6
−
電子部品
モジュール製品製
及び金型・
造設備
機械設備
0
2
本社他
北陸興産㈱
(富山県富山市他)
(注)5
朝日電子㈱
本社工場
(富山県朝日町)
ダイワ電機
本社他
精工㈱
(滋賀県長浜市)
野村エンジ
ニアリング
本社
㈱
北陸アイ
シー㈱他
(神奈川県大和市)
本社工場他
(富山県富山市他)
帳簿価額(百万円)
セグメント
の名称
土地
建物及び 機械装置
構築物及び運搬具 (面積千㎡)
従業員数
(人)
合計
685
245
(25)
2
1,551
0
0
0
51
0
66
11
14
[23]
金型・機械
金型製造設備
設備
電子部品
その他
22/97
0
(3)
50
(4)
59
(0)
−
(−)
6
(−)
90
(37)
21
(2)
13
(2)
20
(−)
EDINET提出書類
北陸電気工業株式会社(E01817)
有価証券報告書
(3) 在外子会社
2026年3月31日現在
事業所名
(所在地)
会社名
北電マレー
本社工場
シア㈱
(マレーシア)
天津北陸電
本社工場
気㈲
(中華人民共和国)
HDKタイ
本社工場
ランド㈱
(タイ)
上海北陸微
本社工場
電子㈲
(中華人民共和国)
北陸電気
本社工場
(広東)㈲
(中華人民共和国)
北陸シンガ
ポール㈱他
本社営業所他
設備の内容
電子部品
回路基板製造設備
電子部品
電子デバイス製造
設備
土地
建物及び 機械装置
構築物及び運搬具 (面積千㎡)
221
1
354
74
345
電子部品
モジュール製品製
造設備
60
493
電子部品
各種抵抗器製造設
備
0
177
販売設備他
12
電子部品
その他
42
(63)
−
(−)
従業員数
(人)
合計
80
698
−
76
275
1,087
97
651
9
186
7
19
−
モジュール製品製
造設備
電子部品
(シンガポール他)
帳簿価額(百万円)
セグメント
の名称
467
(−)
[7]
−
(−)
463
(−)
99
(7)
278
(91)
62
(199)
−
(−)
[11]
−
−
(−)
80
(12)
57
(−)
(注)1.帳簿価額のうち「その他」は、工具、器具及び備品、建設仮勘定並びに無形固定資産であります。
2.土地及び建物の一部を賃借しております。賃借している土地の面積については[ ]で外書しております。
3.連結貸借対照表に計上されていない主要な賃借及びリース設備は次のとおりであります。
2026年3月31日現在
会社名
(所在地)
北陸電気工業㈱
(富山県富山市他)
北陸興産㈱
(富山県富山市他)
HDKタイランド㈱
(タイランド)
北陸(上海)国際貿易㈲
(中華人民共和国)
賃借料及びリース料(百万円)
セグメン
トの名称
設備の内容
電子部品
皮膜・可変抵抗器、電子デバイス及び回
路基板製造設備
171
25
4
201
その他
不動産賃貸・保険代理業設備
−
0
21
22
電子部品
モジュール製品製造設備
79
6
4
89
電子部品
販売設備他
23
5
−
28
建物及び 機械装置
構築物及び運搬具
その他
合計
4.提出会社が連結子会社朝日電子㈱に賃貸している設備であります。
5.連結子会社北陸興産㈱は、提出会社に、土地19百万円(1千㎡)、建物及び構築物318百万円を賃貸しており
ます。
6.従業員数の( )は、平均臨時雇用者数を外書しております。
3【設備の新設、除却等の計画】
当社グループ(当社及び連結子会社)の設備投資については、景気予測、業界動向、得意先情報、投資効率等を総
合的に勘案して策定しております。設備計画は原則的に連結会社各社が個別に策定しておりますが、グループ全体で
重複投資とならないよう、提出会社を中心に調整を図っております。
なお、期末時点では設備投資計画の総枠予算を策定しておりますが、個々のプロジェクトごとの決定がされていな
いため、セグメントごとの数値を開示する方法によっております。
当連結会計年度後1年間の設備投資計画(新設・拡充・更新)は総額3,000百万円を計画しており、セグメントご
との内訳は、次のとおりであります。
セグメントの名称
電子部品
金型・機械設備
報告セグメント計
その他
2026年3月末
計画金額(百万円)
3,000
設備等の主な内容・目的
抵抗器、モジュール製品等の生産設備の増強及びサステナビリ
ティ・DX関連設備の導入
−
3,000
−
合計
3,000
(注)1.設備投資計画に係る今後の所要資金については、主として、自己資金及び借入金をもって充当する予定であ
ります。
2.経常的な設備の更新のための除却・売却を除き、重要な設備の除却・売却の計画はありません。
23/97
EDINET提出書類
北陸電気工業株式会社(E01817)
有価証券報告書
第4【提出会社の状況】
1【株式等の状況】
(1) 【株式の総数等】
①【株式の総数】
種類
発行可能株式総数(株)
普通株式
25,000,000
計
25,000,000
②【発行済株式】
事業年度末現在発行数(株)
(2026年3月31日)
種類
提出日現在発行数(株)
(2026年6月25日)
上場金融商品取引所名又は
登録認可金融商品取引業協会名
普通株式
8,450,099
8,450,099
東京証券取引所
スタンダード市場
計
8,450,099
8,450,099
−
内容
単元株式数
100株
−
(2) 【新株予約権等の状況】
①【ストックオプション制度の内容】
該当事項はありません。
②【ライツプランの内容】
該当事項はありません。
③【その他の新株予約権等の状況】
該当事項はありません。
(3) 【行使価額修正条項付新株予約権付社債券等の行使状況等】
該当事項はありません。
(4) 【発行済株式総数、資本金等の推移】
年月日
2024年11月29日(注)
発行済株式
総数増減数
(株)
発行済株式
総数残高
(株)
資本金増減額
(百万円)
資本金残高
(百万円)
資本準備金
増減額
(百万円)
資本準備金
残高
(百万円)
△800,000
8,450,099
−
5,200
−
462
(注)2024年11月8日開催の取締役会における自己株式消却決議に基づく株式の消却であります。
24/97
EDINET提出書類
北陸電気工業株式会社(E01817)
有価証券報告書
(5) 【所有者別状況】
2026年3月31日現在
株式の状況(1単元の株式数100株)
政府及び
地方公共
団体
金融機関
株主数
(人)
−
所有株式数
(単元)
所有株式数
の割合(%)
区分
外国法人等
個人
その他
単元未満
株式の
状況(株)
金融商品
取引業者
その他の
法人
個人以外
15
25
92
72
9
6,132
6,345
−
−
9,798
1,758
16,048
11,706
152
44,530
83,992
50,899
−
11.7
2.1
19.1
13.9
0.2
53.0
100.0
−
個人
計
(注)1.自己株式605,054株は「個人その他」に6,050単元、「単元未満株式の状況」に54株含まれております。
なお、自己株式605,054株は株主名簿記載上の株式数であり、2026年3月31日現在の実質的な所有株式数は
604,854株であります。
2.「その他の法人」の欄には、証券保管振替機構名義の株式が4単元含まれております。
(6) 【大株主の状況】
2026年3月31日現在
氏名又は名称
住所
株式会社フェローテック
東京都中央区日本橋2丁目3-4
北電工取引先持株会
富山県富山市下大久保3158
NOMURA PB NOMINEES LIMITED OMNIBUS-MARGIN (CASHPB)
(常任代理人野村證券株式会社)
所有株式数
(千株)
発行済株式(自己
株式を除く。)の
総数に対する所有
株式数の割合
(%)
1,027
13.10
472
6.02
382
4.87
1 ANGEL LANE, LONDON, EC4R 3AB,
UNITED KINGDOM
(東京都中央区日本橋1丁目13−1)
北電工従業員持株会
富山県富山市下大久保3158
350
4.47
株式会社北陸銀行
富山県富山市堤町通り1丁目2-26
301
3.84
株式会社北國銀行
石川県金沢市広岡2丁目12-6
158
2.02
前田建設工業株式会社
東京都千代田区富士見2丁目10-2
149
1.91
株式会社富山銀行
富山県高岡市下関町3-1
139
1.78
コーセル株式会社
富山県富山市上赤江町1丁目6-43
112
1.44
112
1.43
3,206
40.87
DFA INTL SMALL CAP VALUE PORTFOLIO
(常任代理人 シティバンク、エヌ・エイ東京支店)
PALISADES WEST 6300,BEE CAVE ROAD
BUILDING ONE AUSTIN TX 78746 US
(東京都新宿区新宿6丁目27-30)
計
−
25/97
EDINET提出書類
北陸電気工業株式会社(E01817)
有価証券報告書
(7) 【議決権の状況】
①【発行済株式】
2026年3月31日現在
株式数
(株)
区分
議決権の数
(個)
内容
無議決権株式
−
−
−
議決権制限株式(自己株式等)
−
−
−
議決権制限株式(その他)
−
−
−
完全議決権株式(自己株式等)
(注)1
普通株式
604,800
−
−
完全議決権株式(その他)
(注)2
普通株式
7,794,400
77,944
−
単元未満株式
(注)3
普通株式
50,899
−
−
発行済株式総数
8,450,099
−
−
総株主の議決権
−
77,944
−
(注)1.「完全議決権株式(自己株式等)」欄は、全て当社保有の自己株式であります。
2.「完全議決権株式(その他)」欄には、証券保管振替機構名義の株式が400株含まれております。
また、「議決権の数」欄には、同機構名義の株式に係る議決権の数4個が含まれております。
3.「単元未満株式」欄には、当社所有の自己株式54株が含まれております。
②【自己株式等】
2026年3月31日現在
所有者の氏名又は名称
北陸電気工業株式会社
所有者の住所
富山県富山市
下大久保3158番地
計
−
自己名義所有他人名義所有
株式数(株) 株式数(株)
所有株式数の
合計(株)
発行済株式総数
に対する所有株
式数の割合(%)
604,800
−
604,800
7.16
604,800
−
604,800
7.16
(注)このほか、株主名簿上は当社名義となっておりますが、実質的に所有していない株式が200株(議決権の数2
個)あります。
なお、当該株式数は「①発行済株式」の「完全議決権株式(その他)」の中に含まれております。
2【自己株式の取得等の状況】
【株式の種類等】会社法第155条第3号に該当する普通株式の取得および会社法第155条第7号に該当する普通株式
の取得
(1) 【株主総会決議による取得の状況】
該当事項はありません。
(2) 【取締役会決議による取得の状況】
区分
株式数(株)
価額の総額(円)
取締役会(2024年11月8日)での決議状況
(取得期間2024年11月11日〜2025年6月20日)
360,000
500,000,000
当事業年度前における取得自己株式
235,500
372,459,700
当事業年度における取得自己株式
89,500
127,484,400
残存決議株式の総数及び価額の総額
35,000
55,900
当事業年度の末日現在の未行使割合(%)
9.7
0.0
当期間における取得自己株式
−
−
提出日現在の未行使割合(%)
9.7
0.0
26/97
EDINET提出書類
北陸電気工業株式会社(E01817)
有価証券報告書
(3) 【株主総会決議又は取締役会決議に基づかないものの内容】
区分
株式数(株)
当事業年度における取得自己株式
当期間における取得自己株式
価額の総額(円)
1,490
3,747,473
92
256,496
(注)当期間における取得自己株式には、2026年6月1日からこの有価証券報告書提出日までの単元未満株式の買取り
による株式は含まれておりません。
(4) 【取得自己株式の処理状況及び保有状況】
当事業年度
区分
当期間
株式数(株)
処分価額の総額
(円)
株式数(株)
処分価額の総額
(円)
引き受ける者の募集を行った取得自己株式
−
−
−
−
消却の処分を行った取得自己株式
−
−
−
−
合併、株式交換、株式交付、会社分割に
係る移転を行った取得自己株式
−
−
−
−
4,116
5,852,937
−
−
604,854
−
604,946
−
その他(譲渡制限付株式報酬による自己株式
の処分)
保有自己株式数
(注)1.当事業年度における「その他(譲渡制限付株式報酬による自己株式の処分)」は、2025年6月27日開催の取
締役会決議に基づき実施した、譲渡制限付株式報酬としての自己株式の処分であります。
2.当期間における保有自己株式数には、2026年6月1日からこの有価証券報告書提出日までの単元未満株式の
買取りによる株式は含まれておりません。
3【配当政策】
当社は、配当金につきましては財務基盤の強化と株主の皆様への利益還元を両立することを基本としながら、資本
効率の向上を図る観点から、純資産配当率3.0%以上および配当性向35%目処をともに満たすよう行っていく方針と
しております。
当期の純利益は、連結では1,986百万円、単体では1,904百万円となったことから、期末配当はその他利益剰余金を
原資として、1株当たり95円とすること、および来期より中間配当を実施することを2026年5月12日開催の取締役会
で決議いたしました。
なお、当期に係る剰余金の配当は次のとおりであります。
決議年月日
2026年5月12日
取締役会決議
配当金の総額
(百万円)
1株当たり配当額
(円)
745
95.00
27/97
EDINET提出書類
北陸電気工業株式会社(E01817)
有価証券報告書
4【コーポレート・ガバナンスの状況等】
(1)【コーポレート・ガバナンスの概要】
① コーポレート・ガバナンスに関する基本的な考え方
当社は、北陸電気工業グループ行動憲章において、「良き企業市民としての社会的責任を自覚し、誠実かつ倫
理的な事業活動を推進します。また、グローバル企業として国際ルールおよび各国の法令を遵守し、お客様、株
主・投資家様、取引先、地域社会、従業員をはじめとした関係者に配慮した経営に取り組み、安定的な成長を通
じて企業価値の向上とともに社会の発展に尽くします。」と定めています。
その実現のため、次の基本方針に沿って透明・公正かつ迅速・果断な意思決定を行うための経営体制を構築
し、コーポレート・ガバナンスの充実を図っていきます。
<コーポレート・ガバナンスの基本方針>
(1) 株主の権利・平等性の確保に努めます。
(2) 株主以外のステークホルダーとの適切な協働に努めます。
(3) 適切な情報開示と透明性確保に努めます。
(4) 取締役会等は、透明・公正かつ迅速・果断な意思決定を行い、その役割・責務を適切に果たすよう努めま
す。
(5) 株主との建設的な対話に努めます。
<企業理念>
社是、社訓に謳っております“明日をつくろう”“誠実をもって仕事に励もう”“責任を自覚しお互いに協
力しよう”“良い製品をつくり社会の発展に尽くそう”という創業以来のモノ造りへの精神は不変です。安
心、安全、便利で有益な電子部品デバイス・モジュールを開発・提供することによって、お客様に信頼され社
会に貢献する企業を目指します。
② 企業統治の体制の概要及び当該体制を採用する理由
イ.企業統治の体制の概要
当社は取締役会の監査・監督機能およびコーポレート・ガバナンスを強化し、より透明性の高い経営の実現
を図るため2017年6月29日開催の第83回定時株主総会をもって、監査役会設置会社から監査等委員会設置会社
へ移行しました。
経営方針等の重要項目に関する意思決定機関として取締役会、経営の監査・監督機関として監査等委員会が
あり、また、業務遂行の適正化を図るため業務監査部を設置しており、関係会社を含めた内部監査を行ってお
ります。
提出日(2026年6月25日)現在、取締役会は、取締役(監査等委員である取締役を除く。)6名(うち社外
取締役1名)および監査等委員である取締役4名(うち社外取締役3名)で構成されており、ステークホル
ダーの視点を重視した経営の基本的な意思決定と業務執行の監査・監督を行い、毎月1回の定期開催に加え必
要に応じ臨時開催により、重要事項を全て付議し、十分な討議を経て決議を行っております。取締役会の構成
員の氏名は以下のとおりです。
議長代表取締役社長下坂立正
取締役(監査等委員である取締役を除く。)西村裕司、村上吉憲、安藤正人、福澤義司、
社外取締役(監査等委員である取締役を除く。)坪川貞子
取締役(常勤監査等委員)杉本学
社外取締役(監査等委員)北之園雅章、菊島聡史、井村一明
提出日現在、監査等委員会は、監査等委員である取締役4名で構成されており、取締役会の監査・監督機能
と経営の透明性を高め、コーポレート・ガバナンスの強化と中長期的な企業価値の向上を図るべく、毎月1回
の定期開催に加え必要に応じ臨時開催しております。監査等委員会の構成員の氏名は以下のとおりです。
委員長取締役(常勤監査等委員)杉本学
社外取締役(監査等委員)北之園雅章、菊島聡史、井村一明
なお、杉本学は常勤の監査等委員であります。常勤の監査等委員を選定している理由は、監査等委員会の
情報収集の充実を図り、内部監査部門等との十分な連携を通じて監査の実効性を高め、監査・監督機能を強化
する目的からであります。
指名・報酬諮問委員会は、取締役の指名および報酬等に係る手続きの公正性、透明性、客観性を強化し、当
社のコーポレート・ガバナンスの更なる充実を図ることを目的に、取締役会の任意の諮問機関として設置して
おります。提出日現在、指名・報酬諮問委員会の構成員の氏名は以下のとおりです。
委員長独立社外取締役(監査等委員)井村一明
取締役(常勤監査等委員)杉本学、社外取締役(監査等委員)北之園雅章、菊島聡史
社外取締役(監査等委員である取締役を除く。)坪川貞子
また、重要な業務執行について迅速な意思決定を図るため、取締役および執行役員を中心に構成される経営
戦略会議を設置しております。議長は、代表取締役社長下坂立正が務めております。
28/97
EDINET提出書類
北陸電気工業株式会社(E01817)
有価証券報告書
(注)当社は、2026年6月26日開催予定の定時株主総会の議案(決議事項)として「取締役(監査等委員であ
る取締役を除く。)6名選任の件」を提案しており、当該議案が承認可決されますと、取締役会、監査
等委員会、指名・報酬諮問委員会の議長、委員長及び構成員は以下のとおりとなる予定です。なお、当
該定時株主総会の直後に開催が予定される取締役会の決議事項の内容(役職等)を含めて記載しており
ます。
<取締役会>
議長代表取締役社長下坂
立正
取締役(監査等委員である取締役を除く。)福澤義司、村上吉憲、西村
社外取締役(監査等委員である取締役を除く。)坪川貞子
取締役(常勤監査等委員)杉本学
社外取締役(監査等委員)北之園雅章、菊島聡史、井村一明
<監査等委員会>
委員長取締役(常勤監査等委員)杉本学
社外取締役(監査等委員)北之園雅章、菊島
聡史、井村
<指名・報酬諮問委員会>
委員長独立社外取締役(監査等委員)井村一明
取締役(常勤監査等委員)杉本学
社外取締役(監査等委員)北之園雅章、菊島聡史
社外取締役(監査等委員である取締役を除く。)坪川
裕司、安藤
正人
一明
貞子
当社の提出日現在における企業統治の体制の図は以下のとおりであります。
当社は、2026年6月26日開催予定の定時株主総会の議案(決議事項)として「取締役(監査等委員である取
締役を除く。)6名選任の件」を提案していますが、当該議案が承認可決された場合も同様です。
29/97
EDINET提出書類
北陸電気工業株式会社(E01817)
有価証券報告書
ロ.当該企業統治の体制を採用する理由
当社は、監査等委員会設置会社として経営方針、重要事項の迅速な意思決定・業務執行の強化を図るととも
に、取締役会の監査・監督機能と経営の透明性を高め、コーポレート・ガバナンスの強化と中長期的な企業価
値の向上を図ることができるものと判断し、現状の企業統治の体制を採用しております。
③ 企業統治に関するその他の事項
イ.内部統制システムの整備の状況
当社は、取締役会において、「内部統制システム構築の基本方針」を以下のとおり決議しております。
a.当社および当社子会社の取締役等および使用人の職務の執行が法令および定款に適合することを確保する
ための体制
・「北陸電気工業グループ行動憲章」を定めコンプライアンス体制の整備および維持を図る。
日本語、英語、中国語で作成して当社海外子会社にも配布、当社グループの役員および従業員に対して国
際ルールおよび各国の法令を遵守し、誠実かつ倫理的な事業活動の推進を求める。
・内部監査部門として業務執行部門から独立した業務監査部を設置し、内部統制システムが有効に機能して
いることを書類監査および現地監査で確認する。
・法令違反その他のコンプライアンスに関する内部・外部からの通報・相談窓口を社内および顧問弁護士等
に設置する。本件窓口に通報又は相談したことを理由として、不利益な取扱いを行わない。
・業務監査部は、監査等委員会と連携を図り当社グループ全体の監査を行い法令遵守体制および社内報告体
制の運用に問題があると認めるときは、被監査部門のみならず本社関係部門ならびに代表取締役および監
査等委員会に報告する。
b.取締役の職務の執行に係る情報の保存および管理に関する体制
・取締役会の議事録、稟議書、報告書その他取締役の職務執行に係る情報については、「文書取扱規定」
「情報管理規定」等に基づき適切に保存および管理する。
・前項の情報は、取締役会による取締役の職務執行の監督または監査等委員会による取締役の職務執行の監
査および監督にあたり必要と認めるときは、いつでも閲覧することができる。
c.当社および当社子会社の損失の危険の管理に関する規定その他の体制
・「リスク管理規定」および「緊急事態対応規定」、「BCP規定」を定め、事業に伴う各種のリスクを想
定し、管理責任者を決定し同規定に従ったリスク管理体制を構築し、防災対策および災害や事故発生時に
対する初動対応ならびに危険発生時に速やかな事業継続体制を整備する。損失の危険が大きい場合は、代
表取締役を本部長とする緊急事態対策本部を設置し、情報連絡チームおよび顧問弁護士等を含む外部アド
バイザリーチームを組織し迅速な対応を行い、損失の拡大を防止しこれを最小限に留める体制を整える。
加えて、事後の再発防止策の策定も行う。
・子会社に係る各種リスクの把握、分析、対応策においても、同規定に従いリスクの予防と発生した場合の
体制を整備し運用する。
d.当社および当社子会社の取締役等の職務の執行が効率的に行われることを確保するための体制
・当社グループ経営方針に基づき、事業本部、営業部門および子会社が策定した年度計画を審議し、年度予
算を決定する。
・取締役等の職務権限と担当業務を、「取締役会規則」、「組織規定」、「業務分掌規定」、「職務権限規
定」等に基づき明確にし、会社の機関相互の適切な役割分担と連携を確保する。子会社においても職務権
限と担当業務を明確にして、事業本部、営業部門と連携のうえ職務の執行をする。
・執行役員制度を導入し業務執行責任を明確にするとともに、取締役会では取締役および執行役員の業務執
行状況の監督を行う。
e.当社子会社の取締役等の職務の執行に係る事項の当社への報告に関する体制
・「子会社管理規定」に基づき、各子会社は当社へ決裁申請、各種報告等を行う。また代表取締役、取締役
(監査等委員である取締役を除く。)、常勤監査等委員および執行役員が参加し四半期ごとに開催される
「トップヒアリング」に海外子会社の取締役等を必要に応じて招聘し業務執行状況その他経営上の問題の
報告を受ける。国内子会社の取締役等は、取締役会、経営戦略会議、およびその他の重要な会議に参加し
て事業執行状況や問題等を当社に報告をする。
f.監査等委員会がその職務を補助すべき使用人を置くことを求めた場合における当該使用人に関する事項
・監査等委員会がその職務を補助すべき使用人を置くことを求めた場合は、業務監査部に所属する使用人に
職務を補助することを委任する。
g.前号の使用人の取締役(監査等委員である取締役を除く。)からの独立性および当該使用人に対する監査
等委員会の指示の実効性確保に関する事項
・業務監査部の人事・組織の変更については予め監査等委員会の同意を必要とする。
・委任を受けた当該使用人が業務監査部の業務を兼務する場合は、監査等委員会に係る業務を優先して従事
するものとする。
h.当社および当社子会社の取締役(監査等委員である取締役を除く。)等および使用人が当社監査等委員会
に報告するための体制、その他の監査等委員会への報告に関する体制
・当社グループの取締役(監査等委員である取締役を除く。)等および使用人は、監査等委員会から業務に
関して報告を求められた場合は遅滞なく報告する。また、当社グループの業務または業績に影響を与える
重要な事項を知った場合は監査等委員会に遅滞なく報告する。
30/97
EDINET提出書類
北陸電気工業株式会社(E01817)
有価証券報告書
・コンプライアンス規定、各種通報・相談規定を整備し、その適切な運用を維持することにより、法令違反
その他コンプライアンス上の問題について監査等委員会等への適切な報告体制を確保する。
・監査等委員会への報告、通報・相談者に対して、当該報告、通報・相談を行ったことを理由として、不利
益な取扱いを行わない。
i.監査等委員の職務の執行について生じる費用または債務の処理に係る方針に関する事項
・監査等委員の職務の執行について生じる費用の前払いまたは償還等の請求があった場合には当該請求に掛
かる費用が監査等委員の職務の執行に必要でないと明らかに認められる場合を除きこれに応じる。
j.その他監査等委員会の監査が実効的に行われることを確保するための体制
・監査等委員が経営戦略会議や取締役会その他重要な会議に出席するなど、経営課題や業務運営上の重要課
題について代表取締役、取締役(監査等委員である取締役を除く。)、執行役員等と意見交換を行う機会
を確保する。
・監査等委員会は、業務監査部から内部監査の報告を受けるとともに、代表取締役と協議のうえで特定の事
項について経理部門その他当社各部門に監査への協力を依頼することができる。
・監査等委員会は、定期的に会計監査人および業務監査部と意見交換を行い、連携の強化を図る。
k.財務報告の信頼性を確保するための体制について
・財務報告を適正に行うため、規定および手順等を定め財務報告に係る内部統制の体制整備と有効性向上を
図る。
・ガバナンス部は財務報告に係る内部統制の構築、整備を図り、業務監査部門による監査を通じて内部統制
の有効性について評価し、是正や改善の必要があるときは、速やかに代表取締役および監査等委員会に報
告するとともに当該部門はその対策を講じる。
l.反社会的勢力排除に向けた基本的考え方およびその整備状況について
・市民生活の秩序や安全に脅威を与える反社会的勢力・団体に対しては毅然として対応する。
・反社会的勢力排除に向けては、本社総務部門を対応部署と定め、警察や外部専門機関との連絡体制を構築
し、情報の収集を行う。行動規範、マニュアル等を作成し社内連絡体制を周知徹底する。
ロ.リスク管理体制の整備の状況
「リスク管理規定」に基づき、リスク管理委員会を開催し、子会社を含めた各種リスクに対して的確な管理
活動を推進するとともに、活動状況について取締役会への報告を行っております。また、「緊急事態対応規
定」を定め、事業に伴う各種のリスクを想定し、管理責任者を決定し同規定に従ったリスク管理体制を整備し
ております。なお、「顧客の信用リスク」への損失の危険管理については、諸規定を見直し、与信状況の監視
を強化するとともにリスクマネジメント会議を定例開催し、経営への影響が大きいリスクに関して議論してお
ります。
ハ.子会社の業務の適正を確保するための体制整備の状況
「子会社管理規定」に基づき、各子会社は当社へ決裁申請、各種報告を行うとともに、子会社の職務権限と
担当業務を明確にして、事業本部、営業部門と連携のうえ職務の執行をするなど子会社の業務の適正を図って
おります。
ニ.責任限定契約の内容の概要
当社は会社法第427条第1項の規定に基づき、社外取締役との間で同法第423条第1項の損害賠償責任を限定
する契約を締結しております。当該契約に基づく損害賠償責任の限度額は、法令が規定する額としておりま
す。
ホ.役員等賠償責任保険契約(D&O保険)の内容の概要
当社は、会社法第430条の3第1項に規定する役員等賠償責任保険契約を保険会社との間で締結しており、
当社取締役を含む被保険者が負担することになる法律上の損害賠償金および争訟費用を当該保険契約により填
補することとしております(ただし、法令に違反することを被保険者が認識しながら行った行為に起因する損
害等を除く。)。当該保険契約の保険料は全額会社負担としています。
ヘ.取締役の定数
当社の取締役(監査等委員である取締役を除く。)は12名以内、監査等委員である取締役は6名以内とする
旨定款に定めております。
ト.取締役の選任および解任の決議要件
当社は、取締役の選任決議について、監査等委員である取締役とそれ以外の取締役とを区別して、議決権を
行使することができる株主の議決権の3分の1以上を有する株主が出席し、その議決権の過半数をもって行う
旨および累積投票によらない旨を定款に定めております。
取締役の職務執行に不正または重大な法令もしくは定款違反等があった場合は解任することとしておりま
す。
チ.取締役会で決議できる株主総会決議事項
・剰余金の配当等の決定機関
当社は、剰余金の配当等会社法第459条第1項各号に定める事項について、法令に別段の定めがある場合
を除き、株主総会の決議によらず、取締役会の決議により定める旨定款に定めております。これは、剰余金
の配当等を取締役会の権限とすることにより、株主への機動的な利益還元を可能とすることを目的とするも
のであります。
・自己の株式の取得
31/97
EDINET提出書類
北陸電気工業株式会社(E01817)
有価証券報告書
当社は、会社法第459条第1項の規定により、取締役会の決議によって、自己の株式を取得することがで
きる旨を定款に定めております。これは、経営環境の変化に対応した機動的な資本政策の遂行を可能とする
ため、市場取引等により自己の株式を取得することを目的とするものであります。
・取締役の責任免除
当社は、会社法第426条第1項の規定により、取締役会の決議をもって同法第423条第1項の行為に関する
取締役(取締役であったものを含む。)の責任を法令の限度において免除することができる旨定款に定めて
おります。これは、取締役が職務を遂行するにあたり、その能力を十分に発揮して、期待される役割を果た
しうる環境を整備することを目的とするものであります。
リ.株主総会の特別決議要件
当社は、会社法第309条第2項に定める株主総会の特別決議要件について、議決権を行使することができる
株主の議決権の3分の1以上を有する株主が出席し、その議決権の3分の2以上をもって行う旨定款に定めて
おります。これは、株主総会における特別決議の定足数を緩和することにより、株主総会の円滑な運営を行う
ことを目的とするものであります。
ヌ.取締役会、指名・報酬諮問委員会の活動状況
a.取締役会
取締役会は、取締役会規則に従い、当社の経営に関する基本方針、重要な業務執行に関する事項、株主総
会の決議により授権された事項のほか、法令および定款に定められた事項を決議し、また、法令に定められ
た事項および重要な業務執行状況につき報告を受けます。取締役会は、原則毎月1回開催するほか、必要に
応じて随時開催しています。2026年3月期は合計15回開催し、個々の取締役は全員毎回出席しました。
主な審議テーマは以下のとおりです。
経営戦略・サステナビリティ・ガバナンス関連、決算・財務情報、監査等委員会・会計監査人関連、リス
クマネジメント・内部統制・コンプライアンス関連、人事関連、個別案件
主な報告事項は以下のとおりです。
内部統制状況、サステナビリティ関連(TCFD報告等)、コンプライアンス体制(研修の実施他)、財
務報告に係る内部統制、内部監査計画・結果、リスク管理委員会等
b.指名・報酬諮問委員会
指名・報酬諮問委員会は、2026年3月期は3回開催し、個々の委員は全員毎回出席しました。
主なテーマは以下のとおりです。
取締役の選任、個人別の報酬等の内容、後継者計画の件
ル.株式会社の支配に関する基本方針について
当社は財務及び事業の方針の決定を支配する者の在り方に関する基本方針を定めており、その内容(会社法
施行規則第118条第3号に掲げる事項)は次のとおりです。
なお、当社が定めている当社株式の大規模買付行為に関する対応策(以下、「本施策」という。)の有効期
限は、2026年6月26日開催予定の当社第92期定時株主総会終結の時までとなっておりますが、当社は、社会、
経済情勢の変化、買収への対応方針に関する議論の進展等を踏まえ、本施策の継続の是非や内容について検討
した結果、2026年5月12日開催の当社取締役会において、第92期株主総会における株主の皆様のご承認を条件
として、本施策を一部改定の上継続する内容の当社株式の大規模買付行為に関する対応方針について決議いた
しました。その詳細につきましては、2026年5月12日付当社ニュースリリース「当社株式の大規模買付行為に
関する対応方針(買収への対応方針)の一部改訂および継続の件」をご参照ください。
a.基本方針の内容の概要
我が国の資本市場においては、買収内容を判断するために必要な合理的な情報・期間や、企業買収の対象と
なる会社の経営陣との十分な協議や合意形成プロセスを経ることなく、突如として一方的な大規模買付を強行
するといった動きがなされる可能性も決して否定できません。
当社株式の大規模買付行為が発生した場合に、株主の皆様が買付に応じるべきか否かを適切に判断するため
に必要かつ十分な情報の提供を受けること、当社取締役会による検討・評価および株主の皆様のご判断等に必
要な期間を確保すること、当社取締役会が買付者と交渉・協議を行い、あるいは株主の皆様に当社取締役会と
しての代替案を提示すること等を可能とすることにより、当社グループの企業価値ひいては株主共同利益を向
上させることを基本方針としています。
b.不適切な支配の防止のための取組み
ⅰ.本施策発動に係る手続きの設定
・本施策は、当社株式保有割合が20%以上となる大規模買付等が行われる場合に、買付者等に対し、事前
に当該買付等に関する情報の提供を求め、当該買付等についての情報収集・検討を行う時間を確保した
上で、当社取締役会が買付者との交渉・協議を行うこと、あるいは株主の皆様に当社取締役会としての
代替案を提示するなどの手続きを定めています。
ⅱ.取締役会の恣意的判断を排除するための独立委員会の利用
・本施策の導入にあたり、取締役会の恣意的判断を排除し、株主の皆様のために、本施策の発動等の運用
に際しての実質的な判断を客観的に行う機関として、独立委員会を設置します。独立委員会は、独立性
の高い当社社外取締役、社外有識者から選任され、構成されています。
ⅲ.新株予約権無償割当ての利用
32/97
EDINET提出書類
北陸電気工業株式会社(E01817)
有価証券報告書
・買付者等の行為が、当社の企業価値・株主共同の利益を損なう恐れがあると認められる場合には、当社
は、当社の取締役会決議により、買付者等による権利行使ができない新株予約権を、当社取締役会が定
める一定の日における全ての株主に対してその所有株式1株につき1個の割合で割り当てます。
ⅳ.本新株予約権の行使および本新株予約権の取得
・本施策に従って本新株予約権の無償割当てがなされ、買付者等以外の株主の皆様により本新株予約権が
行使された場合、または当社による本新株予約権の取得と引き換えに、買付者等以外の株主の皆様に対
して当社株式が交付された場合、当該買付者等の有する当社株式の議決権割合は希釈化されることにな
ります。
c.不適切な支配の防止のための取組みについての取締役会の判断
本施策は、株主共同の利益を損なうものではなく、また、当社の会社役員の地位の維持を目的とするもので
はないと考えております。
ⅰ.株主意思を反映するものであること
・本施策は、定時株主総会で株主の皆様のご承認をいただいたうえで継続しております。なお、上記のと
おり、当社は、第92期株主総会における株主の皆様のご承認を条件として、本施策を一部改定すること
を予定しておりますが、同改定により、当社取締役会は、大規模買付対抗措置の発動に先立ち、株主の
皆様の意思を確認するための株主総会を招集し、大規模買付対抗措置を発動するか否かのご判断を株主
の皆様に行っていただくことができるものとしております。したがって、本施策に係る判断には、株主
の皆様の意思が反映されるものと考えております。
ⅱ.取締役会の判断の客観性・合理性の確保
・本施策においては、大規模買付対抗措置の発動要件を客観的かつ合理的に定めており、また、発動の手
続きとして、当社取締役会から独立した独立委員会の勧告を最大限尊重するものと定めており、当社取
締役会の恣意的な判断を排除しています。
ⅲ.買収防衛策に関する指針の要件を完全充足していること
・本施策は、経済産業省および法務省が2005年5月27日に公表した「企業価値・株主共同の利益の確保ま
たは向上のための買収防衛策に関する指針」の定める三原則((a)企業価値・株主共同の利益の確保・
向上の原則、(b)事前開示・株主意思の原則、(c)必要性・相当性確保の原則)を完全に充足しており、
また、企業価値研究会が2008年6月30日に公表した「近時の諸環境の変化を踏まえた買収防衛策の在り
方」に適合しています。さらに、上記のとおり、当社は、第92期株主総会における株主の皆様のご承認
を条件として、本施策を一部改定することを予定しておりますが、同改定後の本施策については、それ
らに加え、経済産業省が2023年8月31日に発表した「企業買収における行動指針−企業価値の向上と株
主利益の確保に向けて−」の内容その他買収への対応方針に関する議論等を踏まえた内容となっており
ます。
33/97
EDINET提出書類
北陸電気工業株式会社(E01817)
有価証券報告書
(2)【役員の状況】
① 役員一覧
a.2026年6月25日(有価証券報告書提出日)現在の当社の役員の状況は、以下のとおりです。
男性9名女性1名 (役員のうち女性の比率10.0%)
役職名
代表取締役
下坂
氏名
生年月日
立正
1959年12月3日生
社長
取締役
経営改革本部長
取締役
モジュールシステム
事業本部長
西村
村上
裕司
吉憲
略歴
1982年4月
㈱北陸銀行入行
2012年10月
2014年7月
同行監査部担当部長
当社入社社長付部長
2014年11月
2015年7月
当社管理本部長
当社執行役員管理本部長
2016年6月
2018年6月
当社取締役管理本部長
当社常務取締役管理本部長
2019年3月
2024年6月
当社代表取締役社長(現任)
所有
株式数
(百株)
(注)2
147
(注)2
83
(注)2
68
(注)2
43
(注)2
23
(注)2
9
北陸興産㈱代表取締役社長
1965年1月15日生 1989年4月
1999年7月
2015年7月
2017年4月
2019年7月
2022年6月
2023年6月
当社入社
当社名古屋営業所長
当社高周波部品事業本部製造部長
当社コンポーネント事業本部長
当社執行役員コンポーネント事業本部長
当社取締役コンポーネント事業本部長
1966年6月17日生 1989年4月
2013年7月
2014年7月
2018年7月
2019年7月
当社入社
HDKマイクロデバイス㈱開発部長
上海北陸微電子㈲董事長
HDKマイクロデバイス㈱代表取締役社長
当社執行役員
2022年6月
2023年10月
任期
当社取締役経営改革本部長(現任)
当社取締役
当社取締役モジュールシステム事業本部長(現
任)
取締役
品質保証担当
取締役
安藤
福澤
正人
義司
コンポーネント
事業本部長
1964年1月5日生 1984年4月
2014年7月
2015年7月
2016年7月
2019年7月
2023年4月
2023年6月
2026年4月
当社入社
当社アドバンストデバイス開発本部部長
当社高周波部品事業本部長
当社執行役員高周波部品事業本部長
当社執行役員兼HDKチャイナ㈱董事長
当社執行役員社長付部長
当社取締役開発本部長
1964年3月24日生
1987年4月
当社入社
2002年7月
2019年6月
朝日電子㈱工場長
2021年7月
2023年7月
2025年6月
取締役
坪川
貞子
1962年5月2日生 1989年12月
1990年2月
2012年1月
当社取締役品質保証担当(現任)
朝日電子㈱代表取締役社長(現任)
当社執行役員
当社執行役員コンポーネント事業本部長
当社取締役コンポーネント事業本部長(現任)
社会保険労務士登録
行政書士登録開業
開業
社会保険労務士法人坪川事務所代表社員(現任)
2015年9月
行政書士法人坪川事務所代表社員(現任)
2023年6月
当社取締役(監査等委員)
2025年6月
当社取締役(現任)
34/97
EDINET提出書類
北陸電気工業株式会社(E01817)
有価証券報告書
役職名
取締役
氏名
杉本
学
1961年12月3日生 1985年4月
2012年4月
(常勤監査等委員)
取締役
北之園
雅章
取締役
菊島
聡史
井村
一明
当社入社
当社東京営業所長
(注)3
69
(注)3
1
㈱北陸銀行入行
(注)3
同行支店部長兼ほくぎんダイレクト支店長
同行営業推進部長
同行常任監査役
同行常勤監査役
㈱ほくほくフィナンシャルグループ取締役監査等
委員
ほくほく債権回収㈱代表取締役社長
31
2021年6月
2023年6月
ダイワ電機精工㈱代表取締役社長
1959年8月24日生 1988年4月
当社取締役(常勤監査等委員)(現任)
弁護士登録
松尾綜合法律事務所入所
1997年6月
当社監査役
2003年5月
2009年11月
東京あおい法律事務所代表
桜川綜合法律事務所弁護士
2017年6月
当社取締役(監査等委員)(現任)
2022年9月
桜川協和法律事務所弁護士(現任)
1958年7月27日生 1981年4月
2010年6月
2014年1月
2014年6月
2016年6月
2017年6月
2021年6月
取締役
所有
株式数
(百株)
当社ガバナンス室長
当社資材部長
2019年6月
2019年6月
(監査等委員)
任期
2016年3月
2018年7月
(監査等委員)
(監査等委員)
略歴
生年月日
1956年11月1日生 2016年7月
2017年7月
2017年8月
2017年8月
当社取締役(監査等委員)(現任)
堤商事㈱代表取締役社長
金沢国税局徴収部長
金沢国税局退職
税理士登録
19
井村一明税理士事務所所長(現任)
2020年6月
中村留精密工業㈱監査役(現任)
2021年6月
当社取締役(監査等委員)(現任)
計
(注)3
495
(注)1.取締役坪川貞子、北之園雅章、菊島聡史および井村一明は、社外取締役であります。
2.2025年6月27日選任後、1年以内に終了する事業年度に関する定時株主総会終結の時までであります。
3.2025年6月27日選任後、2年以内に終了する事業年度に関する定時株主総会終結の時までであります。
4.当社では、意思決定・監督と執行の分離による取締役会の活性化のため、また、能力主義に基づく積極的な
人材登用のため、執行役員制度を導入しております。
執行役員は7名で、経営管理部長林良徳、営業マーケティング本部長飯山康太、営業マーケティング
本部副本部長中村吉秀、人事部長釈永敦、開発本部長荻原克行、モジュールシステム事業本部製
造部長熊野慎治、管理本部長金川智久で構成されております。
35/97
EDINET提出書類
北陸電気工業株式会社(E01817)
有価証券報告書
b.2026年6月26日開催予定の定時株主総会の議案(決議事項)として、「取締役(監査等委員である取締役を除
く。)6名選任の件」を提案しており、当該議案が承認可決されますと、当社の役員の状況は以下のとおりと
なる予定であります。なお、当該定時株主総会の直後に開催が予定される取締役会の決議事項の内容(役職
等)を含めて記載しております。
男性9名女性1名 (役員のうち女性の比率10.0%)
役職名
代表取締役
下坂
氏名
生年月日
立正
1959年12月3日生
社長
常務取締役
常務取締役
福澤
村上
義司
吉憲
モジュールシステム
事業本部長
1964年3月24日生
略歴
1982年4月
㈱北陸銀行入行
2012年10月
2014年7月
同行監査部担当部長
当社入社社長付部長
2014年11月
2015年7月
当社管理本部長
当社執行役員管理本部長
2016年6月
2018年6月
当社取締役管理本部長
当社常務取締役管理本部長
2019年3月
2024年6月
当社代表取締役社長(現任)
1987年4月
2002年7月
2019年6月
所有
株式数
(百株)
(注)2
147
(注)2
23
(注)2
68
(注)2
83
(注)2
43
(注)2
9
北陸興産㈱代表取締役社長
当社入社
朝日電子㈱工場長
2021年7月
朝日電子㈱代表取締役社長(現任)
当社執行役員
2023年7月
2025年6月
当社執行役員コンポーネント事業本部長
当社取締役コンポーネント事業本部長
2026年6月
当社常務取締役(予定)
1966年6月17日生 1989年4月
任期
当社入社
2013年7月
2014年7月
HDKマイクロデバイス㈱開発部長
上海北陸微電子㈲董事長
2018年7月
2019年7月
2022年6月
2023年10月
2026年6月
HDKマイクロデバイス㈱代表取締役社長
当社執行役員
当社取締役
当社取締役モジュールシステム事業本部長
当社常務取締役モジュールシステム事業本部長
(予定)
取締役
経営改革本部長
取締役
品質保証担当
取締役
西村
安藤
坪川
裕司
正人
貞子
1965年1月15日生 1989年4月
1999年7月
当社入社
当社名古屋営業所長
2015年7月
2017年4月
当社高周波部品事業本部製造部長
当社コンポーネント事業本部長
2019年7月
2022年6月
当社執行役員コンポーネント事業本部長
当社取締役コンポーネント事業本部長
2023年6月
当社取締役経営改革本部長(現任)
1964年1月5日生 1984年4月
2014年7月
2015年7月
2016年7月
2019年7月
2023年4月
2023年6月
2026年4月
当社入社
当社アドバンストデバイス開発本部部長
当社高周波部品事業本部長
当社執行役員高周波部品事業本部長
当社執行役員兼HDKチャイナ㈱董事長
当社執行役員社長付部長
当社取締役開発本部長
1962年5月2日生 1989年12月
1990年2月
2012年1月
社会保険労務士登録
行政書士登録開業
当社取締役品質保証担当(現任)
開業
社会保険労務士法人坪川事務所代表社員(現任)
2015年9月
行政書士法人坪川事務所代表社員(現任)
2023年6月
当社取締役(監査等委員)
2025年6月
当社取締役(現任)
36/97
EDINET提出書類
北陸電気工業株式会社(E01817)
有価証券報告書
役職名
取締役
氏名
杉本
学
北之園
略歴
1961年12月3日生 1985年4月
2012年4月
(常勤監査等委員)
取締役
生年月日
雅章
2016年3月
2018年7月
当社ガバナンス室長
当社資材部長
2021年6月
2023年6月
ダイワ電機精工㈱代表取締役社長
1959年8月24日生 1988年4月
(監査等委員)
取締役
菊島
聡史
(監査等委員)
当社監査役
東京あおい法律事務所代表
桜川綜合法律事務所弁護士
2017年6月
当社取締役(監査等委員)(現任)
2022年9月
桜川協和法律事務所弁護士(現任)
2021年6月
取締役
井村
一明
弁護士登録
松尾綜合法律事務所入所
2003年5月
2009年11月
1958年7月27日生 1981年4月
2010年6月
2014年1月
2014年6月
2016年6月
2017年6月
1956年11月1日生 2016年7月
2017年7月
2017年8月
2017年8月
㈱北陸銀行入行
同行支店部長兼ほくぎんダイレクト支店長
同行営業推進部長
同行常任監査役
同行常勤監査役
㈱ほくほくフィナンシャルグループ取締役監査等
委員
ほくほく債権回収㈱代表取締役社長
(注)3
69
(注)3
1
(注)3
31
(注)3
19
当社取締役(監査等委員)(現任)
堤商事㈱代表取締役社長
金沢国税局徴収部長
金沢国税局退職
税理士登録
井村一明税理士事務所所長(現任)
2020年6月
中村留精密工業㈱監査役(現任)
2021年6月
当社取締役(監査等委員)(現任)
計
所有
株式数
(百株)
当社取締役(常勤監査等委員)(現任)
1997年6月
2019年6月
2019年6月
(監査等委員)
当社入社
当社東京営業所長
任期
495
(注)1.取締役坪川貞子、北之園雅章、菊島聡史および井村一明は、社外取締役であります。
2.2026年6月26日選任後、1年以内に終了する事業年度に関する定時株主総会終結の時までであります。
3.2025年6月27日選任後、2年以内に終了する事業年度に関する定時株主総会終結の時までであります。
4.当社では、意思決定・監督と執行の分離による取締役会の活性化のため、また、能力主義に基づく積極的な
人材登用のため、執行役員制度を導入しております。
執行役員は7名で、経営管理部長林良徳、営業マーケティング本部長飯山康太、営業マーケティング
本部副本部長中村吉秀、人事部長釈永敦、開発本部長荻原克行、モジュールシステム事業本部製
造部長熊野慎治、管理本部長金川智久で構成されております。
②
社外役員の状況
a.社外取締役の員数
2026年6月25日(有価証券報告書提出日)現在の当社の社外取締役は4名(うち監査等委員であるものは3
名)です。2026年6月26日開催予定の定時株主総会の議案(決議事項)として、「取締役(監査等委員である
取締役を除く。)6名選任の件」を提案しており、当該議案が承認可決されますと、社外取締役4名(うち監
査等委員であるものは3名)となる予定であります。
b.社外取締役と提出会社との人的関係、資本的関係または取引関係その他の関係
社外取締役と当社との人的関係、取引関係およびその他の関係はありません。社外取締役と当社との資本的
関係である当社株式所有状況は、①役員一覧b.をご参照ください。
坪川貞子は、社会保険労務士法人坪川事務所、行政書士法人坪川事務所の代表社員であります。当社と同
氏との間に人的関係、資本的関係又は重要な取引関係その他の利害関係はありません。北之園雅章は、桜川
協和法律事務所弁護士であります。同氏は、過去に当社の業務執行者でない役員(監査役)を務めていました
が、それ以外に同氏との間に人的関係、資本的関係又は重要な取引関係その他の利害関係はありません。菊
島聡史は、㈱北陸銀行勤務の後、同行常勤監査役、㈱ほくほくフィナンシャルグループの取締役監査等委
員、ほくほく債権回収㈱代表取締役社長、堤商事㈱代表取締役社長を歴任しました。㈱北陸銀行は、当社の主
力銀行であり、当社の株主であります。当社は、㈱北陸銀行の親会社である㈱ほくほくフィナンシャルグルー
プの株式を保有しております。なお、当社とほくほく債権回収㈱および堤商事㈱との間に特別な利害関係はあ
りません。また、当社と同氏との間に人的関係、資本的関係又は重要な取引関係その他の利害関係はありませ
ん。井村一明は、井村一明税理士事務所の所長、中村留精密工業㈱の社外監査役であります。当社と同氏と
の間に人的関係、資本的関係又は重要な取引関係その他の利害関係はありません。
c.社外取締役を選任するための提出会社からの独立性に関する基準または方針
当社は、社外取締役の独立性については、東京証券取引所の定めに基づく独立性基準を満たすことを前提と
しています。また、社外取締役の選任については、企業法務、金融・経済、財務・会計等について専門的な知
37/97
EDINET提出書類
北陸電気工業株式会社(E01817)
有価証券報告書
見を有し、客観的・中立的立場から経営に対する提言または経営の監督・監視をなしうる人材と考えておりま
す。なお、当社は坪川貞子、北之園雅章、菊島聡史および井村一明を東京証券取引所の定めに基づく
独立役員として指定し、同取引所に届け出ております。
③ 社外取締役による監督または監査と内部監査、監査等委員会による監査および会計監査との相互連携ならびに
内部統制部門との関係
社外取締役(監査等委員)は、内部監査部門である業務監査部および会計監査人ならびに内部統制部門から定
期的かつ必要に応じて監査状況の報告および説明を受けるなど相互連携のもと幅広く監査を行っております。
社外取締役(監査等委員)は法律、税務等に関する豊富な知識、経験を有しており、当社の事業に精通した社
内の常勤監査等委員と連携し、監査等委員会として実効性の高い監査を実施しております。
(3)【監査の状況】
① 監査等委員会監査の状況
有価証券報告書提出日現在、当社の監査等委員会は、監査等委員である取締役4名(うち3名は社外取締役)で
構成されております。
各監査等委員は監査等委員会規則並びに監査等委員会監査等基準に準拠し、当期の監査方針、計画等に従い、
取締役会その他重要な会議に出席する他、取締役等からその職務の執行状況を聴取するなど、適正な監査を行っ
ております。
また、監査等委員は会計監査人から監査計画、監査実施状況等についての説明及び報告を受けるほか、必要に
応じて情報交換を行い相互連携することにより、監査の品質向上・効率化、コーポレート・ガバナンスの充実と
強化に努めております。
当事業年度において当社は監査等委員会を14回開催しており、個々の監査等委員の出席状況については次のと
おりであります。
役職名
氏
名
開催回数
出席回数
14回
14回
14回
14回
常勤監査等委員
(取締役)
杉本
非常勤監査等委員
(社外取締役)
北之園
非常勤監査等委員
(社外取締役)
菊島
聡史
14回
14回
非常勤監査等委員
(社外取締役)
井村
一明
14回
14回
非常勤監査等委員
(社外取締役)
坪川
貞子
4回
4回
(注)非常勤監査等委員坪川
学
雅章
貞子氏は、2025年6月27日開催の定時株主総会終結の時をもって監査等委員である取
締役を退任しております。退任までに開催された監査等委員会の回数は4回であります。
監査等委員会においては、a.監査方針及び監査計画の策定、b.監査報告書の作成、c.会計監査人の選
任、d.会計監査人の報酬、e.監査等委員でない取締役の選解任及び報酬等のほか、内部統制の整備・運用状
況、監査等委員会提言等の検討事項について協議いたしました。また、業務監査部より定期的に内部監査の報告
を受けるとともに、意見交換を行っております。
当事業年度の監査等委員会における主たる検討事項の具体的な内容は以下のとおりです。
a.監査方針及び監査計画の策定(カッコ内は当事業年度の実績)
監査計画(2025年7月〜2026年6月)
<業務監査>
・法令及び定款に適合する事を確保するための体制(33の拠点と部門を各1回)
・情報の保存管理に対する体制(27回)
・損失の危険の管理に関する体制(14回)
・職務執行が効率的に行われることを確保する体制について(27回)
・企業集団における業務の適正を確保する体制について(33の拠点と部門を各1回)
<会計監査>
・会計監査人との連携(2回)
・決算書類監査(2回)
38/97
EDINET提出書類
北陸電気工業株式会社(E01817)
有価証券報告書
<その他>
・監査等委員会の開催(14回)
・代表取締役との意見交換会(1回)
・執行取締役とのミーティング(2回)
・株主総会関連書類監査、監査報告書の作成(1回)
・工場視察(1回)
b.監査報告書の作成
監査計画に基づき実施してきた当事業年度の監査活動の内容を踏まえ、内部監査部門等や会計監査人と定期
的に会合を持ち、相互に緊密な連携をとって、取締役の職務執行の適法性や妥当性、会計監査人の監査の方法
及び結果の相当性に関して協議し、監査報告書を作成しております。
c.会計監査人の選任
会計監査人の独立性、監査品質、実効性、ローテーションを含む監査体制、信頼性等その適格性について
は、当事業年度における監査報告のレビューによる選任評価、また代表取締役、管理本部長、財務部門及び内
部監査部門等における会計監査人の評価結果も参考として、協議を重ね選任しております。
d.会計監査人の報酬
会計監査人から説明を受けた監査計画の監査日数や人員配置などの内容、監査実績の検証と評価、監査の遂
行状況の相当性、報酬の前提となる見積りの算出根拠等を精査し検討しております。
e.監査等委員でない取締役の選解任及び報酬
指名・報酬諮問委員会での議論の確認を含め検討を行っております。取締役の選任については、各候補者の
業務執行状況及び業績、これまでの経歴等を評価し確認しました。取締役の報酬については、基本方針、報酬
体系、個人別報酬額等の決定方法等の確認を行っております。
各監査等委員は、取締役会に出席し、意見を述べ、取締役等から経営上の重要事項に関する説明を聴取し、取
締役の職務執行について適法性•妥当性の観点から監査・監督を行っております。また、会計監査人からは期初
に監査計画の説明を受け、期中には中間レビュー結果、更に期末に監査結果の報告を受けるなど密接な連携を
図っております。
常勤監査等委員は、取締役会以外の重要な会議(トップヒアリング、経営戦略会議、リスクマネジメント会
議、サステナビリティ委員会など)にも出席し、主要な事業部門、国内外のグループ会社の実地監査やTV会議
によるリモート監査を実施しており、その結果を監査等委員会に定期的に報告しています。また、代表取締役と
は適宜ミーティングを行い意見交換により意思疎通を図り、業務執行取締役とは定期ミーティングを通して職務
執行状況を監査し、経営監視機能を果たしています。なお、監査状況に関する情報は監査等委員会で共有してお
ります。
今年度は、DX化およびAI活用状況の確認を目的とした工場視察を監査等委員全員参加で実施し、課題など
について取締役会に提言を致しました。
② 内部監査の状況
当社は、内部監査部門として業務執行部門から独立した業務監査部を設置しており、3名体制で当社グループ
全体の実地監査•リモート監査を行っております。
業務監査部は、監査等委員会、会計監査人および内部統制部門であるガバナンス部との連携のもと、年間監査
計画を立て毎月必要な内部監査を関係会社も含めて行い、監査結果は被監査部門に加え、代表取締役および監査
等委員会ならびに関係部門に報告しております。
業務監査部長は取締役会に原則年2回出席し、監査計画や重点監査項目の状況などについて直接報告を行うこ
ととしております。また業務監査部長は監査等委員会に原則毎月出席し、会社の状況を適確に報告・提供する体
制としております。
③ 会計監査の状況
a.監査法人の名称
太陽有限責任監査法人
b.継続監査期間
47年間
c.業務を執行した公認会計士
公認会計士秋田秀樹
公認会計士南波洋行
d.監査業務に係る補助者の構成
当社の会計監査業務に係る補助者は、公認会計士8名、その他11名であります。
e.監査法人の選定・再任方針と理由
当社は、監査法人の監査能力、職務遂行能力、ローテーション含む監査体制等を勘案し、総合的に判断し再
任の議事内容を決定しております。
f.監査等委員会による監査法人の評価
39/97
EDINET提出書類
北陸電気工業株式会社(E01817)
有価証券報告書
監査等委員会は、監査法人の監査能力、職務遂行能力、ローテーション含む監査体制に関する事項ならび
に、監査等委員会との連携や業務監査部、財務部などの当社関係者のヒアリングなどにより評価しておりま
す。
g.監査法人の異動
当連結会計年度において監査法人の異動はありません。
④
監査報酬の内容等
a.監査公認会計士等に対する報酬
前連結会計年度
当連結会計年度
区分
監査証明業務に基づく
報酬(百万円)
非監査業務に基づく報
酬(百万円)
監査証明業務に基づく
報酬(百万円)
非監査業務に基づく報
酬(百万円)
提出会社
30
−
30
−
連結子会社
−
−
−
−
計
30
−
30
−
b.監査公認会計士等と同一のネットワークに対する報酬(a.を除く)
前連結会計年度
当連結会計年度
区分
監査証明業務に基づく
報酬(百万円)
非監査業務に基づく報
酬(百万円)
監査証明業務に基づく
報酬(百万円)
非監査業務に基づく報
酬(百万円)
提出会社
−
1
−
1
連結子会社
−
1
−
1
計
−
2
−
2
当社における非監査業務の内容は、太陽グラントソントン税理士法人に対する移転価格税制の同期文書作成の報
酬であります。
また、連結子会社における非監査業務の内容は、上海北陸微電子㈲の致同会計事務所に対する移転価格税制の同
期文書作成の報酬であります。
c.監査報酬の決定方針
当社の監査公認会計士等に対する監査報酬の決定方針としましては、監査日数、当社グループの規模、同業
他社および同一地域での監査報酬水準などを総合的に勘案し、代表取締役が監査等委員会の同意を得て決定す
ることとしております。
d.監査等委員会が会計監査人の報酬等に同意した理由
取締役会が提案した会計監査人に対する報酬等に対して、当社の監査等委員会が会社法第399条第1項の同
意をした理由は、会計監査人から説明を受けた当連結会計年度の会計監査計画の監査日数や人数配置などの内
容、前年度の監査実績の検証と評価、会計監査人の監査の遂行状況の相当性、報酬の前提となる見積りの算定
根拠を精査した結果であります。
40/97
EDINET提出書類
北陸電気工業株式会社(E01817)
有価証券報告書
(4)【役員の報酬等】
① 役員の報酬等の額またはその算定方法の決定に関する方針に係る事項
イ.役員報酬等の内容の決定に関する方針等
当社は、2023年3月28日開催の取締役会において、取締役の個人別の報酬等の内容に係る決定方針の変更を
決議しておりますが、当該取締役会の決議に際しては、予め決議する内容について指名・報酬諮問委員会へ諮
問し、答申を受けております。
取締役の個人別の報酬等の内容に係る決定方針の内容の概要は次のとおりです。
a.基本方針
当社の取締役の報酬制度は、企業の持続的な成長と中長期的な企業価値向上に向けた健全なインセンティ
ブとして十分に機能するよう、株主の利益と連動した報酬体系とする。監査等委員である取締役を除く取締
役の報酬水準は、役員のキャリア要件ならびに業績等を勘案し、役割と責務に相応しい水準とすることを基
本方針に、毎年、過半数を独立社外取締役で構成する指名・報酬諮問委員会に代表取締役がその内容を諮問
し、相当であることの答申を得た上で取締役会にて決定する。監査等委員である取締役の報酬は、固定報酬
のみとし監査等委員の協議により決定する。
b.報酬の構成及び割合
業務執行取締役の報酬は、固定報酬、業績連動報酬である賞与および非金銭報酬である株式報酬から構成
する。固定報酬と非金銭報酬の割合は、固定報酬の水準と安定性を重視し、株主利益の追求にも配慮して定
める。業績連動報酬については、業績向上に対するインセンティブが働くよう、固定報酬または非金銭報酬
に対する割合に制限は設けない。
c.固定報酬の額等の決定(報酬等を与える時期等の決定を含む。)に関する方針
当社の取締役の固定報酬は月例の金銭報酬とし、役位、職責、在任年数に応じて他社水準、当社の業績、
従業員給与の水準をも考慮しながら、総合的に勘案して決定するものとする。
d.業績連動報酬、非金銭報酬の内容および額等の決定(報酬等を与える時期等の決定を含む。)に関する方針
業績連動報酬は、事業年度ごとの業績向上に対する意識を高めるため、業績指標を反映した金銭報酬であ
る賞与とし、直近の決算期における連結売上高および連結営業利益額の目標値に対する達成度合いに応じて
算出される額を事業年度終了後に年1回支給する。
非金銭報酬は、当社の企業価値の持続的な向上を図るインセンティブを付与するとともに、株主との一層
の価値共有を進めることを目的に、当社の普通株式(譲渡制限付株式)を支給する報酬とする。中長期的な
社会価値の創出やESGへの取組等の非財務状況も勘案し、事業年度ごとに年1回付与する。業務執行取締
役は、取締役会の決議により、譲渡制限付株式報酬に充てるものとされた金銭報酬債権の全部を現物出資財
産として払込み、当社の普通株式について発行または処分を受けるものとする。非金銭報酬については、各
取締役に対する支給額は役位ごとに設定する。
e.個人別の報酬等の内容に関する決定の方法
個人別の報酬額および支払い時期については、取締役会決議に基づき代表取締役がその具体的内容につい
て委任を受けるものとし、その権限の内容は、各取締役の固定報酬、業績連動報酬、非金銭報酬の額及び割
当株式数とする。
当該権限が代表取締役によって適切に行使されるようにするため、役位ごとの支給水準、算定方法または
付与水準の考え方に関しては、代表取締役がその内容について指名・報酬諮問委員会に諮問し、代表取締役
はその答申を得ることを上記の委任の条件とする。代表取締役は当該答申の内容を踏まえて決定しなければ
ならない。
ロ.役員報酬等に関する株主総会の決議
取締役(監査等委員である取締役を除く。)の固定報酬および業績連動報酬の限度額は、2022年6月29日開
催の第88回定時株主総会にて年額200百万円以内(ただし、使用人分給与は含まない。)と決議いただいてお
ります。また、譲渡制限付株式付与のための株式報酬の限度額は、同株主総会にて上記報酬枠とは別枠で年額
20百万円以内と決議いただいております。当該株主総会終了時点の取締役(監査等委員である取締役を除
く。)の員数は、6名です。
監査等委員である取締役の報酬限度額は、2017年6月29日開催の第83回定時株主総会において年額45百万円
以内と決議いただいております。当該株主総会終了時点の監査等委員の員数は、4名です。
ハ.取締役の個人別の報酬等の決定に係る委任に関する事項
取締役会は、代表取締役社長下坂立正に対し各取締役の報酬等の額の決定を委任しております。委任した理
由は、当社全体の業績等を勘案し各取締役の役割と責務を検討するには代表取締役が適していると判断したた
めであります。また、取締役会は、当事業年度に係る取締役の個人別の報酬について、報酬等の内容の決定方
法および決定された報酬等の内容が取締役会で決議された決定方針と整合していることや、指名・報酬諮問委
員会からの答申が尊重されていることを確認しており、当該決定方針に沿うものと判断しております。
② 役員区分ごとの報酬等の総額、報酬等の種類別の総額および対象となる役員の員数
41/97
EDINET提出書類
北陸電気工業株式会社(E01817)
有価証券報告書
報酬等の総額
(百万円)
役員区分
対象となる
役員の員数
(人)
報酬等の種類別の総額(百万円)
固定報酬
業績連動報酬
株式報酬
取締役(監査等委員及び
社外取締役を除く。)
77
54
12
9
6
取締役(監査等委員)
(社外取締役を除く。)
15
15
−
−
1
社外取締役
17
17
−
−
4
③
役員ごとの連結報酬等の総額等
当社は連結報酬等の報酬区分が無く、総額が1億円以上である取締役が存在しないため、記載しておりませ
ん。
④ 使用人兼務役員の使用人分給与のうち重要なもの
総額(百万円)
対象となる役員の員数(人)
46
4
内容
部門業務執行としての給与であります。
(5)【株式の保有状況】
① 投資株式の区分の基準及び考え方
当社は原則として純投資目的での株式取得は行っておらず、当社が保有する投資株式は全て純投資目的以外の
目的である投資株式であります。
②
保有目的が純投資目的以外の目的である投資株式
a.保有方針及び保有の合理性を検証する方法並びに個別銘柄の保有の適否に関する取締役会等における検証の
内容
政策保有株式については、事業戦略・研究開発・営業活動・財務活動等における取引先との関係強化を通じ
て持続的な企業価値の向上を目的として株式を保有しておりますが、そのリターンとリスク等を踏まえた中長
期的な観点から、保有意義、経済合理性について、取締役会において検証し、保有の継続の是非を判断してお
ります。保有意義が希薄化した株式は、順次売却・縮減していく方針です。
b.銘柄数及び貸借対照表計上額
銘柄数
(銘柄)
貸借対照表計上額の
合計額(百万円)
非上場株式
9
65
非上場株式以外の株式
7
2,087
(当事業年度において株式数が増加した銘柄)
銘柄数
(銘柄)
株式数の増加に係る取得
価額の合計額(百万円)
非上場株式
−
−
−
非上場株式以外の株式
2
2
持株会による取得
(当事業年度において株式数が減少した銘柄)
銘柄数
(銘柄)
株式数の減少に係る売却
価額の合計額(百万円)
非上場株式
1
3
非上場株式以外の株式
3
48
42/97
株式数の増加の理由
EDINET提出書類
北陸電気工業株式会社(E01817)
有価証券報告書
c.特定投資株式及びみなし保有株式の銘柄ごとの株式数、貸借対照表計上額等に関する情報
特定投資株式
銘柄
当事業年度
前事業年度
株式数(千株)
株式数(千株)
貸借対照表計上額
(百万円)
貸借対照表計上額
(百万円)
199
198
225
209
199
226
コーセル㈱
㈱ほくほくフィナン
シャルグループ
1,163
581
265
31
246
184
78
78
173
120
975
975
147
130
57
77
122
92
5
4
7
5
㈱CCIグループ
㈱富山銀行
天二科技㈲
インフロニア・ホー
ルディングス㈱
カシオ計算機㈱
保有目的、業務提携等の概要、
定量的な保有効果
及び株式数が増加した理由
当社の株式の
保有の有無
電子部品の取引先、古くからの親密先で
あり、継続保有。持株会により増加。
有
メインの取引金融機関として各種提供情
報を活用することで財務体質強化につな
がる。持合は徐々に削減することとして
おり、当期、一部持ち合いを解消。
有
取引金融機関として各種提供情報を活用
することで財務体質強化につながる。持
合は徐々に削減することにしており、当
期、一部持ち合いを解消。
有
取引金融機関として各種提供情報を活用
することで財務体質強化につながる。持
合いもしており、継続保有。
有
電子部品の取引先、安定調達・供給のた
め継続保有。
無
取引建設業者。物件維持・保全への情報
提供有。持合は徐々に削減することとし
ており、当期、一部持ち合いを解消。
有
電子部品の取引先であり今後の拡販も見
込むため、継続保有。持株会により増
加。
無
(注)1.保有の合理性の検証は、銘柄ごとに、当事業年度末簿価に対する当事業年度の受取配当金の比率を算出し、
当社のWACC(加重平均資本コスト)と比較する方法で行っておりますが、定量的な保有効果につきまし
ては、秘密保持の観点から記載しておりません。
2.㈱北國フィナンシャルホールディングスは、2025年10月1日付で㈱CCIグループに商号変更するととも
に、普通株式を1株につき10株とする株式分割を行っております。
みなし保有株式
該当する株式はありません。
保有株式の発行会社との間の営業上の取引、業務上の提携等の概要
該当する株式はありません。
③
保有目的が純投資目的である投資株式
該当する株式はありません。
43/97
EDINET提出書類
北陸電気工業株式会社(E01817)
有価証券報告書
5【従業員の状況等】
(1)【人材戦略に関する基本方針等】
① 連結会社の経営方針・経営戦略等に関連付けた連結会社の人材戦略
当社グループの人材戦略については、持続的な企業価値向上の源泉である人的資本の価値最大化を重要課題と
位置付けており、「個の能力最大化」と「組織の活性化」を連動させた人的資本経営を推進しています。
イ.適正な人材配置と獲得
4分野(モビリティ、GX/DX、産業・インフラ、スマート家電・医療)の成長戦略に必要な「人材ポート
フォリオ」を策定し、人材の最適配置を行っています。多様性を確保するために経験者採用も推進し、熟練技能
者からの技能継承を促して、持続可能な組織体制を構築しています。
ロ.人材育成と多様性の深化
生成AIを活用できるデジタル人材の育成に注力しています。また、女性の活躍を促進させるため、女性取締
役が参画する女性活躍推進会議を、女性従業員が主体的に企画運営しています。女性の意見を反映しやすくする
ことで、育児支援体制の拡充や職場環境の改善などに取り組み、多様な人材が定着し継続して活躍できる環境を
整備しています。
ハ.エンゲージメントの向上
従業員エンゲージメント調査を継続し、職場課題の抽出と改善を実行することで、心身ともに良好な状態で挑
戦できるウェルビーイングな企業風土構築に取り組んでいます。
② 従業員の給与(賞与を含む)その他の給付の額及び内容の決定に関する方針(提出会社)
給与その他の給付の額の決定に関する方針については、従業員の能力を最大限に引き出し、成果を公正かつ透
明性の高い仕組みで評価しております。
イ.給与・評価体系
従業員の能力評価による職能等級制度により賃金を決定し、半期ごとの業務面接制度を通じて個人目標の設定
や進捗管理、能力開発を促進することで、評価の納得性を高めています。
ロ.賞与
業務目標面接により設定した個人目標の達成度考課による業績評価に加え、個人の能力や態度を総合的に勘案
しています。
ハ.その他の給付
「ファイナンス・ウェルネス」の向上を掲げ、従業員持株会の奨励金制度等で、従業員の中長期的な資産形成
を支援しています。
(2)【従業員の状況】
① 連結会社の状況
2026年3月31日現在
セグメントの名称
従業員数(人)
1,729(365)
電子部品
26
金型・機械設備
(2)
1,755(367)
報告セグメント計
その他
6 (−)
全社(共通)
72
(4)
1,833(371)
合計
(注)1.従業員数は就業人員(当社グループからグループ外への出向者を除き、グループ外から当社グループへの出
向者を含む。)であり、臨時従業員数は( )内に年間の平均人員を外数で記載しております。なお、臨時従
業員には、パートタイマー及び嘱託契約の従業員を含み、派遣社員を除いております。
2.全社(共通)として記載されている従業員数は、特定のセグメントに区分できない管理部門に所属している
ものであります。
44/97
EDINET提出書類
北陸電気工業株式会社(E01817)
有価証券報告書
② 提出会社の状況
2026年3月31日現在
従業員数(人)
644
平均年齢(歳)
平均勤続年数(年)
平均年間給与(円)
平均年間給与の
対前事業年度増減率
(%)
44.0
20.5
5,739,384
7.3
(21)
セグメントの名称
従業員数(人)
572(17)
電子部品
572(17)
報告セグメント計
72 (4)
全社(共通)
644(21)
合計
(注)1.従業員数は就業人員(当社から社外への出向者を除き、社外から当社への出向者を含む。)であり、臨時従
業員数は( )内に年間の平均人員を外数で記載しております。なお、臨時従業員には、パートタイマー及び
嘱託契約の従業員を含み派遣社員を除いております。
2.平均年間給与は、賞与及び基準外賃金を含んでおります。
3.全社(共通)として記載されている従業員数は、特定のセグメントに区分できない管理部門に所属している
ものであります。
③ 労働組合の状況
当社グループの労働組合は北陸電気工業労働組合と称し、全日本電機・電子・情報関連産業労働組合連合会に加
入しており、2026年3月31日現在の組合員数は、477名であります。
労使関係において特に記載すべき事項はありません。
④ 管理職に占める女性労働者の割合、男性労働者の育児休業取得率及び労働者の男女の賃金の差異
イ.提出会社
当事業年度
管理職に占める女性労働男性労働者の育児休業取
者の割合(%)
得率(%)
(注)1.
(注)2.
6.0
労働者の男女の賃金の差異(%)
(注)1.
全労働者
100.0
正規雇用労働者
77.7
パート・有期労働者
78.0
76.6
(注)1.「女性の職業生活における活躍の推進に関する法律」(平成27年法律第64号)の規定に基づき算出したもの
であります。
2.「育児休業、介護休業等育児又は家族介護を行う労働者の福祉に関する法律」(平成3年法律第76号)の規
定に基づき、「育児休業、介護休業等育児又は家族介護を行う労働者の福祉に関する法律施行規則」(平成
3年労働省令第25号)第71条の6第1号における育児休業等の取得割合を算出したものであります。
ロ.連結子会社
当事業年度
名称
朝日電子㈱
管理職に占める
女性労働者の割
合(%)
(注)1.
男性労働者の育
児休業取得率
(%)
(注)2.
40.0
100.0
労働者の男女の賃金の差異(%)
(注)1.
全労働者
87.2
正規雇用労働者
パート・有期労
働者
82.5
90.6
(注)1.「女性の職業生活における活躍の推進に関する法律」(平成27年法律第64号)の規定に基づき算出したもの
であります。
2.「育児休業、介護休業等育児又は家族介護を行う労働者の福祉に関する法律」(平成3年法律第76号)の規
定に基づき、「育児休業、介護休業等育児又は家族介護を行う労働者の福祉に関する法律施行規則」(平成
3年労働省令第25号)第71条の6第1号における育児休業等の取得割合を算出したものであります。
45/97
EDINET提出書類
北陸電気工業株式会社(E01817)
有価証券報告書
第5【経理の状況】
1.連結財務諸表及び財務諸表の作成方法について
(1) 当社の連結財務諸表は、「連結財務諸表の用語、様式及び作成方法に関する規則」(昭和51年大蔵省令第28号)
に基づいて作成しております。
(2) 当社の財務諸表は、「財務諸表等の用語、様式及び作成方法に関する規則」(昭和38年大蔵省令第59号。以下
「財務諸表等規則」という。)に基づいて作成しております。
また、当社は、特例財務諸表提出会社に該当し、財務諸表等規則第127条の規定により財務諸表を作成しており
ます。
2.監査証明について
当社は、金融商品取引法第193条の2第1項の規定に基づき、連結会計年度(2025年4月1日から2026年3月31日
まで)の連結財務諸表及び事業年度(2025年4月1日から2026年3月31日まで)の財務諸表について、太陽有限責任
監査法人による監査を受けております。
3.連結財務諸表等の適正性を確保するための特段の取組みについて
当社は、連結財務諸表等の適正性を確保するための特段の取組みを行っております。具体的には、会計基準等の内
容を適切に把握し、又は会計基準等の変更等について的確に対応できる体制を整備するため、公益財団法人財務会計
基準機構に加入しております。
46/97
EDINET提出書類
北陸電気工業株式会社(E01817)
有価証券報告書
1【連結財務諸表等】
(1)【連結財務諸表】
①【連結貸借対照表】
(単位:百万円)
前連結会計年度
(2025年3月31日)
資産の部
流動資産
現金及び預金
受取手形及び売掛金
電子記録債権
商品及び製品
仕掛品
原材料及び貯蔵品
その他
貸倒引当金
流動資産合計
固定資産
有形固定資産
建物及び構築物
減価償却累計額及び減損損失累計額
建物及び構築物(純額)
機械装置及び運搬具
減価償却累計額及び減損損失累計額
機械装置及び運搬具(純額)
土地
その他
有形固定資産合計
無形固定資産
投資その他の資産
投資有価証券
繰延税金資産
その他
貸倒引当金
投資その他の資産合計
固定資産合計
資産合計
47/97
当連結会計年度
(2026年3月31日)
11,931
13,079
※7 8,033
※7 7,807
616
1,788
2,979
3,340
1,964
△28
30,625
967
1,448
4,060
3,359
1,972
△31
32,663
※6 14,039
※6 14,504
△11,575
※3 2,463
※3 2,553
※6 26,808
※6 27,744
△23,777
※3 3,031
△24,069
※3 3,674
※2,※3 2,611
※2,※3 2,652
433
8,539
262
496
9,376
322
※1 1,431
※1 2,185
1,042
1,312
△19
3,767
12,569
43,195
687
952
△11
3,813
13,513
46,177
△11,951
EDINET提出書類
北陸電気工業株式会社(E01817)
有価証券報告書
(単位:百万円)
前連結会計年度
(2025年3月31日)
負債の部
流動負債
電子記録債務
買掛金
短期借入金
未払法人税等
賞与引当金
その他
流動負債合計
固定負債
長期借入金
リース債務
繰延税金負債
再評価に係る繰延税金負債
退職給付に係る負債
その他
固定負債合計
負債合計
純資産の部
株主資本
資本金
資本剰余金
利益剰余金
自己株式
株主資本合計
その他の包括利益累計額
その他有価証券評価差額金
土地再評価差額金
為替換算調整勘定
退職給付に係る調整累計額
その他の包括利益累計額合計
純資産合計
負債純資産合計
48/97
当連結会計年度
(2026年3月31日)
143
5,659
※3,※5 3,409
334
513
1,218
11,279
111
5,069
※3,※5 4,111
591
474
1,438
11,796
※3 5,326
※3 4,923
157
0
※2 319
3,362
35
9,202
20,482
328
−
※2 319
2,891
99
8,563
20,359
5,200
3,958
9,730
△736
18,152
5,200
3,961
11,003
△861
19,303
401
960
※2 643
※2 643
3,377
138
4,560
22,713
43,195
4,585
323
6,513
25,817
46,177
EDINET提出書類
北陸電気工業株式会社(E01817)
有価証券報告書
②【連結損益計算書及び連結包括利益計算書】
【連結損益計算書】
(単位:百万円)
前連結会計年度
(自 2024年4月1日
至 2025年3月31日)
売上高
売上原価
売上総利益
販売費及び一般管理費
営業利益
営業外収益
受取利息
受取配当金
設備賃貸料
為替差益
スクラップ売却益
その他
営業外収益合計
営業外費用
支払利息
債権売却損
その他
営業外費用合計
経常利益
特別利益
固定資産売却益
取引先関連事業損失戻入益
投資有価証券売却益
保険解約返戻金
その他
特別利益合計
特別損失
減損損失
固定資産売却損
固定資産除却損
保険解約損
その他
特別損失合計
税金等調整前当期純利益
法人税、住民税及び事業税
法人税等調整額
法人税等合計
当期純利益
親会社株主に帰属する当期純利益
49/97
当連結会計年度
(自 2025年4月1日
至 2026年3月31日)
※8 43,185
※8 43,128
※1,※3 34,606
※1,※3 34,616
8,579
※2,※3 5,978
8,512
※2,※3 6,201
2,600
2,311
133
39
37
81
38
43
374
148
42
38
277
35
46
588
73
27
24
125
2,849
90
34
31
156
2,742
※4 0
※4 1
155
16
44
9
225
−
107
57
17
184
※7 233
※7 41
※5 0
−
※6 62
※6 57
−
10
307
2,767
575
△2
573
2,194
2,194
30
4
134
2,792
773
32
805
1,986
1,986
EDINET提出書類
北陸電気工業株式会社(E01817)
有価証券報告書
【連結包括利益計算書】
(単位:百万円)
前連結会計年度
(自 2024年4月1日
至 2025年3月31日)
当期純利益
その他の包括利益
その他有価証券評価差額金
土地再評価差額金
退職給付に係る調整額
為替換算調整勘定
その他の包括利益合計
包括利益
(内訳)
親会社株主に係る包括利益
50/97
当連結会計年度
(自 2025年4月1日
至 2026年3月31日)
2,194
1,986
1
△9
125
1,148
※ 1,266
558
−
185
1,208
※ 1,953
3,461
3,939
3,461
3,939
EDINET提出書類
北陸電気工業株式会社(E01817)
有価証券報告書
③【連結株主資本等変動計算書】
前連結会計年度(自 2024年4月1日
至
2025年3月31日)
(単位:百万円)
株主資本
資本金
当期首残高
5,200
資本剰余金
利益剰余金
5,037
8,025
自己株式
株主資本合計
△1,450
16,812
当期変動額
剰余金の配当
△489
△489
親会社株主に帰属する当期
純利益
2,194
2,194
自己株式の取得
△374
△374
自己株式の処分
0
8
9
自己株式の消却
△1,079
1,079
−
非支配株主との取引に係る
親会社の持分変動
△0
△0
株主資本以外の項目の当期
変動額(純額)
当期変動額合計
当期末残高
−
△1,079
1,705
714
1,340
5,200
3,958
9,730
△736
18,152
その他の包括利益累計額
その他有価証土地再評価差額為替換算調整勘退職給付に係る その他の包括利
券評価差額金
金
定
調整累計額
益累計額合計
当期首残高
400
652
2,229
12
3,294
純資産合計
20,106
当期変動額
剰余金の配当
△489
親会社株主に帰属する当期
純利益
2,194
自己株式の取得
△374
自己株式の処分
9
自己株式の消却
−
非支配株主との取引に係る
親会社の持分変動
△0
株主資本以外の項目の当期
変動額(純額)
当期変動額合計
当期末残高
1
△9
1,148
125
1,266
1,266
1
△9
1,148
125
1,266
2,606
401
643
3,377
138
4,560
22,713
51/97
EDINET提出書類
北陸電気工業株式会社(E01817)
有価証券報告書
当連結会計年度(自
2025年4月1日
至
2026年3月31日)
(単位:百万円)
株主資本
資本金
当期首残高
5,200
資本剰余金
利益剰余金
3,958
9,730
自己株式
株主資本合計
△736
18,152
当期変動額
剰余金の配当
△713
△713
親会社株主に帰属する当期
純利益
1,986
1,986
自己株式の取得
自己株式の処分
3
△131
△131
5
9
自己株式の消却
−
非支配株主との取引に係る
親会社の持分変動
△0
△0
株主資本以外の項目の当期
変動額(純額)
当期変動額合計
当期末残高
−
3
1,272
△125
1,150
5,200
3,961
11,003
△861
19,303
その他の包括利益累計額
その他有価証土地再評価差額為替換算調整勘退職給付に係る その他の包括利
券評価差額金
金
定
調整累計額
益累計額合計
当期首残高
401
643
3,377
138
4,560
純資産合計
22,713
当期変動額
剰余金の配当
△713
親会社株主に帰属する当期
純利益
1,986
自己株式の取得
△131
自己株式の処分
9
自己株式の消却
−
非支配株主との取引に係る
親会社の持分変動
△0
株主資本以外の項目の当期
変動額(純額)
558
1,208
185
1,953
1,953
当期変動額合計
558
−
1,208
185
1,953
3,104
当期末残高
960
643
4,585
323
6,513
25,817
52/97
EDINET提出書類
北陸電気工業株式会社(E01817)
有価証券報告書
④【連結キャッシュ・フロー計算書】
(単位:百万円)
前連結会計年度
(自 2024年4月1日
至 2025年3月31日)
営業活動によるキャッシュ・フロー
税金等調整前当期純利益
減価償却費
減損損失
貸倒引当金の増減額(△は減少)
賞与引当金の増減額(△は減少)
退職給付に係る負債の増減額(△は減少)
受取利息及び受取配当金
支払利息
為替差損益(△は益)
固定資産売却損益(△は益)
固定資産除却損
投資有価証券売却損益(△は益)
保険解約返戻金
スクラップ売却損益(△は益)
債権売却損
保険解約損益(△は益)
取引先関連事業損失戻入益
売上債権の増減額(△は増加)
棚卸資産の増減額(△は増加)
仕入債務の増減額(△は減少)
未収消費税等の増減額(△は増加)
その他
小計
利息及び配当金の受取額
利息の支払額
法人税等の支払額
保険解約返戻金の受取額
損害賠償金の支払額
スクラップ売却による収入
営業活動によるキャッシュ・フロー
2,767
1,026
233
8
111
△412
△172
73
△49
0
62
△16
△44
△38
27
−
△155
28
1,626
△285
19
△369
4,440
172
△73
△497
44
△0
38
4,124
53/97
当連結会計年度
(自 2025年4月1日
至 2026年3月31日)
2,792
1,158
41
△4
△39
△471
△190
90
△18
△1
57
△107
△57
△35
−
30
−
39
△394
△708
△27
△413
1,741
190
△92
△535
57
−
35
1,397
EDINET提出書類
北陸電気工業株式会社(E01817)
有価証券報告書
(単位:百万円)
前連結会計年度
(自 2024年4月1日
至 2025年3月31日)
投資活動によるキャッシュ・フロー
固定資産の取得による支出
固定資産の売却による収入
投資有価証券の取得による支出
投資有価証券の売却及び償還による収入
貸付けによる支出
貸付金の回収による収入
定期預金の純増減額(△は増加)
その他
投資活動によるキャッシュ・フロー
財務活動によるキャッシュ・フロー
短期借入金の純増減額(△は減少)
長期借入れによる収入
長期借入金の返済による支出
リース債務の返済による支出
自己株式の取得による支出
配当金の支払額
連結の範囲の変更を伴わない子会社株式の取得に
よる支出
財務活動によるキャッシュ・フロー
現金及び現金同等物に係る換算差額
現金及び現金同等物の増減額(△は減少)
現金及び現金同等物の期首残高
現金及び現金同等物の期末残高
54/97
当連結会計年度
(自 2025年4月1日
至 2026年3月31日)
△1,010
1
△2
21
−
−
△421
△61
△1,471
△825
1
△2
158
△35
0
217
348
△134
△350
2,600
△3,090
△200
△374
△489
800
2,500
△3,001
△97
△131
△713
△0
△0
△1,905
538
1,285
8,018
※1 9,303
△644
287
906
9,303
※1 10,210
EDINET提出書類
北陸電気工業株式会社(E01817)
有価証券報告書
【注記事項】
(連結財務諸表作成のための基本となる重要な事項)
1 連結の範囲に関する事項
(イ)連結子会社の数 16社
主要な連結子会社名
北陸興産㈱、朝日電子㈱、ダイワ電機精工㈱、北電マレーシア㈱、上海北陸微電子㈲、北陸電気(広東)㈲、天
津北陸電気㈲、北陸(上海)国際貿易㈲、北陸シンガポール㈱、HDKタイランド㈱
(ロ)主要な非連結子会社の名称等
主要な非連結子会社はありません。
(連結の範囲から除いた理由)
非連結子会社は、小規模であり、合計の総資産、売上高、当期純損益(持分に見合う額)及び利益剰余金(持分
に見合う額)等は、連結財務諸表に重要な影響を及ぼしていないためであります。
2
持分法の適用に関する事項
持分法を適用する非連結子会社及び関連会社はありません。
また、持分法を適用しない主要な非連結子会社及び関連会社はありません。
(持分法を適用しない理由)
持分法を適用していない非連結子会社及び関連会社は、当期純損益(持分に見合う額)及び利益剰余金(持分に
見合う額)等からみて、持分法の対象から除いても連結財務諸表に及ぼす影響が軽微であり、かつ、全体としても
重要性がないため、持分法の適用範囲から除外しております。
3
連結子会社の事業年度等に関する事項
連結子会社の決算日が連結決算日と異なる会社は次のとおりであります。
会社名
決算日
HDKチャイナ㈱
12月31日
北陸(上海)国際貿易㈲
12月31日
天津北陸電気㈲
12月31日
HDKタイランド㈱
12月31日
上海北陸微電子㈲
12月31日
北陸電気(広東)㈲
12月31日
北陸インターナショナルタイランド㈱
12月31日
いずれも、連結子会社の決算日現在の財務諸表を使用しております。ただし、連結決算日との間に生じた重要
な取引については、連結上必要な調整を行っております。
4
会計方針に関する事項
(イ)重要な資産の評価基準及び評価方法
①有価証券
その他有価証券
市場価格のない株式等以外のもの
時価法(評価差額は全部純資産直入法により処理し、売却原価は移動平均法により算定)
市場価格のない株式等
移動平均法による原価法
②デリバティブ
時価法
③棚卸資産
(商品及び製品並びに仕掛品)
当社及び国内連結子会社は主として総平均法による原価法(収益性の低下による簿価切下げの方法)、在外連
結子会社は主として総平均法または先入先出法による低価法を採用しております。
(原材料及び貯蔵品)
当社及び国内連結子会社は主として先入先出法による原価法(収益性の低下による簿価切下げの方法)、在外
連結子会社は主として先入先出法による低価法を採用しております。
55/97
EDINET提出書類
北陸電気工業株式会社(E01817)
有価証券報告書
(ロ)重要な減価償却資産の減価償却の方法
①有形固定資産(リース資産を除く)
当社及び国内連結子会社は主として定率法、在外連結子会社は主として定額法を採用しております。
②無形固定資産(リース資産を除く)
定額法によっております。
なお、自社利用のソフトウエアについては、社内における利用可能期間(5年)に基づく定額法を採用してお
ります。
③リース資産
所有権移転外ファイナンス・リース取引に係るリース資産
リース期間を耐用年数として、残存価額を零とする定額法を採用しております。
(ハ)重要な引当金の計上基準
①貸倒引当金
債権の貸倒損失に備えるため、当社及び国内連結子会社は、一般債権については貸倒実績率により、貸倒懸念
債権等特定の債権については個別に回収可能性を検討し、回収不能見込額を計上しており、在外連結子会社は、
主として特定の債権について、その回収可能性を勘案した所要見積額を計上しております。
②賞与引当金
従業員に対して支給する賞与の支出に充てるため、支給見込額の当連結会計年度の負担額を計上しておりま
す。
(ニ)退職給付に係る会計処理の方法
①退職給付見込額の期間帰属方法
退職給付債務の算定にあたり、退職給付見込額を当連結会計年度末までの期間に帰属させる方法については、
期間定額基準によっております。
②数理計算上の差異、過去勤務費用の費用処理方法
過去勤務費用については、その発生時における従業員の平均残存勤務期間以内の一定の年数(主として10年)
による定額法により費用処理しております。
数理計算上の差異については、各連結会計年度の発生時における従業員の平均残存勤務期間以内の一定の年数
(主として10年)による定額法により按分した額をそれぞれ発生の翌連結会計年度から費用処理しております。
③小規模企業等における簡便法の採用
一部の連結子会社は、退職給付に係る負債及び退職給付費用の計算に、退職給付に係る期末自己都合要支給額
を退職給付債務とする方法を用いた簡便法を適用しております。
(ホ)収益及び費用の計上基準
商品又は製品の販売に係る収益は、主に製造等による販売であり、顧客との販売契約に基づいて商品又は製品
を引き渡す履行義務を負っております。当該履行義務は、商品又は製品を引き渡す一時点において、顧客が当該
商品又は製品に対する支配を獲得して充足されると判断し、引渡時点で収益を認識しております。ただし、商品
又は製品の国内の販売において、出荷時から当該商品又は製品の支配が顧客に移転される時までの期間が通常の
期間である場合には、出荷時に収益を認識しております。
(ヘ)重要なヘッジ会計の方法
①ヘッジ会計の方法
為替変動リスクのヘッジについて振当処理の要件を充たしている場合には振当処理を採用しております。
②ヘッジ手段とヘッジ対象
為替変動リスクに対してヘッジするために為替予約取引を利用しております。
③ヘッジ方針
為替変動リスクをヘッジする目的に限定し、デリバティブ取引を行っております。
なお、デリバティブ取引の相手先は、格付けの高い金融機関に限定しております。
④ヘッジ有効性評価の方法
振当処理をしている為替予約については、有効性の評価を省略しております。
(ト)連結キャッシュ・フロー計算書における資金の範囲
手許現金、随時引き出し可能な預金及び容易に換金可能であり、かつ、価値の変動について僅少なリスクしか
負わない取得日から3か月以内に償還期限の到来する短期投資からなります。
56/97
EDINET提出書類
北陸電気工業株式会社(E01817)
有価証券報告書
(重要な会計上の見積り)
会計上の見積りにより当連結会計年度に係る連結財務諸表にその額を計上した項目であって、翌連結会計年度に係る
連結財務諸表に重要な影響を及ぼす可能性があるもの、およびその会計上の見積りの内容は次のとおりであります。
(単位:百万円)
前連結会計年度
当連結会計年度
商品及び製品
1,788
1,448
仕掛品
2,979
4,060
原材料及び貯蔵品
3,340
3,359
繰延税金資産
1,636
1,579
(注)繰延税金資産は繰延税金負債と相殺前の金額であります。
①棚卸資産(商品及び製品、仕掛品、原材料及び貯蔵品)
棚卸資産の評価において、期末における正味売却価額が取得原価よりも下落している場合には当該正味売却価額
をもって貸借対照表価額とする一方、営業循環過程から外れた棚卸資産については、正味売却価額まで切り下げる
方法に代えて、滞留期間に応じて規則的に帳簿価額を切り下げ、収益性の低下の事実を反映させる方法を採用して
おります。また、滞留期間に応じた規則的な帳簿価額の切下げにおきましては、滞留期間ごとの簿価切下率の基準
を設定しており、当該基準に使用する滞留期間は、棚卸資産の種類に基づき、入庫日、工程投入日又は最終出荷日
を基準日として算定しております。ただし、収益性の低下が認められないことが明らかな棚卸資産については、そ
の根拠を検討したうえで、上記の簿価切下げの対象から除外しております。
営業循環過程から外れた棚卸資産の簿価切下げの方法の採用及び基準の設定については、過去の廃棄実績及び出
荷実績との整合性を検証することで、また、簿価切下げの対象からの除外に当たっては、収益性の低下が認められ
ない根拠を確認することで、それらの妥当性を図っております。
電子部品業界は技術革新のスピードが速く、価格競争が激しいことから、将来の需要等の市場環境が予測より悪
化し、棚卸資産の収益性が低下した場合は、簿価切下げが必要となる場合があります。
②繰延税金資産
繰延税金資産の回収可能性については、納税主体ごとに、「繰延税金資産の回収可能性に関する適用指針」に基
づき企業の分類を行い、当該分類に基づき判断しております。
また、将来減算一時差異および税務上の繰越欠損金に係る繰延税金資産の回収可能額は、過年度における課税所
得の実績および事業計画に基づき見積った将来の課税所得を基礎として算定しております。
経営環境の変化等により、将来の課税所得の金額が見積りと異なる場合には、繰延税金資産の金額に影響を与え
る可能性があります。
(未適用の会計基準等)
(リースに関する会計基準等)
・「リースに関する会計基準」(企業会計基準第34号 2024年9月13日企業会計基準委員会)
・「リースに関する会計基準の適用指針」(企業会計基準適用指針第33号 2024年9月13日企業会計基準委員会)
等
(1)概要
企業会計基準委員会において、日本基準を国際的に整合性のあるものとする取組みの一環として、借手の全てのリー
スについて資産及び負債を認識するリースに関する会計基準の開発に向けて、国際的な会計基準を踏まえた検討が行わ
れ、基本的な方針として、IFRS第16号の単一の会計処理モデルを基礎とするものの、IFRS第16号の全ての定めを採り入
れるのではなく、主要な定めのみを採り入れることにより、簡素で利便性が高く、かつ、IFRS第16号の定めを個別財務
諸表に用いても、基本的に修正が不要となることを目指したリース会計基準等が公表されました。
借手の会計処理として、借手のリースの費用配分の方法については、IFRS第16号と同様に、リースがファイナンス・
リースであるかオペレーティング・リースであるかにかかわらず、全てのリースについて使用権資産に係る減価償却費
及びリース負債に係る利息相当額を計上する単一の会計処理モデルが適用されます。
(2)適用予定日
2028年3月期の期首から適用します。
(3)当該会計基準等の適用による影響
「リースに関する会計基準」等の適用による連結財務諸表に与える影響額については、現時点で評価中であります。
57/97
EDINET提出書類
北陸電気工業株式会社(E01817)
有価証券報告書
(連結貸借対照表関係)
※1 投資有価証券のうち非連結子会社及び関連会社に対するものは、次のとおりであります。
前連結会計年度
当連結会計年度
(2025年3月31日)
(2026年3月31日)
投資有価証券(株式)
30百万円
30百万円
※2
当社は「土地の再評価に関する法律」(平成10年3月31日公布法律第34号)に基づき、事業用の土地の再評価を
行い、土地再評価差額金を純資産の部に計上しております。
・再評価の方法…「土地の再評価に関する法律施行令(平成10年3月31日公布政令第119号)第2条第五号」
に定める方法により算出
・再評価を行った年月日…2000年3月31日
前連結会計年度
当連結会計年度
(2025年3月31日)
(2026年3月31日)
再評価を行った土地の当連結会計年度末に
295百万円
276百万円
おける時価と再評価後の帳簿価額との差額
※3
担保資産及び担保付債務
担保に供している資産は、次のとおりであります。
前連結会計年度
(2025年3月31日)
当連結会計年度
(2026年3月31日)
建物及び構築物
589百万円 (
357百万円)
571百万円 (
340百万円)
機械装置及び運搬具
196
(
196
)
166
(
166
)
1,468
(
1,302
)
1,468
(
1,302
)
2,254
(
1,857
)
2,206
(
1,809
)
土地
計
担保付債務は、次のとおりであります。
前連結会計年度
(2025年3月31日)
当連結会計年度
(2026年3月31日)
短期借入金
2,077百万円 (
1,797百万円)
2,364百万円(
1,938百万円)
長期借入金
4,182
(
3,573
)
3,954
(
3,391
)
6,259
(
5,370
)
6,319
(
5,329
)
計
上記のうち、(
4
)内書は工場財団抵当並びに当該債務を示しております。
保証債務
次の保証先について、金融機関からの借入に対し債務保証を行っております。
前連結会計年度
(2025年3月31日)
従業員
0百万円
当連結会計年度
(2026年3月31日)
0百万円
※5
当座貸越契約
当社及び連結子会社3社は、運転資金の効率的な調達を行うため取引銀行4行と当座貸越契約を締結しておりま
す。当連結会計年度末における当座貸越契約に係る借入未実行残高等は次のとおりであります。
前連結会計年度
当連結会計年度
(2025年3月31日)
(2026年3月31日)
当座貸越極度額の総額
借入実行残高
差引額
※6
10,830百万円
600
10,873百万円
1,400
10,230
9,473
圧縮記帳額
国庫補助金等により固定資産の取得金額から控除している圧縮記帳額は次のとおりであります。
前連結会計年度
当連結会計年度
(2025年3月31日)
(2026年3月31日)
建物及び構築物
機械装置及び運搬具
計
58/97
68百万円
215
68百万円
215
283
283
EDINET提出書類
北陸電気工業株式会社(E01817)
有価証券報告書
※7
受取手形及び売掛金のうち、顧客との契約から生じた債権の金額は、それぞれ以下のとおりであります。
前連結会計年度
当連結会計年度
(2025年3月31日)
(2026年3月31日)
受取手形
17百万円
8,016
売掛金
なお、契約資産および契約負債はありません。
14百万円
7,792
(連結損益計算書関係)
※1 期末棚卸高は収益性の低下に伴う簿価切下後の金額であり、次の棚卸資産評価損(洗替法による戻入額相殺後)
が売上原価に含まれております。
前連結会計年度
(自 2024年4月1日
至 2025年3月31日)
当連結会計年度
(自 2025年4月1日
至 2026年3月31日)
123百万円
※2
59百万円
販売費及び一般管理費のうち主要な費目及び金額は次のとおりであります。
前連結会計年度
(自 2024年4月1日
至 2025年3月31日)
従業員給料及び賞与
貸倒引当金繰入額
賞与引当金繰入額
退職給付費用
減価償却費
※3
当連結会計年度
(自 2025年4月1日
至 2026年3月31日)
3,178百万円
0
247
125
250
3,402百万円
2
238
113
275
一般管理費及び当期製造費用に含まれる研究開発費の総額
前連結会計年度
(自 2024年4月1日
至 2025年3月31日)
当連結会計年度
(自 2025年4月1日
至 2026年3月31日)
1,623百万円
※4
1,583百万円
固定資産売却益の内容は次のとおりであります。
前連結会計年度
2024年4月1日
2025年3月31日)
当連結会計年度
2025年4月1日
2026年3月31日)
(自
至
機械装置及び運搬具
※5
(自
至
0百万円
1百万円
固定資産売却損の内容は次のとおりであります。
前連結会計年度
2024年4月1日
2025年3月31日)
当連結会計年度
2025年4月1日
2026年3月31日)
(自
至
機械装置及び運搬具
※6
(自
至
0百万円
−百万円
固定資産除却損の内容は次のとおりであります。
前連結会計年度
2024年4月1日
2025年3月31日)
当連結会計年度
2025年4月1日
2026年3月31日)
(自
至
建物及び構築物
機械装置及び運搬具
工具、器具及び備品
無形固定資産
計
(自
至
3百万円
56
3
0
11百万円
34
11
−
62
57
59/97
EDINET提出書類
北陸電気工業株式会社(E01817)
有価証券報告書
※7
減損損失
当社グループは以下の資産グループについて減損損失を計上しました。
前連結会計年度(自 2024年4月1日至 2025年3月31日)
場所
滋賀県長浜市
他
用途
事業用資産
種類
土地、建物及び構築物、機械装置等
当社グループは事業用資産については原則として工場を、賃貸資産、福利厚生施設及び遊休資産についてはそれ
ぞれ個別の物件を単位としてグルーピングを行っておりますが、金型製造販売会社において事業用資産について収
益性の低下により投資額の回収が見込めなくなったことから、帳簿価額を回収可能価額まで減額し、当該減少額を
減損損失(233百万円)として特別損失に計上しました。その内訳は、土地126百万円、建物及び構築物64百万円、
機械装置等42百万円であります。
なお、将来キャッシュ・フローがマイナスのため、回収可能価額は不動産鑑定評価額で評価した正味売却価額と
しております。
当連結会計年度(自 2025年4月1日至 2026年3月31日)
場所
富山県立山町
用途
事業用資産
種類
機械装置等
当社グループは事業用資産については原則として工場を、賃貸資産、福利厚生施設および遊休資産についてはそ
れぞれ個別の物件を単位としてグルーピングを行っておりますが、回路基板の製造拠点をASEAN工場に集約す
るため、当該工場につきまして、生産品の移転および今後の生産終了を決定いたしました。また、物流の効率化を
図るため、同工場の土地、建物につきましては物流拠点として使用することも併せて決定しております。これによ
り、遊休資産となる機械装置等につきましては帳簿価額を回収可能価額まで減額し、当該減少額を減損損失(41百
万円)に計上しました。
なお、将来キャッシュ・フローがマイナスのため、回収可能価額は不動産鑑定評価額で評価した正味売却価額と
しております。
※8
顧客との契約から生じる収益
売上高については、顧客との契約から生じる収益及びそれ以外の収益を区分して記載しておりません。顧客との
契約から生じる収益の金額は、連結財務諸表「注記事項(収益認識関係)2.顧客との契約から生じる収益を分解
した情報」および「注記事項(セグメント情報等)」に記載しております。
60/97
EDINET提出書類
北陸電気工業株式会社(E01817)
有価証券報告書
(連結包括利益計算書関係)
※ その他の包括利益に係る組替調整額並びに法人税等及び税効果額
前連結会計年度
(自 2024年4月1日
至 2025年3月31日)
当連結会計年度
2025年4月1日
2026年3月31日)
(自
至
その他有価証券評価差額金:
当期発生額
組替調整額
33百万円
△16
914百万円
△107
17
△15
807
△248
1
558
1,148
−
1,208
−
法人税等及び税効果額
1,148
−
1,208
−
為替換算調整勘定
1,148
1,208
156
27
272
△1
法人税等及び税効果額
183
△57
270
△84
退職給付に係る調整額
125
185
−
−
−
−
法人税等及び税効果額
−
△9
−
−
土地再評価差額金
△9
−
1,266
1,953
法人税等及び税効果調整前
法人税等及び税効果額
その他有価証券評価差額金
為替換算調整勘定:
当期発生額
組替調整額
法人税等及び税効果調整前
退職給付に係る調整額:
当期発生額
組替調整額
法人税等及び税効果調整前
土地再評価差額金:
当期発生額
組替調整額
法人税等及び税効果調整前
その他の包括利益合計
(連結株主資本等変動計算書関係)
前連結会計年度(自 2024年4月1日至 2025年3月31日)
1.発行済株式の種類及び総数並びに自己株式の種類及び株式数に関する事項
当連結会計年度
当連結会計年度
当連結会計年度
期首株式数(千株) 増加株式数(千株) 減少株式数(千株)
当連結会計年度末
株式数(千株)
発行済株式
普通株式(注)1
9,250
−
800
8,450
合計
9,250
−
800
8,450
自己株式
普通株式(注)2.3
1,087
236
806
517
合計
1,087
236
806
517
(注)1.普通株式の発行済株式数の減少800千株は、取締役会決議に基づく自己株式の消却によるものです。
2.普通株式の自己株式の増加236千株は、取締役会決議による自己株式の取得による増加235千株、単元未満株
式の買取りによる増加1千株によるものであります。
3.普通株式の自己株式の減少806千株は、取締役会決議による自己株式の消却800千株、譲渡制限付株式報酬と
しての自己株式の処分6千株によるものであります。
61/97
EDINET提出書類
北陸電気工業株式会社(E01817)
有価証券報告書
2.配当に関する事項
(1)配当金支払額
(決
議)
2024年5月10日
取締役会
株式の種類
配当金の総額
(百万円)
普通株式
1株当たり
配当額(円)
489
60.00
基準日
効力発生日
2024年3月31日
2024年6月6日
(2)基準日が当連結会計年度に属する配当のうち、配当の効力発生日が翌連結会計年度となるもの
(決
議)
2025年5月9日
取締役会
株式の種類
配当金の総額
(百万円)
配当の原資
1株当たり
配当額(円)
普通株式
713
利益剰余金
90.00
基準日
効力発生日
2025年3月31日
2025年6月6日
当連結会計年度
当連結会計年度
当連結会計年度
期首株式数(千株) 増加株式数(千株) 減少株式数(千株)
当連結会計年度末
株式数(千株)
当連結会計年度(自 2025年4月1日至 2026年3月31日)
1.発行済株式の種類及び総数並びに自己株式の種類及び株式数に関する事項
発行済株式
普通株式
8,450
−
−
8,450
合計
8,450
−
−
8,450
自己株式
普通株式(注)1.2
517
90
4
604
合計
517
90
4
604
(注)1.普通株式の自己株式の増加90千株は、取締役会決議による自己株式の取得による増加89千株、単元未満株式
の買取りによる増加1千株によるものであります。
2.普通株式の自己株式の減少4千株は、譲渡制限付株式報酬としての自己株式の処分によるものであります。
2.配当に関する事項
(1)配当金支払額
(決
議)
2025年5月9日
取締役会
株式の種類
配当金の総額
(百万円)
普通株式
1株当たり
配当額(円)
713
90.00
基準日
効力発生日
2025年3月31日
2025年6月6日
(2)基準日が当連結会計年度に属する配当のうち、配当の効力発生日が翌連結会計年度となるもの
(決
議)
2026年5月12日
取締役会
株式の種類
配当金の総額
(百万円)
配当の原資
1株当たり
配当額(円)
普通株式
745
利益剰余金
95.00
62/97
基準日
効力発生日
2026年3月31日
2026年6月5日
EDINET提出書類
北陸電気工業株式会社(E01817)
有価証券報告書
(連結キャッシュ・フロー計算書関係)
※1 現金及び現金同等物の期末残高と連結貸借対照表に掲記されている科目の金額との関係
前連結会計年度
2024年4月1日
2025年3月31日)
(自
至
当連結会計年度
2025年4月1日
2026年3月31日)
(自
至
現金及び預金勘定
11,931百万円
13,079百万円
預入期間が3か月を超える定期預金
△2,627
△2,869
9,303
10,210
現金及び現金同等物
2
重要な非資金取引の内容
(1)自己株式の消却
前連結会計年度
2024年4月1日
2025年3月31日)
(自
至
自己株式の消却
1,079百万円
当連結会計年度
2025年4月1日
2026年3月31日)
(自
至
−百万円
(リース取引関係)
ファイナンス・リース取引
所有権移転外ファイナンス・リース取引
① リース資産の内容
(ア)有形固定資産
主として、電子部品セグメントにおける生産設備、コンピュータ端末機等(機械装置及び運搬具並びに工
具、器具及び備品)であります。
(イ)無形固定資産
ソフトウエアであります。
② リース資産の減価償却の方法
連結財務諸表作成のための基本となる重要な事項「4 会計方針に関する事項(ロ)重要な減価償却資産の減
価償却の方法」に記載のとおりであります。
(金融商品関係)
1.金融商品の状況に関する事項
(1)金融商品に対する取組方針
当社グループは、資金運用については安全性の高い金融資産に限定し、また、資金調達については主に銀行借入
によっております。デリバティブ取引は、将来の為替・金利の変動によるリスク回避を目的としており、投機的な
取引は行わない方針であります。
(2)金融商品の内容及びそのリスク並びにリスク管理体制
営業債権である受取手形及び売掛金は、顧客の信用リスクに晒されております。当該リスクに関しては、当社グ
ループの与信管理規定に従い、取引先ごとの期日管理及び残高管理を行うとともに、主な取引先の信用状況を定期
的に把握する体制としております。
投資有価証券は、主に業務上の関係を有する企業の株式であり、市場価格の変動リスクに晒されております。
営業債務である支払手形及び買掛金は、そのほとんどが1年以内の支払期日であります。
借入金のうち、短期借入金は主に営業取引に係る資金調達であり、長期借入金は主に設備投資に係る資金調達で
ありますが、変動金利の借入金は、金利の変動リスクに晒されております。
デリバティブ取引の契約は、各事業部署の稟議手続により、管理部門の検討を経て社長決裁により行われてお
り、取引結果は毎月管理部門に報告されております。
また、デリバティブの利用にあたっては、信用リスクを軽減するために、格付の高い金融機関とのみ取引を行っ
ております。
なお、デリバティブ取引の一部についてはヘッジ会計を行っており、その内容は連結財務諸表作成のための基本
となる重要な事項「4 会計方針に関する事項(ヘ)重要なヘッジ会計の方法」に記載しております。
営業債務や借入金は、流動性リスクに晒されていますが、当社グループでは、各社が月次に資金繰計画を作成す
るなどの方法により管理しております。
(3)金融商品の時価等に関する事項についての補足説明
「2.金融商品の時価等に関する事項」におけるデリバティブ取引に関する契約額等については、その金額自体
がデリバティブ取引に係る市場リスクを示すものではありません。
63/97
EDINET提出書類
北陸電気工業株式会社(E01817)
有価証券報告書
2.金融商品の時価等に関する事項
連結貸借対照表計上額、時価及びこれらの差額については、次のとおりであります。なお、「現金及び預金」「受
取手形及び売掛金」「電子記録債権」「電子記録債務」「買掛金」「短期借入金」については、現金であることおよ
び短期間で決済されるため時価が帳簿価額に近似することから、注記を省略しております。
前連結会計年度(2025年3月31日)
連結貸借対照表計上額
(百万円)(*1)
時価(百万円)(*1)
(1)投資有価証券
1,327
1,327
−
(2)長期借入金
(8,136)
(8,075)
(△60)
(*1)負債に計上されているものについては、(
差額(百万円)
)で示しております。
当連結会計年度(2026年3月31日)
連結貸借対照表計上額
(百万円)(*1)
時価(百万円)(*1)
(1)投資有価証券
2,089
2,089
−
(2)長期借入金
(7,635)
(7,560)
(△74)
差額(百万円)
(*1)負債に計上されているものについては、( )で示しております。
(注)1.金融商品の時価の算定方法並びに有価証券に関する事項
(1)投資有価証券
これらの時価について、株式は取引所の価格によっております。また、保有目的ごとの有価証券に関する事
項については、注記事項「有価証券関係」をご参照下さい。
(2)長期借入金
これらの時価については、元利金の合計額を、新規に同様の借入をした場合に想定される利率で割り引いた
現在価値により算定しております。
(注)2.市場価格のない株式等
非上場株式(連結貸借対照表計上額は前連結会計年度末104百万円、当連結会計年度末96百万円)は、市場
価格がないため、「(1)投資有価証券」には含めておりません。
(注)3.金銭債権及び満期のある有価証券の連結決算日後の償還予定額
前連結会計年度(2025年3月31日)
1年以内
(百万円)
現金及び預金
受取手形及び売掛金
電子記録債権
合計
1年超5年以内
(百万円)
5年超10年以内
(百万円)
10年超
(百万円)
11,931
8,033
616
−
−
−
−
−
−
−
−
−
20,581
−
−
−
1年超5年以内
(百万円)
5年超10年以内
(百万円)
13,079
7,807
967
−
−
−
−
−
−
−
−
−
21,854
−
−
−
当連結会計年度(2026年3月31日)
1年以内
(百万円)
現金及び預金
受取手形及び売掛金
電子記録債権
合計
64/97
10年超
(百万円)
EDINET提出書類
北陸電気工業株式会社(E01817)
有価証券報告書
(注)4.長期借入金の返済予定額
前連結会計年度(2025年3月31日)
1年以内 1年超2年以内 2年超3年以内 3年超4年以内 4年超5年以内
5年超
(百万円)
(百万円)
(百万円)
(百万円)
(百万円)
(百万円)
長期借入金
2,809
2,210
1,675
1,060
365
14
当連結会計年度(2026年3月31日)
1年以内 1年超2年以内 2年超3年以内 3年超4年以内 4年超5年以内
5年超
(百万円)
(百万円)
(百万円)
(百万円)
(百万円)
(百万円)
長期借入金
2,711
2,175
1,560
865
321
−
3.金融商品の時価のレベルごとの内訳等に関する事項
金融商品の時価を、時価の算定に用いたインプットの観察可能性及び重要性に応じて、以下の3つのレベルに分類
しております。
レベル1の時価:同一の資産又は負債の活発な市場における(無調整の)相場価格により算定した時価
レベル2の時価:レベル1のインプット以外の直接又は間接的に観察可能なインプットを用いて算定した時価
レベル3の時価:重要な観察できないインプットを使用して算定した時価
時価の算定に重要な影響を与えるインプットを複数使用している場合には、それらのインプットがそれぞれ属する
レベルのうち、時価の算定における優先順位が最も低いレベルに時価を分類しております。
(1)時価をもって連結貸借対照表計上額とする金融資産及び金融負債
前連結会計年度(2025年3月31日)
(単位:百万円)
区分
投資有価証券
その他有価証券
株式
時価
レベル1
レベル2
1,327
レベル3
−
合計
−
1,327
当連結会計年度(2026年3月31日)
(単位:百万円)
区分
投資有価証券
その他有価証券
株式
時価
レベル1
レベル2
2,089
レベル3
−
合計
−
2,089
(2)時価をもって連結貸借対照表計上額としない金融資産及び金融負債
前連結会計年度(2025年3月31日)
(単位:百万円)
区分
時価
レベル2
8,075
レベル1
長期借入金
−
レベル3
合計
−
8,075
当連結会計年度(2026年3月31日)
(単位:百万円)
区分
時価
レベル2
7,560
レベル1
レベル3
合計
長期借入金
−
−
7,560
(注)時価の算定に用いた評価技法及びインプットの説明
投資有価証券
上場株式は相場価格を用いて評価しております。上場株式は活発な市場で取引されているため、その時価をレベル1
の時価に分類しております。
長期借入金
これらの時価は、元利金の合計額と、当該債務の残存期間及び信用リスクを加味した利率を基に、割引現在価値法に
より算定しており、レベル2の時価に分類しております。
(有価証券関係)
1.その他有価証券
前連結会計年度(2025年3月31日)
65/97
EDINET提出書類
北陸電気工業株式会社(E01817)
有価証券報告書
連結貸借対照表計上額
取得原価(百万円)
(百万円)
種類
連結貸借対照表計上額が
取得原価を超えるもの
株式
連結貸借対照表計上額が
取得原価を超えないもの
株式
小計
小計
合計
差額(百万円)
992
402
590
992
402
590
335
365
△30
335
365
△30
1,327
767
560
(注)非上場株式(連結貸借対照表計上額104百万円)については、市場価格がなく、時価を把握することが極め
て困難と認められることから、上表の「その他有価証券」には含めておりません。
当連結会計年度(2026年3月31日)
連結貸借対照表計上額
取得原価(百万円)
(百万円)
種類
連結貸借対照表計上額が
取得原価を超えるもの
株式
連結貸借対照表計上額が
取得原価を超えないもの
株式
小計
小計
合計
差額(百万円)
1,856
486
1,369
1,856
486
1,369
232
234
△1
232
234
△1
2,089
721
1,367
(注)非上場株式(連結貸借対照表計上額96百万円)については、市場価格がなく、時価を把握することが極めて
困難と認められることから、上表の「その他有価証券」には含めておりません。
2.売却したその他有価証券
前連結会計年度(自 2024年4月1日
種類
至
2025年3月31日)
売却益の合計額
(百万円)
売却額(百万円)
株式
合計
当連結会計年度(自
種類
2025年4月1日
株式
合計
至
売却損の合計額
(百万円)
21
16
−
21
16
−
2026年3月31日)
売却益の合計額
(百万円)
売却額(百万円)
売却損の合計額
(百万円)
158
107
−
158
107
−
3.減損処理を行った有価証券
その他有価証券について、前連結会計年度は減損処理を行っておりませんが、当連結会計年度は4百万円減損処
理を行っております。
なお、減損処理にあたっては、期末における時価が取得原価に比べ50%以上下落した場合には全て減損処理を行
い、30〜50%程度下落した場合には、回復可能性等を考慮して必要と認められた額について減損処理を行っており
ます。
(デリバティブ取引関係)
該当事項はありません。
66/97
EDINET提出書類
北陸電気工業株式会社(E01817)
有価証券報告書
(退職給付関係)
1.採用している退職給付制度の概要
当社及び連結子会社は、従業員の退職給付に充てるため、非積立型の確定給付制度及び確定拠出制度を採用して
おります。
確定給付制度では、退職給付として、給与と勤務期間に基づいた一時金を支給します。
2.確定給付制度
(1) 退職給付債務の期首残高と期末残高の調整表
前連結会計年度
2024年4月1日
2025年3月31日)
(自
至
退職給付債務の期首残高
当連結会計年度
2025年4月1日
2026年3月31日)
(自
至
3,773百万円
勤務費用
3,362百万円
197
利息費用
172
23
42
数理計算上の差異の発生額
△156
△279
退職給付の支払額
△472
△412
8
5
△13
−
3,362
2,891
期首残高の為替換算に伴う増減
その他
退職給付債務の期末残高
(2) 退職給付債務及び年金資産の期末残高と連結貸借対照表に計上された退職給付に係る負債及び退職給付に係る
資産の調整表
前連結会計年度
(2025年3月31日)
当連結会計年度
(2026年3月31日)
積立型制度の退職給付債務
−百万円
−百万円
年金資産
−
−
−
−
非積立型制度の退職給付債務
3,362
2,891
連結貸借対照表に計上された負債と資産の純額
3,362
2,891
退職給付に係る負債
3,362
2,891
退職給付に係る資産
連結貸借対照表に計上された負債と資産の純額
−
−
3,362
2,891
(3) 退職給付費用及びその内訳項目の金額
前連結会計年度
2024年4月1日
2025年3月31日)
(自
至
当連結会計年度
2025年4月1日
2026年3月31日)
(自
至
勤務費用
197百万円
172百万円
利息費用
23
42
数理計算上の差異の費用処理額
27
△1
過去勤務費用の費用処理額
−
△7
確定給付制度に係る退職給付費用
247
206
(4) 退職給付に係る調整額
退職給付に係る調整額に計上した項目(法人税等及び税効果控除前)の内訳は次のとおりであります。
前連結会計年度
(2025年3月31日)
当連結会計年度
(2026年3月31日)
過去勤務費用
−百万円
63百万円
数理計算上の差異
183
206
183
270
合
計
(5) 退職給付に係る調整累計額
退職給付に係る調整累計額に計上した項目(法人税等及び税効果控除前)の内訳は次のとおりであります。
67/97
EDINET提出書類
北陸電気工業株式会社(E01817)
有価証券報告書
前連結会計年度
(2025年3月31日)
当連結会計年度
(2026年3月31日)
未認識過去勤務費用
−百万円
63百万円
未認識数理計算上の差異
201
408
201
471
合
計
(6) 数理計算上の計算基礎に関する事項
主要な数理計算上の計算基礎(加重平均で表わしております。)
前連結会計年度
(2025年3月31日)
割引率
1.30%
当連結会計年度
(2026年3月31日)
2.43%
3.確定拠出制度
当社および連結子会社の確定拠出制度への要拠出額は、前連結会計年度105百万円、当連結会計年度110百万円で
あります。
68/97
EDINET提出書類
北陸電気工業株式会社(E01817)
有価証券報告書
(税効果会計関係)
1.繰延税金資産及び繰延税金負債の発生の主な原因別の内訳
前連結会計年度
(2025年3月31日)
当連結会計年度
(2026年3月31日)
繰延税金資産
貸倒引当金
10百万円
賞与引当金
4百万円
150
140
1,029
892
固定資産
158
169
減損損失
168
167
土地再評価損
109
109
棚卸資産評価損
192
185
投資有価証券評価損
31
27
退職給付引当金
未払事業税等
23
34
税務上の繰越欠損金(注)1
318
336
その他
178
245
繰延税金資産小計
2,369
2,314
税務上の繰越欠損金に係る評価性引当額(注)1
△269
△269
将来減算一時差異等の合計に係る評価性引当額
△463
△465
評価性引当額小計
△733
△735
繰延税金資産合計
1,636
1,579
土地再評価益
△319
△319
その他有価証券評価差額金
△158
△407
外国子会社の留保金
△319
△354
退職給与負債調整勘定
△86
△86
繰延税金負債
△28
△43
繰延税金負債合計
その他
△913
△1,211
繰延税金資産の純額
722
368
(注)1.税務上の繰越欠損金及びその繰延税金資産の繰越期限別の金額
前連結会計年度(2025年3月31日)
1年以内
(百万円)
1年超
2年以内
(百万円)
2年超
3年以内
(百万円)
3年超
4年以内
(百万円)
4年超
5年以内
(百万円)
5年超
(百万円)
合計
(百万円)
税務上の繰越欠損金(※1)
−
20
−
207
50
40
318
評価性引当額
−
△12
−
△167
△50
△40
△269
繰延税金資産
−
8
−
39
−
−
48
(※1) 税務上の繰越欠損金は、法定実効税率を乗じた額であります。
当連結会計年度(2026年3月31日)
1年以内
(百万円)
1年超
2年以内
(百万円)
2年超
3年以内
(百万円)
3年超
4年以内
(百万円)
4年超
5年以内
(百万円)
5年超
(百万円)
合計
(百万円)
税務上の繰越欠損金(※1)
−
−
226
52
10
47
336
評価性引当額
−
−
△160
△52
△10
△46
△269
繰延税金資産
−
−
66
−
−
0
67
(※1)
税務上の繰越欠損金は、法定実効税率を乗じた額であります。
69/97
EDINET提出書類
北陸電気工業株式会社(E01817)
有価証券報告書
2.法定実効税率と税効果会計適用後の法人税等の負担率との間に重要な差異があるときの、当該差異の原因となっ
た主要な項目別の内訳
前連結会計年度
当連結会計年度
(2025年3月31日)
(2026年3月31日)
法定実効税率
30.5%
30.5%
交際費等永久に損金に算入されない項目
0.6
0.5
住民税均等割等
0.5
0.7
△8.3
△0.8
(調整)
評価性引当額の増減
外国源泉税等
1.3
1.7
在外子会社の税率差異
△2.8
△2.9
税額控除
税率変動による差額
その他
△0.2
△1.1
0.2
△0.7
△0.4
0.3
税効果会計適用後の法人税等の負担率
20.7
28.9
(収益認識関係)
1.顧客との契約から生じる収益に関する重要な会計方針
①重要な事業における主な履行義務の内容
電子部品の製造販売であります。
②電子部品の製造販売における取引形態及び通常の収益認識時点
主に下記のとおり分類されます。
取引形態
通常の収益認識時点
国内販売
出荷日
輸出取引
船積日
預託取引
顧客使用日
2.顧客との契約から生じる収益を分解した情報
①各セグメントにおける主な履行義務の内容および収益認識の時期による区分は下記のとおりであります。
セグメント
主な履行義務の内容
電子部品
電子部品の製造販売
金型・機械装置
金型・機械装置の製造販売
その他(注)
㈱大泉製作所から仕入れた商品の販売
収益認識の時期による区分
一時点で移転される財
不動産の販売
保険代理業における手数料収入等
一定の期間にわたり移転されるサービス
(注)「その他」における不動産賃貸収入は、企業会計基準第13号「リース取引に関する会計基準」の範囲に含
まれるため、「顧客との契約から生じる収益」の対象から除外しております。
②上記区分ごとおよび地域ごとの売上高は、「注記事項(セグメント情報等)」をご参照ください。
なお、不動産賃貸収入は「その他の収益」として区分掲記しております。
3.顧客との契約から生じる収益を理解するための基礎となる情報
履行義務に関する情報としての財・サービスの内容は、[事業の内容]をご参照ください。
70/97
EDINET提出書類
北陸電気工業株式会社(E01817)
有価証券報告書
(セグメント情報等)
【セグメント情報】
1.報告セグメントの概要
(1)報告セグメントの決定方法
当社の報告セグメントは、当社グループ(当社及び連結子会社)の構成単位のうち分離された財務情報が入手可
能であり、当社の取締役会が、経営資源の配分の決定及び業績を評価するために、定期的に検討を行う対象となっ
ているものであります。
当社グループは、主として電子部品の製造・販売を事業としており、当社が電子部品事業について国内及び海外
の包括的な戦略を立案し、事業活動を展開しております。
一方、電子部品の製造に関連する金型・機械設備の製造・販売も事業の一端としておりますが、市場動向・営業
体制等が電子部品事業と異なるため、区別して管理を行っております。
従って、当社は、「電子部品」及び「金型・機械設備」の2つを報告セグメントとしております。
(2)各セグメントに属する製品及びサービスの種類
「電子部品」は、抵抗器、モジュール製品、電子デバイス及び回路基板等を製造・販売しております。
「金型・機械設備」は、金型・機械設備の製造・販売及びその保守業務を行っております。
2.報告セグメントごとの売上高、利益又は損失、資産、負債その他の項目の金額の算定方法
報告されている事業セグメントの会計処理の方法は、「連結財務諸表作成のための基本となる重要な事項」にお
ける記載と概ね同一であります。報告セグメントの利益は、営業利益ベースの数値であります。セグメント間の内
部収益及び振替高は市場実勢価格に基づいております。
3.報告セグメントごとの売上高、利益又は損失、資産、負債その他の項目の金額に関する情報
前連結会計年度(自
2024年4月1日
至
2025年3月31日)
報告セグメント
売上高
一時点で移転される財
一定の期間にわたり移
転されるサービス
顧客との契約から生じ
る収益(注)4
その他の収益(注)5
外部顧客への売上高
セグメント間の内部
売上高又は振替高
計
セグメント利益
セグメント資産
セグメント負債
その他の項目
減価償却費
有形固定資産及び
無形固定資産の増加額
その他
(注)1
(単位:百万円)
連結
調整額
財務諸表
(注)2
計上額
(注)3
合計
電子部品
金型・
機械設備
42,197
526
42,724
324
43,049
−
43,049
10
−
10
68
78
−
78
42,207
526
42,734
393
43,127
−
43,127
−
42,207
−
526
−
42,734
57
451
57
43,185
−
−
57
43,185
−
171
171
122
293
△293
−
42,207
3,654
38,006
11,969
697
54
509
714
42,905
3,709
38,515
12,684
573
114
1,838
352
43,479
3,823
40,354
13,037
△293
△1,222
2,841
7,444
43,185
2,600
43,195
20,482
826
12
839
69
908
117
1,026
1,038
−
1,038
19
1,058
70
1,128
計
71/97
EDINET提出書類
北陸電気工業株式会社(E01817)
有価証券報告書
当連結会計年度(自
2025年4月1日
至
2026年3月31日)
報告セグメント
売上高
一時点で移転される財
一定の期間にわたり移
転されるサービス
顧客との契約から生じ
る収益(注)4
その他の収益(注)5
外部顧客への売上高
セグメント間の内部
売上高又は振替高
計
セグメント利益
セグメント資産
セグメント負債
その他の項目
減価償却費
有形固定資産及び
無形固定資産の増加額
その他
(注)1
(単位:百万円)
連結
調整額
財務諸表
(注)2
計上額
(注)3
合計
電子部品
金型・
機械設備
42,265
445
42,711
279
42,991
−
42,991
9
−
9
68
78
−
78
42,275
445
42,721
348
43,069
−
43,069
−
42,275
−
445
−
42,721
58
407
58
43,128
−
−
58
43,128
−
319
319
129
448
△448
−
42,275
3,467
40,589
12,373
765
110
501
657
43,040
3,577
41,090
13,031
536
57
1,847
371
43,577
3,634
42,938
13,403
△448
△1,323
3,239
6,956
43,128
2,311
46,177
20,359
951
3
954
93
1,047
110
1,158
1,677
16
1,693
87
1,780
110
1,890
計
(注)1.「その他」の区分は、報告セグメントに含まれない事業セグメントであり、商品仕入(㈱大泉製作
所製品)及び不動産・保険代理業に係る事業であります。
2.調整額の内容は以下のとおりであります。
セグメント利益
(単位:百万円)
前連結会計年度
セグメント間取引消去
全社費用※
当連結会計年度
60
△1,283
65
△1,388
合計
△1,222
△1,323
※全社費用は、主に報告セグメント及びその他に帰属しない一般管理費であります。
セグメント資産
(単位:百万円)
前連結会計年度
セグメント間取引消去
全社資産※
当連結会計年度
△212
3,054
△132
3,371
合計
2,841
3,239
※全社資産は、主に当社保有の投資有価証券及び本社等の建物とソフトウエアであります。
セグメント負債
(単位:百万円)
前連結会計年度
当連結会計年度
セグメント間取引消去
全社負債※
△520
7,964
△538
7,494
合計
※全社負債は、主に当社の長期借入金であります。
減価償却費
7,444
6,956
(単位:百万円)
前連結会計年度
固定資産の調整額
全社費用※
当連結会計年度
△25
143
△34
145
合計
117
※全社費用は、主に本社等の建物及びソフトウエアの減価償却であります。
有形固定資産及び無形固定資産の増加額
前連結会計年度
固定資産の調整額
全社※
(単位:百万円)
当連結会計年度
△19
89
合計
70
※全社は、主に本社等におけるソフトウエア及び建物の取得であります。
3.セグメント利益は、連結財務諸表の営業利益と調整を行っております。
72/97
110
△24
134
110
EDINET提出書類
北陸電気工業株式会社(E01817)
有価証券報告書
4.「顧客との契約から生じる収益」は、企業会計基準第29号「収益認識に関する会計基準」の対象と
なる顧客との契約から生じる収益であります。
5.「その他の収益」は、顧客との契約から生じる収益のうち、収益認識会計基準等の適用範囲外とさ
れている、企業会計基準第13号「リース取引に関する会計基準」の範囲に含まれる不動産賃貸収入
であります。
【関連情報】
前連結会計年度(自 2024年4月1日
1.製品及びサービスごとの情報
至
2025年3月31日)
(単位:百万円)
電子部品
外部顧客への売上高
金型・機械設備
42,207
その他
526
合計
451
43,185
2.地域ごとの情報
(1)売上高
(単位:百万円)
日本
アジア
その他
合計
21,768
20,306
1,110
43,185
(注)1.売上高は顧客の所在地を基礎とし、国又は地域に分類しております。
2.「アジア」につきましては、一区分として管理しており、各国の外部顧客への売上高を区分することは困難
であるため、国ごとの金額は記載しておりませんが、中国および東南アジア諸国が主体であります。
(2)有形固定資産
(単位:百万円)
日本
アジア
その他
6,446
(注)アジアのうち、中国は897百万円です。
3.主要な顧客ごとの情報
2,092
合計
0
8,539
(単位:百万円)
相手先
売上高
関連するセグメント名
無錫夏普電子元器件㈲
7,777 電子部品
(注)無錫夏普電子元器件㈲の所在地は中国であり、当該顧客への売上高は、2.地域ごとの情報(1)売上高のアジア
に含まれております。
当連結会計年度(自 2025年4月1日
1.製品及びサービスごとの情報
至
2026年3月31日)
(単位:百万円)
電子部品
外部顧客への売上高
金型・機械設備
42,275
その他
445
合計
407
43,128
2.地域ごとの情報
(1)売上高
(単位:百万円)
日本
アジア
その他
合計
23,468
18,638
1,021
43,128
(注)1.売上高は顧客の所在地を基礎とし、国又は地域に分類しております。
2.「アジア」につきましては、一区分として管理しており、各国の外部顧客への売上高を区分することは困難
であるため、国ごとの金額は記載しておりませんが、中国および東南アジア諸国が主体であります。
(2)有形固定資産
(単位:百万円)
日本
アジア
6,774
(注)アジアのうち、中国は875百万円です。
3.主要な顧客ごとの情報
その他
2,601
合計
0
9,376
(単位:百万円)
相手先
売上高
関連するセグメント名
無錫夏普電子元器件㈲
6,592 電子部品
(注)無錫夏普電子元器件㈲の所在地は中国であり、当該顧客への売上高は、2.地域ごとの情報(1)売上高のアジア
に含まれております。
73/97
EDINET提出書類
北陸電気工業株式会社(E01817)
有価証券報告書
【報告セグメントごとの固定資産の減損損失に関する情報】
前連結会計年度(自 2024年4月1日至 2025年3月31日)
電子部品
減損損失
当連結会計年度(自
金型・機械設備
233
−
2025年4月1日
至
電子部品
減損損失
その他
−
233
−
2026年3月31日)
金型・機械設備
41
(単位:百万円)
合計
全社・消去
その他
−
(単位:百万円)
合計
全社・消去
−
41
−
【報告セグメントごとののれんの償却額及び未償却残高に関する情報】
前連結会計年度(自 2024年4月1日至 2025年3月31日)
該当事項はありません。
当連結会計年度(自 2025年4月1日
該当事項はありません。
至
2026年3月31日)
【関連当事者情報】
該当事項はありません。
(1株当たり情報)
前連結会計年度
(自 2024年4月1日
至 2025年3月31日)
当連結会計年度
(自 2025年4月1日
至 2026年3月31日)
2,863.49円
3,290.86円
270.78円
253.15円
1株当たり純資産額
1株当たり当期純利益金額
(注)1.潜在株式調整後1株当たり当期純利益金額については、潜在株式が存在しないため記載しておりません。
2.1株当たり純資産額の算定上の基礎は、次のとおりであります。
前連結会計年度
(2025年3月31日)
純資産の部の合計額(百万円)
純資産の部の合計額から控除する金額
(百万円)
(うち非支配株主持分(百万円))
当連結会計年度
(2026年3月31日)
22,713
25,817
−
−
(−)
(−)
普通株式に係る期末の純資産額(百万円)
22,713
25,817
1株当たり純資産額の算定に用いられた期末の
普通株式の数(千株)
7,932
7,845
3.1株当たり当期純利益金額の算定上の基礎は、次のとおりであります。
前連結会計年度
(自 2024年4月1日
至 2025年3月31日)
当連結会計年度
(自 2025年4月1日
至 2026年3月31日)
親会社株主に帰属する当期純利益金額
(百万円)
2,194
1,986
普通株主に帰属しない金額(百万円)
−
−
普通株式に係る親会社株主に帰属する
当期純利益金額(百万円)
2,194
1,986
普通株式に係る期中平均株式数(千株)
8,105
7,848
(重要な後発事象)
該当事項はありません。
74/97
EDINET提出書類
北陸電気工業株式会社(E01817)
有価証券報告書
⑤【連結附属明細表】
【借入金等明細表】
当期首残高当期末残高
(百万円) (百万円)
区分
平均利率
(%)
返済期限
短期借入金
1年以内に返済予定の長期借入金
1年以内に返済予定のリース債務
長期借入金(1年以内に返済予定のものを除く)
リース債務(1年以内に返済予定のものを除く)
600
2,809
121
5,326
157
1,400
2,711
204
4,923
328
1.4
0.9
−
1.1
−
−
−
−
2027年4月〜2030年12月
2027年4月〜2032年10月
合計
9,016
9,567
−
−
(注)1.「平均利率」については、借入金等の当期末残高に対する加重平均利率を記載しております。
なお、リース債務の「平均利率」については、一部の連結子会社がリース料総額に含まれる利息相当額を控
除する前の金額でリース債務を連結貸借対照表に計上しており、また、リース契約が多岐にわたり平均利率
の算出が困難であるため、記載しておりません。
2.長期借入金及びリース債務(1年以内に返済予定のものを除く)の連結決算日後5年内における返済予定額
は次のとおりであります。
1年超2年以内
(百万円)
2年超3年以内
(百万円)
3年超4年以内
(百万円)
4年超5年以内
(百万円)
長期借入金
2,175
1,560
865
321
リース債務
127
77
69
40
【資産除去債務明細表】
該当事項はありません。
(2) 【その他】
当連結会計年度における半期情報等
中間連結会計期間
当連結会計年度
売上高(百万円)
20,633
43,128
税金等調整前中間(当期)純利益金額
(百万円)
1,460
2,792
親会社株主に帰属する中間(当期)純
利益金額(百万円)
1,051
1,986
1株当たり中間(当期)純利益金額
(円)
133.98
253.15
75/97
EDINET提出書類
北陸電気工業株式会社(E01817)
有価証券報告書
2【財務諸表等】
(1)【財務諸表】
①【貸借対照表】
(単位:百万円)
前事業年度
(2025年3月31日)
資産の部
流動資産
現金及び預金
受取手形
電子記録債権
売掛金
商品及び製品
仕掛品
原材料及び貯蔵品
関係会社短期貸付金
未収入金
前払費用
その他
貸倒引当金
流動資産合計
固定資産
有形固定資産
建物
構築物
機械及び装置
車両運搬具
工具、器具及び備品
土地
建設仮勘定
有形固定資産合計
無形固定資産
投資その他の資産
投資有価証券
関係会社株式
長期貸付金
繰延税金資産
その他
貸倒引当金
投資その他の資産合計
固定資産合計
資産合計
76/97
当事業年度
(2026年3月31日)
3,122
8
550
※2 7,096
605
1,878
13
※2 12
※2 2,035
13
34
△7
15,363
3,066
−
940
※2 7,328
382
2,451
14
※2 549
※2 2,666
27
3
△59
17,371
※1,※5 1,191
※1,※5 1,196
※1 72
※1 89
※1,※5 1,685
※1,※5 1,897
2
88
※1 1,851
1
4,894
197
1
137
※1 1,851
4
5,178
193
1,395
9,915
※2 508
1,124
1,092
△387
13,648
18,740
34,104
2,153
9,915
※2 22
862
723
△311
13,365
18,737
36,109
EDINET提出書類
北陸電気工業株式会社(E01817)
有価証券報告書
(単位:百万円)
前事業年度
(2025年3月31日)
負債の部
流動負債
電子記録債務
買掛金
短期借入金
未払法人税等
未払金
賞与引当金
その他
流動負債合計
固定負債
長期借入金
再評価に係る繰延税金負債
退職給付引当金
その他
固定負債合計
負債合計
純資産の部
株主資本
資本金
資本剰余金
資本準備金
その他資本剰余金
資本剰余金合計
利益剰余金
利益準備金
その他利益剰余金
繰越利益剰余金
利益剰余金合計
自己株式
株主資本合計
評価・換算差額等
その他有価証券評価差額金
土地再評価差額金
評価・換算差額等合計
純資産合計
負債純資産合計
77/97
当事業年度
(2026年3月31日)
83
65
※2 4,577
※2 4,337
※1,※4 3,378
※1,※4 4,079
124
481
※2 1,074
※2 1,175
399
319
9,958
365
342
10,848
※1 5,186
※1 4,814
319
3,284
38
8,828
18,787
319
3,072
108
8,315
19,163
5,200
5,200
462
3,564
4,027
462
3,568
4,031
532
604
5,539
6,072
△736
14,563
6,659
7,263
△861
15,632
400
352
753
15,316
34,104
959
352
1,312
16,945
36,109
EDINET提出書類
北陸電気工業株式会社(E01817)
有価証券報告書
②【損益計算書】
(単位:百万円)
(自
至
前事業年度
2024年4月1日
2025年3月31日)
(自
至
当事業年度
2025年4月1日
2026年3月31日)
売上高
※1 36,361
※1 37,197
売上原価
売上総利益
※1 30,858
※1 31,783
5,503
※2 3,799
※2 3,984
1,703
1,429
※1 631
※1 663
※1 251
※1 227
−
23
906
301
82
1,273
60
27
148
74
38
349
2,260
76
34
123
−
47
281
2,421
0
−
※3 155
44
9
209
1
107
−
57
7
173
−
36
48
244
−
3
331
2,137
291
0
291
1,845
41
34
1
−
30
−
108
2,486
569
12
581
1,904
販売費及び一般管理費
営業利益
営業外収益
受取利息及び受取配当金
設備賃貸料
為替差益
その他
営業外収益合計
営業外費用
支払利息
債権売却損
貸与資産減価償却費
為替差損
その他
営業外費用合計
経常利益
特別利益
固定資産売却益
投資有価証券売却益
取引先関連事業損失戻入益
保険解約返戻金
その他
特別利益合計
特別損失
減損損失
固定資産除却損
投資有価証券評価損
貸倒引当金繰入額
保険解約損
その他
特別損失合計
税引前当期純利益
法人税、住民税及び事業税
法人税等調整額
法人税等合計
当期純利益
78/97
5,413
EDINET提出書類
北陸電気工業株式会社(E01817)
有価証券報告書
③【株主資本等変動計算書】
前事業年度(自 2024年4月1日
至
2025年3月31日)
(単位:百万円)
株主資本
資本剰余金
資本金
資本準備金
当期首残高
5,200
462
利益剰余金
その他利益剰
余金
自己株式
株主資本合計
その他資本剰
余金
利益準備金
4,643
483
4,232
48
△538
△489
1,845
1,845
繰越利益剰余
金
△1,450
13,572
当期変動額
剰余金の配当
当期純利益
自己株式の取得
△374
△374
自己株式の処分
0
8
9
自己株式の消却
△1,079
1,079
−
株主資本以外の項目の当期
変動額(純額)
当期変動額合計
当期末残高
−
−
△1,079
48
1,307
714
991
5,200
462
3,564
532
5,539
△736
14,563
評価・換算差額等
当期首残高
その他有価証
券評価差額金
土地再評価差
額金
評価・換算差
額等合計
387
361
748
純資産合計
14,321
当期変動額
剰余金の配当
△489
当期純利益
1,845
自己株式の取得
△374
自己株式の処分
9
自己株式の消却
−
株主資本以外の項目の当期
変動額(純額)
13
△9
4
4
当期変動額合計
13
△9
4
995
当期末残高
400
352
753
15,316
79/97
EDINET提出書類
北陸電気工業株式会社(E01817)
有価証券報告書
当事業年度(自
2025年4月1日
至
2026年3月31日)
(単位:百万円)
株主資本
資本剰余金
資本金
資本準備金
当期首残高
5,200
462
利益剰余金
その他利益剰
余金
自己株式
株主資本合計
その他資本剰
余金
利益準備金
3,564
532
5,539
71
△785
△713
1,904
1,904
繰越利益剰余
金
△736
14,563
当期変動額
剰余金の配当
当期純利益
自己株式の取得
自己株式の処分
3
△131
△131
5
9
自己株式の消却
−
株主資本以外の項目の当期
変動額(純額)
当期変動額合計
当期末残高
−
−
3
71
1,119
△125
1,069
5,200
462
3,568
604
6,659
△861
15,632
評価・換算差額等
当期首残高
その他有価証
券評価差額金
土地再評価差
額金
評価・換算差
額等合計
400
352
753
純資産合計
15,316
当期変動額
剰余金の配当
△713
当期純利益
1,904
自己株式の取得
△131
自己株式の処分
9
自己株式の消却
−
株主資本以外の項目の当期
変動額(純額)
559
559
559
当期変動額合計
559
−
559
1,628
当期末残高
959
352
1,312
16,945
80/97
EDINET提出書類
北陸電気工業株式会社(E01817)
有価証券報告書
【注記事項】
(重要な会計方針)
1.資産の評価基準及び評価方法
(1) 有価証券
①子会社株式及び関連会社株式……………移動平均法による原価法
②その他有価証券
市場価格のない株式等以外のもの………時価法(評価差額は全部純資産直入法により処理し、売却原価は移動
平均法により算定)
市場価格のない株式等……………………移動平均法による原価法
(2) デリバティブ………………………………時価法
(3) 棚卸資産
商品及び製品・仕掛品………………………総平均法による原価法(収益性の低下による簿価切下げの方法)
原材料及び貯蔵品……………………………先入先出法による原価法(収益性の低下による簿価切下げの方法)
2.固定資産の減価償却の方法
(1) 有形固定資産(除くリース資産)………定率法
(2) 無形固定資産(除くリース資産)………定額法
なお、自社利用のソフトウエアについては、社内における利用可能期
間(5年)に基づく定額法を採用しております。
(3) リース資産
所有権移転外ファイナンス・リース取引に係るリース資産
リース期間を耐用年数として、残存価額を零とする定額法を採用して
おります。
3.引当金の計上基準
(1) 貸倒引当金…………………………………債権の貸倒損失に備えるため、一般債権については貸倒実績率によ
り、貸倒懸念債権等特定の債権については個別に回収可能性を検討
し、回収不能見込額を計上しております。
(2) 賞与引当金…………………………………従業員に対して支給する賞与の支出に充てるため、支給見込額の当期
負担額を計上しております。
(3) 退職給付引当金……………………………従業員の退職給付に備えるため、当事業年度末における退職給付債務
の見込額に基づき計上しております。
退職給付債務の算定にあたり、退職給付見込額を当事業年度末までの
期間に帰属させる方法については、期間定額基準によっております。
過去勤務費用は、その発生時の従業員の平均残存勤務期間以内の一定
の年数(10年)による定額法により費用処理しております。
数理計算上の差異は、各事業年度の発生時における従業員の平均残存
勤務期間以内の一定の年数(10年)による定額法により按分した額
を、それぞれ発生の翌事業年度から費用処理しております。
4.収益及び費用の計上基準……………………商品又は製品の販売に係る収益は、主に製造等による販売であり、顧
客との販売契約に基づいて商品又は製品を引き渡す履行義務を負って
おります。
当該履行義務は、商品又は製品を引き渡す一時点において、顧客が当
該商品又は製品に対する支配を獲得して充足されると判断し、引渡時
点で収益を認識しております。
当社が代理人として商品の販売に関与している場合には、純額で収益
を認識しております。
5.その他財務諸表作成のための基本となる重要な事項
(1) ヘッジ会計の処理…………………………振当処理の要件を満たしている為替予約については振当処理によって
おります。
(2) 退職給付に係る会計処理…………………退職給付に係る未認識数理計算上の差異及び未認識過去勤務費用の未
処理額の会計処理の方法は、連結財務諸表におけるこれらの会計処理
の方法と異なっております。
81/97
EDINET提出書類
北陸電気工業株式会社(E01817)
有価証券報告書
(重要な会計上の見積り)
会計上の見積りにより当事業年度に係る財務諸表にその額を計上した項目であって、翌事業年度に係る財務諸表に重
要な影響を及ぼす可能性があるものは次のとおりであります。
(単位:百万円)
前事業年度
商品及び製品
仕掛品
原材料及び貯蔵品
繰延税金資産
当事業年度
605
382
1,878
2,451
13
14
1,369
1,356
(注)繰延税金資産は繰延税金負債と相殺前の金額であります。
①棚卸資産(商品及び製品、仕掛品、原材料及び貯蔵品)
棚卸資産の評価において、期末における正味売却価額が取得原価よりも下落している場合には当該正味売却価額
をもって貸借対照表価額とする一方、営業循環過程から外れた棚卸資産については、正味売却価額まで切り下げる
方法に代えて、滞留期間に応じて規則的に帳簿価額を切り下げ、収益性の低下の事実を反映させる方法を採用して
おります。また、滞留期間に応じた規則的な帳簿価額の切下げにおきましては、滞留期間ごとの簿価切下率の基準
を設定しており、当該基準に使用する滞留期間は、棚卸資産の種類に基づき、入庫日、工程投入日又は最終出荷日
を基準日として算定しております。ただし、収益性の低下が認められないことが明らかな棚卸資産については、そ
の根拠を検討したうえで、上記の簿価切下げの対象から除外しております。
営業循環過程から外れた棚卸資産の簿価切下げの方法の採用及び基準の設定については、過去の廃棄実績及び出
荷実績との整合性を検証することで、また、簿価切下げの対象からの除外に当たっては、収益性の低下が認められ
ない根拠を確認することで、それらの妥当性を図っております。
電子部品業界は技術革新のスピードが速く、価格競争が激しいことから、将来の需要等の市場環境が予測より悪
化し、棚卸資産の収益性が低下した場合には、簿価切下げが必要となる場合があります。
②繰延税金資産
繰延税金資産の回収可能性については、納税主体ごとに、「繰延税金資産の回収可能性に関する適用指針」に基
づき企業の分類を行い、当該分類に基づき判断しております。
また、将来減算一時差異および税務上の繰越欠損金に係る繰延税金資産の回収可能額は、過年度における課税所
得の実績および事業計画を基礎として算定しております。
経営環境の変化等により、将来の課税所得の金額が見積りと異なる場合には、繰延税金資産の金額に影響を与え
る可能性があります。
(貸借対照表関係)
※1 担保に供している資産及び担保に係る債務
担保に供している資産
前事業年度
(2025年3月31日)
建物及び構築物
機械及び装置
土地
当事業年度
(2026年3月31日)
589百万円
196
1,501
571百万円
166
1,501
2,287
2,239
前事業年度
(2025年3月31日)
当事業年度
(2026年3月31日)
計
担保に係る債務
短期借入金
長期借入金
計
※2
2,077百万円
4,182
2,364百万円
3,954
6,259
6,319
関係会社に対する金銭債権及び金銭債務(区分表示したものを除く)
前事業年度
(2025年3月31日)
短期金銭債権
長期金銭債権
短期金銭債務
3,494百万円
508
844
82/97
当事業年度
(2026年3月31日)
4,852百万円
22
772
EDINET提出書類
北陸電気工業株式会社(E01817)
有価証券報告書
3
保証債務
次の関係会社等について、金融機関からの借入およびリースに対し債務保証を行っております。
前事業年度
(2025年3月31日)
北陸興産㈱
HDKタイランド㈱
ダイワ電機精工㈱
その他
計
当事業年度
(2026年3月31日)
171百万円
146
2
0
140百万円
287
1
0
321
429
※4
当座貸越契約
当社は、運転資金の効率的な調達を行うため、取引銀行4行と当座貸越契約を締結しております。当事業年度末
における当座貸越契約に係る借入未実行残高等は次のとおりであります。
前事業年度
(2025年3月31日)
当座貸越極度額の総額
借入実行残高
差引額
※5
当事業年度
(2026年3月31日)
7,500百万円
600
7,500百万円
1,400
6,900
6,100
圧縮記帳額
国庫補助金等により固定資産の取得金額から控除している圧縮記帳額は次のとおりであります。
前事業年度
(2025年3月31日)
建物
機械及び装置
計
83/97
当事業年度
(2026年3月31日)
68百万円
68百万円
215
215
283
283
EDINET提出書類
北陸電気工業株式会社(E01817)
有価証券報告書
(損益計算書関係)
※1 関係会社との取引高
前事業年度
(自 2024年4月1日
至 2025年3月31日)
営業取引による取引高
(自
至
当事業年度
2025年4月1日
2026年3月31日)
売上高
14,369百万円
13,373百万円
仕入高
8,482
8,457
営業取引以外の取引による取引高
資産売却高
65
−
資産購入高
136
269
1,352
1,388
その他
※2
販売費に属する費用のおおよその割合は前事業年度19%、当事業年度20%、一般管理費に属する費用のおおよそ
の割合は前事業年度81%、当事業年度80%であります。
販売費及び一般管理費のうち主要な費目及び金額は次のとおりであります。
前事業年度
当事業年度
(自 2024年4月1日
(自 2025年4月1日
至 2025年3月31日)
至 2026年3月31日)
従業員給料及び賞与
915百万円
981百万円
122
112
賞与引当金繰入額
53
45
退職給付費用
143
145
減価償却費
1,621
1,579
研究開発費
※3
取引先関連事業損失戻入益
2022年度において顧客の民事再生手続開始の申立てに伴い、取引先関連事業損失2,004百万円を計上しました
が、前事業年度は棚卸資産の評価損、部材等の発注残に係る損失の一部を戻入れ、当事業年度は売掛金に対する貸
倒引当金の一部を戻入れたものであります。
(有価証券関係)
子会社株式及び関連会社株式(当事業年度の貸借対照表計上額は子会社株式9,915百万円、前事業年度の貸借対照
表計上額は子会社株式9,915百万円)は、市場価格がなく、時価を把握することが極めて困難と認められることか
ら、記載しておりません。
84/97
EDINET提出書類
北陸電気工業株式会社(E01817)
有価証券報告書
(税効果会計関係)
1.繰延税金資産及び繰延税金負債の発生の主な原因別の内訳
前事業年度
(2025年3月31日)
当事業年度
(2026年3月31日)
貸倒引当金損金算入限度超過額
123百万円
116百万円
賞与引当金損金算入限度超過額
121
114
1,029
963
74
81
繰延税金資産
退職給付引当金損金算入限度超過額
固定資産償却限度超過額
減損損失
55
54
土地再評価損
109
109
棚卸資産評価損
61
52
投資有価証券評価損
31
27
関係会社株式評価損否認額
835
835
その他
156
221
繰延税金資産小計
2,600
2,576
△1,231
△1,220
評価性引当額小計
△1,231
△1,220
繰延税金資産合計
1,369
1,356
土地再評価益
△319
△319
その他有価証券評価差額金
△158
△407
退職給与負債調整勘定
△86
△86
繰延税金負債合計
△564
△813
繰延税金資産の純額
804
542
将来減算一時差異等の合計に係る評価性引当額
繰延税金負債
2.法定実効税率と税効果会計適用後の法人税等の負担率との間に重要な差異があるときの、当該差異の原因となっ
た主要な項目別の内訳
前事業年度
当事業年度
(2025年3月31日)
(2026年3月31日)
法定実効税率
30.5%
30.5%
(調整)
交際費等永久に損金に算入されない項目
0.8
0.6
住民税均等割等
0.6
0.6
評価性引当額の増減
△10.2
△0.5
受取配当等の益金不算入等
税率変動による差額
その他
△6.3
△1.4
△0.3
△6.6
△0.4
△0.8
税効果会計適用後の法人税等の負担率
13.7
23.4
(収益認識関係)
顧客との契約から生じる収益を理解するための基礎となる情報は、連結財務諸表「注記事項(収益認識関係)」に
同一の内容を記載しているため、注記を省略しております。
(重要な後発事象)
該当事項はありません。
85/97
EDINET提出書類
北陸電気工業株式会社(E01817)
有価証券報告書
④【附属明細表】
【有形固定資産等明細表】
(単位:百万円)
当期首残高
当期増加額
当期減少額
当期末残高
当期末減価
償却累計額
及び減損損
失累計額
建物
7,084
144
135
7,093
5,896
130
1,196
構築物
666
28
19
675
585
10
89
14,721
614
1,213
14,122
12,225
343
(40)
1,897
20
−
4
16
14
0
1
工具、器具及び備品
1,088
107
233
961
824
47
137
土地
1,851
[672]
−
−
1,851
[672]
−
−
1,851
1
2
−
4
−
−
4
25,434
897
1,606
24,725
19,546
532
5,178
ソフトウエア
583
82
28
637
452
86
184
その他
20
−
−
20
11
−
8
無形固定資産計
605
82
28
658
464
86
193
資産の種類
当期償却額
差引当期末
残高
有形固定資産
機械及び装置
車両運搬具
建設仮勘定
有形固定資産計
無形固定資産
(注)1.「当期償却費」欄の( )内は内書きで、減損損失の計上額であります。
2.「当期首残高」および「当期末残高」欄の[ ]内は内書きで、土地の再評価に関する法律(平成10年法律
第34号)により行った土地の再評価実施前の帳簿価額との差額であります。
3.機械及び装置の主な増加額は、研究開発設備345百万円、抵抗器製造設備77百万円、モジュール製造設備75
百万円、電子デバイス製造設備70百万円、管理設備45百万円であります。
4.機械及び装置の主な減少額は、回路基板製造設備901百万円、抵抗器製造設備162百万円、モジュール製造設
備71百万円、管理設備47百万円、研究開発設備19百万円、電子デバイス製造設備10百万円であります。
【引当金明細表】
(単位:百万円)
科目
当期首残高
当期増加額
当期減少額
当期末残高
貸倒引当金
394
59
83
370
賞与引当金
399
365
399
365
(2) 【主な資産及び負債の内容】
連結財務諸表を作成しているため、記載を省略しております。
(3) 【その他】
該当事項はありません。
86/97
EDINET提出書類
北陸電気工業株式会社(E01817)
有価証券報告書
第6【提出会社の株式事務の概要】
事業年度
4月1日から3月31日まで
定時株主総会
6月中
基準日
3月31日
剰余金の配当の基準日
9月30日
3月31日
1単元の株式数
100株
単元未満株式の買取り
取扱場所
(特別口座)
株主名簿管理人
東京都千代田区丸の内1丁目4番5号
(特別口座)
東京都千代田区丸の内1丁目4番5号
取次所
買取手数料
三菱UFJ信託銀行株式会社証券代行部
三菱UFJ信託銀行株式会社
−
株式の売買の委託に係る手数料相当額として別途定める金額
公告掲載方法
電子公告により行います。ただし電子公告によることができない事故その他やむを得
ない事由が生じたときは、日本経済新聞に掲載して行います。
公告掲載URL(https://www.hdk.co.jp/japanese/financ̲j/fnc007̲j.htm)
株主に対する特典
該当事項はありません。
(注)当社定款の定めにより、当社の株主は、その有する単元未満株式について、次に掲げる権利以外の権利を行使す
ることはできません。
会社法第189条第2項各号に掲げる権利
取得請求権付株式の取得を請求する権利
募集株式または募集新株予約権の割当てを受ける権利
87/97
EDINET提出書類
北陸電気工業株式会社(E01817)
有価証券報告書
第7【提出会社の参考情報】
1【提出会社の親会社等の情報】
当社は、金融商品取引法第24条の7第1項に規定する親会社等はありません。
2【その他の参考情報】
当事業年度の開始日から有価証券報告書の提出日までの間に、次の書類を提出しております。
(1)有価証券報告書及びその添付書類並びに確認書
事業年度(第91期)(自 2024年4月1日至 2025年3月31日)2025年6月26日関東財務局長に提出
(2)内部統制報告書及びその添付書類
2025年6月26日関東財務局長に提出
(3)半期報告書及び確認書
(第92期中)(自 2025年4月1日
至
2025年9月30日)2025年11月12日関東財務局長に提出
(4)臨時報告書
2025年7月2日関東財務局長に提出
企業内容等の開示に関する内閣府令第19条第2項第9号の2(株主総会における議決権行使の結果)に基づく臨時
報告書であります。
2025年11月14日関東財務局長に提出
企業内容等の開示に関する内閣府令第19条第2項第4号(主要株主の異動)に基づく臨時報告書であります。
(5)自己株券買付状況報告書
報告期間(自 2025年6月1日
至
2025年6月30日)2025年7月10日関東財務局長に提出
88/97
EDINET提出書類
北陸電気工業株式会社(E01817)
有価証券報告書
第二部【提出会社の保証会社等の情報】
該当事項はありません。
89/97
EDINET提出書類
北陸電気工業株式会社(E01817)
有価証券報告書
独立監査人の監査報告書及び内部統制監査報告書
2026年6月25日
北陸電気工業株式会社
取締役会
御中
太陽有限責任監査法人
北陸事務所
指定有限責任社員
公認会計士
業務執行社員
秋
田
秀
樹
指定有限責任社員
公認会計士
業務執行社員
南
波
洋
行
<連結財務諸表監査>
監査意見
当監査法人は、金融商品取引法第193条の2第1項の規定に基づく監査証明を行うため、「経理の状況」に掲げられて
いる北陸電気工業株式会社の2025年4月1日から2026年3月31日までの連結会計年度の連結財務諸表、すなわち、連結
貸借対照表、連結損益計算書、連結包括利益計算書、連結株主資本等変動計算書、連結キャッシュ・フロー計算書、連
結財務諸表作成のための基本となる重要な事項、その他の注記及び連結附属明細表について監査を行った。
当監査法人は、上記の連結財務諸表が、我が国において一般に公正妥当と認められる企業会計の基準に準拠して、北
陸電気工業株式会社及び連結子会社の2026年3月31日現在の財政状態並びに同日をもって終了する連結会計年度の経営
成績及びキャッシュ・フローの状況を、全ての重要な点において適正に表示しているものと認める。
監査意見の根拠
当監査法人は、我が国において一般に公正妥当と認められる監査の基準に準拠して監査を行った。監査の基準におけ
る当監査法人の責任は、「連結財務諸表監査における監査人の責任」に記載されている。当監査法人は、我が国におけ
る職業倫理に関する規定(社会的影響度の高い事業体の財務諸表監査に適用される規定を含む。)に従って、会社及び
連結子会社から独立しており、また、監査人としてのその他の倫理上の責任を果たしている。当監査法人は、意見表明
の基礎となる十分かつ適切な監査証拠を入手したと判断している。
監査上の主要な検討事項
監査上の主要な検討事項とは、当連結会計年度の連結財務諸表の監査において、監査人が職業的専門家として特に重要
であると判断した事項である。監査上の主要な検討事項は、連結財務諸表全体に対する監査の実施過程及び監査意見の形
成において対応した事項であり、当監査法人は、当該事項に対して個別に意見を表明するものではない。
90/97
EDINET提出書類
北陸電気工業株式会社(E01817)
有価証券報告書
棚卸資産の評価
監査上の主要な検討事項の内容及び決定理由
監査上の対応
会社は、2026年3月31日現在、連結貸借対照表に棚卸資
産8,868百万円を計上しており、【注記事項】(重要な会
計上の見積り)及び(連結損益計算書関係)において関連
する開示を行っている。
会社は、棚卸資産の評価において、期末における正味売
却価額が取得原価よりも下落している場合には、当該正味
売却価額をもって連結貸借対照表価額とする一方、営業循
環過程から外れた棚卸資産については、正味売却価額まで
切り下げる方法に代えて、滞留期間に応じて規則的に帳簿
価額を切り下げ、収益性の低下の事実を反映させる方法を
採用している。
会社は、滞留期間に応じた規則的な帳簿価額の切下げに
おいて、滞留期間ごとの簿価切下率の基準を設定してい
る。また、当該基準に使用する滞留期間は、棚卸資産の種
類に基づき、入庫日、工程投入日又は最終出荷日を基準日
として算定されている。
棚卸資産の評価は連結財務諸表に重要な影響を及ぼすこ
とに加え、上記の営業循環過程から外れた棚卸資産の簿価
切下げの方法の採用及び基準の設定には経営者の重要な判
断が介在することから、当監査法人は、当該事項を監査上
の主要な検討事項とした。
当監査法人は、棚卸資産の評価を検討するに当たり、主
として以下の監査手続を実施した。
・ ITに係る全般統制及び業務処理統制を含め、棚卸資産
の評価に関連する内部統制の整備状況及び運用状況の評
価を実施した。特に評価の基礎となる滞留期間の算定の
正確性に焦点を当てた。
・会社が採用する滞留期間に応じて規則的に帳簿価額の
切下げをする方法について、会社が保有する棚卸資産の
性質、販売状況、廃棄方針等を総合的に勘案し、その妥
当性を検討した。
・会社が設定した滞留期間ごとの簿価切下率の基準が過
去の廃棄実績及び出荷実績と整合し、合理的であるか検
討した。
・滞留している棚卸資産の網羅的な識別がなされている
かを確かめるために、期末棚卸の立会時に棚卸資産の保
管場所を視察し、必要に応じて工場の担当責任者に質問
を実施した。また、立会時にテストカウント対象とした
棚卸資産の入庫日等を把握したうえで、当該入庫日等が
網羅的、かつ、正確に会社の棚卸資産の集計データに取
り込まれているかを確かめた。
・棚卸資産の簿価切下額の算出データを入手し、滞留期
間に応じて会社が設定した基準に基づいた簿価切下げが
行われているかを確かめた。
・重要な構成単位の監査人の作業結果の利用において、
当該監査人に対して、棚卸資産の評価に関する必要な手
続を指示したうえで、当該監査人が実施した作業結果を
入手し、監査証拠としての十分性及び適切性を評価し
た。
91/97
EDINET提出書類
北陸電気工業株式会社(E01817)
有価証券報告書
その他の記載内容
その他の記載内容は、有価証券報告書に含まれる情報のうち、連結財務諸表及び財務諸表並びにこれらの監査報告書以
外の情報である。経営者の責任は、その他の記載内容を作成し開示することにある。また、監査等委員会の責任は、その
他の記載内容の報告プロセスの整備及び運用における取締役の職務の執行を監視することにある。
当監査法人の連結財務諸表に対する監査意見の対象にはその他の記載内容は含まれておらず、当監査法人はその他の記
載内容に対して意見を表明するものではない。
連結財務諸表監査における当監査法人の責任は、その他の記載内容を通読し、通読の過程において、その他の記載内容
と連結財務諸表又は当監査法人が監査の過程で得た知識との間に重要な相違があるかどうか検討すること、また、そのよ
うな重要な相違以外にその他の記載内容に重要な誤りの兆候があるかどうか注意を払うことにある。
当監査法人は、実施した作業に基づき、その他の記載内容に重要な誤りがあると判断した場合には、その事実を報告す
ることが求められている。
その他の記載内容に関して、当監査法人が報告すべき事項はない。
連結財務諸表に対する経営者及び監査等委員会の責任
経営者の責任は、我が国において一般に公正妥当と認められる企業会計の基準に準拠して連結財務諸表を作成し適正
に表示することにある。これには、不正又は誤謬による重要な虚偽表示のない連結財務諸表を作成し適正に表示するた
めに経営者が必要と判断した内部統制を整備及び運用することが含まれる。
連結財務諸表を作成するに当たり、経営者は、継続企業の前提に基づき連結財務諸表を作成することが適切であるか
どうかを評価し、我が国において一般に公正妥当と認められる企業会計の基準に基づいて継続企業に関する事項を開示
する必要がある場合には当該事項を開示する責任がある。
監査等委員会の責任は、財務報告プロセスの整備及び運用における取締役の職務の執行を監視することにある。
連結財務諸表監査における監査人の責任
監査人の責任は、監査人が実施した監査に基づいて、全体としての連結財務諸表に不正又は誤謬による重要な虚偽表
示がないかどうかについて合理的な保証を得て、監査報告書において独立の立場から連結財務諸表に対する意見を表明
することにある。虚偽表示は、不正又は誤謬により発生する可能性があり、個別に又は集計すると、連結財務諸表の利
用者の意思決定に影響を与えると合理的に見込まれる場合に、重要性があると判断される。
監査人は、我が国において一般に公正妥当と認められる監査の基準に従って、監査の過程を通じて、職業的専門家と
しての判断を行い、職業的懐疑心を保持して以下を実施する。
・不正又は誤謬による重要な虚偽表示リスクを識別し、評価する。また、重要な虚偽表示リスクに対応した監査手続
を立案し、実施する。監査手続の選択及び適用は監査人の判断による。さらに、意見表明の基礎となる十分かつ適切
な監査証拠を入手する。
・連結財務諸表監査の目的は、内部統制の有効性について意見表明するためのものではないが、監査人は、リスク評
価の実施に際して、状況に応じた適切な監査手続を立案するために、監査に関連する内部統制を検討する。
・経営者が採用した会計方針及びその適用方法の適切性、並びに経営者によって行われた会計上の見積りの合理性及
び関連する注記事項の妥当性を評価する。
92/97
EDINET提出書類
北陸電気工業株式会社(E01817)
有価証券報告書
・
経営者が継続企業を前提として連結財務諸表を作成することが適切であるかどうか、また、入手した監査証拠に基
づき、継続企業の前提に重要な疑義を生じさせるような事象又は状況に関して重要な不確実性が認められるかどうか
結論付ける。継続企業の前提に関する重要な不確実性が認められる場合は、監査報告書において連結財務諸表の注記
事項に注意を喚起すること、又は重要な不確実性に関する連結財務諸表の注記事項が適切でない場合は、連結財務諸
表に対して除外事項付意見を表明することが求められている。監査人の結論は、監査報告書日までに入手した監査証
拠に基づいているが、将来の事象や状況により、企業は継続企業として存続できなくなる可能性がある。
・連結財務諸表の表示及び注記事項が、我が国において一般に公正妥当と認められる企業会計の基準に準拠している
かどうかとともに、関連する注記事項を含めた連結財務諸表の表示、構成及び内容、並びに連結財務諸表が基礎とな
る取引や会計事象を適正に表示しているかどうかを評価する。
・連結財務諸表に対する意見表明の基礎となる、会社及び連結子会社の財務情報に関する十分かつ適切な監査証拠を
入手するために、連結財務諸表の監査を計画し実施する。監査人は、連結財務諸表の監査に関する指揮、監督及び査
閲に関して責任がある。監査人は、単独で監査意見に対して責任を負う。
監査人は、監査等委員会に対して、計画した監査の範囲とその実施時期、監査の実施過程で識別した内部統制の重要
な不備を含む監査上の重要な発見事項、及び監査の基準で求められているその他の事項について報告を行う。
監査人は、監査等委員会に対して、独立性についての我が国における職業倫理に関する規定を遵守したこと、並びに
監査人の独立性に影響を与えると合理的に考えられる事項、及び阻害要因を除去するための対応策を講じている場合又
は阻害要因を許容可能な水準にまで軽減するためのセーフガードを適用している場合はその内容について報告を行う。
監査人は、監査等委員会と協議した事項のうち、当連結会計年度の連結財務諸表の監査で特に重要であると判断した
事項を監査上の主要な検討事項と決定し、監査報告書において記載する。ただし、法令等により当該事項の公表が禁止
されている場合や、極めて限定的ではあるが、監査報告書において報告することにより生じる不利益が公共の利益を上
回ると合理的に見込まれるため、監査人が報告すべきでないと判断した場合は、当該事項を記載しない。
<内部統制監査>
監査意見
当監査法人は、金融商品取引法第193条の2第2項の規定に基づく監査証明を行うため、北陸電気工業株式会社の2026
年3月31日現在の内部統制報告書について監査を行った。
当監査法人は、北陸電気工業株式会社が2026年3月31日現在の財務報告に係る内部統制は有効であると表示した上記
の内部統制報告書が、我が国において一般に公正妥当と認められる財務報告に係る内部統制の評価の基準に準拠して、
財務報告に係る内部統制の評価結果について、全ての重要な点において適正に表示しているものと認める。
監査意見の根拠
当監査法人は、我が国において一般に公正妥当と認められる財務報告に係る内部統制の監査の基準に準拠して内部統
制監査を行った。財務報告に係る内部統制の監査の基準における当監査法人の責任は、「内部統制監査における監査人
の責任」に記載されている。当監査法人は、我が国における職業倫理に関する規定(社会的影響度の高い事業体の財務
諸表監査に適用される規定を含む。)に従って、会社及び連結子会社から独立しており、また、監査人としてのその他
の倫理上の責任を果たしている。当監査法人は、意見表明の基礎となる十分かつ適切な監査証拠を入手したと判断して
いる。
93/97
EDINET提出書類
北陸電気工業株式会社(E01817)
有価証券報告書
内部統制報告書に対する経営者及び監査等委員会の責任
経営者の責任は、財務報告に係る内部統制を整備及び運用し、我が国において一般に公正妥当と認められる財務報告
に係る内部統制の評価の基準に準拠して内部統制報告書を作成し適正に表示することにある。
監査等委員会の責任は、財務報告に係る内部統制の整備及び運用状況を監視、検証することにある。
なお、財務報告に係る内部統制により財務報告の虚偽の記載を完全には防止又は発見することができない可能性があ
る。
内部統制監査における監査人の責任
監査人の責任は、監査人が実施した内部統制監査に基づいて、内部統制報告書に重要な虚偽表示がないかどうかにつ
いて合理的な保証を得て、内部統制監査報告書において独立の立場から内部統制報告書に対する意見を表明することに
ある。
監査人は、我が国において一般に公正妥当と認められる財務報告に係る内部統制の監査の基準に従って、監査の過程
を通じて、職業的専門家としての判断を行い、職業的懐疑心を保持して以下を実施する。
・内部統制報告書における財務報告に係る内部統制の評価結果について監査証拠を入手するための監査手続を実施す
る。内部統制監査の監査手続は、監査人の判断により、財務報告の信頼性に及ぼす影響の重要性に基づいて選択及び
適用される。
・財務報告に係る内部統制の評価範囲、評価手続及び評価結果について経営者が行った記載を含め、全体としての内
部統制報告書の表示を検討する。
・内部統制報告書における財務報告に係る内部統制の評価結果に関する十分かつ適切な監査証拠を入手するために、
内部統制の監査を計画し実施する。監査人は、内部統制報告書の監査に関する指揮、監督及び査閲に関して責任があ
る。監査人は、単独で監査意見に対して責任を負う。
監査人は、監査等委員会に対して、計画した内部統制監査の範囲とその実施時期、内部統制監査の実施結果、識別し
た内部統制の開示すべき重要な不備、その是正結果、及び内部統制の監査の基準で求められているその他の事項につい
て報告を行う。
監査人は、監査等委員会に対して、独立性についての我が国における職業倫理に関する規定を遵守したこと、並びに
監査人の独立性に影響を与えると合理的に考えられる事項、及び阻害要因を除去するための対応策を講じている場合又
は阻害要因を許容可能な水準にまで軽減するためのセーフガードを適用している場合はその内容について報告を行う。
<報酬関連情報>
当監査法人及び当監査法人と同一のネットワークに属する者に対する、会社及び子会社の監査証明業務に基づく報酬及
び非監査業務に基づく報酬の額は、「提出会社の状況」に含まれるコーポレート・ガバナンスの状況等(3)【監査の状
況】に記載されている。
利害関係
会社及び連結子会社と当監査法人又は業務執行社員との間には、公認会計士法の規定により記載すべき利害関係はな
い。