Date: October 30, 2026 Consolidated Financial Results for the Six Months Ended September 30, 2026 (Under IFRS) Company Name: Murata Manufacturing Co., Ltd.Stock Exchange Listings: Listing Code: 6981Tokyo Stock Exchange (URL…
Date: October 30, 2026
Consolidated Financial Results
for the Six Months Ended September 30, 2026 (Under IFRS)
Company Name: Murata Manufacturing Co., Ltd.Stock Exchange Listings:
Listing Code: 6981Tokyo Stock Exchange
(URL https://corporate.murata.com/en-global/)
Phone: 81-75-955-6525
Scheduled date to commence dividend payments: November 30, 2026
(1) Operating results(Percentage represents year-on-year changes.)
RevenueOperating profitProfit before tax
Profit attributable to
owners of parent
Comprehensive income
Six months endedMillions of yen%Millions of yen%Millions of yen%Millions of yen%Millions of yen%
September 30, 20261,090,76420.8245,90748.9248,41542.1186,15240.6179,59820.8
September 30, 2025902,7782.2165,1364.4174,7826.6132,3791.6148,61459.7
Basic earnings
per share
Diluted earnings
per share
Six months endedYenYen
September 30, 2026102.43102.40
September 30, 202571.7771.77
Total assetsTotal equity
Equity attributable to
owners of parent
Ratio of equity
attributable to
owners of parent
Equity attributable to
owners of parent
per share
As ofMillions of yenMillions of yenMillions of yen%Yen
September 30, 20263,249,2482,758,0832,759,13984.91,524.46
March 31, 20263,199,0992,717,8102,718,74385.01,493.58
Annual dividends per share
First quarterSecond quarterThird quarterYear-endTotal
YenYenYenYenYen
Year ended
March 31, 2026
-30.00-35.0065.00
Year ending
March 31, 2027
-35.00
Year ending
March 31, 2027 (Forecast)
-35.0070.00
RevenueOperating profitProfit before tax
Profit attributable to
owners of parent
Basic earnings
per share
Millions of yen%Millions of yen%Millions of yen%Millions of yen%Yen
Year ending
March 31, 2027
2,260,00023.4520,00084.5532,00072.4396,00069.3218.80
(Amounts are rounded to the nearest million yen)
- Consolidated financial results for the six months ended September 30, 2026
(2) Financial position
- Cash dividends
- Revisions to the forecast of cash dividends most recently announced: None
- Forecast of consolidated financial results for the year ending March 31, 2027
(Percentage represents year-on-year changes.)
- Percentage represents year-on-year changes.
- Forecast of financial results has been revised during the six months ended September 30, 2026.
- The number of shares issued that forms the basis for the calculation of basic earnings per share is calculated with the number of issued shares (excluding
treasury shares) as of September 30, 2026.
As of September 30, 20261,963,001,843 shares
As of March 31, 20261,963,001,843 shares
As of September 30, 2026153,092,489 shares
As of March 31, 2026142,709,692 shares
Six months ended September 30, 20261,816,638,676 shares
Six months ended September 30, 20251,843,825,318 shares
4. Notes
(1) Changes in significant subsidiaries during the period (changes in specific subsidiaries that caused change in scope of consolidation): None
(2) Changes in accounting policies and changes in accounting estimates
- Changes in accounting policies required by IFRS: None
- Changes in accounting policies due to other reasons: None
- Changes in accounting estimates: None
(3) Number of issued shares
- Total number of shares at the end of the period (including treasury shares)
- Number of treasury shares at the end of the period
- Average number of shares during the period
*Semi-annual financial results reports are exempt from review conducted by certified public accountants or an audit firm.
*Notes to the forecast of financial results
The above forecasts were prepared based on estimates using information currently available.
Actual results may differ from the forecast. For assumptions and other information regarding the forecast, refer to “Business Results and Financial Position”.
Business Results and Financial Position
(from April 1, 2026 through September 30, 2026)
Millions of yen
Six months ended
September 30, 2025
Six months ended
September 30, 2026
Change
%%%
Revenue902,778100.01,090,764100.0187,98620.8
Operating profit165,13618.3245,90722.580,77148.9
Profit before tax174,78219.4248,41522.873,63342.1
Profit attributable to owners of parent132,37914.7186,15217.153,77340.6
Average exchange rate (Yen/U.S. dollar)146.04-159.37-13.33-
- Business Results
During the period, despite downside risks to the economy including rising prices of raw materials and
energy due to the prolongation of the situation in the Middle East and growing inflationary pressures, the
global economic environment remained generally solid on the back of expanding AI-related demand.
In the electronics market, where Murata Manufacturing Co., Ltd., and its subsidiaries (hereinafter, the
“Companies”) operate, demand for parts remained firm, supported by increased investment in data centers as
well as the advancement of AD/ADAS and the rising share of xEVs in the automotive market.
Under these circumstances, during the period, revenue from capacitors increased across a wide range of
applications, mainly data centers, and revenue from EMI filters for data centers and mobility as well as power
supply modules for data centers increased. As a result, revenue increased by 20.8% year on year to
1,090,764 million yen, partly due to the impact of foreign currency fluctuations (depreciation of the yen by
13.33 yen year on year).
Looking at profits, operating profit was 245,907 million yen, up 48.9% year on year; profit before tax was
248,415 million yen, up 42.1% year on year; and profit attributable to owners of parent came to 186,152
million yen, up 40.6% year on year. This was due to profit-increasing factors such as gains from a higher
operation rate resulting from an increase in production output and the impact of a weaker yen, despite profit-
decreasing factors such as an increase in fixed costs and a fall in product selling prices.
*Component ratio as a percentage of revenue
Millions of yen
Six months ended
September 30, 2025
Six months ended
September 30, 2026
Change
%%%
Capacitors454,90250.4605,58355.5150,68133.1
Inductors and EMI Filters110,74612.3134,92612.424,18021.8
Components
565,64862.7740,50967.9174,86130.9
High-Frequency Device and
Communications Module
202,68122.4198,47418.2(4,207)(2.1)
Battery and Power supply74,8968.378,6857.23,7895.1
Functional Device52,1885.863,7025.811,51422.1
Devices and Modules
329,76536.5340,86131.211,0963.4
Others7,3650.89,3940.92,02927.5
Revenue902,778100.01,090,764100.0187,98620.8
Revenue by Operating Segments
Revenue by Operating Segments during the period was as follows:
*Component ratio as a percentage of revenue
<Components>
Revenue of Components during the period increased by 30.9% year on year to 740,509 million yen.
〔Capacitors〕
The Capacitors category includes MLCCs.
During the period, revenue of MLCCs increased across a wide range of applications, mainly for data
centers, distributors and mobility.
As a result, overall revenue increased by 33.1% year on year to 605,583 million yen.
〔Inductors and EMI filters〕
The Inductors and EMI filters category includes inductors and EMI suppression filters.
During the period, revenue of EMI suppression filters and inductors increased for mobility and data
centers.
As a result, overall revenue increased by 21.8% year on year to 134,926 million yen.
<Devices and Modules>
Revenue of Devices and Modules during the period increased by 3.4% year on year to 340,861 million
yen.
〔High-Frequency Device and Communications Module〕
The High-Frequency Device and Communications Module category includes multilayer resin substrates,
high-frequency modules, connectivity modules, and SAW filters.
During the period, revenue of multilayer resin substrates decreased for smartphones, and revenue of high-
frequency modules decreased for smartphones and PCs.
As a result, overall revenue decreased by 2.1% year on year to 198,474 million yen.
〔Battery and Power supply〕
The Battery and Power supply category includes lithium-ion secondary batteries and power supply
modules.
During the period, revenue of lithium-ion secondary batteries increased for data centers but decreased for
power tools. Revenue also decreased due in part to the transfer of the micro primary battery business. In
contrast, revenue of power supply modules increased for data centers.
As a result, overall revenue increased by 5.1% year on year to 78,685 million yen.
〔Functional Device〕
The Functional Device category includes sensors and timing devices (resonators).
During the period, revenue of sensors increased for mobility and smartphones. In addition, revenue of
actuators increased for computers.
As a result, overall revenue increased by 22.1% year on year to 63,702 million yen.
Millions of yen
Six months ended
September 30, 2025
Six months ended
September 30, 2026
Change
%%%
Communication328,51836.4346,81331.818,2955.6
Mobility234,54226.0268,75124.634,20914.6
Computers145,86316.2235,11021.689,24761.2
Home Electronics73,4088.171,6456.6(1,763)(2.4)
Industry and Others120,44713.3168,44515.447,99839.8
Revenue902,778100.01,090,764100.0187,98620.8
Revenue by Application Category
Revenue by Application Category during the period was as follows:
*Based on our estimate
〔Communication〕
During the period, revenue of multilayer resin substrates, connectivity modules and high-frequency
modules decreased for smartphones, while revenue of MLCCs increased for smartphones. Revenue of
MLCCs also increased for base stations.
As a result, overall revenue increased by 5.6% year on year to 346,813 million yen.
〔Mobility〕
During the period, revenue of MLCCs, EMI suppression filters and inductors increased for automotive.
As a result, overall revenue increased by 14.6% year on year to 268,751 million yen.
〔Computers〕
During the period, revenue of MLCCs, power supply modules and lithium-ion secondary batteries
increased for data centers.
As a result, overall revenue increased by 61.2% year on year to 235,110 million yen.
〔Home Electronics〕
During the period, revenue of MLCCs increased for AV equipment, while revenue of lithium-ion
secondary batteries decreased for power tools.
As a result, overall revenue decreased by 2.4% year on year to 71,645 million yen.
〔Industry and Others〕
During the period, revenue of MLCCs increased for distributors and industrial equipment.
As a result, overall revenue increased by 39.8% year on year to 168,445 million yen.
- Financial Position
Total assets at the end of the period increased by 50,149 million yen from the end of the previous fiscal year
to 3,249,248 million yen mainly due to an increase in trade receivables, despite a decrease in cash and cash
equivalents. Total liabilities increased by 9,876 million yen from the end of the previous fiscal year to 491,165
million yen mainly due to increases in other current liabilities and income taxes payable, despite a decrease in
other financial liabilities. Total equity increased by 40,273 million yen from the end of the previous fiscal year
to 2,758,083 million yen, mainly due to an increase in retained earnings, despite an increase in treasury shares.
The ratio of equity attributable to owners of parent decreased by 0.1 point from the end of the previous fiscal
year to 84.9%.
Cash flows during the period and the year on year changes were as follows:
<Net cash provided by operating activities>
During the period, cash flows from operating activities were an inflow of 215,455 million yen (an increase
in inflow of 47,722 million yen year on year).
This was mainly due to profit for the period of 186,064 million yen, and depreciation and amortization of
91,552 million yen, despite an increase in trade receivables of 66,137 million yen and payment of income
taxes of 57,072 million yen.
<Net cash used in investing activities>
During the period, cash flows from investing activities were an outflow of 112,531 million yen (an increase
in outflow of 47,051 million yen year on year).
This was mainly due to the purchase of property, plant and equipment of 97,649 million yen, aimed
primarily at boosting production capacity and construction of buildings for production.
<Net cash used in financing activities>
During the period, cash flows from financing activities were an outflow of 146,693 million yen (an increase
in outflow of 8,140 million yen year on year).
This was mainly due to the purchase of treasury shares of 76,108 million yen and payment of dividends of
63,710 million yen.
Consolidated Basis
Previous ForecastRevised Forecast
(Announced July 31, 2026)
RevenueMillions of yen2,110,0002,260,000
<%>*1<20.4><23.0>
Operating profitMillions of yen430,000520,000
<%>*1<21.4><23.5>
Profit before taxMillions of yen451,000532,000
<%>*1<16.0><17.5>
Profit attributable to owners of parentMillions of yen338,000396,000
Return on invested capital (ROIC)*2
(post-tax basis)<%>13.916.6
Capital expendituresMillions of yen255,000270,000
<%>*1<8.6><8.2>
Depreciation and amortizationMillions of yen182,000186,000
<%>*1<8.2><7.9>
Research and development expensesMillions of yen174,000178,000
3. Forecast of Consolidated Financial Results for the Year Ending March 31, 2027
Looking ahead, the Companies forecast that revenue for the fiscal year ending March 31, 2027, will exceed
the previous forecast. This outlook reflects further growth in demand related to data centers. Regarding profits,
profit figures are also expected to exceed the previous forecast, reflecting profit-increasing factors such as
gains from a higher operation rate resulting from an increase in production output and an improved product
mix.
In light of these circumstances and taking into account the results for the six months ended September 30,
2026, the Companies have revised their forecast of consolidated financial results for the fiscal year ending
March 31, 2027, which was announced on July 31, 2026.
*1 Ratio to revenue
*2 ROIC (post-tax basis) = Operating profit × (1 - effective tax rate) ÷ Average invested capital at the
beginning and end of the period (Property, plant and equipment/right-of-use assets/goodwill/intangible assets
- inventories + trade receivables - trade payables)
*3 Effective tax rate applied to ROIC (post-tax basis) is average effective tax rate.
The assumed exchange rate from the third quarter of this fiscal year onward has not been changed from 155
yen per U.S. dollar in the previous forecast.
[Cautionary Statement on Forward-looking Statements]
This report contains forward-looking statements concerning the Companies’ projections, plans, policies, strategies, schedules,
and decisions. These forward-looking statements are not historical facts; rather, they represent the assumptions of the Companies
based on information currently available and certain assumptions we deem as reasonable. Actual results may differ materially
from expectations owing to various risks and uncertainties. Readers are therefore requested not to rely on these forward-looking
statements as the sole basis for evaluating the Companies. The Companies have no obligation to revise any of the forward-
looking statements as a result of new information, future events, or otherwise.
Risks and uncertainties that may affect actual results include, but are not limited to, the following:
(1) Economic conditions of the Companies’ business environment, and trends, supply-demand balance, and price fluctuations in
the markets for electronic devices and components
(2) Price fluctuations and insufficient supply of raw materials
(3) Exchange rate fluctuations
(4) The Companies’ ability to provide a stable supply of new products that are compatible with the rapid technical innovation of
the electronic components market and to continue to design and develop products and services that satisfy customers
(5) Changes in the market value of the Companies’ financial assets
(6) Drastic legal, political, and social changes in the Companies’ business environment
(7) Other uncertainties and contingencies.
Condensed semi-annual consolidated financial statements and primary notes
(Millions of yen)
March 31, 2026September 30, 2026
Assets
Current assets
Cash and cash equivalents653,701600,579
Trade receivables328,159392,270
Inventories520,472534,185
Other financial assets24,18543,768
Other current assets54,87655,646
Total current assets
1,581,3931,626,448
Non-current assets
Property, plant and equipment1,300,8831,296,112
Right-of-use assets59,56359,402
Goodwill99,48997,953
Intangible assets36,23435,794
Investments accounted for using equity
method
234266
Other financial assets50,39260,080
Deferred tax assets60,42460,183
Other non-current assets10,48713,010
Total non-current assets
1,617,7061,622,800
Total assets
3,199,0993,249,248
(1) Condensed semi-annual consolidated statement of financial position
(Millions of yen)
March 31, 2026September 30, 2026
Liabilities
Current liabilities
Borrowings1,745739
Trade payables79,79882,911
Lease liabilities10,76411,133
Other financial liabilities57,12646,983
Income taxes payable43,18250,172
Deferred income1,4121,593
Provisions3,0693,236
Other current liabilities119,389131,265
Total current liabilities
316,485328,032
Non-current liabilities
Borrowings1,5161,901
Lease liabilities41,74341,128
Other financial liabilities1,134687
Deferred income22,13720,894
Retirement benefit liability72,27473,664
Provisions9,5458,710
Deferred tax liabilities10,0419,832
Other non-current liabilities6,4146,317
Total non-current liabilities
164,804163,133
Total liabilities
481,289491,165
Equity
Share capital69,44469,444
Capital surplus100,177100,680
Retained earnings2,528,5402,650,982
Other components of equity255,634249,153
Treasury shares(235,052)(311,120)
Equity attributable to owners of parent
2,718,7432,759,139
Non-controlling interests(933)(1,056)
Total equity
2,717,8102,758,083
Total liabilities and equity
3,199,0993,249,248
(Millions of yen)
Six months ended
September 30, 2025
Six months ended
September 30, 2026
Revenue902,7781,090,764
Cost of sales(521,926)(591,994)
Gross profit
380,852498,770
Selling, general and administrative expenses(138,280)(164,944)
Research and development expenses(77,995)(88,081)
Other income3,6785,441
Other expenses(3,119)(5,279)
Operating profit
165,136245,907
Finance income11,0499,451
Finance costs(1,421)(6,975)
Share of profit (loss) of investments accounted
for using equity method
1832
Profit before tax
174,782248,415
Income tax expense(42,441)(62,351)
Profit for the period
132,341186,064
Profit attributable to:
Owners of parent132,379186,152
Non-controlling interests(38)(88)
Profit for the period
132,341186,064
Earnings per share
Basic earnings per share71.77102.43
Diluted earnings per share71.77102.40
(2) Condensed semi-annual consolidated statement of profit or loss and condensed semi-annual consolidated
statement of comprehensive income
Condensed semi-annual consolidated statement of profit or loss
(Millions of yen)
Six months ended
September 30, 2025
Six months ended
September 30, 2026
Profit for the period132,341186,064
Other comprehensive income, net of tax
Items that will not be reclassified to profit or
loss
Financial assets measured at fair value
through other comprehensive income
3,5114,746
Total of items that will not be reclassified to
profit or loss
3,5114,746
Items that may be reclassified to profit or loss
Financial assets measured at fair value
through other comprehensive income
(1)-
Exchange differences on translation of
foreign operations
12,763(11,212)
Total of items that may be reclassified to
profit or loss
12,762(11,212)
Total other comprehensive income, net of tax
16,273(6,466)
Comprehensive income for the period
148,614179,598
Comprehensive income attributable to:
Owners of parent148,642179,671
Non-controlling interests(28)(73)
Comprehensive income for the period
148,614179,598
Condensed semi-annual consolidated statement of comprehensive income
(Millions of yen)
Equity attributable to owners of parent
Non-
controlling
interests
Total equity
Share
capital
Capital
surplus
Retained
earnings
Other
components
of equity
Treasury
shares
Total
Balance as of April 1, 202569,44499,3542,400,684146,515(135,192)2,580,805(830)2,579,975
Profit for the period
--132,379--132,379(38)132,341
Other comprehensive
income
---16,263-16,2631016,273
Comprehensive income
--132,37916,263-148,642(28)148,614
Purchase of treasury
shares
----(76,956)(76,956)-(76,956)
Disposal of treasury
shares
-0--00-0
Dividends--(55,871)--(55,871)(74)(55,945)
Share-based payment
transactions
-354--148502-502
Transfer from other
components of equity to
retained earnings
--33(33)----
Total transactions with
owners
-354(55,838)(33)(76,808)(132,325)(74)(132,399)
Balance as of September 30,
2025
69,44499,7082,477,225162,745(212,000)2,597,122(932)2,596,190
(Millions of yen)
Equity attributable to owners of parent
Non-
controlling
interests
Total equity
Share
capital
Capital
surplus
Retained
earnings
Other
components
of equity
Treasury
shares
Total
Balance as of April 1, 202669,444100,1772,528,540255,634(235,052)2,718,743(933)2,717,810
Profit for the period
--186,152--186,152(88)186,064
Other comprehensive
income
---(6,481)-(6,481)15(6,466)
Comprehensive income
--186,152(6,481)-179,671(73)179,598
Purchase of treasury
shares
----(76,108)(76,108)-(76,108)
Disposal of treasury
shares
-1--01-1
Dividends--(63,710)--(63,710)(50)(63,760)
Share-based payment
transactions
-502--40542-542
Transfer from other
components of equity to
retained earnings
Total transactions with
owners
-503(63,710)-(76,068)(139,275)(50)(139,325)
Balance as of September 30,
2026
69,444100,6802,650,982249,153(311,120)2,759,139(1,056)2,758,083
(3) Condensed semi-annual consolidated statement of changes in equity
Six months ended September 30, 2025
Six months ended September 30, 2026
(Millions of yen)
Six months ended
September 30, 2025
Six months ended
September 30, 2026
Cash flows from operating activities
Profit for the period132,341186,064
Depreciation and amortization84,58091,552
Impairment losses9693,472
Finance income and finance costs(9,628)(2,476)
Income tax expense42,44162,351
Share of loss (profit) of investments accounted for using
equity method
(18)(32)
Loss (gain) on sale and retirement of fixed assets1,264(92)
Decrease (increase) in trade receivables(36,660)(66,137)
Decrease (increase) in inventories(1,331)(14,926)
Decrease (increase) in other assets(12,101)(5,474)
Increase (decrease) in trade payables5,4773,269
Increase (decrease) in other liabilities(5,800)9,356
Other3,3465,600
Subtotal
204,880272,527
Income taxes paid(37,147)(57,072)
Net cash provided by operating activities
167,733215,455
Cash flows from investing activities
Net decrease (increase) in time deposits21,931(22,519)
Purchase of property, plant and equipment(88,317)(97,649)
Proceeds from sale of property, plant and equipment4917,213
Purchase of intangible assets(5,037)(5,964)
Purchase of investments(2,501)(1,315)
Proceeds from sale and redemption of investments70469
Interest and dividends received8,0887,580
Other(205)(346)
Net cash provided by (used in) investing activities
(65,480)(112,531)
Cash flows from financing activities
Net increase (decrease) in short-term borrowings-(676)
Proceeds from long-term borrowings9163
Purchase of treasury shares(76,956)(76,108)
Repayments of lease liabilities(5,384)(5,751)
Interest paid(358)(462)
Dividends paid(55,871)(63,710)
Other(75)(49)
Net cash provided by (used in) financing activities
(138,553)(146,693)
Effect of exchange rate changes on cash and cash
equivalents
(6,454)(9,353)
Net increase (decrease) in cash and cash equivalents
(42,754)(53,122)
Cash and cash equivalents at beginning of period625,148653,701
Cash and cash equivalents at end of period
582,394600,579
(4) Condensed semi-annual consolidated statement of cash flows
(5) Notes to condensed semi-annual consolidated financial statements
(Going concern assumption)
None
Components
Devices and
Modules
Others
Eliminations and
Corporate
Consolidated
Revenue to:
Unaffiliated customers565,648329,7657,365-902,778
Intersegment8,587625,578(34,171)-
Total revenue574,235329,77132,943(34,171)902,778
Operating profit (loss)157,66310,319(2,846)-165,136
Operating profit ratio27.5%3.1%(8.6)%-18.3%
Components
Devices and
Modules
Others
Eliminations and
Corporate
Consolidated
Revenue to:
Unaffiliated customers740,509340,8619,394-1,090,764
Intersegment4,5471224,358(28,917)-
Total revenue745,056340,87333,752(28,917)1,090,764
Operating profit (loss)255,578(4,848)(4,823)-245,907
Operating profit ratio34.3%(1.4)%(14.3)%-22.5%
(Segment Information)
Outline of Operating Segment
The Companies mainly develop, manufacture and sell electronic components and related products.
Operating segments of the Companies are classified based on the business strategies of the Companies, and the Companies
recognized three segments that are Components, Devices and Modules, and Others.
Six months ended September 30, 2025
(Millions of yen)
Six months ended September 30, 2026
(Millions of yen)
Notes: 1. Major products and businesses included in the operating segment:
(1) Components: MLCCs, Inductors, and EMI suppression filters
(2) Devices and Modules: Multilayer resin substrates, High-frequency modules, SAW filters, Lithium-ion secondary
(2) batteries, and Sensors
(3) Others: Solutions business, Medical products, and Machinery manufacturing
Notes: 2. Intersegment transactions are based on market prices.
(Significant subsequent events)
None
Other
October 30, 2026
Murata Manufacturing Co., Ltd.
Listing Code: 6981
(URL https://corporate.murata.com/en-global/)
Flash Report (Six months ended September 30, 2026)
Six months ended
September 30, 2025
Six months ended
September 30, 2026
Growth
ratio
%
RevenueMillions of yen902,7781,090,76420.8
<%>*1<18.3><22.5>
Operating profitMillions of yen165,136245,90748.9
<%>*1<19.4><22.8>
Profit before taxMillions of yen174,782248,41542.1
<%>*1<14.7><17.1>
Profit attributable to owners of parentMillions of yen132,379186,15240.6
Total assetsMillions of yen3,040,3473,249,2486.9
Total equityMillions of yen2,596,1902,758,0836.2
Ratio of equity attributable to owners of
parent
%85.484.9-
Basic earnings per shareYen71.77102.4342.7
Diluted earnings per shareYen71.77102.4042.7
Equity attributable to owners of parent per
share
Yen1,420.521,524.46-
Capital expendituresMillions of yen75,41486,47914.7
<%>*1<9.4><8.4>
Depreciation and amortizationMillions of yen84,58091,5528.2
<%>*1<8.6><8.1>
Research and development expensesMillions of yen77,99588,08112.9
*2<38,254><40,610>
Number of employees73,93476,7533.8
Average exchange rates
Yen/U.S. dollarYen146.04159.37-
Consolidated financial results
Three months ended
September 30, 2025
Three months ended
September 30, 2026
Growth
ratio
%
RevenueMillions of yen486,624588,50020.9
<%>*1<21.3><25.1>
Operating profitMillions of yen103,515147,45342.4
<%>*1<23.1><23.7>
Profit before taxMillions of yen112,460139,18223.8
<%>*1<17.0><17.8>
Profit attributable to owners of parentMillions of yen82,665104,77526.7
Basic earnings per shareYen45.0257.7528.3
Diluted earnings per shareYen45.0257.7328.2
Capital expendituresMillions of yen40,69945,45711.7
<%>*1<8.8><7.8>
Depreciation and amortizationMillions of yen42,63045,9677.8
<%>*1<7.8><7.3>
Research and development expensesMillions of yen38,17643,20613.2
<Breakdown of inventories>(Millions of yen)
As of March 31, 2026As of September 30, 2026
Merchandise and finished goods195,669193,268
Work in process194,794208,175
Raw materials and supplies130,009132,742
Total520,472534,185
*1 Ratio to revenue
*2 Figures in parentheses indicate the number of employees in foreign countries.
Millions of yen
Six months ended
September 30, 2025
Six months ended
September 30, 2026
Change
%*1%*1%
Capacitors465,80250.7863,42360.5397,62185.4
Inductors and EMI filters111,43312.1151,84310.640,41036.3
Components
577,23562.81,015,26671.1438,03175.9
High-Frequency Device and
Communications Module
203,21322.1206,28614.63,0731.5
Battery and Power supply77,5698.6124,5458.746,97660.6
Functional Device53,4965.869,1744.815,67829.3
Devices and Modules
334,27836.5400,00528.165,72719.7
Others6,6200.712,0150.85,39581.5
Total918,133100.01,427,286100.0509,15355.5
Millions of yen
Three months ended
September 30, 2025
Three months ended
September 30, 2026
Change
%*1%*1%
Capacitors241,80749.7447,91859.5206,11185.2
Inductors and EMI filters58,52012.077,52910.319,00932.5
Components
300,32761.7525,44769.8225,12075.0
High-Frequency Device and
Communications Module
117,17124.1111,42214.8(5,749)(4.9)
Battery and Power supply38,9388.073,7729.834,83489.5
Functional Device26,9365.535,6594.78,72332.4
Devices and Modules
183,04537.6220,85329.337,80820.7
Others3,6310.77,1170.93,48696.0
Total487,003100.0753,417100.0266,41454.7
Millions of yen
As of March 31, 2026As of September 30, 2026Change
%*1%*1%
Capacitors269,15860.3526,99867.3257,84095.8
Inductors and EMI filters42,2199.559,1367.616,91740.1
Components
311,37769.8586,13474.9274,75788.2
High-Frequency Device and
Communications Module
52,60711.860,4197.77,81214.8
Battery and Power supply59,39813.3105,25813.545,86077.2
Functional Device18,8854.224,3573.15,47229.0
Devices and Modules
130,89029.3190,03424.359,14445.2
Others3,9020.96,5230.82,62167.2
Total446,169100.0782,691100.0336,52275.4
Orders, Backlogs, and Sales
(1) Orders and Backlogs by Operating Segment
<Orders>
*1 Component ratio
*2 Figures are based on sales prices to customers.
<Backlogs>
*1 Component ratio
*2 Figures are based on sales prices to customers.
Millions of yen
Six months ended
September 30, 2025
Six months ended
September 30, 2026
Change
%*1%*1%
Capacitors454,90250.4605,58355.5150,68133.1
Inductors and EMI filters110,74612.3134,92612.424,18021.8
Components
565,64862.7740,50967.9174,86130.9
High-Frequency Device and
Communications Module
202,68122.4198,47418.2(4,207)(2.1)
Battery and Power supply74,8968.378,6857.23,7895.1
Functional Device52,1885.863,7025.811,51422.1
Devices and Modules
329,76536.5340,86131.211,0963.4
Others7,3650.89,3940.92,02927.5
Revenue902,778100.01,090,764100.0187,98620.8
Millions of yen
Three months ended
September 30, 2025
Three months ended
September 30, 2026
Change
%*1%*1%
Capacitors237,57248.8323,07554.985,50336.0
Inductors and EMI filters58,25812.070,67212.012,41421.3
Components
295,83060.8393,74766.997,91733.1
High-Frequency Device and
Communications Module
120,60624.8112,33619.1(8,270)(6.9)
Battery and Power supply39,1408.043,9037.54,76312.2
Functional Device27,3855.633,1945.65,80921.2
Devices and Modules
187,13138.4189,43332.22,3021.2
Others3,6630.85,3200.91,65745.2
Revenue486,624100.0588,500100.0101,87620.9
Millions of yen
Six months ended
September 30, 2025
Six months ended
September 30, 2026
Change
%*1%*1%
Communication328,51836.4346,81331.818,2955.6
Mobility234,54226.0268,75124.634,20914.6
Computers145,86316.2235,11021.689,24761.2
Home Electronics73,4088.171,6456.6(1,763)(2.4)
Industry and Others120,44713.3168,44515.447,99839.8
Revenue902,778100.01,090,764100.0187,98620.8
Millions of yen
Three months ended
September 30, 2025
Three months ended
September 30, 2026
Change
%*1%*1%
Communication190,96239.3190,39832.4(564)(0.3)
Mobility121,19524.9137,19723.316,00213.2
Computers75,89015.6132,23922.556,34974.3
Home Electronics36,5897.537,3106.37212.0
Industry and Others61,98812.791,35615.529,36847.4
Revenue486,624100.0588,500100.0101,87620.9
(2) Revenue by Operating Segment, Application and Area
- Revenue by Operating Segment
*1 Component ratio
- Revenue by Application (based on the Company’s estimate)
*1 Component ratio
Millions of yen
Six months ended
September 30, 2025
Six months ended
September 30, 2026
Change
%*1%*1%
The Americas148,08016.4145,42213.3(2,658)(1.8)
Europe76,5278.592,0318.415,50420.3
Greater China433,47948.0546,20750.1112,72826.0
Asia and Others179,55819.9235,63121.656,07331.2
Overseas total
837,64492.81,019,29193.4181,64721.7
Japan65,1347.271,4736.66,3399.7
Revenue902,778100.01,090,764100.0187,98620.8
Millions of yen
Three months ended
September 30, 2025
Three months ended
September 30, 2026
Change
%*1%*1%
The Americas90,70518.779,09013.4(11,615)(12.8)
Europe38,0327.848,5238.310,49127.6
Greater China230,84647.4300,83451.169,98830.3
Asia and Others93,83119.3123,63921.029,80831.8
Overseas total
453,41493.2552,08693.898,67221.8
Japan33,2106.836,4146.23,2049.6
Revenue486,624100.0588,500100.0101,87620.9
3. Revenue by Area
*1 Component ratio
*2 Revenue is attributed to countries or areas based on customer locations.
Millions of yen
Three months
ended June 30, 2025
Three months
ended September 30,
2025
Three months
ended December 31,
2025
Three months
ended March 31, 2026
% *1% *1% *1% *1
Revenue416,154100.0486,624100.0467,454100.0460,624100.0
Operating profit61,62114.8103,51521.337,8768.178,82317.1
Profit before tax62,32215.0112,46023.149,50910.684,35218.3
Profit attributable to owners of
parent
49,71411.982,66517.024,9695.376,57216.6
Millions of yen
Three months
ended June 30, 2026
Three months
ended September 30,
2026
% *1% *1
Revenue
502,264100.0588,500100.0
Operating profit
98,45419.6147,45325.1
Profit before tax
109,23321.7139,18223.7
Profit attributable to owners of
parent
81,37716.2104,77517.8
Millions of yen
Three months
ended June 30, 2025
Three months
ended September 30,
2025
Three months
ended December 31,
2025
Three months
ended March 31, 2026
% *1% *1% *1% *1
Capacitors217,33052.2237,57248.8239,11451.1242,40252.6
Inductors and EMI filters52,48812.658,25812.056,37912.156,19112.2
Components
269,81864.8295,83060.8295,49363.2298,59364.8
High-Frequency Device and
Communications Module
82,07519.7120,60624.8102,22421.989,92419.5
Battery and Power supply35,7568.639,1408.038,9488.340,2198.7
Functional Device24,8036.027,3855.627,0695.827,8176.1
Devices and Modules
142,63434.3187,13138.4168,24136.0157,96034.3
Others3,7020.93,6630.83,7200.84,0710.9
Revenue416,154100.0486,624100.0467,454100.0460,624100.0
Millions of yen
Three months
ended June 30, 2026
Three months
ended September 30,
2026
% *1% *1
Capacitors282,50856.2323,07554.9
Inductors and EMI filters64,25412.870,67212.0
Components
346,76269.0393,74766.9
High-Frequency Device and
Communications Module
86,13817.2112,33619.1
Battery and Power supply34,7826.943,9037.5
Functional Device30,5086.133,1945.6
Devices and Modules
151,42830.2189,43332.2
Others4,0740.85,3200.9
Revenue502,264100.0588,500100.0
Quarterly Consolidated Performance
(1) Consolidated Financial Results
*1 Ratio to revenue
(2) Revenue by Operating Segment
*1 Component ratio
Millions of yen
Three months
ended June 30, 2025
Three months
ended September 30,
2025
Three months
ended December 31,
2025
Three months
ended March 31, 2026
% *1% *1% *1% *1
Communication137,55633.1190,96239.3171,71636.7152,72333.2
Mobility113,34727.2121,19524.9121,80526.1118,13725.6
Computers69,97316.875,89015.677,33116.587,19818.9
Home Electronics36,8198.936,5897.535,5997.633,6877.3
Industry and Others58,45914.061,98812.761,00313.168,87915.0
Revenue416,154100.0486,624100.0467,454100.0460,624100.0
Millions of yen
Three months
ended June 30, 2026
Three months
ended September 30,
2026
% *1% *1
Communication156,41531.1190,39832.4
Mobility131,55426.2137,19723.3
Computers102,87120.5132,23922.5
Home Electronics34,3356.837,3106.3
Industry and Others77,08915.491,35615.5
Revenue502,264100.0588,500100.0
(3) Revenue by Application (based on the Company’s estimate)
*1 Component ratio


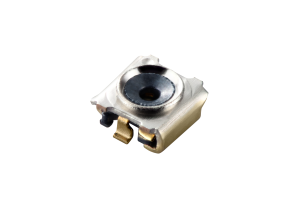
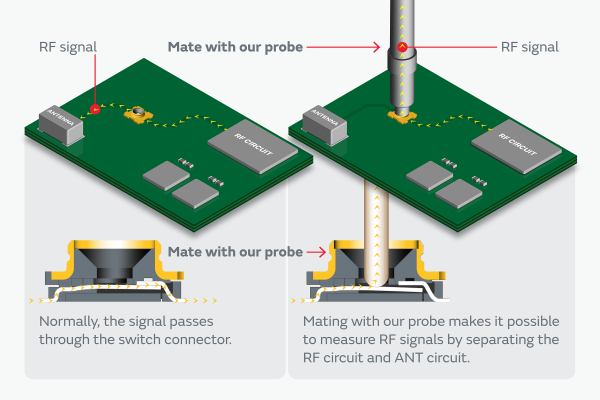 RF Signal Measurement Using a Coaxial Connector with a Switch and a probe
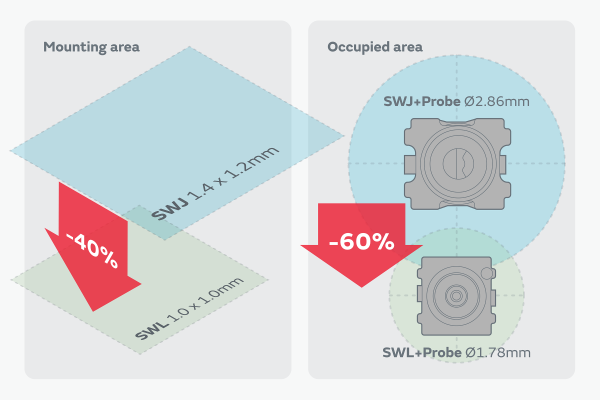 Murata’s SWL Series Reduces PCB Mounting Area by Approximately 40% and Probe-Related Occupied Area by Approximately 60% Compared with the Previous SWJ Series










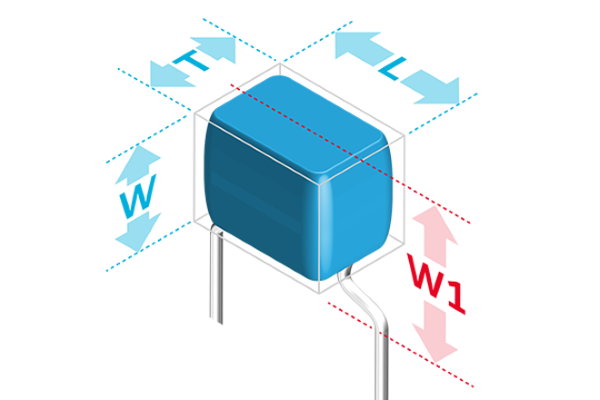 Product Dimensions
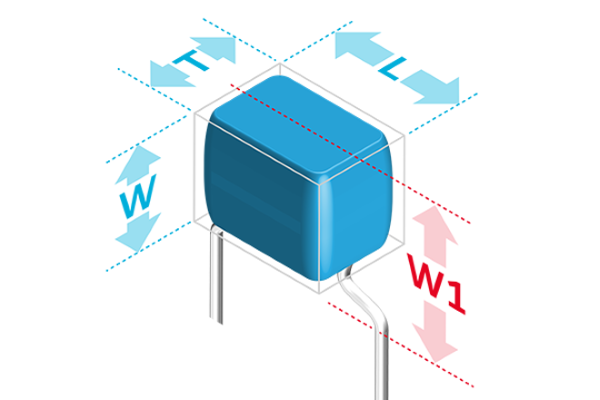 ※3 製品寸法(L×T×W×W1)