Consent Details [#IABV2SETTINGS#] About This website uses cookies This website uses cookies and similar technologies. CASIO Europe GmbH, Casio-Platz 1, D-22848 Norderstedt, GERMANY (referred to here as ‘CASIO’, ‘we‘, ‘our’ or ‘us‘) uses cookies,…

This website uses cookies
This website uses cookies and similar technologies.
CASIO Europe GmbH, Casio-Platz 1, D-22848 Norderstedt, GERMANY (referred to here as ‘CASIO’, ‘we‘, ‘our’ or ‘us‘) uses cookies, web beacons, pixels and plug-ins (collectively referred to as ‘cookies and similar technologies’). When you visit this website [www.casio.com/europe
] [gshock.casio.com/europe
] (‘the website‘) CASIO or service providers acting on behalf of CASIO (i) store information, including personal data, on your end device and/or (ii) obtain access to information, including personal data, stored on your end device and/or (iii) collect, store and process information, including personal data, about you using cookies and similar technologies for the specified purpose or purposes as described and subject to the limitations below.
We use strictly necessary cookies and similar technologies that are required to visit the website and use the functions of the website. We use these cookies and similar technologies to the extent that they are necessary to enable the functions of the website that you have requested. Further information (e.g. the legal basis of our actions, more detailed descriptions of purposes, retention periods, recipients of the data, your rights, contact options etc.) can be found in our Notes on cookies and similar technologies
.
Please select whether you agree to the use of further cookies and similar technologies as described below, or click on ‘Refuse’ to continue without giving your consent:
With your consent, we may also use other cookies and similar technologies. To consent to the use of additional cookies and similar technologies for all categories listed below, please click on the ‘Accept all’ button. To consent to the use of additional cookies and similar technologies for certain categories only, please select the categories for which you wish to give your consent by ticking the box of the relevant category and clicking the ‘Accept selected’ button. If you do not wish to give your consent, please click on the ‘Refuse’ button. Once you have made your selection, you can browse the website and cookies and similar technologies will be stored on your device in accordance with the selected categories. Further information (e.g. the legal basis of our actions, along with more detailed descriptions of purposes, retention periods, recipients of the data, your rights, contact options etc.) can be found in our Notes on cookies and similar technologies
. As described in our Notes on cookies and similar technologies
, you can withdraw your consent or change your selection at any time with effect for the future at our Cookie Control Centre
. Such revocation does not affect the lawfulness of the processing prior to the revocation of consent. The Cookie Control Centre can be accessed via [https://www.casio.com/europe/cookie/
].
[#GPC_BANNER_ICON#]
[#GPC_TOAST_TEXT#]
Consent Selection
Necessary
Preferences
Statistics
Marketing
Show details
Details
-
Necessary 19
Necessary cookies help to make a website usable by enabling basic functions such as page navigation and access to secure areas of the website. The website cannot function properly without these cookies.
-
Adobe Inc.
1
Learn more about this provider
TEST_AMCV_COOKIE_WRITEDetermines whether the user has accepted the cookie consent box.
Maximum Storage Duration: SessionType: HTTP Cookie
-
Casio
5
Learn more about this provider
AKA_A2This cookie is necessary for the cache function. A cache is used by the website to optimize the response time between the visitor and the website. The cache is usually stored on the visitor’s browser.
Maximum Storage Duration: 1 dayType: HTTP Cookie
PHPSESSIDPreserves user session state across page requests.
Maximum Storage Duration: SessionType: HTTP Cookie
**affinity [x2]**Registers which server-cluster is serving the visitor. This is used in context with load balancing, in order to optimize user experience.
Maximum Storage Duration: SessionType: HTTP Cookie
_xsdTechnical identifier used to support script loading and session handling.
Maximum Storage Duration: PersistentType: HTML Local Storage
-
Google
1
Learn more about this provider
Some of the data collected by this provider is for the purposes of personalization and measuring advertising effectiveness. The provider may use the IP Addresses for ads measurement and ads personalization.
test_cookieUsed to check if the user's browser supports cookies.
Maximum Storage Duration: 1 dayType: HTTP Cookie
-
RTB House
2
Learn more about this provider
cUsed in order to detect spam and improve the website's security.
Maximum Storage Duration: 1 yearType: HTTP Cookie
tsThis cookie is necessary for the PayPal login-function on the website.
Maximum Storage Duration: 1 yearType: HTTP Cookie
-
Soundcloud
1
Learn more about this provider
datadomeUsed in context with the website's BotManager. The BotManager detects, categorizes and compiles reports on potential bots trying to access the website.
Maximum Storage Duration: SessionType: HTTP Cookie
-
eugtm.casio.com
consent.cookiebot.com
4
**CookieConsent [x4]**Stores the user's cookie consent state for the current domain
Maximum Storage Duration: 1 yearType: HTTP Cookie
-
maptiler.com
1
_cfuvidThis cookie is a part of the services provided by Cloudflare - Including load-balancing, deliverance of website content and serving DNS connection for website operators.
Maximum Storage Duration: SessionType: HTTP Cookie
-
members.casio.jp
2
AWSALBRegisters which server-cluster is serving the visitor. This is used in context with load balancing, in order to optimize user experience.
Maximum Storage Duration: 7 daysType: HTTP Cookie
AWSALBCORSRegisters which server-cluster is serving the visitor. This is used in context with load balancing, in order to optimize user experience.
Maximum Storage Duration: 7 daysType: HTTP Cookie
-
widget.sndcdn.com
1
sc_anonymous_idUsed in context with the 3D-view-function on the website.
Maximum Storage Duration: 10 yearsType: HTTP Cookie
-
www.mczbf.com
1
cjConsentStores the user's cookie consent state for the current domain
Maximum Storage Duration: 13 monthsType: HTTP Cookie
-
Preferences 1
Preference cookies and similar technologies enable us to remember your choices, preferences and the settings you make (e.g. language, region, text size, font). Further details can be found in our Notes on cookies and similar technologies
.
-
RTB House
1
Learn more about this provider
gUsed in context with the language setting on the website. Facilitates the translation into the preferred language of the visitor.
Maximum Storage Duration: 1 yearType: HTTP Cookie
-
Statistics 18
Statistical cookies and similar technologies enable us to collect information about the use and extent of use of the website by individual users with a view to improving our website. This includes general usage of the website and areas favoured by users, enabling us to improve the website’s performance. Further details can be found in our Notes on cookies and similar technologies
.
-
Adobe Inc.
4
Learn more about this provider
com.adobe.reactor.core.maxFrequency.RL#.dayContains data on user navigation, interaction and time spent on the website and its sub-pages. This data is used to optimise the relevance of advertisements and for statistical purposes.
Maximum Storage Duration: PersistentType: HTML Local Storage
**AMCV_#**Unique user ID that recognizes the user on returning visits
Maximum Storage Duration: 2 yearsType: HTTP Cookie
AMCVS_#AdobeOrgThis is a pattern type cookie name associated with Adobe Marketing Cloud. It stores a unique visitor identifier, and uses an organisation identifier.
Maximum Storage Duration: SessionType: HTTP Cookie
s_ccUsed to check if the user's browser supports cookies.
Maximum Storage Duration: SessionType: HTTP Cookie
-
Appnexus
1
Learn more about this provider
bounceDetermines if a user leaves the website straight away. This information is used for internal statistics and analytics by the website operator.
Maximum Storage Duration: SessionType: Pixel Tracker
-
Arm Treasure Data
2
Learn more about this provider
**_td [x2]**Registers statistical data on users' behaviour on the website. Used for internal analytics by the website operator.
Maximum Storage Duration: 2 yearsType: HTTP Cookie
-
Casio
5
Learn more about this provider
FPAUAssigns a specific ID to the visitor. This allows the website to determine the number of specific user-visits for analysis and statistics.
Maximum Storage Duration: 3 monthsType: HTTP Cookie
FPIDRegisters statistical data on users' behaviour on the website. Used for internal analytics by the website operator.
Maximum Storage Duration: 400 daysType: HTTP Cookie
FPLCRegisters a unique ID that is used to generate statistical data on how the visitor uses the website.
Maximum Storage Duration: 1 dayType: HTTP Cookie
gtmBrowserIdThis cookie is used to determine if the visitor has visited the website before, or if it is a new visitor on the website.
Maximum Storage Duration: PersistentType: HTML Local Storage
**b/ss/#/1/#/s#**Registers data on visitors' website-behaviour. This is used for internal analysis and website optimization.
Maximum Storage Duration: SessionType: Pixel Tracker
-
Google
1
Learn more about this provider
Some of the data collected by this provider is for the purposes of personalization and measuring advertising effectiveness. The provider may use the IP Addresses for ads measurement and ads personalization.
_gatUsed to send data to Google Analytics about the visitor's device and behavior. Tracks the visitor across devices and marketing channels.
Maximum Storage Duration: 1 dayType: HTTP Cookie
-
Microsoft
1
Learn more about this provider
_cltkRegisters statistical data on users' behaviour on the website. Used for internal analytics by the website operator.
Maximum Storage Duration: SessionType: HTML Local Storage
-
Outbrain
3
Learn more about this provider
**dicbo_id [x3]**Collects statistics concerning the visitors' use of the website and its general functionality. This is used to optimize and compile reports on the website for comparison through a third party analysis service.
Maximum Storage Duration: 1 dayType: HTTP Cookie
-
Soundcloud
1
Learn more about this provider
**number(#)**Used to track user’s interaction with embedded content.
Maximum Storage Duration: SessionType: HTML Local Storage
-
Marketing 59
Marketing cookies and similar technologies enable us to collect information about the use and extent of use of the website by individual users. This includes whether a user has visited the website before, which website the user has come from, how the website is used overall and which areas users favour so that we can improve the performance of the website and the user’s experience when using the website. This also enables us to analyse the effectiveness of our marketing activities and provide targeted advertising tailored to your interests. Further details can be found in our Notes on cookies and similar technologies
.
-
Adobe Inc.
6
Learn more about this provider
com.adobe.reactor.core.visitorTracking.landingPageStores visitors' navigation by registering landing pages - This allows the website to present relevant products and/or measure their advertisement efficiency on other websites.
Maximum Storage Duration: SessionType: HTML Local Storage
com.adobe.reactor.core.visitorTracking.landingTimeSets a timestamp for when the visitor entered the website. This is used for analytical purposes on the website.
Maximum Storage Duration: SessionType: HTML Local Storage
com.adobe.reactor.core.visitorTracking.pagesViewedContains data on user navigation, interaction and time spent on the website and its sub-pages. This data is used to optimise the relevance of advertisements and for statistical purposes.
Maximum Storage Duration: PersistentType: HTML Local Storage
com.adobe.reactor.core.visitorTracking.sessionCountContains data on user navigation, interaction and time spent on the website and its sub-pages. This data is used to optimise the relevance of advertisements and for statistical purposes.
Maximum Storage Duration: PersistentType: HTML Local Storage
com.adobe.reactor.core.visitorTracking.trafficSourceUsed by the website's owners to identify how the visitor accessed the website. This is used for statistical purposes.
Maximum Storage Duration: SessionType: HTML Local Storage
demdexVia a unique ID that is used for semantic content analysis, the user's navigation on the website is registered and linked to offline data from surveys and similar registrations to display targeted ads.
Maximum Storage Duration: 180 daysType: HTTP Cookie
-
Appnexus
3
Learn more about this provider
anjRegisters a unique ID that identifies a returning user's device. The ID is used for targeted ads.
Maximum Storage Duration: 3 monthsType: HTTP Cookie
uuid2Registers a unique ID that identifies a returning user's device. The ID is used for targeted ads.
Maximum Storage Duration: 3 monthsType: HTTP Cookie
XANDR_PANIDThis cookie registers data on the visitor. The information is used to optimize advertisement relevance.
Maximum Storage Duration: 3 monthsType: HTTP Cookie
-
Casio
16
Learn more about this provider
_dcidCollects information on user behaviour on multiple websites. This information is used in order to optimize the relevance of advertisement on the website.
Maximum Storage Duration: 400 daysType: HTTP Cookie
_fbpUsed by Facebook to deliver a series of advertisement products such as real time bidding from third party advertisers.
Maximum Storage Duration: 3 monthsType: HTTP Cookie
_gaUsed to send data to Google Analytics about the visitor's device and behavior. Tracks the visitor across devices and marketing channels.
Maximum Storage Duration: 2 yearsType: HTTP Cookie
**_ga_#**Used to send data to Google Analytics about the visitor's device and behavior. Tracks the visitor across devices and marketing channels.
Maximum Storage Duration: 2 yearsType: HTTP Cookie
_gcl_auUsed by Google AdSense for experimenting with advertisement efficiency across websites using their services.
Maximum Storage Duration: 3 monthsType: HTTP Cookie
_gtmeecUsed to temporarily store and process ecommerce-related interaction data in order to ensure reliable analytics event tracking across page loads.
Maximum Storage Duration: 3 monthsType: HTTP Cookie
_td_ssc_idRegisters data on visitors' website-behaviour. This is used for internal analysis and website optimization.
Maximum Storage Duration: 400 daysType: HTTP Cookie
_ttpUsed by the social networking service, TikTok, for tracking the use of embedded services.
Maximum Storage Duration: 13 monthsType: HTTP Cookie
**AwinChannelCookie [x3]**Used to attribute sales or leads to Awin affiliate partners and to enable affiliate commission billing.
Maximum Storage Duration: SessionType: HTTP Cookie
s_ecidSets a unique ID for the visitor, that allows third party advertisers to target the visitor with relevant advertisement. This pairing service is provided by third party advertisement hubs, which facilitates real-time bidding for advertisers.
Maximum Storage Duration: 400 daysType: HTTP Cookie
**ServerAwinChannelCookie [x3]**Used to attribute sales or leads to Awin's affiliate partners and to enable the billing of affiliate commissions.
Maximum Storage Duration: 30 daysType: HTTP Cookie
_gcl_lsTracks the conversion rate between the user and the advertisement banners on the website - This serves to optimise the relevance of the advertisements on the website.
Maximum Storage Duration: PersistentType: HTML Local Storage
-
Google
4
Learn more about this provider
Some of the data collected by this provider is for the purposes of personalization and measuring advertising effectiveness. The provider may use the IP Addresses for ads measurement and ads personalization.
_gidUsed to send data to Google Analytics about the visitor's device and behavior. Tracks the visitor across devices and marketing channels.
Maximum Storage Duration: 1 dayType: HTTP Cookie
IDEUsed by Google DoubleClick to register and report the website user's actions after viewing or clicking one of the advertiser's ads with the purpose of measuring the efficacy of an ad and to present targeted ads to the user.
Maximum Storage Duration: 400 daysType: HTTP Cookie
**gmp\conversion#**Pending
Maximum Storage Duration: SessionType: Pixel Tracker
**pagead/1p-user-list/#**Tracks if the user has shown interest in specific products or events across multiple websites and detects how the user navigates between sites. This is used for measurement of advertisement efforts and facilitates payment of referral-fees between websites.
Maximum Storage Duration: SessionType: Pixel Tracker
-
Microsoft
8
Learn more about this provider
_uetsidUsed to track visitors on multiple websites, in order to present relevant advertisement based on the visitor's preferences.
Maximum Storage Duration: PersistentType: HTML Local Storage
_uetsid_expContains the expiry-date for the cookie with corresponding name.
Maximum Storage Duration: PersistentType: HTML Local Storage
_uetvidUsed to track visitors on multiple websites, in order to present relevant advertisement based on the visitor's preferences.
Maximum Storage Duration: PersistentType: HTML Local Storage
_uetvid_expContains the expiry-date for the cookie with corresponding name.
Maximum Storage Duration: PersistentType: HTML Local Storage
MRUsed to track visitors on multiple websites, in order to present relevant advertisement based on the visitor's preferences.
Maximum Storage Duration: 7 daysType: HTTP Cookie
MUIDUsed widely by Microsoft as a unique user ID. The cookie enables user tracking by synchronising the ID across many Microsoft domains.
Maximum Storage Duration: 1 yearType: HTTP Cookie
_uetsidCollects data on visitor behaviour from multiple websites, in order to present more relevant advertisement - This also allows the website to limit the number of times that they are shown the same advertisement.
Maximum Storage Duration: 1 dayType: HTTP Cookie
_uetvidUsed to track visitors on multiple websites, in order to present relevant advertisement based on the visitor's preferences.
Maximum Storage Duration: 1 yearType: HTTP Cookie
-
Outbrain
1
Learn more about this provider
unifiedPixelCollects data on the user’s navigation and behavior on the website. This is used to compile statistical reports and heatmaps for the website owner.
Maximum Storage Duration: SessionType: Pixel Tracker
-
RTB House
2
Learn more about this provider
__rtbh.lidCollects information on user behaviour on multiple websites. This information is used in order to optimize the relevance of advertisement on the website.
Maximum Storage Duration: 1 yearType: HTTP Cookie
__rtbh.lidCollects information on user behaviour on multiple websites. This information is used in order to optimize the relevance of advertisement on the website.
Maximum Storage Duration: PersistentType: HTML Local Storage
-
Soundcloud
2
Learn more about this provider
dd_testcookiePending
Maximum Storage Duration: SessionType: HTTP Cookie
ddSession_datadomePending
Maximum Storage Duration: PersistentType: HTML Local Storage
-
YouTube
14
Learn more about this provider
__Secure-BUCKETPending
Maximum Storage Duration: 180 daysType: HTTP Cookie
__Secure-ROLLOUT_TOKENUsed to enable specific YouTube features or experiments, such as A/B testing.
Maximum Storage Duration: 180 daysType: HTTP Cookie
__Secure-YECStores the user's video player preferences using embedded YouTube video
Maximum Storage Duration: SessionType: HTTP Cookie
__Secure-YNIDUsed to track user’s interaction with embedded content.
Maximum Storage Duration: 180 daysType: HTTP Cookie
LAST_RESULT_ENTRY_KEYUsed to track user’s interaction with embedded content.
Maximum Storage Duration: SessionType: HTTP Cookie
LogsDatabaseV2:V#||LogsRequestsStoreUsed to track user’s interaction with embedded content.
Maximum Storage Duration: PersistentType: IndexedDB
ServiceWorkerLogsDatabase#SWHealthLogNecessary for the implementation and functionality of YouTube video-content on the website.
Maximum Storage Duration: PersistentType: IndexedDB
TESTCOOKIESENABLEDUsed to track user’s interaction with embedded content.
Maximum Storage Duration: 1 dayType: HTTP Cookie
VISITOR_INFO1_LIVETries to estimate the users' bandwidth on pages with integrated YouTube videos.
Maximum Storage Duration: 180 daysType: HTTP Cookie
YSCRegisters a unique ID to keep statistics of what videos from YouTube the user has seen.
Maximum Storage Duration: SessionType: HTTP Cookie
yt-icons-last-purgedNecessary for the implementation and functionality of YouTube video-content on the website.
Maximum Storage Duration: PersistentType: HTML Local Storage
ytidb::LAST_RESULT_ENTRY_KEYUsed to track user’s interaction with embedded content.
Maximum Storage Duration: PersistentType: HTML Local Storage
YtIdbMeta#databasesUsed to track user’s interaction with embedded content.
Maximum Storage Duration: PersistentType: IndexedDB
yt-player-caption-persistencePending
Maximum Storage Duration: PersistentType: HTML Local Storage
-
lantern.roeye.com
1
track.phpCollects data on the user across websites - This data is used to make advertisement more relevant.
Maximum Storage Duration: SessionType: Pixel Tracker
-
lantern.roeyecdn.com
1
lanternUsed for affiliate attribution. This cookie stores which partner or campaign a user came to the website through, enabling commission allocation.
Maximum Storage Duration: 30 daysType: HTTP Cookie
-
roeye.com
1
#_lanternUsed for affiliate attribution. This cookie stores which partner or campaign a user came to the website through, enabling commission allocation.
Maximum Storage Duration: 6 monthsType: HTTP Cookie
-
Unclassified 5
Unclassified cookies are cookies that we are currently trying to classify, together with providers of individual cookies.
Cross-domain consent3
Your consent applies to the following domains:
List of domains your consent applies to:
eustore.casio.com/europe/
gshock.casio.com/europe/
www.casio.com/europe/
Cookie declaration last updated on 9/30/26 by Cookiebot
[#IABV2_TITLE#]
[#IABV2_BODY_INTRO#]
[#IABV2_BODY_LEGITIMATE_INTEREST_INTRO#]
[#IABV2_BODY_PREFERENCE_INTRO#]
[#IABV2_LABEL_PURPOSES#]
[#IABV2_BODY_PURPOSES_INTRO#]
[#IABV2_BODY_PURPOSES#]
[#IABV2_LABEL_FEATURES#]
[#IABV2_BODY_FEATURES_INTRO#]
[#IABV2_BODY_FEATURES#]
[#IABV2_LABEL_PARTNERS#]
[#IABV2_BODY_PARTNERS_INTRO#]
[#IABV2_BODY_PARTNERS#]
About
When You visit Our website, We or an authorised third party may send You a cookie. Cookies are small text files which can be stored on your device. When You access a website, then a cookie which has been installed on your device will send information to the party which installed the cookie. Cookies are very common and are used on numerous websites. Every cookie generally contains the name of the domain from which it originates; its “life time” and usually the device’s IP address or another unique device number. It may thus also contain personal data, i.e. information on a specific or identifiable natural person.
Do not sell or share my personal information
Allow allCustomize
Allow selectionDeny
Skip to content
Personal Menu
Personal Menu
Added to Favorites
Press release
15.09.2026
G-SHOCK
G-SHOCK Launches New Pink Ribbon Special Edition to Support Breast Cancer Awareness
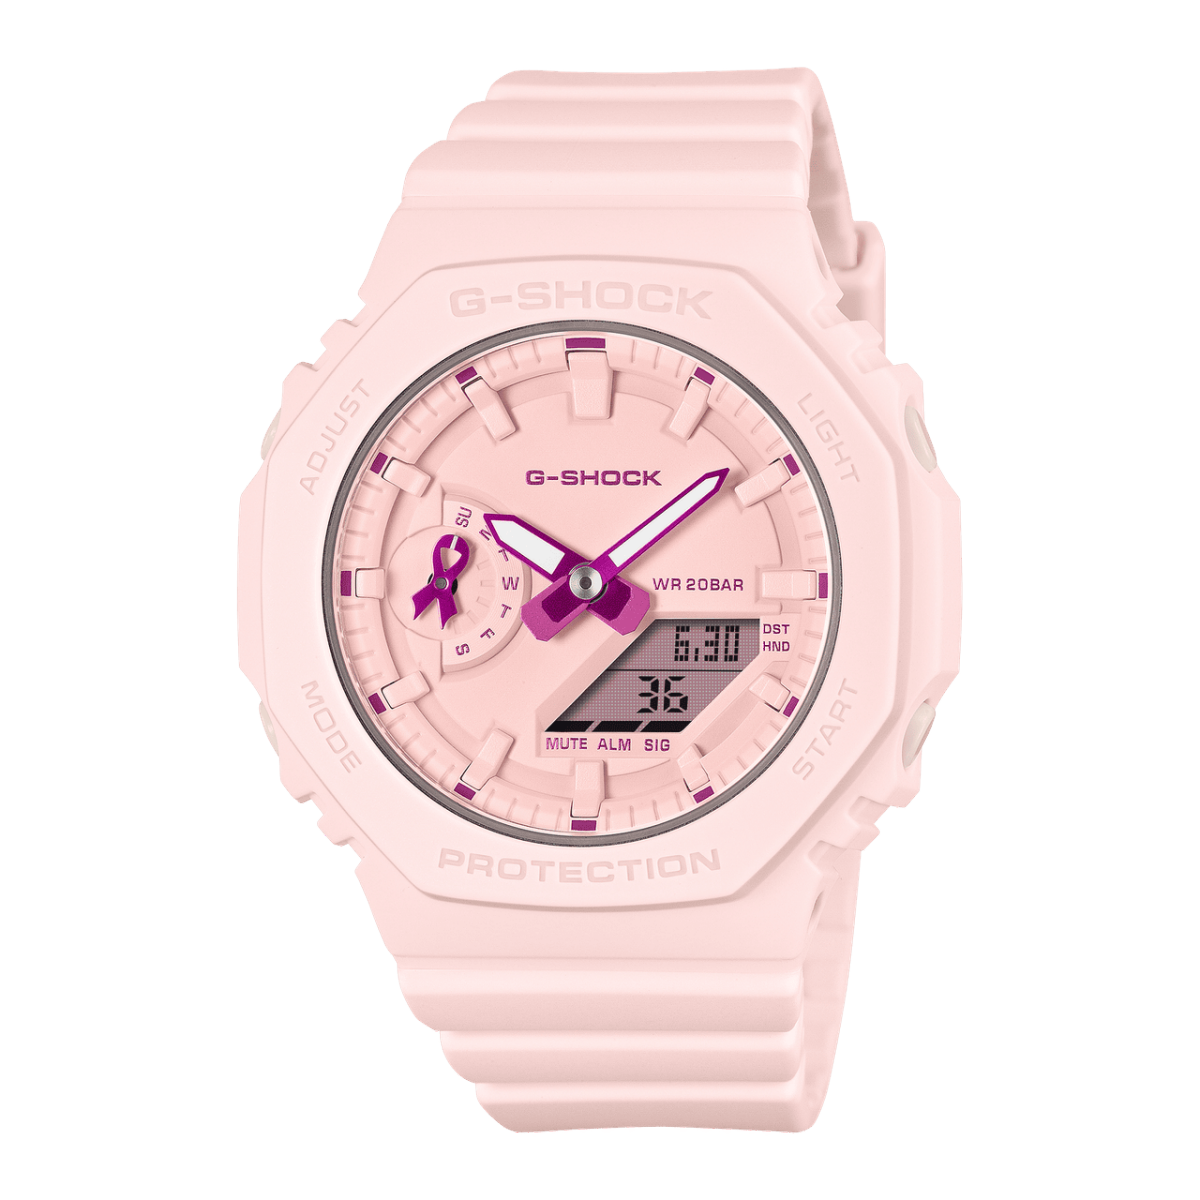
The new GMA-S2100PR-4AER Pink Ribbon combines iconic design with a commitment to breast cancer awareness

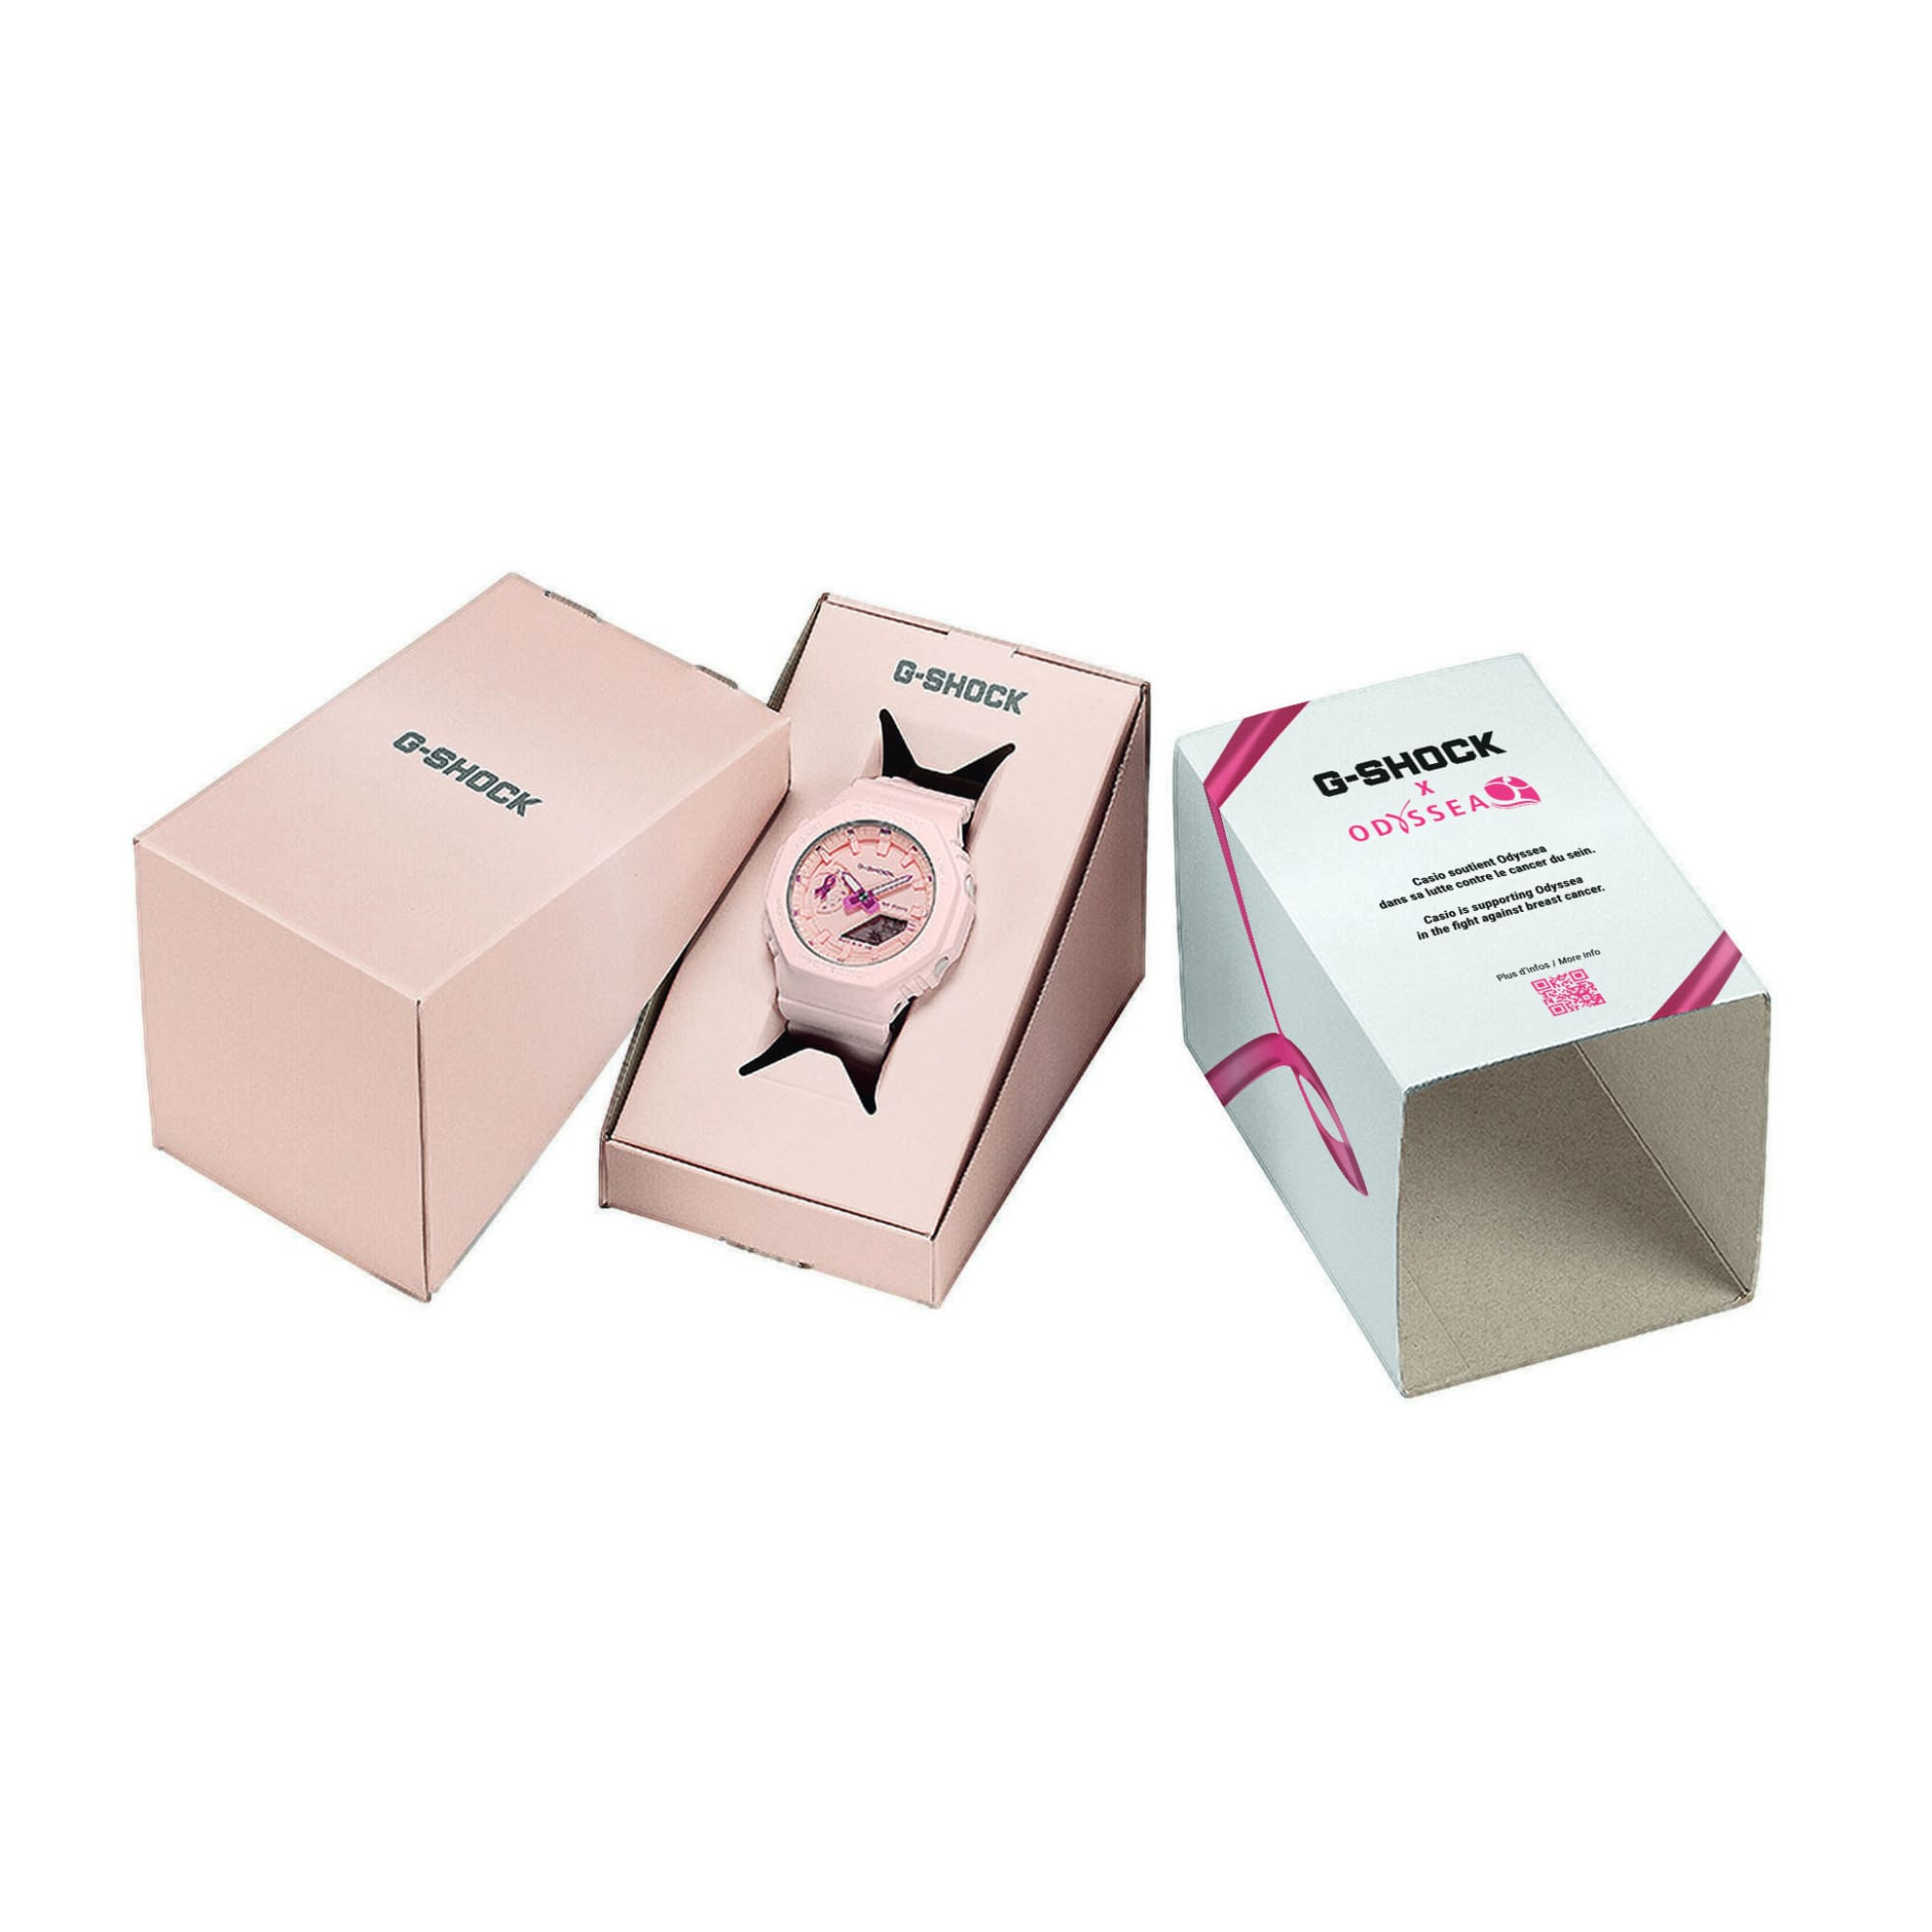
Norderstedt, 15th of September 2026 – In October, the international Breast Cancer Awareness Month, G-SHOCK introduces the new GMA-S2100PR-4AER Pink Ribbon. With this special edition, the brand aims to highlight the importance of early detection and awareness while supporting the French non-profit organization Odyssea with a donation. The organization is dedicated to prevention, research, and supporting those affected by breast cancer.
“At G-SHOCK, resilience and the determination to never give up are part of our DNA. With this special edition, we aim to shine a light on breast cancer awareness and support those affected by the disease. Together with Odyssea, we want to help raise awareness of prevention, early detection and the importance of community support. We are proud to contribute to an organization that provides meaningful assistance and hope to so many people”, says Olivier Grosjean, Directeur Division Montres at CASIO France.
Beyond the donation itself, the partnership aims to support Odyssea's awareness efforts throughout Breast Cancer Awareness Month, including activations at the Paris and La Réunion races. In addition, CASIO will sponsor charity race entries, giving employees the opportunity to take part in the Paris event, which is expected to welcome more than 50,000 participants.
Never Give Up: A Message That Connects
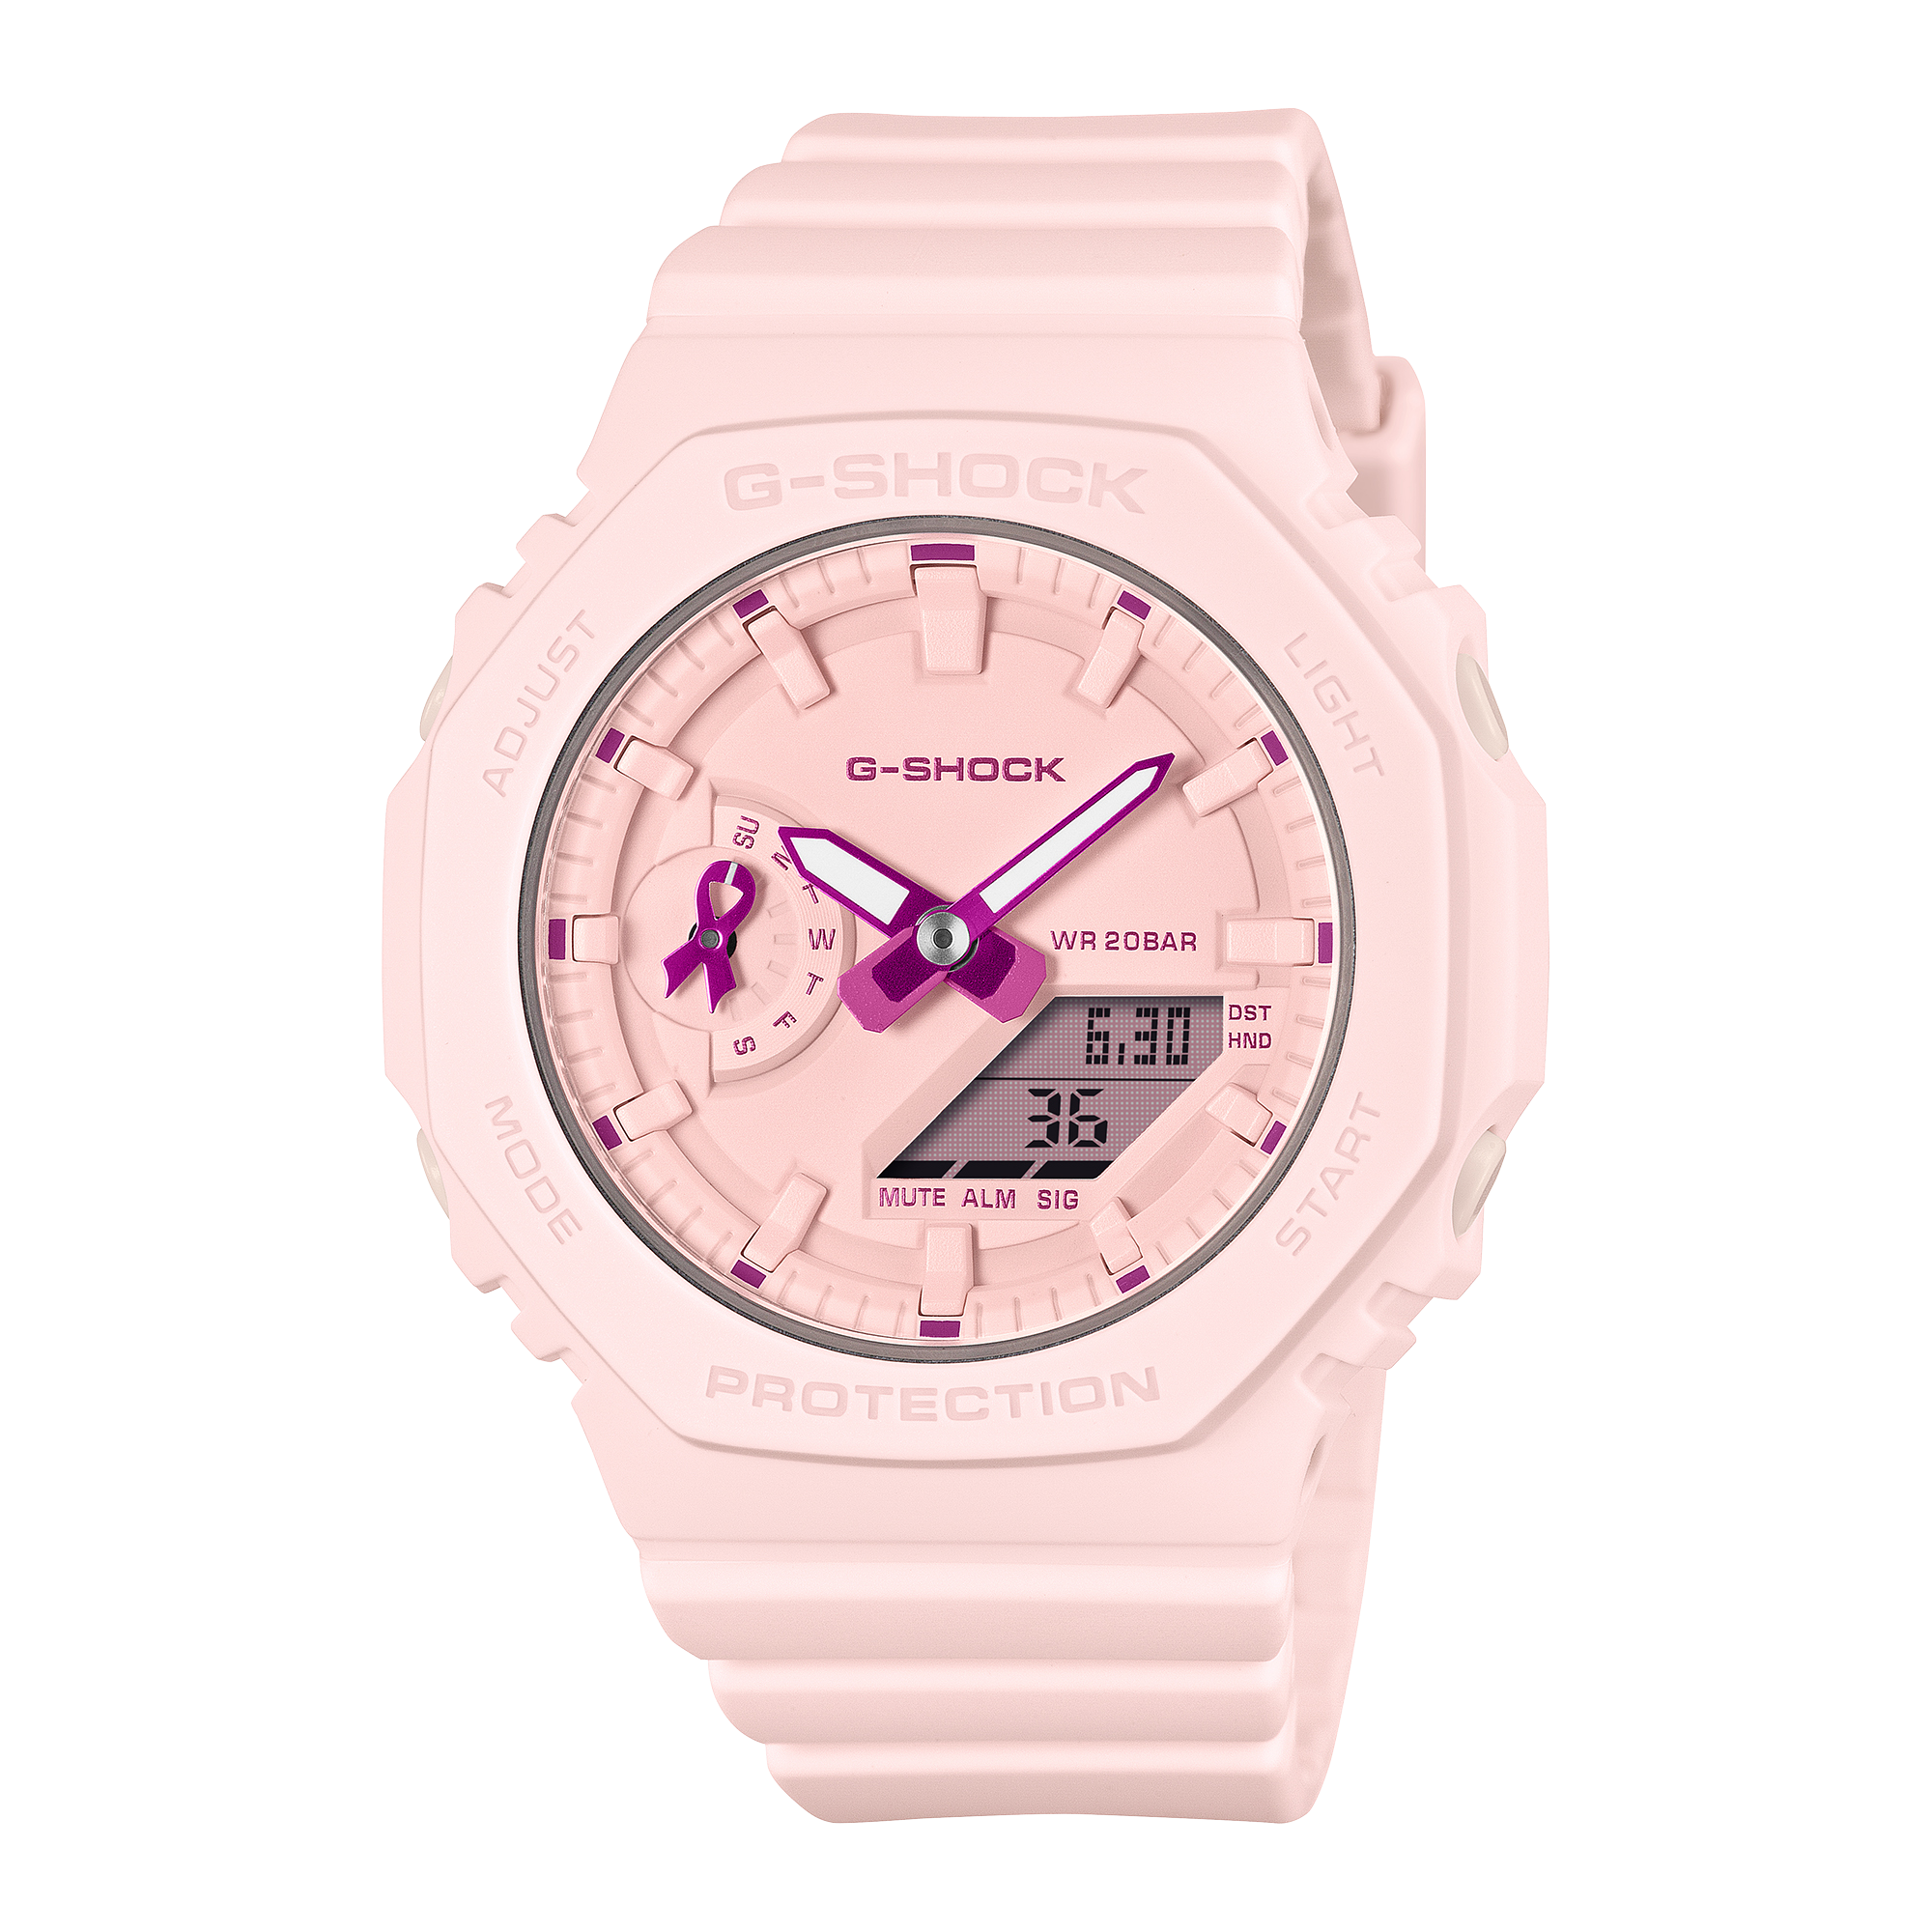
With the GMA-S2100PR-4AER, G-SHOCK supports Odyssea's mission and makes a statement for breast cancer awareness, solidarity, and hope. Inspired by the Pink Ribbon movement, the watch design incorporates its globally recognized symbol, making the message visible on the wrist. The pink design elements and ribbon motif represent unity, courage, and optimism, while highlighting the importance of awareness, early detection, and mutual support.
At the same time, the special edition embodies G-SHOCK's "Never Give Up" spirit. Since its inception, the brand has stood for resilience, determination, and the ability to overcome challenges. These are values that many people affected by breast cancer demonstrate every day and that are also reflected in the work of Odyssea.
Tough. Expressive. Supportive.
The analog-digital GMA-S2100PR-4AER combines G-SHOCK's renowned toughness with a meaningful message. Various shades of pink define the design and give the model its distinctive visual character. The ribbon motif positioned at the 9 o'clock marker references the international symbol of breast cancer awareness, making support for the cause an integral part of the watch's design.
The model's signature durability is ensured by its compact carbon fiber-reinforced case, bio-based resin band, and shock-resistant construction. Features include world time, stopwatch, countdown timer, multiple alarms, and a Neo-display for improved visibility in low-light conditions. The GMA-S2100PR-4AER is more than just a timepiece. It stands for solidarity, strength, and G-SHOCK's enduring message: "Never Give Up."
NEW
GMA-S2100PR-4A
Add to Bag
Old Model

GBX-H5600-1
Add to Bag
Old Model

GBX-H5600-2
Add to Bag
 Pink design elements on the dial
 A special edition package further emphasize the watch's message and distinctive character
The GMA-S2100PR-4A will be available from October 2026 with an MSRP of 99.90 euros at selected retailers and through the Casio and Odyssea Online Store.
Download the press release as a PDF
Odyssea
Odyssea is a French non-profit organization dedicated to the fight against breast cancer. Through sporting events, awareness campaigns, and fundraising initiatives, the organization supports research projects and programs aimed at improving the quality of life of people affected by breast cancer. Since 2002, when the association organised its first race around the Eiffel Tower, it has continued to grow and now offers a circuit of 12 races and walking events across France. More than 18 million euros has been raised and donated locally, thanks to the involvement of over 1.5 million participants. 2025 was a record-breaking year, with more than 2 million euros raised. In 2026, Odysséa aims to go even further!
G-SHOCK
G-SHOCK was born from the vision of creating an unbreakable watch. CASIO engineers developed the Triple 10 Concept, targeting a watch capable of withstanding a 10-meter drop, resisting 10 bar of water pressure, and operating for 10 years on a single battery. Since its launch in 1983, G-SHOCK has continuously evolved while staying true to this original concept. Today, the brand has established itself worldwide across fashion, sports, and music. In 2023, G-SHOCK celebrated its 40th anniversary, marking four decades of innovation and toughness.
News
**2026
| 2025
| 2024
| 2023
**
Products
Help & information
Corporate
Europe (English)
© 2026 CASIO Europe GmbH
Select a location
View all available locations
閉じる


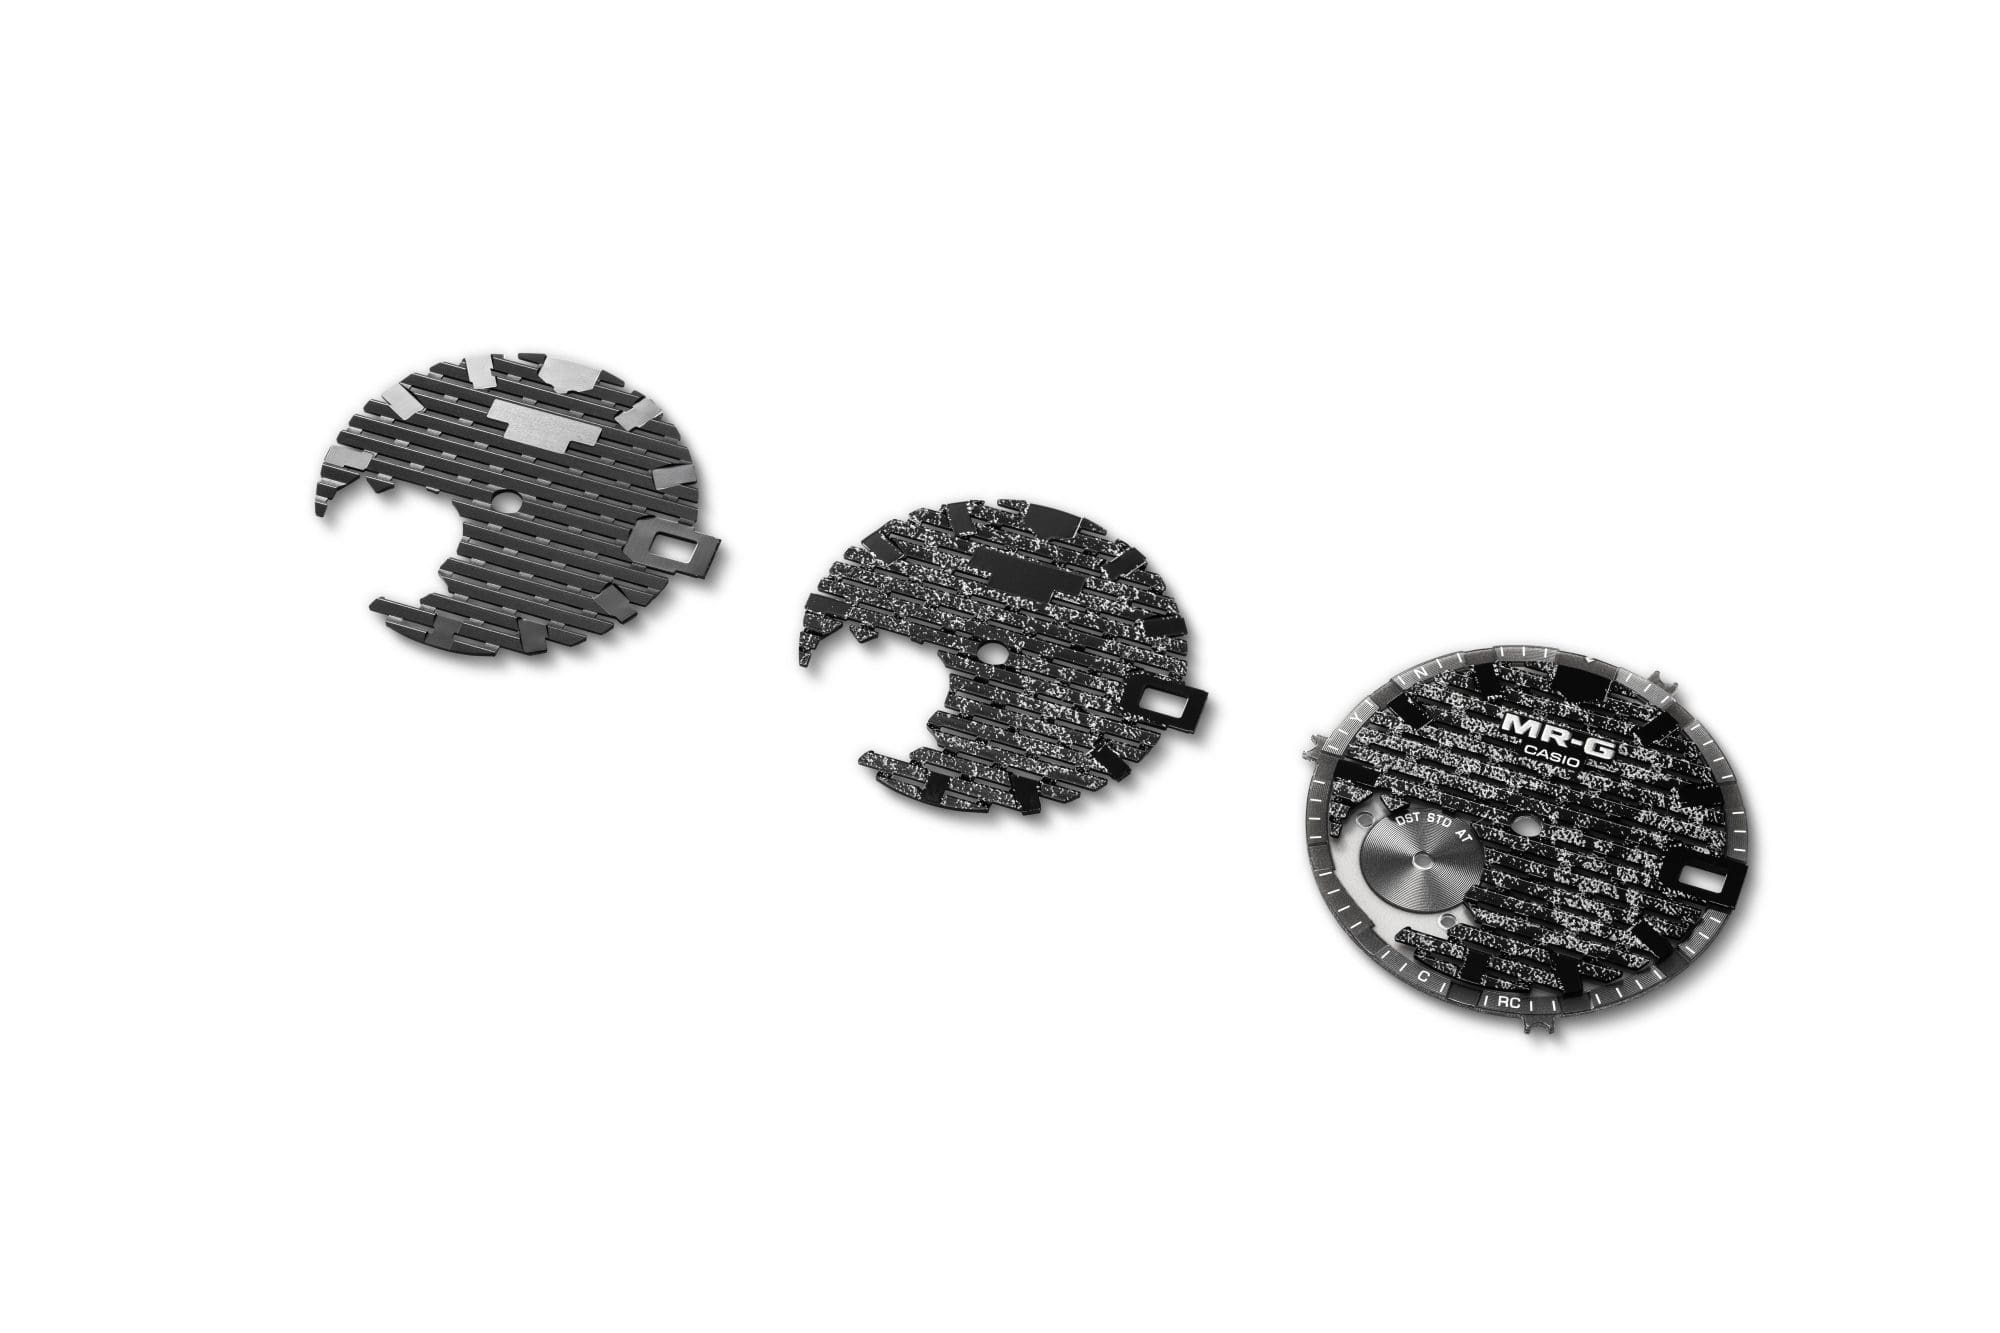
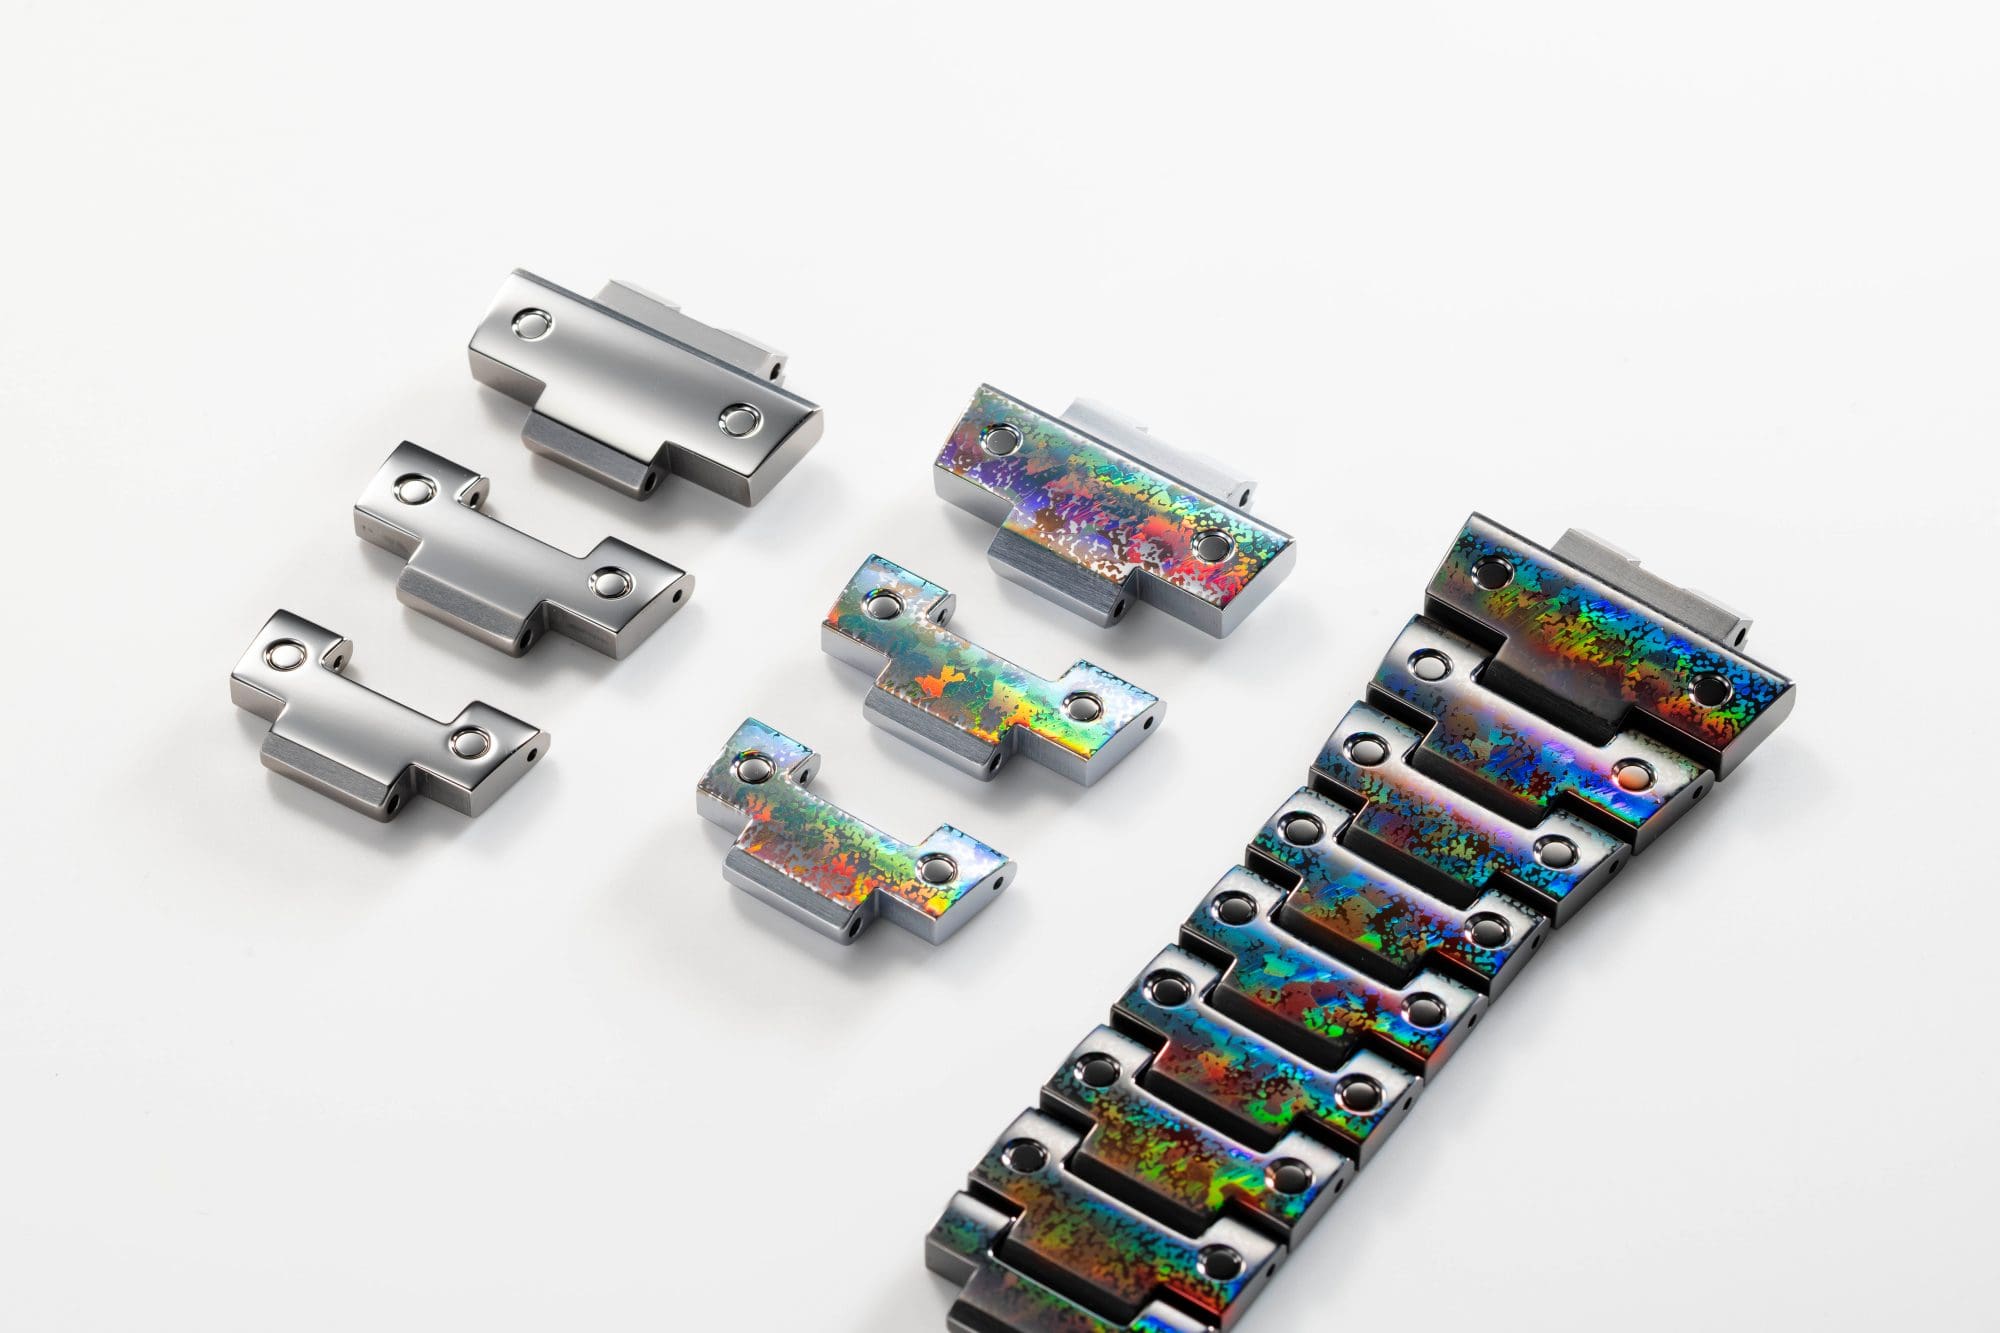


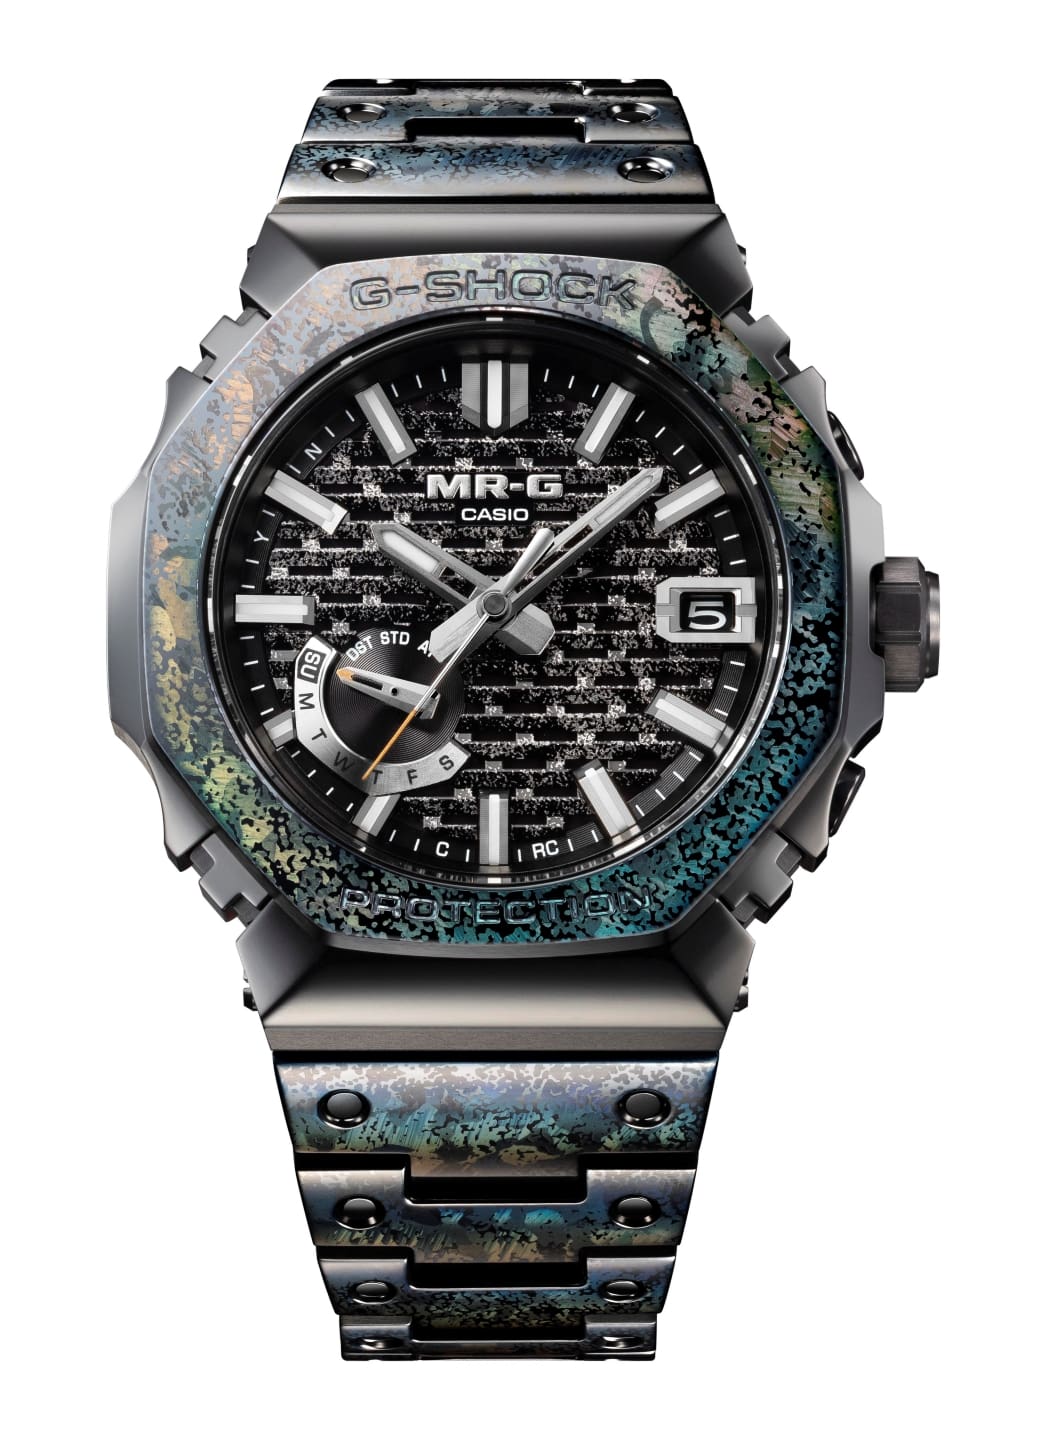



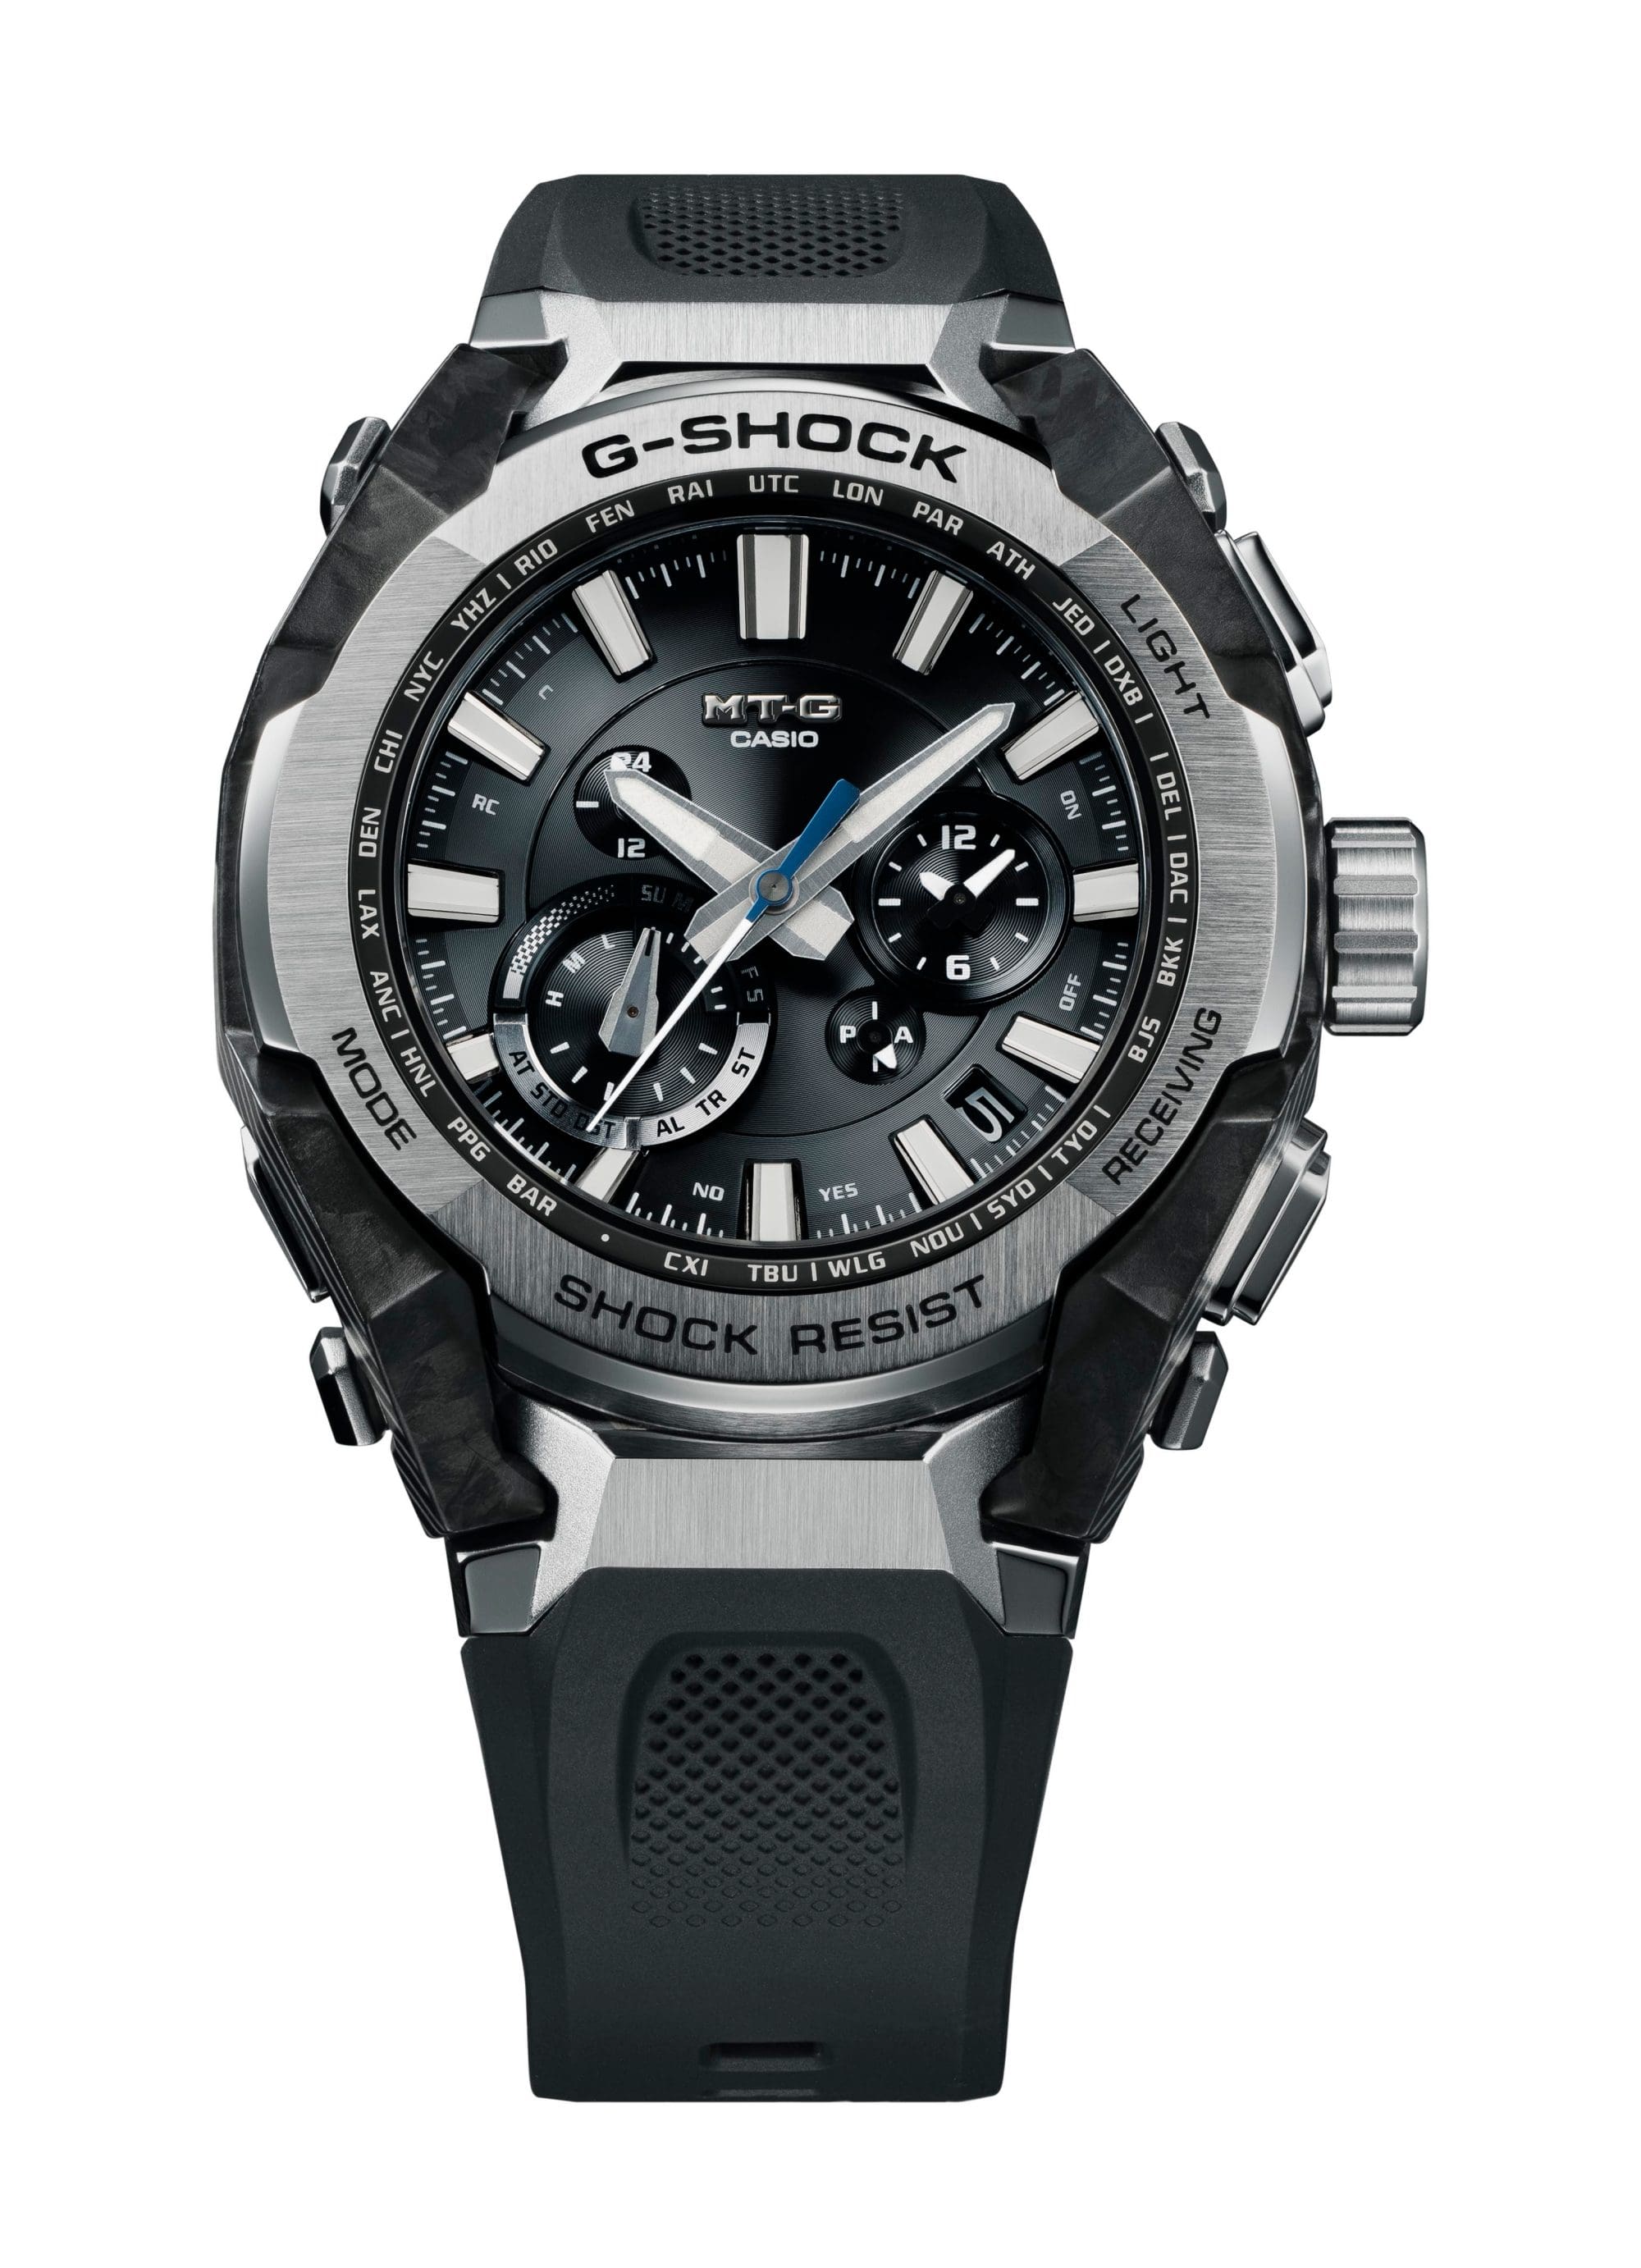
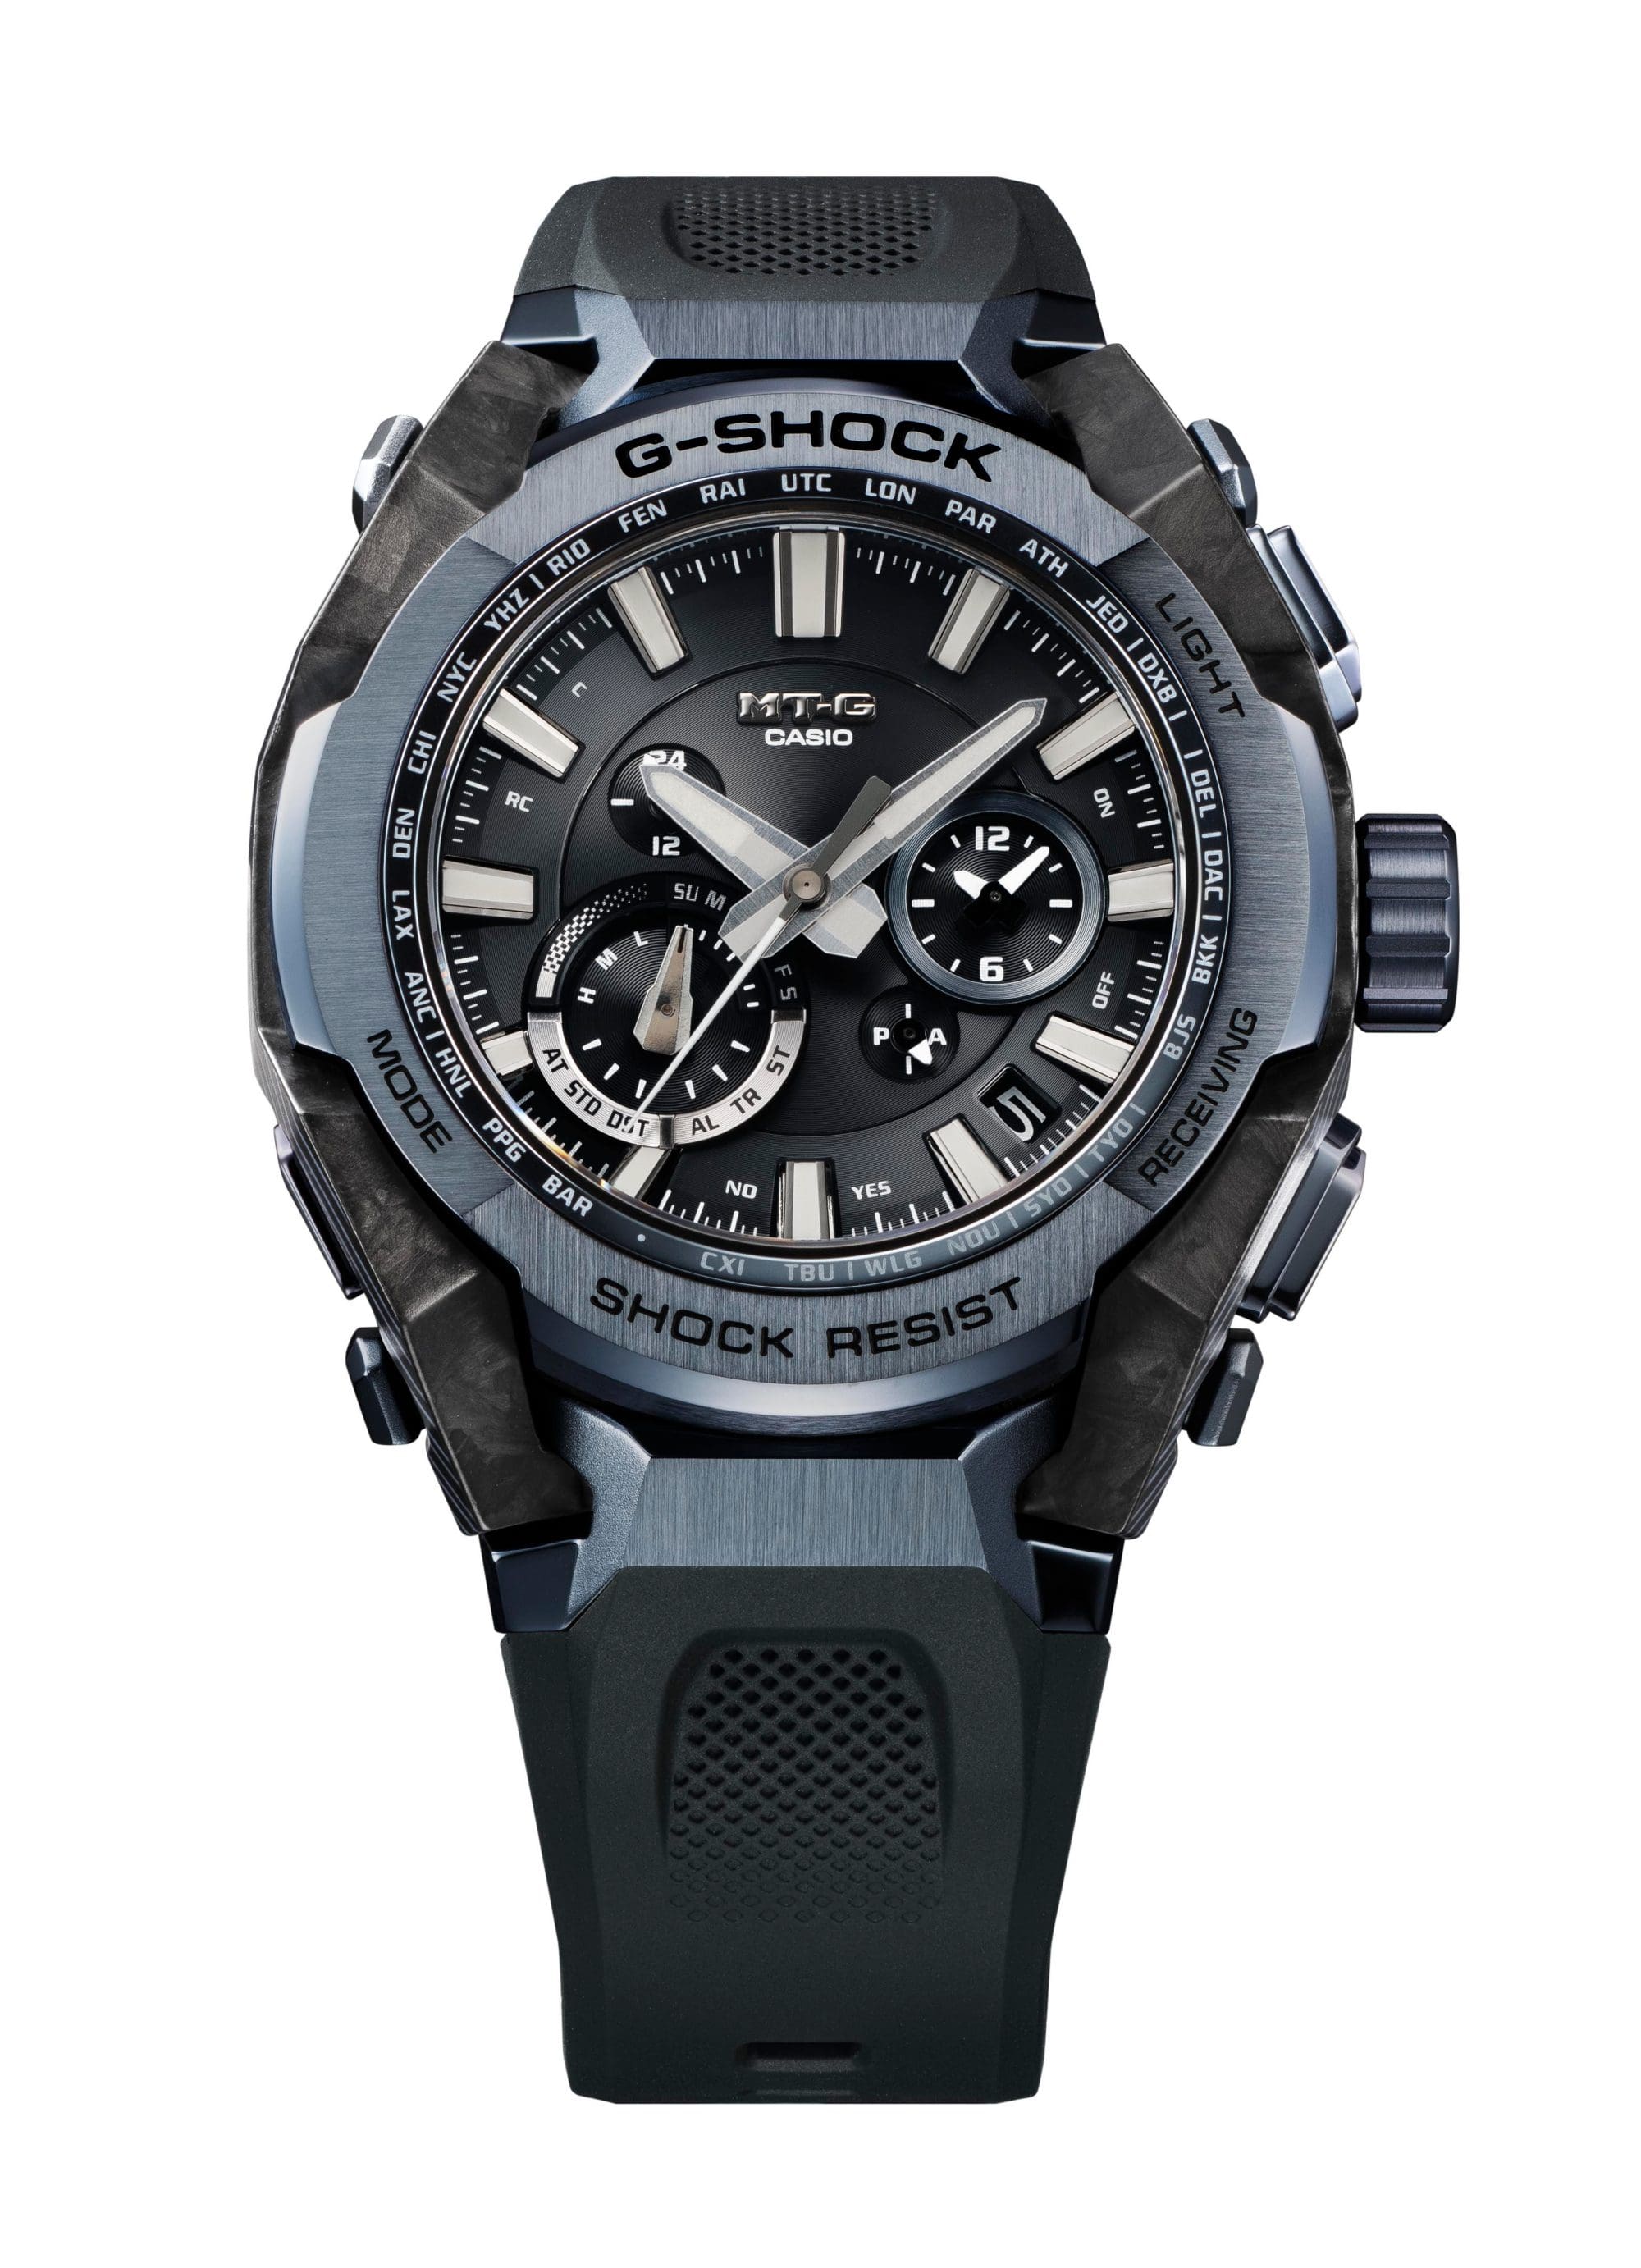
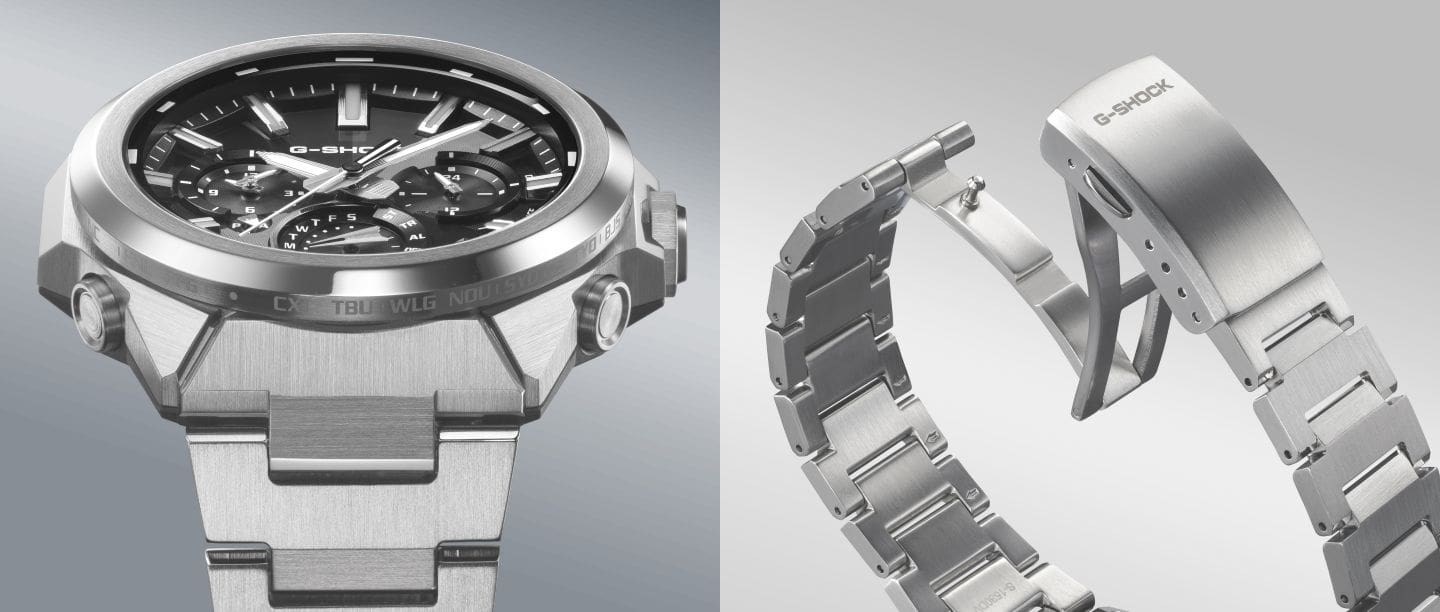
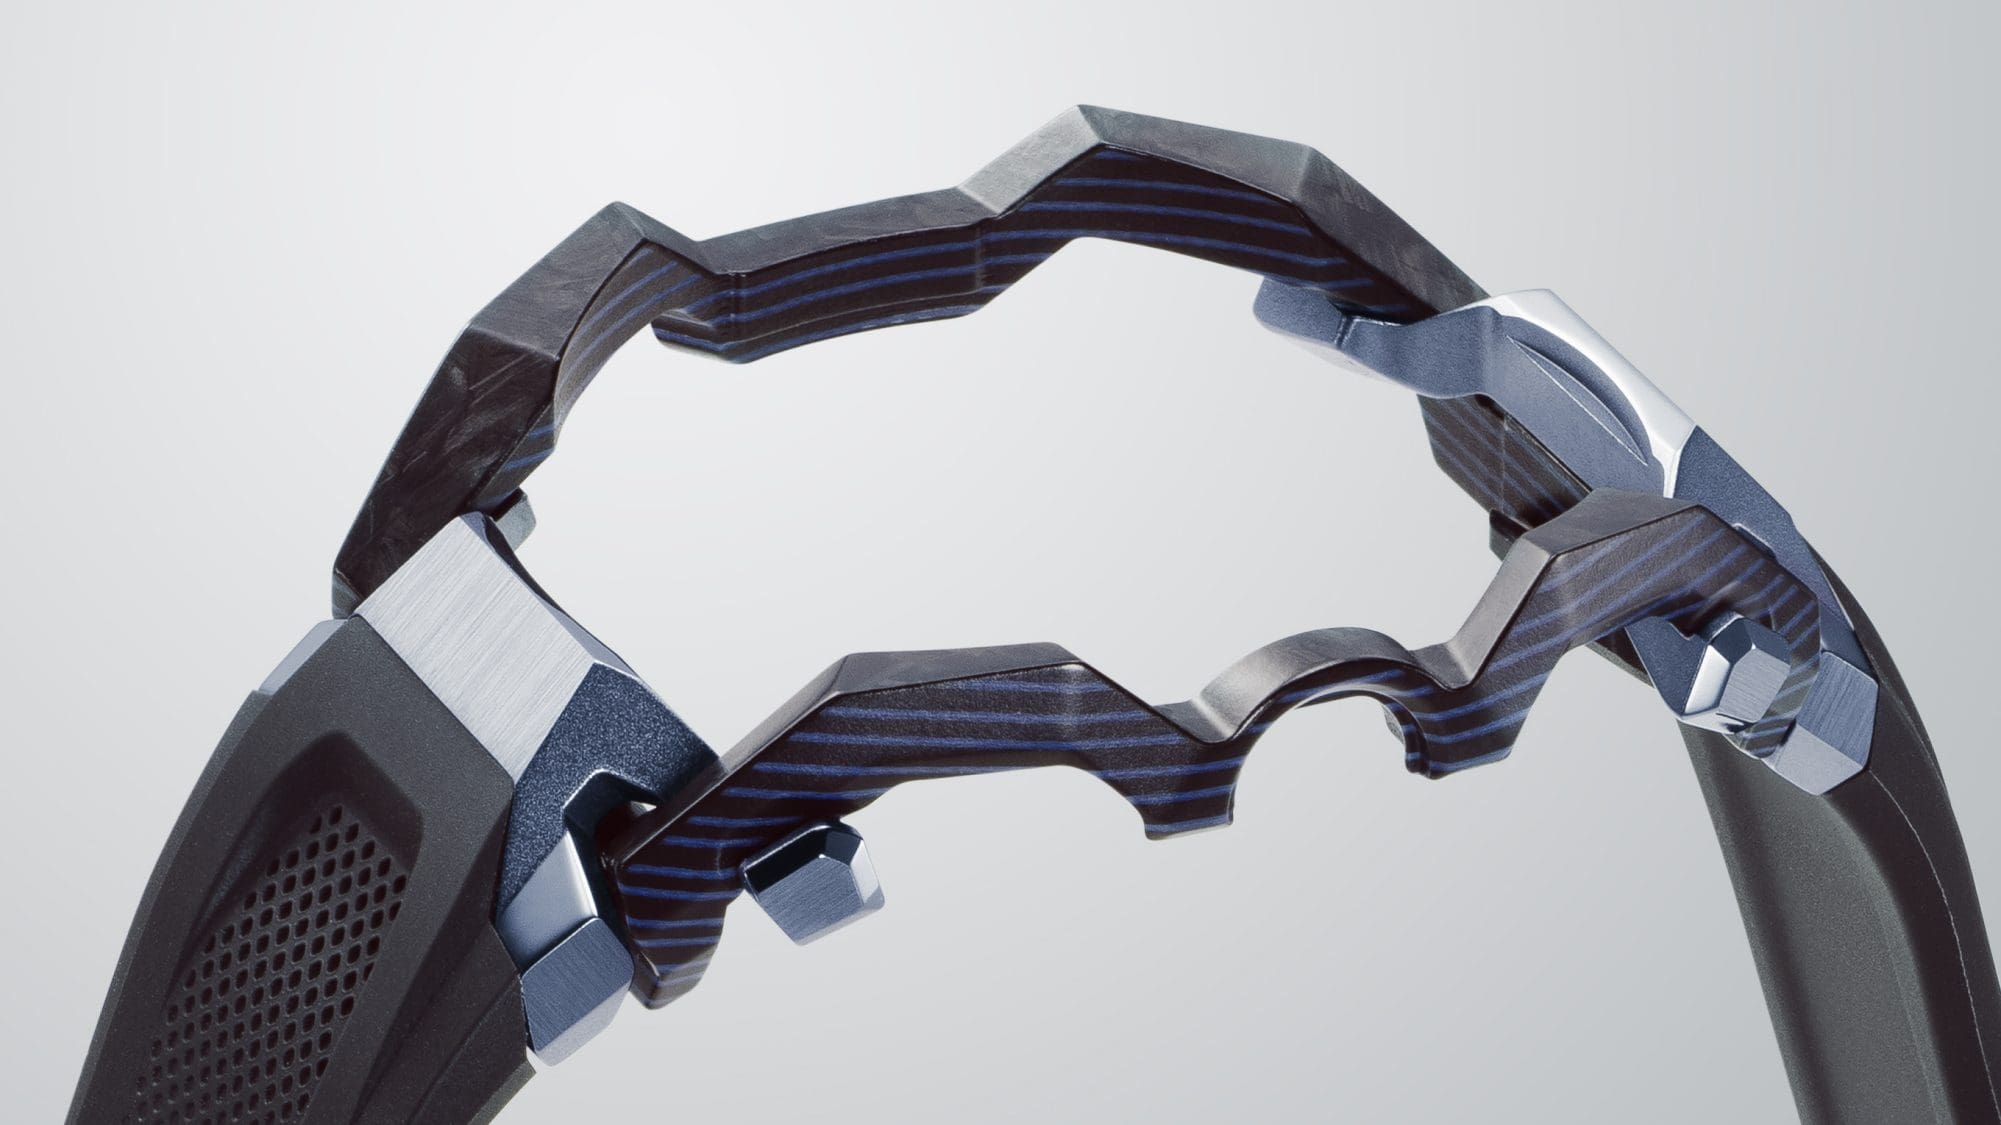 Distinctive frame design combining different materials, created through human-AI collaboration.
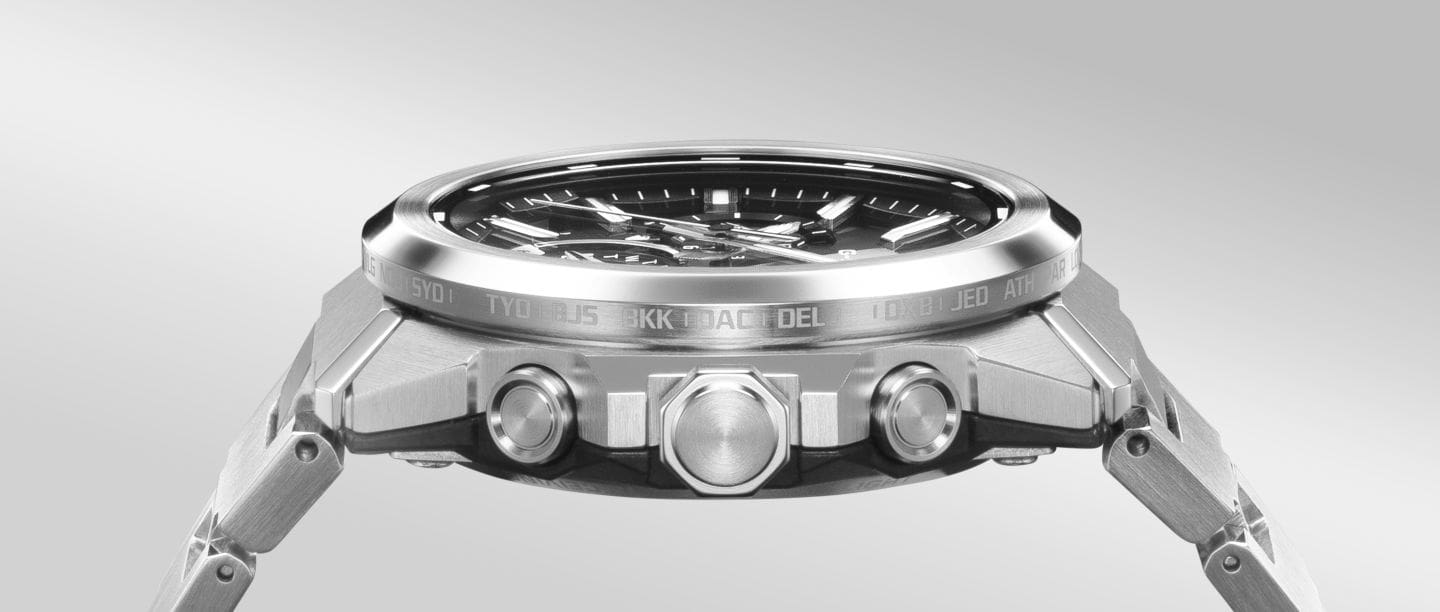
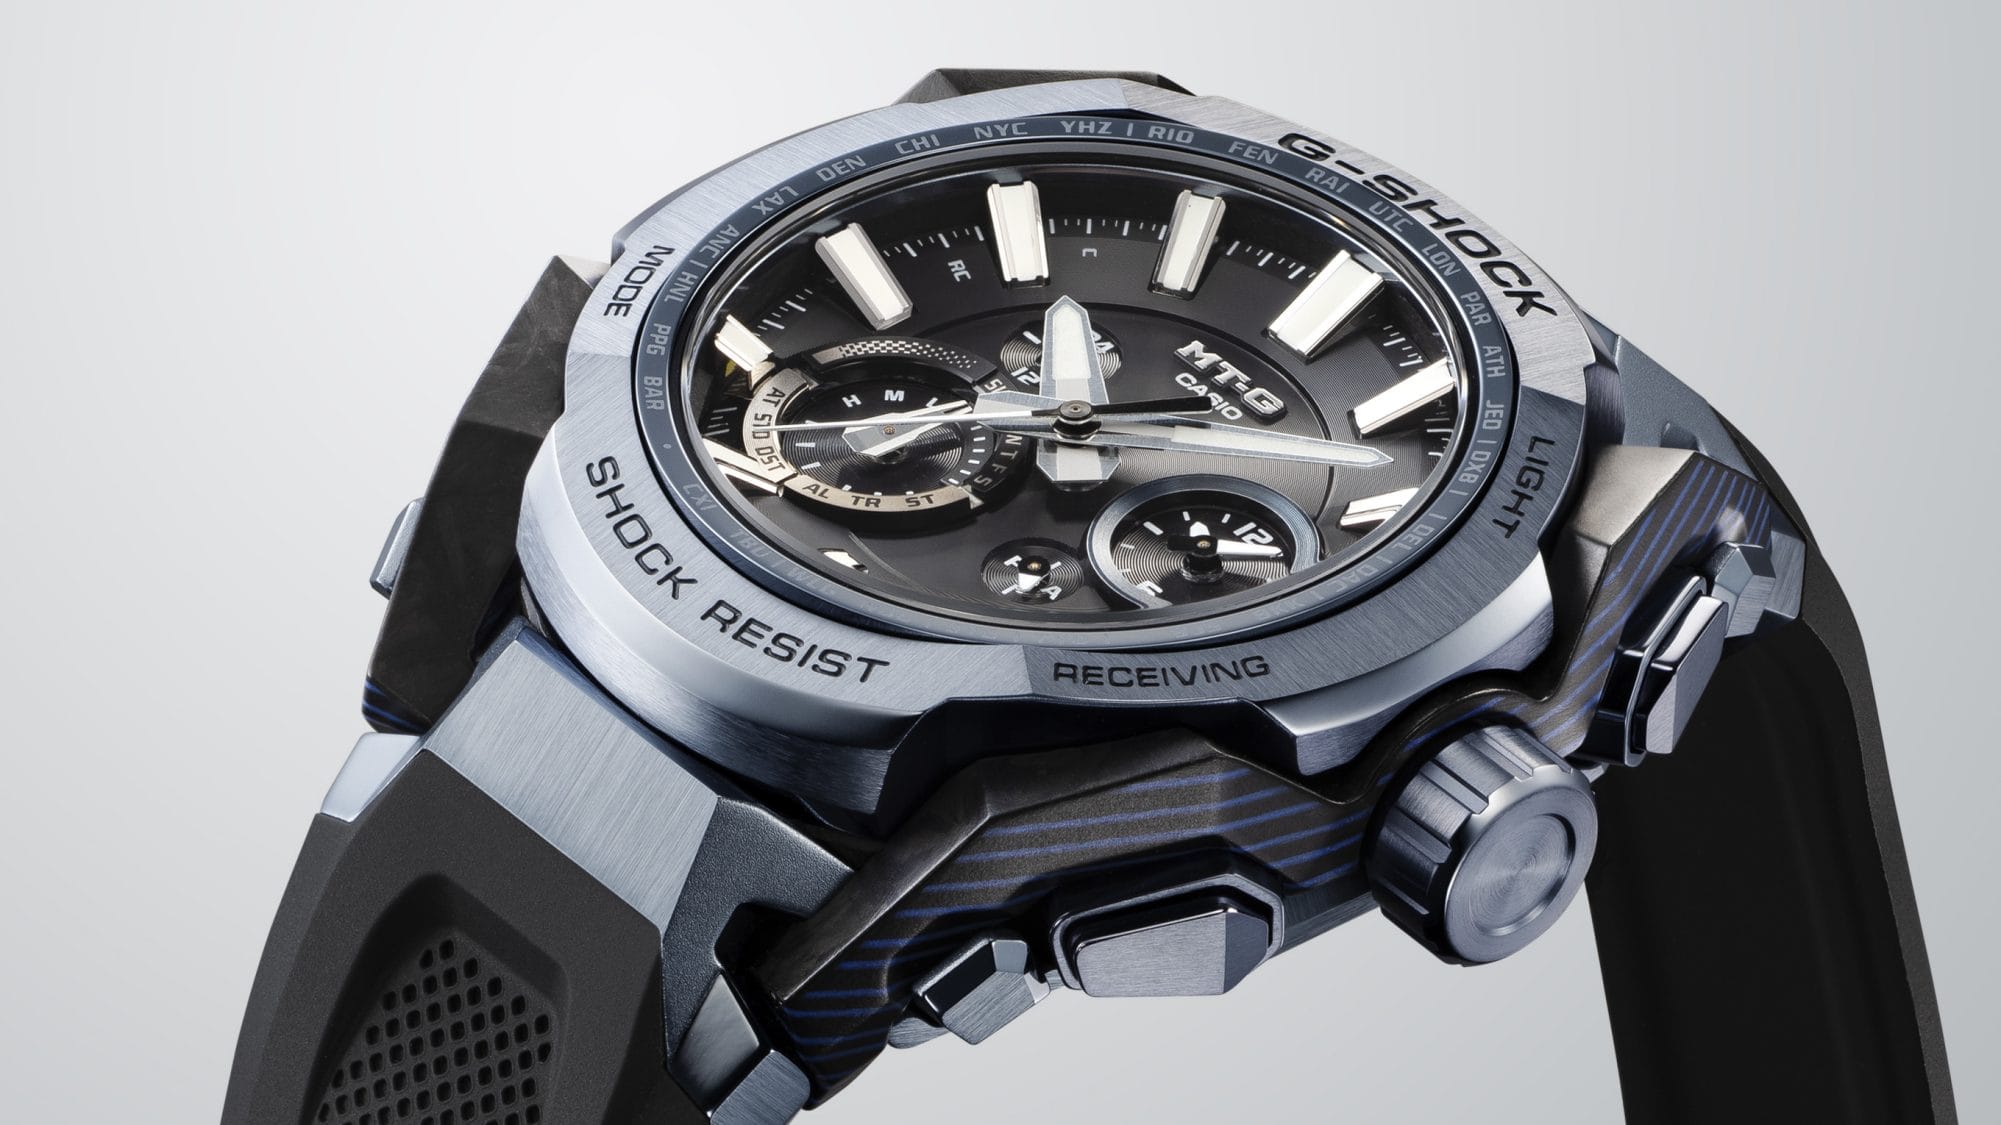 Metal finish brings out a refined look and sense of depth.

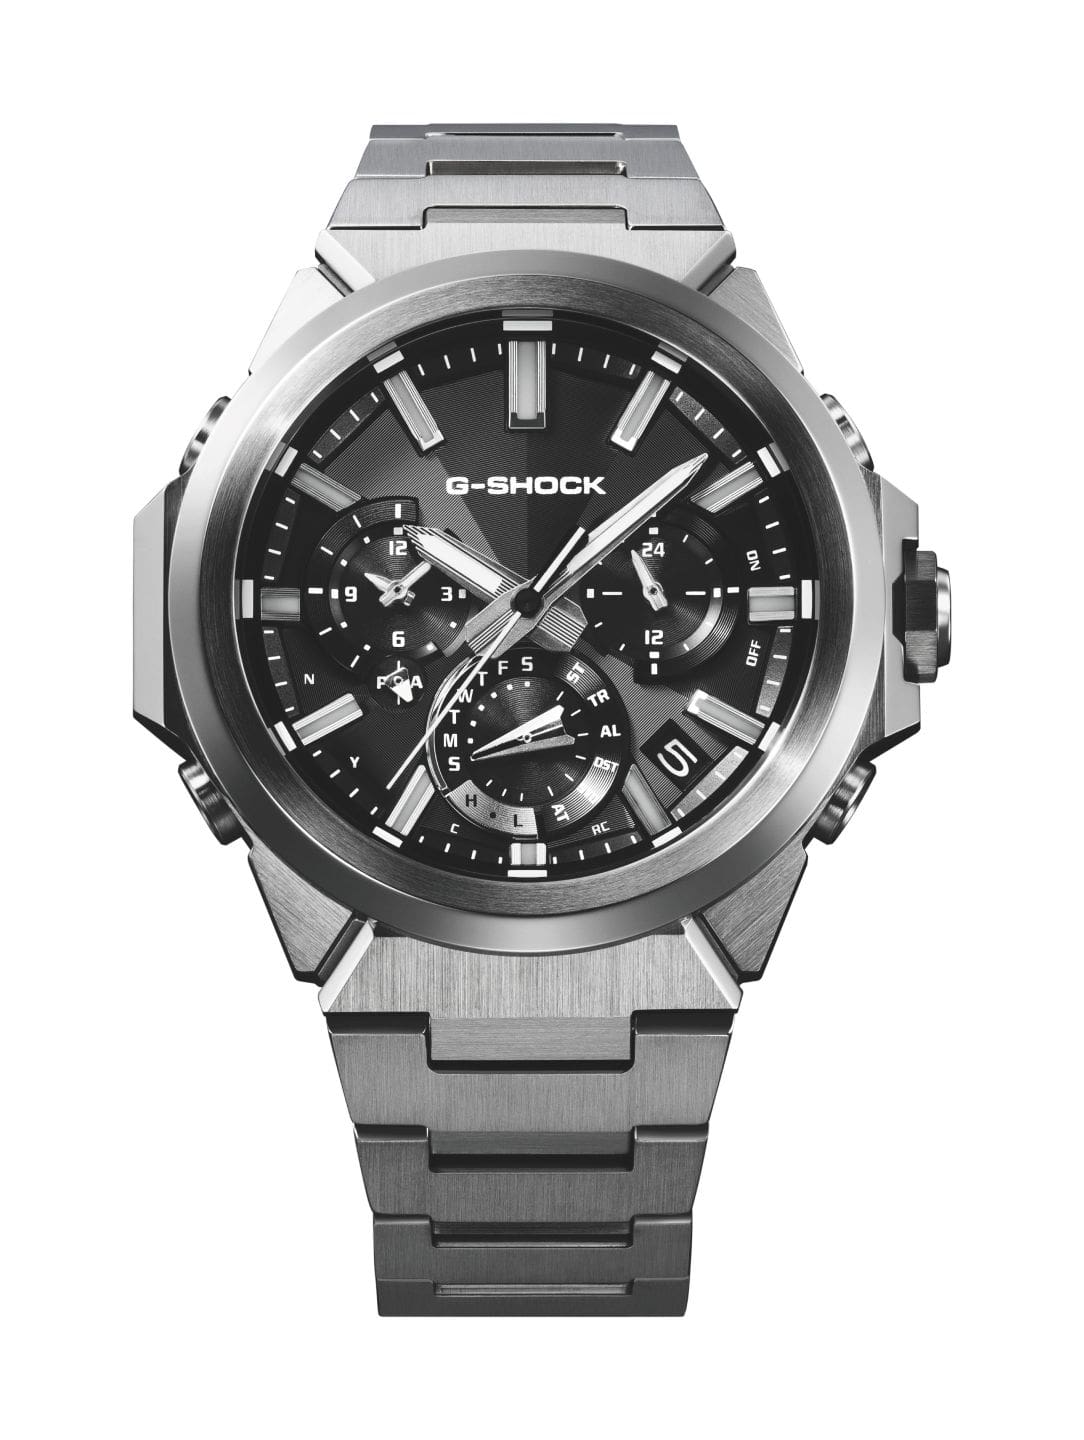
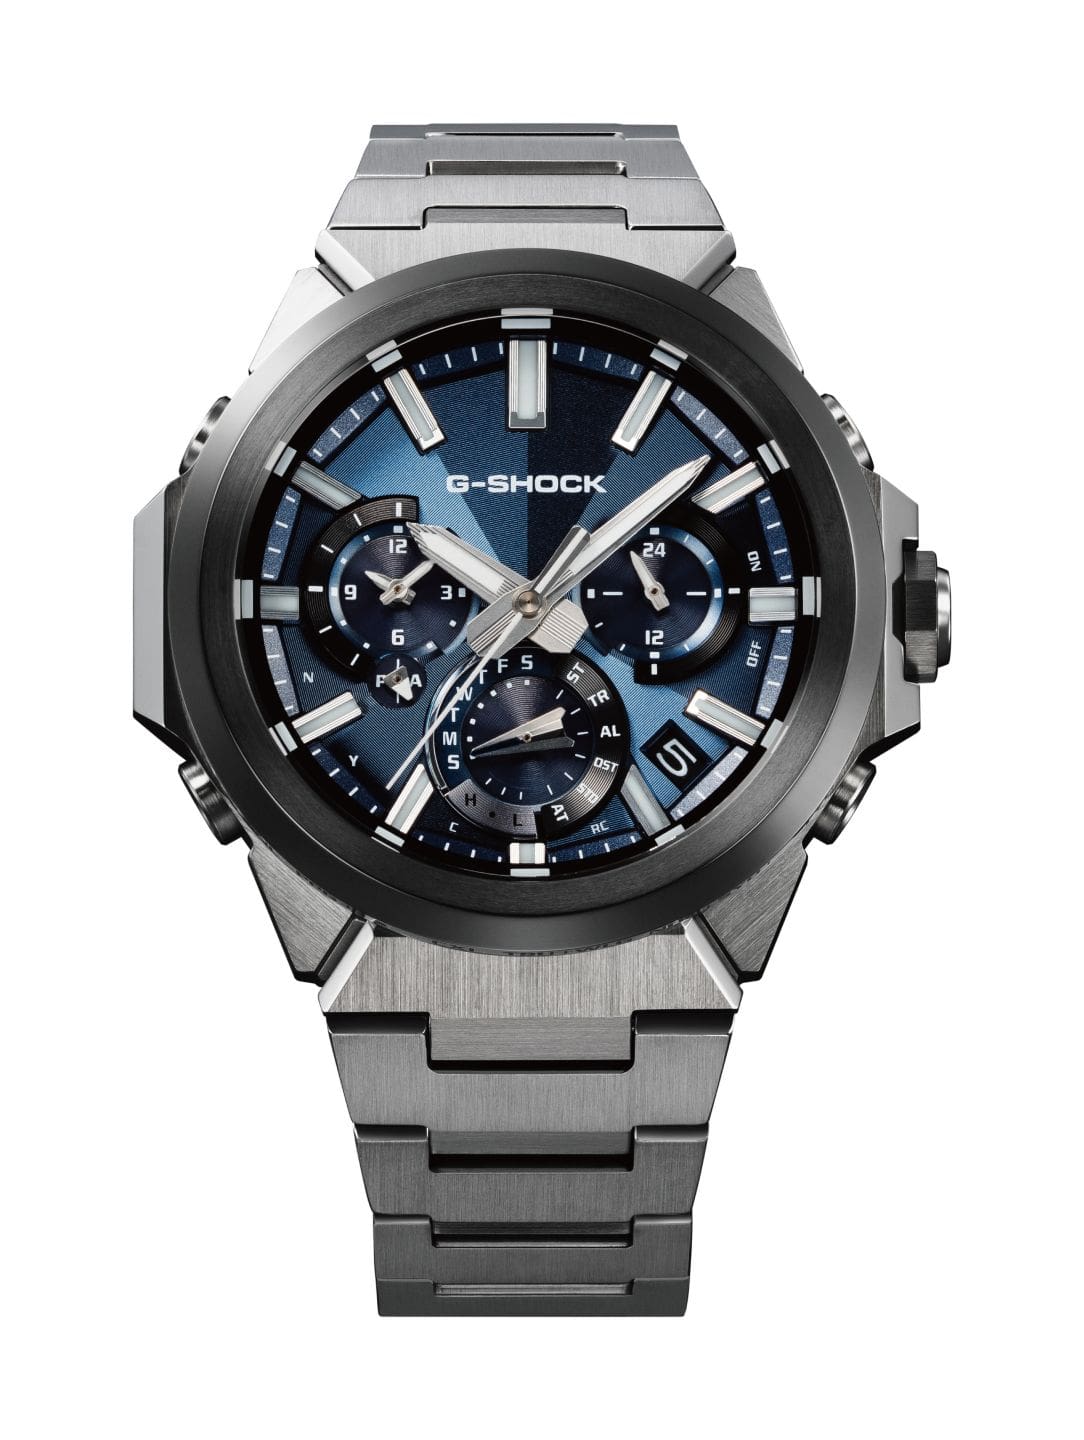
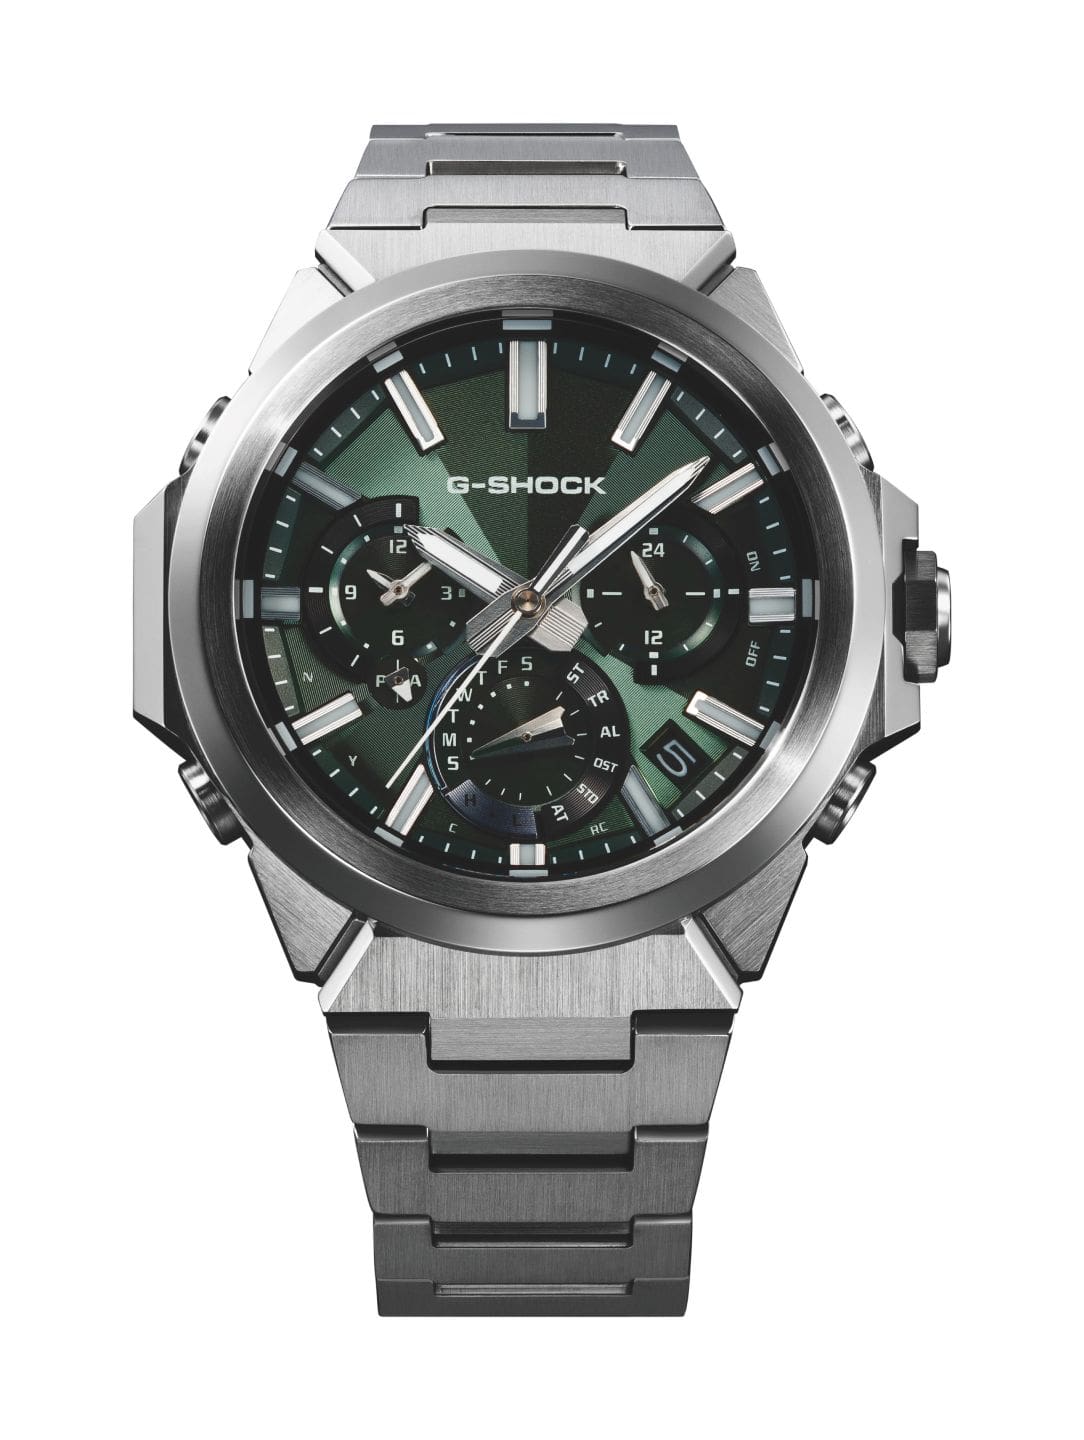
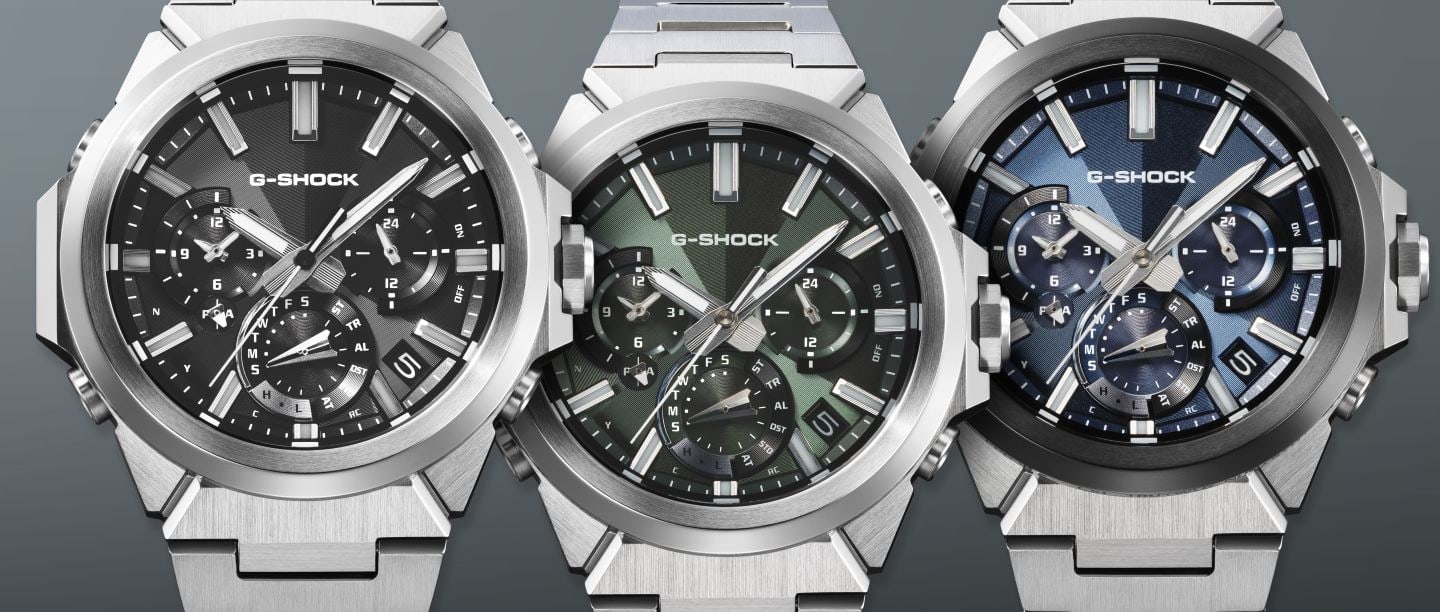


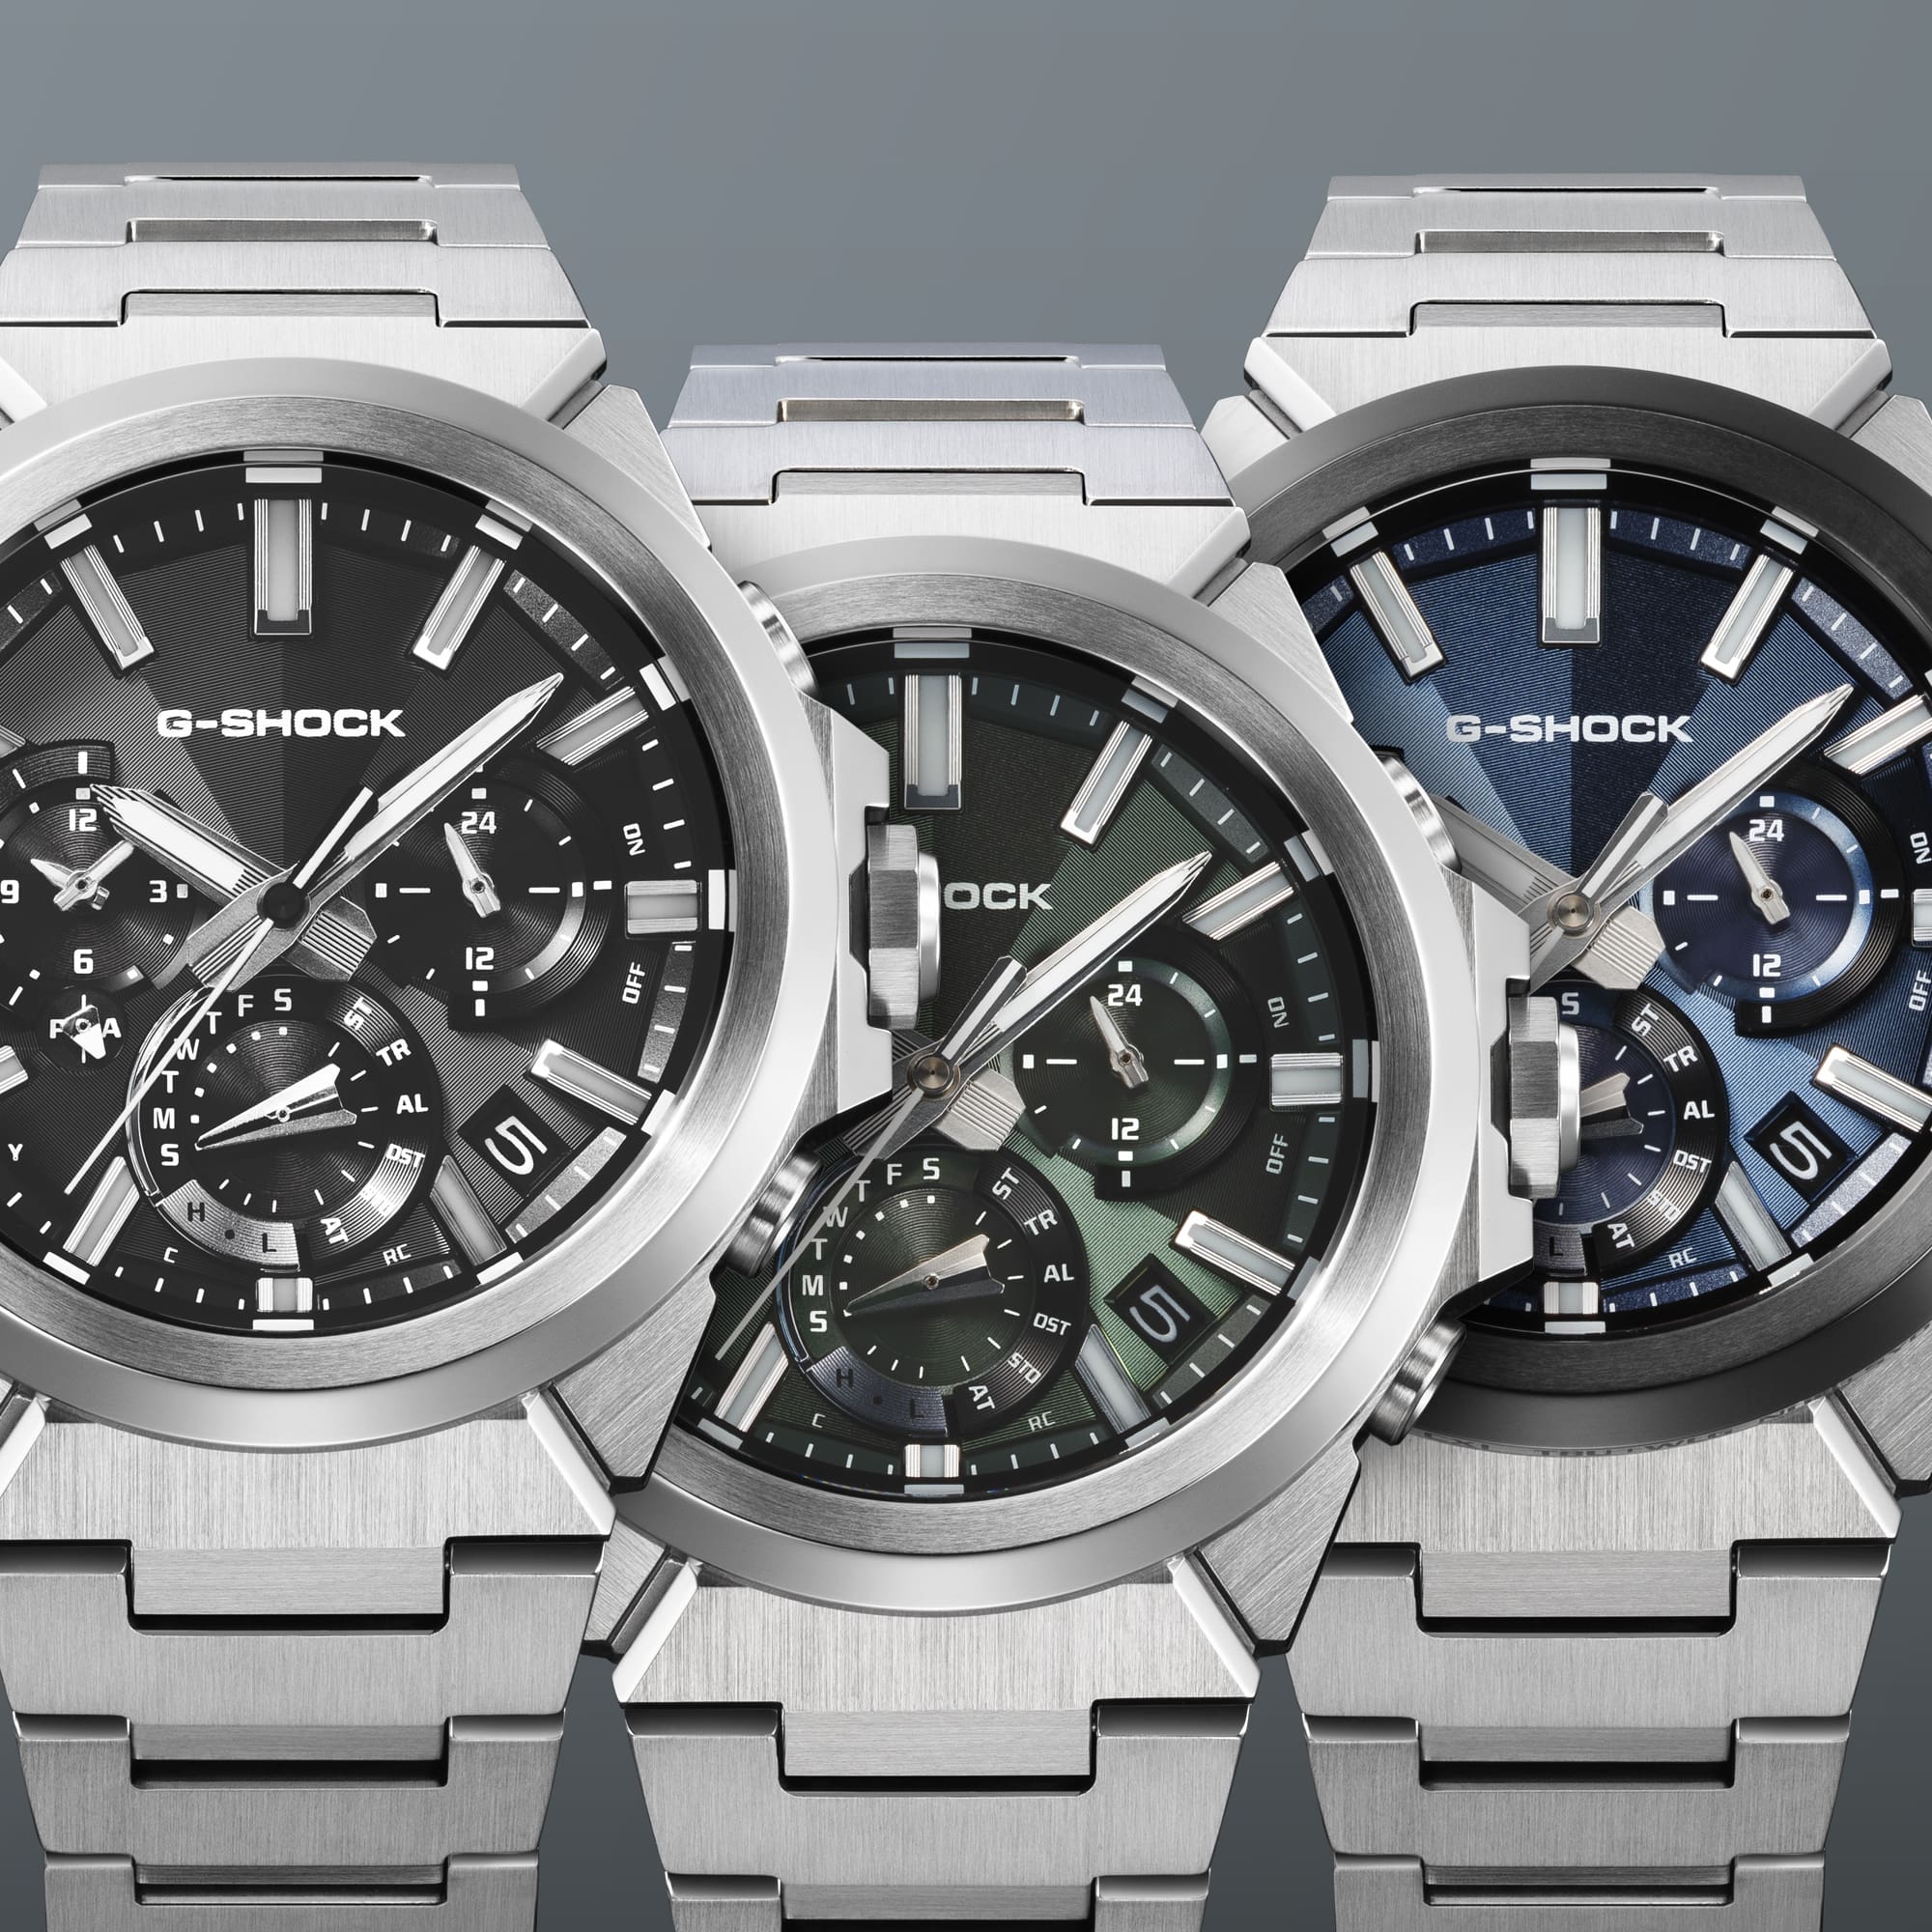
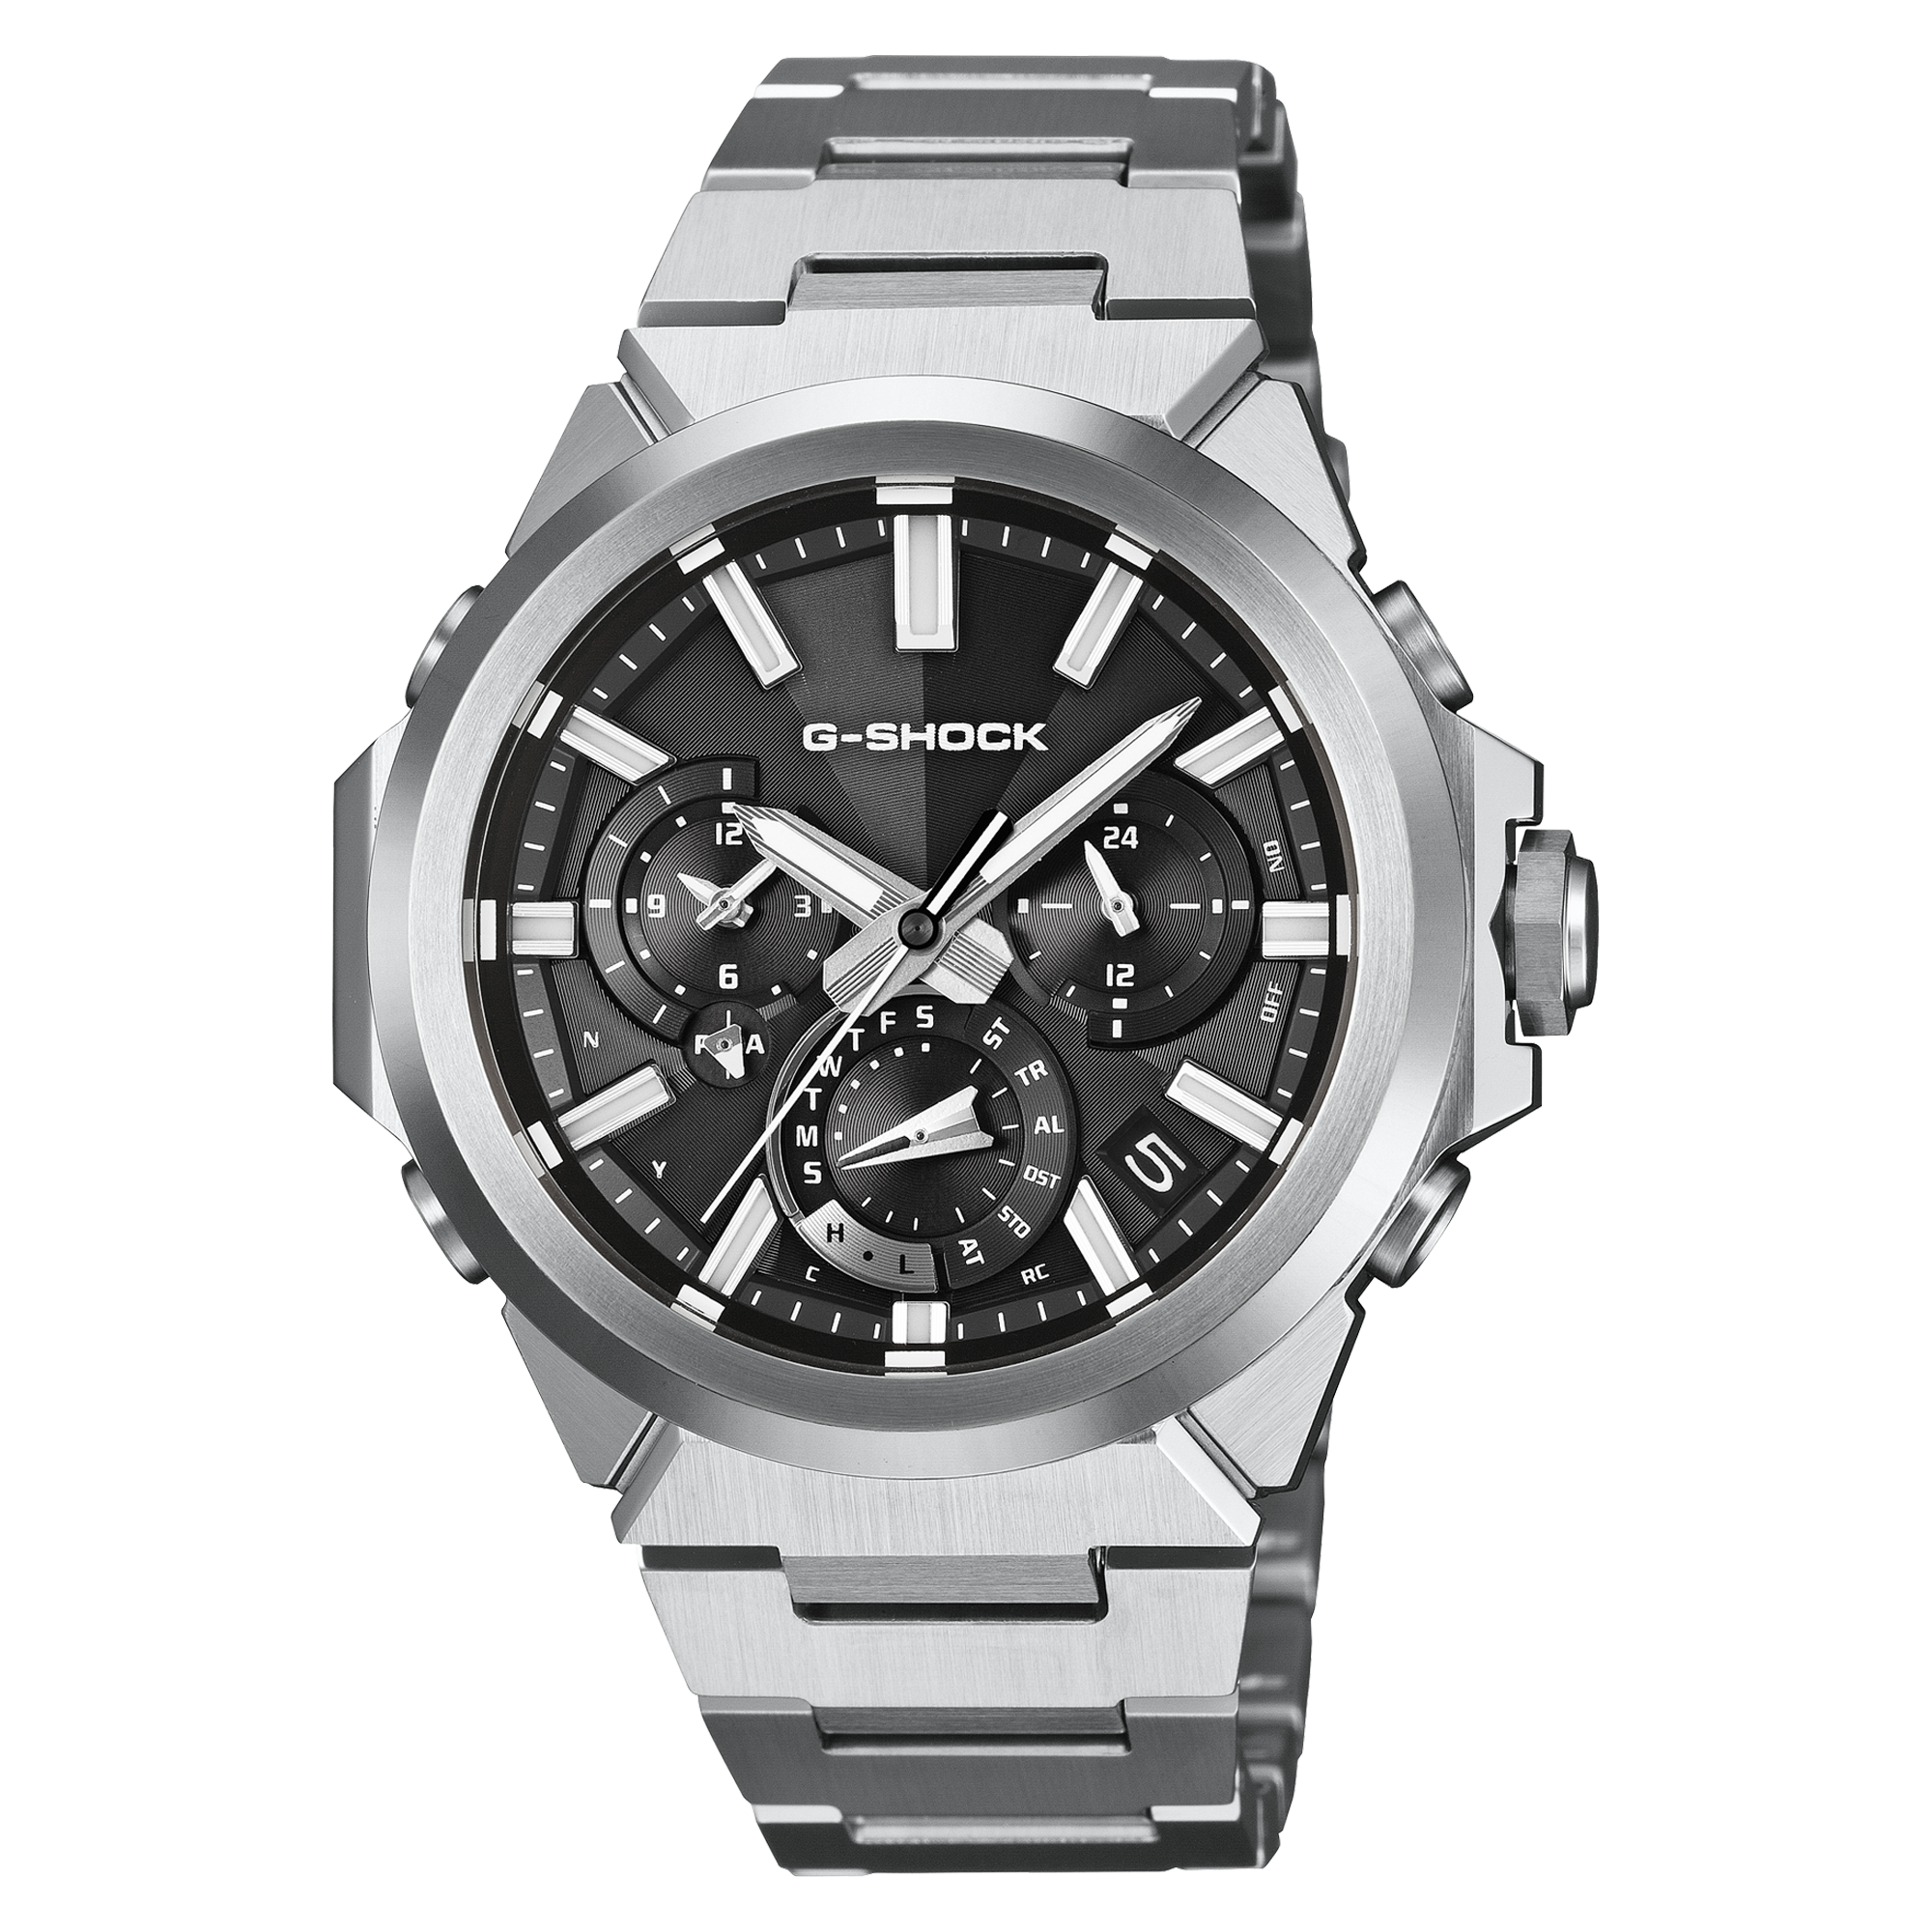 GST-W1000D-1A
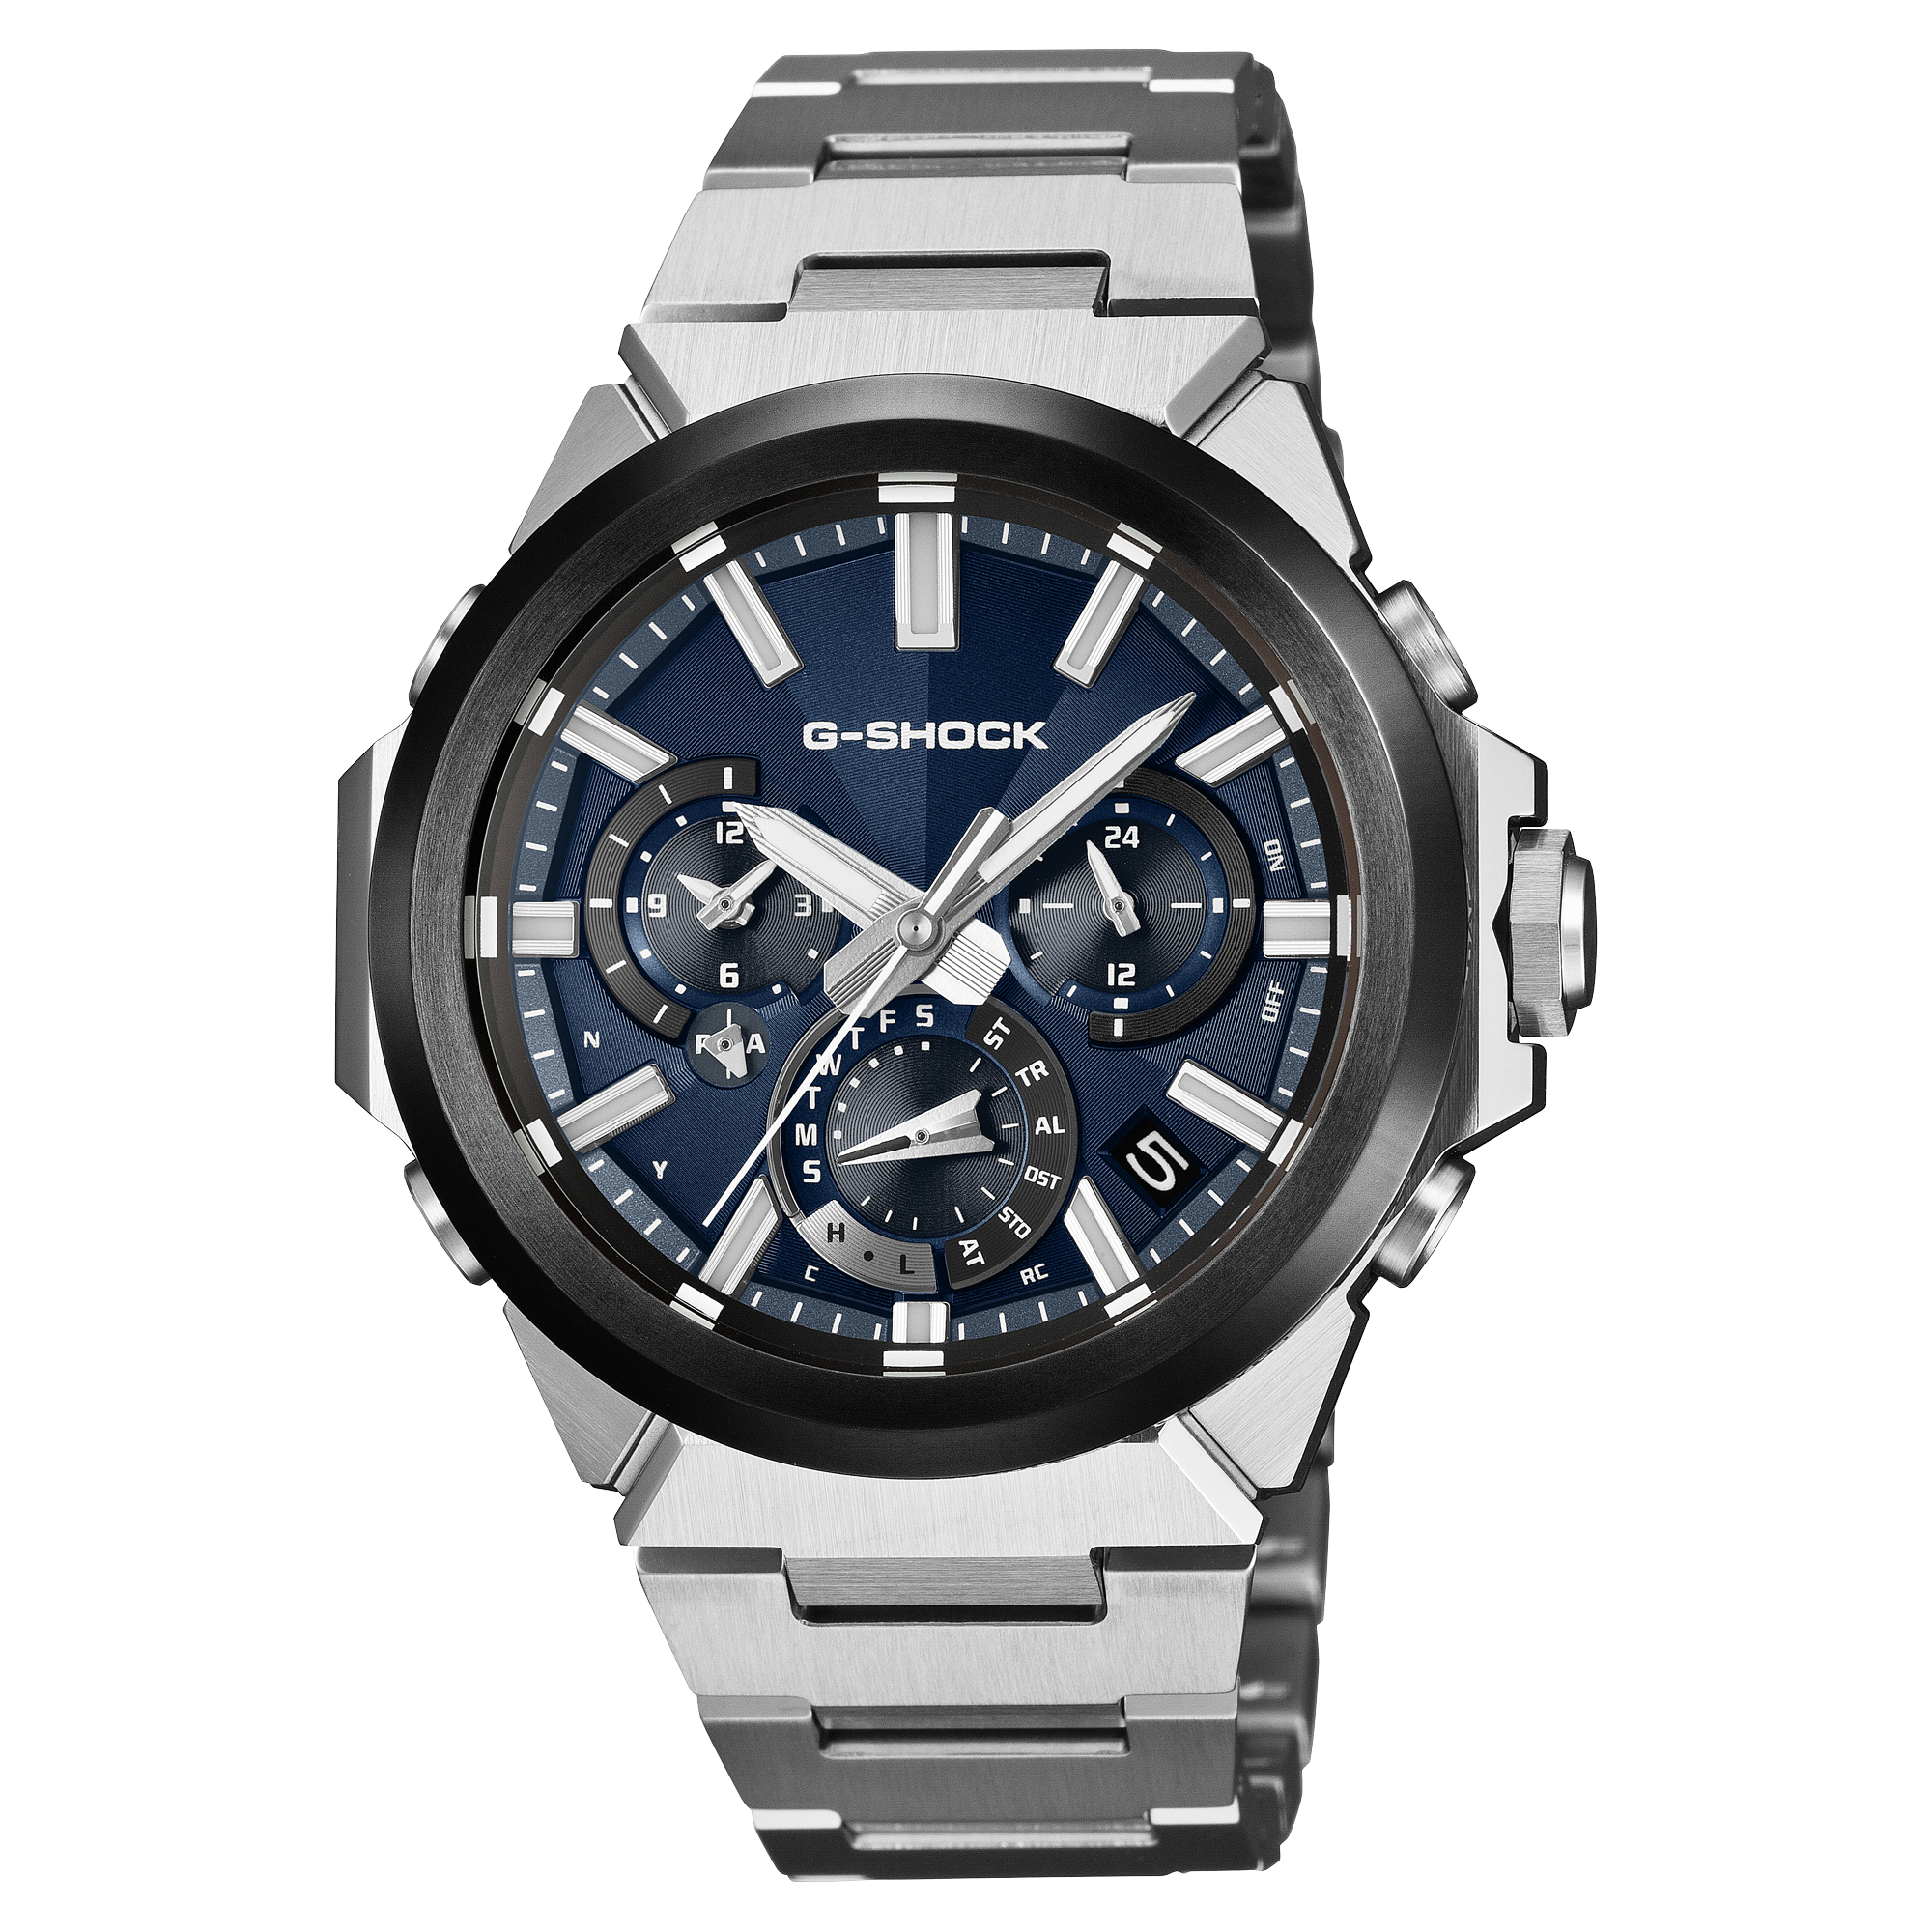 GST-W1000AD-2A
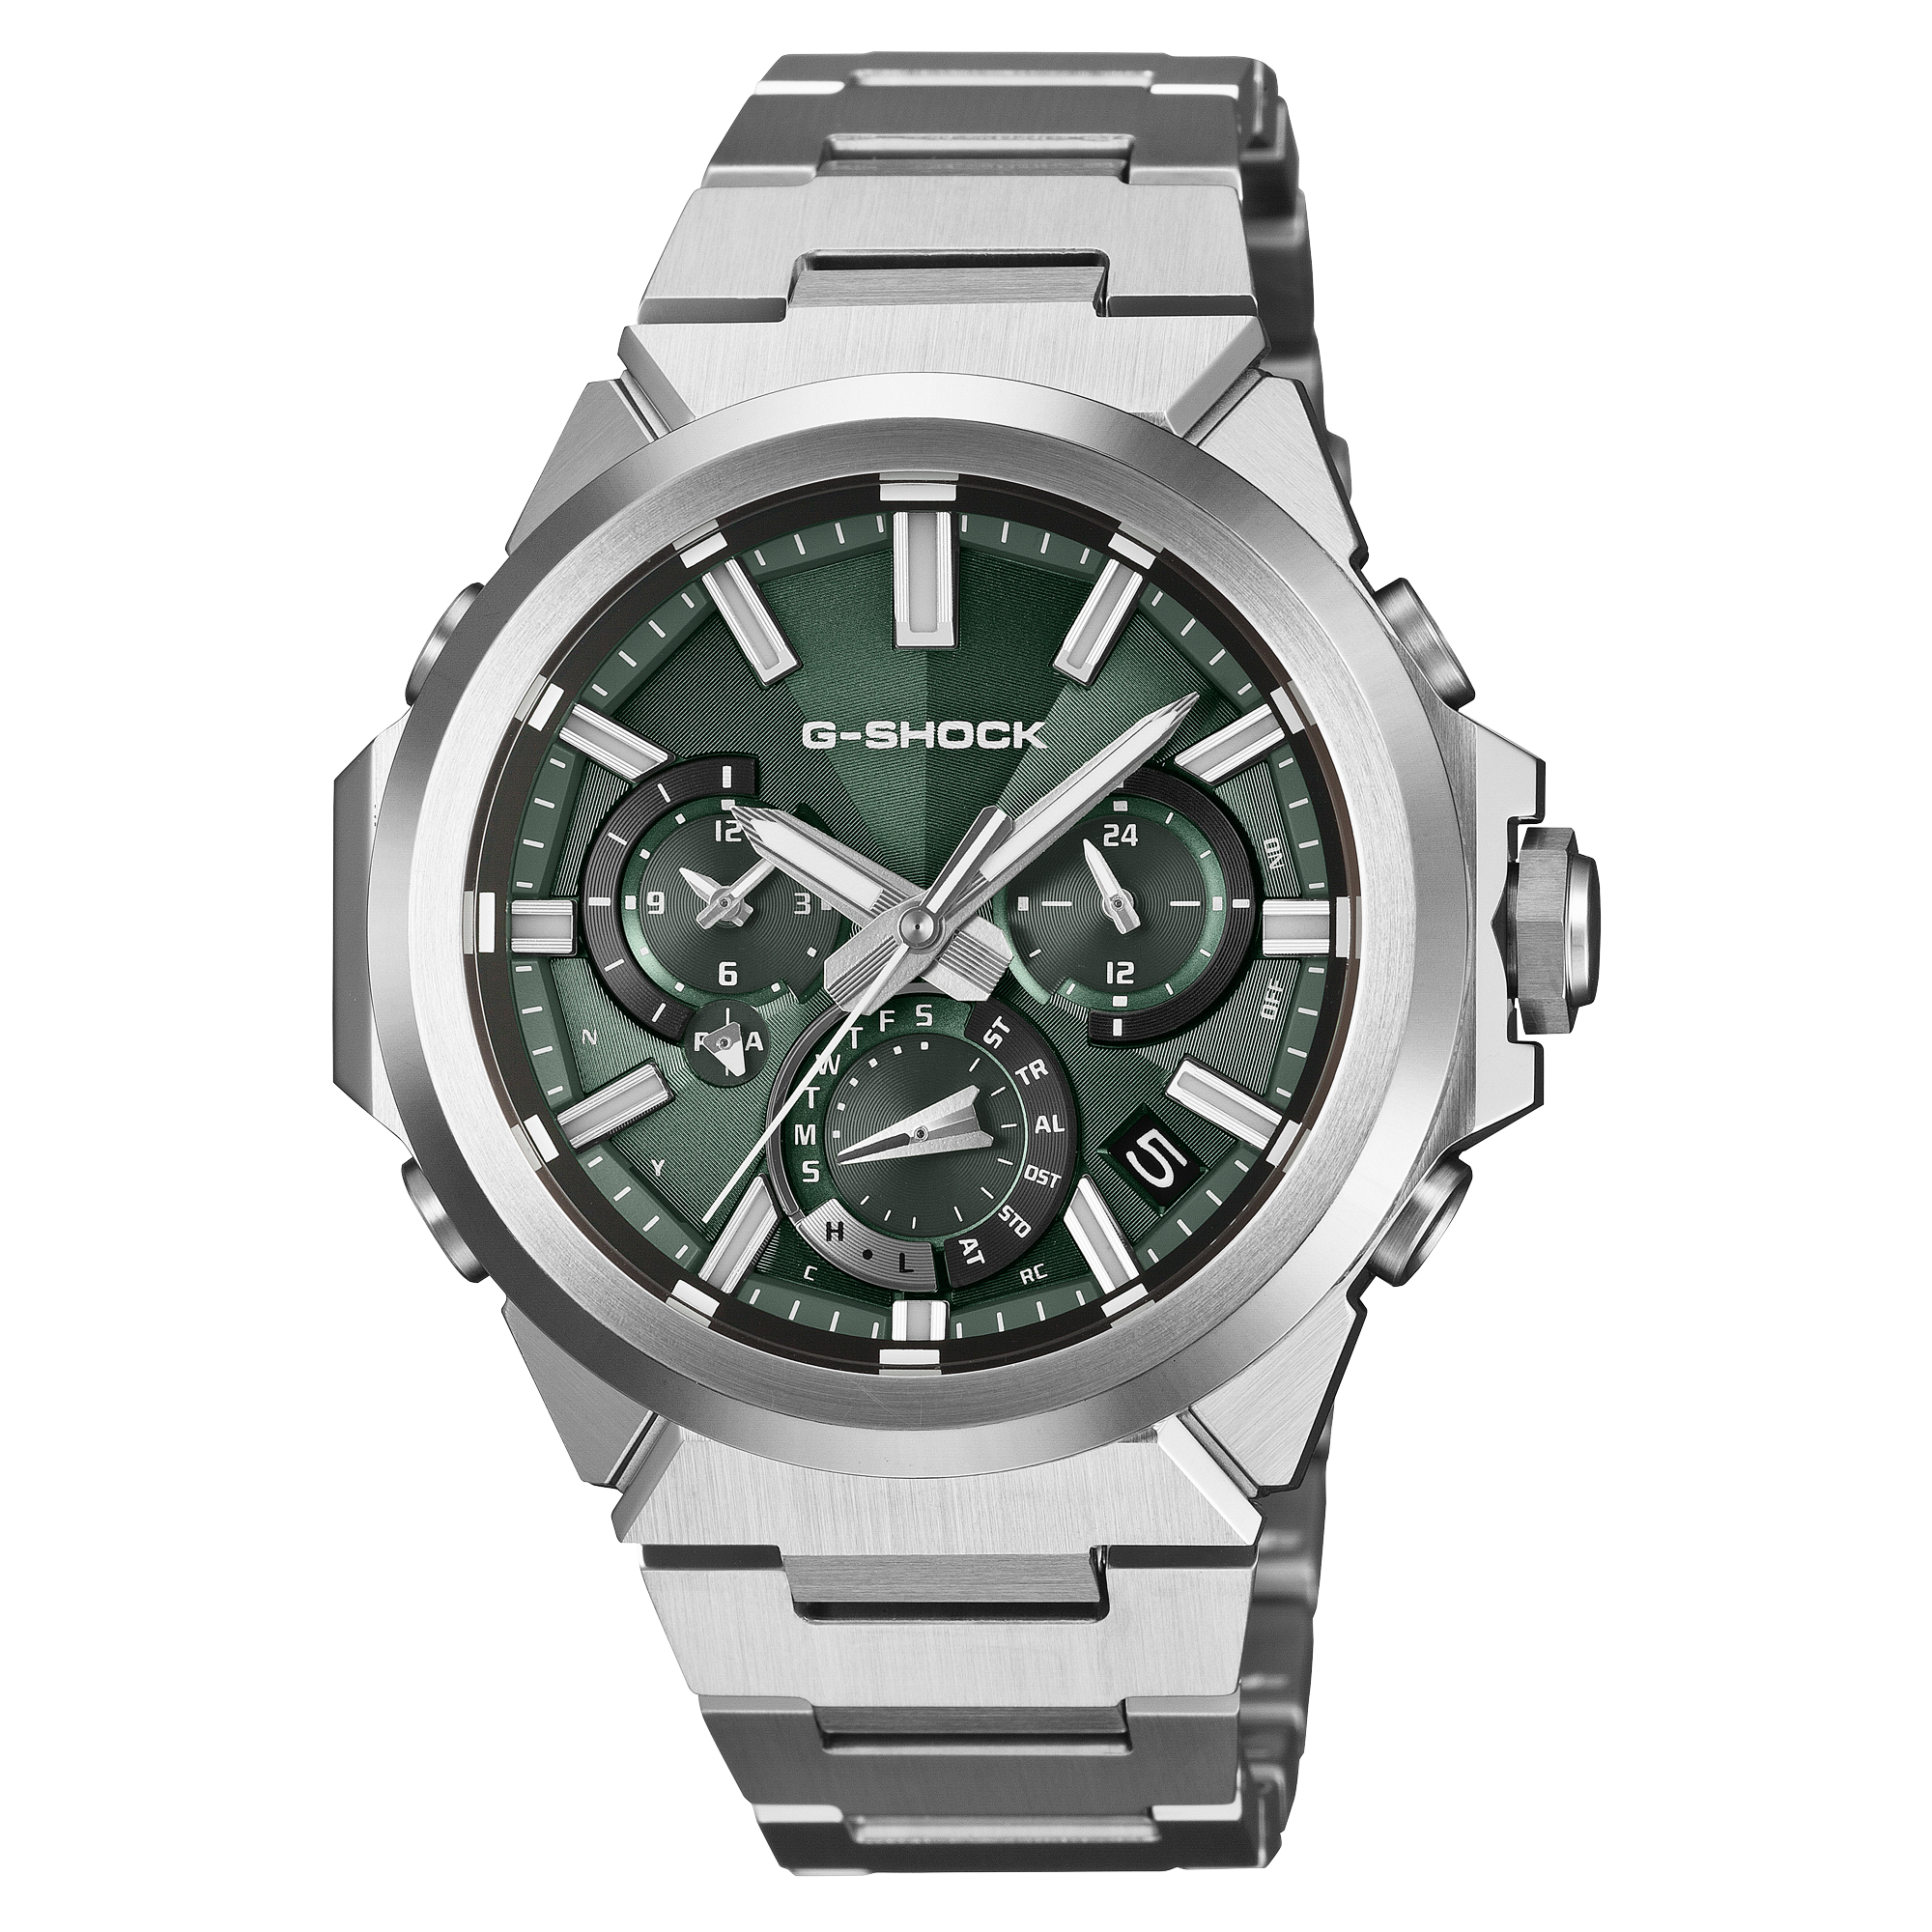 GST-W1000D-3A
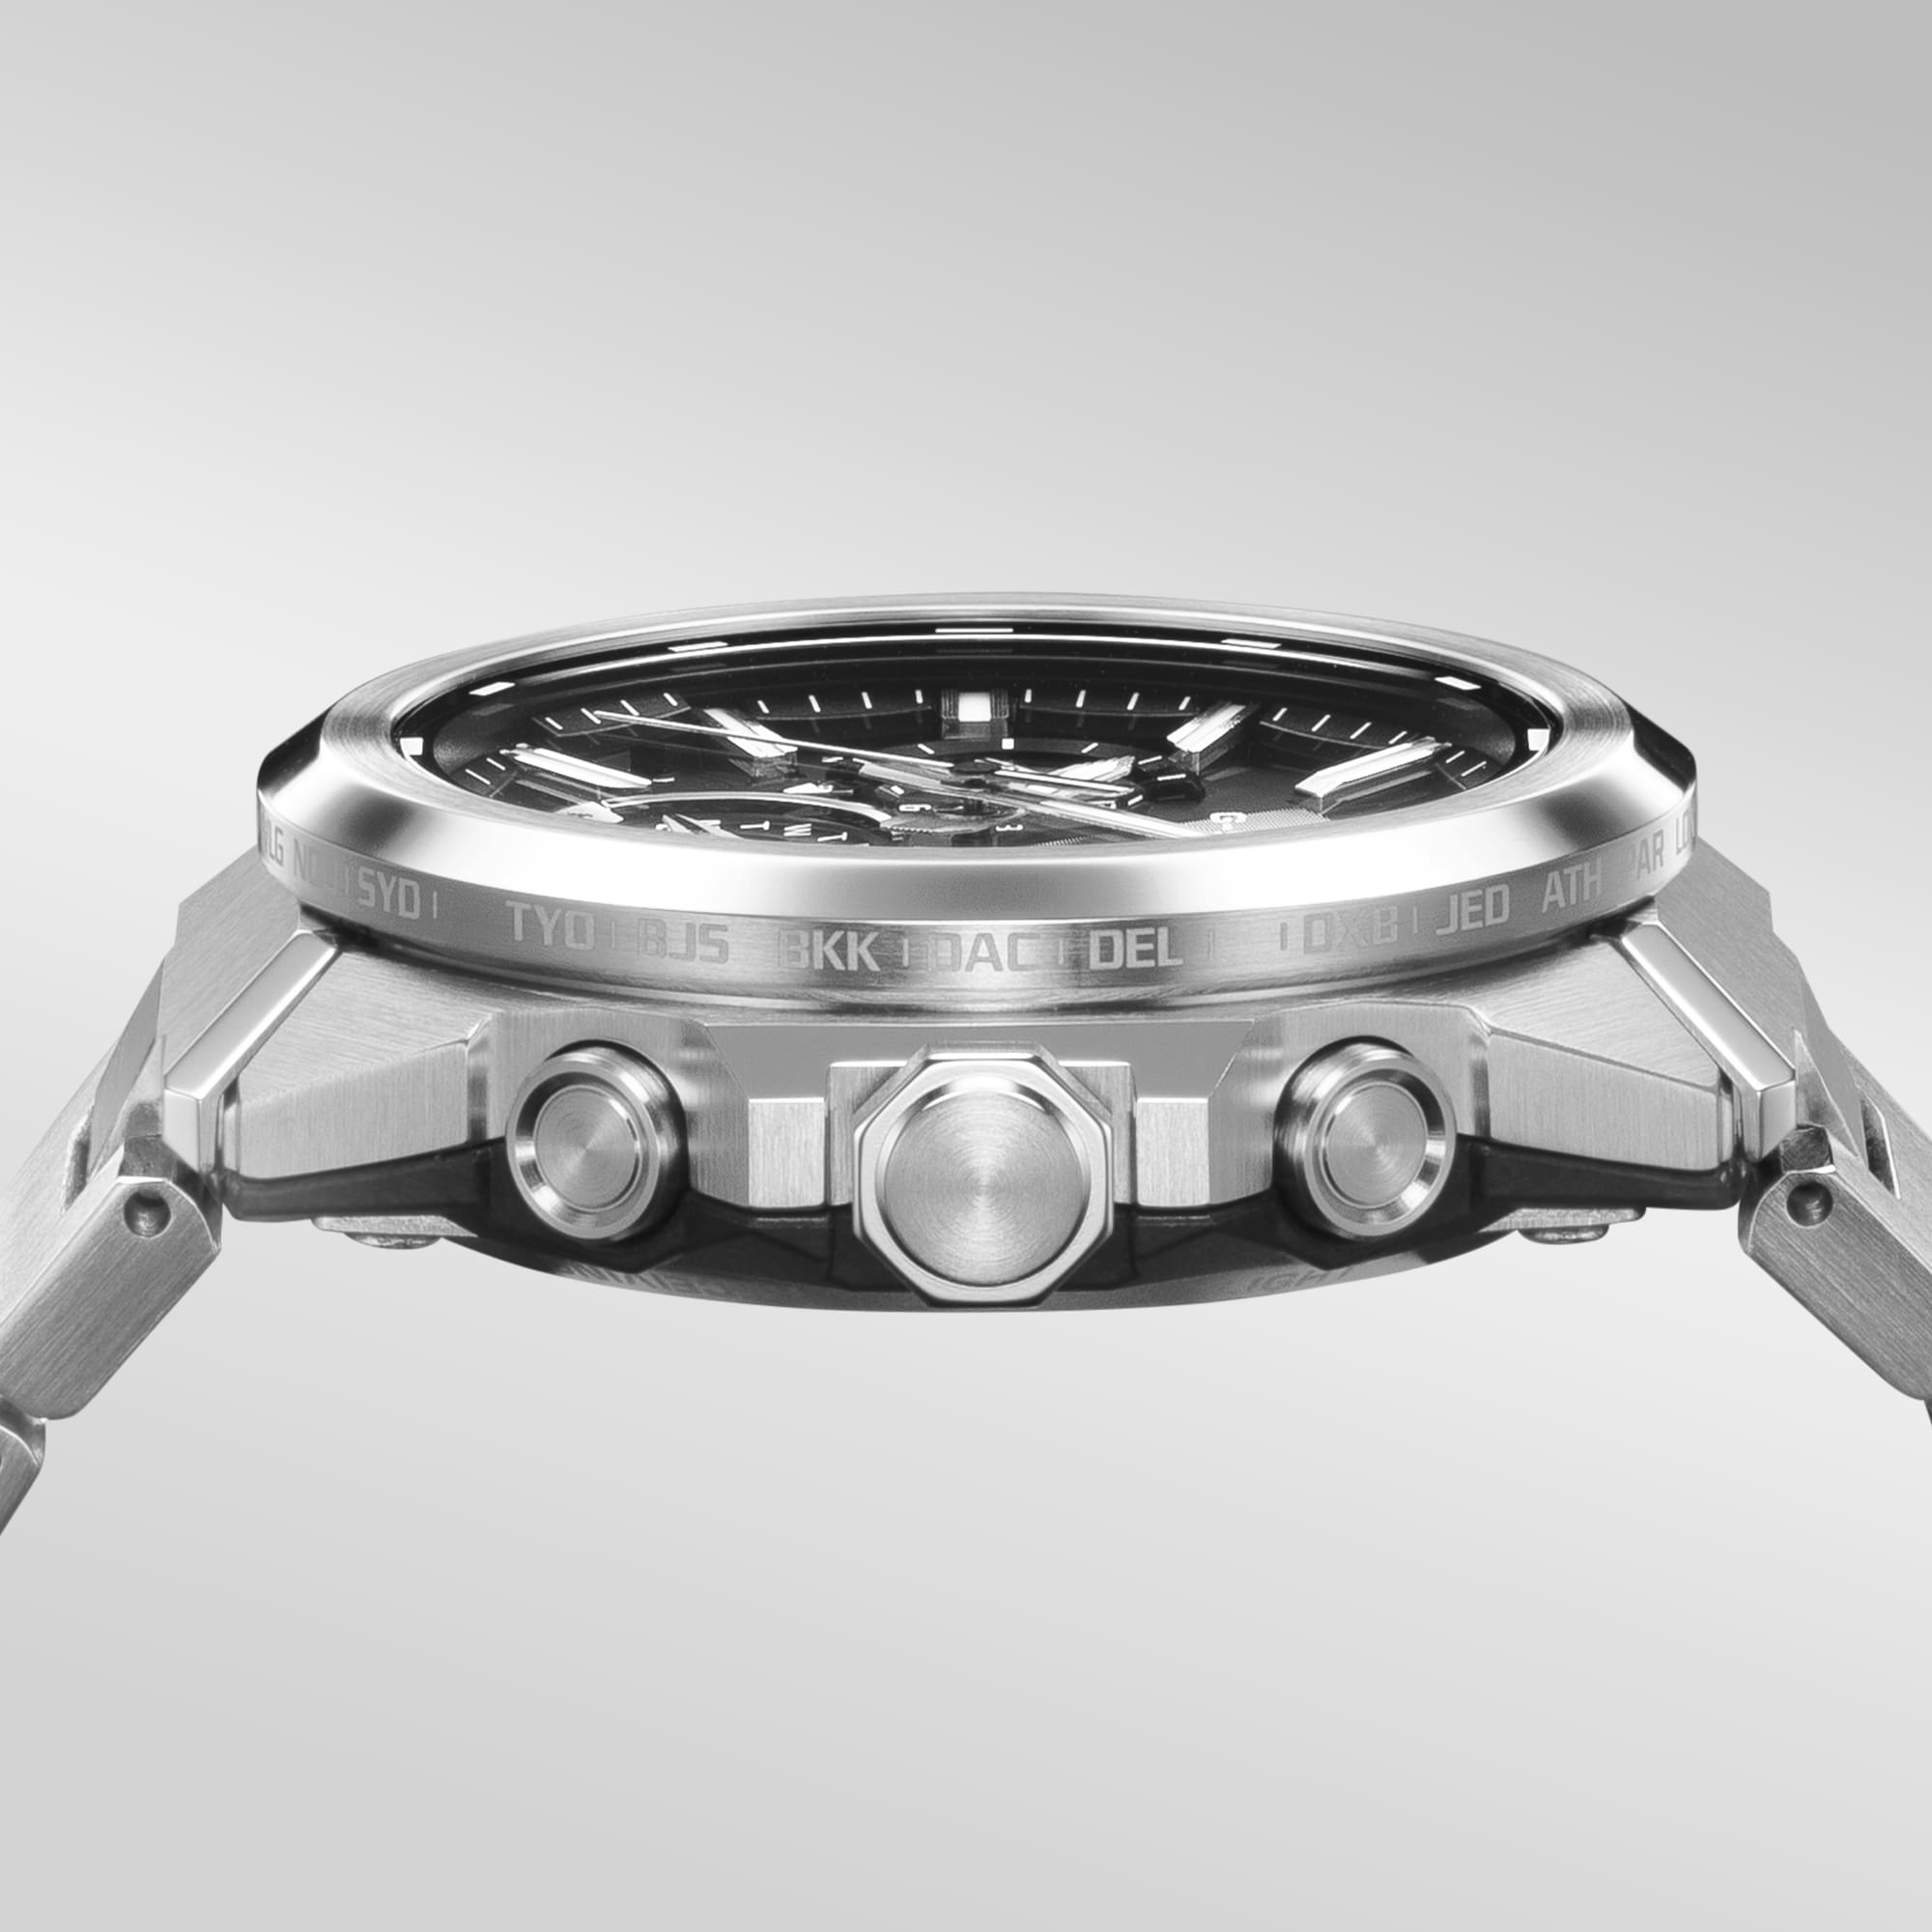 Sides with concealed mounting screws
 Exterior with different finishes
 Dial created using
 Watch glass made with sapphire crystal



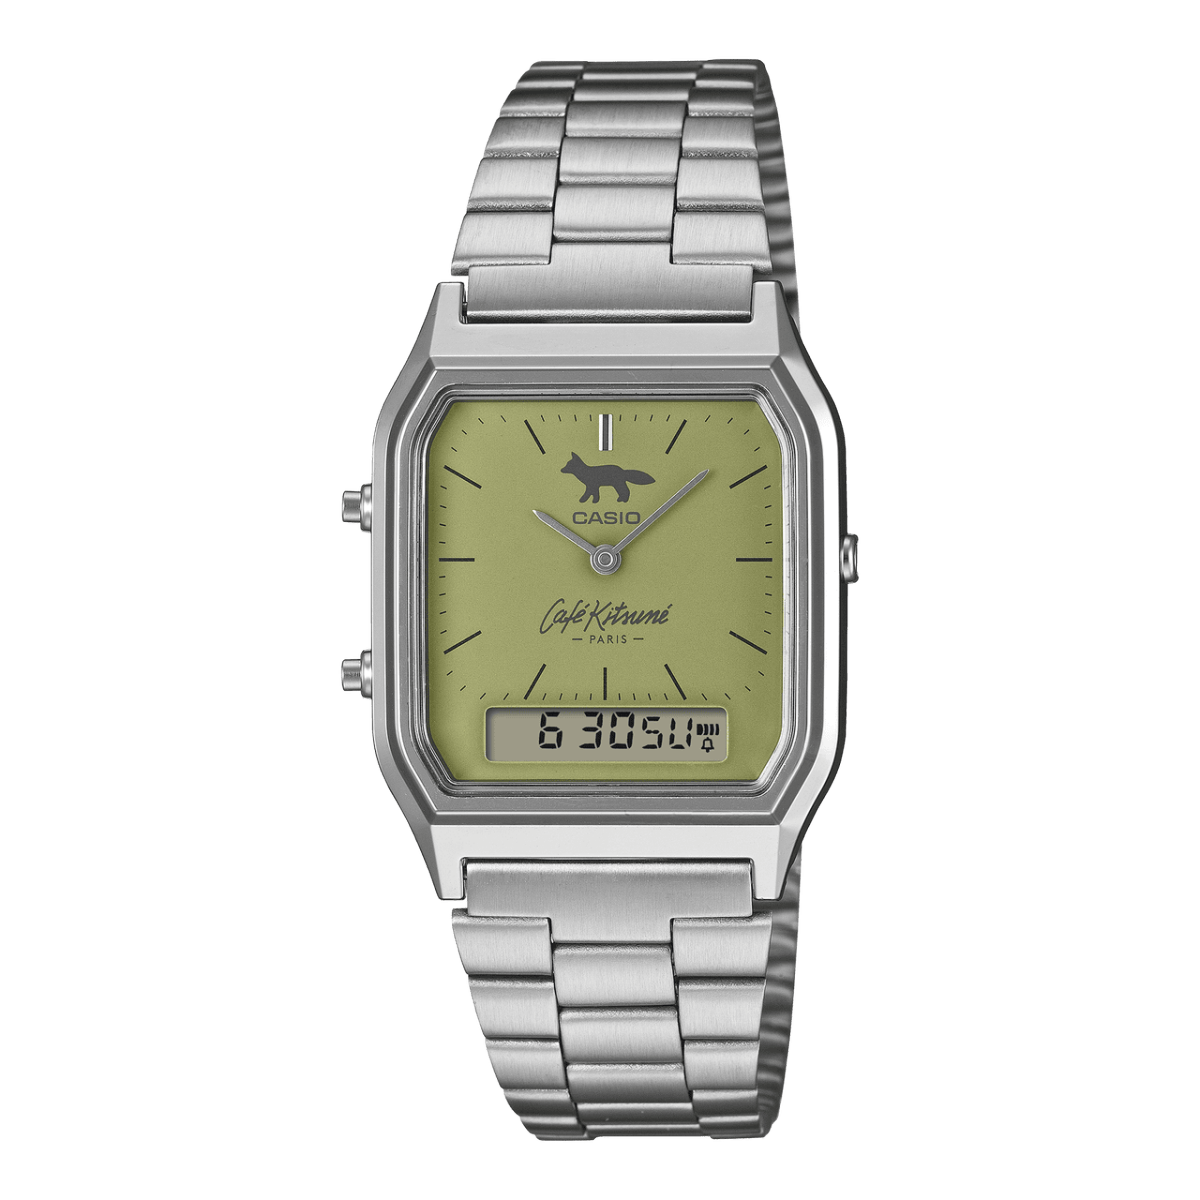
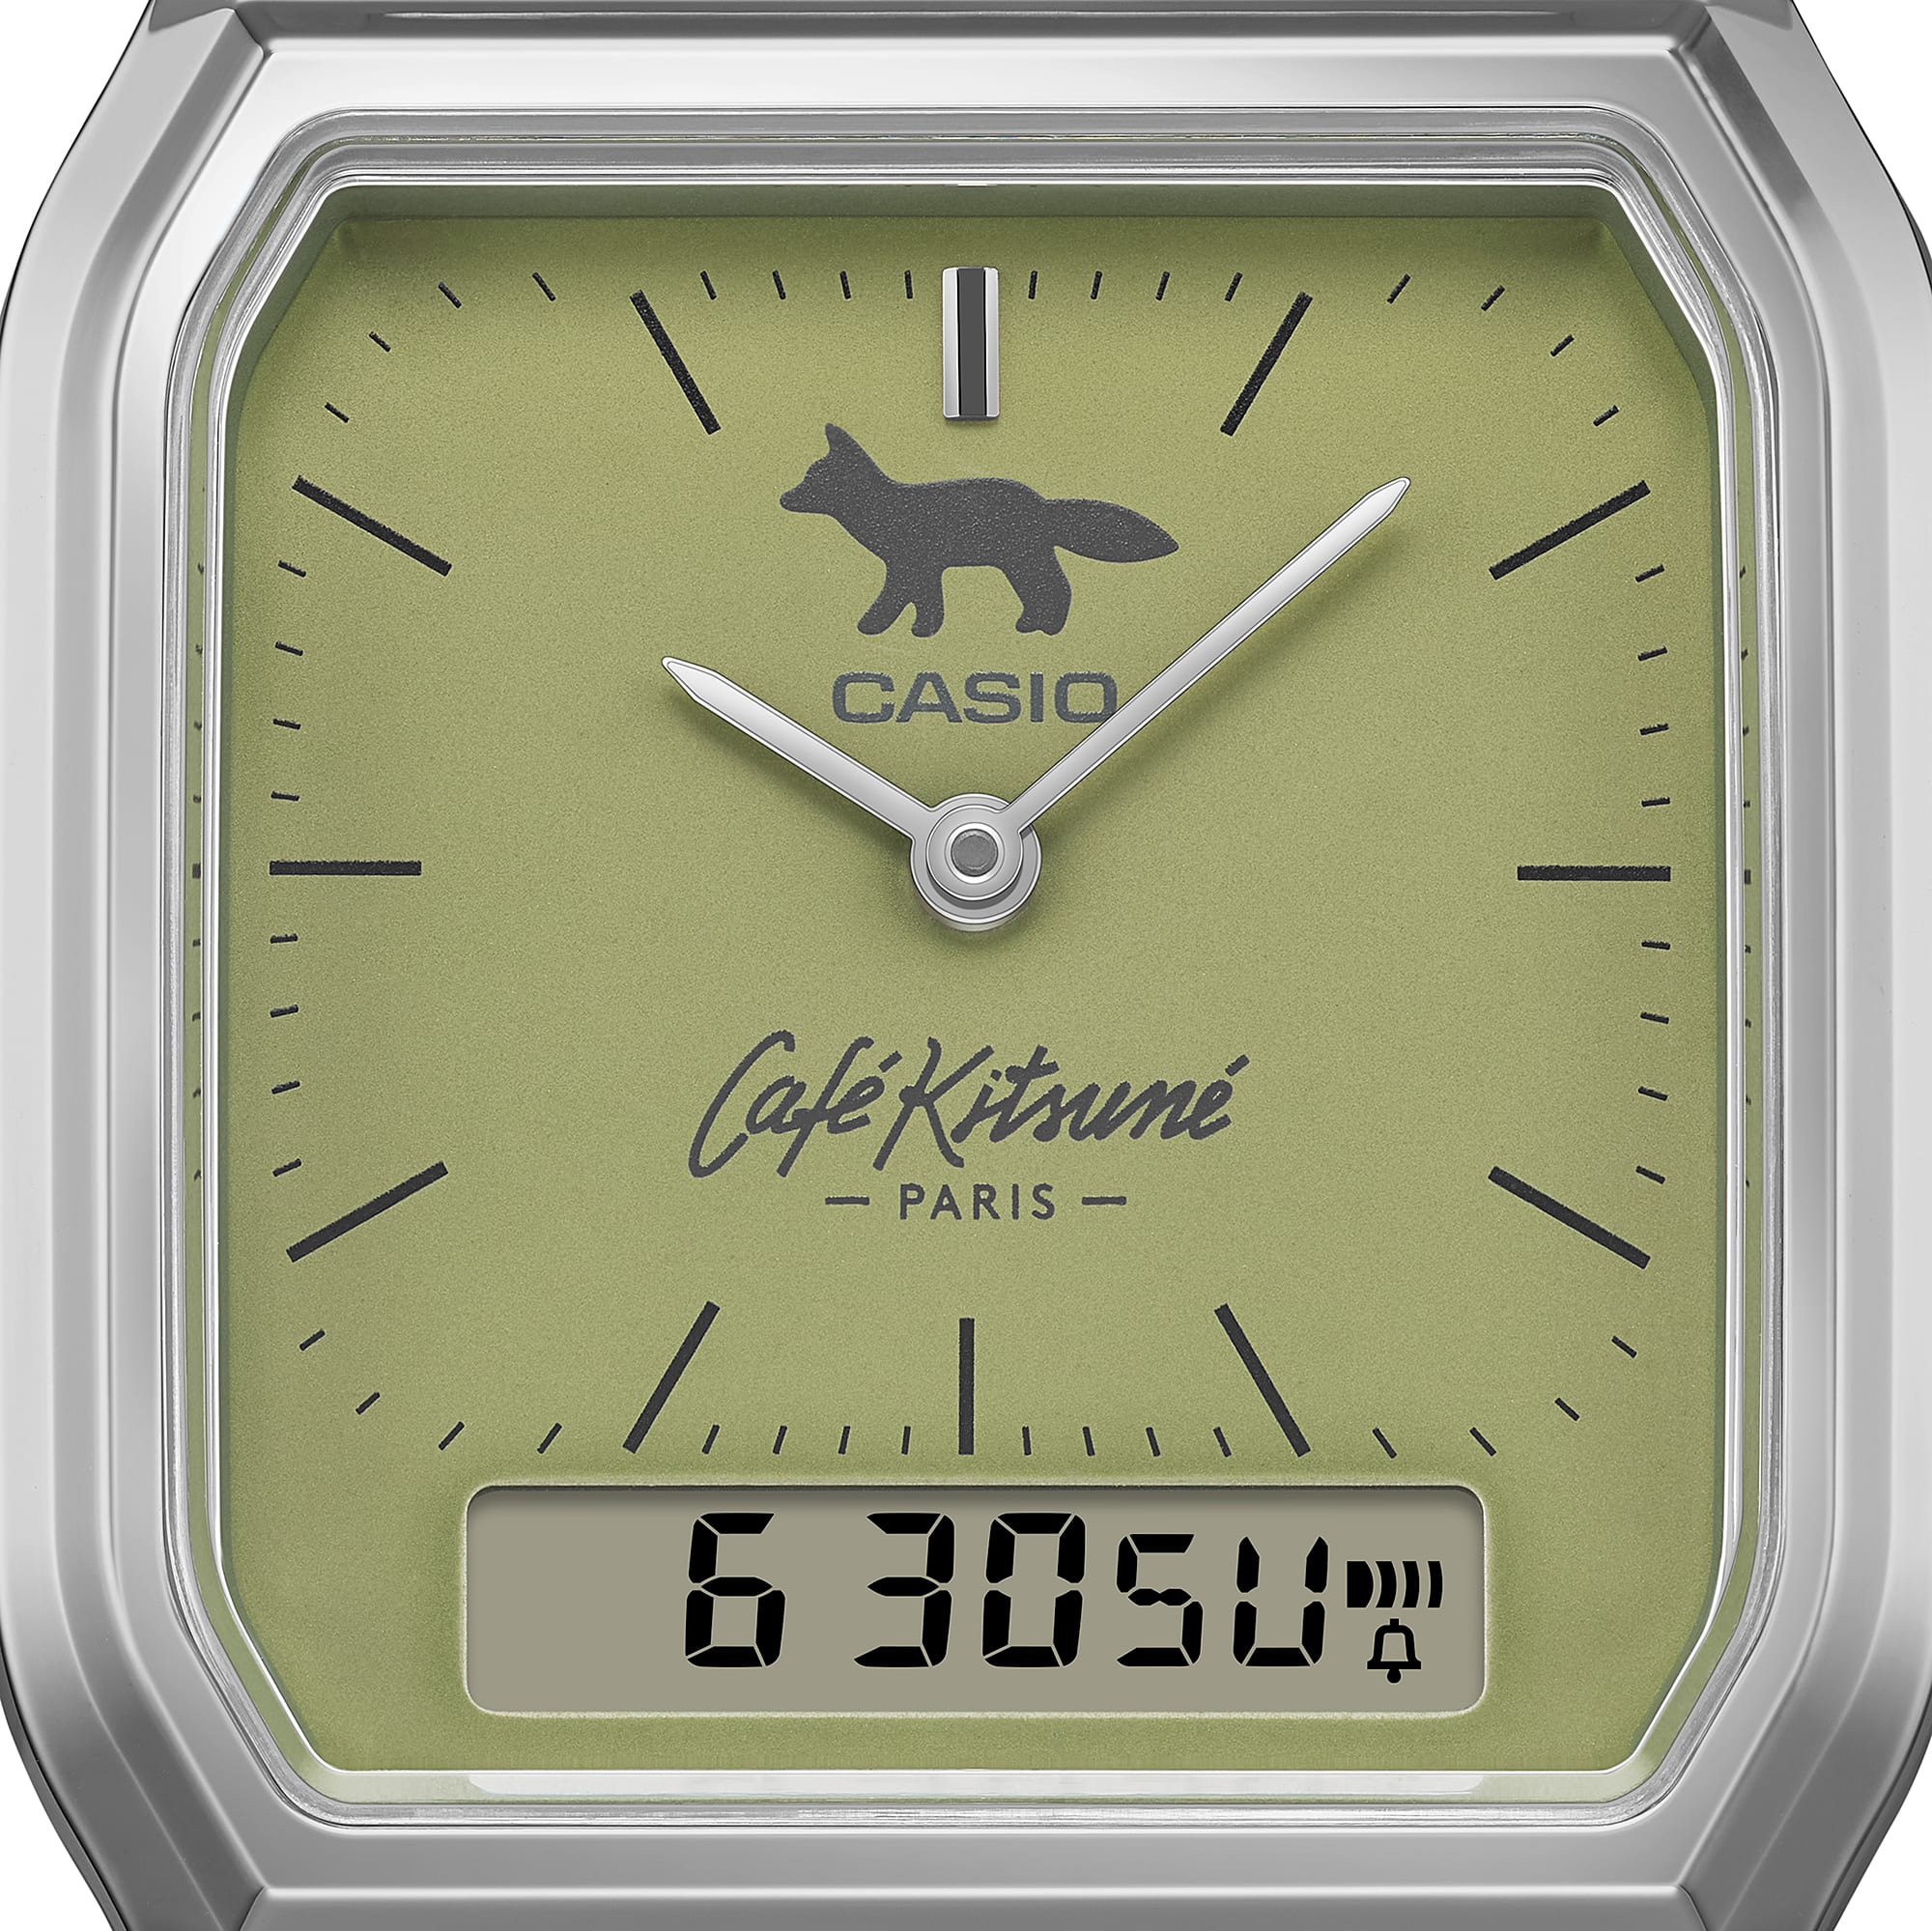 Face design
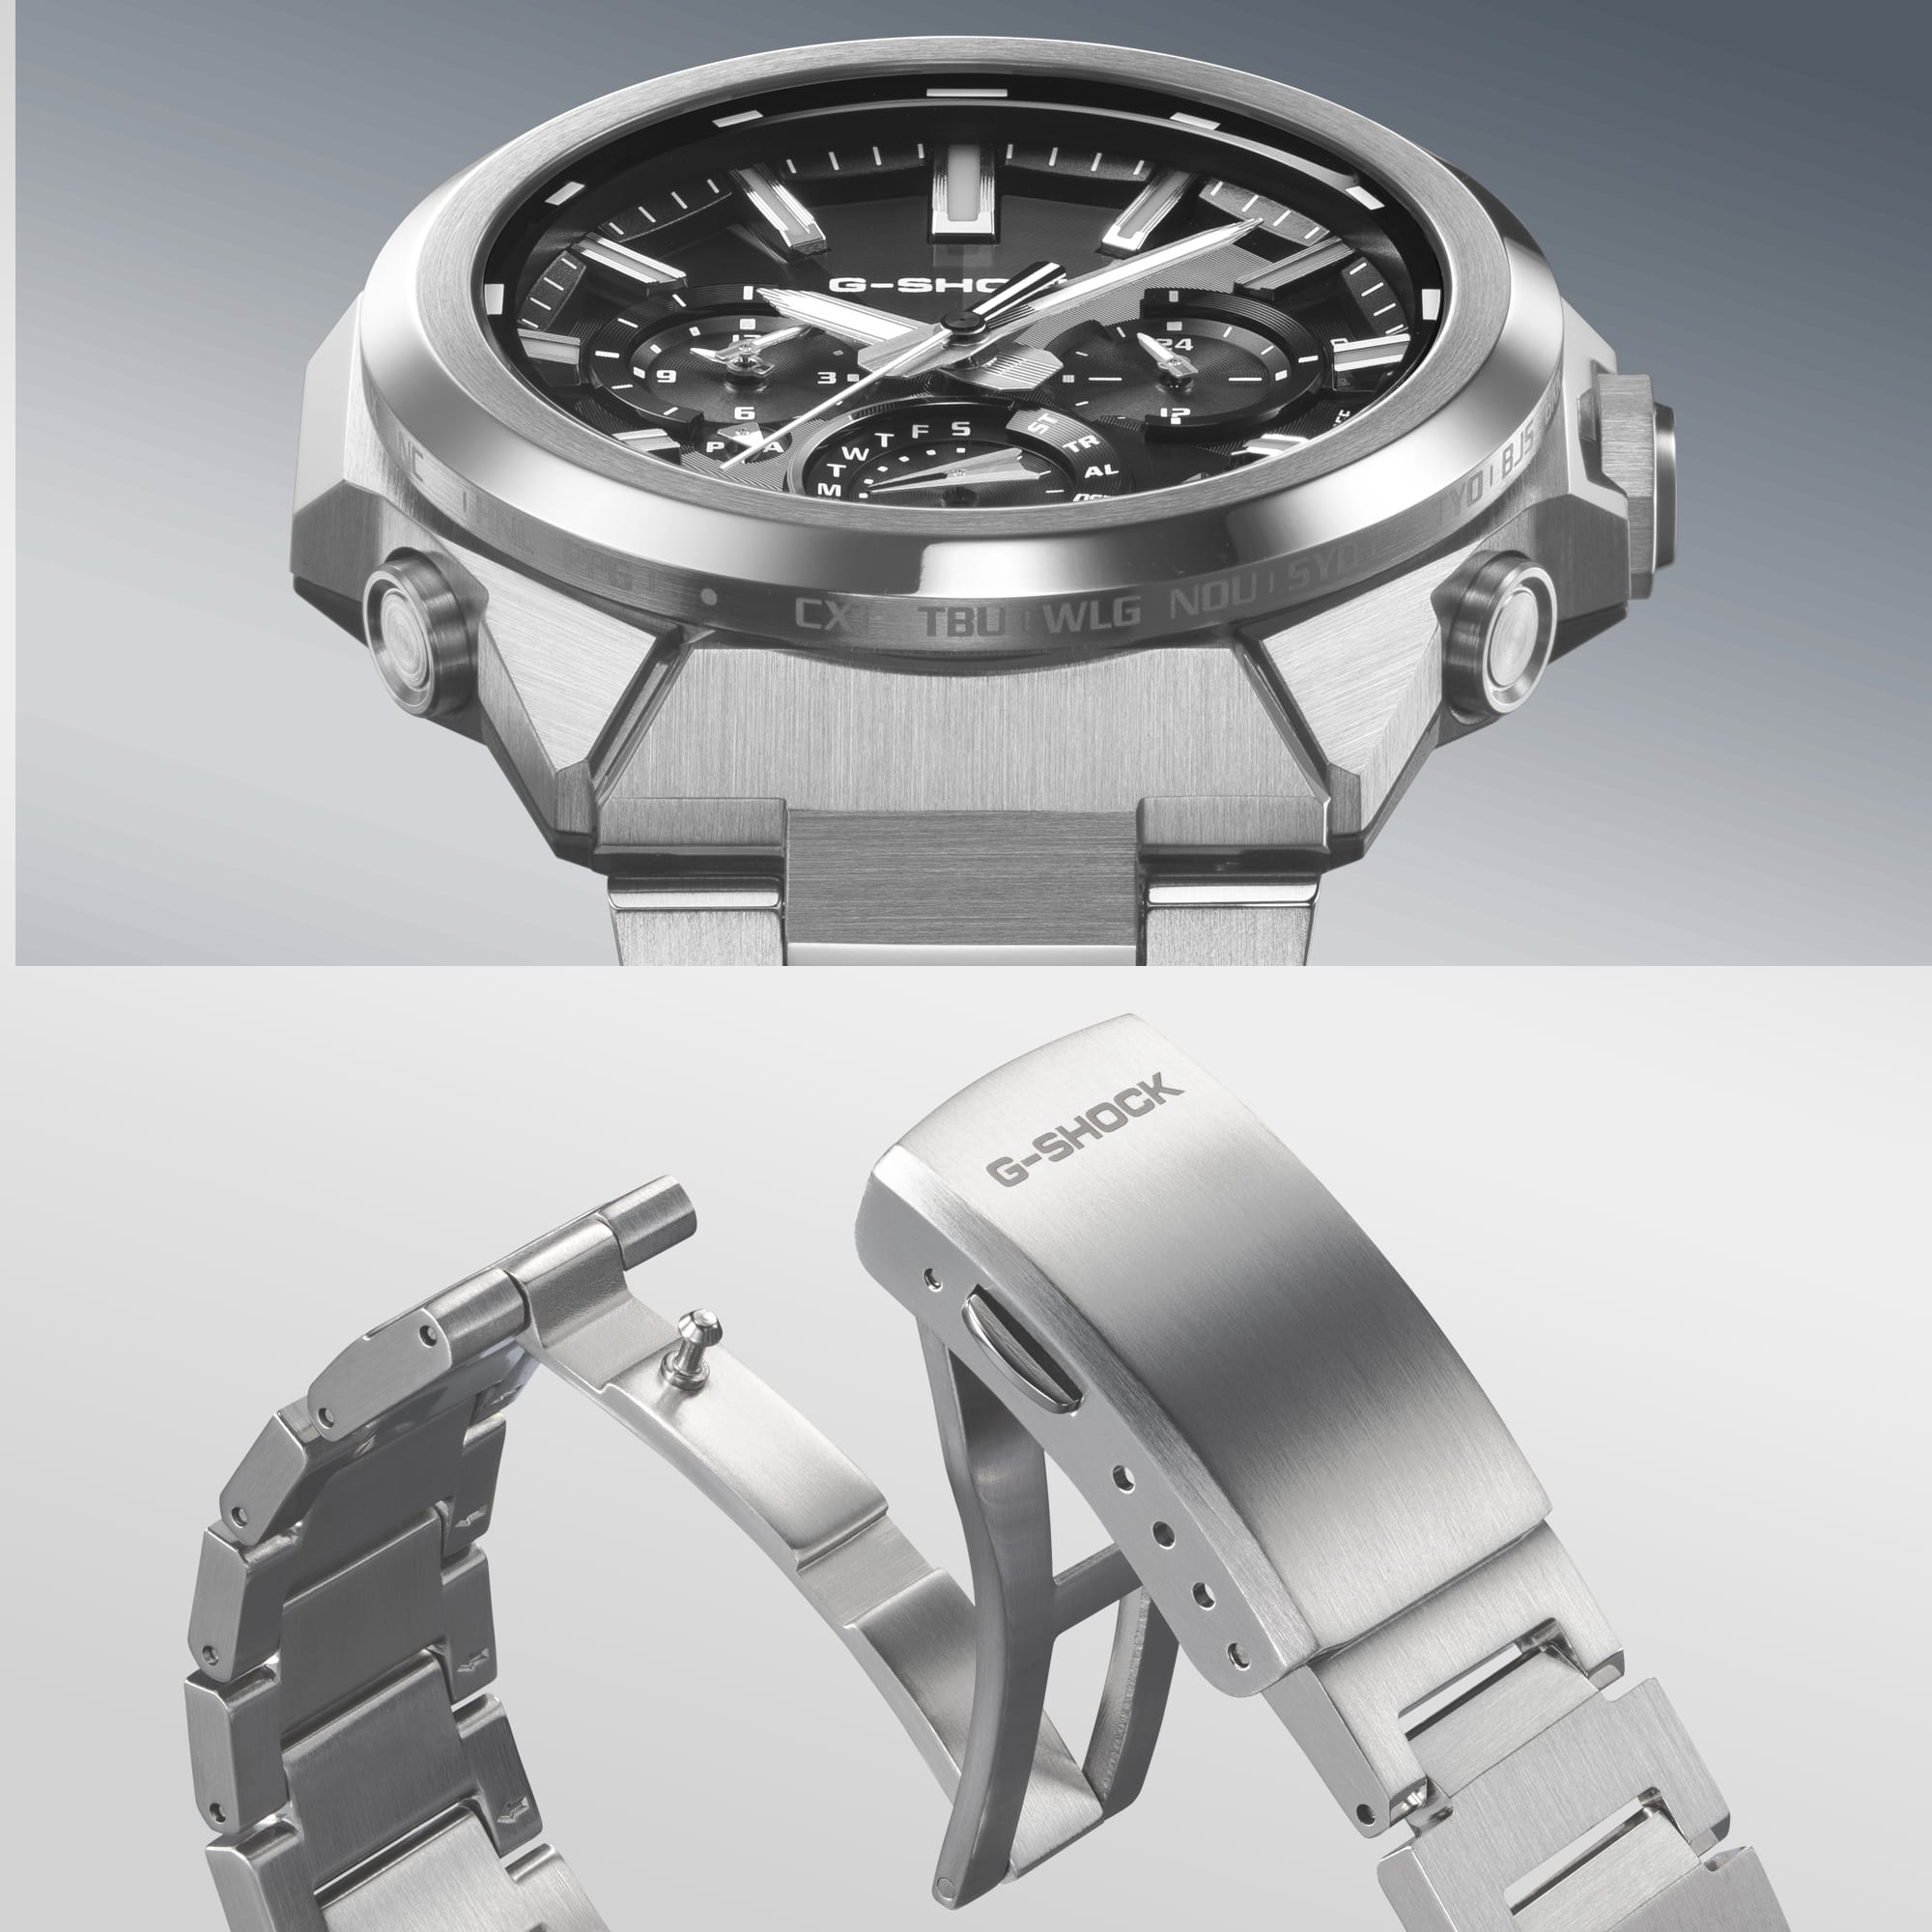
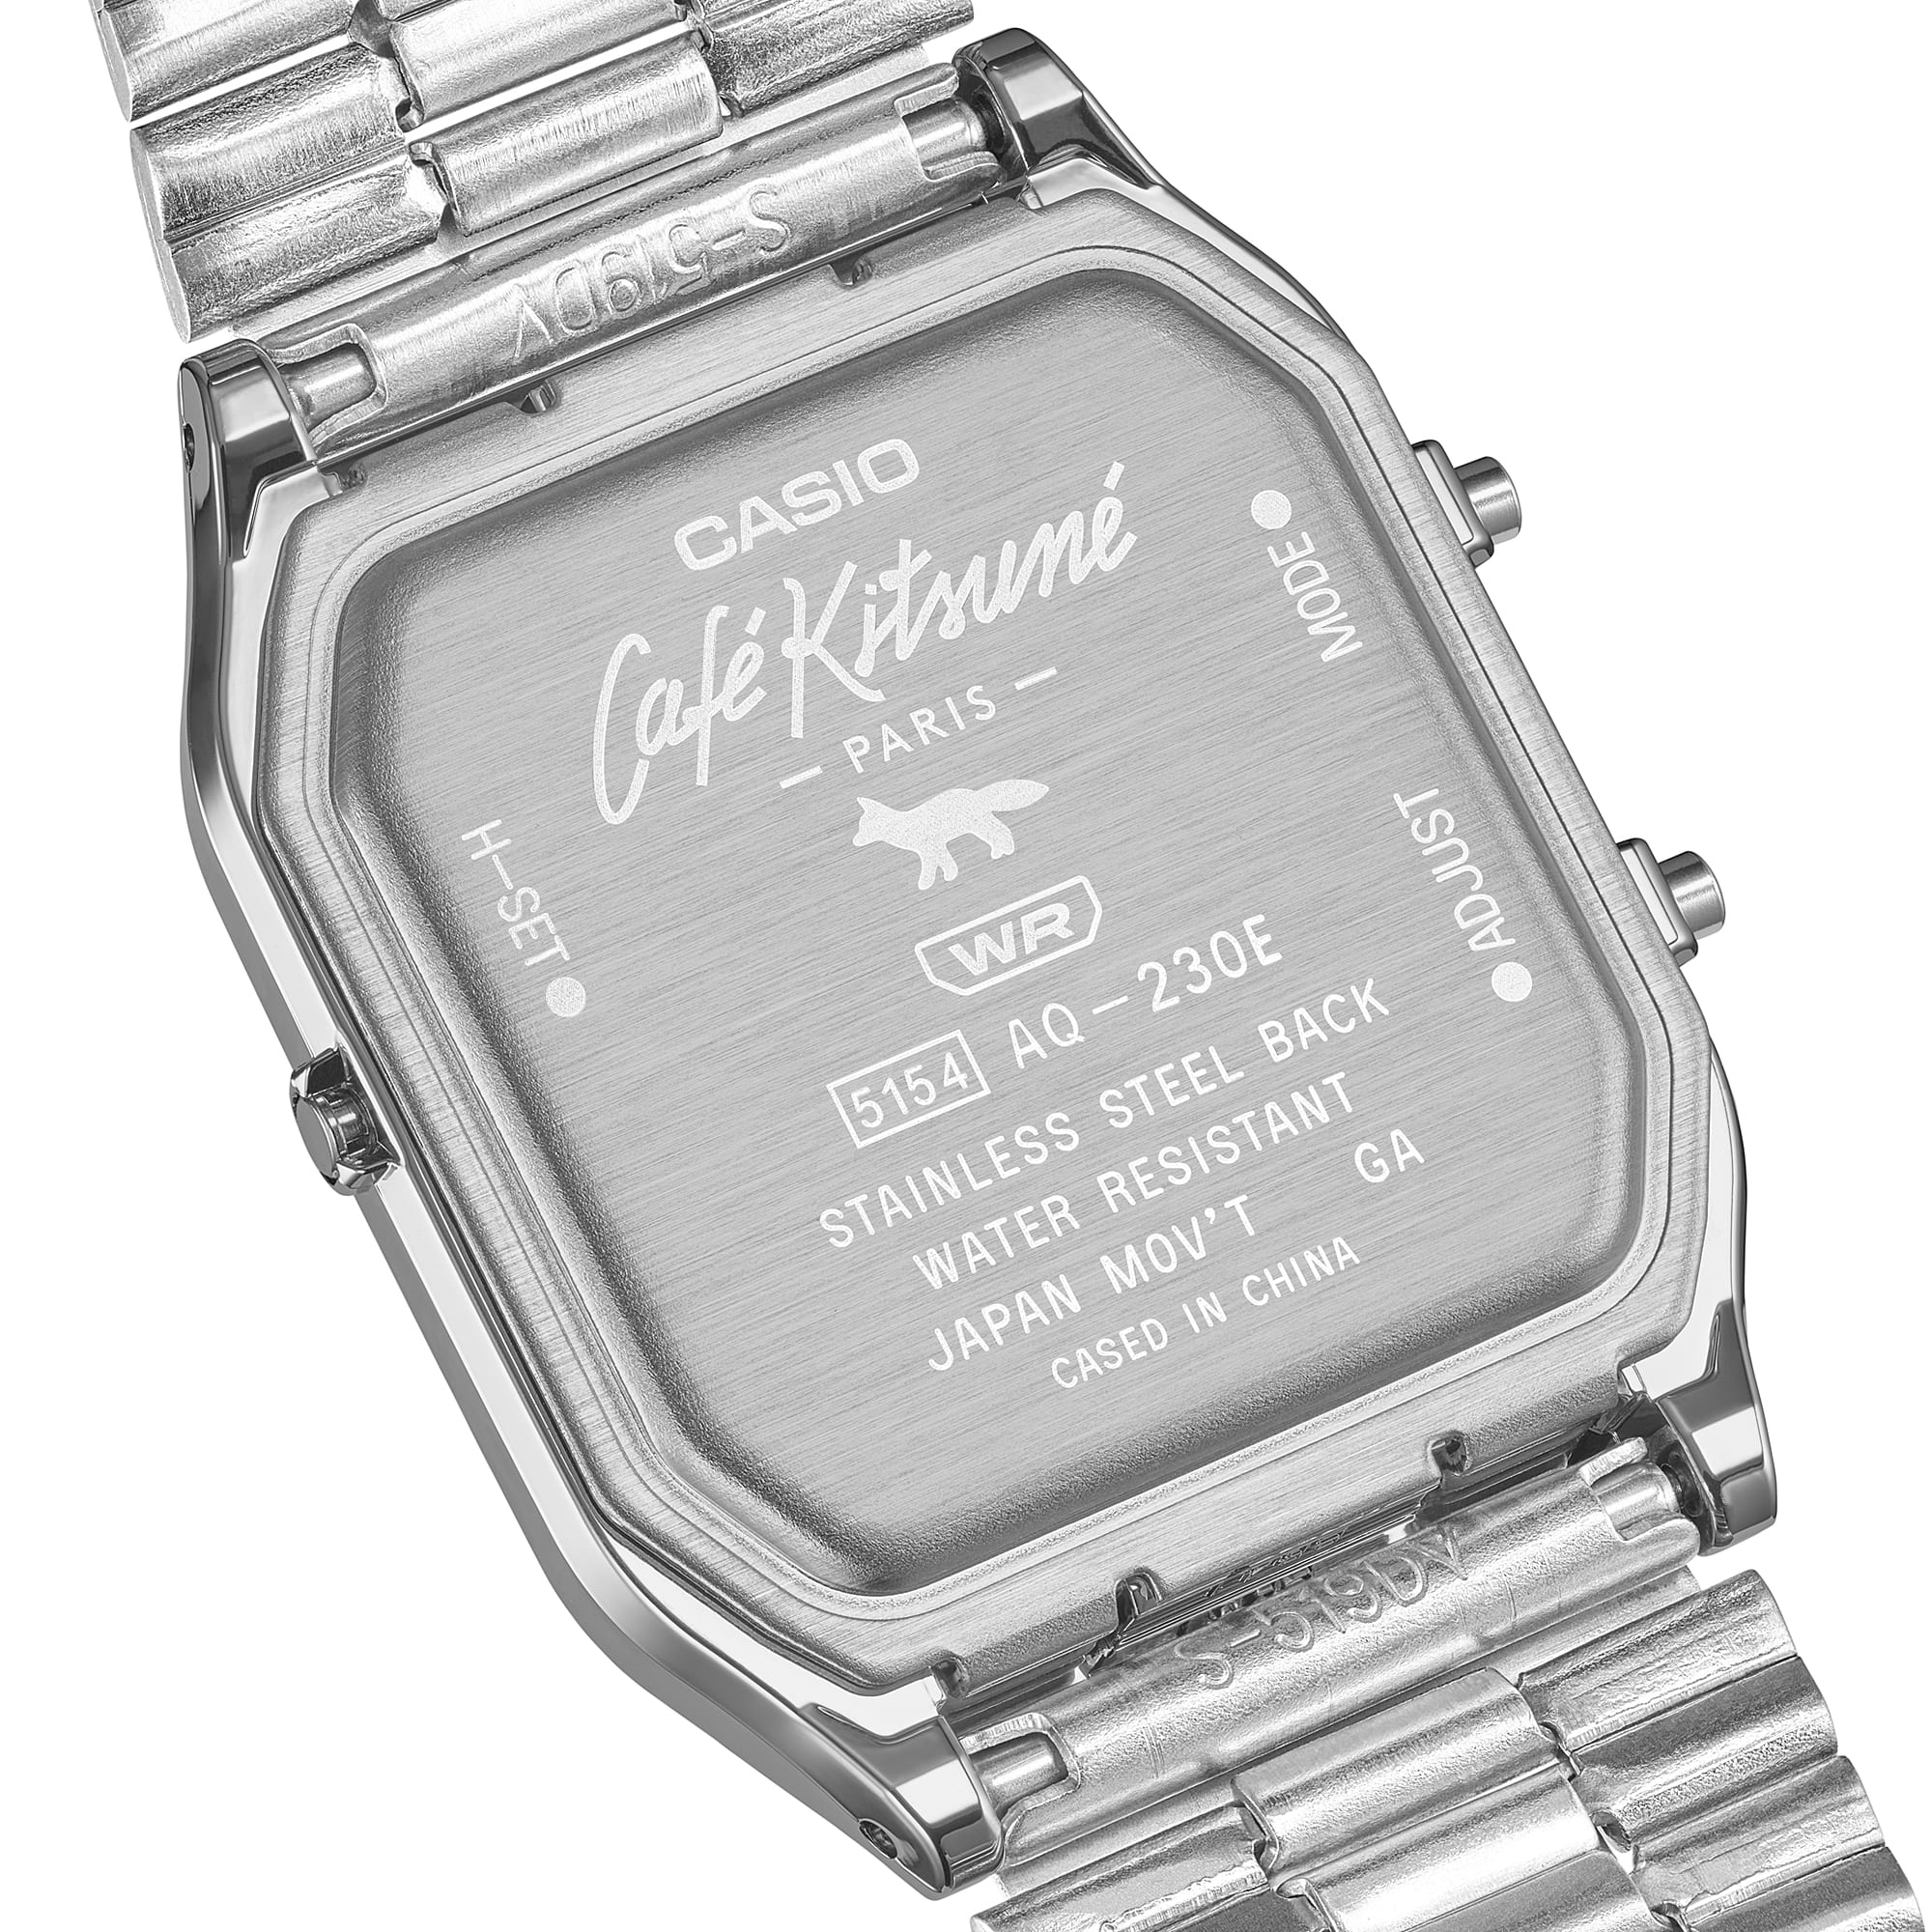 Case back engraving
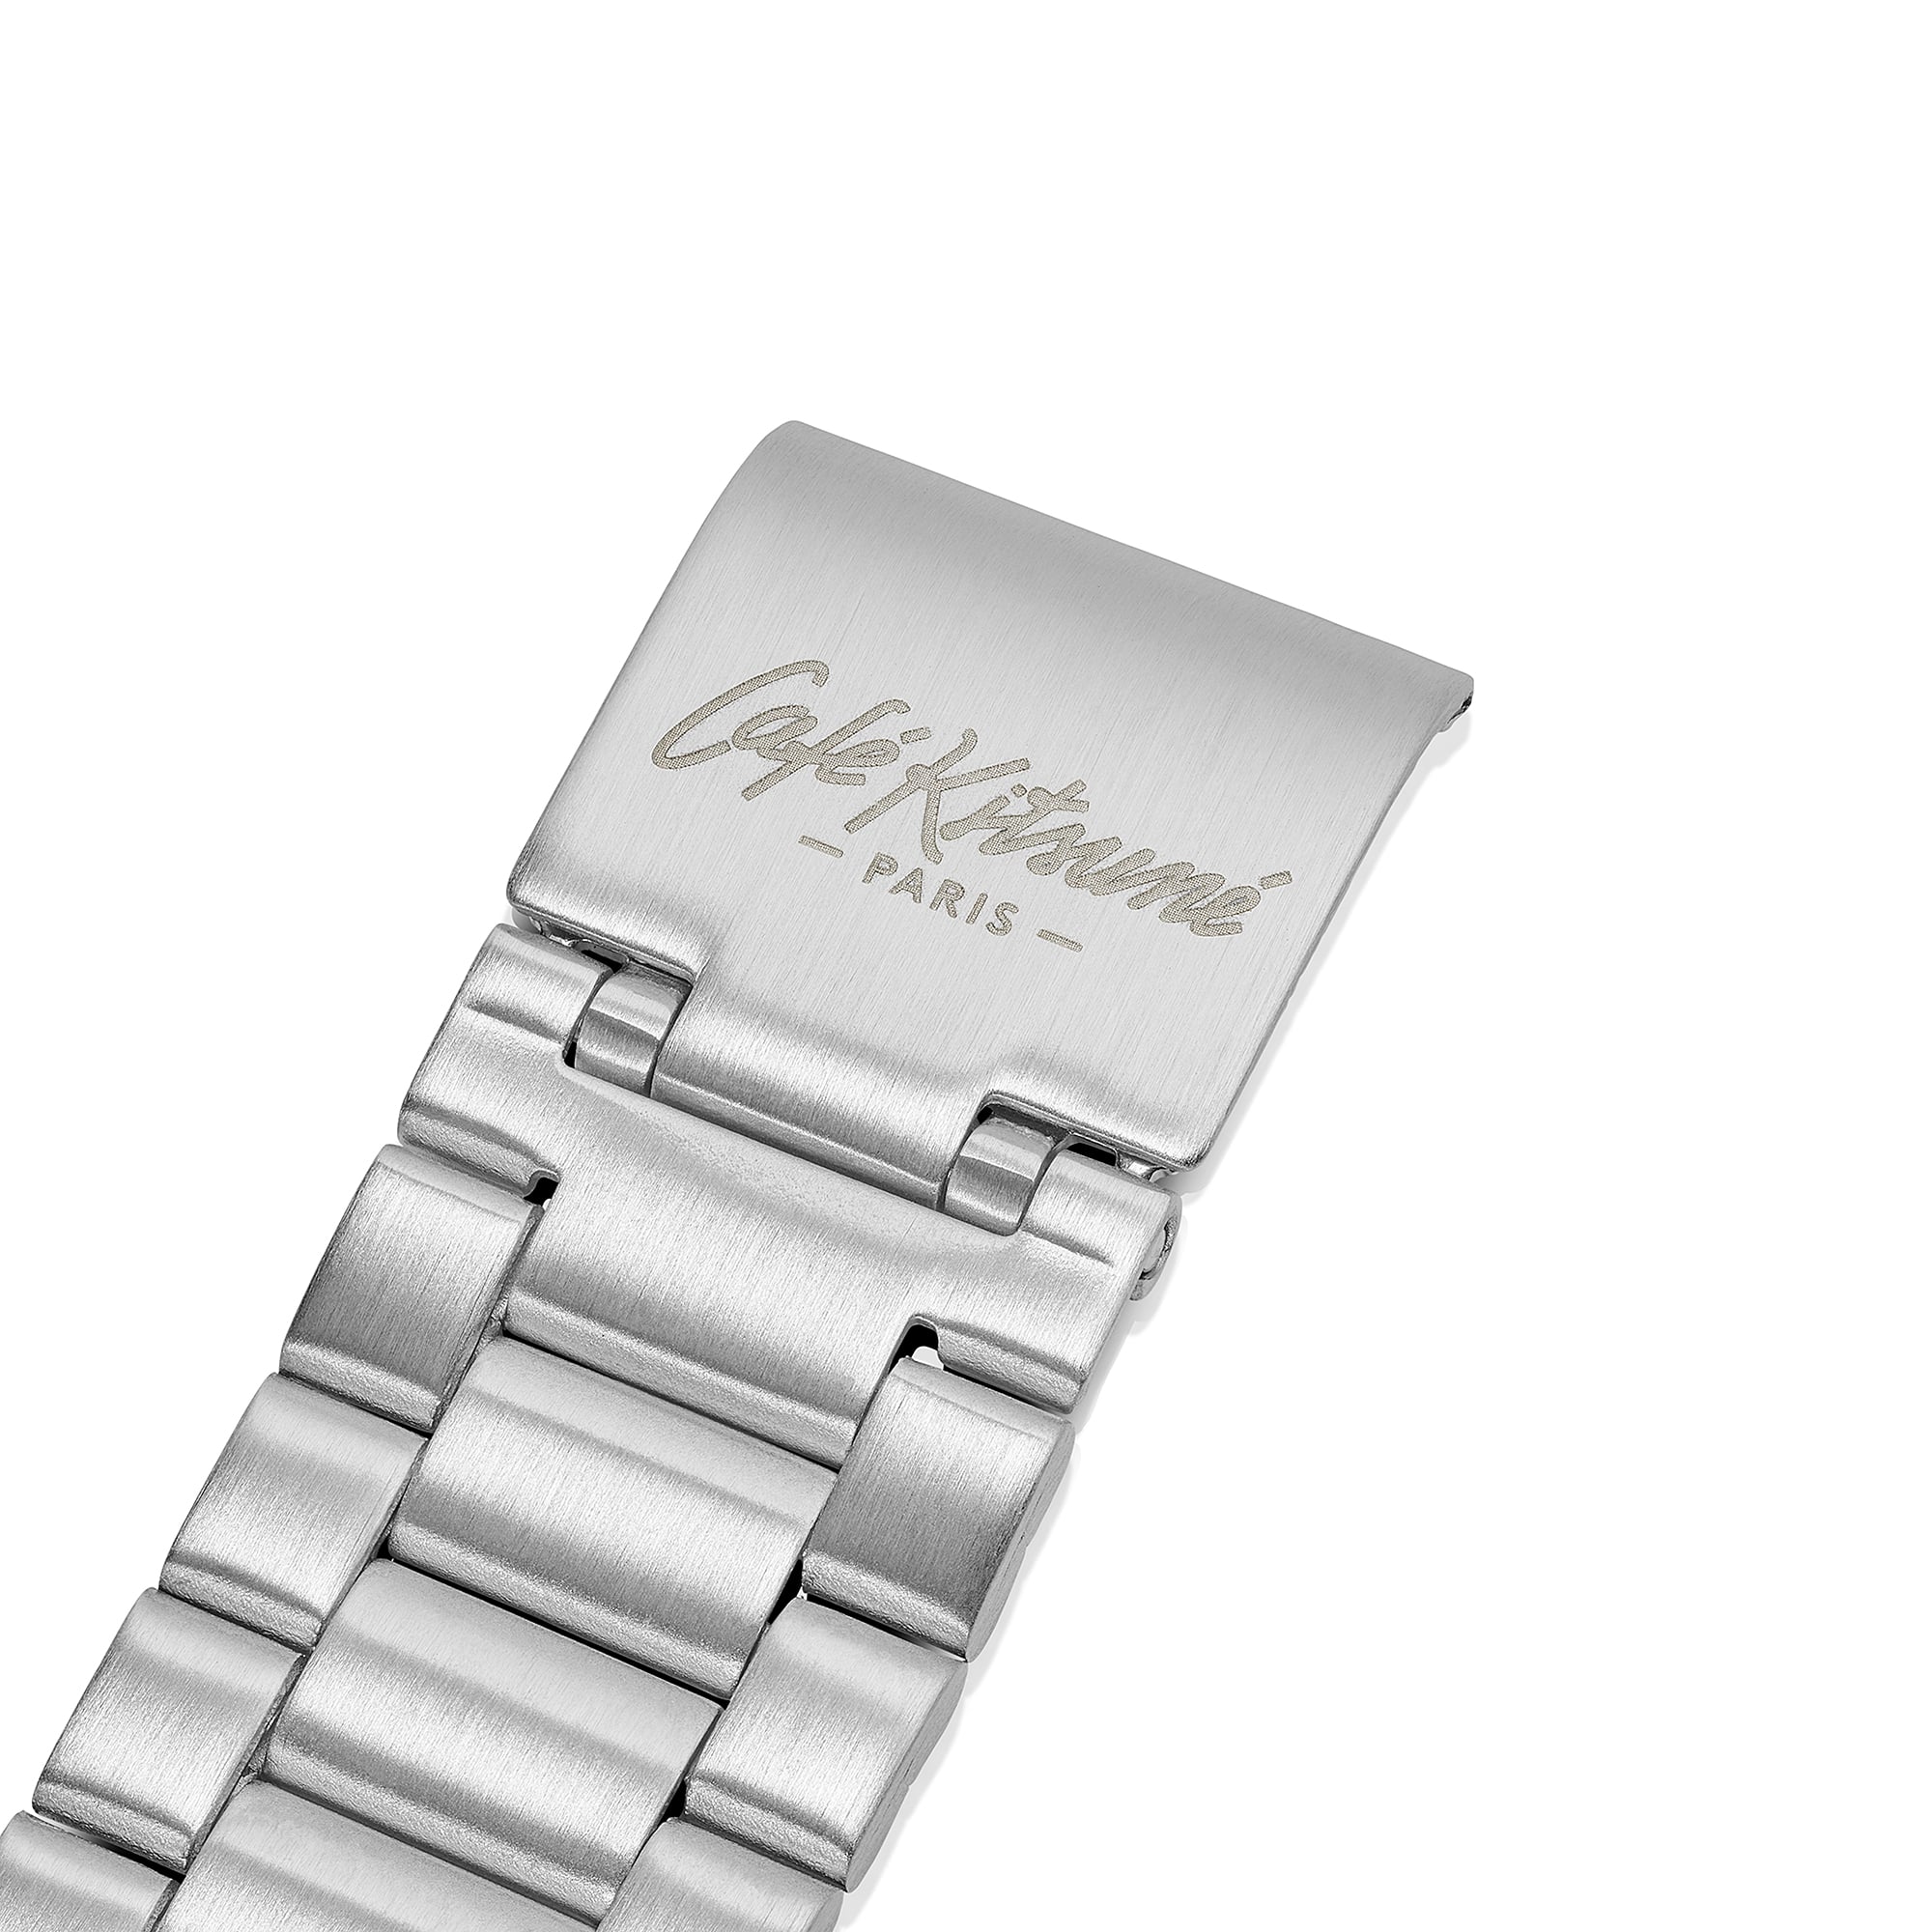 Clasp engraving
 Special packaging





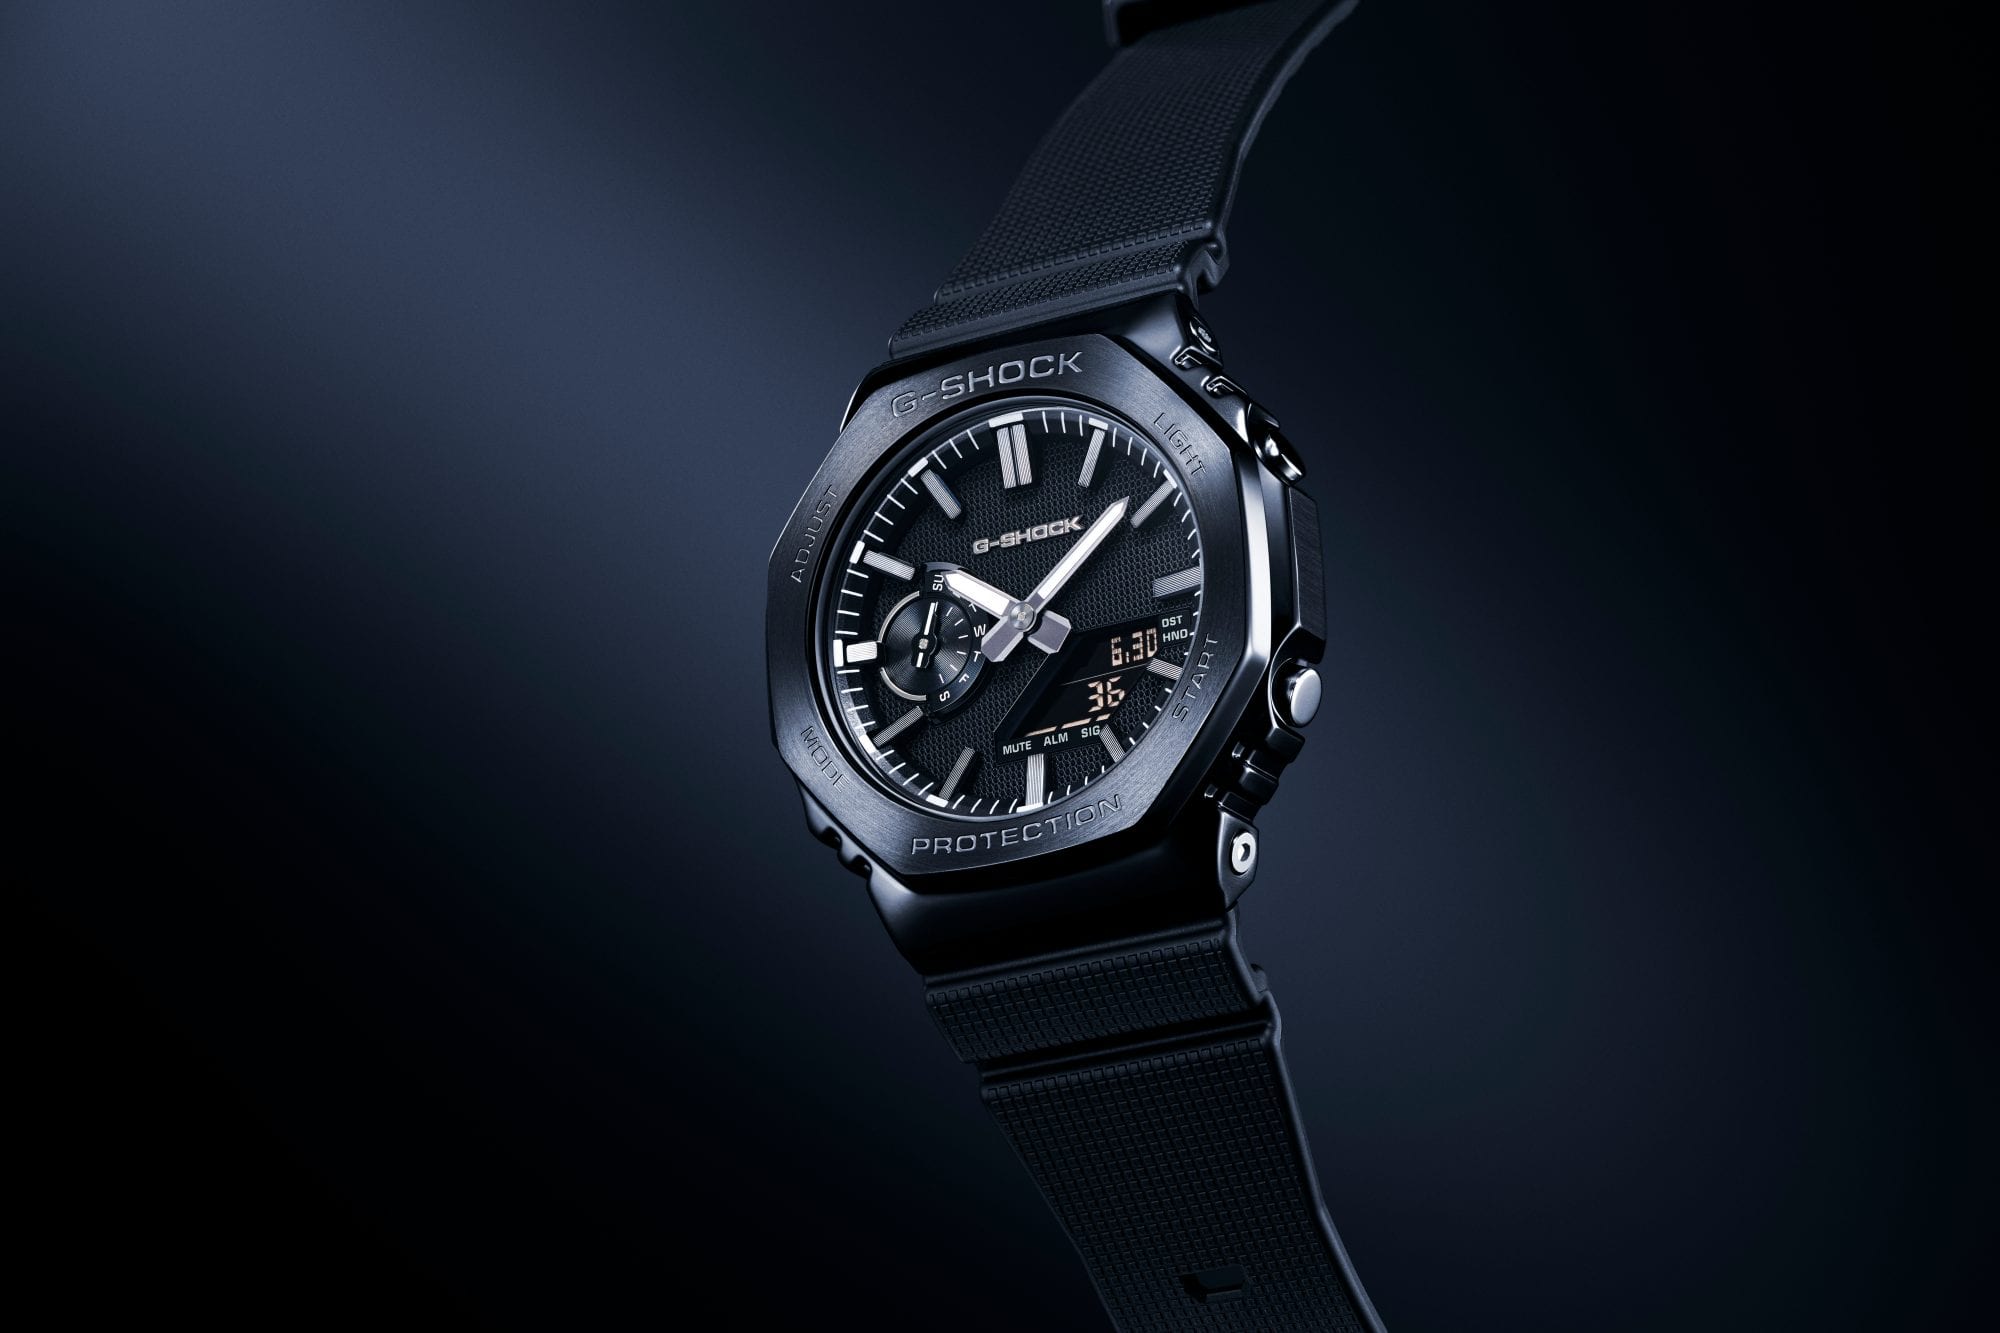
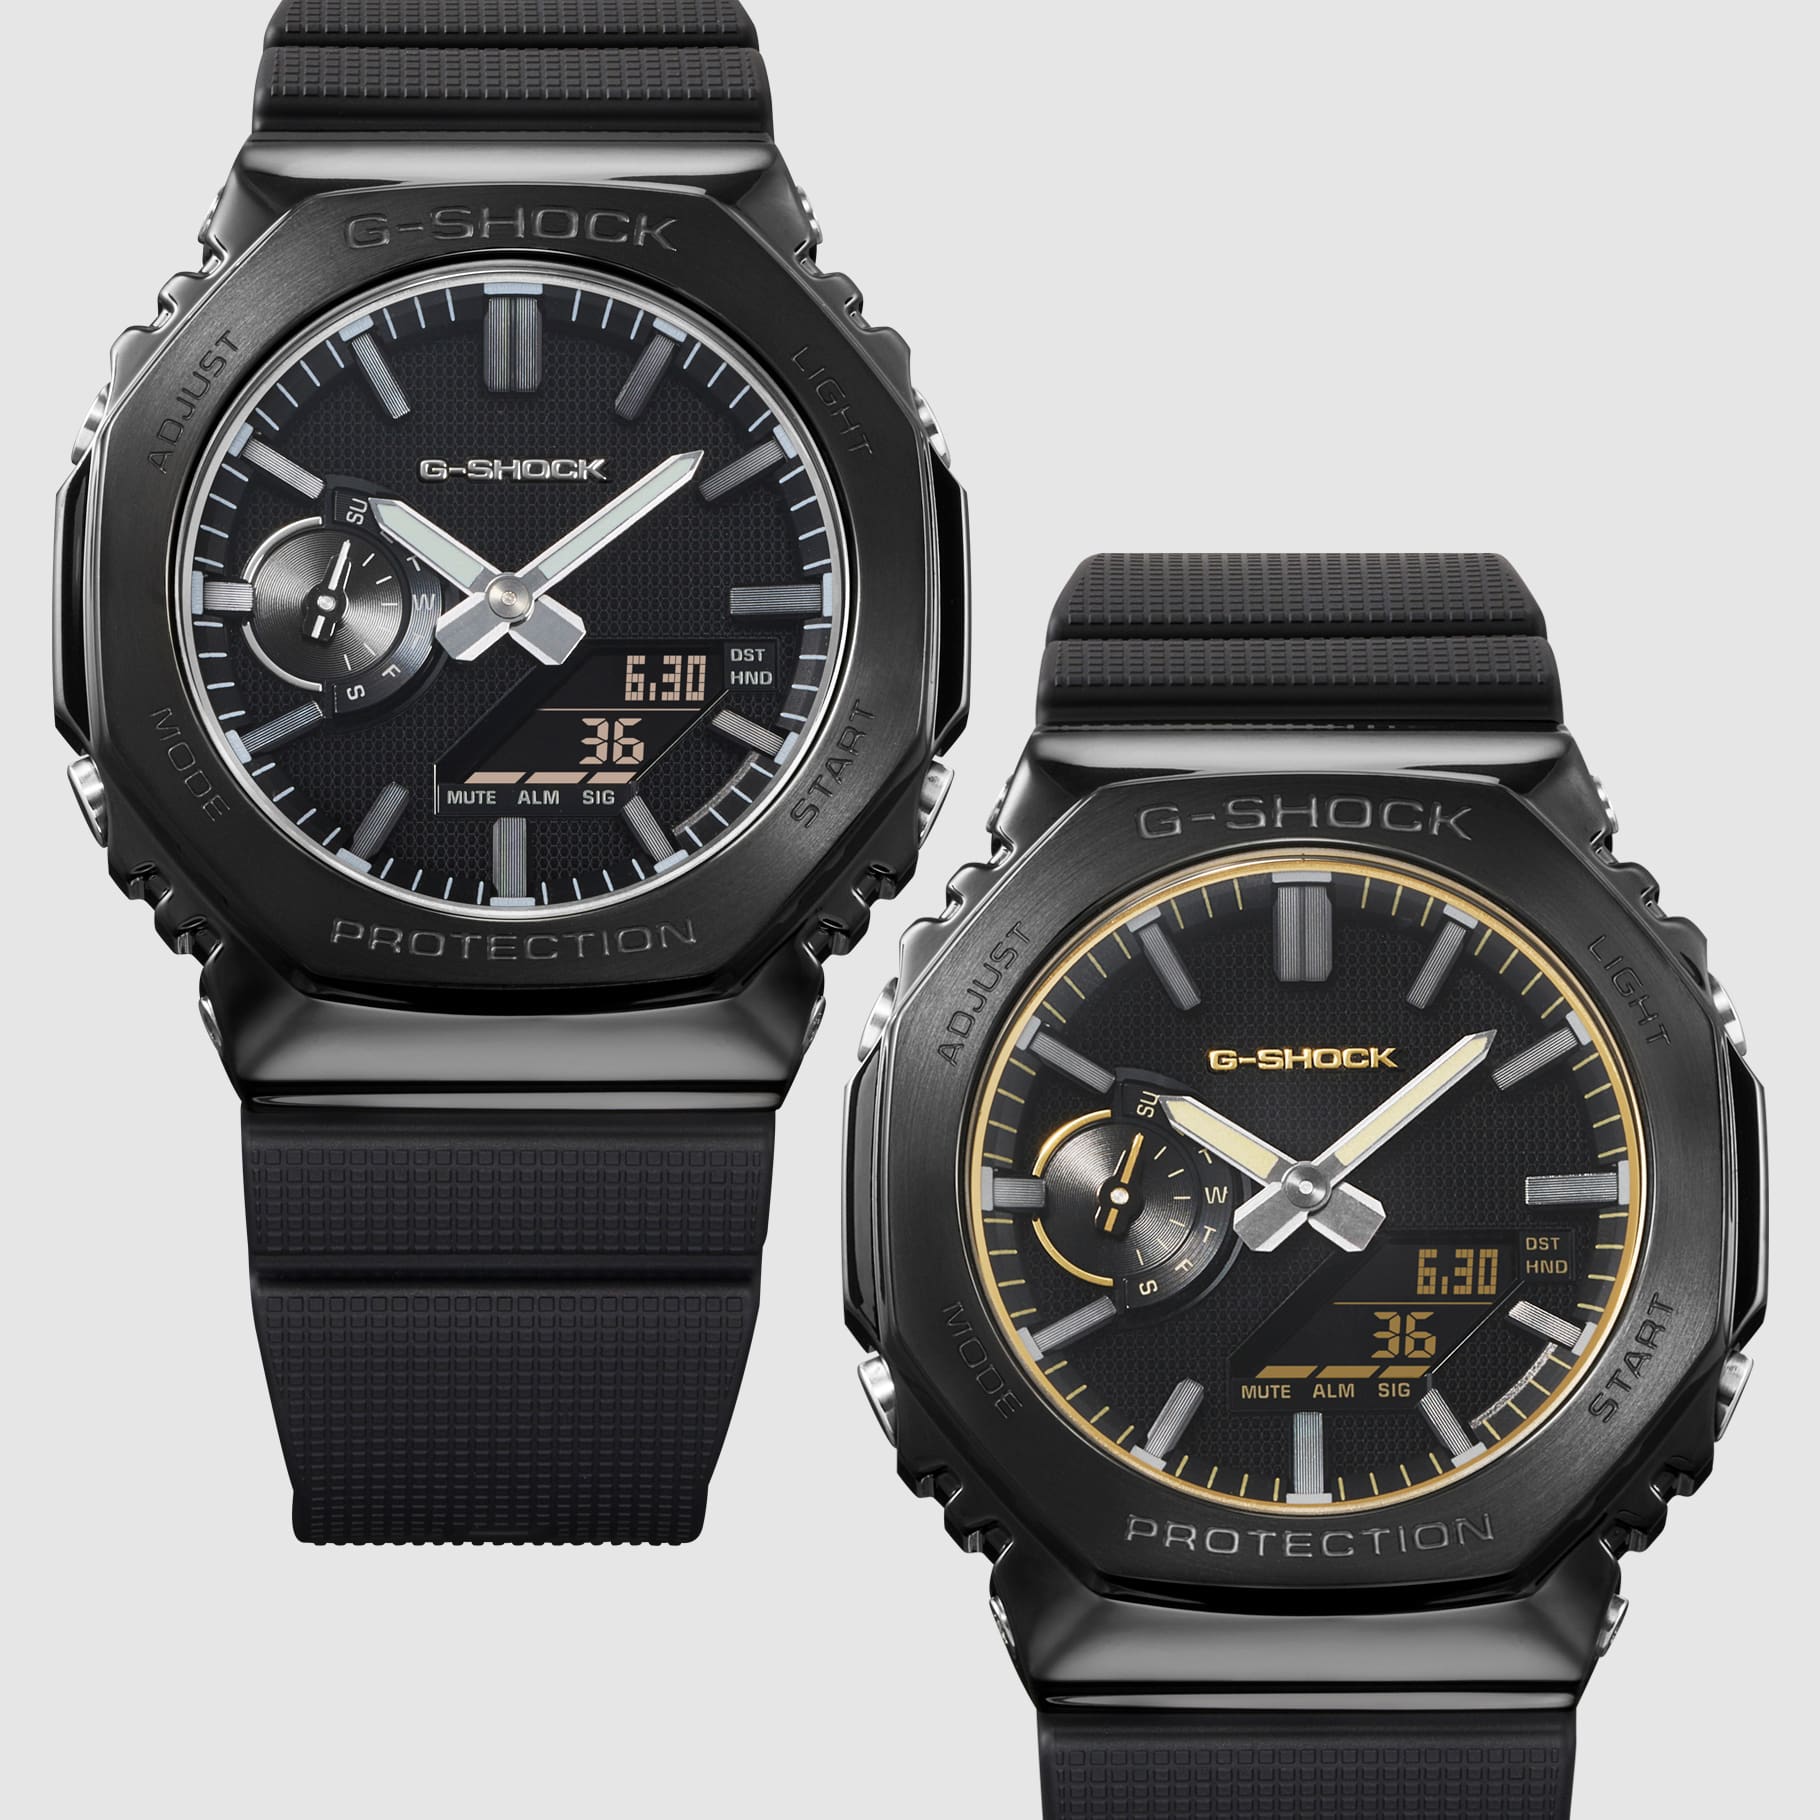 The GM-2100LXB with a metal design
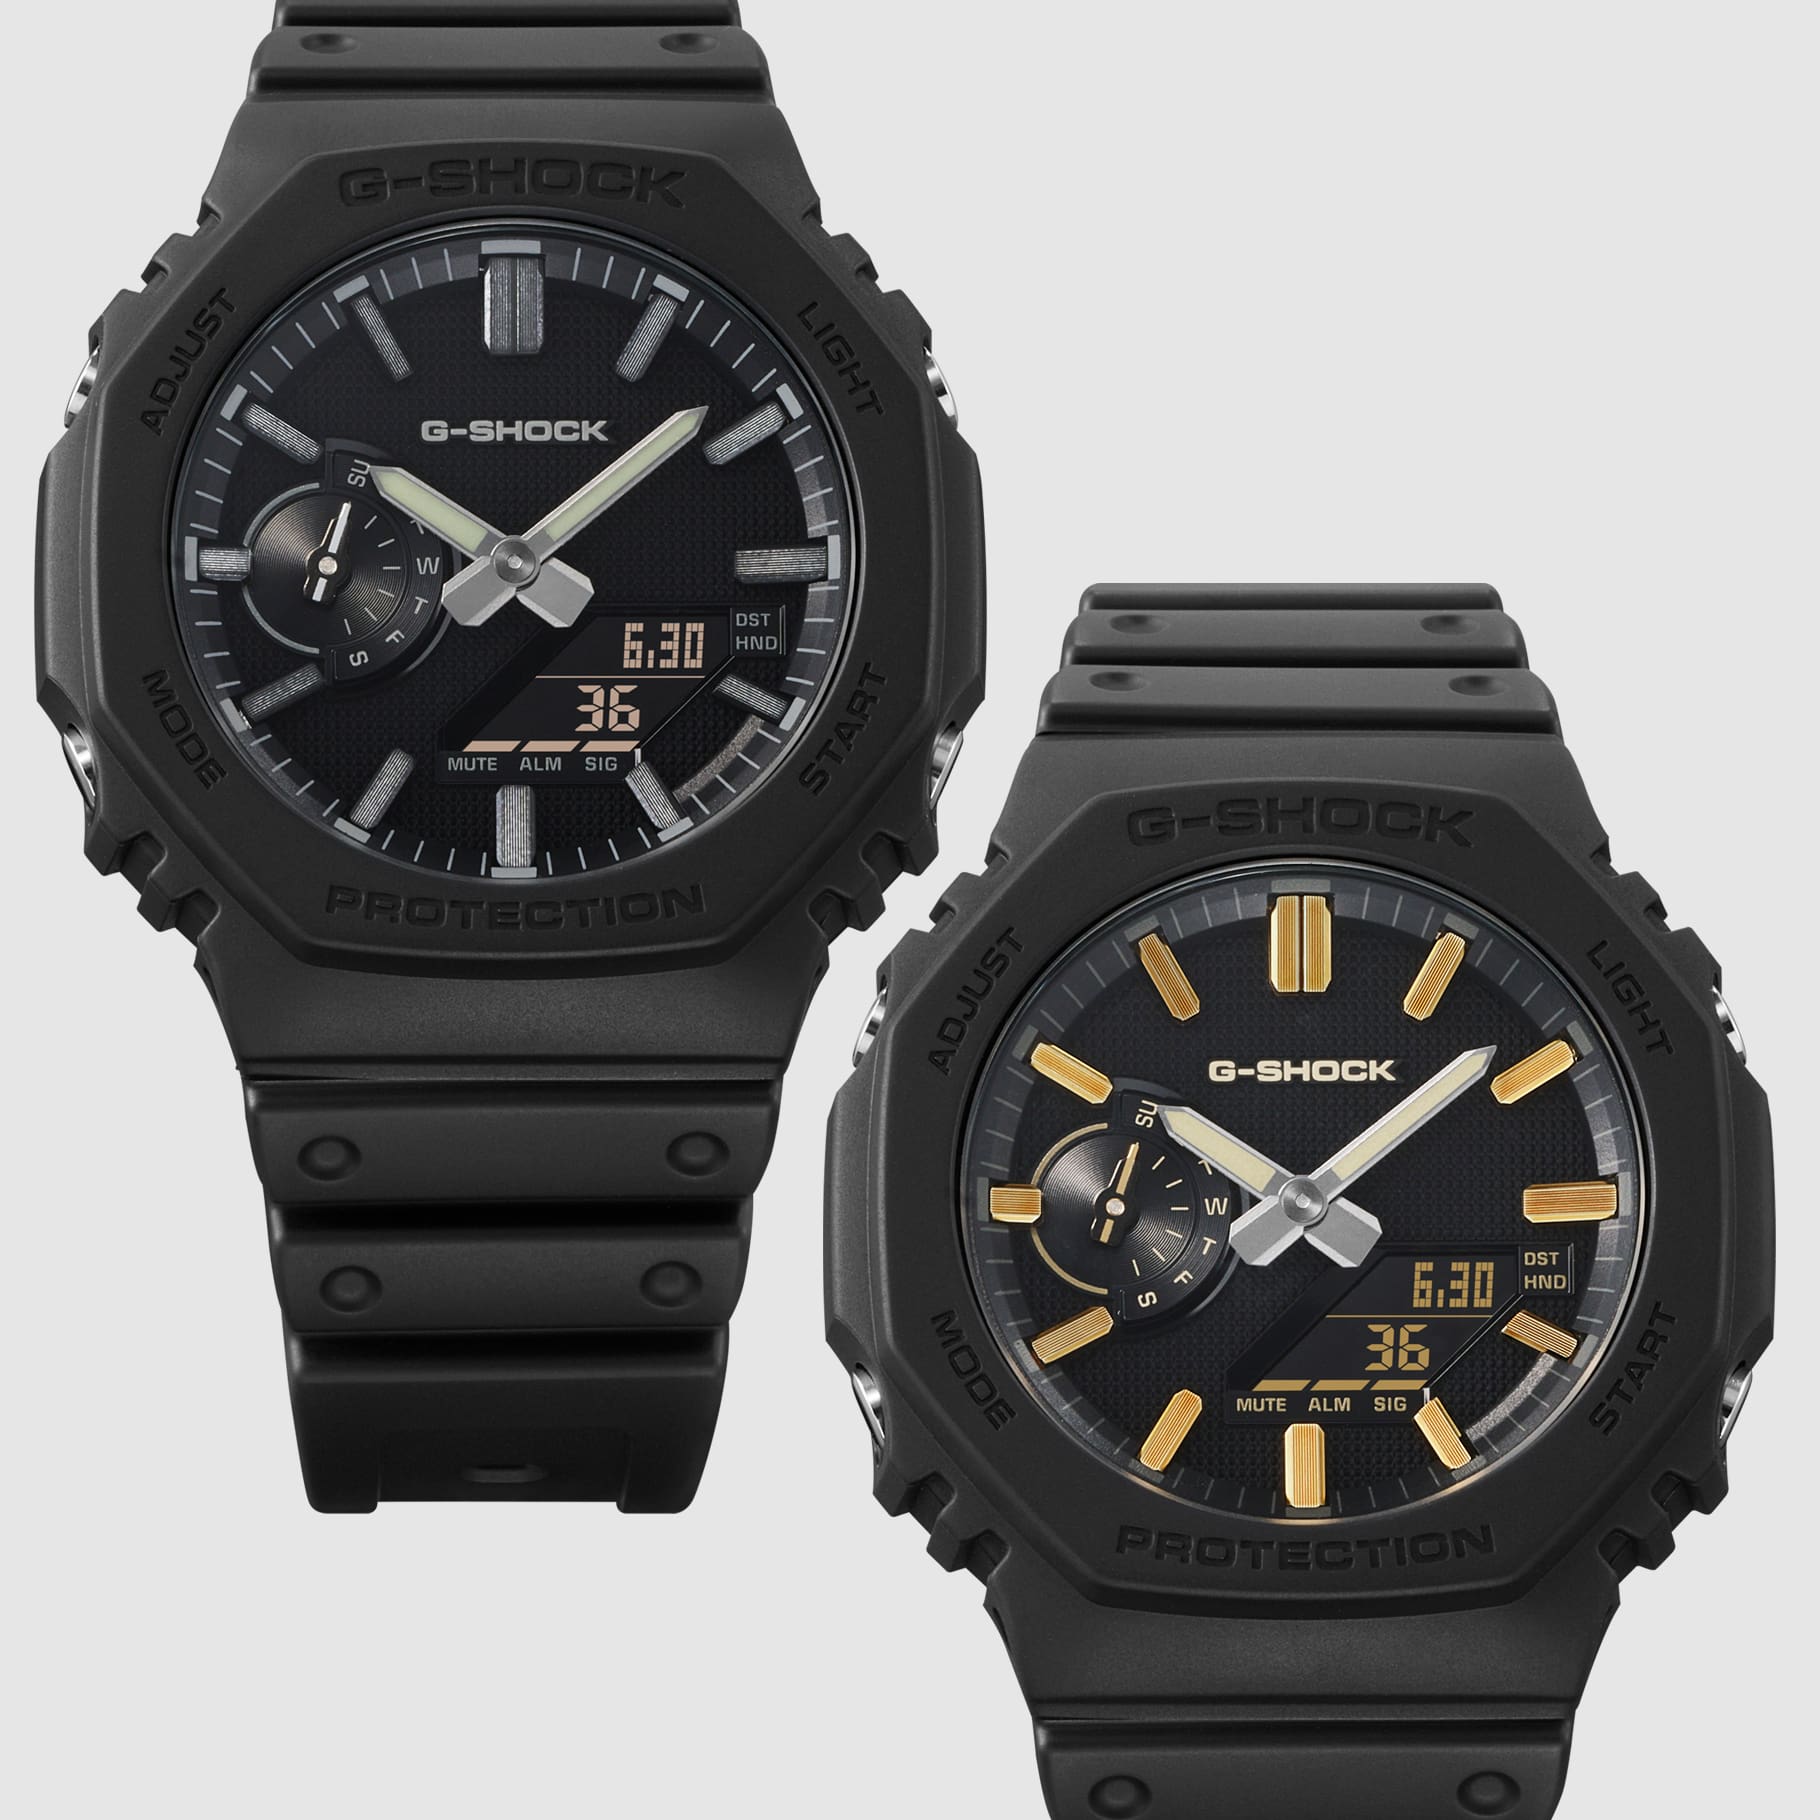 A comparison with the resin GA-2100LXB


 GA-110PKM

 Dial
 When light is on
 Engraved case back
 Band
 Band loop
 Packaging


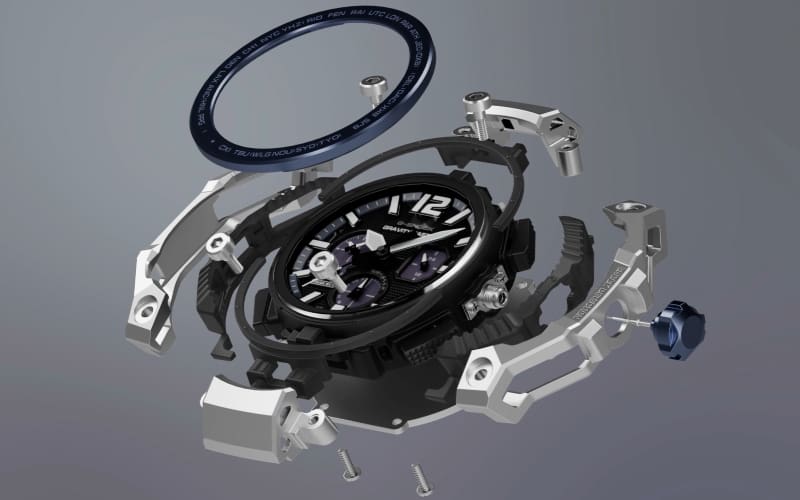




 Facettenschnitt-Lünette aus COBARION Superharte Legierung
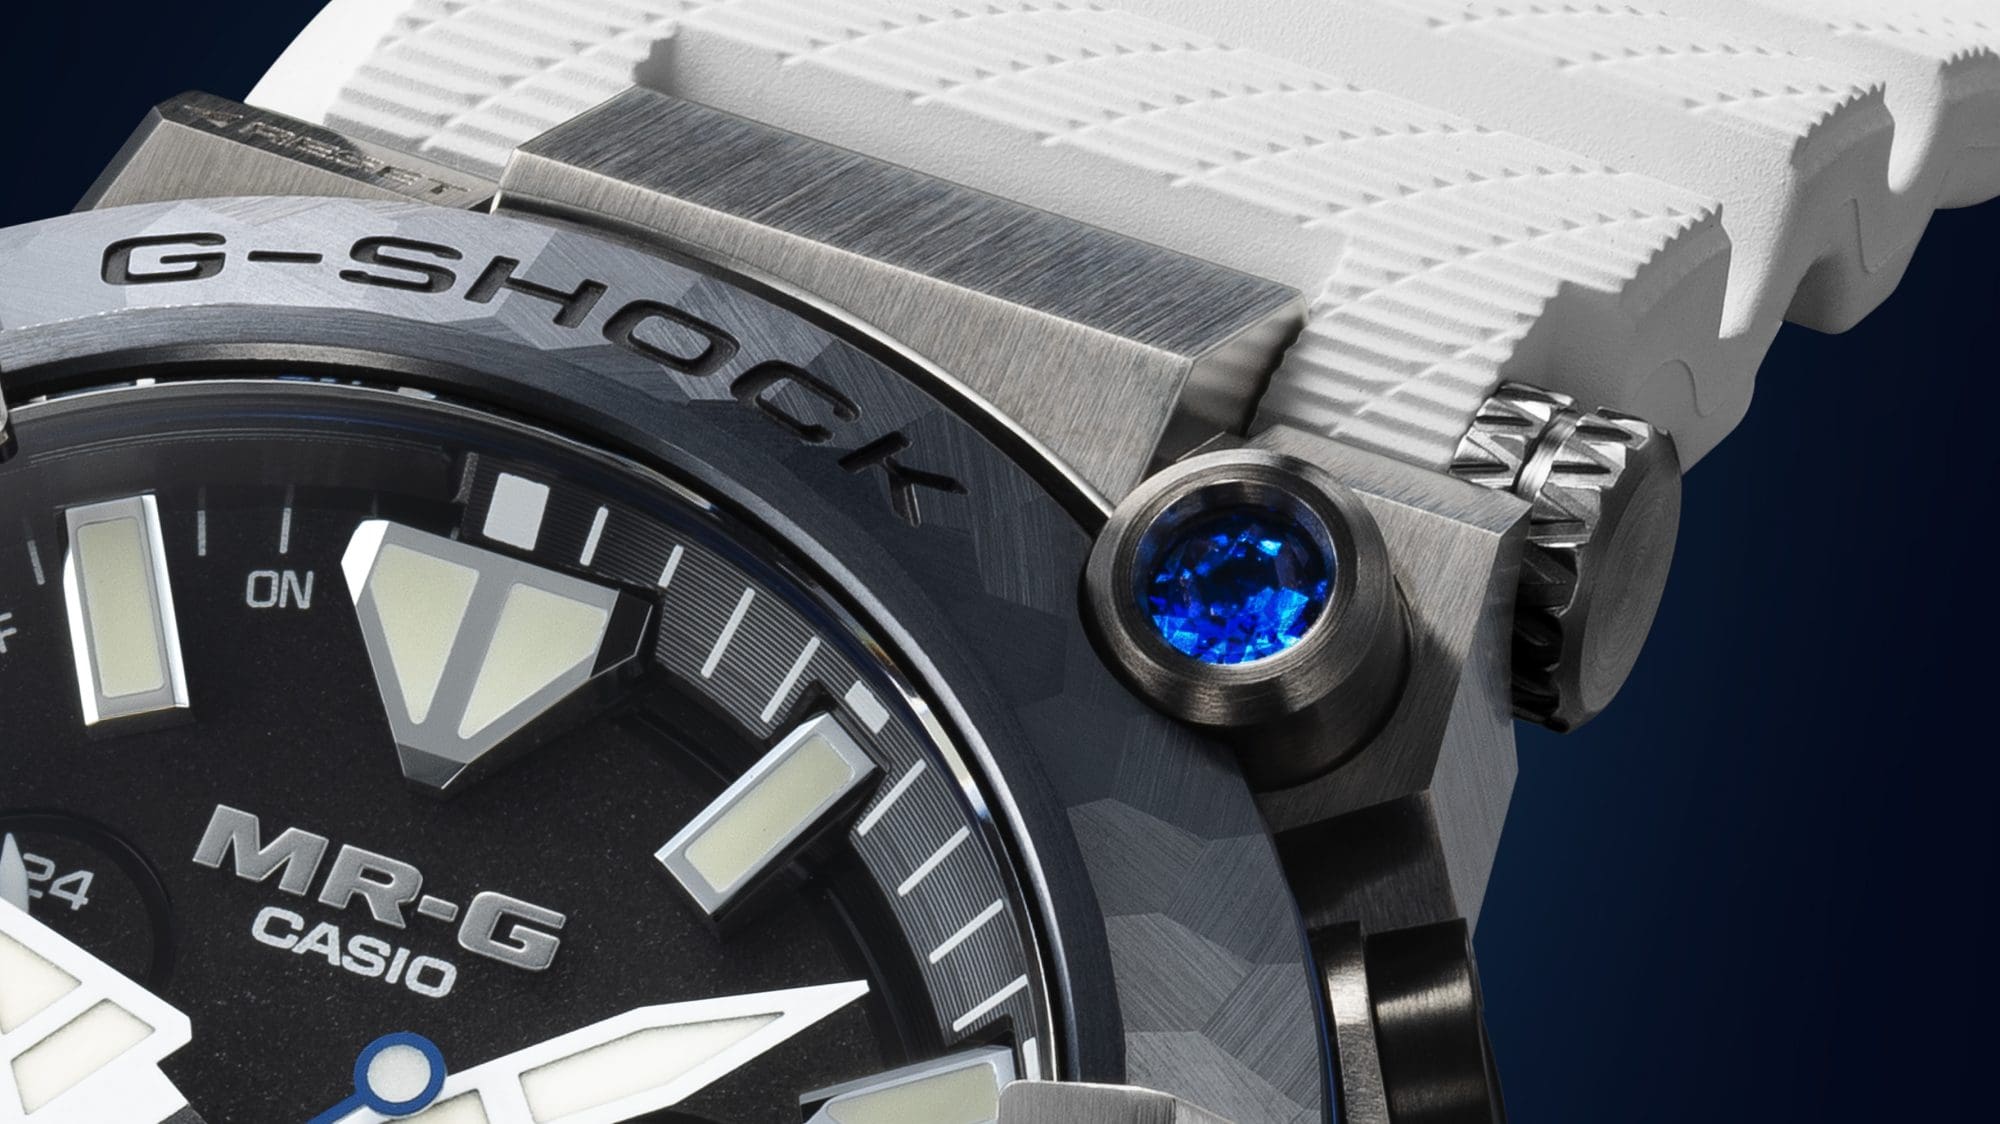 Lab-grown blue sapphire
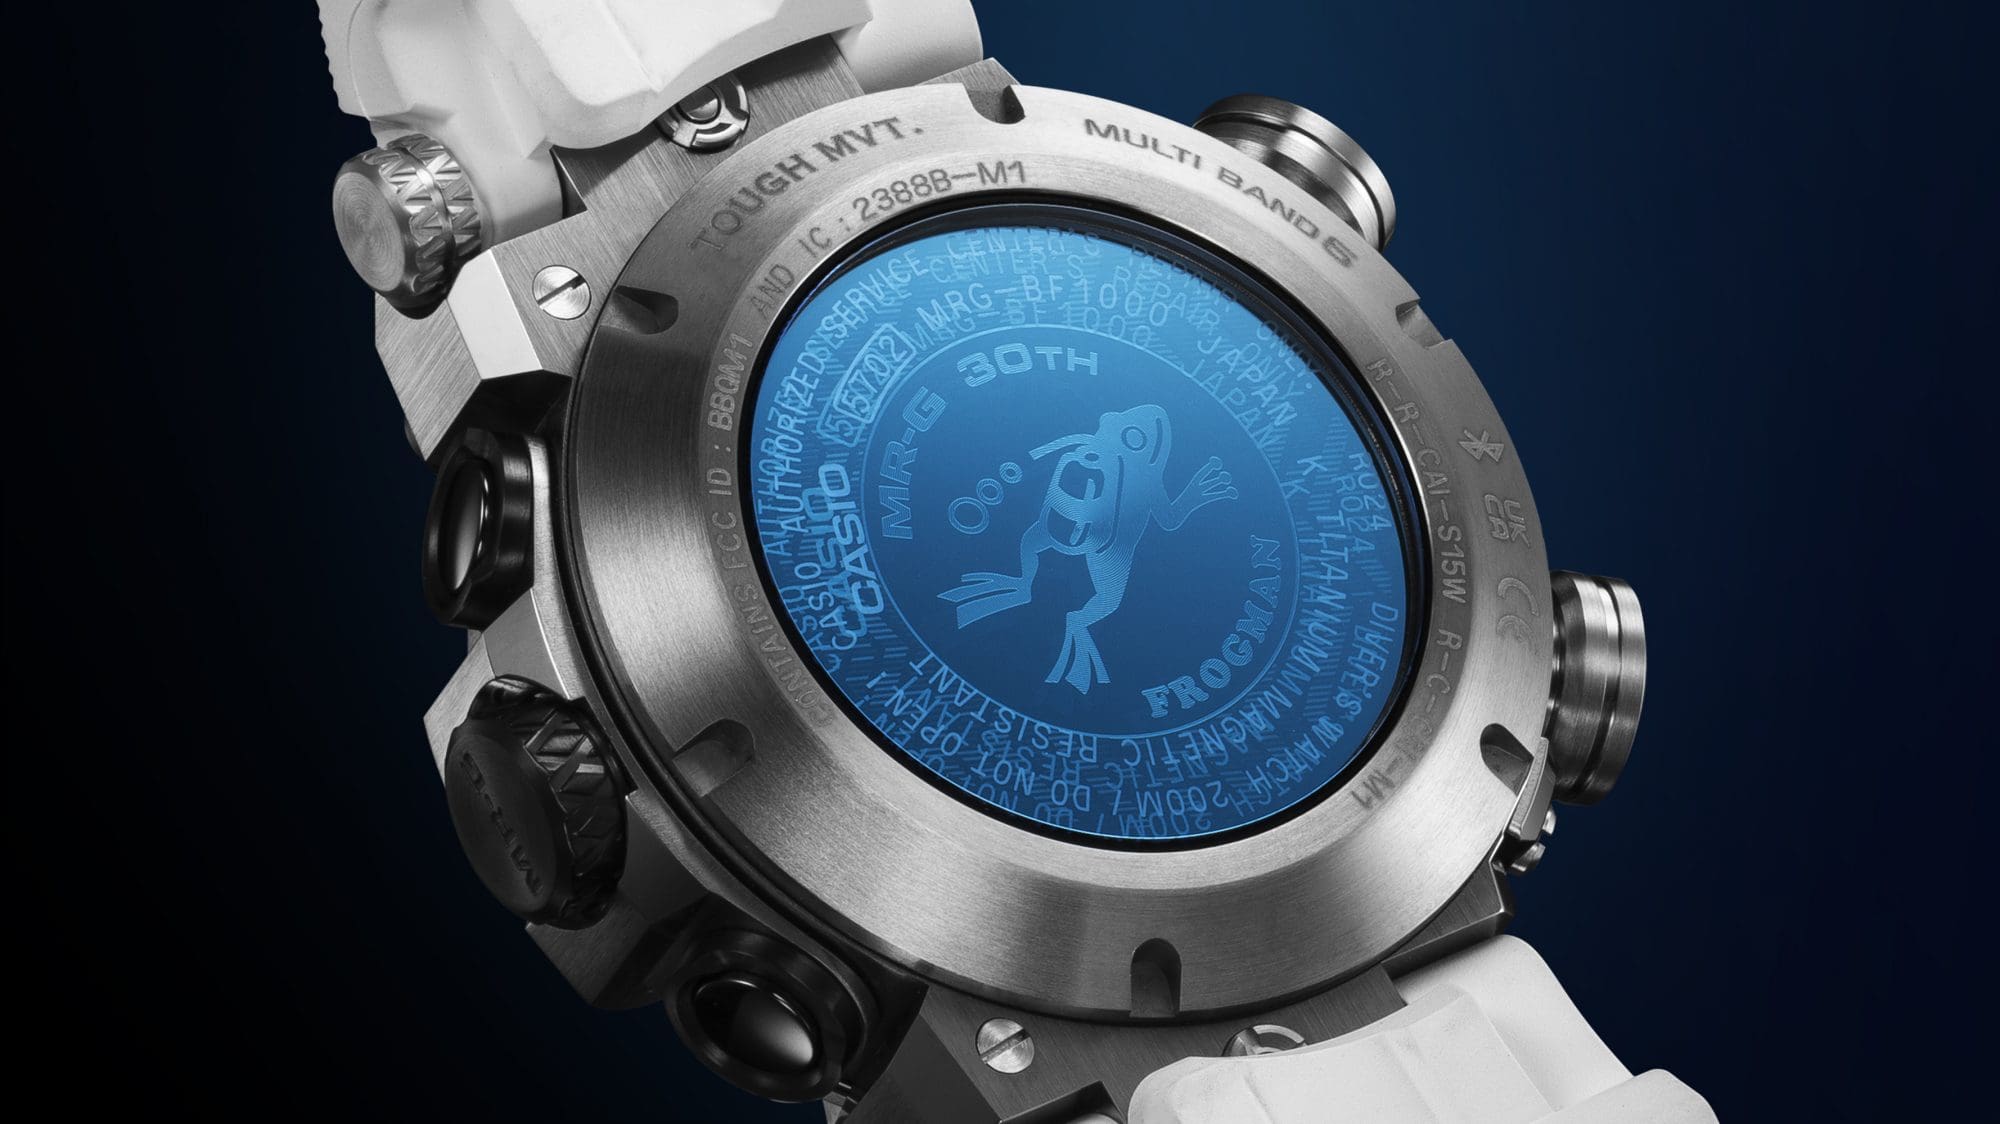 Engraved case back
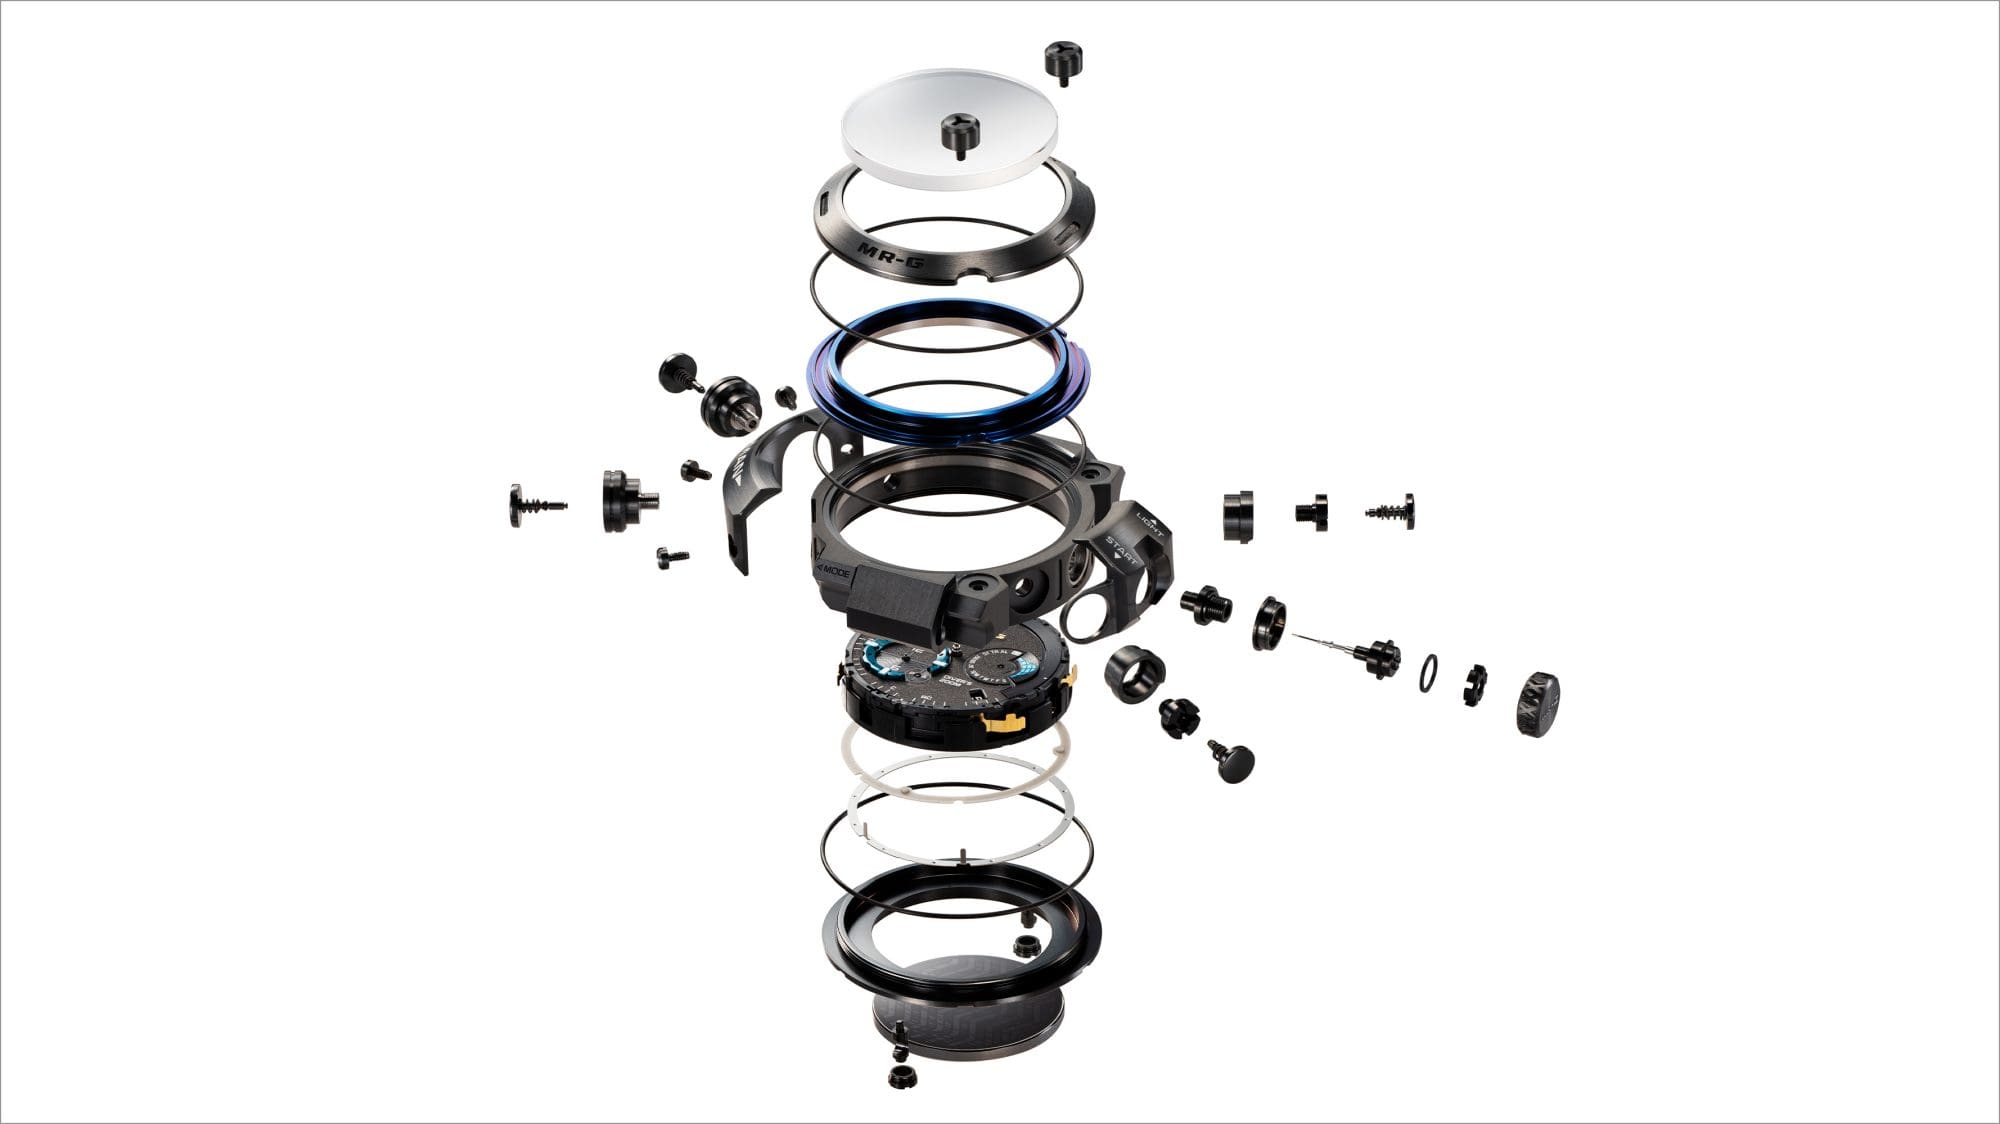 Case constructed from over 70 separate components
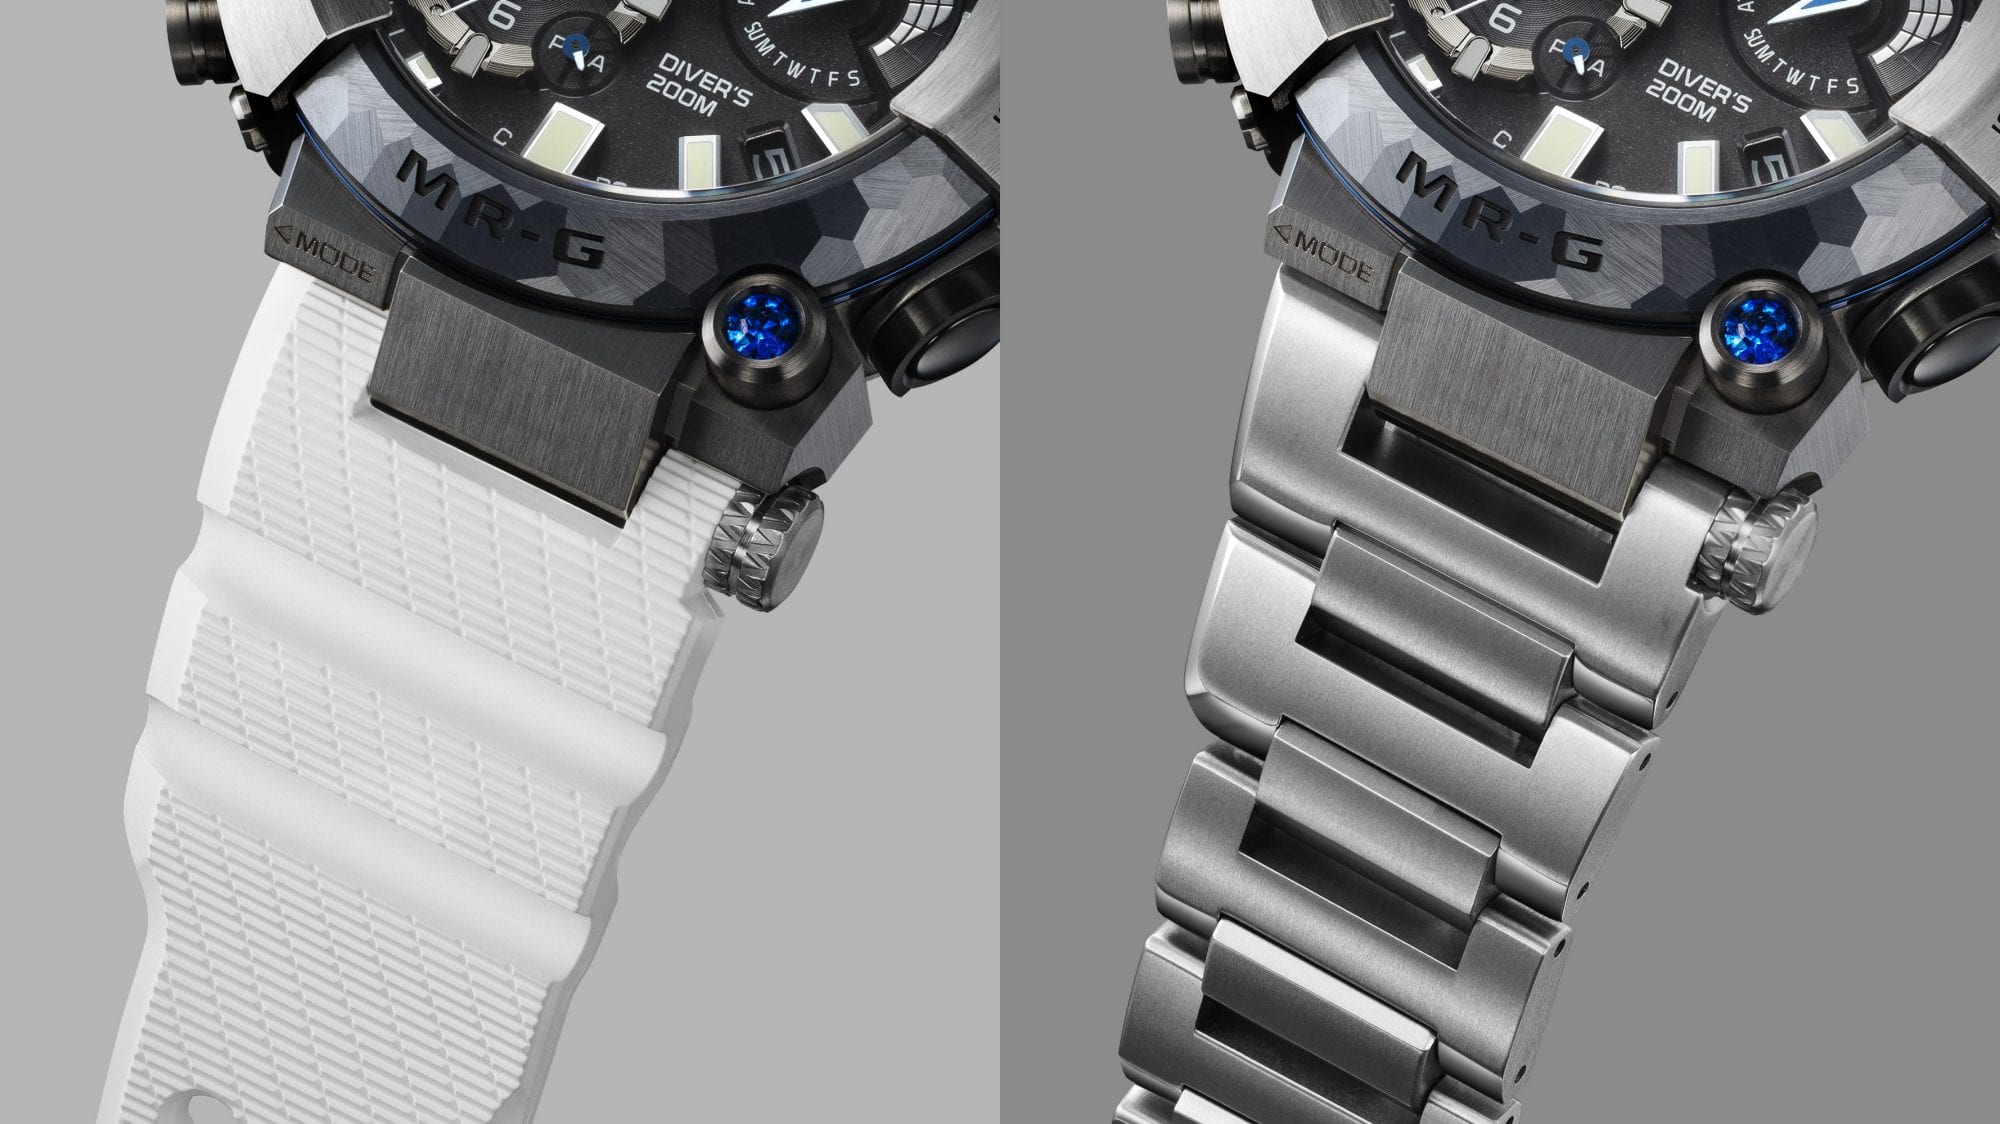 Two interchangeable bands
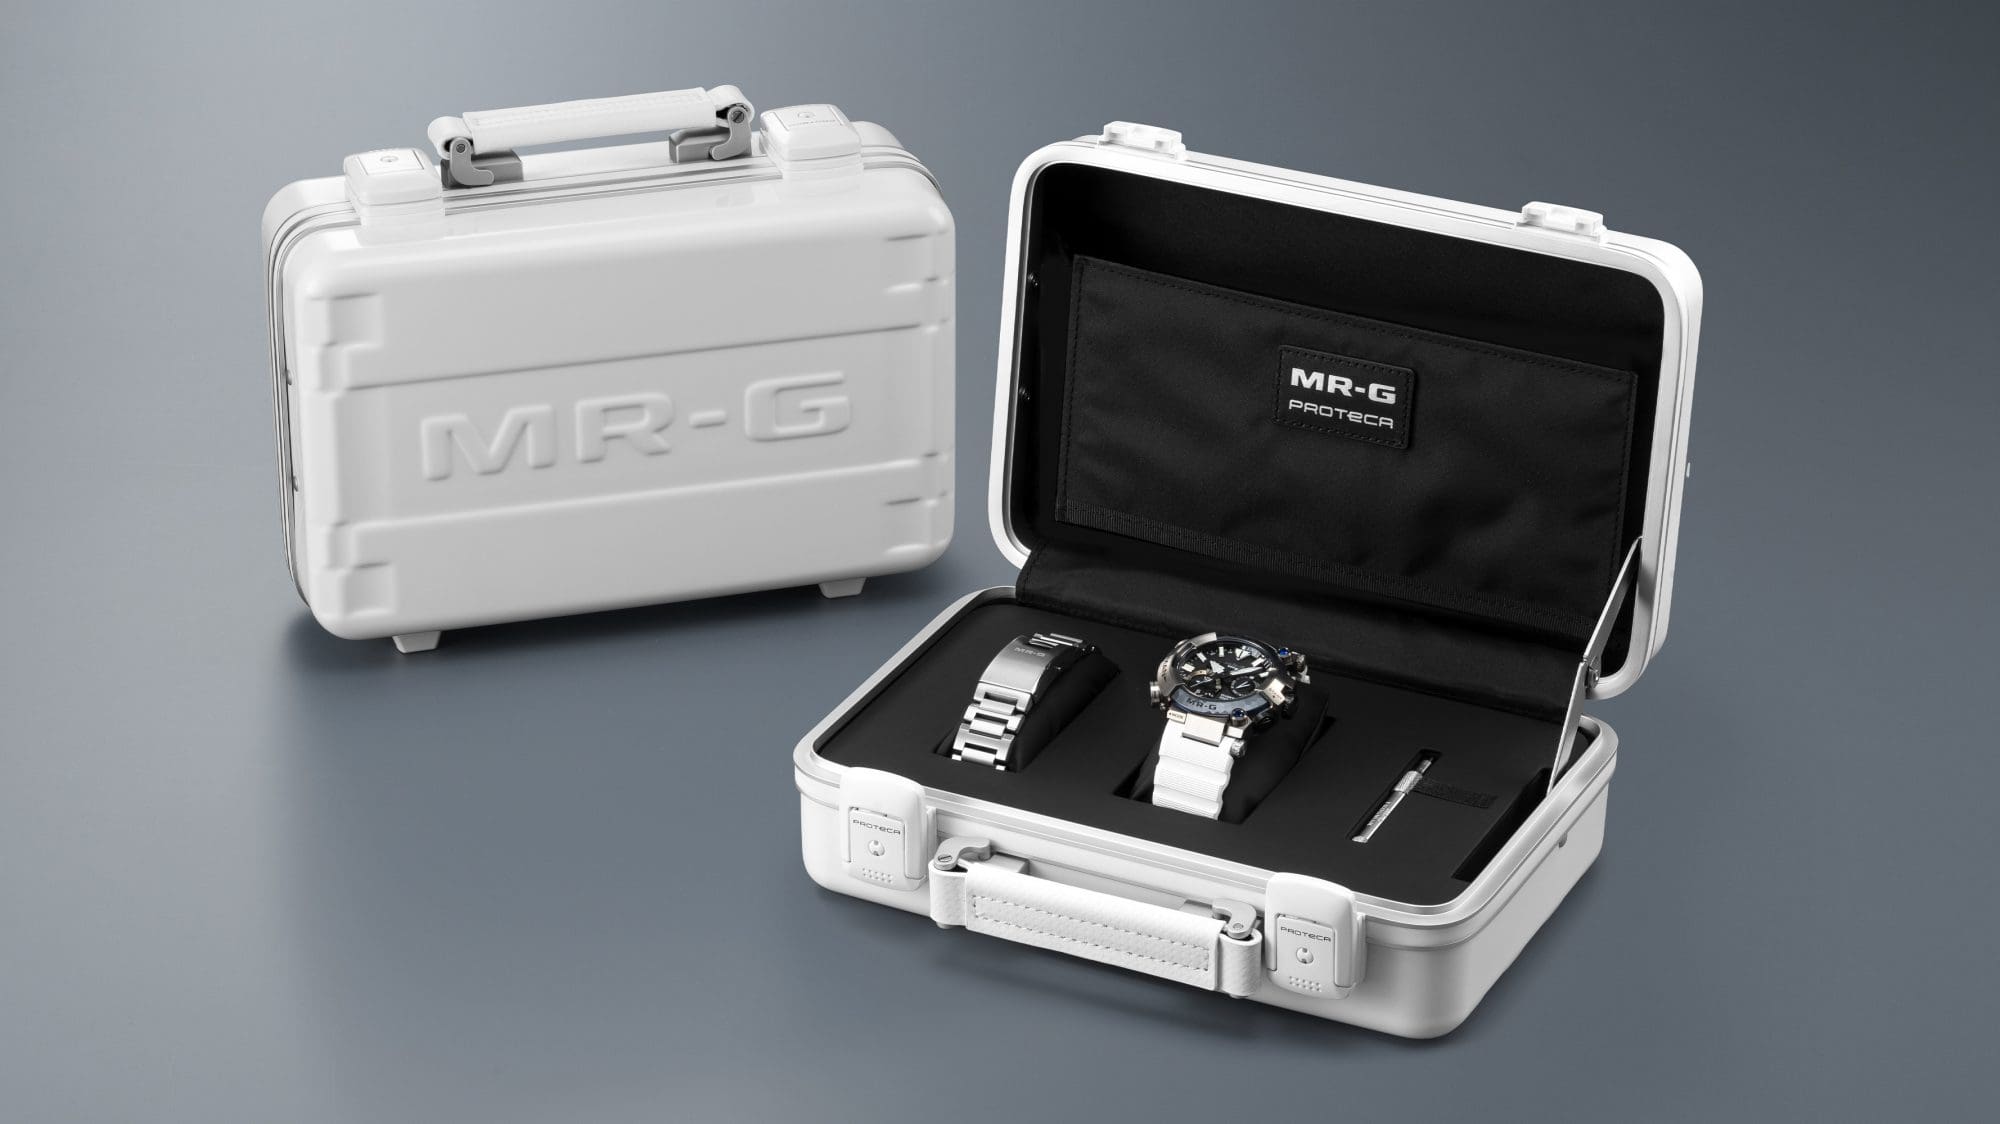 Special case-style box