EDINET提出書類 株式会社遠藤照明(E01986) 有価証券報告書 【表紙】 【提出書類】 有価証券報告書 【根拠条文】 金融商品取引法第24条第1項 【提出先】 関東財務局長 【提出日】 2026年6月23日 【事業年度】 第55期(自 【会社名】 株式会社遠藤照明 【英訳名】 ENDO…
EDINET提出書類
株式会社遠藤照明(E01986)
有価証券報告書
【表紙】
【提出書類】
有価証券報告書
【根拠条文】
金融商品取引法第24条第1項
【提出先】
関東財務局長
【提出日】
2026年6月23日
【事業年度】
第55期(自
【会社名】
株式会社遠藤照明
【英訳名】
ENDO
Lighting
Corporation
【代表者の役職氏名】
代表取締役社長
遠藤邦彦
【本店の所在の場所】
大阪市中央区本町一丁目6番19号
2025年4月1日
至
2026年3月31日)
(同所は登記上の本店所在地であり、実際の業務は下記で行っており
ます。)
【電話番号】
大阪06-6267-7095(代表)
【事務連絡者氏名】
上席執行役員
【最寄りの連絡場所】
大阪市中央区備後町一丁目7番3号
【電話番号】
大阪06-6267-7095(代表)
【事務連絡者氏名】
上席執行役員
【縦覧に供する場所】
株式会社遠藤照明管理本部経理部
管理本部長
管理本部長
後藤修二
後藤修二
(東京都新宿区若葉一丁目4番1号ENDO東京ビル)
株式会社東京証券取引所
(東京都中央区日本橋兜町2番1号)
1/116
EDINET提出書類
株式会社遠藤照明(E01986)
有価証券報告書
第一部【企業情報】
第1 【企業の概況】
1 【主要な経営指標等の推移】
(1) 連結経営指標等
回次
第51期
第52期
第53期
第54期
第55期
決算年月
2022年3月
2023年3月
2024年3月
2025年3月
2026年3月
売上高
(百万円)
40,644
45,731
51,706
53,735
55,473
経常利益
(百万円)
4,249
3,630
5,724
5,411
5,935
親会社株主に帰属する
当期純利益
(百万円)
3,330
2,962
4,649
4,799
4,342
包括利益
(百万円)
4,963
3,735
7,512
6,112
7,021
純資産額
(百万円)
28,243
31,535
38,567
44,052
50,025
総資産額
(百万円)
55,595
57,343
62,753
67,667
76,589
1株当たり純資産額
(円)
1,911.39
2,134.19
2,610.11
2,981.30
3,387.27
1株当たり当期純利益
(円)
225.37
200.48
314.67
324.85
294.00
潜在株式調整後1株当
たり当期純利益
(円)
−
−
−
−
278.83
自己資本比率
(%)
50.8
55.0
61.5
65.1
65.3
自己資本利益率
(%)
12.9
9.9
13.3
11.6
9.2
株価収益率
(倍)
4.2
4.7
4.9
4.2
8.5
営業活動によるキャッ
シュ・フロー
(百万円)
5,034
3,901
10,152
2,916
10,278
投資活動によるキャッ
シュ・フロー
(百万円)
△3,062
△2,789
△2,904
△4,322
△4,303
財務活動によるキャッ
シュ・フロー
(百万円)
△2,131
△461
△4,094
△6
1,131
現金及び現金同等物の
期末残高
(百万円)
10,602
11,847
16,163
15,467
23,534
従業員数
(名)
1,389
1,552
1,552
1,631
1,648
(外、平均臨時雇用者
数)
(名)
(91)
(97)
(120)
(137)
(151)
(注) 1.第51期、第52期、第53期及び第54期の潜在株式調整後1株当たり当期純利益については、潜在株式が存在し
ないため記載しておりません。
2.従業員数欄の(外書)は、臨時従業員の年間平均雇用人員であります。
3.「法人税、住民税及び事業税等に関する会計基準」(企業会計基準第27号 2022年10月28日。以下「2022年
改正会計基準」という。)等を第54期の期首から適用しており、第53期に係る主要な経営指標等について
は、当該会計基準等を遡って適用した後の指標等となっております。なお、2022年改正会計基準については
第20−3項ただし書きに定める経過的な取扱いを適用し、「税効果会計に係る会計基準の適用指針」(企業
会計基準適用指針第28号 2022年10月28日)については第65−2項(2)ただし書きに定める経過的な取扱いを
適用しております。この結果、第54期以降に係る主要な経営指標等については、当該会計基準等を適用した
後の指標等となっております。
2/116
EDINET提出書類
株式会社遠藤照明(E01986)
有価証券報告書
(2) 提出会社の経営指標等
回次
第51期
第52期
第53期
第54期
第55期
決算年月
2022年3月
2023年3月
2024年3月
2025年3月
2026年3月
売上高
(百万円)
21,631
24,445
27,474
29,774
30,500
経常利益
(百万円)
1,940
1,355
2,845
2,006
3,235
当期純利益
(百万円)
1,580
1,463
2,736
2,519
2,629
資本金
(百万円)
5,155
5,155
5,155
5,155
5,155
(千株)
14,776
14,776
14,776
14,776
14,776
純資産額
(百万円)
14,366
15,231
17,545
19,482
21,027
総資産額
(百万円)
33,937
36,037
35,891
38,202
41,544
1株当たり純資産額
(円)
972.24
1,030.79
1,187.39
1,318.53
1,423.81
1株当たり配当額
(円)
22.50
30.00
40.00
50.00
88.00
(うち1株当たり中間
配当額)
(円)
(7.50)
(15.00)
(17.50)
(20.00)
(40.00)
1株当たり当期純利
益
(円)
106.97
99.03
185.16
170.49
178.04
潜在株式調整後1株
当たり当期純利益
(円)
−
−
−
−
168.82
自己資本比率
(%)
42.3
42.3
48.9
51.0
50.6
自己資本利益率
(%)
11.5
9.9
16.7
13.6
13.0
株価収益率
(倍)
8.8
9.4
8.3
8.1
14.1
配当性向
(%)
21.0
30.3
21.6
29.3
49.4
従業員数
(名)
484
483
487
499
508
(外、平均臨時雇用者
数)
(名)
(59)
(73)
(81)
(90)
(105)
株主総利回り
(%)
140.9
144.7
239.3
222.5
402.3
(比較指標:配当込み
TOPIX)
(%)
(102.0)
(107.9)
(152.5)
(150.2)
(202.2)
最高株価
(円)
1,243
956
1,643
1,676
3,100
最低株価
(円)
627
700
895
951
1,130
発行済株式総数
(注) 1.第51期、第52期、第53期及び第54期の潜在株式調整後1株当たり当期純利益については、潜在株式が存在し
ないため記載しておりません。
2.第55期の1株当たり配当額88円00銭のうち、期末配当48円00銭については、2026年6月25日開催予定の定時
株主総会の決議事項になっています。
3.従業員数欄の(外書)は、臨時従業員の年間平均雇用人員であります。
4.最高株価及び最低株価は、2022年4月3日以前は東京証券取引所市場第一部、2022年4月4日以降は東京証
券取引所プライム市場、2023年10月20日以降は東京証券取引所スタンダード市場におけるものであります。
5.「法人税、住民税及び事業税等に関する会計基準」(企業会計基準第27号 2022年10月28日。以下「2022年
改正会計基準」という。)等を第54期の期首から適用しており、第53期に係る主要な経営指標等について
は、当該会計基準等を遡って適用した後の指標等となっております。なお、2022年改正会計基準については
第20−3項ただし書きに定める経過的な取扱いを適用しております。この結果、第54期以降に係る主要な経
営指標等については、当該会計基準等を適用した後の指標等となっております。
3/116
EDINET提出書類
株式会社遠藤照明(E01986)
有価証券報告書
2 【沿革】
当社は、1967年9月に創業(1972年8月に株式会社へ組織変更)し、自社ブランドの照明器具製造販売を開始いた
しました。その後、地球環境に配慮した省エネルギー効果の高いLED照明器具の開発に着手し、2010年2月からL
ED照明器具の本格販売を開始、現在に至っております。
年月
概要
1967年9月
大阪市城東区において遠藤照明器具製作所を創業、照明器具の製造を開始
1972年8月
大阪府東大阪市に株式会社遠藤照明を設立、製造工場を新設
9月
大阪営業所を新設
1974年1月
東京営業所を新設
1975年1月
福岡営業所を新設
6月
本社配送センターを新設
1982年1月
名古屋営業所を新設
1984年6月
栃木県佐野市の佐野工業団地に関東物流センター(現佐野事業所)を新設
1986年8月
佐野工場を関東物流センター(現佐野事業所)内に開設
1987年6月
本社を大阪市東成区へ移転
東京営業所を東京支店、大阪営業所を大阪支店に組織変更
1988年8月
本社配送センターを中央物流センターとして滋賀県甲賀郡水口町(現甲賀市水口町)へ移転
1989年5月
水口工場を中央物流センター内に新設
6月
1990年2月
8月
照明技術研究所を大阪府東大阪市に新設
タイ製造子会社 Lighting ENDO(THAILAND)Co.,Ltd.(連結子会社)を設立
大阪証券取引所市場第二部特別指定銘柄(新二部)に株式を上場
本社及び大阪支店を大阪市西区へ移転
1993年1月
システム収納家具の販売及び取付工事事業を開始
1996年1月
大阪証券取引所市場第二部銘柄に指定
1997年7月
インテリア家具及びインテリア家具用品の販売を開始
1999年12月
照明器具に関し全事業所を対象にISO9001を認証取得
2000年8月
Lighting ENDO(THAILAND)Co.,Ltd.が照明器具及びシステム収納家具に関してISO9001を
認証取得
2003年11月
Lighting ENDO(THAILAND)Co.,Ltd.は、ENDO Lighting(THAILAND)Public Co.,Ltd.に商号を変更
中国製造子会社昆山恩都照明有限公司(連結子会社)を設立
2004年2月
インテリア家具及びインテリア家具用品の販売に関しISO9001を認証取得
2005年7月
東京都港区に青山ショールームを新設
レンタル事業の子会社 イーシームズ株式会社(連結子会社)を設立
2006年7月
本社及び大阪支店、イーシームズ株式会社(連結子会社)を大阪市中央区(本社ビル完成)に移転し、
本社ショールームを新設
2007年4月
東京支店、大阪支店を廃止し、東京事業所、大阪事業所に組織変更
6月
照明技術研究所において、ISO14001を認証取得
2008年10月
福岡県大川市にインテリア家具及びインテリア家具用品の物流センター(大川センター)を新設
2009年5月
LEDモジュールを開発し、LED照明器具「LEDZ」の商品化に成功
2010年1月
昆山恩都照明有限公司の販売子会社として恩藤照明設備(北京)有限公司(連結子会社)を設立
2月
LED新型モジュールを開発し、LED照明器具「LEDZ」の本格販売を開始
5月
昆山恩都照明有限公司が照明器具に関してISO9001を認証取得
12月
ヨーロッパ駐在員事務所をドイツに新設 (2013年4月閉鎖)
4/116
EDINET提出書類
株式会社遠藤照明(E01986)
有価証券報告書
年月
2011年2月
概要
ENDO Lighting(THAILAND)Public Co.,Ltd.の子会社としてENDO LIGHTING ACCESSORIES(INDIA)
PRIVATE LTD.(連結子会社)を設立
3月
システム収納家具の製造並びに販売取付工事事業から撤退
9月
北米における照明器具の販売強化のため、Icon International Inc.を買収(2019年3月清算)
2012年2月
東京事業所及び青山ショールームを集約化し、東京都新宿区へ移転
9月
ロンドン駐在員事務所をイギリスに新設 (2016年2月閉鎖)
11月
大阪府東大阪市にLED照明器具新製品開発拠点「テクニカルセンター」を新設
12月
大阪証券取引所市場第一部銘柄に指定
2013年7月
12月
2014年4月
11月
東京証券取引所と大阪証券取引所の現物市場統合に伴い、東京証券取引所市場第一部に上場
ニューヨーク駐在員事務所を米国に新設 (2015年3月閉鎖)
ENDO Lighting SE Asia Pte.Ltd.(連結子会社)をシンガポールに設立
欧州市場における照明器具販売強化のため、Ansell Electrical Products Limited及び
Ansell (Sales & Distribution) Limitedを買収
2015年3月
大阪市中央区にENDO堺筋ビルを竣工
2016年4月
ENDO Lighting SE Asia Pte.Ltd.の子会社としてENDO LIGHTING VIETNAM COMPANY LIMITED(連結
子会社)を設立
2017年9月
会社創業50周年
2018年12月
Ansell Electrical Products Limitedの子会社としてAnsell Electrical Products Spain SL(連結
子会社)を設立
2019年8月
Ansell (Sales & Distribution) Limitedの子会社としてAnsell (Sales & Distribution) Republic
of Ireland(連結子会社)を設立
2022年4月
東京証券取引所の新市場区分「プライム市場」に移行
2023年10月
東京証券取引所「スタンダード市場」に移行
3 【事業の内容】
当社グループは、当社及び連結子会社11社で構成され、照明器具の製造販売、照明器具及び省エネ機器のレンタ
ル、家具の販売を主な内容として事業活動を展開しております。
なお、事業区分はセグメントと同一であります。
事業区分
事業内容
照明器具関連事業
照明器具の製造・販売
環境関連事業
省エネ機器の販売
照明器具及び省エネ機器のレンタル
インテリア家具事業
インテリア家具・用品の販売
会社名
(製造・販売)
当社
ENDO Lighting(THAILAND)Public Co.,Ltd.
昆山恩都照明有限公司
Ansell Electrical Products Limited
Ansell(Sales & Distribution)Limited
(販売)
恩藤照明設備(北京)有限公司
ENDO LIGHTING ACCESSORIES(INDIA)PRIVATE LTD.
ENDO Lighting SE Asia Pte.Ltd.
ENDO LIGHTING VIETNAM COMPANY LIMITED
Ansell Electrical Products Spain SL
Ansell (Sales & Distribution) Republic of
Ireland Limited
(レンタル・販売)
イーシームズ株式会社
(販売)
当社
5/116
EDINET提出書類
株式会社遠藤照明(E01986)
有価証券報告書
事業の系統図は次のとおりであります。
6/116
EDINET提出書類
株式会社遠藤照明(E01986)
有価証券報告書
4 【関係会社の状況】
名称
住所
資本金又は
出資金
(百万円)
主要な事業
の内容
議決権の所有
(被所有)割合
(%)
756
照明器具関
連事業
99.9
当社製品の販売及び製造委
託他役員7名のうち当社
役員2名、当社執行役員1
名、当社従業員1名
1,755
照明器具関
連事業
100.0
当社製品の製造委託及び銀
行取引に対する債務保証他
役員6名のうち当社役員
3名、当社執行役員1名
100.0
当社製品及び商品の仕入、
販売及びレンタル並びに同
社借入債務に対する債務保
証他役員6名のうち当社
役員2名、当社執行役員1
名、当社従業員3名
関係内容
(連結子会社)
ENDO Lighting(THAILAND)Public
Co.,Ltd.
(注) 2
昆山恩都照明有限公司
(注) 2
イーシームズ株式会社
タイ国サムットプラ
カーン県
中国江蘇省
大阪市中央区
100
環境関連事
業
恩藤照明設備(北京)有限公司
中国北京市
67
照明器具関
連事業
ENDO LIGHTING ACCESSORIES
(INDIA)PRIVATE LTD.
インド国マハーラー
シュトラ州
255
照明器具関
連事業
役員3名のうち当社役員1
名、執行役員1名、当社従
[52.0]
業員1名
ENDO Lighting SE Asia
Pte.Ltd.
シンガポール国
51
照明器具関
連事業
100.0
21
照明器具関
連事業
100.0 役員1名のうち当社従業員
[100.0] 1名
8
照明器具関
連事業
100.0
16
照明器具関
連事業
(注) 2,4
ENDO LIGHTING VIETNAM COMPANY
LIMITED
Ansell Electrical Products
Limited
(注) 2,5
ベトナム国
ホーチミン市
英国チェシャー州
ウォリントン
Ansell Electrical Products
Spain SL
スペイン国
Ansell(Sales &
Distribution)Limited
英国アントリム州ベ
ルファスト
0
照明器具関
連事業
Ansell(Sales &
Distribution)Republic of
Ireland Limited
アイルランド国ダブ
リン県
0
照明器具関
連事業
マドリード
100.0
[100.0]
役員4名
100.0
100.0
[100.0]
100.0
100.0
[100.0]
役員4名のうち当社役員1
名、当社執行役員2名、当
社従業員1名
役員7名のうち当社役員2
名、当社執行役員1名、当
社従業員1名
役員2名
役員7名のうち当社役員2
名、当社執行役員1名、当
社従業員1名
役員2名
(注) 1.主要な事業の内容欄には、セグメント情報に記載された名称を記載しております。
2.特定子会社であります。
3.有価証券届出書又は有価証券報告書を提出している会社はありません。
4.イーシームズ株式会社については、売上高(連結会社相互間の内部売上高を除く)の連結売上高に占める割合
が10%を超えております。ただし、セグメントの「環境関連事業」の売上高に占める当該連結子会社の売上
高(セグメント間の内部売上高又は振替高を含む)の割合が100分の90を超えるため、主要な損益情報等の記
載を省略しております。
5.Ansell Electrical Products Limitedについては、売上高(連結会社相互間の内部売上を除く)の連結売上高
に占める割合が10%を超えております。
主要な損益情報等
①売上高
15,184
百万円
②経常利益
1,737
〃
③当期純利益
1,324
〃
④純資産額
14,470
〃
⑤総資産額
19,261
〃
6.議決権の所有割合の[
]内は、間接所有割合で内数であります。
7/116
EDINET提出書類
株式会社遠藤照明(E01986)
有価証券報告書
第2 【事業の状況】
1 【経営方針、経営環境及び対処すべき課題等】
文中の将来に関する事項は、当連結会計年度末現在において判断したものであります。
(1) 会社の経営の基本方針
当社グループは、経営理念として「企業は公器」を掲げ、企業の社会的存在価値を高めることに経営資源を集中
し、人間(組織)の持つ無限の能力と可能性を最大限発揮させる経営の仕組みづくり並びに社会に貢献する経営を優
先することを目指しております。
この理念のもと、人体と同様に一人一人が自ら考え、行動、創意工夫し、生き生きと個人と組織が成長と繁栄を実
現する『個と組織の調和と永続』、お客様と周囲の人々から沢山の「ありがとう」を頂ける個人と会社であることを
目指す『ありがとう創造企業に』の2つの経営目的を通じて、人と地球に優しい高付加価値空間を創造し社会に貢献
する会社『エシカル(=倫理的な、道徳上の)ソリューション カンパニー』というコーポレートミッションの実現に
向けて取り組みを行っております。
(2) 中長期的な会社の経営戦略
当社グループは、長期のビジョンとして、『エシカル ソリューションNo.1リーディングカンパニーへ』を掲げ、
継続的な成長と安定した高収益を生み出す企業体質を確実なものとするため、各事業セグメントにおける事業体制の
強化と総コスト(原価及び経費)の徹底した削減を進めるとともに、経営基盤の更なる強化に取り組み、利益を重視
した経営を推進して参ります。
1.国内照明事業の着実な成長と収益力向上
・照明制御及びネットワークソリューション製品の拡充と提案型営業の強化
・重点分野への営業集中と顧客の創造、関係強化
・オフィスやパーソナル空間市場など新規市場への展開
・品質・在庫などのロスコストの削減と原価低減活動の継続
2.海外照明事業の持続的成長
・アジア・英国への経営資源の集中
・英国電材卸市場の顧客別営業施策強化と英国国外市場の開拓推進
・アジア高級建築分野への特化と強い経営体質づくり
3.環境関連事業の提案力強化
・ソリューション提案力の強化を通じた市場の更なる深掘り
・リース事業の強化と新たな製品・サービスの開拓推進
4.インテリア家具事業の確実な利益確保
・照明事業との協業と既製品ビジネスの強化
・オフィス市場など新規分野・新規顧客の開拓の推進
5.経営基盤の強化
・徹底したPDCAの実践による事業計画の完遂
・人事制度改革の深化と経営人材の育成
・企業風土改革とIT化、デジタル化の推進による業務改善
8/116
EDINET提出書類
株式会社遠藤照明(E01986)
有価証券報告書
(3)優先的に対処すべき事業上及び財務上の課題
当社グループは、顧客のニーズや期待に応えるために会社価値と経営品質の向上を経営目標として掲げ、顧客密着
型経営を推進しております。
サステナビリティに関する社会的な要請が高まる中、エネルギー価格の高騰やゼロカーボンに向けた社会の取組み
の進捗を受けて、省エネ効果の高いLED照明器具やウェルビーイングに関する照明ソリューションへの需要は引き
続き堅調に推移するものと見込んでおりますが、中東における紛争の勃発に伴う原油供給の不確実性、為替相場の急
激な変動及び景気後退に伴う設備投資意欲の減退等は、当社グループにとってもリスク要因であり、先行き不透明な
状況が続くと考えております。
このような事業環境のなか、当社グループといたしましては、長期ビジョンである「エシカルソリューションNo.1
リーディングカンパニーへ」の実現に向けて、2025年度に策定した「中期経営計画」で掲げた「高付加価値空間創
造」・「グローバル競争力強化」・「事業領域拡大」を大きな柱とし、それを支える強固な経営基盤を「サステナビ
リティ経営強化」「企業価値の向上」の2つの視点から構築することで、2027年度売上610億円・営業利益70億円を目
指して参ります。
照明器具関連事業(国内)においては、継続して無線制御ソリューション照明のトップランナーとして、多様化す
るニーズに応える次世代ソリューション照明製品の新たな付加価値の追求と市場競争力の強化を図ります。市場訴求
力のある新製品に注力するとともに、引き続き原価管理・経費管理の徹底を図り、安定した事業収益基盤の構築に努
めて参ります。
照明器具関連事業(海外)では、地域ごとにフィットした製品・サービスの供給を進めることでのシェアアップに
加え、新規市場での事業の安定化を図り、更なる海外事業の拡大に努めて参ります。
環境関連事業では、レンタルスキームを活用したソリューション提案に注力するとともに、照明周辺分野及びネッ
トワークとの連携による新たなビジネスモデルの開発により、長期的な事業発展につなげて参ります。
インテリア家具事業では、照明事業のチャンネルを活用した販売促進活動や既製品家具の販売強化などを推し進め
るとともに、主力分野に成長したオフィス・ホテル分野での顧客開拓を積極的に行って参ります。
また、経営基盤の強化においては、昨年11月からの株式会社アドバンテッジパートナーズとの業務提携により、外
部の豊富な知見や経営支援を活用し、「中期経営計画」達成の蓋然性を高め、長期ビジョン実現をより加速させる企
業変革の取り組みを全社プロジェクトとして推進しております。
不透明な外部環境変化による収益性悪化リスクに備え、業務プロセスの適時見直しやデジタル活用による効率化な
どムダを排除し、筋肉質な経営体質を目指すとともに、事業成長の根幹となる新たな照明ソリューションの創造を実
現する人材・組織づくりの強化のための制度変更や積極投資を行って参ります。
長期的展望に立った成長投資として、次世代ソリューション照明製造の生産設備投資、新製品・制御システム開発
のための研究開発投資、データベース構築と新たな付加価値サービスの提供のためのDX関連投資に加え、適切なタイ
ミングでの機動的な成長投資枠も設定した上で、更なる成長戦略の実現・企業価値向上に取り組んで参ります。
9/116
EDINET提出書類
株式会社遠藤照明(E01986)
有価証券報告書
2 【サステナビリティに関する考え方及び取組】
当社グループのサステナビリティに関する考え方及び取り組みは、次のとおりであります。
なお、将来に関する事項は、当連結会計年度末現在において当社グループが判断したものであります。
[遠藤照明グループのサステナビリティ基本方針]
遠藤照明は、「ありがとう創造企業」を経営理念とし、社会活動のあらゆる場面で求められる光によって、人々の
暮らしを明るく照らすだけでなく、より豊かに、幸せにすることを目指しています。
この実現のため、「エシカルソリューションNo.1リーディングカンパニーへ」をビジョンに掲げ、照明の持つ可能
性を広げ、照明空間の新たな価値を創造・提供することを追求してきました。遠藤照明が考えるエシカルとは、地球
環境と社会に与える影響に配慮すると同時に、人々の暮らしをより快適に・より便利に・より健康にする、光環境の
付加価値を探究することであり、照明とそれを応用したソリューションによって、持続可能な地球と社会の実現に貢
献していきます。創業以来当社は、その時代が求める照明空間を創り届けるため、社会に先駆けて常に挑戦してきま
した。これからも、社員一人ひとりが社員憲章に基づく文化・風土を大切にし、個々の能力の成長と同じ目標に進ん
でいく組織力を基盤に、挑戦を続けていきます。
そして、関わる皆様の人権を尊重しながら、適正なガバナンスと社会的責任を果たしていきます。また、ステーク
ホルダーの皆様とも良好な関係を築きながら、サステナビリティ活動を積極的に推進していくことで、本方針を実効
性のあるものとして取り組んでいきます。
(1) サステナビリティ全般
①
ガバナンス
当社グループは、気候変動などの重要な経営課題について、サステナビリティの観点を踏まえた経営を推進し、持
続可能な社会の実現に貢献するため、代表取締役を委員長とした取締役・監査役全員が参加するサステナビリティ委
員会を設置しております。当委員会では取締役会と連携することで課題解決や施策の迅速な実行を可能とし、ガバナ
ンスの効いた体制においてサステナビリティ関連のリスク及び機会のモニタリング・監督・議決を行っております。
[役員報酬]
2025年度より、サステナビリティ経営をより強化していくため、取締役の業績連動報酬に、サステナビリティ指標
を追加し、その達成度を報酬に連動させる制度を導入いたしました。
サステナビリティ指標を追加することで、持続可能な社会の実現と企業価値向上に対する意識を高めることを目的
としています。
10/116
EDINET提出書類
株式会社遠藤照明(E01986)
有価証券報告書
②
リスク管理
当社グループは、サステナビリティ基本方針に基づき、各部門にて事業計画を策定するにあたり、発生可能性、投
資効果等を検証及び評価し、将来想定されるリスクと事業成長や計画達成の機会の分析を行ったうえで、重要度の高
いものについてサステナビリティ委員会に報告します。サステナビリティ委員会では、報告を受けた事案について審
議を行い、各部門へ審議結果を基に対応策の策定を指示し、必要に応じて各担当部門から報告を受け、それぞれの事
案の進捗管理及びモニタリングを行っております。サステナビリティに関するリスクはコンプライアンスリスク管理
委員会に連携されており、統合的なリスク管理体制のもとで管理しています。
③
戦略
a.E(環境)S(社会)G(ガバナンス)のテーマ別方針
人々の暮らしをより快適に・より便利に・より健康にする光環境の実現を目指して、サステナビリティ委員会
における議論を基に3つのテーマを設け、テーマ別の方針を定めています。
・高効率な照明を追求し続け、世界の地域と人々へより少ない資源とエネルギーで、より豊かな暮らしを届けるこ
とで、ゼロエミッション社会に貢献します。
・環境にやさしい製品設計を行うことで、効率的な資源活用を推進します。
・LED照明のパイオニア企業として、事業活動の全過程において環境問題に対して責任ある対応をし、環境負荷の軽
減、持続可能な地球環境の維持に努めます。
・照明が持つ無限の可能性と価値を探究・創造することで、新たな人と光の関わり方を提案していきます。そし
て、社会と暮らしのあらゆる場面の光と空間にイノベーションを創り出し、人々のライフスタイルをより快適
に、便利に、健康に変革します。
・安心安全な照明空間を提供するためにも、健全かつ安定的なサプライチェーンを構築し、社会と共存共栄できる
関係性を築きます。
・新たな価値の創造とソリューションの提供の源泉となるのは、その可能性を追求する輝く人材にあります。社員
一人ひとりの成長を支え、安心して健康に働ける環境と活躍できる組織づくりを推進し、個人と組織が一体と
なってともに持続的に発展していきます。
・自社と関わる全てのステークホルダーの人権を尊重し、公正な事業活動を推進します。
・社会的責任を果たすべく、経営理念や社員憲章を通じて、ENDOの価値創造を支えてきた文化・風土の共有・醸成
を継続します。
・法令を始めとする社会ルールを遵守し、強固なガバナンス体制の構築に努めるとともに、ステークホルダーの皆
様へ適時適切な情報開示と、対話を深めていくことで、公正で透明性のある事業活動を遂行します。
b.当社グループのマテリアリティと戦略
サステナビリティの各テーマにおける様々な課題を、自社及びステークホルダーにとっての重要度を総合的に
評価したうえで、次の6つの項目を特に注力すべき最重要マテリアリティとして特定し、取り組みを推進してお
ります。
マテリアリティ
戦略
より高効率な照明の追
当社グループは、主力の提供製品がLED照明であることから、関連する温室効
求
果ガス排出のほとんどが販売した製品の使用によるものとなっており、LEDを
中心とした照明の高効率化と無線コントロールを中核に据えた照明制御技術の熟
成により、使用される当社製品が排出する温室効果ガスの排出量の抑制に取り組
みます。
11/116
EDINET提出書類
株式会社遠藤照明(E01986)
有価証券報告書
環境に配慮した資源の
製造工程での効率的な資源の活用を進めるとともに、製品の配送、利用中、廃棄
活用(注)1
後を含めた製品利用サイクルトータルにおける環境負荷低減の取り組みを進めま
す。
新たな照明ソリュー
省エネルギーと快適性やウェルネス・ウェルビーイングを両立させる照明システ
ションの創造
ムの研究に取り組み、社会的課題の解決への貢献を目指します。
付加価値・ソリュー
顧客の多様化するニーズを捉え、新たな付加価値やソリューションを創出できる
ション創造に応える人
人材を輩出すべく、そのために必要な高いスキルを社員が学び・習得するための
材
環境と人事制度の構築を進め、社員のスキルアップの実現を促します。
社員の活躍が組織の持
当社の経営目的である「個と組織の調和と永続」の実現のためには、社員の高い
続的成長を生み出す組
エンゲージメントが重要であると考え、そのために必要な人事制度や業務効率の
織づくり
改革を進めます。
強固なガバナンス体制
多様な社会からの要請や期待に応え、企業価値を向上していくためには、強固な
の整備(注)2
ガバナンス体制を整備し、改善し続けていくことが重要な課題であることから、
コーポレートガバナンス・コードへの対応の強化等、社内の基盤強化に取り組ん
で参ります。
(注)1
2
環境に対するより広義な取り組みとするためマテリアリティの名称を「より効果的な資源の活用」から
「環境に配慮した資源の活用」に変更しました。
企業全体として、ガバナンスの強化が重要と考え「強固なガバナンス体制の整備」を最重要マテリアリ
ティに追加しました。
※マテリアリティ全16項目の詳細は、当社Webサイトをご参照ください。
サステナビリティサイト https://www.endo-lighting.co.jp/about/sustainability/
12/116
EDINET提出書類
株式会社遠藤照明(E01986)
有価証券報告書
④
指標及び目標
(マテリアリティに関する指標及び目標)
当社の事業活動において地球環境と社会に与える影響に配慮し、持続可能な社会と企業の成長の実現に向け、優先的
に取り組む課題として6項目を最重要課題として選定しています。
これらの課題の解決を目指し、定期的にサステナビリティ委員会において進捗確認をおこない、様々な取り組みの
もと着実に推進しています。
マテリアリティ
2026年3月期
実績
指標
2031年3月期
目標
日本国内で販売した製品の使用による温室効果ガ
ス排出の削減率 (注)1
(各年の基礎排出係数を使用した場合)
2013年度比
20%削減
(39%削減)
2013年度比
26%削減
(43%削減)
より高効率な照明日本国内で販売した製品の調光制御可能製品の販
売台数割合
の追求
58.4%
75.0%
87
(67)
102
(78)
日本国内で販売した調光制御可能製品の使用によ
る温室効果ガス削減貢献量 [kt-CO2] (注)2
(各年の基準排出係数を使用した場合)
環境に配慮した資自社が保有する事業所における、Scope2に係る温
室効果ガス削減量 [t-CO2]
源の活用
2050年のカーボン
ニュートラルを実
現。
1,081 中期目標として、
2030年までに温室効
果ガス削減量3,500tCO2を目指す。
IoTで全ての人とモノがつながり、様々な知識や情
新 た な 照明 ソ
報が共有され、今までにない新たな価値を生み出
リューションの創
す「Society 5.0」に対応する次世代の照明システ
造
ムを開発し、社会課題の解決に貢献する。
「Society 5.0」に対
応する次世代の照明
− システムを2030年ま
でに開発し製品化す
る。
付加価値・ ソ 日々変化する経営環境に適応した、次世代を担う
リ ュ ー シ ョ ン 創 ソリューションを創造できる人材の育成に向けた
造に応える人材
人的資本投資の推進状況。
−
スキルポイントの毎
年向上(注)3
社員の活躍が組
織 の 持続的成長社員エンゲージメントサーベイの良好回答割合
を 生 み 出 す 組織 (注)4
づくり
62.4%
重大な不正、コンプライアンス違反の発生件数
0件
0件
強固 な ガ バ ナ ン コンプライアンス関連の研修受講率
ス体制の整備
100%
100%
重大な情報インシデントの発生件数
0件
0件
良好回答割合
70%以上
(注)1.製品の性能改善による温室効果ガス排出量削減率を求めるため、2013年基礎排出係数0.000551tCO2/kwhを使用
し、2026年3月期日本国内で販売した製品の総定格光束を基準に算出しております。
2.調光制御可能製品を4万時間経過後の光量に調光制御(初期20%、4万時間後0%調光制御)した場合の削
減量となります。2013年基礎排出係数0.000551tCO2/kwhを使用しています。推計量であるため、製品の使用
による温室効果ガス排出量算定には含めておりません。
3.職務や業務に必要なスキルをポイント化し、個人別に割り当てた全社平均ポイント。
4.海外出向者を含む全社員を対象にエンゲージメントサーベイを実施しています。
※連結グループ全てにおける記載が困難であるため、連結グループにおいて主要な事業を営む提出会社単体の記
載としています。
13/116
EDINET提出書類
株式会社遠藤照明(E01986)
有価証券報告書
(上記マテリアリティにおける具体的な取り組み及び今後の施策)
a.日本国内で販売した製品の使用による温室効果ガス排出の削減に向けた取り組み
・直管形LEDユニット「LEDZ TUBE series」にて、高効率200lm/Wを実現。また、センサー制御で省エネを実現する
モーションセンサー制御直管形LEDユニット「Quick」を2025年6月発刊「LIGHTING+ FOR WORKSPACE vol.2」に掲
載、2025年7月から販売を開始。これら活動により日本国内で販売した製品の使用による温室効果ガス排出の削減
率は2013年度比20%となりました。
b.日本国内で販売した調光制御可能製品の使用による温室効果ガス削減に向けた取り組み
・調光調色製品(当社呼称Synca,Tunableシリーズ)の強化を図るため、システム天井用ベースライトにおいては調
光調色で高効率170.8lm/Wを実現。2025年6月発刊「LIGHTING+ FOR WORKSPACE vol.2」に掲載、2025年7月から販
売を開始。日本国内で販売した製品の調光制御可能製品の販売台数割合は58.4%、総定格光束量割合は66%となり
ました。
c.環境に配慮した資源の活用に向けた取り組み
・日本国内6拠点にて2023年9月から、英国1拠点にて2022年12月からグリーン電力への切替えを行いました。こ
れによる2026年3月期のScope2に係る温室効果ガス削減量は日本国内で968t-CO2、英国で113t-CO2です。
d.新たな照明ソリューションの創造
・無線コントロールによる調光制御可能製品の導入範囲を拡大するため、リモコンだけで設定から操作まで完結で
きる「Smart LEDZ Lite」を開発。2025年6月発刊「LIGHTING+ FOR WORKSPACE vol.2」に掲載、2025年7月から販
売を開始しました。また、鮮やかな発色と幅広い光色再現で色鮮やかに引き立てるライティングを実現する
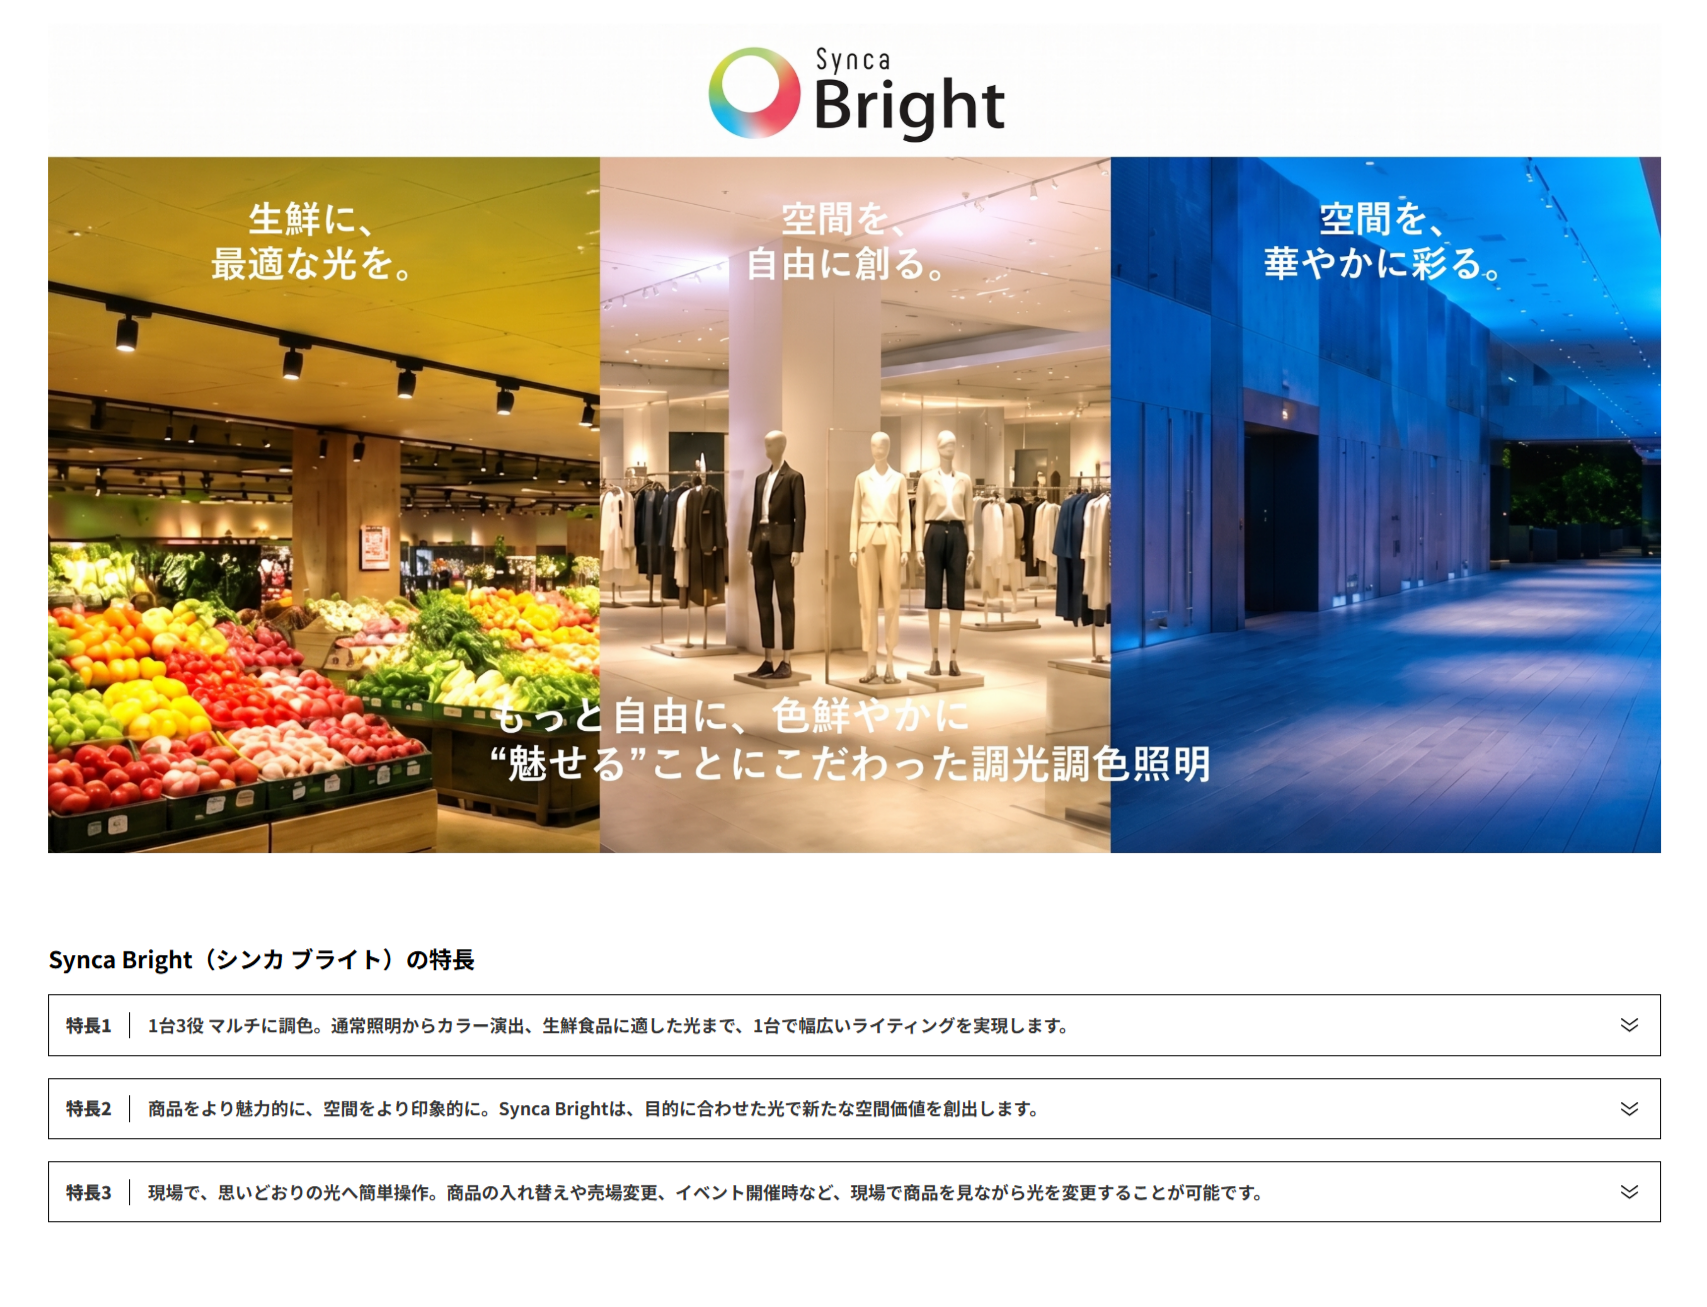
「Synca Bright」を開発、2025年8月から販売を開始しました。
e.付加価値・ソリューション創造に応える人材
・従業員の能力や熟練度を客観的に把握し、「適材適所の配置」「効果的な人材育成」「公平な人事評価」を実現
するため、スキルの見える化を推進しています。各組織に求められる知識や資格等のスキルを明確化すること
で、目標と現状の乖離から各自が学ぶべき内容を意識し、学習結果に基づく公平な評価・処遇の実現を目指して
います。また、従業員が自身の強みと弱みを客観的に把握することで、スキルアップやキャリア形成に対するモ
チベーションを向上させることも目的としています。知識向上に向けたツールとして、自律選択型研修 e-ラーニ
ングの導入を行っています。
f.社員の活躍が組織の持続的成長を生み出す組織づくり
・エンゲージメントの可視化と改善
海外出向者を含む全社員を対象に、年1回のエンゲージメントサーベイを実施しています。社員がやりがいを持
ち、持続的に活躍できる職場環境の構築を目指し、会社への貢献意欲や働きやすさを定量的に可視化しました。
サーベイ結果から抽出された課題の分析に基づき、各種施策を講じた結果、エンゲージメントスコア(良好回答
率)は前年度比2.5%向上しました。
・教育制度の拡充
人材育成の強化に向け、新任階層別研修および新入社員研修のカリキュラムを見直し、教育体系の質的向上を図
りました。
・ベースアップの実施
従業員が安心して就業できる環境を確保し、持続的成長に向けたモチベーションを向上させるため、2025年4月に
ベースアップを実施しました。また、継続的な物価上昇への対応として、2026年4月についてもベースアップの実
施を決定しています。これにより、4年連続のベースアップとなります。
g.強固なガバナンス体制の整備
・社内のコンプライアンス意識を醸成し、社員が業務上の様々な場面で適切な判断を行えることを目的に、顧問弁
護士によるコンプライアンスセミナーを実施し、月次の「コンプライアンス通信」の発信を通じ、具体的な違反
事例や関連知識を共有することでリテラシーの向上を図っています。加えて、昨今のITリスクの増大に対応し、
情報セキュリティセミナーの開催やAI活用における留意事項を「IT Insight」として発信しています。これらの
多角的な啓発活動を通じ、ガバナンスの体制のさらなる強化に努めています。
14/116
EDINET提出書類
株式会社遠藤照明(E01986)
有価証券報告書
(2) 人的資本
人的資本に関するガバナンス、リスク管理等は「2 サステナビリティに関する考え方及び取組」に組み込まれており
ます。詳細は(1)サステナビリティ全般の「① ガバナンス」「②リスク管理」をご参照ください。
① 戦略
人的資本に関する方針
当社グループでは、「個と組織の調和と永続」を経営目的に掲げ、社員と組織が目標を共有し、共に成長できる組
織を目指しています。人的資本については、以下の考えに基づき取り組みを推進しています。
<経営戦略に連動する人材戦略>
長期ビジョンである「エシカルソリューション No.1リーディングカンパニーへ」の実現に向け、「中期経営
計画2025-2027」において、企業戦略を支える経営基盤の強化として「ソリューション人材」の育成と組織づく
りを掲げております。事業成長の根幹となる「新たな照明ソリューションの創造」を実現するため、人材・組
織づくりの強化に向けた制度変更や積極投資を進める方針です。
<人材育成方針>
経営理念である「ありがとう創造企業」に共感し、光と照明の可能性を追求するために自律的にチャレンジ
し、そのための高いスキルを学び習得しようとする人材を重視し、そのような人材を輩出するため、人的資本
への投資を強化するとともに、社員一人ひとりのスキルアップを実現できる人材育成基盤の整備を進めていき
ます。
<社内環境整備方針>
人権と多様性を尊重し、様々なバックグラウンドや個性を持った社員を区別することなく、一人ひとりがそ
の能力を発揮し、活躍し、成長できる職場づくりを推進し、全ての社員のエンゲージメント向上に取り組み、
誇りとやりがいを持って働ける職場環境を目指します。
<提出会社の従業員給与等の決定方針>
当社の従業員の給与等は、『役割』を基軸とする役割等級制度に基づき、社員に求める役割を成果の質・難
易度及び責任の度合いなどによって職群別・グレード別に明らかにし、目標及び職責を効果的に評価し決定し
ています。中期経営計画で掲げる「公正な評価制度と成果に報いるインセンティブ制度の実現」との連動によ
り、従業員エンゲージメントの向上を図ると共に、経営理念の実現及び会社目標の継続的な達成を目指してい
ます。
② 人的資本基盤の強化への取り組み
a.柔軟な働き方ができる環境の整備
従業員が安心して長期的に活躍できる職場づくりに向け、テレワーク、時短勤務、時差出勤など、個人の事情やラ
イフステージに応じた柔軟な働き方を支援する制度を導入しています。仕事とプライベートを両立できる環境整備を
推進した結果、当社は育児休業取得後の復帰者は高い水準を保持しています。
(2026年3月期女性の育児休職後の復職者数10名・復職率100%)
b.人材の確保
国内の労働人口が減少するなか、優秀な人材の確保は事業成長に不可欠と考えています。今期は採用サイトをリ
ニューアルし、入社後の姿(仕事像)をイメージできる情報を提供するなど、採用の動機付けとなるような内容に拡充
しました。また、継続的なベースアップを実施し、人材獲得における競争力を強化しています。
(採用サイトURL https://recruit.endo-lighting.co.jp/)
③
人権の尊重
当社グループは「エシカルソリューションNo.1リーディングカンパニーへ」をビジョンに掲げ、事業活動のすべて
のプロセスに関わる人々の人権を尊重することは企業活動の根幹であると認識しています。「サステナビリティ基本
方針」においても、事業活動の推進における「人権の尊重」の必要性を明文化しており、国連の「ビジネスと人権に
関する指導原則」に基づき、2026年3月に「人権方針」を策定いたしました。
(人権方針サイトURL https://www.endo-lighting.co.jp/about/policy/human̲rights/)
④
指標及び目標
当社は、個と組織が共に成長していくためには、女性の活躍が不可欠であり、女性がそれぞれの個性を活かし活躍
できる職場環境を目指しています。
2027年3月期においての目標を設定し、改善に向け取り組みました。
2026年3月期実績
2027年3月期目標
女性管理職比率(%)
11.5
12
男性育児休業等取得率(%)
106.3
100
※表示数値は、第4提出会社の状況.5従業員の状況等(2)従業員の状況にある「(4)管理職に占める女性労
働者の割合、男性労働者の育児休業取得率及び労働者の男女の賃金の差異」の(注)1(注)2(注)3に対応
して算出しております。
15/116
EDINET提出書類
株式会社遠藤照明(E01986)
有価証券報告書
※育休取得率は、当該年度の育休対象社員(年度内に子どもが生まれた人数)に対して当該年度に育休を取得した
社員数の割合で算出しています。過年度に配偶者が出産し、当該年度に育児休業を取得した男性社員が含まれる
ため、取得率が100%を超えることがあります。
※人的資本に関する指標及び目標は、各連結子会社の規模・制度の違いから一律記載は困難であるため、提出会社
単体の記載としております。
(3) 気候変更
建物において経常的に使用される照明は電力消費量も多く、温室効果ガスの削減においても責任と期待のある分野
と考えられています。当社グループにおいても、販売した製品の使用による温室効果ガスの排出量が全体の9割を超
えており、照明器具メーカーの責任としてTCFDの考えに賛同し、気候変動に関する情報開示を行って参ります。
気候変動に関するガバナンス、リスク管理等は「2 サステナビリティに関する考え方及び取組」に組み込まれてお
ります。詳細は(1)サステナビリティ全般の「① ガバナンス」「②リスク管理」「③ 戦略」並びに「④指標及び目
標」を参照ください。
2026年3月期実績
項目
排出量
[kt-CO2]
算出内容
構成比
Scope1
直接排出
0.8
0.0% (燃料別)Σ{(使用量)×(燃料別排出原単位)}
Scope2
間接排出
7.6
0.3% (電気事業者別)Σ{(電力使用量)×(排出原単位)}
Category1
購入した製品・サー
ビス
74
3.2% Σ{(購入額)×(製品分類別排出原単位)}
Category2
資本財
1.6
0.1% Σ{(取得額)×(民生用電気機器部門の排出原単位)}
Category3
燃料・エネルギー関
連の活動
−
Category4
輸送、配送(上流)
4
Category5
事業から出る廃棄物
0.2
0.0% (廃棄物種類別)Σ{(廃棄物数量)×(排出原単位)}
Category6
出張
0.8
0.0%
Σ{(ガソリン使用量)×(排出原単位)}
+ (移動手段別) Σ { (支給額) × (排出原単位) }
0.0% + (勤務形態・都市階級別) Σ { (従業員数) × (営業日
数) ×(排出原単位) }
※3 通勤手当を支給していない拠点のみ
− 該当する事業活動がないため
0.2%
(輸送手段別)Σ{(輸送トンキロ)×(排出原単位)}
※1 海外拠点は輸送費用(Category1)で算定
(移動手段別)Σ{(支給額)×(排出原単位)}
+Σ{(宿泊日数)×(排出原単位)}
+(拠点別)Σ{(従業員数)×(排出原単位)}
※2 出張費用を支払っていない拠点のみ
Category7
雇用者の通勤
0.4
Category8
自社が賃借している
リース資産の稼働
−
−
燃料消費量(Scope1)や電力消費量(Scope2)で算定して
いるため分離集計未実施。
Category9
出荷輸送(自社が荷
主となる輸送以降)
−
−
直送比率が高く概ねCategory4集計値に含まれており、販売
代理店納品後の二次配送先特定が困難で、かつ近隣配送であ
ることから排出削減に影響力を及ぼすことが軽微であるため
集計未実施。
Category10
事業者による中間製
品の加工
−
− 該当する事業活動がないため
Category11
販売した製品の使用
2,251
Category12
販売した製品の廃棄
0.2
Category13
他者に賃貸している
リース資産の稼働
−
−
Category14
自社が主宰するフラ
ンチャイズ加盟店の
Scope1,2の排出量
−
− 該当する事業活動がないため
Category15
株式投資、債券投資
−
− 該当する事業活動がないため
Scope3
合
計
2,340
96.2%
(製品別)Σ{(消費電力)×(想定生涯使用時間40,000
[h])×(排出原単位)}
0.0% (材質別)Σ(製品重量×売上台数×排出原単位)
イーシームズのリース資産は、販売した製品の使用
(Category 11)に包含されているため、分離集計未実施
100.0%
(注) 1.環境省・経済産業省「サプライチェーンを通じた温室効果ガス排出量算定に関する基本ガイドライン」に基づ
き算定を実施しております。
2.グループ全社を対象に集計実施しております。
16/116
EDINET提出書類
株式会社遠藤照明(E01986)
有価証券報告書
3 【事業等のリスク】
有価証券報告書に記載した事業の状況、経理の状況等に関する事項のうち、経営者が連結会社の財政状態、経営成
績及びキャッシュ・フローの状況に重要な影響を与える可能性があると認識している主要なリスクは、以下のとおり
であります。
なお、文中の将来に関する事項は、当連結会計年度末現在において当社グループが判断したものであります。
1.事業活動に関するリスク
(1) 経済情勢・需要変動等について
当社グループの製品需要は経済情勢及び景気動向の影響を受け、特に主要取扱製品であるLED照明器具は
建築物等の照明設備であるため、建築需要動向、企業の設備投資動向によっては、当社グループの経営成績及
び財政状態に大きな影響を及ぼす可能性があります。
(2) 製品ライフサイクルと在庫について
当社グループの主力製品であるLED照明器具のライフサイクルは、新しいLED素子の開発による性能、
品質の向上の影響を直接的に受けます。昨今、技術革新の速度が増しており、在庫の陳腐化のリスクが高まっ
ております。当社グループとしましても、LED素子、電源等の部品の在庫管理には万全を期しております
が、環境が急変し想定していた売上数量が確保出来なかった場合には、棚卸資産処分損が発生し、当社グルー
プの経営成績及び財政状態に大きな影響を及ぼす可能性があります。
(3) 技術革新について
当社グループは、高効率、高機能を有する製品づくりを目指し、研究開発に取り組んでおりますが、長期的
に市場ニーズに合致した新技術を創造し続けられるとは限らず、想定とは異なる市場ニーズの変化や、急激な
業界の技術革新に追随できず優位性のある製品を提供できなくなった場合、当社グループの経営成績及び財政
状態に大きな影響を及ぼす可能性があります。当社グループは、LED照明の製品開発において、ロードマッ
プの策定と商品群のメジャーチェンジを計画的に実施するなど、照明の調光調色技術、ワイヤレス技術の分野
で優位性のある製品開発の強化に努めております。
(4) 販売価格等について
当社グループが属する照明器具業界は、新規企業が参入する厳しい価格競争の環境にあります。したがっ
て、当社グループの想定とは異なる販売価格の引下げを余儀なくされる可能性があり、大口需要獲得のための
特値による価格下落など、想定以上に価格競争が厳しくなった場合、当社グループの経営成績及び財政状態に
影響を及ぼす可能性があります。当社グループは、収益確保のため部材の調達コスト及び製造コスト等の削減
に継続して取り組むとともに製品の高付加価値化に努めております。
(5) グローバルな事業展開について
当社グループは、タイ、中国、インド、イギリス、シンガポール、ベトナムに製造子会社・販売子会社を展
開し、グローバルな事業運営を行っております。海外では、政情不安、経済動向の不確実性、宗教及び文化の
相違等のいわゆるカントリーリスクに直面する可能性があります。当社グループでは、現地子会社と本社の間
で緊密なコミュニケーションを実施することと合わせて、現地情報の積極的な収集に努めており、情勢の変化
に対して機敏に対応していく方針でありますが、予測不能な事態が発生した場合には、当社グループの経営成
績及び財政状態に影響を及ぼす可能性があります。
(6) 製品の品質について
当社グループは、所定の品質基準に基づき、製品の品質確保に細心の注意を払っておりますが、基幹部品の
不良等により製品に重大な欠陥が発生した場合には、製品の回収及び交換による費用、企業イメージのダウン
等により、当社グループの経営成績及び財政状態に影響を及ぼす可能性があります。
(7) 知的財産権について
当社グループの事業活動におきましては、特許権等の様々な知的財産権が関係している場合があり、第三者
の所有する知的財産権を侵害するリスクを必ずしも否定できません。他社との間に知的財産を巡って紛争が生
じたりする可能性は皆無とはいえず、当社グループ製品の生産、販売に制限を受けたり、損害賠償金等の支払
が発生する場合があり、当社グループの経営成績及び財政状態に大きな影響を及ぼす可能性があります。
当社グループでは他社の知的財産権の調査を行うなど社内の管理体制を強化しており、問題の発生を回避す
るために細心の注意を払っております。
17/116
EDINET提出書類
株式会社遠藤照明(E01986)
有価証券報告書
2.マーケット変動によるリスク
(1) 原材料の仕入価格の高騰について
当社グループが製造している照明器具は鋼材、アルミニウム、樹脂等を主な材料として使用しており、原油
価格やその他原材料価格変動の影響を受けます。これらの仕入価格が急激に変動した場合は、当社グループの
経営成績及び財政状態に影響を及ぼす可能性があります。
(2) 為替変動による影響について
当社グループは、LED照明器具に使用するLED素子並びに電源等の海外輸入比率が高く、中国、タイに
所在する子会社にて製造した製品の大部分を日本で販売する事業体制のため、為替変動の影響を受けます。ま
た、海外に所在する連結子会社の連結財務諸表作成において、貸借対照表及び損益計算書は円換算されるた
め、為替相場の変動の影響を受けます。当社グループは、為替予約等により為替相場の変動をヘッジ又は軽減
する対策を講じてはおりますが、為替レートが急激に変動した場合には、当社グループの経営成績及び財政状
態に影響を及ぼす可能性があります。
(3) デリバティブ取引について
当社グループは、輸出入取引の為替変動リスクをヘッジする目的で、為替予約取引等を実行しております。
そのため、為替レートの変動状況により、相当額の評価損益が発生する可能性があります。
3.自然災害・事故等によるリスク
地震、台風等の自然災害や火災等の事故災害が発生した場合、従業員等への人的被害はもとより、当社グループ
の拠点の設備等の損壊や電力、ガス、水の供給困難により、一部または全部の操業が中断し、生産及び出荷が遅延
するなど、国内外のサプライチェーンの混乱を含め、事業活動に多大な影響を及ぼす可能性があります。また、損
害を被った設備等の修復のために多額の費用が発生し、結果として、当社グループの事業、経営成績及び財政状態
に重大な影響を及ぼす可能性があります。
その他、深刻な感染症等の拡大が発生した場合、従業員等への感染被害による休業や市場経済が大きく停滞した
場合には、当社グループの経営成績及び財政状態に重大な影響を及ぼす可能性があります。
4.情報セキュリティに関するリスク
当社グループは、事業を展開する上で、技術や営業に関する機密情報の他、多数の情報を保有しており、常に最
適な情報セキュリティを目指して対策を講じておりますが、これらの情報が重要な情報の紛失、コンピュータウイ
ルスの感染、不正アクセス等、誤ってまたは避けられない理由で外部に流出した場合には、被害者に対する賠償責
任の発生や、当社グループの市場評価の低下、社会的信用の失墜、顧客の流出等を招き、当社グループの事業展
開、経営成績及び財政状態に影響を及ぼす可能性があります。
5.その他のリスク
(1)繰延税金資産について
当社グループは、当連結会計年度において1,113百万円の繰延税金資産を計上しております。繰延税金資産に
つきましては、今後の利益(課税所得)をもって全額回収可能と考えておりますが、業績の悪化によって一部取
崩を求められることとなった場合には、当社グループの経営成績及び財政状態に影響を及ぼす可能性がありま
す。
(2)のれんについて
当社グループは、当連結会計年度末において2,315百万円ののれんを計上しております。のれんは、他の固定
資産と同様に減損会計の対象であり、事業の展開等が計画どおりに進まずのれんの減損処理を行う必要が生じ
る事態が発生した場合には、当社グループの経営成績及び財政状態に影響を及ぼす可能性があります。
18/116
EDINET提出書類
株式会社遠藤照明(E01986)
有価証券報告書
4 【経営者による財政状態、経営成績及びキャッシュ・フローの状況の分析】
(1) 経営成績等の状況の概要
当連結会計年度における当社グループ(当社及び連結子会社)の財政状態、経営成績及びキャッシュ・フロー(以
下、「経営成績等」という。)の状況の概要は次のとおりであります。
①
財政状態及び経営成績の状況
当連結会計年度におけるわが国経済は、多くの企業で継続的な賃上げが実施され所得環境の改善が進み、責任あ
る積極財政への期待を背景に株式市場は歴史的な高水準となりました。しかし、直近では中東情勢に起因する資源
価格の上昇による景気減速懸念が顕在化しており、先行き不透明な状況となりました。世界経済においては、地政
学リスクの高まりに加え、米国の通商政策の動向、中国経済の減速及びAI技術の急速な普及に伴うエネルギー需
給の逼迫等、不確実性の高い状況が継続しました。
このような事業環境の下、当社グループは、高付加価値空間創造企業として、持続可能でよりよい社会の実現を
目指し、高い省エネ性能に加え、顧客価値を創造する光の質を高めた新製品の開発、製造及び販売に注力して参り
ました。
業界に先駆け製品をLED化して以降、製品のエネルギー効率の継続的な改善は製造メーカーの責務と考え、さ
らなる高効率照明器具の開発を進めるとともに、「人と地球にやさしい未来の光」を実現し、人々の暮らしを明る
く照らすだけでなく、より豊かに幸せにすることを目指したサステナビリティ経営を推進しております。
製造部門においては、環境に配慮した製品の提供に向けた継続的な品質改善活動及び原価低減活動を実施し、生
産効率の向上を図るとともに、全社的なコスト意識の徹底により、販売費及び一般管理費の抑制に努めて参りまし
た。
この結果、当社グループの当連結会計年度の財政状態及び経営成績は以下のとおりとなりました。
財政状態の状況
(流動資産)
当連結会計年度末における流動資産は、50,954百万円(前連結会計年度末比7,882百万円の増加)となりま
した。
(固定資産)
当連結会計年度末における固定資産は、25,635百万円(前連結会計年度末比1,039百万円の増加)となりま
した。
(流動負債)
当連結会計年度末における流動負債は、13,926百万円(前連結会計年度末比625百万円の減少)となりまし
た。
(固定負債)
当連結会計年度末における固定負債は、12,637百万円(前連結会計年度末比3,573百万円の増加)となりま
した。
(純資産)
当連結会計年度末における純資産合計は、50,025百万円(前連結会計年度末比5,973百万円の増加)となり
ました。
経営成績の状況
(売上高)
当連結会計年度における売上高は、55,473百万円(前連結会計年度比3.2%の増収)となりました。
(営業利益)
当連結会計年度における営業利益は、5,742百万円(前連結会計年度比16.5%の増益)となりました。
(経常利益)
当連結会計年度における経常利益は、5,935百万円(前連結会計年度比9.7%の増益)となりました。
(親会社株主に帰属する当期純利益)
当連結会計年度における親会社株主に帰属する当期純利益は、4,342百万円(前連結会計年度比9.5%の減益)
となりました。
19/116
EDINET提出書類
株式会社遠藤照明(E01986)
有価証券報告書
セグメントごとの経営成績は、次のとおりであります。
(照明器具関連事業)
照明器具関連事業の売上高は48,962百万円(前連結会計年度比2.1%の増収)(セグメント間取引含む。以
下同じ。)となり、セグメント利益(営業利益。以下同じ。)は6,162百万円(前連結会計年度比16.6%の増
益)となりました。
(環境関連事業)
環境関連事業の売上高は11,285百万円(前連結会計年度比10.7%の増収)となり、セグメント利益は976百
万円(前連結会計年度比1.7%の増益)となりました。
(インテリア家具事業)
インテリア家具事業の売上高は1,160百万円(前連結会計年度比16.8%の減収)となり、セグメント利益は
25百万円(前連結会計年度は78百万円のセグメント利益)となりました。
②
キャッシュ・フローの状況
当連結会計年度における現金及び現金同等物は、23,534百万円(前連結会計年度は15,467百万円)となりまし
た。
営業活動によるキャッシュ・フローは、10,278百万円の増加(前連結会計年度は2,916百万円の増加)となり
ました。
投資活動によるキャッシュ・フローは、4,303百万円の減少(前連結会計年度は4,322百万円の減少)となりま
した。
財務活動によるキャッシュ・フローは、1,131百万円の増加(前連結会計年度は6百万円の減少)となりまし
た。
③
生産、受注及び販売の実績
a.生産実績
当連結会計年度における生産実績をセグメントごとに示すと、次のとおりであります。
セグメントの名称
生産高(百万円)
照明器具関連事業
前年同期比(%)
7,989
△14.6
(注) 1.セグメント間取引については、相殺消去しております。
2.金額は製造原価としております。
b.受注実績
当社グループ(当社及び連結子会社、以下同じ)は主に需要予測に基づく見込生産方式を採用しているため、該
当事項はありません。
c.販売実績
当連結会計年度における販売実績をセグメントごとに示すと、次のとおりであります。
セグメントの名称
販売高(百万円)
前年同期比(%)
照明器具関連事業
43,098
2.1
環境関連事業
11,215
10.6
インテリア家具事業
1,160
△16.8
55,473
3.2
合計
(注) セグメント間取引については、相殺消去しております。
20/116
EDINET提出書類
株式会社遠藤照明(E01986)
有価証券報告書
(2) 経営者の視点による経営成績等の状況に関する分析・検討内容
経営者の視点による当社グループの経営成績等の状況に関する認識及び分析・検討内容は次のとおりでありま
す。 なお、文中の将来に関する事項は、当連結会計年度末現在において判断したものであります。
①
当連結会計年度の経営成績等の状況に関する認識及び分析・検討内容
当社グループの当連結会計年度の経営成績等は、業績予想として売上高55,700百万円、営業利益5,300百万円、
経常利益5,600百万円及び親会社株主に帰属する当期純利益4,100百万円を2025年4月30日に公表し、その達成の
ため、高付加価値空間創造企業として、持続可能でよりよい社会の実現を目指し、高い省エネ性能に加え、顧客
価値を創造する光の質を高めた新製品の開発、製造及び販売に注力して参りました。
国内では電気料金の高騰及びサステナビリティに対する社会的要請の高まりが追い風となり、海外ではそれぞ
れの市場に適合した製品が顧客から高い評価を得ており、当連結会計年度における売上高は、55,473百万円(前
連結会計年度比3.2%の増収、業績予想比0.4%の減収)となりました。
また、全社的なコスト意識の徹底により、営業利益は5,742百万円(前連結会計年度比16.5%の増益、業績予想
比8.3%の増益)、経常利益は5,935百万円(前連結会計年度比9.7%の増益、業績予想比6.0%の増益)、親会社
株主に帰属する当期純利益は4,342百万円(前連結会計年度比9.5%の減益、業績予想比5.9%の増益)となりまし
た。
2026年3月期
(2025年4月30日公表
の業績予想)
2026年3月期
(実績)
増減
増減率(%)
売上高(百万円)
55,700
55,473
△226
△0.4
営業利益(百万円)
5,300
5,742
442
8.3
経常利益(百万円)
5,600
5,935
335
6.0
親会社株主に帰属する
当期純利益(百万円)
4,100
4,342
242
5.9
セグメントごとの経営成績の状況に関する認識及び分析・検討内容は、次のとおりであります。
(照明器具関連事業)
当セグメントにおきましては、業務用LED照明器具分野で業界トップクラスの品揃えを実現し、照明制御ソ
リューション分野でのトップブランドとしての地位の確立に努めました。
国内市場については、無線照明コントロールシステム「SmartLEDZ Fit/Fit Plus」、無線調光調色器具
「Tunable LEDZ」及び自然の光、カラー演出、色味調整の三役を1台で備えた次世代無線調光調色器具シリーズ
「Synca」の販売促進に注力しました。電気料金の高騰、2027年末の蛍光灯製造・輸出入禁止及びサステナビリ
ティに関する社会的要請の高まりを背景とした既存照明器具の取り換え需要に加え、新設の商業施設やオフィス
等の大型施設向け需要の取込みを強化しました。
6月にはオフィス向け照明カタログ「LIGHTING+ FOR WORKSPACE vol.2」、11月には医療福祉施設向け照明カ
タログ「HOSPITALITY & HEALTHFUL LIGHTING」を発刊し、それぞれの施設用途に求められる最適な光環境を実現
する新製品及び次世代ソリューション照明を活用した照明制御手法により、省エネルギーとウェルビーイングを
両立する照明ソリューションを提案しました。
あわせて、東京・大阪・福岡の体感型ショールーム「Synca U/X Lab」においても、新製品展示も含めたリ
ニューアルを行い、実空間において光の価値を体感いただくことで、より訴求力の高い提案活動を継続しまし
た。
海外市場におきましては、欧州及びアジアの両市場において、地域ごとの市場ニーズを反映し、施策を推進し
ました。
欧州市場は、英国電材卸市場でのシェア拡大と安定基盤構築に向け、強みであるカスタマーサービスの向上を
徹底し、競合他社との差別化を推進しました。5月に総合カタログ「S18」を発刊し、卸売業者と協同での物件
ビジネスの獲得に向けた提案活動を強化しました。また、8月にはウォリントンの配送拠点のキャパシティを
78%増加させる6,700㎡の新倉庫棟を増設しました。あわせて、新たな倉庫管理システムを導入したことで、在
庫管理、業務効率、顧客サービスの向上を図るとともに、リテール向けのDIY事業及び欧州大陸での海外事業
の拡大への対応力も強化しました。
21/116
EDINET提出書類
株式会社遠藤照明(E01986)
有価証券報告書
一方、アジア市場は、5月にWEBリリースした「sync5」製品が高い評価を得る中、リアル戦略及びデジタル戦
略両面から販売促進を図り、新規顧客獲得活動を強化しました。リアル戦略では、インドにショールームを9拠
点整備するとともに、シンガポール、フィリピン、タイ及びベトナムにも展開し、アジア各国での実機体感型の
提案環境を拡充しました。デジタル戦略では、海外公式サイトの大幅改訂とSNSの広告運用強化により、フォ
ロワー数が期初比で約300人から約20,000人へと大幅に増加し、ブランド認知の向上に寄与しました。
この結果、売上高は48,962百万円(前連結会計年度比2.1%の増収)(セグメント間取引含む。以下同じ。)
となり、セグメント利益(営業利益。以下同じ。)は6,162百万円(前連結会計年度比16.6%の増益)となりま
した。
(環境関連事業)
当セグメントにおきましては、電気料金及び建設資材の高騰を背景に、顧客の節約意識が高まっている中で照
明更新による電気代の削減、照明を活かして内装の印象を変える改装及び照明更新等を提案し、スーパーマー
ケット及びホームセンターにおいて、複数の成功事例を創出しました。さらに、「Synca Bright」、リモート
サービス及び自家消費太陽光発電システムの提案等を進め、照明と環境関連商材を組み合わせた付加価値の提供
に努めました。
この結果、売上高は11,285百万円(前連結会計年度比10.7%の増収)となり、セグメント利益は976百万円
(前連結会計年度比1.7%の増益)となりました。
(インテリア家具事業)
当セグメントにおきましては、屋外空間の有効活用需要の拡大を受け、海外アウトドア家具メーカーと日本国
内における独占販売契約を締結し、国内唯一の専属代理店として展開を開始しました。新市場の開拓及び認知度
向上に向け、東京、大阪、名古屋及び福岡の主要4拠点のショールームにて展示会を開催し、設計事務所及び施
主に対する提案営業を強化するとともに、ブランドの確立に取り組みました。
この結果、売上高は1,160百万円(前連結会計年度比16.8%の減収)となり、セグメント利益は25百万円(前
連結会計年度比67.0%の減益)となりました。
財政状態に関する認識及び分析・検討内容は、次のとおりであります。
当社グループの当連結会計年度末における自己資本比率は65.3%(前連結会計年度末比0.2ポイントの増加)と
なり、当連結会計年度末における1株当たり純資産額は3,387円27銭(前連結会計年度末比405円97銭の増加)とな
りました。
(資産)
当連結会計年度末の資産合計は、76,589百万円(前連結会計年度末比8,921百万円の増加)となりました。
主な要因は、「現金及び預金」の増加8,295百万円、「有形固定資産」の増加1,106百万円及び「棚卸資産」
の減少931百万円によるものであります。
(負債)
当連結会計年度末の負債合計は、26,564百万円(前連結会計年度末比2,948百万円の増加)となりました。
主な要因は、「有利子負債」の増加2,231百万円によるものであります。
(純資産)
当連結会計年度末の純資産合計は、50,025百万円(前連結会計年度末比5,973百万円の増加)となりました。
主な要因は、「親会社株主に帰属する当期純利益」の計上4,342百万円、「為替換算調整勘定」の増加2,546
百万円及び「配当金の支払い」による減少1,034百万円によるものであります。
22/116
EDINET提出書類
株式会社遠藤照明(E01986)
有価証券報告書
経営成績及び財政状態等に重要な影響を与える要因
当社グループの経営成績及び財政状態等に重要な影響を与える要因につきましては、「第2
3
②
事業の状況
事業等のリスク」に記載のとおりであります。
キャッシュ・フローの状況の分析・検討内容並びに資本の財源及び資金の流動性に係る情報
当社グループの当連結会計年度のキャッシュ・フローは、「第2 事業の状況
営成績及びキャッシュ・フローの状況の分析
(1) 経営成績等の状況の概要
4 経営者による財政状態、経
② キャッシュ・フローの状況」に
記載のとおりであります。
当社グループの運転資金の需要は、原材料の仕入及び製造費用並びに販売費及び一般管理費等の営業費用であ
ります。投資を目的とした資金需要は、新製品のための設備投資が中心となっております。
当社グループは、これらの事業運営上必要な資金の流動性と資金の源泉を安定的に確保することを基本方針と
しております。
運転資金の需要につきましては、自己資金及び金融機関からの短期借入金を基本としており、設備投資等の長
期資金の調達につきましては、金融機関からの長期借入金を基本としております。
③
重要な会計上の見積り及び当該見積りに用いた仮定
当社グループの連結財務諸表は、わが国において一般に公正妥当と認められている会計基準に基づき作成して
おります。この連結財務諸表を作成するにあたって、資産、負債、収益及び費用の報告額に影響を及ぼす見積り
及び仮定を用いております。
過去の実績及び当該取引の状況に照らして、合理的と考える見積り及び判断を行っておりますが、実際の結果
は、見積りによる不確実性があるため、これらの見積り及び仮定に基づく数値は実際の結果と異なる可能性があ
ります。
連結財務諸表の作成にあたって用いた会計上の見積り及び仮定のうち、重要なものは「第5
1
連結財務諸表等
(1)連結財務諸表
注記事項
経理の状況
(重要な会計上の見積り)」に記載しております。
23/116
EDINET提出書類
株式会社遠藤照明(E01986)
有価証券報告書
5 【重要な契約等】
(事業提携契約の締結)
当社は、2025年10月31日開催の当社取締役会において、株式会社アドバンテッジパートナーズと事業提携契約を締
結することを決議し、同日付で当該契約を締結しました。
その主な内容は、以下のとおりであります。
契約締結日
2025年10月31日
(注1)
会社名
株式会社アドバン
テッジパートナーズ
契約の名称
契約内容
契約期間
事業提携契約書
当社の業績向上の実現
を目的とした諸施策の
検討とノウハウの提携
等による事業提携の実
施
自 2025年11月20日
至 2029年5月20日
又は資本提携終了日
のいずれか早く到来
する日まで(注2)
(注)1.同日の取締役会において、第2回無担保転換社債型新株予約権付社債の募集について決議いたしました。
詳細は、「第4 提出会社の状況 1 株式等の状況 (2)新株予約権等の状況 ③その他の新株予約
権等の状況」に記載のとおりであります。
2.「資本提携終了日」とは、第2回無担保転換社債型新株予約権付社債又はこれらを転換若しくは行使して
取得する当社株式のいずれも保有しないこととなる日をいいます。
6 【研究開発活動】
当社グループは、「人と地球にやさしい未来の光」を創造し、持続可能な社会を実現するため「エシカルライティ
ング」を提唱しております。「より豊かな光環境をより少ないエネルギーで」を実現する為に日々研究、開発の活動
をしております。
なお、当連結会計年度における当社グループ全体の研究開発費の総額は、994百万円であります。
当社グループの研究開発活動は、次のとおりであります。
現代社会に求められる「省電力への貢献」と「人々のウェルビーイング」の両立を実現する為に地球と人に優しい
『次世代の光空間』の創造をする為の研究開発を行っております。当期は照明ソリューションの訴求強化に向け、6
月にオフィス用に特化した「LIGHTING+FOR WORKSPACE
vol2」、7月に生鮮向けの「SyncaBright」パンフレット、
9月には医療福祉施設向けの「HOSPITALITY&HEALTHFUL LIGHTING」を発刊し、市場へのアプローチを拡大していま
す。さらに、2026年4月には「LEDZ PRO7」を発刊。これにより、従来を超える徹底した省電力化への貢献と、時代
のニーズであるウェルビーイング(心身の健康や快適性)への強力な訴求が可能となりました。
「LIGHTING+ FOR WORKSPACE vol.2」では、「SmartLEDZ System」を拡張するゲートウェイに加え、照明以外の機
器も無線制御できる接点ユニット、独自の電波式を採用した照度モーションセンサーを新たに発売しました。 さら
に、ベース照明器具の省電力化も進め、エネルギー消費効率(Lm/W)を向上させています。「SyncaBright」パンフ
レットでは無線制御で光色を可変させあらゆる生鮮食材に最適な光色を実現できるようになりました。
「HOSPITALITY&HEALTHFUL LIGHTING」ではベッドブラケットライトに「調光・調色機能」を追加した新仕様をリ
リースいたしました。1日の外光変化に合わせて明るさと光色をスケジュール運転(自動制御)することで、人に寄
り添う快適な環境を提供できるようになりました。2026年4月発刊の「LEDZ
PRO7」では「人と地球にやさしい未来
に向けて」をテーマに、異なる要素を最適なバランスでブレンドすることで、これまでにない新たな価値を創り出し
ます。その具現化として、「グレアレスダウンライト」では、光の質を改善しながらも徹底した省電力化を追求。ま
た、「調光調色スポットライト」においては、当社独自のレンズ設計技術を用いることで、エネルギー消費効率を最
大47.5%向上させることに成功しました。さらに、その他の調光調色器具(Tunable LEDZシリーズ)でも、業界トッ
プクラスのラインナップとさらなる高効率化を達成しています。確かな技術力で、空間の快適性と高い省エネ性能を
ハイレベルで両立し、持続可能な社会の実現に貢献してまいります。
研究開発においては、中央研究所を中心に子会社である中国の昆山恩都照明有限公司、タイのENDO Lighting
(THAILAND)Public Co.,Ltd.と連携し、照明空間マネジメントシステム機能の向上及び拡充により、高効率LED照
明システムの国内外への展開を加速し、更なる高付加価値空間創造を実現できるLED照明製品の開発を推し進めて
まいります。
24/116
EDINET提出書類
株式会社遠藤照明(E01986)
有価証券報告書
第3 【設備の状況】
1 【設備投資等の概要】
当連結会計年度の設備投資の総額は4,398百万円で、セグメントごとの設備投資について示すと、次のとおりであり
ます。
(1) 照明器具関連事業
当連結会計年度の主な設備投資は、製品金型を中心に総額1,380百万円の投資を実施しました。
なお、重要な設備の除却または売却はありません。
(2) 環境関連事業
当連結会計年度の主な設備投資は、イーシームズ株式会社の賃貸用資産を中心に総額3,359百万円の投資を実施
しました。
なお、重要な設備の除却または売却はありません。
(3) インテリア家具事業
当連結会計年度の主な設備投資は、倉庫設備を中心に総額1百万円の投資を実施しました。
なお、重要な設備の除却または売却はありません。
(注) 上記セグメント別の記載においては、「セグメント間取引消去」調整前の金額を記載しております。
25/116
EDINET提出書類
株式会社遠藤照明(E01986)
有価証券報告書
2 【主要な設備の状況】
(1) 提出会社
2026年3月31日現在
帳簿価額(百万円)
事業所名
(所在地)
セグメントの
名称
設備の内容
全社(共通)
経営統括設備
建物及び
構築物
機械装置
及び
運搬具
274
販売設備
777
0
照明器具
関連事業
生産設備
物流倉庫設備
販売設備
423
8
テクニカルセン
ター
(大阪府東大阪市)
照明器具
関連事業
研究開発
施設、設備
品質管理
施設、設備
生産統括設備
物流倉庫設備
345
2
中央物流センター
(滋賀県甲賀市水口
町)
照明器具
関連事業
物流倉庫設備
加工設備
49
0
照明器具
関連事業
インテリア
家具事業
販売設備
東京事業所
(東京都新宿区)
476
本社
(大阪市中央区)
賃貸用設備
照明器具
関連事業
インテリア
家具事業
全社(共通)
大阪事業所
(大阪市中央区)
佐野事業所
(栃木県佐野市)
土地
(面積㎡)
従業員数
(名)
有形固定
資産合計
投資
不動産
0
600
1,204
26
61
1,774
91
5
729
28
16
699
71
3
304
115
9
17
1,447
167
その他
325
(195)
販売設備
販売設備
935
(537)
291
(16,000)
334
(1,902)
251
(11,385)
954
(1,112)
(注)1.帳簿価額のうち、「その他」は工具、器具及び備品、リース資産及び建設仮勘定であります。
2.投資不動産には、土地が含まれており、その帳簿価額は768百万円(面積4,881㎡)であります。
(2) 国内子会社
2026年3月31日現在
帳簿価額(百万円)
会社名
イーシームズ
株式会社
事業所名
(所在地)
セグメント
の名称
設備の内容
本社
(大阪市
中央区)
環境関連
事業
賃貸用資産
建物及び
構築物
機械装置
及び
運搬具
土地
(面積㎡)
リース
資産
その他
合計
152
11,053
11,205
(注)1. 帳簿価額のうち「その他」は、工具、器具及び備品、レンタル資産及び建設仮勘定であります。
2. 帳簿価額は、未実現利益消去前の金額を記載しております。
26/116
従業員数
(名)
77
EDINET提出書類
株式会社遠藤照明(E01986)
有価証券報告書
(3) 在外子会社
2026年3月31日現在
帳簿価額(百万円)
会社名
ENDO
Lighting
(THAILAND)
Public Co.,
Ltd.
事業所名
(所在地)
本社工場
(タイ国サ
ムットプラ
カーン県)
セグメント
の名称
設備の
内容
照明器具
関連事業
建物及び
構築物
機械装置
及び
運搬具
統括設備
生産設備
販売設備
643
64
土地
(面積㎡)
従業員数
(名)
リース
資産
その他
22
39
1,004
261
233
(19,216)
合計
昆山恩都照明
有限公司
本社工場
(中国江蘇
省)
照明器具
関連事業
統括設備
生産設備
販売設備
872
337
1,092
2,302
526
ENDO
Lighting
SE
Asia
Pte.Ltd.
本社
(シンガポー
ル国)
照明器具
関連事業
統括設備
販売設備
1
23
0
26
6
ENDO
LIGHTING
ACCESSORIES
(INDIA)
PRIVATE LTD.
本社
(インド国マ 照明器具関
ハーラーシュ 連事業
トラ州)
統括設備
販売設備
4
44
48
53
Ansell
Electrical
Products
Limited
本社工場
(英国チェ
シ ャ ー 州
ウォリント
ン)
照明器具
関連事業
統括設備
生産設備
販売設備
38
32
141
211
179
Ansell
( Sales &
Distribution
)Limited
本社
(英国アント
リム州ベル
ファスト)
照明器具
関連事業
統括設備
生産設備
販売設備
276
17
362
24
68
(5,000)
(注) 1.帳簿価額のうち、「その他」は工具、器具及び備品、建設仮勘定であります。
2.昆山恩都照明有限公司の帳簿価額及び従業員数には、恩藤照明設備(北京)有限公司の帳簿価額及び従業員が
含まれております。
3.Ansell Electrical Products Limitedの帳簿価額及び従業員数には、Ansell Electrical Products Spain
SLの帳簿価額及び従業員が含まれております。
4.Ansell(Sales & Distribution) Limitedの帳簿価額及び従業員数には、Ansell (Sales & Distribution)
Republic of Ireland Limitedの帳簿価額及び従業員が含まれております。
5.昆山恩都照明有限公司は、土地50,000㎡に対して土地使用権(帳簿価額86百万円)を所有しております。
3 【設備の新設、除却等の計画】
(1) 重要な設備の新設等
投資予定額
事業の種類
別セグメン
トの名称
設備の内容
提出会社
照明器具
関連事業
本社(大阪市中
インテリア
央区)
家具事業
全社(共通)
新製品投資
IT投資
775
イーシームズ
株式会社
本社(大阪市中
環境関連
央区)及び他
事業
7営業拠点
レンタル資
産
4,250
会社名
事業所名
(所在地)
総額
既支払額
(百万円) (百万円)
−
資金調達方法
着手年月
完了予定
年月
自己資金
借入金
2026年4月
2026年4月
〜2027年3月
−
2026年4月
2026年4月
〜2027年3月
−
− 借入金
(注) 完成後の増加能力につきましては算定が困難なため、記載を省略しております。
(2) 重要な設備の除却等
特記すべき事項はありません。
27/116
完成後の
増加能力
EDINET提出書類
株式会社遠藤照明(E01986)
有価証券報告書
第4 【提出会社の状況】
1 【株式等の状況】
(1) 【株式の総数等】
① 【株式の総数】
種類
発行可能株式総数(株)
普通株式
35,800,000
計
35,800,000
② 【発行済株式】
事業年度末現在
発行数(株)
(2026年3月31日)
提出日現在
発行数(株)
(2026年6月23日)
上場金融商品取引所
名又は登録認可金融
商品取引業協会名
内容
普通株式
14,776,321
14,776,321
東京証券取引所
スタンダード市場
単元株式数100株
計
14,776,321
14,776,321
−
−
種類
(2) 【新株予約権等の状況】
① 【ストックオプション制度の内容】
該当事項はありません。
② 【ライツプランの内容】
該当事項はありません。
③ 【その他の新株予約権等の状況】
当社は、会社法に基づき新株予約権付社債を発行しております。
第2回無担保転換社債型新株予約権付社債(2025年11月20日発行)
決議年月日
新株予約権の数(個)
2025年10月31日
※
49
(注)1
新株予約権のうち自己新株予約権の数
(個) ※
新株予約権の目的となる株式の種類、
内容及び数(株) ※
新株予約権の行使時の払込金額
(円) ※
普通株式
新株予約権の行使期間
2025年11月21日〜2030年11月18日
※
新株予約権の行使により株式を発行す
る場合の株式の発行価格及び資本組入
額(円) ※
新株予約権の行使の条件
※
組織再編成行為に伴う新株予約権の交
付に関する事項 ※
新株予約権の行使の際に出資の目的と
する財産の内容及び価額 ※
新株予約権付社債の残高(百万円)
※
2,262
2,210,400
(注)1
(注)2
発行価格
資本組入額
2,262
1,131
(注)3
(注)4
各本新株予約権の一部行使はできないものとする。原則として2028年11月
20日まで本新株予約権を行使しないものとする。 (注)5
新株予約権は、転換社債型新株予約権付社債に付されたものであり、本社
債からの分離譲渡はできないものとする。
※
新株予約権の譲渡に関する事項
―
※
(注)7
各本新株予約権の行使に際しては、当該本新株予約権に係る本社債を出資
するものとし、当該本社債の価額は当該本社債の額面金額と同額とする。
5,018
当事業年度の末日(2026年3月31日)における内容を記載しております。なお、提出日の前月末(2026年5月31
日)現在において、これらの事項に変更はありません。
28/116
EDINET提出書類
株式会社遠藤照明(E01986)
有価証券報告書
(注)1.新株予約権の目的となる株式の数
新株予約権付社債の額面102,040,000円につき新株予約権1個が割り当てられております。本新株予約権付
社債には、希薄化を可能な限り抑制することを目的として現金決済条項が設定されており、これにより目的と
なる株式の数が減少する可能性があります。表記上は、新株予約権の目的となる株式の数は株式に転換される
可能性がある最大の株式数で計算しております。
本新株予約権の行使により当社が新たに発行又はこれに代えて当社の保有する当社普通株式を処分(以下当
社普通株式の発行又は処分を当社普通株式の「交付」という。)する当社普通株式の数は、同時に行使された
本新株予約権に係る本社債の金額の総額を当該行使時において有効な転換価額で除して得られる数とする。但
し、1株未満の端数が生じた場合は、会社法の規定に基づいて現金により精算する(当社が単元株制度を採用
している場合において、本新株予約権の行使により単元未満株式が発生する場合には、会社法に定める単元未
満株式の買取請求権が行使されたものとして現金により精算し、1単元未満の株式はこれを切り捨てる。)。
なお、かかる現金精算において生じた1円未満の端数はこれを切り捨てる。
2.新株予約権の行使時の払込金額
1 本新株予約権の行使に際して出資される財産の内容及びその価額又はその算定方法
(1) 本新株予約権1個の行使に際し、当該本新株予約権が付された各本社債を出資するものとする。
(2) 本新株予約権1個の行使に際して出資される財産の価額は、各本社債の金額と同額とする。
2 転換価額
各本新株予約権の行使により交付する当社普通株式の数を算定するにあたり用いられる価額(以下「転換価
額」という。)は、2,262円とする。なお、転換価額は次項第(1)号乃至第(5)号に定めるところに従い調整され
ることがある。
3 転換価額の調整
(1) 転換価額の調整
① 当社は、本新株予約権付社債の発行後、本号②に掲げる各事由により当社の発行済普通株式数に変更
を生じる場合又は変更を生じる可能性がある場合は、次に定める算式(以下「新株発行等による転換価
額調整式」という。)により転換価額を調整する。
調整後転換価額
= 調整前転換価額 ×
発行又は処分株式数×1株当たりの発行
又は処分価額
+
既発行
時価
普通株式数
既発行普通株式数+発行又は処分株式数
②
新株発行等による転換価額調整式により本新株予約権付社債の転換価額の調整を行う場合及びその調
整後転換価額の適用時期については、次に定めるところによる。
イ 時価(本項第(3)号②に定義される。以下同じ。)を下回る払込金額をもって当社普通株式を新たに発行
し、又は当社の保有する当社普通株式を処分する場合(無償割当てによる場合を含む。)(但し、譲渡制限
付株式報酬制度に基づき当社の取締役(社外取締役を除く。)に当社普通株式を交付する場合、新株予約
権(新株予約権付社債に付されたものを含む。)の行使、取得請求権付株式又は取得条項付株式の取得、
その他当社普通株式の交付を請求できる権利の行使によって当社普通株式を交付する場合、及び合併、
会社分割、株式交換、株式移転又は株式交付により当社普通株式を交付する場合を除く。)
調整後転換価額は、払込期日(募集に際して払込期間を定めた場合はその最終日とし、無償割当ての場
合はその効力発生日とする。)の翌日以降、又はかかる発行若しくは処分につき株主に割当てを受ける権
利を与えるための基準日がある場合にはその日の翌日以降これを適用する。
ロ 株式の分割により普通株式を発行する場合
調整後転換価額は、株式の分割のための基準日の翌日以降これを適用する。
ハ 時価を下回る価額をもって当社普通株式を交付する定めのある取得請求権付株式又は時価を下回る価
額をもって当社普通株式の交付を請求できる新株予約権(新株予約権付社債に付されたものを含む。)を
発行又は付与する場合(但し、当社又は当社の子会社の取締役、監査役、執行役その他の役員又は従業員
に対してストック・オプション目的で発行される普通株式を目的とする新株予約権を除く。)
調整後転換価額は、取得請求権付株式の全部に係る取得請求権又は新株予約権の全部が当初の条件で
行使されたものとみなして新株発行等による転換価額調整式を適用して算出するものとし、払込期日(募
集に際して払込期間を定めた場合はその最終日とし、新株予約権の場合は割当日とする。)の翌日以降又
は(無償割当ての場合は)効力発生日の翌日以降これを適用する。但し、株主に割当てを受ける権利を与
えるための基準日がある場合には、その日の翌日以降これを適用する。
ニ 当社の発行した取得条項付株式又は取得条項付新株予約権(新株予約権付社債に付されたものを含
む。)の取得と引換えに時価を下回る価額をもって当社普通株式を交付する場合調整後転換価額は、取得
日の翌日以降これを適用する。
ホ 上記イ乃至ニの場合において、基準日が設定され、かつ、効力の発生が当該基準日以降の株主総会、
取締役会その他当社の機関の承認を条件としているときには、上記イ乃至ニにかかわらず、調整後転換
価額は、当該承認があった日の翌日以降これを適用する。この場合において、当該基準日の翌日から当
該承認があった日までに本新株予約権の行使請求をした本新株予約権を有する者(以下「本新株予約権
者」という。)に対しては、次の算出方法により、当社普通株式を交付する。
29/116
EDINET提出書類
株式会社遠藤照明(E01986)
有価証券報告書
交付普通
株式数
(
=
調整前
転換価額
−
調整後
転換価額
)
×
調整前転換価額により当該期
間内に交付された普通株式数
調整後転換価額
この場合、1株未満の端数を生じたときはこれを切り捨て、現金による調整は行わない。
(2) 特別配当による転換価額の調整
① 当社は、本新株予約権付社債の発行後、下記第②号に定める特別配当の支払いを実施する場合には、
次に定める算式(以下「特別配当による転換価額調整式」といい、新株発行等による転換価額調整式
と併せて「転換価額調整式」と総称する。)をもって転換価額を調整する。
調整後
転換価額
=
調整前
転換価額
×
時価
−
1株当たりの特別配当
時価
「1株当たりの特別配当」とは、特別配当を、剰余金の配当に係る当該事業年度の最終の基準日に
おける各本社債の金額(金102,040,000円)当たりの本新株予約権の目的となる株式の数で除した金額
をいう。1株当たり特別配当の計算については、円位未満小数第2位まで算出し、小数第2位を四捨
五入する。
②イ 「特別配当」とは、2030年11月20日までの間に終了する各事業年度内に到来する配当に係る各基準
日につき、当社普通株式1株当たりの剰余金の配当(会社法第455条第2項及び第456条の規定により
支払う金銭も含む。)の額(金銭以外の財産を配当財産とする剰余金の配当の場合には、かかる配当財
産の簿価を配当の額とする。)に当該基準日時点における各本社債の金額(金102,040,000円)当たりの
本新株予約権の目的である株式の数を乗じて得た金額の当該事業年度における累計額が、基準配当金
(基準配当金は、2030年11月20日までの間に終了する各事業年度内に到来する配当に係る各基準日に
つき、当該基準日時点における各本社債の金額(金102,040,000円)当たりの本新株予約権の目的であ
る株式の数に、50を乗じた金額の当該事業年度における累計額)(当社が当社の事業年度を変更した場
合には、本新株予約権者と協議のうえ合理的に調整された金額)を超える場合における当該超過額を
いう。
ロ 特別配当による転換価額の調整は、各事業年度の配当に係る最終の基準日に係る会社法第454条又
は第459条に定める剰余金の配当決議が行われた日の属する月の翌月10日以降これを適用する。
(3) ① 転換価額調整式の計算については、円位未満小数第2位まで算出し、小数第2位を切り捨てる。
② 転換価額調整式で使用する時価は、新株発行等による転換価額調整式の場合は調整後転換価額を適用
する日(但し、本項第(1)号②ホの場合は基準日)又は特別配当による転換価額調整式の場合は当該事
業年度の配当に係る最終の基準日に先立つ45取引日目に始まる30連続取引日の東京証券取引所におけ
る当社普通株式終値の平均値(終値のない日数を除く。)とする。
この場合、平均値の計算は、円位未満小数第2位まで算出し、小数第2位を切り捨てる。
③ 新株発行等による転換価額調整式で使用する既発行普通株式数は、株主に割当てを受ける権利を与え
るための基準日がある場合はその日、また、かかる基準日がない場合は、調整後転換価額を適用する
日の1か月前の日における当社の発行済普通株式数から、当該日における当社の有する当社普通株式
の数を控除した数とし、当該転換価額の調整前に本項第(1)号②又は本項第(5)号に基づき交付された
ものとみなされた当社普通株式のうち未だ交付されていない当社普通株式の数を加えた数とする。ま
た、当社普通株式の株式分割が行われる場合には、新株発行等による転換価額調整式で使用する発行
又は処分株式数は、基準日における当社の有する当社普通株式に割り当てられる当社普通株式の数を
含まないものとする。
④ 転換価額調整式により算出された転換価額と調整前転換価額との差額が1円未満にとどまるときは、
転換価額の調整は行わないこととする。但し、次に転換価額の調整を必要とする事由が発生し転換価
額を算出する場合は、転換価額調整式中の調整前転換価額に代えて、調整前転換価額からこの差額を
差し引いた額を使用するものとする。
⑤ 本新株予約権付社債の発行後、本号⑥に掲げる各事由により当社の普通株式数に変更を生じる場合又
は変更を生じる可能性がある場合で、当社普通株式の新たな発行又は当社の保有する当社普通株式の
処分における払込金額(本号⑥ロの場合は、取得請求権付株式に係る取得請求権又は新株予約権を当
初の発行条件に従い行使する場合の当社普通株式1株当たりの対価、本号⑥ハの場合は、取得条項付
株式又は取得条項付新株予約権を取得した場合の当社普通株式1株当たりの対価(総称して、以下
「取得価額等」という。)をいう。)が、本号⑥において調整後転換価額の適用開始日として定める日
において有効な転換価額を下回る場合には、転換価額は当該払込金額又は取得価額等と同額(但し、
調整後転換価額が1,809円を下回ることとなる場合には、1,809円とする。)に調整される。但し、本
⑤による転換価額の調整は、当社が導入する譲渡制限付株式報酬制度に基づき、当社の取締役(社外
取締役を除く。)に当社普通株式を交付する場合又は従業員に対してストック・オプション目的で発
行される普通株式を目的とする新株予約権には適用されないものとする。
⑥ 本号⑤により転換価額の調整を行う場合及び調整後転換価額の適用時期については、次に定めるとこ
ろによる。
イ 当社普通株式を新たに発行し、又は当社の保有する当社普通株式を処分する場合(但し、譲渡制限
付株式報酬制度に基づく普通株式の発行又は普通株式の処分、無償割当て又は株式の分割による場
30/116
EDINET提出書類
株式会社遠藤照明(E01986)
有価証券報告書
合、新株予約権(新株予約権付社債に付されたものを含む。)の行使、取得請求権付株式又は取得条項
付株式の取得、その他当社普通株式の交付を請求できる権利の行使によって当社普通株式を交付する
場合、及び合併、会社分割、株式交換、株式移転又は株式交付により当社普通株式を交付する場合を
除く。)
調整後転換価額は、払込期日(募集に際して払込期間を定めた場合はその最終日とする。)の翌日以
降、又はかかる発行若しくは処分につき株主に割当てを受ける権利を与えるための基準日がある場合
はその日の翌日以降これを適用する。
ロ 当社普通株式を交付する定めのある取得請求権付株式又は当社普通株式の交付を請求できる新株予
約権(新株予約権付社債に付されたものを含む。)を発行又は付与する場合
調整後転換価額は、払込期日(募集に際して払込期間を定めた場合はその最終日とし、新株予約権
の場合は割当日とする。)の翌日以降、又は(無償割当ての場合は)効力発生日の翌日以降これを適用
する。但し、株主に割当てを受ける権利を与えるための基準日がある場合には、その日の翌日以降こ
れを適用する。
ハ 当社の発行した取得条項付株式又は取得条項付新株予約権(新株予約権付社債に付されたものを含
む。)の取得と引換えに当社普通株式を交付する場合
調整後転換価額は、取得日の翌日以降これを適用する。
ニ 本⑥イ及びロの場合において、基準日が設定され、かつ、効力の発生が当該基準日以降の株主総
会、取締役会その他当社の機関の承認を条件としているときには、本⑥イ及びロにかかわらず、調整
後転換価額は、当該承認があった日の翌日以降これを適用する。この場合において、当該基準日の翌
日から当該承認があった日までに本新株予約権の行使請求をした本新株予約権者に対しては、本項第
(1)号②ホに定める算出方法により、当社普通株式を追加的に交付する。
(4) 本項第(1)号①、本項第(2)号①及び本項第(3)号⑤のうち複数の規定に該当する場合、調整後転換価額がよ
り低い金額となる規定を適用して転換価額を調整する。
(5) 本項第(1)号②、本項第(2)号②及び本項第(3)号⑥の転換価額の調整を必要とする場合以外にも、次に掲げ
る場合には、当社は、本新株予約権付社債権者と協議の上、その承認を得て、必要な転換価額の調整を行
う。
① 株式の併合、合併、会社分割、株式交換、株式移転又は株式交付のために転換価額の調整を必要とす
るとき。
② その他当社の発行済普通株式数の変更又は変更の可能性が生じる事由の発生により転換価額の調整を
必要とするとき。
③ 当社普通株式の株主に対する普通株式以外の種類の株式の無償割当てのために転換価額の調整を必要
とするとき。
④ 転換価額を調整すべき事由が2つ以上相接して発生し、一方の事由に基づく調整後の転換価額の算出
にあたり使用すべき時価につき、他方の事由による影響を考慮する必要があるとき。
(6) 本項第(1)号乃至第(5)号により転換価額の調整を行うときは、当社は、あらかじめ書面によりその旨並び
にその事由、調整前の転換価額、調整後の転換価額及びその適用の日その他必要な事項を本新株予約権付
社債権者に通知する。但し、適用の日の前日までに前記の通知を行うことができないときは、適用の日以
降速やかにこれを行う。
3.新株予約権の行使期間
本新株予約権の新株予約権者は、2025年11月21日から2030年11月18日((注)8.「償還の方法」欄第2項
第(2)号に定めるところにより、本社債が繰上償還される場合には、当該償還日の2銀行営業日前)までの間
(以下「行使期間」という。)、いつでも、本新株予約権を行使することができる。但し、行使期間の最終日が
銀行営業日でない場合にはその前銀行営業日を最終日とする。行使期間を経過した後は、本新株予約権は行使
できないものとする。
上記にかかわらず、以下の期間については行使請求ができないものとする。
(1) 当社普通株式に係る株主確定日(会社法第124条第1項に定める基準日をいう。)及びその前銀行営業日(振
替機関の休業日でない日をいう。)
(2) 振替機関が必要であると認めた日
(3) 組織再編行為をするために本新株予約権の行使の停止が必要であると当社が合理的に判断した場合は、そ
れらの組織再編行為の効力発生日の翌日から14日以内の日に先立つ30日以内の当社が指定する期間中は、
本新株予約権を行使することはできない。この場合には停止期間その他必要な事項をあらかじめ本新株予
約権付社債権者に通知する。
4.新株予約権の行使により株式を発行する場合における増加する資本金及び資本準備金に関する事項
(1) 本新株予約権の行使により株式を発行する場合において増加する資本金の額は、会社計算規則第17条第1
項に従い算出される資本金等増加限度額の2分の1の金額とし、計算の結果1円未満の端数が生じたとき
は、その端数を切り上げるものとする。
(2) 本新株予約権の行使により株式を発行する場合において増加する資本準備金の額は、上記(1)記載の資本金
等増加限度額から上記(1)に定める増加する資本金の額を減じた額とする。
5.新株予約権の行使の条件
各本新株予約権の一部行使はできないものとする。
31/116
EDINET提出書類
株式会社遠藤照明(E01986)
有価証券報告書
6.自己新株予約権の取得の事由及び取得の条件
1 本新株予約権付社債権者による本新株予約権の行使請求の意向表明時における本新株予約権付社債の取得
(1) 2025年11月21日から2030年9月20日に本新株予約権付社債権者から当社に対して本新株予約権の行使請求
の意向に係る通知(以下「行使請求意向通知」という。)が書面により行われた場合、当社は、当該行使請
求意向通知が行われてから実務上可能な限り速やかに、当該行使請求意向通知に記載された本新株予約権
に係る本新株予約権付社債の全部(以下、本欄において「取得新株予約権付社債」という。)を取得し、こ
れと引換えに当該行使請求意向通知を行った本新株予約権付社債権者に対して行使取得交付財産(以下に定
義する。)を交付する。
(2) 「行使取得交付財産」とは、(A)取得新株予約権付社債に係る本社債の額面金額の総額に相当する額(以下
「額面金額相当額」という。)の金銭、及び(B)次の算式により算出される数の当社普通株式(但し、1株未
満の端数は切り捨て、現金による調整は行わない。また、計算の結果、単元未満株式が発生する場合に
は、会社法に定める単元未満株式の買取請求権が行使されたものとして現金により精算する。)をいう。
行使取得転換価値−額面金額相当額(正の数である場合に限る。)
1株当たりの行使取得平均VWAP
「行使取得転換価値」とは、次の算式により算出される数値をいう。
額面金額相当額
行使取得最終日転換価額
×
1株当たりの行使取得平均VWAP
「1株当たりの行使取得平均VWAP」とは、行使取得関係VWAP計算期間(以下に定義する。)に含まれる各
VWAP取引日(以下に定義する。)において東京証券取引所が発表する当社普通株式の売買高加重平均価格
(以下「VWAP」という。)の平均値をいう。行使取得関係VWAP計算期間中に「新株予約権の行使時の払込金
額」欄第3項(1)号②、(2)号、(3)号⑥、(5)号記載の転換価額の調整事由が発生した場合には、1株当た
りの行使取得平均VWAPも適宜調整される。
「行使取得最終日転換価額」とは、行使取得関係VWAP計算期間の最終日において有効な転換価額をい
う。
「行使取得関係VWAP計算期間」とは、行使請求意向通知が行われた日の10VWAP取引日前の日に始まる10
連続VWAP取引日をいう。
本欄において「VWAP取引日」とは、東京証券取引所が開設されている日をいい、VWAPが発表されない日
を含まない。
2 当社の選択による本新株予約権付社債の取得
(1) 2030年9月21日から2030年11月18日に当社から本新株予約権付社債権者に対して本新株予約権の取得に係
る通知(以下「取得通知」という。)が書面により行われた場合、当社は、取得通知が行われてから実務上
可能な限り速やかに、当該取得通知に記載された本新株予約権に係る本新株予約権付社債の全部を取得
し、これと引換えに当該取得通知を行った本新株予約権付社債権者に対して交付財産(以下に定義する。)
を交付する。但し、取得通知に先立ち、本新株予約権付社債権者の書面による同意(但し、かかる同意は不
合理に拒絶、留保又は遅延されないものとする。)を得ていない場合は、この限りではない。
(2) 「交付財産」とは、(A)額面金額相当額の金銭、及び(B)次の算式により算出される数の当社普通株式(但
し、1株未満の端数は切り捨て、現金による調整は行わない。また、計算の結果、単元未満株式が発生す
る場合には、会社法に定める単元未満株式の買取請求権が行使されたものとして現金により精算する。)を
いう。
転換価値−額面金額相当額(正の数である場合に限る。)
1株当たりの平均VWAP
「転換価値」とは、次の算式により算出される数値をいう。
額面金額相当額
最終日転換価額
×
1株当たりの平均VWAP
「1株当たりの平均VWAP」とは、VWAP計算期間(以下に定義する。)に含まれるVWAPの平均値をいう。
VWAP計算期間中に「新株予約権の行使時の払込金額」欄第3項(1)号②、(2)号、(3)号⑥、(5)号記載の転
換価額の調整事由が発生した場合には、1株当たりのVWAPも適宜調整される。
「最終日転換価額」とは、VWAP計算期間の最終日において有効な転換価額をいう。
「VWAP計算期間」とは、取得通知が行われた日の10VWAP取引日前の日に始まる10連続VWAP取引日をい
う。
3 当社は、第1項又は第2項に定める取得条項により取得した本新株予約権付社債を、かかる取得から実務上
可能な限り速やかに消却するものとする。
7.組織再編成行為に伴う新株予約権の交付に関する事項
当社が組織再編行為を行う場合は、(注)8.「償還の方法」欄第2項第(2)号①に基づき本新株予約権付
社債の繰上償還を行う場合を除き、承継会社等をして、組織再編行為の効力発生日の直前において残存する
本新株予約権付社債に付された本新株予約権の所持人に対して、当該本新株予約権の所持人の有する本新株
予約権に代えて、それぞれの場合につき、承継会社等の新株予約権で、下記第(1)号乃至第(10)号に掲げる内
32/116
EDINET提出書類
株式会社遠藤照明(E01986)
有価証券報告書
容のもの(以下「承継新株予約権」という。)を交付させるものとする。この場合、組織再編行為の効力発生
日において、本新株予約権は消滅し、本社債に係る債務は承継会社等に承継され、本新株予約権の所持人
は、承継新株予約権の所持人となるものとし、本新株予約権付社債の要項の本新株予約権に関する規定は承
継新株予約権について準用する。
(1) 交付される承継会社等の新株予約権の数
当該組織再編行為の効力発生日直前において残存する本新株予約権付社債の所持人が保有する本新株予
約権の数と同一の数とする。
(2) 承継会社等の新株予約権の目的たる株式の種類
承継会社等の普通株式とする。
(3) 承継会社等の新株予約権の目的たる株式の数
承継会社等の新株予約権の行使により交付される承継会社等の普通株式の数は、当該組織再編行為の条
件を勘案の上、本新株予約権付社債の要項を参照して決定するほか、以下に従う。なお、転換価額は
(注)2.「新株予約権の行使時の払込金額」欄第3項第(1)号乃至第(5)号と同様の調整に服する。
① 合併、株式交換、株式移転又は株式交付の場合には、当該組織再編行為の効力発生日の直後に承継会
社等の新株予約権を行使したときに、当該組織再編行為の効力発生日の直前に本新株予約権を行使し
た場合に得られる数の当社普通株式の保有者が当該組織再編行為において受領する承継会社等の普通
株式の数を受領できるように、転換価額を定める。当該組織再編行為に際して承継会社等の普通株式
以外の証券又はその他の財産が交付されるときは、当該証券又は財産の公正な市場価値を承継会社等
の普通株式の時価で除して得られる数に等しい承継会社等の普通株式の数を併せて受領できるように
する。
② その他の組織再編行為の場合には、当該組織再編行為の効力発生日の直後に承継会社等の新株予約権
を行使したときに、当該組織再編行為の効力発生日の直前に本新株予約権を行使した場合に本新株予
約権付社債の所持人が得ることのできる経済的利益と同等の経済的利益を受領できるように、転換価
額を定める。
(4) 承継会社等の新株予約権の行使に際して出資される財産の内容及びその価額又はその算定方法
承継会社等の新株予約権1個の行使に際しては、各本社債を出資するものとし、承継会社等の新株予約
権1個の行使に際して出資される財産の価額は、各本社債の金額と同額とする。
(5) 承継会社等の新株予約権を行使することができる期間
当該組織再編行為の効力発生日又は承継会社等の新株予約権を交付した日のいずれか遅い日から、
(注)3.「新株予約権の行使期間」欄に定める本新株予約権の行使期間の満了日までとし、(注)3.
「新株予約権の行使期間」欄に準ずる制限に服する。
(6) 承継会社等の新株予約権の行使の条件
(注)5.「新株予約権の行使の条件」欄に準じて決定する。
(7) 承継会社等の新株予約権の取得条項
承継会社等は、承継会社等の新株予約権及び承継された本社債を(注)6.「自己新株予約権の取得の
事由及び取得の条件」欄と同様に取得することができる。
(8) 承継会社等の新株予約権の行使により株式を発行する場合における増加する資本金及び資本準備金に関す
る事項
承継会社等の新株予約権の行使により株式を発行する場合において増加する資本金の額は、会社計算規
則第17条第1項に従い算出される資本金等増加限度額の2分の1の金額とし、計算の結果1円未満の端数
が生じたときは、その端数を切り上げるものとする。承継会社等の新株予約権の行使により株式を発行す
る場合において増加する資本準備金の額は、資本金等増加限度額から増加する資本金の額を減じた額とす
る。
(9) 組織再編行為が生じた場合
本欄の規定に準じて決定する。
(10)その他
承継会社等の新株予約権の行使により承継会社等が交付する承継会社等の普通株式の数につき、1株未
満の端数が生じた場合は、会社法の規定に基づいて現金により精算する(承継会社等が単元株制度を採用し
ている場合において、承継会社等の新株予約権の行使により単元未満株式が発生する場合には、会社法に
定める単元未満株式の買取請求権が行使されたものとして現金により精算し、1株未満の端数はこれを切
り捨てる。)。また、当該組織再編行為の効力発生日時点における本新株予約権付社債の所持人は、本社債
を承継会社等の新株予約権とは別に譲渡することができないものとする。かかる本社債の譲渡に関する制
限が法律上無効とされる場合には、承継会社等が発行する本社債と同様の社債に付された承継会社等の新
株予約権を、当該組織再編行為の効力発生日直前の本新株予約権付社債の所持人に対し、本新株予約権及
び本社債の代わりに交付できるものとする。
8.償還の方法
1 償還金額
各社債の金額100円につき金100円
但し、繰上償還の場合は本欄第2項第(2)号に定める金額による。
2 社債の償還の方法及び期限
(1) 本社債は、2030年11月20日(償還期限)にその総額を各社債の金額100円につき金100円で償還する。
(2) 繰上償還事由
① 組織再編行為による繰上償還
イ 組織再編行為(下記ニ(ⅰ)に定義する。)が当社の株主総会で承認された場合(株主総会の承認が不要な
場合は当社の取締役会で決議された場合。かかる承認又は決議がなされた日を、以下「組織再編行為承
認日」という。)において、承継会社等(下記ニ(ⅱ)に定義する。)の普通株式がいずれの金融商品取引所
にも上場されない場合には、当社は本新株予約権付社債の社債権者(以下「本新株予約権付社債権者」と
いう。)に対して償還日(当該組織再編行為の効力発生日前の日とする。)の30日前までに通知の上、残存
33/116
EDINET提出書類
株式会社遠藤照明(E01986)
有価証券報告書
する本社債の全部(一部は不可)を、以下の償還金額で繰上償還するものとする。
上記償還に適用される償還金額は、参照パリティ(下記ハに定義する。)が100%を超える場合には、各
社債の金額100円につき金100円に参照パリティを乗じた額とし、参照パリティが100%以下となる場合に
は、各社債の金額100円につき金100円とする。
ハ 参照パリティは、以下に定めるところにより決定された値とする。
(ⅰ) 当該組織再編行為に関して当社普通株式の株主に支払われる対価が金銭のみである場合
当該普通株式1株につき支払われる当該金銭の額を当該組織再編行為承認日時点で有効な転換価額
((注)2.「新株予約権の行使時の払込金額」欄第2項第(1)号に定義する。)で除して得られた値(小
数第5位まで算出し、小数第5位を四捨五入し、これを百分率で表示する。)
(ⅱ) (ⅰ)以外の場合
会社法に基づき当社の取締役会その他の機関において当該組織再編行為に関して支払われ若しくは交
付される対価を含む条件が決議又は決定された日(決議又は決定された日よりも後に当該組織再編行為の
条件が公表される場合にはかかる公表の日)の直後の取引日(株式会社東京証券取引所(以下「東京証券取
引所」という。)において売買立会が行われる日をいう。但し、東京証券取引所において当社普通株式の
あらゆる種類の取引停止処分又は取引制限(一時的な取引制限も含む。)があった場合には、当該日は
「取引日」にあたらないものとする。以下同じ。)に始まる5連続取引日の東京証券取引所における当社
普通株式の普通取引の終値の平均値を、当該5連続取引日の最終日時点で有効な転換価額で除して得ら
れた値(小数第5位まで算出し、小数第5位を四捨五入し、これを百分率で表示する。)とする。当該5
連続取引日において(注)2.「新株予約権の行使時の払込金額」欄第3項第(1)号②、第(2)号②、第
(3)号⑥及び第(5)号に記載の転換価額の調整事由が生じた場合には、当該5連続取引日の当社普通株式
の普通取引の終値の平均値は、(注)2.「新株予約権の行使時の払込金額」欄第3項に記載の転換価
額の調整条項に準じて合理的に調整されるものとする。
ニ それぞれの用語の定義は以下のとおりとする。
(ⅰ) 組織再編行為
当社が消滅会社となる合併契約の締結、当社が分割会社となる吸収分割契約の締結若しくは新設分割
計画の作成、当社が他の会社の完全子会社となる株式交換契約の締結若しくは株式移転計画の作成、株
式交付親会社が当社の発行済株式の全部を取得することを内容とする株式交付計画の作成又はその他の
日本法上の会社組織再編手続で、かかる手続により本社債に基づく当社の義務が他の会社に引き受けら
れることとなるものをいう。
(ⅱ) 承継会社等
当社による組織再編行為に係る吸収合併存続会社若しくは新設合併設立会社、吸収分割承継会社若し
くは新設分割設立会社、株式交換完全親会社若しくは株式移転完全親会社、株式交付親会社又はその他
の日本法上の会社組織再編手続におけるこれらに相当する会社のいずれかであって、本社債に基づく当
社の義務を引き受けるものをいう。
ホ 当社は、本号①イに定める通知を行った後は、当該通知に係る繰上償還通知を撤回又は取り消すこと
はできない。
② 公開買付けによる上場廃止に伴う繰上償還
イ 当社普通株式について金融商品取引法に基づく公開買付けがなされ、当社が当該公開買付けに賛同す
る意見を表明し、当該公開買付けの結果、当社普通株式が上場されている全ての日本の金融商品取引所
においてその上場が廃止となる可能性があることを当社又は公開買付者が公表又は容認し(但し、当社又
は公開買付者が、当該公開買付け後も当社普通株式の上場を維持するよう努力する旨を公表した場合を
除く。)、かつ公開買付者が当該公開買付けにより当社普通株式を取得した場合、当社は、本新株予約権
付社債権者に対して当該公開買付けによる当社普通株式の取得日(当該公開買付けに係る決済の開始日を
意味する。)から15日以内に通知の上、当該通知日から30日以上60日以内の日を償還日として、残存する
本社債の全部(一部は不可)を、本号①に記載の償還の場合に準ずる方式によって算出される償還金額で
繰上償還するものとする。
ロ 本号①及び②の両方に従って本社債の償還を義務付けられる場合、本号①の手続が適用される。但
し、組織再編行為により当社普通株式の株主に支払われる対価を含む条件が公表される前に本号②に基
づく通知が行われた場合には、本号②の手続が適用される。
③ スクイーズアウト事由による繰上償還
当社普通株式を全部取得条項付種類株式にする定款の変更の後、当社普通株式の全てを対価をもって
取得する旨の当社の株主総会の決議がなされた場合、当社の特別支配株主(会社法第179条第1項に定義
される。)による当社の他の株主に対する株式等売渡請求を承認する旨の当社の取締役会の決議がなされ
た場合又は上場廃止を伴う当社普通株式の併合を承認する旨の当社の株主総会の決議がなされた場合(以
下「スクイーズアウト事由」という。)、当社は、本新株予約権付社債権者に対して、実務上可能な限り
速やかに、但し、当該スクイーズアウト事由の発生日から14日以内に通知した上で、当該通知において
指定した償還日(かかる償還日は、当該スクイーズアウト事由に係る当社普通株式の取得日又は効力発生
日より前で、当該通知の日から14銀行営業日(振替機関の休業日ではない日をいう。以下同じ。)目以降
30銀行営業日目までのいずれかの日とする。)に、残存する本社債の全部(一部は不可)を、本号①に記載
の償還の場合に準ずる方式によって算出される償還金額で繰上償還するものとする。
④ 支配権変動事由による繰上償還
イ 本新株予約権付社債権者は、支配権変動事由(下記ロに定義する。)が生じた場合、当該事由が生じた
日後いつでも、その選択により、当社に対し、あらかじめ書面により通知し、当該通知日から30日以上
60日以内の日を償還日として、その保有する本社債の全部又は一部を、本号①に記載の償還の場合に準
ずる方式によって算出される償還金額で繰上償還することを、当社に対して請求する権利を有するもの
とする。
ロ 「支配権変動事由」とは、特定株主グループ(当社の株券等(金融商品取引法第27条の23第1項に規定
する株券等をいう。)の保有者(同法第27条の23第3項に基づき保有者に含まれる者を含む。)及びその共
同保有者(同法第27条の23第5項に規定する共同保有者をいい、同条第6項に基づき共同保有者とみなさ
ロ
34/116
EDINET提出書類
株式会社遠藤照明(E01986)
有価証券報告書
れる者を含む。))の株券等保有割合(同法第27条の23第4項に規定する株券等保有割合をいう。)が50%
超となった場合をいう。
⑤ 社債権者の選択による繰上償還
イ 本新株予約権付社債権者は、2028年11月21日(但し、同日に先立ち財務制限条項抵触事由(下記ロに定
義する。)が生じた場合には、当該事由が生じた日)以降、その選択により、当社に対して、償還すべき
日の15銀行営業日以上前に事前通知を行った上で、当該繰上償還日に、その保有する本新株予約権付社
債の全部又は一部を各社債の金額100円につき金100円で繰上償還することを、当社に対して請求する権
利を有する。
ロ 「財務制限条項抵触事由」とは、以下の事由をいう。
(イ) 当社の2025年3月期以降の連結若しくは単体の通期の損益計算書に記載される経常損益が2期連続
して損失となった場合
(ロ) 当社の2025年3月期以降の各事業年度の末日における連結の通期の貸借対照表に記載される株主資
本合計の額が、直前の事業年度の末日における通期の貸借対照表に記載される株主資本合計の額の75%
を下回った場合
(ハ) 当社の2025年3月期以降の各事業年度の末日における単体の通期の貸借対照表に記載される株主資
本合計の額が、直前の事業年度の末日における通期の貸借対照表に記載される株主資本合計の額の75%
を下回った場合
⑥ 上場廃止事由等又は監理銘柄指定による繰上償還
イ 本新株予約権付社債権者は、当社普通株式について、上場廃止事由等(下記ロに定義する。)が生じた
若しくは生じる合理的な見込みがある場合、又は東京証券取引所による監理銘柄への指定がなされた若
しくはなされる合理的な見込みがある場合には、その選択により、当社に対して、償還すべき日の15銀
行営業日以上前に事前通知を行った上で、当該繰上償還日に、その保有する本新株予約権付社債の全部
又は一部を各社債の金額100円につき金100円で繰上償還することを、当社に対して請求する権利を有す
る。
ロ 「上場廃止事由等」とは、当社又はその企業集団に、東京証券取引所有価証券上場規程第601条第1項
各号に定める事由が発生した場合、又は、当社が本新株予約権付社債の払込期日以降その事業年度の末
日現在における財務諸表又は連結財務諸表において債務超過となる場合において、当該事業年度の末日
の翌日から起算して6か月を経過する日までの期間において債務超過の状態でなくならなかった場合を
いう。
(3) 本項に定める償還すべき日が銀行休業日にあたるときは、その前銀行営業日にこれを繰り上げる。
3 買入消却
(1) 当社及びその子会社(下記第(3)号に定義する。以下同じ。)は、本新株予約権付社債権者と合意の上、随
時本新株予約権付社債をいかなる価格でも買入れることができる。
(2) 当社又はその子会社が本新株予約権付社債を買入れた場合には、当社は、いつでも、その選択により(当
社の子会社が買入れた場合には、当該子会社より消却のために当該本新株予約権付社債の交付を受けた
後)、当該本新株予約権付社債に係る本社債を消却することができ、かかる消却と同時に当該本新株予約
権付社債に係る本新株予約権は消滅する。
(3) 「子会社」とは、会社法第2条第3号に定める子会社をいう。
(3) 【行使価額修正条項付新株予約権付社債券等の行使状況等】
該当事項はありません。
35/116
EDINET提出書類
株式会社遠藤照明(E01986)
有価証券報告書
(4) 【発行済株式総数、資本金等の推移】
年月日
発行済株式
総数増減数
(千株)
発行済株式
総数残高
(千株)
資本金増減額
資本金残高
(百万円)
(百万円)
357
14,776
500
2012年9月20日
(注)
2026年3月31日現在
資本準備金
資本準備金
増減額
残高
(百万円)
(百万円)
5,155
500
3,795
(注)転換社債型新株予約権付社債の株式転換による増加であります。
(5) 【所有者別状況】
2026年3月31日現在
株式の状況(1単元の株式数100株)
政府及び
地方公共
団体
区分
金融機関
金融商品
取引業者
その他の
法人
外国法人等
個人以外
個人
個人
その他
計
単元未満
株式の状況
(株)
株主数
−
6
19
59
108
7
5,545
5,744
(人)
所有株式数
−
14,828
6,732
52,768
33,112
14
40,059
147,513
(単元)
有株式数の割合
−
10.05
4.56
35.77
22.45
0.01
27.16
100.00
(%)
(注) 自己株式8,703株は、「個人その他」に87単元、「単元未満株式の状況」に3株含まれております。
なお、自己株式1,000株は株主名簿上の株式数であり、2026年3月31日現在の実質的な所有株式数は
7,703株であります。
−
25,021
−
(6) 【大株主の状況】
氏名又は名称
住所
株式会社アーバン
奈良県奈良市西大寺新池町2番45−3号
株式会社日本カストディ銀行(信託
口)
2026年3月31日現在
発行済株式
(自己株式を
所有株式数除く。)の総数
(千株)
に対する所有
株式数の割合
(%)
4,933
33.40
東京都中央区晴海1丁目8番12号
652
4.41
日本生命保険相互会社
東京都千代田区丸の内1丁目6番6号
364
2.46
BNY GCM CLIENT ACCOUNT JPRD AC
ISG (FE−AC)
(常任代理人株式会社三菱UFJ銀
行)
日本マスタートラスト信託銀行株式
会社(信託口)
PETERBOROUGH COURT 133 FLEET STREET
LONDON EC4A 2BB UNITED KINGDOM
(東京都千代田区丸の内1丁目4番5号 )
337
2.28
東京都港区赤坂1丁目8番1号
258
1.75
JPモルガン証券株式会社
東京都千代田区丸の内2丁目7番3号
251
1.70
THE BANK OF NEW YO
RK MELLON 140044
(常任代理人株式会社みずほ銀
行)
INTERACTIVE BROKERS LLC
(常任代理人 インタラクティブ・
ブローカーズ証券株式会社)
240 GREENWICH STREET, NEW YORK,NY
10286,U.S.A.
(東京都港区港南2丁目15番1号)
244
1.65
ONE PICKWICK PLAZA GREENWICH,
CONNECTICUT 06830 USA
(東京都千代田区霞が関3丁目2番5号)
219
1.48
遠藤照明従業員持株会
大阪府大阪市中央区備後町1丁目7番3号
212
1.44
RE FUND 107‐CLIENT AC
(常任代理人 シティバンク、エ
ヌ・エイ東京支店)
MINISTRIES COMPLEX ALMURQAB AREA KUWAIT
KW 13001
(東京都新宿区新宿6丁目27番30号)
200
1.35
−
7,673
51.95
計
(注) 1.所有株式数は、千株未満を切り捨てて示しております。
2.発行済株式(自己株式を除く。)の総数に対する所有株式数の割合は、小数点第2位未満を切り捨てて表示
しております。
36/116
EDINET提出書類
株式会社遠藤照明(E01986)
有価証券報告書
(7) 【議決権の状況】
① 【発行済株式】
株式数(株)
議決権の数(個)
2026年3月31日現在
内容
無議決権株式
−
−
−
議決権制限株式(自己株式等)
−
−
−
議決権制限株式(その他)
−
−
−
区分
完全議決権株式(自己株式等)
普通株式
7,700
77
完全議決権株式(その他)
普通株式
14,743,600
147,436
単元未満株式
普通株式
25,021
−
−
14,776,321
−
−
147,513
−
発行済株式総数
総株主の議決権
−
−
単元株式数100株
(注) 1.「完全議決権株式(その他)」欄の普通株式には、株主名簿上は当社名義となっておりますが、実質的に所有
していない株式が1,000株(議決権10個)含まれております。
2.「単元未満株式」の欄には、当社所有の自己株式3株が含まれております。
② 【自己株式等】
2026年3月31日現在
所有者の氏名
又は名称
(自己保有株式)
株式会社遠藤照明
計
所有者の住所
自己名義
所有株式数
(株)
他人名義
所有株式数
(株)
所有株式数
の合計
(株)
発行済株式
総数に対する
所有株式数
の割合(%)
大阪市中央区本町一丁目6
番19号
7,700
−
7,700
0.05
−
7,700
−
7,700
0.05
37/116
EDINET提出書類
株式会社遠藤照明(E01986)
有価証券報告書
2 【自己株式の取得等の状況】
【株式の種類等】
会社法第155条第3号による普通株式の取得
(1) 【株主総会決議による取得の状況】
該当事項はありません。
(注)2026年6月25日開催予定の第55回定時株主総会において、当社は自己株式取得(株式総数735千株、取得価額
の総額2,500百万円)に関する株主提案を受けておりますが、当社取締役会は本議案に反対しております。
(2) 【取締役会決議による取得の状況】
区分
株式数(株)
取締役会(2025年4月30日)での決議状況
(取得期間2025年5月1日〜2025年10月31日)
価額の総額(百万円)
75,000
100
―
―
当事業年度における取得自己株式
12,300
24
残存決議株式の総数及び価額の総額
62,700
75
83.6
75.1
当期間における取得自己株式
―
―
提出日現在の未行使割合(%)
83.6
75.1
当事業年度前における取得自己株式
当事業年度の末日現在の未行使割合(%)
(3) 【株主総会決議又は取締役会決議に基づかないものの内容】
該当事項はありません。
(4) 【取得自己株式の処理状況及び保有状況】
当事業年度
区分
当期間
処分価額の総額
(百万円)
株式数(株)
処分価額の総額
(百万円)
株式数(株)
引き受ける者の募集を行った
取得自己株式
−
−
−
−
消却の処分を行った取得自己株式
−
−
−
−
合併、株式交換、株式交付、
会社分割に係る移転を行った
取得自己株式
−
−
−
−
その他(−)
4,793
11
−
−
保有自己株式数
7,703
−
7,703
−
(注) 1.上記の他、株主名簿上は、当社名義となっておりますが、実質的に所有していない株式が1,000株(議決権10
個)あります。
2.当期間における取得自己株式の処理状況及び保有状況には、2026年6月1日からこの有価証券報告書提出日
までの単元未満株式の買取り及び売渡による株式は含まれておりません。
38/116
EDINET提出書類
株式会社遠藤照明(E01986)
有価証券報告書
3 【配当政策】
当社の配当政策は、長期的に安定配当を維持していくことを基本方針としておりますが、企業の収益状況や内部留
保の厚み等、経営状態に応じ斟酌されるべきものと考えております。
当社は、中間配当及び期末配当の年2回の剰余金の配当を行うことを基本的な方針としております。また、剰余金
の配当の決定機関は、中間配当は取締役会、期末配当は株主総会であります。なお、定款において「取締役会の決議
をもって毎年9月30日の最終の株主名簿に記載または記録された株主若しくは登録株式質権者に対し、中間配当金と
して剰余金の配当を行うことができる。」旨を定めております。
当事業年度の配当金につきましては、1株当たり普通配当88円00銭(うち中間配当40円00銭)としております。
内部留保金につきましては、長期的展望にたった新規事業の開発活動及び経営体質の効率化・省力化のための投資
等に活用し、企業体質と企業競争力のさらなる強化に取り組んで参ります。
(注) 基準日が当事業年度に属する剰余金の配当は、以下のとおりであります。
配当金の総額
1株当たりの配当額
決議年月日
(百万円)
(円)
2025年10月31日
590
40.00
取締役会決議
2026年6月25日
定時株主総会決議(予定)
708
39/116
48.00
EDINET提出書類
株式会社遠藤照明(E01986)
有価証券報告書
4 【コーポレート・ガバナンスの状況等】
(1) 【コーポレート・ガバナンスの概要】
①
コーポレート・ガバナンスに関する基本的な考え方
当社は、経営理念として「企業は公器」を掲げ、事業活動は社会的存在価値を高めることに経営資源を集中
し、人間(組織)の持つ無限の能力と可能性を最大限発揮させる経営の仕組みづくり、社会に貢献する経営を優
先することを目指しております。
この考え方を実現する経営理念として「個と組織の調和と永続」、「ありがとう創造企業に」、「エシカル
(=倫理的な、道徳上の)ソリューション カンパニーとしてキラキラ光り輝く会社に」、「世界のブランドE
NDOに」等を掲げております。長期的な視点での企業価値の最大化を目指した企業活動を律するコーポレー
ト・ガバナンスの充実に取り組んでおります。
コーポレート・ガバナンスの重要性を十分認識し、透明性ある経営を推し進め、的確な情報開示を実践して
おります。また、経営の監視機能の強化、経営の機動性の向上、経営のチェック機能の充実に努めておりま
す。
②
企業統治の体制の概要及び当該体制を採用する理由
有価証券報告書提出日現在、当社は、取締役会を取締役5名(うち社外取締役2名)で構成し、取締役会を
毎月1回以上開催して、少人数で迅速な意思決定を行うとともに業務執行を監督しております。
社外取締役は、客観的・大局的見地から経営全般及び業務執行状況に関する助言を行い、取締役相互の監督
体制の強化と透明性のある意思決定の実効性を監督しております。
また、取締役会の諮問委員会として、代表取締役、社外取締役で構成する指名・報酬諮問委員会を設置し、
取締役の選任及び解任、取締役の報酬等の内容について取締役会に答申しております。
監査役は4名(うち社外監査役2名)の体制で、監査役全員が取締役会に出席して、取締役の職務執行を監
査し経営を監視しております。
代表取締役社長は、各部門の代表者を招集して経営執行会議を月1回開催し、経営計画、組織体制等の重要
な経営課題を協議し方針を決定して、職務執行が効率的に行われるよう監督しております。
各担当取締役及び執行役員は、経営計画に基づいた部門が実施すべき具体的な施策及び効率的な業務遂行体
制を決定します。その遂行状況を各部門担当取締役及び執行役員が、定期的に報告し、施策及び効率的な業務
遂行体制を阻害する要因の分析とその改善に努めております。
監査役は、取締役会、その他重要な会議へ出席し、意見等を述べ運営状況を監視しております。更に取締役
及び各部門の代表者等からの聴取、重要な決裁書類の閲覧等を通じ、取締役会の意思決定の過程及び取締役の
業務執行状況を監視しております。
以上のとおり、当社は取締役及び監査役による経営の監督・監視機能が果たされているため、現状の企業統
治の体制を採用しております。
取締役会、監査役会、経営執行会議、任意設置の委員会の構成員は次のとおりです。(◎は、議長、委員長
を示しています。)
役職名
氏名
取締役会
監査役会
経営執行
会議
指名・報酬
諮問委員会
コンプライ
アンスリスク
管理委員会
◎
◎
代表取締役社長
遠藤
邦彦
◎
◎
取締役常務執行
役員
菱谷
清
○
○
○
取締役上席執行
役員
奥村
昌之
○
○
○
社外取締役
土屋
郁子
○
○
○
○
社外取締役
山葉
隆久
○
○
○
○
常勤監査役
久保
章
○
◎
○
○
常勤監査役
杉坂
真志
○
○
○
○
社外監査役
村井
潤
○
○
○
○
社外監査役
奥澤
望
○
○
○
○
上席執行役員
後藤
修二
○
上席執行役員
三沢
広実
○
執行役員
鍛冶谷
栄司
○
40/116
EDINET提出書類
株式会社遠藤照明(E01986)
有価証券報告書
役職名
氏名
取締役会
監査役会
経営執行
会議
執行役員
細井
秀人
○
執行役員
小川
佳洋
○
執行役員
髙島
康行
○
執行役員
大島
雄太
○
執行役員
永山
惠一
○
執行役員
嶋田
夏樹
○
執行役員
眞島
久美子
○
なお、当社のガバナンスの体制は、以下のとおりです。
41/116
指名・報酬
諮問委員会
コンプライ
アンスリスク
管理委員会
EDINET提出書類
株式会社遠藤照明(E01986)
有価証券報告書
当社は、2026年6月25日開催予定の第55回定時株主総会の議案(決議事項)として、「取締役5名選任の
件」を提案しており、当該議案が承認可決されると、当社の取締役は5名(内、社外取締役2名)、監査役は
4名(内、社外監査役2名)となります。また、当該定時株主総会の直後に開催が予定されている取締役会の
決議事項として「代表取締役及び役付取締役選定の件」及び「特定取締役選定の件」が付議される予定です。
これらが承認可決された場合の取締役会の構成員の状況については、後記「(2)役員の状況 ②」のとおりで
あり、指名・報酬諮問委員会の委員長は、代表取締役遠藤邦彦であり、その他の構成員は、社外取締役土屋郁
子、社外取締役山葉隆久となります。
③
企業統治に関するその他の事項
a.内部統制システムについての基本的な考え方
当社は、2006年5月15日開催の取締役会において、内部統制システム構築の基本方針を決議し、適宜これを
改定しております。2023年3月15日開催の取締役会で決議した改定後の基本方針は、以下のとおりです。
・取締役及び執行役員並びに使用人の職務の執行が法令及び定款に適合することを確保するための体制
当社は、コンプライアンス体制に係る規程を制定し、取締役及び執行役員並びに使用人に法令、定款の
遵守を周知徹底するとともに、「社員憲章」の輪読やコンプライアンス研修による啓蒙活動を行う。
内部監査室は、当社及び当社子会社(以下、「当社グループ」という。)の業務遂行、コンプライアンス
の状況等について監査を実施し、経営管理の方向性を示すことにより会社の組織的経営を側面から支援する
とともに内部統制の信頼性を高めるよう努める。
また、コンプライアンス上の疑義のある行為等の社内報告体制として、内部通報制度を整備し、社内
通
報窓口とは別に弁護士への外部通報窓口も設けて、通報者の保護を図るとともに、不正行為の早期発
見と是正に努める。
各子会社は、法令等を遵守することはもとより自主的に定めた基準に従い業務を遂行する。
・取締役の職務の執行に係る情報の保存及び管理に関する体制
取締役会議事録、その他取締役の職務執行に係る情報を含んだ文書については、定款及び取締役会規則、
文書管理規程等の社内規程に基づき適切に保存及び管理し、取締役、監査役及び内部監査室は、それらの情
報を常時閲覧できるものとする。
・損失の危険の管理に関する規程その他の体制
当社は、代表取締役社長が管理本部長をリスク管理に関する総括責任者に任命し、当社グループにおい
て、災害等が発生した場合に備えて、規程及び基準の整備を行う等、必要に応じて適宜見直しを図る。リス
ク管理の全社的推進とリスク管理に必要な情報の共有化を図るため、コンプライアンスリスク管理委員会を
設置し、「リスク管理規程」に則り、各事業部門において自律的にマネジメントを行い、重要な事項につい
てはコンプライアンスリスク管理委員会に報告する。
内部監査室は当社グループのリスク管理状況を監査し、その結果を当社代表取締役及び各子会社取締役に
報告する。
取締役会は定期的に当社グループのリスク管理体制を見直し、問題点の把握と改善に努める。
・取締役の職務の執行が効率的に行われることを確保するための体制
取締役会は、重要事項の決定を行うと共に、経営計画、組織体制等の重要な経営課題を協議する。
取締役会における取締役の指名・報酬等に係る取締役会の機能の独立性・客観性と説明責任を強化するた
め、取締役会の諮問委員会として、指名・報酬諮問委員会を置き、代表取締役と社外取締役をその委員とす
る。
指名・報酬諮問委員会は、「指名・報酬諮問委員会規程」に則り、取締役会の諮問により、取締役の指
名・報酬等について審議した結果を取締役会に対して答申する。
業務執行の効率性を高めるために執行役員制度を導入し、代表取締役社長は取締役会の方針や決議事項を
執行役員に指示、伝達し、執行役員は業務執行状況を報告する。
経営執行会議は、取締役及び執行役員で構成し、取締役会の意思決定が迅速かつ効率的に行われるよう、
取締役会付議事項となる重要案件を事前に協議する。
当社は、持続可能な社会の実現に向けた社会的責任を認識し、会社と社会の持続可能性の両立と中長期的
な企業価値向上を目指すため、取締役や監査役が参加するサステナビリティ推進組織として「サステナビリ
ティ委員会」を置く。
42/116
EDINET提出書類
株式会社遠藤照明(E01986)
有価証券報告書
サステナビリティ委員会は、気候変動、汚染防止、資源循環、水資源、生物多様性などの環境に関する事
項、人権の尊重、従業員の健康・労働環境への配慮や公正・適切な処遇などの社会に関する事項、取引先と
の公正・適正な取引、腐敗防止、コーポレートガバナンス、自然災害等への危機管理などのガバナンスに関
する事項について検討し、サステナビリティ推進における課題や方針等、審議した結果を取締役会に対して
答申する。
・当社グループにおける業務の適正を確保するための体制
当社は、当社グループの業務の適正を確保するため、当社から子会社に役員等を配置し、子会社を管理す
る。
当社と子会社は定期的に海外生産拠点経営執行会議及び海外拠点課題検討会等を行い、当社グループ各社
の円滑な情報交換と効率的な事業運営を促進する。
監査役と内部監査室は、子会社の事業規模を勘案して定期的にグループ管理体制を監査し、必要に応じて
当社代表取締役及び各子会社取締役に報告する。
・監査役がその職務を補助すべき使用人を置くことを求めた場合における当該使用人に関する体制並びにその
使用人の取締役からの独立性及び当該使用人に対する指示の実効性の確保に関する事項
監査役会がその職務を補助すべき使用人を置くことを求めた場合、取締役会は監査役会と協議のうえ、監
査役の職務が実効的に行われるよう、専任の監査役スタッフを配置する。
監査役スタッフは監査役の職務を補助するものとし、指揮命令は監査役が行うものとする。監査役スタッ
フの人事及び評価については、監査役会の事前の同意を得るものとする。
・取締役及び執行役員並びに使用人が監査役に報告をするための体制、その他の監査役への報告に関する体
制、報告をしたことを理由として不利な取扱いを受けないことを確保するための体制
当社グループの取締役及び執行役員並びに使用人は、当社グループに著しい損害を及ぼすおそれのある事
項及び不正行為や法令並びに定款に違反する行為を認知した場合の他、取締役会に付議する重要な事項と決
定事項を、法令及び社内規程に基づき監査役に報告する。
また、報告を行った取締役及び執行役員並びに使用人に対し、当該報告を行ったことを理由として、不利
な取扱いを行うことを禁止し、その旨を当社グループの取締役及び執行役員並びに使用人に周知徹底する。
・監査役の職務の執行の費用の支払いの方針、その他監査役の監査が実効的に行われることを確保するための
体制
監査役は重要な意思決定のプロセスや業務の執行状況を把握するため、当社グループの取締役会及び主要
な会議に出席する。また、稟議書類等、業務執行に係る重要な文書を閲覧し、当社グループの取締役及び執
行役員並びに使用人に説明を求めることができる。
また、監査役はその独立性と権限により監査の実効性を確保するとともに、内部監査室及び会計監査人と
緊密な連携を保ちながら監査が実効的に行われる体制を構築し運用する。
監査役がその職務の執行について生ずる費用の前払い等の請求をしたときは、当該監査役の職務執行に必
要でないと認められた場合を除き、速やかに処理する。
・財務報告の信頼性を確保するための体制
当社は、当社グループの財務報告の信頼性を確保するための体制を構築し、金融商品取引法その他の関係
法令に基づき有効性を評価して、この体制の強化・充実を図る。内部監査室は会計監査人と連携して、財務
報告に係る内部統制の有効性を継続的に評価し、当社グループは不備があれば速やかに是正するとともに、
取締役会等に報告する。
・反社会的勢力排除に向けた基本的な考え方及びその整備状況
当社は、市民生活の秩序や安全に脅威を与える反社会的勢力及び団体に対しては断固とした姿勢で臨むこ
とを「倫理規程」に掲げ、関係排除に取り組む。反社会的勢力排除に向けた体制は、当社人事総務部を対応
部署とし、事案により関係部署と協議のうえ、組織的に対応する。
また、警察、企業防衛協議会及び弁護士等との情報交換や各種研修への参加等により、外部専門機関との
連携を強化する。
43/116
EDINET提出書類
株式会社遠藤照明(E01986)
有価証券報告書
b.リスク管理体制の整備の状況
当社は、適正な事業運営を行い経営の安定的成長及び経営資源の保全を図るために、業務に関わる全てのリ
スクを適切に管理・統制することが経営上の重要課題の一つであると考えており、リスク管理規程等により当
社グループの各種リスク管理体制の強化に取り組んでおります。
また、顧問弁護士には、法律上の判断を必要とする場合に適宜アドバイスを受けております。
c.責任限定契約の内容の概要
当社は、会社法第427条第1項及び当社定款の規定に基づき、取締役(業務執行取締役であるものを除く)及
び監査役との間において、会社法第423条第1項による損害賠償責任について、責任限定契約を締結しておりま
す。当該契約に基づく責任の限度額は、法令が規定する額としております。
d.役員等賠償責任保険契約の内容の概要
当社は、当社及び子会社・孫会社の取締役、監査役及び執行役員等の主要な業務執行者を被保険者として、
会社法第430条の3第1項に規定する役員等賠償責任保険契約を保険会社との間で締結しております。
当該保険契約では、被保険者である役員等が、その業務につき行った行為(不作為を含む。)に起因して損
害賠償請求がなされたことにより、被保険者が被る損害賠償金や争訟費用等を補償するものです。ただし、贈
収賄などの犯罪行為や意図的に違法行為を行った役員自身の損害等は補償対象外とすることにより、役員等の
職務の執行の適正性が損なわれないように措置を講じております。
なお、保険料は当社が全額負担しております。
e.取締役の定数及び任期
当社は、取締役の定数を12名以内とし、取締役の任期は、選任後1年以内に終了する事業年度のうち最終の
ものに関する定時株主総会の終結の時までとする旨を定款に定めております。
補欠または増員により選任された取締役の任期は、在任取締役の任期の満了する時までとしております。
f.取締役の選任の決議要件
当社は、取締役の選任決議につき、株主総会において議決権を行使することができる株主の議決権の3分の
1以上を有する株主が出席し、その議決権の過半数をもって行う旨を定款で定めております。また、取締役の
選任については、累積投票によらない旨を定款に定めております。
g.株主総会の決議事項を取締役会で決議することができることとしている事項
・自己株式の取得
当社は、自己株式の取得について、会社法第165条第2項の規定により、機動的な資本政策等を遂行するた
め、取締役会の決議によって市場取引等により自己の株式を取得することができる旨を定款で定めておりま
す。
・取締役及び監査役の責任免除
当社は、職務の遂行にあたり期待される役割を十分に発揮できるようにするため、会社法第426条第1項の
規定により、任務を怠ったことによる取締役(取締役であった者を含む。)及び監査役(監査役であったものを
含む。)の損害賠償責任を、法令の限度において、取締役会の決議によって免除することができる旨を定款に
定めております。
・中間配当
当社は、株主への機動的な利益還元ができるよう、取締役会の決議により毎年9月30日を基準日として会
社法第454条第5項に定める中間配当を行うことができる旨を定款に定めております。
h.特別決議
株主総会の決議は、法令または本定款に別段の定めがある場合を除き、出席した議決権を行使することがで
きる株主の議決権の過半数をもって行う旨を定款で定めております。
会社法第309条第2項に定める決議は、議決権を行使することができる株主の議決権の3分の1以上を有する
株主が出席し、その議決権の3分の2以上をもって行う旨を定款で定めております。
44/116
EDINET提出書類
株式会社遠藤照明(E01986)
有価証券報告書
④
取締役会の活動状況
当事業年度において取締役会を19回開催しており、個々の取締役の出席状況については、次のとおりであり
ます。
取締役会
氏名
開催回数
出席回数
遠藤
邦彦
19回
19回
菱谷
清
19回
19回
奥村
昌之
15回
15回
土屋
郁子
15回
15回
山葉
隆久
15回
15回
なお、取締役会での具体的な検討内容の主な事項は以下のとおりです。
・株主総会に関する事項
・取締役会・取締役に関する事項
・決算に関する事項
・経営の基本方針の決定
・株式、資本等に関する事項
・組織再編に関する事項
・規則等の制定、変更、廃止
・重要な人事、給与の事項
・重要な財務事項
・関係会社に関する事項
・法令または定款に定める事項
・その他重要な事項
また、取締役会の意思決定が迅速かつ効率的に行われるよう取締役及び執行役員で構成した経営執行会議は、当
事業年度において12回開催した他、書面決議を2回実施し、取締役会付議事項となる重要案件を事前に協議し、社
外役員においては、必要に応じてオブザーバーとして、出席を行っています。
その他、代表取締役と社外取締役を委員とする指名・報酬諮問委員会は、取締役会の諮問により、取締役会の独
立性・客観性と説明責任を強化するため、当事業年度において5回開催しており、取締役の指名・報酬等につい
て、サクセッションプランの観点等を踏まえ、審議した結果を取締役会に対して答申しております。
経営執行会議
氏名
開催回数
出席回数
遠藤
邦彦
12回
12回
菱谷
清
12回
12回
奥村
昌之
12回
12回
(注)取締役奥村昌之氏は、2025年6月25日開催の第54回定時株主総会において選任されたため、取締
役に選任される以前に執行役員として出席した経営執行会議の回数3回中3回を含んでおります。
指名・報酬諮問委員会
氏名
開催回数
出席回数
遠藤
邦彦
5回
5回
土屋
郁子
3回
3回
山葉
隆久
3回
3回
(注)取締役土屋郁子、取締役山葉隆久の両氏は、2025年6月25日開催の第54回定時株主総会において
選任されたため、指名・報酬諮問委員会の開催回数が異なります。
45/116
EDINET提出書類
株式会社遠藤照明(E01986)
有価証券報告書
(2) 【役員の状況】
①
2026年6月23日(有価証券報告書提出日)現在の当社の役員の状況は、以下のとおりです。
a. 役員一覧
男性8名
女性1名
役職名
(役員のうち女性の比率 11.1%)
氏名
生年月日
遠藤邦彦
1974年4月8日生
菱谷
清
1958年1月8日生
取締役
上席執行役員
営業本部長
奥村昌之
1963年10月15日生
取締役
土屋郁子
1960年3月31日生
取締役
山葉隆久
1959年12月14日生
久保
1961年10月22日生
代表取締役社長
取締役
常務執行役員
開発・品質・生産担当
常勤監査役
常勤監査役
章
杉坂真志
1960年8月29日生
監査役
村井
潤
1961年12月19日生
監査役
奥澤
望
1978年7月7日生
略歴
1997年4月
2001年1月
2006年4月
2006年6月
2007年6月
2010年6月
2014年6月
1980年4月
2016年5月
2016年6月
2022年6月
1988年3月
2016年4月
2025年4月
2025年6月
1983年4月
2000年4月
2012年9月
2022年8月
2025年6月
1982年4月
2010年6月
2022年1月
2025年6月
1985年4月
2015年6月
2021年4月
2023年4月
2023年6月
1984年4月
2005年7月
2008年4月
2022年6月
2025年6月
1993年4月
1997年6月
2015年6月
2003年4月
2007年12月
2011年9月
2011年12月
2019年7月
2023年3月
2025年6月
株式会社富士銀行入行
当社入社
当社経営戦略室長
当社取締役
当社常務取締役
当社代表取締役専務取締役
当社代表取締役社長(現任)
松下冷機株式会社入社
当社入社
当社取締役
当社常務取締役(現任)
当社入社
当社執行役員
当社上席執行役員
当社取締役(現任)
プラス株式会社入社
アスクル株式会社入社
同社リーガル&セキュリティ本部執行役員本部長
株式会社Hacobu社外監査役(現任)
当社取締役(現任)
沖電気工業株式会社入社
ローム株式会社常務取締役
Yamaha Labo代表
当社取締役(現任)
松下電器産業株式会社入社
パナソニック株式会社アプライアンス社内部統制推
進室国内流通担当部長兼パナソニックコンシュー
マーマーケティング株式会社監査役
パナソニックETソリューションズ株式会社取締役・
経営管理担当
当社入社
当社常勤監査役(現任)
当社入社
イーシームズ株式会社(出向)取締役
同社代表取締役社長
当社取締役
当社常勤監査役(現任)
弁護士登録(大阪弁護士会)
村井法律事務所弁護士(現任)
当社監査役(現任)
ソニー株式会社入社
仰星監査法人入所
公認会計士登録
税理士登録
リードアカウンティング株式会社設立代表取締役
(現任)
税理士法人スタートミー設立代表社員(現任)
当社監査役(現任)
計
所有
任期株式数
(千株)
注4
143
注4
1
注4
13
注4
−
注4
−
注5
−
注6
2
注5
0
注7
−
159
(注) 1.所有株式数は、千株未満を切り捨てて表示しております。
2.取締役土屋郁子及び山葉隆久は、社外取締役であります。
3.監査役村井潤及び奥澤望は、社外監査役であります。
4.2025年3月期に係る定時株主総会終結の時から、2026年3月期に係る定時株主総会終結の時まででありま
す。
5.2023年3月期に係る定時株主総会終結の時から、2027年3月期に係る定時株主総会終結の時まででありま
す。
6.2025年3月期に係る定時株主総会終結の時から、2029年3月期に係る定時株主総会終結の時まででありま
す。
7.前任者の辞任に伴う就任であるため、当社の定款の定めにより、前任者の任期満了の時までであります。な
お、前任者の任期は、2023年3月期に係る定時株主総会終結の時から、2027年3月期に係る定時株主総会終
結の時までであります。
46/116
EDINET提出書類
株式会社遠藤照明(E01986)
有価証券報告書
8.取締役兼務者含む執行役員体制は以下のとおりであります。
地
氏
名
取締役
常務執行役員
取締役
上席執行役員
位
担
当
菱谷
清
奥村
昌之
営業本部長
上席執行役員
後藤
修二
管理本部長兼人事総務部長
上席執行役員
三沢
広実
中央研究所長兼特注部長
執行役員
鍛冶谷
栄司
営業本部東京営業統括部長
執行役員
細井
秀人
営業本部大阪営業統括部長兼大阪営業部長
執行役員
小川
佳洋
営業本部営業企画統括部長
執行役員
髙島
康行
営業本部特機開発統括部長兼特機開発部長
執行役員
大島
雄太
海外本部長兼 ENDO Lighting (THAILAND) Public
Co.,Ltd. 代表取締役社長兼 ENDO Lighting SE Asia
Pte.Ltd.代表取締役社長
執行役員
永山
惠一
イーシームズ株式会社
執行役員
嶋田
夏樹
生産統括部長
執行役員
眞島
久美子
営業本部環境ソリューション統括部長
執行役員
浅野
大輔
営業本部東京商環境統括部長
開発・品質・生産担当
代表取締役社長
9.当社は法令に定める監査役の員数を欠くことになる場合に備え、補欠監査役1名を選任しております。補欠
監査役の略歴は次のとおりであります。
氏名
坂田秀隆
生年月日
1959年11月29日生
略歴
1982年4月
1984年10月
1988年3月
1997年6月
2019年1月
2020年6月
坂田秀治会計事務所入所
等松・青木監査法人入所
公認会計士登録
監査法人トーマツ事業開発部
株式会社MAGIC代表取締役(現任)
dep.FAS合同会社代表社員
47/116
所有
株式数
(千株)
−
EDINET提出書類
株式会社遠藤照明(E01986)
有価証券報告書
b.
社外役員の状況
当社は社外取締役2名と、社外監査役2名を置いております。
社外取締役土屋郁子は、プラス株式会社を経て 2000年よりアスクル株式会社にて法務・セキュリティ部門の要
職を歴任し 、2012年に執行役員本部長、2018年にはCEO補佐室執行役員統括部長に就任するなど 、事業会社に
おける豊富なキャリアを通じて高度な専門知識と経営補佐に関する深い知見を有しております 。また、他の事業
会社での監査役経験も有していることから 、2025年6月より当社社外取締役に選任しております。なお、当社と
同氏、および同氏が社外監査役を務める株式会社Hacobuとの間には 、人的関係、資本的関係及び重要な取引関係
その他の利害関係はなく、独立性を有するものと考え、社外取締役として選任しております。
社外取締役山葉隆久は、沖電気工業株式会社、ヤマハ株式会社を経て、ローム株式会社常務取締役、サムコ株
式会社取締役常務執行役員等の要職を歴任し、2020年からは新日本無線株式会社常務執行役員や大阪大学産業科
学研究所特任教授を務めるなど、電子部品、特に半導体産業の事業会社における豊富な経験と幅広い見識を有し
ていることから、2025年6月より当社社外取締役に選任しております。なお、当社と同氏、および同氏が代表を
務めるYamaha Laboとの間には、人的関係、資本的関係及び重要な取引関係その他の利害関係はなく 、独立性を
有するものと考え、社外取締役として選任しております。
社外監査役村井潤は、1993年4月大阪弁護士会に登録をし、久保井法律事務所(現久保井総合法律事務所)での
弁護士経験を経て、1997年6月村井法律事務所を開設しており、長年にわたる弁護士としての経験を有しており
ます。また、ケイエス冷凍食品株式会社での社外監査役、及び大阪府信用農業協同組合連合会での員外監事とし
ての経験も有しており、2015年6月より当社社外監査役として就任し、主に法務面を中心とした監査を実施して
おります。法律の専門家としての豊かな経験と高い見識に基づき、広い視野で監査いただくため、社外監査役と
して選任しております。同氏は、弁護士資格に加えて2023年には公認不正検査士(CFE)の資格を取得しておりま
す。なお、同氏は2025年3月末時点において、当社の株式500株を保有しておりますが、その重要性はないものと
判断しております。当社と同氏の間には人的関係、資本的関係及び重要な取引関係その他の利害関係はありませ
ん。
社外監査役の奥澤望氏は、2007年12月に仰星監査法人に入所後、2011年9月に公認会計士、同年12月に税理士と
して登録いたしました。その後、2019年7月にリードアカウンティング株式会社を設立して代表取締役に就任。さ
らに2023年3月には税理士法人スタートミーを設立して代表社員に就任し、現在は両社の代表を務めております。
監査法人での豊富な経験と公認会計士、税理士としての資格を有し、企業会計、税制・会計監査・内部統制に精
通し、エンジニアの経験があり、IT関係にも熟知しております。また、他の監査等委員会設置会社での取締役経
験も有しており、その幅広い経験と高い見識に基づき、広い視野で監査いただけるものと判断しております。当
社と同氏の間には、人的関係、資本的関係及び重要な取引関係その他の利害関係はありません。以上のことか
ら、独立性を有するものと考え、社外監査役として選任しております。
当社の独立役員選任方針は、一般株主と利益相反が生じることが無いよう、東京証券取引所の独立役員の独立
性に関する判断基準等を参考にし、社外役員候補者の経歴や当社との関係を踏まえて、社外役員としての職務を
遂行するに充分な独立性が確保できることを個別に判断しております。
以上のとおり、当社の社外取締役及び社外監査役は高い見識を有しており、それぞれが客観的・中立的な立場
から発言をする等して、経営の監督及び監視と牽制の役割を果たしております。
c.
社外取締役又は社外監査役による監督又は監査と内部監査、監査役監査及び会計監査との相互連携並びに内部
統制部門との関係
当社では、社外取締役及び社外監査役が出席する取締役会、監査役会及びその他重要な会議等を通じ、各監査
の報告を受け必要に応じて意見を述べることにより、各監査と連携した監督及び監査の機能を果たしておりま
す。
さらに、社外取締役は、監査役との連携を図るため3か月に1回、監査役会に出席して意見交換等を行ってお
ります。また、社外監査役は、常勤監査役と内部監査室とが毎月開催している監査情報交換会の報告を受けるこ
と等により、監査の実効性を高めております。加えて、社外取締役と社外監査役は、社外役員懇談会を形成し、
四半期毎に代表取締役ほか業務執行取締役との懇談会を実施し、その場で経営の実態をヒアリングすると同時に
自由闊達な意見交換を行うようにしております。
48/116
EDINET提出書類
株式会社遠藤照明(E01986)
有価証券報告書
(3) 【監査の状況】
① 監査役監査の状況
a.組織、人員、手続
有価証券報告書提出日現在、当社の監査役会は、監査役4名で構成されており、各監査役の状況及び当事業年
度に開催した監査役会及び取締役会への出席状況は、次のとおりであります。
出席状況(出席率)
氏名
監査役会
経歴等
取締役会
製造会社において、経理・財務部門の経験が豊富で内部統
制部門の経験もあり、財務・会計及び監査に関する相当程
度の知見を有しております。
当社の営業本部長、管理本部長を歴任し、当社グループの
15回
15回
常勤監査役
事業に深く精通しており、経営全般の監査の職責を適切に
杉坂真志
(100%)
(100%)
遂行できる知見を有しております。
弁護士として法曹界での豊富な経験を有しており、また民
18回
19回
非常勤監査役(独立社外)
間会社で社外監査役等の経験もあることから、コーポレー
村井
潤
(100%)
(100%)
ト・ガバナンスの専門的知見を有しております。
公認会計士・税理士の資格を有し、ほかの監査等委員会設
15回
15回
非常勤監査役(独立社外)
置会社での社外取締役の経験もあることから、財務・会
奥澤
望
計・税務・内部統制・ITデジタル等の専門的知見を有して
(100%)
(100%)
おります。
(注) 監査役の杉坂真志氏は、前職が取締役であることから、前職時を含めると取締役会は、19回出席しておりま
す。
常勤監査役
久保
章
18回
(100%)
19回
(100%)
監査役監査は、監査役が監査役会の規則として整備した「監査役会規則」「監査役会監査基準」「内部統制シ
ステムに係る監査の実施基準」「会計監査人の選解任等の決定に関する監査役会の対応指針」に定める監査手続
に準拠して、期初に策定する「監査役会の基本方針と体制」で各監査役の役割分担を決めております。更に、事
業年度ごとに作成する「監査計画」では重点監査項目を、「監査活動計画」では監査日程を決めております。
b.監査役会の活動状況
監査役会は、取締役会に先立って毎月1回開催し、必要な場合は随時開催しております。また、Web会議の
手法を幅広く活用するなどして、監査役活動の確保に努めました。監査役会は18回開催(臨時6回を含む)してお
り、監査役会1回あたりの所要時間は1時間11分(臨時監査役会除く1時間24分)となりました。昨年度より第1・
第3四半期決算の監査法人レビューは任意となりましたが、当社では継続して実施しており、監査役会としてレ
ビュー結果を確認し取締役会で報告しました。その為、7月・1月の決算発表前に臨時監査役会を開催しており
ます。
また、今期は特別な対応として、㈱アドバンテッジパートナーズとの事業提携及び無担保転換社債型新株予約
権付社債の発行に関しての臨時監査役会を10月に3回実施しました。従って、6月株主総会後の臨時監査役会を
含め6回の臨時監査役会を開催しました。
監査役会は、当事業年度の「監査計画」を検討した結果、(1)連結経営(2)内部統制システムの整備(構築と運
用)(3)リスクマネジメントの推進(4)コンプライアンス(規程等の遵守状況)の4項目の状況確認を、主要な監
査項目と定めました。また、提案型監査を意識した「監査活動計画」を検討し、(1)重要な会議への参加(取締役
会・経営執行会議・サステナビリティ委員会・コンプライアンスリスク管理委員会・各部門検討会・子会社取締
役会・子会社経営検討会・その他の主要な会議への出席)(2)監査法人との連携(監査法人との定期的な会合・必
要に応じた打合せ)(3)内部監査室との連携(J-SOX会議・監査情報交換会)(4)代表取締役ほか業務執行取締
役と四半期毎の懇談(社外監査役が事務局となり社外役員懇談会として実施)、社外取締役との連携(社外取締
役を四半期毎に監査役会に招聘)(5)監査役会の開催 (6)情報共有化の実施(常勤監査役により部門・営業所・子
会社往査等を積極的に実施し、監査役会を通して情報の共有化を図る)の6項目の活動日程を定め実施しまし
た。
常勤監査役は、社長との懇談会を四半期毎に設定し、活動報告及び意見交換を実施しております。また、その
内容は、監査役会にて社外監査役にも共有するとともに、社外取締役にも四半期毎に監査役会に参加頂き、情報
の共有化を図り、活発な意見交換を行っております。監査役会の活動は、常勤・非常勤を問わず四半期毎に取締
役会にて各人から報告を行い、独任制を重視した運営を行い、各監査役がガバナンス強化に努めております。
49/116
EDINET提出書類
株式会社遠藤照明(E01986)
有価証券報告書
c.監査役の主な活動
今期から常勤監査役は、2名体制となり、1名は製造部門及び海外会社を担当し、1名は国内営業を中心に国
内部門を担当するように担当を分けて幅広く現場に密着した往査を実施致しました。具体的には、国内事業所や
海外会社への往査及び関係部門へのヒアリング等の活動を通じて幅広い情報を収集するとともに、コンプライア
ンス違反はないか、内部統制システムの整備状況の監視・検証に当たり、監査役会等において往査結果を報告し
て、社外監査役、社外取締役、内部監査室、管理本部及び監査法人との情報共有に努めております。また、財
務・会計及び監査に関する相当程度の知見を有するものとして、当社グループの経営全般を監査して、当社や子
会社の取締役会等で適宜意見を述べ助言等を行っております。
非常勤監査役は、取締役会、監査役会、経営執行会議、サステナビリティ委員会及びコンプライアンスリスク
管理委員会その他の会議にWeb会議の手法も活用して積極的に出席しております。また、社外取締役全員及び
社外監査役全員とで社外役員懇談会を組成し、その事務局を担当して代表取締役ほか業務執行取締役と四半期毎
に懇談会を実施し、自由闊達な情報交換・意見交換を行い、各業務執行取締役との対話を通じて相互理解を深め
るとともに、リスクコントロールを図るなどしました。また、情報セキュリティやDX推進のモニタリングのた
めに情報システム部門との面談を実施しました。それぞれの監査役が有する専門的な知見を活かして、社外監査
役としての客観的立場から当社や子会社の取締役会等重要会議で適宜意見を述べ助言等を行っております。
なお、今期は常勤監査役2名・非常勤監査役2名の4名体制となり、非常勤社外監査役は、弁護士・公認会計
士となり、法律・会計の専門家としての意見を述べております。
②
内部監査の状況
内部監査につきましては、代表取締役社長の直轄部門である内部監査室(員数:4名)が、会社の経営目標の
効果的な達成に資することを目的として、合法性及び合理性の観点から公正かつ独立の立場で、ガバナンスプロ
セス、リスクマネジメント及びリスクコントロールに関連する経営諸活動の遂行状況を、内部監査人としての規
律遵守の態度をもって評価しております。これに基づいて客観的意見を述べ、助言・勧告を行うアシュアランス
業務及び特定の経営諸活動の支援を行うアドバイザリー業務を行うことを基本方針に掲げて、当社グループ全体
の監査を実施しております。その活動方針及び結果は、取締役会に報告しております。
内部監査、監査役監査及び会計監査の相互連携につきましては、内部監査室は、監査役と監査情報交換会を毎
月1回開催し、業務監査及び内部統制監査の状況を報告するとともに、双方の情報及び意見を交換するなど、連
携を深めながら監査を実施しております。また、内部監査室は、財務報告に係る内部統制監査を実施する中で、
会計監査人である監査法人と監査情報の交換及び内部統制評価に関する意見交換を行うなど、連携を維持しなが
ら効率的な監査に努めております。さらに、三様監査の取組の一環として、年5回開催される監査役会と監査法
人との会合に内部監査室長が出席し、情報共有及び意見交換を行っております。
内部監査の実効性を確保するための取組につきましては、内部監査室は、内部監査規程に基づき業務の適正性
を監査するとともに、財務報告に係る内部統制監査として、内部統制報告書に記載されている全社的な内部統制
及び業務プロセスに係る内部統制の評価を行っております。これらの内部監査の結果につきましては、代表取締
役社長のみならず、取締役会及び監査役会へ報告するとともに、必要に応じて直接課題提起及び改善提案を行う
ことで、内部統制システムの強化に努めております。
③
会計監査の状況
a. 監査法人の名称
太陽有限責任監査法人
b. 継続監査期間
37年間
(注)上記記載の期間は、調査が著しく困難であったため、当社が株式上場した以後の期間について調査した結果
について記載したものであり、継続監査期間はこの期間を超える可能性があります。
c. 業務を執行した公認会計士
指定有限責任社員業務執行社員
指定有限責任社員業務執行社員
公認会計士
公認会計士
荒井
有久
巌
衛
d. 監査業務に係る補助者の構成
当社の会計監査業務に係る補助者は、公認会計士4名、その他13名であり、会計監査につきましては当社は太
陽有限責任監査法人と監査契約を締結し、会社法監査及び金融商品取引法監査を受けております。太陽有限責任
監査法人は、独立の第三者としての立場から財務諸表監査を実施し、当社は監査結果の報告を受けております。
50/116
EDINET提出書類
株式会社遠藤照明(E01986)
有価証券報告書
e. 監査法人の選定方針と理由
当社は、会計監査人の選定及び評価に際しては、当社の広範な業務内容に対応して効率的な監査業務を実施す
ることができる一定の規模を有し、審査体制が整備されていること、監査日数、監査期間及び具体的な監査実施
要領並びに監査費用が合理的かつ妥当であること、さらに監査実績などにより総合的に判断しております。ま
た、日本公認会計士協会の定める「独立性に関する指針」に基づき独立性を有することを確認するとともに、必
要な専門性を有することについて検証し、確認しております。
(会計監査人の解任又は不再任の決定の方針)
会計監査人が会社法第340条第1項各号のいずれかに該当すると認められる場合には、監査役会は監査役全員の
同意により会計監査人を解任いたします。
上記の場合のほか、会計監査人が職務を適切に遂行することが困難であると認められる場合、または監査の適
正性をより高めるために会計監査人の変更が妥当であると判断される場合には、監査役会は、会計監査人の選任
及び解任並びに会計監査人を再任しないことに関する株主総会の議案の内容を決定いたします。
f. 監査役及び監査役会による監査法人の評価
当社監査役及び監査役会は、事業年度ごとに会計監査人を評価し、会計監査は従前から適正に行われているこ
とを確認しております。また、会計監査人からその職務の執行状況について適宜報告を受け、必要に応じて説明
を求めております。
監査役会は、事業年度ごとに会計監査人の職務執行状況等を総合的に評価して再任に関する決議をしており、
その際には日本監査役協会が公表する「会計監査人の選解任等に関する議案の内容の決定権行使に関する監査役
の対応指針」及び「会計監査人の評価及び選定基準策定に関する監査役等の実務指針」に準拠して制定した「会
計監査人の選解任等の決定に関する監査役会の対応指針」及び「質問表−監査法人の評価項目について−」の手
続に沿って、経理部門・内部監査部門等の監査対応部署からの報告及び会計監査人から回答された「質問表−監
査法人の評価項目について−」の記入内容等に基づいて、下記の具体的要素を検証し評価しております。
・監査活動の相当性(適正性・妥当性)
・監査実施の有効性・効率性
・監査品質
・品質管理体制・独立性
・専門性
・総合的能力
④ 監査報酬の内容等
a. 監査公認会計士等に対する報酬
前連結会計年度
区
分
当連結会計年度
監査証明業務に
基づく報酬(百万円)
非監査業務に
基づく報酬(百万円)
監査証明業務に
基づく報酬(百万円)
非監査業務に
基づく報酬(百万円)
提出会社
34
−
34
−
計
34
−
34
−
b. 監査公認会計士等と同一のネットワーク(Grant Thornton International Limited)に属する組織(a.を除く)
前連結会計年度
区
分
当連結会計年度
監査証明業務に
基づく報酬(百万円)
非監査業務に
基づく報酬(百万円)
監査証明業務に
基づく報酬(百万円)
非監査業務に
基づく報酬(百万円)
提出会社
−
−
−
1
連結子会社
−
2
−
1
計
−
2
−
3
当社における非監査業務の内容は、税務レビュー業務等に基づく報酬です。
また、連結子会社における非監査業務の内容は、税務レビュー業務等に基づく報酬です。
c. その他の重要な監査証明業務に基づく報酬の内容
該当事項はありません。
51/116
EDINET提出書類
株式会社遠藤照明(E01986)
有価証券報告書
d. 監査報酬の決定方針
当社の監査公認会計士等に対する監査報酬の決定方針は、会計監査人の選解任等の決定に関する監査役会の対
応指針に基づき監査役会が行なう評価結果に沿って、当社の規模や業種、監査日数等を勘案した上で、監査役会
の同意を得て決定することとしております。
e. 監査役会が会計監査人の報酬等に同意した理由
取締役会が提案した会計監査人に対する報酬等に対して、監査役会は、取締役、社内関係部署及び会計監査人
から必要な資料を入手し報告を聴取のうえ、会計監査人の監査計画の内容、従前の事業年度における職務執行状
況や報酬見積りの算出根拠などを確認し、検討した結果、会計監査人の報酬等について同意しておりま
す。
(4) 【役員の報酬等】
①
役員の報酬等の額又はその算定方法の決定に関する方針に係る事項
当社は、2025年5月19日開催の取締役会において「取締役の個人別の報酬等の内容に係る決定方針」を決議
いたしました。その内容は以下のとおりであります。
a. 基本方針
当社の取締役の報酬は、企業価値の持続的な向上を図ることの意欲を高めるとともに、インセンティブとし
て十分に機能するよう株主利益と連動した報酬体系とし、個々の取締役の職責及び実績、経営内容や経済情勢
を勘案して、総合的に決定することを基本方針とする。
具体的には、業務執行取締役の報酬は、固定報酬としての基本報酬と業績連動報酬、本定時株主総会での承
認可決を条件として導入する譲渡制限付株式報酬により構成し、監督機能を担う社外取締役については、その
職務に鑑み、基本報酬のみを支給する。
b. 基本報酬の個人別の報酬等の額の決定に関する方針(報酬等を与える時期または条件の決定に関する方針
を含む。)
取締役の基本報酬は、月例の固定報酬(金銭報酬)として支給し、役位、職責、在任年数に応じて他社水
準、当社の業績、執行役員の報酬、従業員給与の水準を考慮しながら、経営内容や経済情勢を勘案して決定す
る。
c. 業績連動報酬等の内容および額の算定方法の決定に関する方針(報酬等を与える時期または条件の決定に
関する方針を含む。)
業績連動報酬は、利益の最大化および企業の持続可能性の担保が株主価値向上に資するとの考えから、経常
利益及びサステナビリティ経営の進捗を重視し、事業年度ごとの価値向上に対する意識を高めるための指標に
より算出された役位別の基準額に、個人計画達成度係数等を乗じた報酬額を、毎年、一定の時期に金銭報酬で
支給する。
d. 非金銭報酬等の内容および額の算定方法の決定に関する方針(報酬等を与える時期または条件の決定に関
する方針を含む。)
非金銭報酬は、毎年一定の時期に支給する譲渡制限付株式とし、各取締役に対する個別付与株式数は各取締
役の役位、職責に応じて基本報酬の金額等を考慮しながら総合的に勘案して決定する。
e. 基本報酬の額、業績連動報酬等の額、譲渡制限付株式報酬の額の取締役の個人別の報酬等の額に対する割
合の決定に関する方針
業績連動報酬は、経常利益等に基づき基本報酬と別枠で支給するものとし、基本報酬と業績連動報酬と譲渡
制限付株式報酬の支給割合は、株主と経営者の利害を共有し、企業価値の持続的な向上に寄与するために、最
も適切な割合となることを方針とする。
f. 取締役の個人別の報酬等の内容についての決定に関する事項
取締役の個人別の報酬額は、取締役会が指名・報酬諮問委員会に原案を諮問し答申を得て、その具体的内容
の決定は代表取締役社長遠藤邦彦氏に委任する。
委任を受けた代表取締役社長は、当該答申内容を考慮して、各取締役の基本報酬の額および各取締役(社外
取締役を除く。)の業績連動報酬の評価を実施し、報酬額を決定する。
52/116
EDINET提出書類
株式会社遠藤照明(E01986)
有価証券報告書
当社は、取締役の報酬等の額を年額2億円以内、業務執行取締役に対する業績連動報酬については、連結経
常利益の1.5%の範囲内で支給するものとし、上記年額2億円以内とは別枠で年額1億円以内となっておりま
す。
業績連動報酬等は、事業年度ごとの業績向上に対する意識を高めるため業績指標を反映した金銭報酬とし、
各事業年度の連結経常利益および経常利益に応じて社内基準により算出された額を支給しております。なお、
当事業年度における業績連動報酬等に係る指標の実績は第55期連結経常利益5,935百万円、経常利益3,235百万
円となっております。
また、2025年5月19日開催の取締役会において決議しました当社の取締役(社外取締役を除く)に対する譲
渡制限付株式報酬制度の概要は、以下のとおりです。
当社は、役員報酬制度の見直しの一環として、当社の取締役(社外取締役を除く。以下「対象取締役」とい
う。)に当社の企業価値の持続的な向上を図るインセンティブを与えるとともに、株主の皆様との一層の価値
共有を進めることを目的として、上記の報酬枠とは別枠にて、対象取締役に対して、新たに譲渡制限付株式の
付与のための報酬を支給するものです。
対象取締役に対して譲渡制限付株式の付与のために支給する報酬は金銭債権とし、その総額は、年額1億円
以内(ただし、使用人兼務取締役の使用人分給与を含まない。)といたします。また、各対象取締役への具体
的な支給時期及び配分については、取締役会において決定することといたします。
対象取締役は、当社の取締役会決議に基づき、本議案により支給される金銭債権の全部を現物出資財産とし
て払い込み、当社の普通株式について発行又は処分を受けるものとし、これにより発行又は処分をされる当社
の普通株式の総数は年75,000株以内(ただし、本議案が承認可決された日以降、当社の普通株式の株式分割
(当社の普通株式の無償割当てを含む。)又は株式併合が行われた場合その他譲渡制限付株式として発行又は
処分をされる当社の普通株式の総数の調整が必要な事由が生じた場合には、当該総数を、合理的な範囲で調整
する。)といたします。
役員の報酬等の額又はその算定方法の決定に関する方針を決定する機関と手続の概要
②
当社の取締役及び監査役の報酬等に関する株主総会の決議は、1990年6月28日開催の第19回定時株主総会で
決議し、その内容は、取締役の年間報酬総額を2億円以内、監査役の年間報酬総額を5,000万円以内としており
ます。なお、第19回定時株主総会終結時点での取締役の員数は10名、監査役の員数は3名であります。
また、業務執行取締役に対する業績連動報酬に関する株主総会の決議は、2014年6月27日開催の第43回定時
株主総会で決議し、その内容は、業績連動報酬は連結経常利益の1.5%の範囲内で支給するものとし、その上限
額は年額2億円以内とは別枠で年額1億円以内としております。なお、第43回定時株主総会終結時点での取締
役の員数は12名、監査役の員数は4名であります。
当事業年度における報酬等の決定過程にかかる取締役会及び指名・報酬諮問委員会の活動としては、2025年
6月17日の指名・報酬諮問委員会における審議結果にもとづき、2025年6月25日開催の取締役会において各取
締役の報酬等を決定しております。
なお、監査役の報酬につきましては、基本報酬のみとし、各監査役の報酬については株主総会の決議により
承認された限度額の範囲内において監査役の協議により決定いたします。
③
提出会社の役員区分ごとの報酬等の総額、報酬等の種類別の総額及び対象となる役員の員数
役員区分
取締役
(社外取締役を除く。)
監査役
(社外監査役を除く。)
社外役員
報酬等の総額
(百万円)
報酬等の種類別の総額(百万円)
固定報酬
業績連動報酬
退職慰労金
譲渡制限付
株式報酬
対象となる
役員の員数
(名)
175
68
41
54
11
4
22
22
−
0
−
2
15
15
−
0
−
7
(注)
退職慰労金については、当連結会計年度に係る役員退職慰労引当金繰入額に計上した役員退職慰労金(功労
加算金)の合計額を記載しております。
④ 役員ごとの連結報酬等の総額等
(注)連結報酬等の総額が1億円以上である者が存在しないため、記載しておりません。
53/116
EDINET提出書類
株式会社遠藤照明(E01986)
有価証券報告書
(5) 【株式の保有状況】
①
投資株式の区分の基準及び考え方
当社は、株式の価値の変動または株式に係る配当によって利益を受けることを目的とする投資を純投資目的で
ある投資株式とし、それ以外を純投資目的以外の株式とし、取引先との取引関係の強化、当社の企業価値向上に
つなげることを目的として保有しております。
②
保有目的が純投資目的以外の目的である投資株式
a.保有方針及び保有の合理性を検証する方法並びに個別銘柄の保有の適否に関する取締役会等における検証の
内容
政策保有株式の継続・拡充・縮小・廃止については、取締役会において定期的に保有による便益やリスクが
資本コストに見合っているか等を個別に精査、検証し、審議しています。
また、株主価値が大きく毀損される事態やコーポレート・ガバナンス上の重大な懸念事項が生じている場合
などを除き、政策保有株式に係る議決権の行使にあたっては、取引先との関係強化に生かす方向で議決権を行
使しております。
b.銘柄数及び貸借対照表計上額
銘柄数
(銘柄)
貸借対照表計上額の
合計額(百万円)
非上場株式
1
12
非上場株式以外の株式
5
69
(当事業年度において株式数が増加した銘柄)
銘柄数
(銘柄)
株式数の増加に係る取得
価額の合計額(百万円)
非上場株式
非上場株式以外の株式
2
1
(当事業年度において株式数が減少した銘柄)
銘柄数
(銘柄)
株式数の減少に係る売却
価額の合計額(百万円)
非上場株式
非上場株式以外の株式
54/116
株式数の増加の理由
−
企業間取引強化のため
EDINET提出書類
株式会社遠藤照明(E01986)
有価証券報告書
c.特定投資株式及びみなし保有株式の銘柄ごとの株式数、貸借対照表計上額等に関する情報
特定投資株式
銘柄
当事業年度
前事業年度
株式数(株)
株式数(株)
保有目的、業務提携等の概要、
定量的な保有効果
及び株式数が増加した理由
当社の株
式の保有
の有無
当該株式については、同社との企業間取
引の関係強化のため保有しており、取締
役会で定期的に保有による便益やリスク
が資本コストに見合っているか等を精
査、検証しています。
株式数が増加した理由は、取引先持株会
を通じて株式取得したためであります。
無
貸借対照表計上額貸借対照表計上額
(百万円)
(百万円)
16,983
15,974
株式会社AOKIホー
ルディングス
27
20
10,000
10,000
24
19
11,600
2,900
株式会社オカムラ
第一生命ホールディン
グス株式会社
(注)
16
13
200
100
因幡電機産業株式会社
0
0
210
202
株式会社オンワード
ホールディングス
0
0
当該株式については、同社との企業間取
引の関係強化のため保有しており、取締
役会で定期的に保有による便益やリスク
が資本コストに見合っているか等を精
査、検証しています。
当該株式については、同社との企業間取
引の関係強化のため保有しており、取締
役会で定期的に保有による便益やリスク
が資本コストに見合っているか等を精
査、検証しています。
株式数が増加した理由は、2025年4月1
日付の株式分割(1株を4株)によるも
のであります。
当該株式については、同社との企業間取
引の関係強化のため保有しており、取締
役会で定期的に保有による便益やリスク
が資本コストに見合っているか等を精
査、検証しています。
株式数が増加した理由は、取引先持株会
を通じての株式取得及び、2025年11月30
日付の株式分割(1株を2株)によるも
のであります。
当該株式については、同社との企業間取
引の関係強化のため保有しており、取締
役会で定期的に保有による便益やリスク
が資本コストに見合っているか等を精
査、検証しています。
株式数が増加した理由は、取引先持株会
を通じて株式取得したためであります。
有
無
無
無
(注) 第一生命ホールディングス株式会社は、2026年4月1日付で、株式会社第一ライフグループに商号変更して
おります。
みなし保有株式
該当事項はありません。
③
保有目的が純投資目的である投資株式
該当事項はありません。
④
当事業年度に投資株式の保有目的を純投資目的から純投資目的以外の目的に変更したもの
該当事項はありません。
⑤
当事業年度の前4事業年度及び当事業年度に投資株式の保有目的を純投資目的以外の目的から純投資目的に変
更したもの
該当事項はありません。
55/116
EDINET提出書類
株式会社遠藤照明(E01986)
有価証券報告書
5 【従業員の状況等】
(1) 【人材戦略に関する基本方針等】
人的資本に関する方針
当社グループでは、「個と組織の調和と永続」を経営目的に掲げ、社員と組織が目標を共有し、共に成長できる組織
を目指しています。人的資本については、以下の考えに基づき取り組みを推進しています。
(経営戦略に連動する人材戦略)
長期ビジョンである「エシカルソリューション No.1リーディングカンパニーへ」の実現に向け、「中期経営計画
2025-2027」において、企業戦略を支える経営基盤の強化として「ソリューション人材」の育成と「社員の活躍が組織
の持続的成長を生み出す組織」づくりを掲げております。事業成長の根幹となる「新たな照明ソリューションの創
造」を実現するため、人材・組織づくりの強化に向けた制度変更や積極投資を進める方針です。
(提出会社の従業員給与等の決定方針)
当社の従業員の給与等は、『役割』を基軸とする役割等級制度に基づき、社員に求める役割を成果の質・難易度及
び責任の度合いなどによって職群別・グレード別に明らかにし、目標及び職責を効果的に評価し決定しています。中
期経営計画で掲げる「公正な評価制度と成果に報いるインセンティブ制度の実現」との連動により、従業員エンゲー
ジメントの向上を図ると共に、経営理念の実現及び会社目標の継続的な達成を目指しています。
(2) 【従業員の状況】
① 連結会社の状況
セグメント別の従業員数を示すと次のとおりであります。
2026年3月31日現在
セグメントの名称
従業員数(名)
1,502
(113)
77
(13)
20
(7)
49
(18)
1,648
(151)
照明器具関連事業
環境関連事業
インテリア家具事業
全社(共通)
合計
(注) 1.従業員数欄の(外書)は、臨時従業員の年間平均雇用人員であります。
2.臨時従業員は、パートタイマー及び嘱託契約の従業員を含み、派遣社員を除いております。
3.全社(共通)は、総務及び経理等の管理部門の従業員であります。
② 提出会社の状況
従業員数(名)
平均年齢(歳)
508(105)
41.6
平均勤続年数(年)
平均年間給与(千円)
12.8
6,729
セグメントの名称
2026年3月31日現在
平均年間給与の対前
事業年度増減率(%)
6.3
従業員数(名)
439
(80)
20
(7)
49
(18)
508
(105)
照明器具関連事業
インテリア家具事業
全社(共通)
合計
(注) 1.従業員数は、当社から他社への出向者を除く就業人員数であります。
2.従業員数欄の(外書)は、臨時従業員の年間平均雇用人員であります。
3.臨時従業員は、パートタイマー及び嘱託契約の従業員を含み、派遣社員を除いております。
4.平均年間給与は、賞与及び基準外賃金を含んでおり、支給対象期間1年未満の者を除いております。
5.全社(共通)は、総務及び経理等の管理部門の従業員であります。
56/116
EDINET提出書類
株式会社遠藤照明(E01986)
有価証券報告書
③ 労働組合の状況
労働組合は結成されておりませんが、労使関係については良好であります。
④ 管理職に占める女性労働者の割合、男性労働者の育児休業取得率及び労働者の男女の賃金の差異
a. 提出会社
当事業年度
管理職に占める
女性労働者の割合
(%)
11.5
男性労働者の
育児休業取得率
(%)
労働者の男女の賃金の差異(%)
全労働者
106.3
正規雇用労働者
72.9
パート・有期労働者
74.7
48.5
(注) 1.「女性の職業生活における活躍の推進に関する法律」(平成27年法律第64号)の規定に基づき算出したもの
であります。
2.「育児休業、介護休業等育児又は家族介護を行う労働者の福祉に関する法律」(平成3年法律第76号)の規
定に基づき、「育児休業、介護休業等育児又は家族介護を行う労働者の福祉に関する法律施行規則」(平成
3年労働省令第25号)第71条の6第2号における育児休業等及び育児目的休暇の取得割合を算出したもので
あります。
3.育休取得率は、当該年度の育休対象社員(年度内に子どもが生まれた人数)に対して当該年度に育休を取得
した社員数の割合で算出しています。過年度に配偶者が出産し、当該年度に育児休業を取得した男性社員が
含まれるため、取得率が100%を超えることがあります。
4.男女の賃金格差については、男性の賃金に対する女性の賃金の割合を示しております。なお、同一労働の賃
金に差はなく、等級別人数構成の差によるものであります。出向者は、出向先の従業員として集計しており
ます。
5.労働者の賃金は、賞与及び基準外賃金を含んでおり、支給対象期間1年未満の者を除いております。
b.
連結会社の状況
当事業年度
名称
イーシームズ㈱
管理職に占める
女性労働者
の割合(%)
20.0
男性労働者の
育児休業
取得率(%)
100.0
労働者の男女の
賃金の差異(%)
全労働者
70.1
正規雇用
労働者
74.0
パート・
有期労働者
43.8
(注) 1.「女性の職業生活における活躍の推進に関する法律」(平成27年法律第64号)の規定に基づき算出したもの
であります。
2.「育児休業、介護休業等育児又は家族介護を行う労働者の福祉に関する法律」(平成3年法律第76号)の規
定に基づき、「育児休業、介護休業等育児又は家族介護を行う労働者の福祉に関する法律施行規則」(平成
3年労働省令第25号)第71条の6第2号における育児休業等及び育児目的休暇の取得割合を算出したもので
あります。
3.男女の賃金格差については、男性の賃金に対する女性の賃金の割合を示しております。なお、同一労働の賃
金に差はなく、等級別人数構成の差によるものであります。出向者は、出向先の従業員として集計しており
ます。
4.労働者の賃金は、賞与及び基準外賃金を含んでおり、支給対象期間1年未満の者を除いております。
5.連結子会社11社のうち、「女性の職業生活における活躍の推進に関する法律」(平成27年法律第64号)の公
表義務の対象となる子会社のみを記載しております。
57/116
EDINET提出書類
株式会社遠藤照明(E01986)
有価証券報告書
第5 【経理の状況】
1.連結財務諸表及び財務諸表の作成方法について
(1) 当社の連結財務諸表は、「連結財務諸表の用語、様式及び作成方法に関する規則」(昭和51年大蔵省令第28号)に
基づいて作成しております。
(2) 当社の財務諸表は、「財務諸表等の用語、様式及び作成方法に関する規則」(昭和38年大蔵省令第59号。以下「財
務諸表等規則」という。)に基づいて作成しております。
また、当社は、特例財務諸表提出会社に該当し、財務諸表等規則第127条の規定により財務諸表を作成しておりま
す。
2.監査証明について
当社は、金融商品取引法第193条の2第1項の規定に基づき、連結会計年度(2025年4月1日から2026年3月31日ま
で)の連結財務諸表及び事業年度(2025年4月1日から2026年3月31日まで)の財務諸表について、太陽有限責任監査法
人により監査を受けております。
3.連結財務諸表等の適正性を確保するための特段の取組について
当社は、連結財務諸表等の適正性を確保するための特段の取組を行っております。具体的には、会計基準等の内容
を適切に把握し、会計基準等の変更について的確に対応することができる体制を整備するため、公益財団法人財務会
計基準機構へ加入し情報収集に努めるとともに、監査法人等が主催するセミナーへの参加並びに会計専門誌の定期購
読等を行っております。
58/116
EDINET提出書類
株式会社遠藤照明(E01986)
有価証券報告書
1 【連結財務諸表等】
(1) 【連結財務諸表】
① 【連結貸借対照表】
(単位:百万円)
前連結会計年度
(2025年3月31日)
資産の部
流動資産
現金及び預金
受取手形
売掛金
商品及び製品
仕掛品
原材料及び貯蔵品
リース債権及びリース投資資産
その他
貸倒引当金
流動資産合計
固定資産
有形固定資産
建物及び構築物
減価償却累計額
建物及び構築物(純額)
機械装置及び運搬具
減価償却累計額
機械装置及び運搬具(純額)
レンタル資産
減価償却累計額
レンタル資産(純額)
土地
リース資産
減価償却累計額
リース資産(純額)
建設仮勘定
その他
減価償却累計額
その他(純額)
有形固定資産合計
無形固定資産
ソフトウエア
のれん
その他
※1
※1
当連結会計年度
(2026年3月31日)
15,692
728
10,501
12,400
367
1,478
639
1,480
△215
23,988
598
10,894
11,444
494
1,376
1,072
1,276
△190
43,072
50,954
10,218
△5,790
10,545
△6,308
4,427
4,237
3,902
△3,492
4,357
△3,900
410
456
17,833
△9,336
18,907
△9,756
8,497
3,465
9,150
296
△152
無形固定資産合計
投資その他の資産
投資有価証券
退職給付に係る資産
繰延税金資産
その他
貸倒引当金
投資その他の資産合計
固定資産合計
資産合計
59/116
3,494
353
△169
144
183
543
3,564
△2,878
1,042
3,881
△3,163
686
18,176
717
19,282
616
2,335
103
826
2,315
120
3,055
3,262
93
104
1,481
1,762
△78
106
289
1,113
1,580
△0
3,363
24,595
67,667
3,089
25,635
76,589
EDINET提出書類
株式会社遠藤照明(E01986)
有価証券報告書
(単位:百万円)
前連結会計年度
(2025年3月31日)
負債の部
流動負債
支払手形及び買掛金
短期借入金
1年内返済予定の長期借入金
リース債務
未払金
未払法人税等
賞与引当金
役員賞与引当金
製品保証引当金
その他
流動負債合計
固定負債
社債
転換社債型新株予約権付社債
長期借入金
リース債務
繰延税金負債
役員退職慰労引当金
退職給付に係る負債
その他
固定負債合計
負債合計
純資産の部
株主資本
資本金
資本剰余金
利益剰余金
自己株式
株主資本合計
その他の包括利益累計額
その他有価証券評価差額金
繰延ヘッジ損益
為替換算調整勘定
退職給付に係る調整累計額
その他の包括利益累計額合計
非支配株主持分
純資産合計
負債純資産合計
※1
4,906
1,500
3,595
※3
49
1,280
406
1,035
124
512
1,140
※1
60/116
当連結会計年度
(2026年3月31日)
※3
4,899
900
3,125
70
1,345
328
1,096
113
474
1,573
14,551
13,926
1,000
6,820
118
13
127
385
599
1,000
5,018
5,045
154
163
422
834
9,064
23,615
12,637
26,564
5,155
5,516
26,746
△0
5,155
5,518
30,054
△15
37,418
40,712
27
19
6,648
△61
34
12
9,194
70
6,633
0
44,052
67,667
9,312
0
50,025
76,589
EDINET提出書類
株式会社遠藤照明(E01986)
有価証券報告書
② 【連結損益計算書及び連結包括利益計算書】
【連結損益計算書】
売上高
売上原価
売上総利益
販売費及び一般管理費
営業利益
営業外収益
受取利息及び配当金
賃貸収入
その他
営業外収益合計
営業外費用
支払利息
為替差損
賃貸収入原価
固定資産除却損
その他
営業外費用合計
経常利益
特別利益
固定資産売却益
特別利益合計
特別損失
役員退職慰労金
固定資産売却損
特別損失合計
税金等調整前当期純利益
法人税、住民税及び事業税
法人税等調整額
法人税等合計
当期純利益
非支配株主に帰属する当期純利益
親会社株主に帰属する当期純利益
前連結会計年度
(自 2024年4月1日
至 2025年3月31日)
※1
53,735
※2,※4
32,915
※3,※4
20,820
15,890
(単位:百万円)
当連結会計年度
(自 2025年4月1日
至 2026年3月31日)
※1
55,473
※2,※4
32,706
※3,※4
22,766
17,024
4,930
5,742
415
172
142
411
177
83
730
672
84
35
75
35
18
103
229
72
50
24
248
5,411
479
5,935
※5
0
※5
0
※6
61/116
0
2
2
※6
51
0
0
5,412
52
5,885
1,271
△658
1,126
417
612
4,799
0
4,799
1,543
4,342
0
4,342
EDINET提出書類
株式会社遠藤照明(E01986)
有価証券報告書
【連結包括利益計算書】
当期純利益
その他の包括利益
その他有価証券評価差額金
繰延ヘッジ損益
為替換算調整勘定
退職給付に係る調整額
その他の包括利益合計
包括利益
(内訳)
親会社株主に係る包括利益
非支配株主に係る包括利益
前連結会計年度
(自 2024年4月1日
至 2025年3月31日)
4,799
(単位:百万円)
当連結会計年度
(自 2025年4月1日
至 2026年3月31日)
4,342
△5
40
1,273
4
1,312
7
△6
2,546
131
2,679
※1
62/116
※1
6,112
7,021
6,112
0
7,021
0
EDINET提出書類
株式会社遠藤照明(E01986)
有価証券報告書
③ 【連結株主資本等変動計算書】
前連結会計年度(自 2024年4月1日
至 2025年3月31日)
(単位:百万円)
株主資本
資本金
当期首残高
資本剰余金
5,155
5,516
利益剰余金
自己株式
22,574
株主資本合計
△0
33,246
当期変動額
剰余金の配当
△627
△627
親会社株主に帰属す
る当期純利益
4,799
4,799
自己株式の取得
△0
自己株式の処分
△0
株主資本以外の項目
の当期変動額(純
額)
当期変動額合計
当期末残高
4,171
△0
4,171
5,155
5,516
26,746
△0
37,418
その他の包括利益累計額
その他有価証券
退職給付に係る その他の包括利非支配株主持分
繰延ヘッジ損益為替換算調整勘定
評価差額金
調整累計額
益累計額合計
当期首残高
32
△20
5,374
△66
5,320
0
純資産合計
38,567
当期変動額
剰余金の配当
△627
親会社株主に帰属す
る当期純利益
4,799
自己株式の取得
△0
自己株式の処分
株主資本以外の項目
の当期変動額(純
額)
△5
40
1,273
4
1,312
0
当期変動額合計
△5
40
当期末残高
27
19
1,273
4
1,312
0
5,484
6,648
△61
6,633
0
44,052
63/116
1,312
EDINET提出書類
株式会社遠藤照明(E01986)
有価証券報告書
当連結会計年度(自 2025年4月1日
至 2026年3月31日)
(単位:百万円)
株主資本
資本金
当期首残高
資本剰余金
5,155
5,516
利益剰余金
自己株式
26,746
株主資本合計
△0
37,418
当期変動額
剰余金の配当
親会社株主に帰属す
る当期純利益
△1,034
△1,034
4,342
4,342
自己株式の取得
自己株式の処分
1
△25
△25
9
11
株主資本以外の項目
の当期変動額(純
額)
当期変動額合計
当期末残高
1
3,307
△15
3,294
5,155
5,518
30,054
△15
40,712
その他の包括利益累計額
その他有価証券
退職給付に係る その他の包括利非支配株主持分
繰延ヘッジ損益為替換算調整勘定
評価差額金
調整累計額
益累計額合計
当期首残高
27
19
6,648
△61
6,633
0
純資産合計
44,052
当期変動額
剰余金の配当
△1,034
親会社株主に帰属す
る当期純利益
4,342
自己株式の取得
△25
自己株式の処分
11
株主資本以外の項目
の当期変動額(純
額)
7
△6
2,546
131
2,679
0
2,679
当期変動額合計
7
△6
2,546
131
2,679
0
5,973
当期末残高
34
12
9,194
70
9,312
0
50,025
64/116
EDINET提出書類
株式会社遠藤照明(E01986)
有価証券報告書
④ 【連結キャッシュ・フロー計算書】
前連結会計年度
(自 2024年4月1日
至 2025年3月31日)
営業活動によるキャッシュ・フロー
税金等調整前当期純利益
減価償却費
のれん償却額
貸倒引当金の増減額(△は減少)
賞与引当金の増減額(△は減少)
役員賞与引当金の増減額(△は減少)
製品保証引当金の増減額(△は減少)
役員退職慰労引当金の増減額(△は減少)
退職給付に係る資産の増減額(△は増加)
退職給付に係る負債の増減額(△は減少)
受取利息及び受取配当金
支払利息
固定資産売却損益(△は益)
役員退職慰労金
売上債権の増減額(△は増加)
棚卸資産の増減額(△は増加)
仕入債務の増減額(△は減少)
未払金の増減額(△は減少)
その他
小計
利息及び配当金の受取額
利息の支払額
法人税等の支払額
営業活動によるキャッシュ・フロー
投資活動によるキャッシュ・フロー
有形固定資産の取得による支出
有形固定資産の売却による収入
無形固定資産の取得による支出
定期預金の預入による支出
定期預金の払戻による収入
その他
投資活動によるキャッシュ・フロー
財務活動によるキャッシュ・フロー
短期借入金の純増減額(△は減少)
長期借入れによる収入
長期借入金の返済による支出
配当金の支払額
転換社債型新株予約権付社債の発行による収入
その他
財務活動によるキャッシュ・フロー
現金及び現金同等物に係る換算差額
現金及び現金同等物の増減額(△は減少)
現金及び現金同等物の期首残高
現金及び現金同等物の期末残高
※1
65/116
(単位:百万円)
当連結会計年度
(自 2025年4月1日
至 2026年3月31日)
5,412
3,097
241
△60
147
△49
△70
17
△3
58
△415
84
△0
△1,244
△1,686
△285
△491
△655
5,885
3,205
248
△100
44
△18
△39
1
△184
15
△411
103
△2
51
△222
1,614
△269
395
871
4,096
11,189
414
△79
△1,513
410
△108
△1,213
2,916
10,278
△4,154
8
△314
△224
220
142
△3,934
9
△362
△399
245
137
△4,322
△4,303
1,300
4,000
△4,674
△627
△4
△600
1,500
△3,745
△1,032
5,019
△10
△6
715
△696
16,163
15,467
1,131
961
8,067
15,467
23,534
※1
EDINET提出書類
株式会社遠藤照明(E01986)
有価証券報告書
【注記事項】
(連結財務諸表作成のための基本となる重要な事項)
1.連結の範囲に関する事項
すべての子会社を連結しております。
(1) 連結子会社の数
11社
(2) 主要な連結子会社の名称
ENDO Lighting(THAILAND)Public Co.,Ltd.
昆山恩都照明有限公司
イーシームズ株式会社
Ansell Electrical Products Limited
Ansell(Sales & Distribution)Limited
2.連結子会社の事業年度等に関する事項
ENDO Lighting(THAILAND)Public Co.,Ltd.、イーシームズ株式会社、ENDO LIGHTING ACCESSORIES(INDIA)
PRIVATE LTD.、ENDO Lighting SE Asia Pte.Ltd.及びENDO LIGHTING VIETNAM COMPANY LIMITEDの決算日は連結決
算日と一致しております。
昆山恩都照明有限公司及び恩藤照明設備(北京)有限公司の決算日は12月31日であります。
また、Ansell Electrical Products Limited、Ansell Electrical Products Spain SL、Ansell(Sales
& Distribution)Limited及びAnsell(Sales & Distribution)Republic of Ireland Limitedの決算日は1月31
日であります。連結財務諸表の作成にあたっては、同日現在の財務諸表を使用し、連結決算日との間に生じた重
要な取引については、連結上必要な調整を行っております。
3.会計方針に関する事項
(1) 重要な資産の評価基準及び評価方法
①
有価証券
その他有価証券
市場価格のない株式等以外のもの
時価法を採用しております。
(評価差額は全部純資産直入法により処理し、売却原価は主として移動平均法により算定)
市場価格のない株式等
主として移動平均法による原価法を採用しております。
②
デリバティブ取引により生じる債権債務
時価法を採用しております。
③
棚卸資産
商品・製品・仕掛品・原材料
主として移動平均法による原価法(収益性の低下に基づく簿価切下げの方法により算定)を採用しておりま
す。
貯蔵品
主として個別法による原価法(収益性の低下に基づく簿価切下げの方法により算定)を採用しております。
66/116
EDINET提出書類
株式会社遠藤照明(E01986)
有価証券報告書
(2) 重要な減価償却資産の減価償却の方法
①
有形固定資産(リース資産を除く)
当社及び国内連結子会社は定率法(ただし、1998年4月1日以降に取得した建物(建物附属設備は除く)及び2016
年4月1日以降に取得した建物附属設備及び構築物並びに国内連結子会社のレンタル資産については定額法)を採
用し、在外連結子会社は定額法を採用しております。
なお、主な耐用年数は以下のとおりであります。
建物及び構築物
5〜50年
機械装置及び運搬具 2〜15年
レンタル資産
5〜7年
また、当社及び国内連結子会社は2007年3月31日以前に取得したものについては、償却可能限度額まで償却が
終了した翌年から5年間で均等償却する方法を採用しております。
②
無形固定資産(リース資産を除く)
当社及び国内連結子会社は定額法を採用し、在外連結子会社は所在地国の会計基準に基づく定額法を採用して
おります。
なお、当社及び国内連結子会社の自社利用のソフトウエアについては、社内における利用可能期間(5年)に基
づいております。
③
リース資産
所有権移転外ファイナンス・リース取引に係るリース資産
リース期間を耐用年数とし、残存価額を零とする定額法を採用しております。
(3) 重要な引当金の計上基準
①
貸倒引当金
債権の貸倒れによる損失に備えるため、一般債権については貸倒実績率により、貸倒懸念債権等特定の債権に
ついては、個別に回収可能性を検討し、回収不能見込額を計上しております。
②
賞与引当金
従業員に対して支給する賞与の支出に充てるため、当連結会計年度に対応する賞与支給見込額を計上しており
ます。
③
役員賞与引当金
役員に対して支給する賞与の支出に充てるため、当連結会計年度に対応する役員賞与支給見込額を計上してお
ります。
④
製品保証引当金
製品販売後に発生する当社負担の保守交換に係る費用に備えるため、過去の実績等に基づく将来発生見込額を
計上しております。
⑤
役員退職慰労引当金
役員の退職慰労金の支給に備えるため、規程に基づく当連結会計年度末の要支給額を計上しております。
(4) 退職給付に係る会計処理の方法
①
退職給付見込額の期間帰属方法
退職給付債務の算定にあたり、退職給付見込額を当連結会計年度末までの期間に帰属させる方法については、
給付算定式基準によっております。
②
数理計算上の差異
各連結会計年度の発生時における従業員の平均残存勤務期間以内の一定の年数(5年)による定額法により按分
した額をそれぞれ発生の翌連結会計年度から費用処理しております。
67/116
EDINET提出書類
株式会社遠藤照明(E01986)
有価証券報告書
(5) 重要な収益及び費用の計上基準
当社及び連結子会社の顧客との契約から生じる収益に関する当該履行義務を充足する通常の時点(収益を認識
する通常の時点)は以下のとおりであります。
① 照明器具関連事業
照明器具関連事業においては、主として日本、アジア及び欧州の顧客に対して照明器具及びランプ等の製造及
び販売を行っております。
国内の商品及び製品の販売については、出荷時から商品及び製品の支配が顧客に移転される時までの期間が通
常の期間であるため、出荷時点で収益を認識しております。また、海外の販売については、主にEXWによる取引で
あり、工場(又は倉庫)からの出荷時に商品及び製品に対する支配が顧客に移転すると考えられることから、出
荷時点で収益を認識しております。
② 環境関連事業
環境関連事業においては、主として日本の顧客に対して照明器具及びランプ等の販売及びレンタル並びに照明
器具設備の設置・電気配線工事等の請負工事を行っております。
商品の販売については、主として国内の販売であり、出荷時から商品及び製品の支配が顧客に移転される時ま
での期間が通常の期間であるため、出荷時点で収益を認識しております。
請負工事については、工期が1ヶ月から3ヶ月程度であり、これらについては「契約における取引開始日から
完全に履行義務を充足すると見込まれる時点までの期間がごく短い場合」として、代替的な取扱いを採用し、工
事完了時点で収益を認識しております。
③ インテリア家具事業
インテリア家具事業においては、主として日本の顧客に対してインテリア及び家具等の販売を行っておりま
す。
国内の商品の販売については、出荷時から商品及び製品の支配が顧客に移転される時までの期間が通常の期間
であるため、出荷時点で収益を認識しております。
(6) 重要な外貨建の資産又は負債の本邦通貨への換算基準
外貨建金銭債権債務は、連結決算日の直物為替相場により円貨に換算し、換算差額は損益として処理しており
ます。
なお、在外子会社等の資産及び負債は、当該在外子会社等の決算日の直物為替相場により円貨に換算し、収益
及び費用については期中平均相場により円貨に換算し、換算差額は純資産の部における為替換算調整勘定及び非
支配株主持分に含めております。
(7) 重要なヘッジ会計の方法
①
ヘッジ会計の方法
繰延ヘッジ処理によっております。
②
ヘッジ手段とヘッジ対象
ヘッジ手段…為替予約
ヘッジ対象…売掛金、買掛金
③
ヘッジ方針
デリバティブ取引は、業務遂行上、金融商品の取引を行うにあたって抱える可能性のある市場リスクを適切に
管理し、当該リスクの低減を図ることを目的とする場合に限っております。
④
ヘッジ有効性評価の方法
ヘッジ対象のキャッシュ・フロー変動の累計又は相場変動とヘッジ手段のキャッシュ・フロー変動の累計又は
相場変動を比較し、両者の変動額を基礎にして、ヘッジの有効性を評価しております。ただし、ヘッジ手段の内
容とヘッジ対象の重要な内容が同一である場合には、ヘッジ対象の相場変動又はキャッシュ・フロー変動をヘッ
ジ手段が完全に相殺するものと考えられるため、有効性の判定を省略しております。
68/116
EDINET提出書類
株式会社遠藤照明(E01986)
有価証券報告書
(8) のれんの償却方法及び償却期間
のれんについては、20年間で均等償却しております。
(9) 連結キャッシュ・フロー計算書における資金の範囲
手許現金、要求払預金及び取得日から3ヶ月以内に満期日の到来する流動性の高い、容易に換金可能であり、
かつ、価値の変動について僅少なリスクしか負わない短期的な投資であります。
(重要な会計上の見積り)
1.棚卸資産の評価
(1) 当連結会計年度の連結財務諸表に計上した金額
(百万円)
前連結会計年度
商品及び製品
当連結会計年度
12,400
11,444
367
494
原材料及び貯蔵品
1,478
1,376
棚卸資産評価損
(洗替法による戻入額相殺後)
△152
△261
仕掛品
(2) 識別した項目に係る重要な会計上の見積りの内容に関する情報
当社グループは、棚卸資産の評価方法として原価法(連結貸借対照表価額は収益性の低下に基づく簿価切下げ
の方法により算定)を採用しており、期末における正味売却価額が取得原価よりも下落している場合には、当該
正味売却価額をもって連結貸借対照表価額としております。また、滞留及び過剰在庫の内、陳腐化した棚卸資産
については、適正な価値で評価されるように評価減の金額を見積っております。
2.繰延税金資産の回収可能性
(1) 当連結会計年度の連結財務諸表に計上した金額
(百万円)
前連結会計年度
繰延税金資産
当連結会計年度
1,481
1,113
(2) 識別した項目に係る重要な会計上の見積りの内容に関する情報
繰延税金資産の回収可能性は、利益計画に基づき課税主体ごとに将来の課税所得を合理的に見積り、将来の税
金負担額を軽減する効果を有するかどうかで判断しております。当該判断は、収益力に基づく一時差異等加減算
前課税所得の十分性、タックス・プランニングに基づく一時差異等加減算前課税所得の十分性及び将来加算一時
差異の十分性のいずれかを満たしているかどうかにより判断しております。
当該見積り及び当該仮定について、将来の不確実な経済条件の変動等により見直しが必要となった場合、翌連
結会計年度の連結財務諸表において認識する繰延税金資産及び法人税等調整額の金額に重要な影響を与える可能
性があります。
69/116
EDINET提出書類
株式会社遠藤照明(E01986)
有価証券報告書
(未適用の会計基準等)
・「リースに関する会計基準」(企業会計基準第34号 2024年9月13日)
・「リースに関する会計基準の適用指針」(企業会計基準適用指針第33号 2024年9月13日)ほか、関連する企業
会計基準、企業会計基準適用指針、実務対応報告及び移管指針の改正
(1) 概要
国際的な会計基準と同様に、借手のすべてのリースについて資産・負債を計上する等の取扱いを定めるもの。
(2) 適用予定日
2028年3月期の期首より適用予定であります。
(3) 当該会計基準等の適用による影響
「リースに関する会計基準」等の適用による連結財務諸表に与える影響額については、現時点で評価中であり
ます。
・「後発事象に関する会計基準」(企業会計基準第41号 2026年1月9日企業会計基準委員会)
・「後発事象に関する会計基準の適用指針」(企業会計基準適用指針第35号 2026年1月9日企業会計基準委
員会)
(1)概要
「後発事象に関する会計基準」等は、後発事象の定義、会計処理及び開示等を取り扱う包括的な会計基準を設
定することを優先的な課題とし、日本公認会計士協会監査・保証基準委員会監査基準報告書560実務指針第
1号「後発事象に関する監査上の取扱い」で示されている会計に関する内容を原則として踏襲して企業会計基準
委員会に移管することを基本的な方針として、表現の見直し及び後発事象の評価期間の整理を行うとともに、財
務諸表の公表の承認に関する注記を新たに求める等、後発事象に関する会計処理及び開示について定めたもので
あります。
(2)適用予定日
2028年3月期の期首より適用予定であります。
(連結貸借対照表関係)
※1
担保資産及び担保付債務
担保に供している資産及び担保付債務は次のとおりであります。
担保提供資産
前連結会計年度
(2025年3月31日)
建物及び構築物
1,010百万円
当連結会計年度
(2026年3月31日)
−百万円
土地
1,497
−
合計
2,507
−
前連結会計年度
(2025年3月31日)
530百万円
当連結会計年度
(2026年3月31日)
−百万円
860
−
1,390
−
対応債務
1年内返済予定の長期借入金
長期借入金
合計
70/116
EDINET提出書類
株式会社遠藤照明(E01986)
有価証券報告書
2
保証債務
下記の会社に対し、当社仕入債務の一括支払信託に係る受益権譲渡に関連して発生した同社の金融機関借入金
等に対する債務保証を行っております。なお、下記金額は、当該保証債務の極度額であります。
前連結会計年度
当連結会計年度
(2025年3月31日)
(2026年3月31日)
ノエル・カンパニー・リミテッド
400百万円
ノエル・カンパニー・リミテッド
−百万円
グローバルファクタリング株式会社 400
合計
※3
グローバルファクタリング株式会社
400
800
400
その他のうち、契約負債の金額は、以下のとおりであります。
前連結会計年度
(2025年3月31日)
契約負債
154百万円
当連結会計年度
(2026年3月31日)
144百万円
(連結損益計算書関係)
※1
顧客との契約から生じる収益
売上高については、顧客との契約から生じる収益及びそれ以外の収益を区分して記載しておりません。顧客との
契約から生じる収益の金額は、連結財務諸表「注記事項(収益認識関係) 1.顧客との契約から生じる収益を分解
した情報」に記載しております。
※2
期末棚卸高は収益性の低下に伴う簿価切下後の金額であり、次の棚卸資産評価損(洗替法による戻入額相殺後)が
売上原価に含まれております。
前連結会計年度
(自 2024年4月1日
至 2025年3月31日)
△152百万円
※3
販売費及び一般管理費のうち主要な費目及び金額は次のとおりであります。
広告宣伝費
前連結会計年度
(自 2024年4月1日
至 2025年3月31日)
当連結会計年度
(自 2025年4月1日
至 2026年3月31日)
503百万円
471百万円
発送配達費
1,385
1,431
諸手数料
2,047
2,085
給与手当
4,790
5,059
805
874
賞与引当金繰入額
役員賞与引当金繰入額
48
98
退職給付費用
313
292
役員退職慰労引当金繰入額
19
3
賃借料
697
789
9
△12
貸倒引当金繰入額
※4
当連結会計年度
(自 2025年4月1日
至 2026年3月31日)
△261百万円
減価償却費
506
515
製品保証引当金繰入額
△72
△22
販売費及び一般管理費と当期製造費用に含まれる研究開発費は、次のとおりであります。
販売費及び一般管理費
当期製造費用
合計
前連結会計年度
(自 2024年4月1日
至 2025年3月31日)
当連結会計年度
(自 2025年4月1日
至 2026年3月31日)
825百万円
991百万円
1
3
826
994
71/116
EDINET提出書類
株式会社遠藤照明(E01986)
有価証券報告書
※5
※6
固定資産売却益の内訳は次のとおりであります。
前連結会計年度
(自 2024年4月1日
至 2025年3月31日)
当連結会計年度
(自 2025年4月1日
至 2026年3月31日)
機械装置及び運搬具
0百万円
0百万円
有形固定資産「その他」
0
2
ソフトウエア
−
0
合計
0
2
固定資産売却損の内訳は次のとおりであります。
前連結会計年度
(自 2024年4月1日
至 2025年3月31日)
当連結会計年度
(自 2025年4月1日
至 2026年3月31日)
機械装置及び運搬具
−百万円
0百万円
有形固定資産「その他」
0
0
合計
0
0
(連結包括利益計算書関係)
※1
その他の包括利益に係る組替調整額並びに法人税等及び税効果額
前連結会計年度
(自 2024年4月1日
至 2025年3月31日)
当連結会計年度
(自 2025年4月1日
至 2026年3月31日)
当期発生額
△8百万円
11百万円
組替調整額
−
−
その他有価証券評価差額金
法人税等及び税効果調整前
法人税等及び税効果額
その他有価証券評価差額金
△8
11
3
△3
△5
7
繰延ヘッジ損益
当期発生額
230
197
組替調整額
△170
△217
法人税等及び税効果調整前
法人税等及び税効果額
繰延ヘッジ損益
59
△20
△19
13
40
△6
1,273
2,546
為替換算調整勘定
当期発生額
−
−
1,273
2,546
−
−
1,273
2,546
当期発生額
△31
161
組替調整額
38
31
組替調整額
法人税等及び税効果調整前
法人税等及び税効果額
為替換算調整勘定
退職給付に係る調整額
法人税等及び税効果調整前
6
192
法人税等及び税効果額
△2
△60
退職給付に係る調整額
4
131
1,312
2,679
その他の包括利益合計
72/116
EDINET提出書類
株式会社遠藤照明(E01986)
有価証券報告書
(連結株主資本等変動計算書関係)
前連結会計年度(自 2024年4月1日至 2025年3月31日)
1.発行済株式に関する事項
当連結会計年度期首
増加
株式の種類
(千株)
(千株)
普通株式
14,776
−
増加
(千株)
0
(変動事由の概要)
単元未満株式の買取りによる増加
当連結会計年度末
(千株)
−
2.自己株式に関する事項
当連結会計年度期首
株式の種類
(千株)
普通株式
減少
(千株)
減少
(千株)
14,776
当連結会計年度末
(千株)
0
−
0
44株
3.新株予約権等に関する事項
該当事項はありません。
4.配当に関する事項
(1) 配当金支払額
決議
株式の種類
配当金の総額
(百万円)
1株当たり配当額
(円)
基準日
効力発生日
2024年6月26日
定時株主総会
普通株式
332
22.50
2024年3月31日
2024年6月27日
2024年10月31日
取締役会
普通株式
295
20.00
2024年9月30日
2024年12月2日
(2) 基準日が当連結会計年度に属する配当のうち、配当の効力発生日が翌連結会計年度となるもの
配当金の総額 1株当たり
決議
株式の種類配当の原資
基準日
効力発生日
(百万円)
配当額(円)
2025年6月25日
定時株主総会
普通株式
利益剰余金
443
30.00
当連結会計年度(自 2025年4月1日至 2026年3月31日)
1.発行済株式に関する事項
当連結会計年度期首
増加
株式の種類
(千株)
(千株)
普通株式
14,776
2.自己株式に関する事項
当連結会計年度期首
株式の種類
(千株)
普通株式
0
2025年3月31日
減少
(千株)
当連結会計年度末
(千株)
−
増加
(千株)
2025年6月26日
−
減少
(千株)
14,776
当連結会計年度末
(千株)
12
4
(変動事由の概要)
2025年4月30日の取締役会決議による自己株式の取得 12,300株
2025年7月14日の取締役会決議による譲渡制限付株式報酬としての自己株式の処分
7
4,793株
3.新株予約権等に関する事項
会社名
内訳
目的となる
株式の種類
目的となる株式の数(株)
当連結会計
年度期首
増加
減少
当連結会
計年度末
第2回無担保転換社債型
新株予約権付社債の
普通株式
−
2,210,400
−
2,210,400
新株予約権
(2025年11月20日発行)
(注)転換社債型新株予約権付社債については、一括法によっております。
(変動事由の概要)
第2回無担保転換社債型新株予約権付社債の新株予約権の発行による増加 2,210,400株
提出会社
73/116
当連結会
計年度末
残高(百
万円)
(注)
EDINET提出書類
株式会社遠藤照明(E01986)
有価証券報告書
4.配当に関する事項
(1) 配当金支払額
決議
株式の種類
配当金の総額
(百万円)
1株当たり配当額
(円)
基準日
効力発生日
2025年6月25日
定時株主総会
普通株式
443
30.00
2025年3月31日
2025年6月26日
2025年10月31日
取締役会
普通株式
590
40.00
2025年9月30日
2025年12月1日
(2) 基準日が当連結会計年度に属する配当のうち、配当の効力発生日が翌連結会計年度となるもの
2026年6月25日開催の定時株主総会の議案として、次のとおり付議する予定です。
配当金の総額
1株当たり
決議
株式の種類配当の原資
基準日
効力発生日
(百万円)
配当額(円)
2026年6月25日
定時株主総会
普通株式
利益剰余金
708
48.00
2026年3月31日
2026年6月26日
(連結キャッシュ・フロー計算書関係)
※1
現金及び現金同等物の期末残高と連結貸借対照表に掲記されている科目の金額との関係は、次のとおりでありま
す。
現金及び預金勘定
預入期間が3か月を超える定期預金
現金及び現金同等物
前連結会計年度
(自 2024年4月1日
至 2025年3月31日)
15,692百万円
△225
15,467
当連結会計年度
(自 2025年4月1日
至 2026年3月31日)
23,988百万円
△453
23,534
(リース取引関係)
ファイナンス・リース取引
(借主側)
所有権移転外ファイナンス・リース取引
(1) リース資産の内容
有形固定資産
主として、連結子会社におけるレンタル資産であります。
(2) リース資産の減価償却の方法
リース期間を耐用年数とし、残存価額を零とする定額法によっております。
(金融商品関係)
1.金融商品の状況に関する事項
(1)金融商品に対する取組方針
当社グループは、資金運用については短期的な預金等の安全性の高い金融資産に限定しております。
現金及び預金の中には外貨預金が含まれておりますが、主に製品及び原材料の輸入等の営業取引に係る為替リス
クを回避するためのものであります。また、資金調達については、主に銀行借入や社債発行により行っておりま
す。デリバティブは、後述するリスクを回避するために利用しており、投機的な取引は行わない方針であります。
(2)金融商品の内容及びそのリスク
営業債権である受取手形、売掛金、リース債権及びリース投資資産は、顧客の信用リスクに晒されております。
投資有価証券である株式は、主に業務上の関係を有する企業の株式ですが、市場価格の変動リスクに晒されてお
ります。
営業債務である支払手形及び買掛金は、その全てが1年以内の支払期日であります。
借入金のうち、短期借入金は主に営業取引に係る資金調達であり、長期借入金(原則として5年以内)は主に設
備投資に係る資金調達であります。変動金利の借入金は、金利の変動リスクに晒されております。
転換社債型新株予約権付社債は、事業拡大のためのM&A、グローバル化推進に資する人財投資及びDX化の更な
る推進のための資金調達であります。
デリバティブ取引は、輸出入取引に係る為替の変動リスクのヘッジを目的とした為替予約取引であります。
(3)金融商品に係るリスク管理体制
① 信用リスク(取引先の契約不履行等に係るリスク)の管理
営業債権は、当社グループの与信管理規程に従い、取引先ごとの期日管理及び残高管理を行うとともに、主
な取引先の信用状況を把握する体制としております。
74/116
EDINET提出書類
株式会社遠藤照明(E01986)
有価証券報告書
② 市場リスクの管理
投資有価証券は、主に業務上の関係を有する企業の株式であり、四半期毎に把握された時価が取締役会に報
告されております。
デリバティブ取引の執行・管理については、取引権限を定めた社内規程に従って行っており、また、デリバ
ティブの利用にあたっては、信用リスクを軽減するために格付の高い金融機関とのみ取引を行っております。
(4)金融商品の時価等に関する事項についての補足説明
「2.金融商品の時価等に関する事項」におけるデリバティブ取引に関する契約額等については、その金額自体
がデリバティブ取引に係る市場リスクを示すものではありません。
2.金融商品の時価等に関する事項
連結貸借対照表計上額、時価及びこれらの差額については、次のとおりであります。
前連結会計年度(2025年3月31日)
(単位:百万円)
連結貸借対照表計上額
(1) リース債権及びリース投資資産
時価
差額
639
765
126
81
81
−
720
846
126
(2) 投資有価証券
その他有価証券
資産計
(1) 社債
1,000
971
28
(2) 長期借入金
10,415
10,235
179
(3) リース債務
負債計
167
163
3
11,582
11,371
211
デリバティブ取引(*3)
61
61
−
(*1)「現金及び預金」「受取手形」「売掛金」「支払手形及び買掛金」「短期借入金」「未払金」「未払法人税
等」については、現金であること、及び短期間で決済されるため時価が帳簿価額に近似するものであること
から、記載を省略しております。
(*2)市場価格のない株式等は、「(2)投資有価証券」には含まれておりません。当該金融商品の連結貸借対照表
計上額は以下のとおりであります。
区分
前連結会計年度(百万円)
非上場株式
12
(*3)デリバティブ取引によって生じた正味の債権・債務は純額で表示しております。
当連結会計年度(2026年3月31日)
(単位:百万円)
連結貸借対照表計上額
(1) リース債権及びリース投資資産
1,072
時価
差額
1,289
217
(2) 投資有価証券
その他有価証券
94
94
−
1,166
1,383
217
(1) 社債
1,000
963
36
(2) 転換社債型新株予約権付社債
5,018
4,584
433
(3) 長期借入金
8,170
8,059
110
資産計
(4) リース債務
負債計
225
217
8
14,413
13,824
589
デリバティブ取引(*3)
21
21
−
(*1)「現金及び預金」「受取手形」「売掛金」「支払手形及び買掛金」「短期借入金」「未払金」「未払法人税
等」については、現金であること、及び短期間で決済されるため時価が帳簿価額に近似するものであること
から、記載を省略しております。
(*2)市場価格のない株式等は、「(2)投資有価証券」には含まれておりません。当該金融商品の連結貸借対照表
計上額は以下のとおりであります。
区分
当連結会計年度(百万円)
非上場株式
12
(*3)デリバティブ取引によって生じた正味の債権・債務は純額で表示しております。
75/116
EDINET提出書類
株式会社遠藤照明(E01986)
有価証券報告書
(注1) 金銭債権及び満期がある有価証券の連結決算日後の償還予定額
前連結会計年度(2025年3月31日)
1年以内
現金及び預金
受取手形
売掛金
リース債権及びリース投資資産
合計
15,692
728
10,495
116
27,032
1年超
5年以内
−
−
6
413
420
(単位:百万円)
5年超
10年超
10年以内
−
−
−
−
−
−
108
−
108
−
1年超
5年以内
−
−
9
744
753
(単位:百万円)
5年超
10年超
10年以内
−
−
−
−
2
−
124
1
126
1
当連結会計年度(2026年3月31日)
1年以内
現金及び預金
受取手形
売掛金
リース債権及びリース投資資産
合計
23,988
598
10,882
202
35,672
(注2) 長期借入金、リース債務及びその他の有利子負債の連結決算日後の返済予定額
前連結会計年度(2025年3月31日)
短期借入金
1,500
1年超
5年以内
−
社債
転換社債型新株予約権付社債
長期借入金
リース債務
合計
−
−
3,595
49
5,144
1,000
−
6,820
109
7,929
1年以内
(単位:百万円)
5年超
10年超
10年以内
−
−
−
−
−
8
8
−
−
−
−
−
当連結会計年度(2026年3月31日)
1年以内
短期借入金
社債
転換社債型新株予約権付社債
長期借入金
リース債務
合計
900
−
−
3,125
70
4,095
1年超
5年以内
−
1,000
5,018
5,045
149
11,213
(単位:百万円)
5年超
10年超
10年以内
−
−
−
−
−
−
−
−
4
−
4
−
3.金融商品の時価のレベルごとの内訳等に関する事項
金融商品の時価を、時価の算定に係るインプットの観察可能性及び重要性に応じて、以下の3つのレベルに分類
しております。
レベル1の時価:観察可能な時価の算定に係るインプットのうち、活発な市場において形成される当該時価の算
定の対象となる資産又は負債に関する相場価格により算定した時価
レベル2の時価:観察可能な時価の算定に係るインプットのうち、レベル1のインプット以外の時価の算定に係
るインプットを用いて算定した時価
レベル3の時価:観察できない時価の算定に係るインプットを使用して算定した時価
時価の算定に重要な影響を与えるインプットを複数使用している場合には、それらのインプットがそれぞれ属す
るレベルのうち、時価の算定における優先順位が最も低いレベルに時価を分類しております。
76/116
EDINET提出書類
株式会社遠藤照明(E01986)
有価証券報告書
(1)
時価で連結貸借対照表に計上している金融商品
前連結会計年度(2025年3月31日)
区分
時価(百万円)
レベル1
レベル2
レベル3
合計
投資有価証券
その他有価証券
81
─
─
81
資産計
81
─
─
81
─
61
─
61
─
61
─
61
デリバティブ取引
通貨関連
負債計
当連結会計年度(2026年3月31日)
区分
時価(百万円)
レベル1
投資有価証券
その他有価証券
資産計
レベル2
レベル3
合計
94
─
─
94
94
─
─
94
─
21
─
21
─
21
─
21
デリバティブ取引
通貨関連
負債計
(2)
時価で連結貸借対照表に計上している金融商品以外の金融商品
前連結会計年度(2025年3月31日)
区分
時価(百万円)
レベル1
レベル2
レベル3
合計
リース債権及びリース投資資産
─
765
─
765
資産計
─
765
─
765
社債
─
971
─
971
転換社債型新株予約権付社債
─
─
─
─
長期借入金
─
10,235
─
10,235
リース債務
─
163
─
163
─
11,371
─
11,371
負債計
当連結会計年度(2026年3月31日)
区分
時価(百万円)
レベル1
レベル2
レベル3
合計
リース債権及びリース投資資産
─
1,289
─
1,289
資産計
─
1,289
─
1,289
社債
─
963
─
963
転換社債型新株予約権付社債
─
4,584
─
4,584
長期借入金
─
8,059
─
8,059
リース債務
─
217
─
217
─
13,824
─
13,824
負債計
(注)時価の算定に用いた評価技法及び時価の算定に係るインプットの説明
投資有価証券
上場株式等は取引所の価格を用いて評価しております。
これらは、活発な市場で取引されているため、その時価をレベル1の時価に分類しております。
77/116
EDINET提出書類
株式会社遠藤照明(E01986)
有価証券報告書
デリバティブ取引
時価の算定方法は、取引先金融機関から提示された価格等に基づき算定しており、レベル2の時価に
分類しております。
リース債権及びリース投資資産
一定の期間毎に分類し、与信管理上の信用リスク区分ごとに、その将来キャッシュ・フローと国債の
利回り等適切な指標に信用スプレッドを上乗せした利率を元に割引現在価値法により算定しており、その
時価をレベル2の時価に分類しております。
社債、転換社債型新株予約権付社債、長期借入金、リース債務
これらの時価は、元利金の合計と、当該債務の残存期間及び信用リスクを加味した利率を基に、割引
現在価値法により算定しており、レベル2の時価に分類しております。
(有価証券関係)
1. その他有価証券
前連結会計年度(2025年3月31日)
連結貸借対照表
計上額
(百万円)
種類
連結貸借対照表計上額が
取得原価を超えるもの
(1) 株式
連結貸借対照表計上額が
取得原価を超えないもの
(1) 株式
小計
小計
合計
取得原価
(百万円)
差額
(百万円)
81
41
39
81
41
39
−
−
−
−
−
−
81
41
39
当連結会計年度(2026年3月31日)
連結貸借対照表
計上額
(百万円)
種類
連結貸借対照表計上額が
取得原価を超えるもの
(1) 株式
連結貸借対照表計上額が
取得原価を超えないもの
(1) 株式
小計
小計
合計
取得原価
(百万円)
差額
(百万円)
94
43
51
94
43
51
−
−
−
−
−
−
94
43
51
(デリバティブ取引関係)
1.ヘッジ会計が適用されているデリバティブ取引
前連結会計年度(2025年3月31日)
ヘッジ会計
の方法
原則的処理方法
原則的処理方法
デリバティブ
取引の種類等
為替予約
買建
米ドル
為替予約
売建
米ドル
主なヘッジ対象
(単位:百万円)
契約額等のうち
時価
1年超
契約額等
買掛金
1,794
─
99
売掛金
3,588
─
△37
当連結会計年度(2026年3月31日)
ヘッジ会計
の方法
原則的処理方法
原則的処理方法
デリバティブ
取引の種類等
為替予約
買建
米ドル
為替予約
売建
米ドル
主なヘッジ対象
(単位:百万円)
契約額等のうち
時価
1年超
契約額等
買掛金
─
─
─
売掛金
1,918
─
21
78/116
EDINET提出書類
株式会社遠藤照明(E01986)
有価証券報告書
(退職給付関係)
1.採用している退職給付制度の概要
当社及び連結子会社は、従業員の退職給付に充てるため、積立型、非積立型の確定給付制度及び確定拠出制度を
採用しております。
確定給付企業年金制度では、給与と勤務期間に基づいた一時金又は年金を支給します。
なお、一部の連結子会社が有する確定給付企業年金制度及び退職一時金制度は、簡便法により退職給付に係る負
債及び退職給付費用を計算しております。
また、当社は2018年4月に退職一時金制度の一部について確定拠出制度へ移行しております。
2.複数事業主制度
確定拠出制度と同様に会計処理する、複数事業主制度の厚生年金基金制度への要拠出額はありません。
3.確定給付制度
(1) 退職給付債務の期首残高と期末残高の調整表(簡便法を適用した制度を除く。)
(単位:百万円)
前連結会計年度
当連結会計年度
(自 2024年4月1日
(自 2025年4月1日
至 2025年3月31日)
至 2026年3月31日)
退職給付債務の期首残高
2,060
2,063
勤務費用
183
181
利息費用
21
28
数理計算上の差異の発生額
△67
△129
退職給付の支払額
△158
△258
その他
23
7
退職給付債務の期末残高
2,063
1,891
(2) 年金資産の期首残高と期末残高の調整表(簡便法を適用した制度を除く。)
年金資産の期首残高
期待運用収益
数理計算上の差異の発生額
事業主からの拠出額
退職給付の支払額
年金資産の期末残高
前連結会計年度
(自 2024年4月1日
至 2025年3月31日)
2,076
41
△99
189
△150
2,056
(単位:百万円)
当連結会計年度
(自 2025年4月1日
至 2026年3月31日)
2,056
30
31
187
△237
2,069
(3) 簡便法を適用した制度の、退職給付に係る負債の期首残高と期末残高の調整表
前連結会計年度
(自 2024年4月1日
至 2025年3月31日)
(単位:百万円)
当連結会計年度
(自 2025年4月1日
至 2026年3月31日)
退職給付に係る負債の期首残高
退職給付費用
退職給付の支払額
その他
217
51
△13
18
274
33
△7
9
退職給付に係る負債の期末残高
274
310
79/116
EDINET提出書類
株式会社遠藤照明(E01986)
有価証券報告書
(4) 退職給付債務及び年金資産の期末残高と連結貸借対照表に計上された退職給付に係る負債及び退職給付に係る資
産の調整表
(単位:百万円)
前連結会計年度
当連結会計年度
(自 2024年4月1日
(自 2025年4月1日
至 2025年3月31日)
至 2026年3月31日)
積立型制度の退職給付債務
2,063
1,891
年金資産
△2,056
△2,069
6
△177
非積立型制度の退職給付債務
274
310
連結貸借対照表に計上された負債と資産の純額
280
132
退職給付に係る負債
退職給付に係る資産
連結貸借対照表に計上された負債と資産の純額
385
△104
280
422
△289
132
前連結会計年度
(自 2024年4月1日
至 2025年3月31日)
183
21
△41
38
51
18
272
(単位:百万円)
当連結会計年度
(自 2025年4月1日
至 2026年3月31日)
181
28
△30
31
33
243
(5) 退職給付費用及びその内訳項目の金額
勤務費用
利息費用
期待運用収益
数理計算上の差異の費用処理額
簡便法で計算した退職給付費用
その他
確定給付制度に係る退職給付費用
(6) 退職給付に係る調整額
退職給付に係る調整額に計上した項目(法人税等及び税効果控除前)の内訳は次のとおりであります。
(単位:百万円)
前連結会計年度
当連結会計年度
(自 2024年4月1日
(自 2025年4月1日
至 2025年3月31日)
至 2026年3月31日)
数理計算上の差異
△6
192
合計
△6
192
(7) 退職給付に係る調整累計額
退職給付に係る調整累計額に計上した項目(法人税等及び税効果控除前)の内訳は次のとおりであります。
(単位:百万円)
前連結会計年度
当連結会計年度
(自 2024年4月1日
(自 2025年4月1日
至 2025年3月31日)
至 2026年3月31日)
未認識数理計算上の差異
88
△103
合計
88
△103
80/116
EDINET提出書類
株式会社遠藤照明(E01986)
有価証券報告書
(8) 年金資産に関する事項
①年金資産の主な内訳
年金資産合計に対する主な分類ごとの比率は、次のとおりであります。
前連結会計年度
当連結会計年度
(自 2024年4月1日
(自 2025年4月1日
至 2025年3月31日)
至 2026年3月31日)
一般勘定
21%
20%
債券
29%
28%
株式
19%
17%
その他
31%
35%
合計
100%
100%
②長期期待運用収益率の設定方法
年金資産の長期期待運用収益率を決定するため、現在及び予想される年金資産の配分と、年金資産を構成する
多様な資産からの現在及び将来期待される長期の収益率を考慮しております。
(9) 数理計算上の計算基礎に関する事項
当連結会計年度末における主要な数理計算上の計算基礎(加重平均で表しております。)
前連結会計年度
当連結会計年度
(自 2024年4月1日
(自 2025年4月1日
至 2025年3月31日)
至 2026年3月31日)
割引率
1.3%
2.1%
長期期待運用収益率
1.5%
1.5%
4.確定拠出制度
当社及び連結子会社の確定拠出制度への要拠出額は、前連結会計年度111百万円、当連結会計年度119百万円であ
ります。
(ストック・オプション等関係)
該当事項はありません。
81/116
EDINET提出書類
株式会社遠藤照明(E01986)
有価証券報告書
(税効果会計関係)
1.繰延税金資産及び繰延税金負債の発生の主な原因別の内訳
前連結会計年度
(2025年3月31日)
当連結会計年度
(2026年3月31日)
棚卸資産評価損
305百万円
254百万円
賞与引当金
262
261
貸倒引当金
79
46
製品保証引当金
180
179
退職給付に係る負債
役員退職慰労引当金
未払事業税
88
40
39
96
57
37
減価償却費及び減損損失
794
802
未実現利益消去
483
513
税務上の繰越欠損金(注)2
820
539
その他
58
65
3,153
2,853
繰延税金資産
繰延税金資産小計
税務上の繰越欠損金に係る評価性引当額(注)2
△3
△4
将来減算一時差異等の合計に係る評価性引当額
△249
△251
評価性引当額小計(注)1
△253
△256
繰延税金資産合計
2,899
2,597
△9
△16
△1,331
△90
△1,431
△1,471
△159
△1,646
1,468
950
繰延税金負債
その他有価証券評価差額金
海外子会社の留保利益
その他
繰延税金負債合計
繰延税金資産純額
(注) 1.評価性引当額が2百万円増加しております。この増加の主な内容は、当社において貸倒引当金に係る評価性
引当額24百万円減少及び製品保証引当金に係る評価性引当額30百万円が増加したためであります。
2.税務上の繰越欠損金及びその繰延税金資産の繰越期限別の金額
前連結会計年度(2025年3月31日)
1年超
2年超
3年超
4年超
1年以内
2年以内 3年以内 4年以内 5年以内
5年超
税務上の繰越欠損金(a)
201
299
−
60
−
259
評価性引当額
−
−
−
−
−
△3
繰延税金資産
201
299
−
60
−
255
合計
820百万円
△3
〃
816
〃
(a) 税務上の繰越欠損金は、法定実効税率を乗じた額であります。
(b) 税務上の繰越欠損金 820百万円(法定実効税率を乗じた額)について、繰延税金資産816百万円を計上して
おります。当該税務上の繰越欠損金については、将来の課税所得の見込み等により、回収可能と判断した部
分については評価制引当額を認識しておりません。
当連結会計年度(2026年3月31日)
1年以内
1年超
2年超
3年超
4年超
2年以内 3年以内 4年以内 5年以内
5年超
税務上の繰越欠損金(a)
218
60
−
−
12
247
評価性引当額
−
−
−
−
−
△4
繰延税金資産
218
60
−
−
12
243
合計
539百万円
△4
534
〃
〃
(a) 税務上の繰越欠損金は、法定実効税率を乗じた額であります。
(b) 税務上の繰越欠損金539百万円(法定実効税率を乗じた額)について、繰延税金資産534百万円を計上してお
ります。当該税務上の繰越欠損金については、将来の課税所得の見込み等により、回収可能と判断した部分
については評価制引当額を認識しておりません。
82/116
EDINET提出書類
株式会社遠藤照明(E01986)
有価証券報告書
2.法定実効税率と税効果会計適用後の法人税等の負担率との差異の原因となった主要な項目別の内訳
前連結会計年度
当連結会計年度
(2025年3月31日)
(2026年3月31日)
法定実効税率
30.6%
30.6%
(調整)
交際費等永久に損金に算入されない項目
0.5
0.6
住民税均等割等
0.7
0.7
子会社税率差異
△5.8
△4.1
評価性引当額の増減
△17.9
0.0
未実現利益に係る税効果未認識額
△0.6
1.0
のれん償却額
1.4
1.3
海外子会社の留保利益
4.3
2.4
税率変更による影響
0.5
△0.3
前期確定申告差異
△1.1
△1.4
その他
△1.4
△4.4
税効果会計適用後の法人税等の負担率
11.3
26.2
(資産除去債務関係)
当社グループは、国内の事業所、ショールーム、物流拠点、海外子会社の工場等で建物等を賃借しており、不動
産賃借契約に基づく退去時の原状回復に係る債務等を有しておりますが、当該債務に関連する賃借資産の使用期間
が明確でなく、現時点において将来退去する予定もないことから、資産除去債務を合理的に見積ることができませ
ん。そのため、当該債務に見合う資産除去債務を計上しておりません。
(賃貸等不動産関係)
当社グループは、大阪府及びその他の地域において、賃貸用のオフィスビル(土地を含む)を有しております。
2025年3月期における当該賃貸等不動産に関する賃貸損益は97百万円(賃貸収益は営業外収益に、賃貸費用は営
業外費用に計上)であります。
2026年3月期における当該賃貸等不動産に関する賃貸損益は105百万円(賃貸収益は営業外収益に、賃貸費用は営
業外費用に計上)であります。
また、当該賃貸等不動産の連結貸借対照表計上額、当連結会計年度増減額及び時価は、次のとおりであります。
(単位:百万円)
前連結会計年度
当連結会計年度
(自 2024年4月1日
(自 2025年4月1日
至 2025年3月31日)
至 2026年3月31日)
連結貸借対照表計上額
期首残高
1,380
1,350
期中増減額
△30
△30
期末残高
1,350
1,320
1,934
2,196
期末時価
(注) 1.連結貸借対照表計上額は、取得原価から減価償却累計額を控除した金額であります。
2.前連結会計年度増減のうち、主な減少額は賃貸用不動産に係る減価償却費(30百万円)であります。
当連結会計年度増減のうち、主な減少額は賃貸用不動産に係る減価償却費(30百万円)であります。
3.期末の時価は、主として「不動産鑑定評価基準」に基づいて自社で算定した金額(指標等を用いて調整を
行ったものを含む。)であります。
83/116
EDINET提出書類
株式会社遠藤照明(E01986)
有価証券報告書
(収益認識関係)
1.顧客との契約から生じる収益を分解した情報
前連結会計年度(自
2024年4月1日
至
2025年3月31日)
(単位:百万円)
報告セグメント
照明器具
関連事業
日
環境関連事業
インテリア
家具事業
合計
計
本
22,510
6,219
1,394
30,124
30,124
アジア
2,962
−
−
2,962
2,962
英
国
14,180
−
−
14,180
14,180
欧
州
2,308
−
−
2,308
2,308
その他
236
−
−
236
236
42,198
6,219
1,394
49,811
49,811
−
3,923
−
3,923
3,923
42,198
10,143
1,394
53,735
53,735
顧客との契約から生じる収益
その他の収益
外部顧客への売上高
(注)その他の収益は、「リース取引に関する会計基準」(企業会計基準第13号)に基づくリース取引・レンタル
取引に係るものであります。
当連結会計年度(自
2025年4月1日
至
2026年3月31日)
(単位:百万円)
報告セグメント
照明器具
関連事業
日
環境関連事業
インテリア
家具事業
合計
計
本
23,391
6,428
1,160
30,979
30,979
アジア
3,092
−
−
3,092
3,092
英
国
14,676
−
−
14,676
14,676
欧
州
1,918
−
−
1,918
1,918
その他
20
−
−
20
20
43,098
6,428
1,160
50,686
50,686
4,786
−
4,786
4,786
11,215
1,160
55,473
55,473
顧客との契約から生じる収益
その他の収益
外部顧客への売上高
43,098
(注)その他の収益は、「リース取引に関する会計基準」(企業会計基準第13号)に基づくリース取引・レンタル
取引に係るものであります。
2.顧客との契約から生じる収益を理解するための基礎となる情報
収益を理解するための基礎となる情報は、「(連結財務諸表作成のための基本となる重要な事項)
針に関する事項 (5) 重要な収益及び費用の計上基準」に記載のとおりです。
84/116
3.会計方
EDINET提出書類
株式会社遠藤照明(E01986)
有価証券報告書
3.顧客との契約に基づく履行義務の充足と当該契約から生じるキャッシュ・フローとの関係並びに当連結会計年度
末において存在する顧客との契約から翌連結会計年度以降に認識すると見込まれる収益の金額及び時期に関する情
報
(1) 契約負債の残高等
(単位:百万円)
前連結会計年度
当連結会計年度
顧客との契約から生じた債権(期首残高)
9,845
11,229
顧客との契約から生じた債権(期末残高)
11,229
11,492
契約負債(期首残高)
137
154
契約負債(期末残高)
154
144
(2) 残存履行義務に配分した取引価格
当社及び連結子会社では、当初の予定契約期間が1年を超える重要な取引がないため、実務上の便法を適用
し、残存履行義務に関する情報の記載を省略しております。また、顧客との契約から生じる対価の中に、取引価
格に含まれていない重要な金額はありません。
85/116
EDINET提出書類
株式会社遠藤照明(E01986)
有価証券報告書
(セグメント情報等)
【セグメント情報】
1.報告セグメントの概要
(1) 報告セグメントの決定方法
当社の報告セグメントは、当社の構成単位のうち分離された財務情報が入手可能であり、取締役会が、経営資
源の配分及び業績を評価するために、定期的に検討を行う対象となっているものであります。
当社は、製品・サービス別の事業部門を置き、各事業部門は、取り扱う製品・サービスについて国内及び海外
の包括的な戦略を立案し、事業活動を展開しております。
したがって、当社は、事業部門を基礎とした製品・サービス別のセグメントから構成されており、「照明器具
関連事業」、「環境関連事業」、「インテリア家具事業」の3つを報告セグメントとしております。
(2) 各報告セグメントに属する製品及びサービスの種類
「照明器具関連事業」は、主に照明器具の製造及び販売をしております。
「環境関連事業」は、主に省エネ機器の販売及び、照明器具、省エネ機器のレンタルをしております。
「インテリア家具事業」は、主にインテリア家具、インテリア用品の販売をしております。
2.報告セグメントごとの売上高、利益又は損失、資産、負債その他の項目の金額の算定方法
報告されている事業セグメントの会計処理の方法は、「連結財務諸表作成のための基本となる重要な事項」にお
ける記載と概ね同一であります。
報告セグメントの利益は、営業利益ベースの数値であります。セグメント間の内部収益及び振替高は、セグメン
ト間で合意された取引価格設定基準に基づいております。
86/116
EDINET提出書類
株式会社遠藤照明(E01986)
有価証券報告書
3.報告セグメントごとの売上高、利益又は損失、資産、負債その他の項目の金額に関する情報
前連結会計年度(自
2024年4月1日
至
2025年3月31日)
(単位:百万円)
報告セグメント
照明器具
関連事業
環境関連事業
合計
インテリア
家具事業
計
売上高
外部顧客への売上高
42,198
10,143
1,394
53,735
53,735
セグメント間の内部
売上高又は振替高
5,776
47
−
5,824
5,824
計
47,975
10,190
1,394
59,560
59,560
セグメント利益
5,283
960
78
6,322
6,322
セグメント資産
35,923
13,968
1,274
51,166
51,166
減価償却費
804
2,583
8
3,396
3,396
のれんの償却額
241
−
−
241
241
有形固定資産及び
無形固定資産の増加額
626
3,931
2
4,561
4,561
至
2026年3月31日)
その他の項目
当連結会計年度(自
2025年4月1日
(単位:百万円)
報告セグメント
照明器具
関連事業
環境関連事業
合計
インテリア
家具事業
計
売上高
外部顧客への売上高
43,098
11,215
1,160
55,473
55,473
セグメント間の内部
売上高又は振替高
5,864
70
−
5,934
5,934
計
48,962
11,285
1,160
61,408
61,408
セグメント利益
6,162
976
25
7,165
7,165
セグメント資産
35,558
15,051
1,033
51,643
51,643
減価償却費
783
2,697
9
3,489
3,489
のれんの償却額
248
−
−
248
248
1,380
3,359
1
4,741
4,741
その他の項目
有形固定資産及び
無形固定資産の増加額
87/116
EDINET提出書類
株式会社遠藤照明(E01986)
有価証券報告書
4.報告セグメント合計額と連結財務諸表計上額との差額及び当該差額の主な内容(差異調整に関する事項)
(単位:百万円)
売上高
前連結会計年度
当連結会計年度
報告セグメント計
59,560
61,408
セグメント間取引消去
△5,824
△5,934
連結財務諸表の売上高
53,735
55,473
(単位:百万円)
利益
前連結会計年度
報告セグメント計
当連結会計年度
6,322
7,165
セグメント間取引消去
133
128
未実現利益の調整額
△37
29
△1,487
△1,581
4,930
5,742
全社費用 (注)
連結財務諸表の営業利益
(注) 全社費用は、主に報告セグメントに帰属しない親会社の管理部門に係る費用であります。
(単位:百万円)
資産
前連結会計年度
当連結会計年度
報告セグメント計
51,166
51,643
セグメント間取引消去
△6,569
△6,629
未実現利益の調整額
△1,407
△1,299
全社資産 (注)
24,478
32,875
連結財務諸表の資産合計
67,667
76,589
(注) 全社資産は、報告セグメントに帰属しない現金及び預金、土地等であります。
調整額 (注)
報告セグメント計
その他の項目
減価償却費
のれんの償却額
前連結
会計年度
当連結
会計年度
前連結
会計年度
当連結
会計年度
(単位:百万円)
連結財務諸表
計上額
前連結
当連結
会計年度
会計年度
3,396
3,489
△329
△314
3,067
3,175
241
248
−
−
241
248
4,741
△266
△343
4,294
4,398
有形固定資産及び
4,561
無形固定資産の増加額
(注) 調整額は、次のとおりであります。
(1) 減価償却費の調整額には、セグメント間取引に係る未実現利益の消去(前連結会計年度△446百万円、当連
結会計年度△442百万円)、報告セグメントに帰属しない全社資産における減価償却費(前連結会計年度117百万
円、当連結会計年度128百万円)が含まれております。
(2) 有形固定資産及び無形固定資産の増加額の調整額には、セグメント間取引に係る未実現利益の消去(前連結
会計年度△510百万円、当連結会計年度△431百万円)、報告セグメントに帰属しない全社資産における投資額
(前連結会計年度243百万円、当連結会計年度87百万円)が含まれております。
88/116
EDINET提出書類
株式会社遠藤照明(E01986)
有価証券報告書
【関連情報】
前連結会計年度(自
2024年4月1日
至
2025年3月31日)
1.製品及びサービスごとの情報
セグメント情報に同様の情報を開示しているため、記載を省略しております。
2.地域ごとの情報
(1)売上高
(単位:百万円)
日本
アジア
34,048
英国
2,962
欧州
14,180
その他
2,308
合計
236
53,735
(注) 売上高は顧客の所在地を基礎とし、国又は地域に分類しております。
(2)有形固定資産
(単位:百万円)
日本
中国
14,957
アジア
1,649
欧州
合計
1,028
540
18,176
3.主要な顧客ごとの情報
外部顧客への売上高のうち、連結損益計算書の売上高の10%以上を占める相手先がないため、記載はありません。
当連結会計年度(自
2025年4月1日
至
2026年3月31日)
1.製品及びサービスごとの情報
セグメント情報に同様の情報を開示しているため、記載を省略しております。
2.地域ごとの情報
(1)売上高
(単位:百万円)
日本
アジア
35,766
英国
3,092
14,676
欧州
その他
1,918
合計
20
55,473
(注) 売上高は顧客の所在地を基礎とし、国又は地域に分類しております。
(2)有形固定資産
(単位:百万円)
日本
中国
15,325
アジア
2,302
欧州
1,080
合計
573
19,282
3.主要な顧客ごとの情報
外部顧客への売上高のうち、連結損益計算書の売上高の10%以上を占める相手先がないため、記載はありません。
89/116
EDINET提出書類
株式会社遠藤照明(E01986)
有価証券報告書
【報告セグメントごとの固定資産の減損損失に関する情報】
該当事項はありません。
【報告セグメントごとののれんの償却額及び未償却残高に関する情報】
前連結会計年度(自
2024年4月1日
至
2025年3月31日)
(単位:百万円)
照明器具
関連事業
当期末残高
環境関連事業
2,335
−
インテリア
家具事業
−
全社・消去
−
合計
2,335
(注)のれん償却額に関しては、セグメント情報に同様の情報を開示しているため、記載を省略しております。
当連結会計年度(自
2025年4月1日
至
2026年3月31日)
(単位:百万円)
照明器具
関連事業
当期末残高
環境関連事業
2,315
−
インテリア
家具事業
−
全社・消去
−
合計
2,315
(注)のれん償却額に関しては、セグメント情報に同様の情報を開示しているため、記載を省略しております。
【報告セグメントごとの負ののれん発生益に関する情報】
該当事項はありません。
【関連当事者情報】
該当事項はありません。
90/116
EDINET提出書類
株式会社遠藤照明(E01986)
有価証券報告書
(1株当たり情報)
前連結会計年度
(自 2024年4月1日
至 2025年3月31日)
当連結会計年度
(自 2025年4月1日
至 2026年3月31日)
1株当たり純資産額
2,981円30銭
3,387円27銭
1株当たり当期純利益
324円85銭
294円00銭
潜在株式調整後
−
278円83銭
1株当たり当期純利益金額
(注) 1.前連結会計年度の潜在株式調整後1株当たり当期純利益については、潜在株式が存在しないため記載して
おりません。
2.1株当たり当期純利益及び潜在株式調整後1株当たり当期純利益の算定上の基礎は、以下のとおりであり
ます。
前連結会計年度
当連結会計年度
(自 2024年4月1日
(自 2025年4月1日
項目
至 2025年3月31日)
至 2026年3月31日)
1株当たり当期純利益
親会社株主に帰属する当期純利益(百万円)
4,799
4,342
−
−
普通株式に係る親会社株主に帰属する当期純利益
(百万円)
4,799
4,342
普通株式の期中平均株式数(千株)
14,776
14,769
親会社株主に帰属する当期純利益調整額(百万円)
−
△1
(うち支払利息(税額相当額控除後)(百万円))
(−)
(△1)
−
799
(うち転換社債型新株予約権付社債(千株))
(−)
(799)
(うち新株予約権(千株))
(−)
(−)
普通株主に帰属しない金額(百万円)
潜在株式調整後1株当たり当期純利益
普通株式増加数(千株)
希薄化効果を有しないため、潜在株式調整後1株当たり
当期純利益の算定に含めなかった潜在株式の概要
−
(重要な後発事象)
該当事項はありません。
91/116
EDINET提出書類
株式会社遠藤照明(E01986)
有価証券報告書
⑤ 【連結附属明細表】
【社債明細表】
会社名
銘柄
当期首残
当期末残
利率
高 (百万高 (百万
(%)
円)
円)
発行年月日
担保
償還期限
(株)遠藤照明
無担保社債
2024年2月27日
1,000
1,000
(−)
0.56 無担保
2029年2月27日
(株)遠藤照明
第2回無担保転換社
債型新株予約権付社
債
2025年11月20日
−
5,018
(−)
− 無担保
2030年11月20日
−
−
1,000
6,018
(−)
−
合計
−
−
(注)1.「当期末残高」欄の(内書)は、1年内償還予定の金額であります。
2.転換社債型新株予約権付社債の内容
発行すべき
株式の内容
新株予約権
の発行価額
㈱遠藤照明
普通株式
無償
株式の発行
価格(円)
発行価額の
総額(百万
円)
新株予約権
の行使によ
り発行した
株式の発行
価額の総額
(百万円)
2,262
5,019
−
新株予約権
の付与割合
(%)
新株予約権
の行使期間
代用払込に
関する事項
100.00
2025 年 11 月
21 日〜 2030
年11月18日
(注)
(注)新株予約権の行使に際して出資される財産の内容は、当該新株予約権に係る本社債を出資するものとする。
3.連結決算日後5年内における1年ごとの償還予定額
1年以内
(百万円)
1年超2年以内
(百万円)
2年超3年以内
(百万円)
3年超4年以内
(百万円)
4年超5年以内
(百万円)
−
1,000
−
5,018
−
【借入金等明細表】
区分
当期首残高
(百万円)
当期末残高
(百万円)
平均利率
(%)
返済期限
短期借入金
1,500
900
1.38
−
1年以内に返済予定の長期借入金
3,595
3,125
0.77
−
1年以内に返済予定のリース債務
49
70
1.43
−
長期借入金(1年以内に返済予定のも
のを除く。)
6,820
5,045
0.99
2027年4月〜
2030年8月
リース債務(1年以内に返済予定のも
のを除く。)
118
154
1.45
2027年4月〜
2033年1月
12,082
9,296
−
−
合計
(注) 1.「平均利率」については、借入金等の期末残高に対する加重平均利率を記載しております。
2.長期借入金及びリース債務(1年以内に返済予定のものを除く)の連結決算日後5年内における返済予定額は
以下のとおりであります。
1年超2年以内
2年超3年以内
3年超4年以内
4年超5年以内
区分
(百万円)
(百万円)
(百万円)
(百万円)
長期借入金
2,495
1,450
950
150
リース債務
63
46
28
12
【資産除去債務明細表】
明細表に記載すべき事項が連結財務諸表規則第15条の23に規定する注記事項として記載されているため、記
載を省略しております。
92/116
EDINET提出書類
株式会社遠藤照明(E01986)
有価証券報告書
(2) 【その他】
当連結会計年度における半期情報等
第1四半期
連結累計期間
中間連結会計期間
第3四半期
連結累計期間
当連結会計年度
売上高
(百万円)
12,507
25,138
39,388
55,473
税金等調整前中間
(四半期)(当期)純利益
(百万円)
925
2,190
3,776
5,885
親会社株主に帰属する
中間(四半期)(当期)純利益
(百万円)
584
1,616
2,715
4,342
(円)
39.57
109.45
183.89
294.00
1株当たり中間
(四半期)(当期)純利益
第1四半期
連結会計期間
1株当たり四半期純利益
(円)
第2四半期
連結会計期間
39.57
69.89
第3四半期
連結会計期間
74.44
(注)第1四半期連結累計期間及び第3四半期連結累計期間に係る財務情報に対するレビュー:有
93/116
第4四半期
連結会計期間
110.11
EDINET提出書類
株式会社遠藤照明(E01986)
有価証券報告書
2 【財務諸表等】
(1) 【財務諸表】
① 【貸借対照表】
(単位:百万円)
前事業年度
(2025年3月31日)
資産の部
流動資産
現金及び預金
受取手形
売掛金
商品及び製品
仕掛品
原材料及び貯蔵品
前渡金
短期貸付金
その他
貸倒引当金
流動資産合計
固定資産
有形固定資産
建物
構築物
機械及び装置
工具、器具及び備品
土地
その他
有形固定資産合計
無形固定資産
ソフトウエア
その他
無形固定資産合計
投資その他の資産
投資有価証券
関係会社株式
関係会社出資金
長期貸付金
前払年金費用
繰延税金資産
その他
貸倒引当金
投資その他の資産合計
※2
94/116
1,312
631
4,147
※2
6,799
581
4,096
6,316
63
240
77
※2
37
※2
2,696
5,079
88
213
39
※2
23
※2
2,447
△3
△2
15,518
19,367
※1
2,562
※1
7
14
128
3,192
※2
固定資産合計
資産合計
当事業年度
(2026年3月31日)
25
2,437
5
10
89
3,192
23
5,929
5,758
452
17
572
34
469
606
66
7,947
1,229
3,990
81
7,947
1,229
3,830
※2
193
1,293
1,643
△78
185
991
1,547
△0
16,284
15,812
22,684
38,202
22,177
41,544
EDINET提出書類
株式会社遠藤照明(E01986)
有価証券報告書
(単位:百万円)
前事業年度
(2025年3月31日)
負債の部
流動負債
支払手形
買掛金
短期借入金
1年内返済予定の長期借入金
未払金
未払法人税等
賞与引当金
役員賞与引当金
製品保証引当金
その他
流動負債合計
固定負債
社債
転換社債型新株予約権付社債
長期借入金
役員退職慰労引当金
その他
固定負債合計
負債合計
純資産の部
株主資本
資本金
資本剰余金
資本準備金
その他資本剰余金
資本剰余金合計
利益剰余金
利益準備金
その他利益剰余金
繰越利益剰余金
利益剰余金合計
自己株式
株主資本合計
評価・換算差額等
その他有価証券評価差額金
繰延ヘッジ損益
評価・換算差額等合計
純資産合計
負債純資産合計
※2
550
3,072
※2
105
3,210
1,100
※1
3,595
※2
703
3,125
※2
972
81
658
38
496
292
146
700
47
468
315
10,588
9,093
1,000
6,820
127
184
1,000
5,018
5,045
360
8,131
18,720
11,424
20,517
5,155
5,155
3,795
1,743
3,795
1,744
5,539
5,540
21
21
8,699
10,295
8,720
△0
19,415
10,316
△15
20,996
21
45
30
67
19,482
38,202
30
21,027
41,544
※1
95/116
当事業年度
(2026年3月31日)
EDINET提出書類
株式会社遠藤照明(E01986)
有価証券報告書
② 【損益計算書】
売上高
売上原価
売上総利益
販売費及び一般管理費合計
営業利益
営業外収益
受取利息及び受取配当金
賃貸収入
為替差益
その他
営業外収益合計
営業外費用
支払利息
賃貸収入原価
その他
営業外費用合計
経常利益
特別利益
固定資産売却益
特別利益合計
特別損失
役員退職慰労金
特別損失合計
税引前当期純利益
法人税、住民税及び事業税
法人税等調整額
法人税等合計
当期純利益
前事業年度
(自 2024年4月1日
至 2025年3月31日)
※2
29,774
※2
20,257
※1,※2
9,517
8,725
(単位:百万円)
当事業年度
(自 2025年4月1日
至 2026年3月31日)
※2
30,500
※2
20,098
※1,※2
10,402
8,992
791
96/116
※2
785
※2
179
138
285
1,409
※2
※2
1,535
184
25
259
1,388
2,006
71
75
27
93
72
13
174
2,006
179
3,235
0
2
0
2
51
2,006
51
3,185
128
△640
238
317
△512
2,519
556
2,629
EDINET提出書類
株式会社遠藤照明(E01986)
有価証券報告書
③ 【株主資本等変動計算書】
前事業年度(自 2024年4月1日
至 2025年3月31日)
(単位:百万円)
株主資本
資本剰余金
利益剰余金
利益準備金
その他利益
剰余金
繰越利益
剰余金
利益剰余金
合計
21
6,808
6,829
剰余金の配当
△627
△627
当期純利益
2,519
2,519
資本金
当期首残高
資本準備金
その他資本
剰余金
資本剰余金
合計
3,795
1,743
5,539
5,155
当期変動額
自己株式の取得
自己株式の処分
株主資本以外の項目
の当期変動額(純
額)
当期変動額合計
当期末残高
1,891
1,891
5,155
3,795
1,743
5,539
21
8,699
8,720
株主資本
自己株式
当期首残高
△0
評価・換算差額等
その他有価証券
評価差額金
繰延ヘッジ
損益
評価・換算
差額等合計
純資産合計
株主資本合計
17,524
20
20
17,545
当期変動額
剰余金の配当
△627
△627
当期純利益
2,519
2,519
△0
△0
自己株式の取得
△0
自己株式の処分
株主資本以外の項目
の当期変動額(純
額)
0
45
46
46
当期変動額合計
△0
1,891
0
45
46
1,937
当期末残高
△0
19,415
21
45
67
19,482
97/116
EDINET提出書類
株式会社遠藤照明(E01986)
有価証券報告書
当事業年度(自 2025年4月1日
至 2026年3月31日)
(単位:百万円)
株主資本
資本剰余金
利益剰余金
利益準備金
その他利益
剰余金
繰越利益
剰余金
利益剰余金
合計
21
8,699
8,720
剰余金の配当
△1,034
△1,034
当期純利益
2,629
2,629
資本金
当期首残高
資本準備金
その他資本
剰余金
資本剰余金
合計
3,795
1,743
5,539
5,155
当期変動額
自己株式の取得
自己株式の処分
1
1
株主資本以外の項目
の当期変動額(純
額)
当期変動額合計
当期末残高
1
1
1,595
1,595
5,155
3,795
1,744
5,540
21
10,295
10,316
株主資本
自己株式
当期首残高
△0
評価・換算差額等
その他有価証券
評価差額金
繰延ヘッジ
損益
評価・換算
差額等合計
純資産合計
株主資本合計
19,415
21
45
67
19,482
当期変動額
剰余金の配当
当期純利益
△1,034
△1,034
2,629
2,629
自己株式の取得
△25
△25
△25
自己株式の処分
9
11
11
株主資本以外の項目
の当期変動額(純
額)
8
△45
△36
△36
当期変動額合計
△15
1,581
8
△45
△36
1,544
当期末残高
△15
20,996
30
30
21,027
98/116
EDINET提出書類
株式会社遠藤照明(E01986)
有価証券報告書
【注記事項】
(重要な会計方針)
1.有価証券の評価基準及び評価方法
(1) 関係会社株式及び関係会社出資金
移動平均法による原価法を採用しております。
(2) その他有価証券
市場価格のない株式等以外のもの
時価法を採用しております。
(評価差額は全部純資産直入法により処理し、売却原価は主として移動平均法により算定)
市場価格のない株式等
主として移動平均法による原価法を採用しております。
2.デリバティブ取引により生じる債権債務の評価基準及び評価方法
時価法を採用しております。
3.棚卸資産の評価基準及び評価方法
原材料・製品・商品・仕掛品
主として移動平均法による原価法(収益性の低下に基づく簿価切下げの方法により算定)を採用しておりま
す。
貯蔵品
主として個別法による原価法(収益性の低下に基づく簿価切下げの方法により算定)を採用しております。
4.固定資産の減価償却の方法
(1) 有形固定資産(リース資産を除く)
定率法によっております。ただし、1998年4月1日以降に取得した建物(建物附属設備は除く)並びに2016年4月
1日以降に取得した建物附属設備及び構築物については、定額法を採用しております。
なお、主な耐用年数は以下のとおりであります。
建物
7〜50年
機械及び装置 2〜12年
また、2007年3月31日以前に取得したものについては、償却可能限度額まで償却が終了した翌年から5年間で均
等償却する方法を採用しております。
(2) 無形固定資産(リース資産を除く)
自社利用のソフトウエアについては、社内における利用可能期間(5年)に基づく定額法を採用しております。
(3) リース資産
所有権移転外ファイナンス・リース取引に係るリース資産
リース期間を耐用年数とし、残存価額を零とする定額法を採用しております。
5.外貨建の資産及び負債の本邦通貨への換算基準
外貨建金銭債権債務は、決算日の直物為替相場により円貨に換算し、換算差額は損益として処理しております。
6.引当金の計上基準
(1) 貸倒引当金
債権の貸倒れによる損失に備えるため、一般債権については貸倒実績率により、貸倒懸念債権等特定の債権につ
いては、個別に回収可能性を検討し、回収不能見込額を計上しております。
99/116
EDINET提出書類
株式会社遠藤照明(E01986)
有価証券報告書
(2) 賞与引当金
従業員に対して支給する賞与の支出に充てるため、当事業年度に対応する賞与支給見込額を計上しております。
(3) 役員賞与引当金
役員に対して支給する賞与の支出に充てるため、当事業年度に対応する役員賞与支給見込額を計上しておりま
す。
(4) 製品保証引当金
製品販売後に発生する当社負担の保守交換に係る費用に備えるため、過去の実績等に基づく将来発生見込額を計
上しております。
(5) 退職給付引当金
従業員の退職給付に備えるため、当事業年度末における退職給付債務及び年金資産の見込額に基づき計上してお
ります。
なお、当事業年度末においては、年金資産が退職給付債務(未認識数理計算上の差異を除く)を上回っているた
め、投資その他の資産の「前払年金費用」に計上しております。
退職給付引当金及び退職給付費用の処理方法は以下のとおりです。
①
退職給付見込額の期間帰属方法
退職給付債務の算定にあたり、退職給付見込額を当事業年度までの期間に帰属させる方法については、給付
算定式基準によっております。
②
数理計算上の差異の費用処理方法
各期の発生時における従業員の平均残存勤務期間以内の一定の年数(5年)による定額法により按分した額を
それぞれ発生の翌事業年度から費用処理しております。
(6) 役員退職慰労引当金
役員の退職慰労金の支給に備えるため、規程に基づく当事業年度末の要支給額を計上しております。
7.ヘッジ会計の方法
(1) ヘッジ会計の方法
繰延ヘッジ処理によっております。
(2) ヘッジ手段とヘッジ対象
ヘッジ手段…為替予約
ヘッジ対象…買掛金
(3) ヘッジ方針
デリバティブ取引は、業務遂行上、金融商品の取引を行うにあたって抱える可能性のある市場リスクを適切に管
理し、当該リスクの低減を図ることを目的とする場合に限っております。
(4) ヘッジ有効性評価の方法
ヘッジ対象のキャッシュ・フロー変動の累計又は相場変動とヘッジ手段のキャッシュ・フロー変動の累計又は相
場変動を比較し、両者の変動額を基礎にして、ヘッジの有効性を評価しております。ただし、ヘッジ手段の内容と
ヘッジ対象の重要な内容が同一である場合には、ヘッジ対象の相場変動又はキャッシュ・フロー変動をヘッジ手段
が完全に相殺するものと考えられるため、有効性の判定を省略しております。
100/116
EDINET提出書類
株式会社遠藤照明(E01986)
有価証券報告書
8.重要な収益及び費用の計上基準
当社と顧客との契約から生じる収益に関する当該履行義務を充足する通常の時点(収益を認識する通常の時
点)は以下のとおりであります。
① 照明器具関連事業
照明器具関連事業においては、主として日本の顧客に対して照明器具及びランプ等の製造及び販売を行ってお
ります。
国内の商品及び製品の販売については、出荷時から商品及び製品の支配が顧客に移転される時までの期間が通
常の期間であるため、出荷時点で収益を認識しております。
② インテリア家具事業
インテリア家具事業においては、主として日本の顧客に対してインテリア及び家具等の販売を行っておりま
す。
国内の商品の販売については、出荷時から商品及び製品の支配が顧客に移転される時までの期間が通常の期間
であるため、出荷時点で収益を認識しております。
9.その他財務諸表作成のための基本となる重要な事項
(1) 退職給付に係る会計処理の方法
未認識数理計算上の差異の貸借対照表における取扱いが連結貸借対照表と異なります。
(重要な会計上の見積り)
1.棚卸資産の評価
(1) 当事業年度の財務諸表に計上した金額
(百万円)
前事業年度
商品及び製品
当事業年度
6,316
5,079
仕掛品
63
88
原材料及び貯蔵品
240
213
棚卸資産評価損
(洗替法による戻入額相殺後)
△15
△200
(2) 識別した項目に係る重要な会計上の見積りの内容に関する情報
連結財務諸表「注記事項(重要な会計上の見積り)1.棚卸資産の評価(2)識別した項目に係る重要な会計上の
見積りの内容に関する情報」に記載した内容と同一であります。
2.繰延税金資産の回収可能性
(1) 当事業年度の財務諸表に計上した金額
(百万円)
前事業年度
繰延税金資産
当事業年度
1,293
991
(2) 識別した項目に係る重要な会計上の見積りの内容に関する情報
連結財務諸表「注記事項(重要な会計上の見積り)2.繰延税金資産の回収可能性(2)識別した項目に係る重要
な会計上の見積りの内容に関する情報」に記載した内容と同一であります。
101/116
EDINET提出書類
株式会社遠藤照明(E01986)
有価証券報告書
(貸借対照表関係)
※1
担保に供している資産及び対応債務
担保提供資産
建物
前事業年度
(2025年3月31日)
1,010百万円
当事業年度
(2026年3月31日)
−百万円
土地
1,497
−
合計
2,507
−
前事業年度
(2025年3月31日)
530百万円
当事業年度
(2026年3月31日)
−百万円
860
−
1,390
−
対応債務
1年内返済予定の長期借入金
長期借入金
合計
※2
3
区分掲記されていない関係会社に対する資産及び負債
短期金銭債権
前事業年度
(2025年3月31日)
2,534百万円
当事業年度
(2026年3月31日)
2,766百万円
長期金銭債権
3,990
3,830
短期金銭債務
2,174
2,620
(1)
保証債務
関係会社に対するもの
前事業年度
(2025年3月31日)
当事業年度
(2026年3月31日)
(借入債務)
イーシームズ株式会社
(2)
400百万円
(借入債務)
イーシームズ株式会社
900百万円
関係会社以外に対するもの
下記の会社に対し、当社仕入債務の一括支払信託に係る受益権譲渡に関連して発生した同社の金融機関借入金
等に対する債務保証を行っております。なお、下記金額は、当該保証債務の極度額であります。
前事業年度
(2025年3月31日)
当事業年度
(2026年3月31日)
ノエル・カンパニー・リミテッド
400百万円
ノエル・カンパニー・リミテッド
−百万円
グローバルファクタリング株式会社
400
グローバルファクタリング株式会社
400
合計
800
400
102/116
EDINET提出書類
株式会社遠藤照明(E01986)
有価証券報告書
(損益計算書関係)
※1
販売費及び一般管理費のうち主要な費目及び金額並びにおおよその割合は、次のとおりであります。
(自
至
前事業年度
2024年4月1日
2025年3月31日)
発送運賃
(自
至
当事業年度
2025年4月1日
2026年3月31日)
728百万円
給料及び手当
730百万円
2,729
2,898
賞与引当金繰入額
549
581
役員賞与引当金繰入額
38
47
退職給付費用
187
188
役員退職慰労引当金繰入額
19
3
支払手数料
1,537
1,422
減価償却費
258
291
製品保証引当金繰入額
△72
△27
おおよその割合
※2
販売費
54%
53%
一般管理費
46
47
前事業年度
(自 2024年4月1日
至 2025年3月31日)
当事業年度
(自 2025年4月1日
至 2026年3月31日)
関係会社との取引に係るものが次のとおり含まれております。
営業取引による取引高
売上高
5,869百万円
5,949百万円
仕入高
10,897
10,226
部材有償支給高
182
154
販売費及び一般管理費
48
72
1,008
1,771
営業取引以外の取引高
(有価証券関係)
前事業年度(2025年3月31日)
関係会社株式は、市場価格のない株式等のため、関係会社株式の時価を記載しておりません。
なお、市場価格のない株式等の関係会社株式の貸借対照表計上額は次のとおりです。
区分
前事業年度
(百万円)
関係会社株式
7,947
当事業年度(2026年3月31日)
関係会社株式は、市場価格のない株式等のため、関係会社株式の時価を記載しておりません。
なお、市場価格のない株式等の関係会社株式の貸借対照表計上額は次のとおりです。
区分
関係会社株式
当事業年度
(百万円)
7,947
103/116
EDINET提出書類
株式会社遠藤照明(E01986)
有価証券報告書
(税効果会計関係)
1.繰延税金資産及び繰延税金負債の発生の主な原因別の内訳
前事業年度
(2025年3月31日)
当事業年度
(2026年3月31日)
棚卸資産評価損
272百万円
213百万円
賞与引当金
201
220
貸倒引当金
25
0
役員退職慰労引当金
40
57
減価償却費及び減損損失
17
17
製品保証引当金
154
147
関係会社株式評価損
202
202
繰越欠損金
799
534
繰延税金資産
69
81
繰延税金資産小計
税務上の繰越欠損金に係る評価
性引当額
将来減算一時差異等の合計に係
る評価性引当額
評価性引当額小計
1,783
1,475
−
−
△399
△412
△399
△412
繰延税金資産合計
1,384
1,063
△60
△58
その他有価証券評価差額金
△9
△14
その他
△20
−
△90
△72
1,293
991
その他
繰延税金負債
前払年金費用
繰延税金負債合計
繰延税金資産純額
2.法定実効税率と税効果会計適用後の法人税等の負担率との差異の原因となった主要な項目別の内訳
前事業年度
当事業年度
(2025年3月31日)
(2026年3月31日)
法定実効税率
30.6%
30.6%
(調整)
交際費等永久に損金に算入されない項目
税額控除
1.1
0.8
△4.0
△3.0
住民税均等割等
1.9
1.2
源泉所得税
0.6
1.8
評価性引当額の増減
△40.7
0.4
外国子会社からの受取配当金の益金不算入
△10.7
△13.4
税率変更による影響
1.3
−
その他
△5.7
△0.9
税効果会計適用後の法人税等の負担率
△25.6
17.5
(収益認識関係)
顧客との契約から生じる収益を理解するための基礎となる情報は、連結財務諸表「注記事項(収益認識関係)」
に同一の内容を記載しているので、注記を省略しております。
(重要な後発事象)
該当事項はありません。
104/116
EDINET提出書類
株式会社遠藤照明(E01986)
有価証券報告書
④ 【附属明細表】
【有形固定資産等明細表】
区分
資産の種類
(単位:百万円)
減価償却
当期末残高
累計額
2,437
3,108
当期首残高
当期増加額
当期減少額
当期償却額
2,562
24
0
148
構築物
7
−
−
1
5
177
機械及び装置
14
0
0
4
10
991
車両運搬具
0
1
0
0
1
19
128
36
3
71
89
1,414
有形固定資産建物
工具、器具及び備品
土地
3,192
−
−
−
3,192
−
リース資産
25
−
−
3
21
3
建設仮勘定
0
70
69
−
0
−
5,929
132
73
230
5,758
5,714
有形固定資産計
無形固定資産 ソフトウエア
452
309
−
190
572
−
ソフトウエア仮勘定
14
327
309
−
31
−
その他
2
−
−
0
2
−
469
637
309
190
606
−
1,350
−
−
30
1,320
659
無形固定資産計
投資その他の
投資不動産
資産
(注)1. 当期増加額のうち主なものは、次のとおりであります。
ソフトウエア
照明設計支援システム
143百万円
(注)2. 当期減少額のうち主なものは、次のとおりであります。
金型
金型一式
3百万円
【引当金明細表】
(単位:百万円)
科目
当期首残高
当期増加額
当期減少額
当期末残高
貸倒引当金
81
−
79
2
賞与引当金
658
700
658
700
役員賞与引当金
38
47
38
47
製品保証引当金
496
10
37
468
役員退職慰労引当金
127
3
131
−
(2) 【主な資産及び負債の内容】
連結財務諸表を作成しているため、記載を省略しております。
(3) 【その他】
該当事項はありません。
105/116
EDINET提出書類
株式会社遠藤照明(E01986)
有価証券報告書
第6 【提出会社の株式事務の概要】
事業年度
毎年4月1日から3月31日まで
定時株主総会
6月中
基準日
3月31日
剰余金の配当の基準日
9月30日
3月31日
1単元の株式数
100株
単元未満株式の買取り
取扱場所
株主名簿管理人
取次所
買取手数料
(特別口座)
大阪市中央区伏見町三丁目6番3号
三菱UFJ信託銀行株式会社大阪証券代行部
(特別口座)
東京都千代田区丸の内一丁目4番5号
三菱UFJ信託銀行株式会社
−
無料
公告掲載方法
当社の公告方法は、電子公告とする。ただし、事故その他やむを得ない事由によって
電子公告による公告をすることができない場合は、日本経済新聞に掲載して行う。
なお、電子公告は当社のホームページに掲載しており、そのアドレスは次のとおりで
ある。
https://www.endo-lighting.co.jp/
株主に対する特典
なし
(注)
当社の株主は、その有する単元未満株式について、次に掲げる権利以外の権利を行使することができない。
会社法第189条第2項に掲げる権利
会社法第166条第1項の規定による請求をする権利
株主の有する株式数に応じて募集株式の割当て及び募集新株予約権の割当てを受ける権利
株主の有する単元未満株式の数と併せて単元株式数となる数の株式を売り渡すことを請求する権利
106/116
EDINET提出書類
株式会社遠藤照明(E01986)
有価証券報告書
第7 【提出会社の参考情報】
1 【提出会社の親会社等の情報】
当社には、金融商品取引法第24条の7第1項に規定する親会社等はありません。
2 【その他の参考情報】
当事業年度の開始日から有価証券報告書提出日までの間に次の書類を提出しております。
(1) 有価証券報告書及びその添付書類並びに確認書
事業年度第54期(自 2024年4月1日至 2025年3月31日)
2025年6月24日関東財務局長に提出
(2) 内部統制報告書及びその添付書類
2025年6月24日関東財務局長に提出
(3) 半期報告書及び確認書
第55期中(自 2025年4月1日
至
2025年9月30日)
2025年11月14日関東財務局長に提出
(4) 臨時報告書
企業内容等の開示に関する内閣府令第19条第2項第9号の2(株主総
2025年6月26日関東財務局長に提出
会における議決権行使の結果)の規定に基づく臨時報告書
(5) 自己株券買付状況報告書
報告期間(自 2025年4月1日
報告期間(自 2025年5月1日
報告期間(自 2025年6月1日
報告期間(自 2025年7月1日
報告期間(自 2025年8月1日
報告期間(自 2025年9月1日
報告期間(自 2025年10月1日
至
至
至
至
至
至
至
2025年4月30日)
2025年5月31日)
2025年6月30日)
2025年7月31日)
2025年8月31日)
2025年9月30日)
2025年10月31日)
2025年6月24日関東財務局長に提出
2025年6月20日関東財務局長に提出
2025年7月7日関東財務局長に提出
2025年8月5日関東財務局長に提出
2025年9月5日関東財務局長に提出
2025年10月3日関東財務局長に提出
2025年11月14日関東財務局長に提出
(6) 自己株券買付状況報告書の訂正報告書
報告期間(自 2025年8月1日至 2025年8月31日)
報告期間(自 2025年9月1日至 2025年9月30日)
2025年11月14日関東財務局長に提出
2025年11月14日関東財務局長に提出
(7) 有価証券届出書及びその添付書類
第2回無担保転換社債型新株予約権付社債
2025年10月31日関東財務局長に提出
(8) 有価証券届出書の訂正届出書
訂正届出書(上記(7)有価証券届出書の訂正届出書)
2025年11月14日関東財務局長に提出
107/116
EDINET提出書類
株式会社遠藤照明(E01986)
有価証券報告書
第二部【提出会社の保証会社等の情報】
該当事項はありません。
108/116
EDINET提出書類
株式会社遠藤照明(E01986)
有価証券報告書
独立監査人の監査報告書及び内部統制監査報告書
2026年6月23日
株式会社遠藤照明
取締役会
御中
太
陽
有
限
責
任
監
査
法
人
大阪事務所
指定有限責任社員
業務執行社員
公認会計士
荒
井
巌
指定有限責任社員
業務執行社員
公認会計士
有
久
衛
<連結財務諸表監査>
監査意見
当監査法人は、金融商品取引法第193条の2第1項の規定に基づく監査証明を行うため、「経理の状況」に掲げられて
いる株式会社遠藤照明の2025年4月1日から2026年3月31日までの連結会計年度の連結財務諸表、すなわち、連結貸借
対照表、連結損益計算書、連結包括利益計算書、連結株主資本等変動計算書、連結キャッシュ・フロー計算書、連結財
務諸表作成のための基本となる重要な事項、その他の注記及び連結附属明細表について監査を行った。
当監査法人は、上記の連結財務諸表が、我が国において一般に公正妥当と認められる企業会計の基準に準拠して、株
式会社遠藤照明及び連結子会社の2026年3月31日現在の財政状態並びに同日をもって終了する連結会計年度の経営成績
及びキャッシュ・フローの状況を、全ての重要な点において適正に表示しているものと認める。
監査意見の根拠
当監査法人は、我が国において一般に公正妥当と認められる監査の基準に準拠して監査を行った。監査の基準におけ
る当監査法人の責任は、「連結財務諸表監査における監査人の責任」に記載されている。当監査法人は、我が国におけ
る職業倫理に関する規定(社会的影響度の高い事業体の財務諸表監査に適用される規定を含む。)に従って、会社及び
連結子会社から独立しており、また、監査人としてのその他の倫理上の責任を果たしている。当監査法人は、意見表明
の基礎となる十分かつ適切な監査証拠を入手したと判断している。
監査上の主要な検討事項
監査上の主要な検討事項とは、当連結会計年度の連結財務諸表の監査において、監査人が職業的専門家として特に重
要であると判断した事項である。監査上の主要な検討事項は、連結財務諸表全体に対する監査の実施過程及び監査意見
の形成において対応した事項であり、当監査法人は、当該事項に対して個別に意見を表明するものではない。
109/116
EDINET提出書類
株式会社遠藤照明(E01986)
有価証券報告書
棚卸資産の評価
監査上の主要な検討事項の内容及び決定理由
監査上の対応
会社は、2026年3月31日現在、重要な会計上の見積り
当監査法人は、棚卸資産の評価の妥当性を検討するに
に 関 す る 注記 に 記載 さ れ て い る と お り 商品及 び 製品当たり、主に以下の監査手続を実施した。
11,444百万円、仕掛品494百万円、原材料及び貯蔵品
1,376百万円を計上している。
(1) 内部統制の評価
連結財務諸表作成のための基本となる重要な事項3.
棚卸資産の評価に関連する内部統制の整備及び運用状
(1) 重要な資産の評価基準及び評価方法に記載のとお 況の有効性を評価した。評価に当たっては、特に棚卸資
り、棚卸資産の連結貸借対照表価額は収益性の低下に基産の評価に利用する情報の正確性・網羅性及び目的整合
づく簿価切下げの方法を採用しており、期末における正性を担保するための下記の統制に焦点を当てた。
味売却価額が取得原価よりも下落している場合には、当・廃番品の判定の基礎となる廃番登録情報の入力プロ
該正味売却価額をもって連結貸借対照表価額としてい
セス
る。
・滞留品を識別するための販売実績に関する製品販売
会社の主力製品は小売店舗やショールーム等の商業施
日付の入力プロセス
設向けのLED照明器具である。昨今、技術革新の速度が
増しており、新しいLED素子や電源等が開発されること (2) 決算時における棚卸資産の評価
から、会社は一定期間が経過するごとに製品カタログを ・会社の棚卸資産の評価方針が、廃番方針等を反映し
刷新して新製品を投入する。その結果、多種多様な品揃
た合理的なものであること、並びに、時の経過による
えを実現して、顧客ニーズに応えてきた。そのため、会
減価率の算定に用いる損失発生割合の見積りの仮定が
社製品には陳腐化リスクや滞留リスクが常に内在してい
合理的であることを検証するため、関連する社内規程
る。加えて、LED照明器具が普及して汎用品化が進展し
を閲覧し、当該評価方針が棚卸資産の収益性低下や陳
たことから、新規企業が参入する厳しい価格競争の環境
腐化の実態を適切に反映しており、「棚卸資産の評価
にあり、製品原価割れ販売のリスクも潜んでいる。
に関する会計基準」に準拠していることを確かめた。
そこで、会社は、正味売却価額が取得原価よりも下落・棚卸資産の評価方針に従い、適切に棚卸資産評価損
している場合の簿価切下げルールと、廃番品及び滞留品
が算定されているかを検証するため、会社が作成した
の簿価切下げルールを設けて、棚卸資産の収益性の低下
棚卸資産評価損算定資料の生成過程を質問及び関連
を連結財務諸表に反映させている。
データの閲覧により理解するとともに、その正確性と
このような棚卸資産の評価は、時の経過による減価率
網羅性について、当監査法人内部のIT専門家と連携し
の設定や正味売却価額の算定に関して、経営者による一
て検討した。
定の仮定に基づき見積られており、判断を伴うことか ・収益性の低下に基づく簿価切下げの方法について
ら、当監査法人は、当該事項を監査上の主要な検討事項
は、直近1年間の販売実績における最低売価と正味売
に該当するものと判断した。
却価額が一致していることを確かめた。
・廃番品については、社内の承認を経て廃番登録が行
われていることを関連する申請書の閲覧により確かめ
た。また、廃番登録に該当がある場合には、棚卸資産
のデータと廃番登録申請を照合し、廃番日登録の正確
性及び網羅性の検証を実施した。
・滞留品については入出荷データを閲覧し、滞留品が
適切に識別されていることを確かめた。
その他の記載内容
その他の記載内容は、有価証券報告書に含まれる情報のうち、連結財務諸表及び財務諸表並びにこれらの監査報告書
以外の情報である。経営者の責任は、その他の記載内容を作成し開示することにある。また、監査役及び監査役会の責
任は、その他の記載内容の報告プロセスの整備及び運用における取締役の職務の執行を監視することにある。
当監査法人の連結財務諸表に対する監査意見の対象にはその他の記載内容は含まれておらず、当監査法人はその他の
記載内容に対して意見を表明するものではない。
連結財務諸表監査における当監査法人の責任は、その他の記載内容を通読し、通読の過程において、その他の記載内
容と連結財務諸表又は当監査法人が監査の過程で得た知識との間に重要な相違があるかどうか検討すること、また、そ
のような重要な相違以外にその他の記載内容に重要な誤りの兆候があるかどうか注意を払うことにある。
当監査法人は、実施した作業に基づき、その他の記載内容に重要な誤りがあると判断した場合には、その事実を報告
することが求められている。
その他の記載内容に関して、当監査法人が報告すべき事項はない。
110/116
EDINET提出書類
株式会社遠藤照明(E01986)
有価証券報告書
連結財務諸表に対する経営者並びに監査役及び監査役会の責任
経営者の責任は、我が国において一般に公正妥当と認められる企業会計の基準に準拠して連結財務諸表を作成し適正
に表示することにある。これには、不正又は誤謬による重要な虚偽表示のない連結財務諸表を作成し適正に表示するた
めに経営者が必要と判断した内部統制を整備及び運用することが含まれる。
連結財務諸表を作成するに当たり、経営者は、継続企業の前提に基づき連結財務諸表を作成することが適切であるか
どうかを評価し、我が国において一般に公正妥当と認められる企業会計の基準に基づいて継続企業に関する事項を開示
する必要がある場合には当該事項を開示する責任がある。
監査役及び監査役会の責任は、財務報告プロセスの整備及び運用における取締役の職務の執行を監視することにあ
る。
連結財務諸表監査における監査人の責任
監査人の責任は、監査人が実施した監査に基づいて、全体としての連結財務諸表に不正又は誤謬による重要な虚偽表
示がないかどうかについて合理的な保証を得て、監査報告書において独立の立場から連結財務諸表に対する意見を表明
することにある。虚偽表示は、不正又は誤謬により発生する可能性があり、個別に又は集計すると、連結財務諸表の利
用者の意思決定に影響を与えると合理的に見込まれる場合に、重要性があると判断される。
監査人は、我が国において一般に公正妥当と認められる監査の基準に従って、監査の過程を通じて、職業的専門家と
しての判断を行い、職業的懐疑心を保持して以下を実施する。
・
不正又は誤謬による重要な虚偽表示リスクを識別し、評価する。また、重要な虚偽表示リスクに対応した監査手続
を立案し、実施する。監査手続の選択及び適用は監査人の判断による。さらに、意見表明の基礎となる十分かつ適切
な監査証拠を入手する。
・
連結財務諸表監査の目的は、内部統制の有効性について意見表明するためのものではないが、監査人は、リスク評
価の実施に際して、状況に応じた適切な監査手続を立案するために、監査に関連する内部統制を検討する。
・
経営者が採用した会計方針及びその適用方法の適切性、並びに経営者によって行われた会計上の見積りの合理性及
び関連する注記事項の妥当性を評価する。
・
経営者が継続企業を前提として連結財務諸表を作成することが適切であるかどうか、また、入手した監査証拠に基
づき、継続企業の前提に重要な疑義を生じさせるような事象又は状況に関して重要な不確実性が認められるかどうか
結論付ける。継続企業の前提に関する重要な不確実性が認められる場合は、監査報告書において連結財務諸表の注記
事項に注意を喚起すること、又は重要な不確実性に関する連結財務諸表の注記事項が適切でない場合は、連結財務諸
表に対して除外事項付意見を表明することが求められている。監査人の結論は、監査報告書日までに入手した監査証
拠に基づいているが、将来の事象や状況により、企業は継続企業として存続できなくなる可能性がある。
・
連結財務諸表の表示及び注記事項が、我が国において一般に公正妥当と認められる企業会計の基準に準拠している
かどうかとともに、関連する注記事項を含めた連結財務諸表の表示、構成及び内容、並びに連結財務諸表が基礎とな
る取引や会計事象を適正に表示しているかどうかを評価する。
・
連結財務諸表に対する意見表明の基礎となる、会社及び連結子会社の財務情報に関する十分かつ適切な監査証拠を
入手するために、連結財務諸表の監査を計画し実施する。監査人は、連結財務諸表の監査に関する指揮、監督及び査
閲に関して責任がある。監査人は、単独で監査意見に対して責任を負う。
監査人は、監査役及び監査役会に対して、計画した監査の範囲とその実施時期、監査の実施過程で識別した内部統制
の重要な不備を含む監査上の重要な発見事項、及び監査の基準で求められているその他の事項について報告を行う。
111/116
EDINET提出書類
株式会社遠藤照明(E01986)
有価証券報告書
監査人は、監査役及び監査役会に対して、独立性についての我が国における職業倫理に関する規定を遵守したこと、
並びに監査人の独立性に影響を与えると合理的に考えられる事項、及び阻害要因を除去するための対応策を講じている
場合又は阻害要因を許容可能な水準にまで軽減するためのセーフガードを適用している場合はその内容について報告を
行う。
監査人は、監査役及び監査役会と協議した事項のうち、当連結会計年度の連結財務諸表の監査で特に重要であると判
断した事項を監査上の主要な検討事項と決定し、監査報告書において記載する。ただし、法令等により当該事項の公表
が禁止されている場合や、極めて限定的ではあるが、監査報告書において報告することにより生じる不利益が公共の利
益を上回ると合理的に見込まれるため、監査人が報告すべきでないと判断した場合は、当該事項を記載しない。
<内部統制監査>
監査意見
当監査法人は、金融商品取引法第193条の2第2項の規定に基づく監査証明を行うため、株式会社遠藤照明の2026年3
月31日現在の内部統制報告書について監査を行った。
当監査法人は、株式会社遠藤照明が2026年3月31日現在の財務報告に係る内部統制は有効であると表示した上記の内
部統制報告書が、我が国において一般に公正妥当と認められる財務報告に係る内部統制の評価の基準に準拠して、財務
報告に係る内部統制の評価結果について、全ての重要な点において適正に表示しているものと認める。
監査意見の根拠
当監査法人は、我が国において一般に公正妥当と認められる財務報告に係る内部統制の監査の基準に準拠して内部統
制監査を行った。財務報告に係る内部統制の監査の基準における当監査法人の責任は、「内部統制監査における監査人
の責任」に記載されている。当監査法人は、我が国における職業倫理に関する規定(社会的影響度の高い事業体の財務
諸表監査に適用される規定を含む。)に従って、会社及び連結子会社から独立しており、また、監査人としてのその他
の倫理上の責任を果たしている。当監査法人は、意見表明の基礎となる十分かつ適切な監査証拠を入手したと判断して
いる。
内部統制報告書に対する経営者並びに監査役及び監査役会の責任
経営者の責任は、財務報告に係る内部統制を整備及び運用し、我が国において一般に公正妥当と認められる財務報告
に係る内部統制の評価の基準に準拠して内部統制報告書を作成し適正に表示することにある。
監査役及び監査役会の責任は、財務報告に係る内部統制の整備及び運用状況を監視、検証することにある。
なお、財務報告に係る内部統制により財務報告の虚偽の記載を完全には防止又は発見することができない可能性があ
る。
内部統制監査における監査人の責任
監査人の責任は、監査人が実施した内部統制監査に基づいて、内部統制報告書に重要な虚偽表示がないかどうかにつ
いて合理的な保証を得て、内部統制監査報告書において独立の立場から内部統制報告書に対する意見を表明することに
ある。
監査人は、我が国において一般に公正妥当と認められる財務報告に係る内部統制の監査の基準に従って、監査の過程
を通じて、職業的専門家としての判断を行い、職業的懐疑心を保持して以下を実施する。
・
内部統制報告書における財務報告に係る内部統制の評価結果について監査証拠を入手するための監査手続を実施す
る。内部統制監査の監査手続は、監査人の判断により、財務報告の信頼性に及ぼす影響の重要性に基づいて選択及び
適用される。
112/116
EDINET提出書類
株式会社遠藤照明(E01986)
有価証券報告書
・
財務報告に係る内部統制の評価範囲、評価手続及び評価結果について経営者が行った記載を含め、全体としての内
部統制報告書の表示を検討する。
・
内部統制報告書における財務報告に係る内部統制の評価結果に関する十分かつ適切な監査証拠を入手するために、
内部統制の監査を計画し実施する。監査人は、内部統制報告書の監査に関する指揮、監督及び査閲に関して責任があ
る。監査人は、単独で監査意見に対して責任を負う。
監査人は、監査役及び監査役会に対して、計画した内部統制監査の範囲とその実施時期、内部統制監査の実施結果、
識別した内部統制の開示すべき重要な不備、その是正結果、及び内部統制の監査の基準で求められているその他の事項
について報告を行う。
監査人は、監査役及び監査役会に対して、独立性についての我が国における職業倫理に関する規定を遵守したこと、
並びに監査人の独立性に影響を与えると合理的に考えられる事項、及び阻害要因を除去するための対応策を講じている
場合又は阻害要因を許容可能な水準にまで軽減するためのセーフガードを適用している場合はその内容について報告を
行う。
<報酬関連情報>
当監査法人及び当監査法人と同一のネットワークに属する者に対する、会社及び子会社の監査証明業務に基づく報酬
及び非監査業務に基づく報酬の額は、「提出会社の状況」に含まれるコーポレート・ガバナンスの状況等(3)【監査の状
況】に記載されている。
利害関係
会社及び連結子会社と当監査法人又は業務執行社員との間には、公認会計士法の規定により記載すべき利害関係はな
い。
以
※1.上記の監査報告書の原本は当社(有価証券報告書提出会社)が別途保管しております。
2.XBRLデータは監査の対象には含まれていません。
113/116
上
EDINET提出書類
株式会社遠藤照明(E01986)
有価証券報告書
独立監査人の監査報告書
2026年6月23日
株式会社遠藤照明
取締役会
御中
太
陽
有
限
責
任
監
査
法
人
大阪事務所
指定有限責任社員
業務執行社員
公認会計士
荒
井
巌
指定有限責任社員
業務執行社員
公認会計士
有
久
衛
<財務諸表監査>
監査意見
当監査法人は、金融商品取引法第193条の2第1項の規定に基づく監査証明を行うため、「経理の状況」に掲げられて
いる株式会社遠藤照明の2025年4月1日から2026年3月31日までの第55期事業年度の財務諸表、すなわち、貸借対照
表、損益計算書、株主資本等変動計算書、重要な会計方針、その他の注記及び附属明細表について監査を行った。
当監査法人は、上記の財務諸表が、我が国において一般に公正妥当と認められる企業会計の基準に準拠して、株式会
社遠藤照明の2026年3月31日現在の財政状態及び同日をもって終了する事業年度の経営成績を、全ての重要な点におい
て適正に表示しているものと認める。
監査意見の根拠
当監査法人は、我が国において一般に公正妥当と認められる監査の基準に準拠して監査を行った。監査の基準におけ
る当監査法人の責任は、「財務諸表監査における監査人の責任」に記載されている。当監査法人は、我が国における職
業倫理に関する規定(社会的影響度の高い事業体の財務諸表監査に適用される規定を含む。)に従って、会社から独立
しており、また、監査人としてのその他の倫理上の責任を果たしている。当監査法人は、意見表明の基礎となる十分か
つ適切な監査証拠を入手したと判断している。
監査上の主要な検討事項
監査上の主要な検討事項とは、当事業年度の財務諸表の監査において、監査人が職業的専門家として特に重要である
と判断した事項である。監査上の主要な検討事項は、財務諸表全体に対する監査の実施過程及び監査意見の形成におい
て対応した事項であり、当監査法人は、当該事項に対して個別に意見を表明するものではない。
棚卸資産の評価
連結財務諸表の監査報告書に記載されている監査上の主要な検討事項(棚卸資産の評価)と同一内容であるため、記
載を省略している。
114/116
EDINET提出書類
株式会社遠藤照明(E01986)
有価証券報告書
その他の記載内容
その他の記載内容は、有価証券報告書に含まれる情報のうち、連結財務諸表及び財務諸表並びにこれらの監査報告書
以外の情報である。経営者の責任は、その他の記載内容を作成し開示することにある。また、監査役及び監査役会の責
任は、その他の記載内容の報告プロセスの整備及び運用における取締役の職務の執行を監視することにある。
当監査法人の財務諸表に対する監査意見の対象にはその他の記載内容は含まれておらず、当監査法人はその他の記載
内容に対して意見を表明するものではない。
財務諸表監査における当監査法人の責任は、その他の記載内容を通読し、通読の過程において、その他の記載内容と
財務諸表又は当監査法人が監査の過程で得た知識との間に重要な相違があるかどうか検討すること、また、そのような
重要な相違以外にその他の記載内容に重要な誤りの兆候があるかどうか注意を払うことにある。
当監査法人は、実施した作業に基づき、その他の記載内容に重要な誤りがあると判断した場合には、その事実を報告
することが求められている。
その他の記載内容に関して、当監査法人が報告すべき事項はない。
財務諸表に対する経営者並びに監査役及び監査役会の責任
経営者の責任は、我が国において一般に公正妥当と認められる企業会計の基準に準拠して財務諸表を作成し適正に表
示することにある。これには、不正又は誤謬による重要な虚偽表示のない財務諸表を作成し適正に表示するために経営
者が必要と判断した内部統制を整備及び運用することが含まれる。
財務諸表を作成するに当たり、経営者は、継続企業の前提に基づき財務諸表を作成することが適切であるかどうかを
評価し、我が国において一般に公正妥当と認められる企業会計の基準に基づいて継続企業に関する事項を開示する必要
がある場合には当該事項を開示する責任がある。
監査役及び監査役会の責任は、財務報告プロセスの整備及び運用における取締役の職務の執行を監視することにあ
る。
財務諸表監査における監査人の責任
監査人の責任は、監査人が実施した監査に基づいて、全体としての財務諸表に不正又は誤謬による重要な虚偽表示が
ないかどうかについて合理的な保証を得て、監査報告書において独立の立場から財務諸表に対する意見を表明すること
にある。虚偽表示は、不正又は誤謬により発生する可能性があり、個別に又は集計すると、財務諸表の利用者の意思決
定に影響を与えると合理的に見込まれる場合に、重要性があると判断される。
監査人は、我が国において一般に公正妥当と認められる監査の基準に従って、監査の過程を通じて、職業的専門家と
しての判断を行い、職業的懐疑心を保持して以下を実施する。
・
不正又は誤謬による重要な虚偽表示リスクを識別し、評価する。また、重要な虚偽表示リスクに対応した監査手続
を立案し、実施する。監査手続の選択及び適用は監査人の判断による。さらに、意見表明の基礎となる十分かつ適切
な監査証拠を入手する。
・
財務諸表監査の目的は、内部統制の有効性について意見表明するためのものではないが、監査人は、リスク評価の
実施に際して、状況に応じた適切な監査手続を立案するために、監査に関連する内部統制を検討する。
・
経営者が採用した会計方針及びその適用方法の適切性、並びに経営者によって行われた会計上の見積りの合理性及
び関連する注記事項の妥当性を評価する。
115/116
EDINET提出書類
株式会社遠藤照明(E01986)
有価証券報告書
・
経営者が継続企業を前提として財務諸表を作成することが適切であるかどうか、また、入手した監査証拠に基づ
き、継続企業の前提に重要な疑義を生じさせるような事象又は状況に関して重要な不確実性が認められるかどうか結
論付ける。継続企業の前提に関する重要な不確実性が認められる場合は、監査報告書において財務諸表の注記事項に
注意を喚起すること、又は重要な不確実性に関する財務諸表の注記事項が適切でない場合は、財務諸表に対して除外
事項付意見を表明することが求められている。監査人の結論は、監査報告書日までに入手した監査証拠に基づいてい
るが、将来の事象や状況により、企業は継続企業として存続できなくなる可能性がある。
・
財務諸表の表示及び注記事項が、我が国において一般に公正妥当と認められる企業会計の基準に準拠しているかど
うかとともに、関連する注記事項を含めた財務諸表の表示、構成及び内容、並びに財務諸表が基礎となる取引や会計
事象を適正に表示しているかどうかを評価する。
監査人は、監査役及び監査役会に対して、計画した監査の範囲とその実施時期、監査の実施過程で識別した内部統制
の重要な不備を含む監査上の重要な発見事項、及び監査の基準で求められているその他の事項について報告を行う。
監査人は、監査役及び監査役会に対して、独立性についての我が国における職業倫理に関する規定を遵守したこと、
並びに監査人の独立性に影響を与えると合理的に考えられる事項、及び阻害要因を除去するための対応策を講じている
場合又は阻害要因を許容可能な水準にまで軽減するためのセーフガードを適用している場合はその内容について報告を
行う。
監査人は、監査役及び監査役会と協議した事項のうち、当事業年度の財務諸表の監査で特に重要であると判断した事
項を監査上の主要な検討事項と決定し、監査報告書において記載する。ただし、法令等により当該事項の公表が禁止さ
れている場合や、極めて限定的ではあるが、監査報告書において報告することにより生じる不利益が公共の利益を上回
ると合理的に見込まれるため、監査人が報告すべきでないと判断した場合は、当該事項を記載しない。
<報酬関連情報>
報酬関連情報は、連結財務諸表の監査報告書に記載されている。
利害関係
会社と当監査法人又は業務執行社員との間には、公認会計士法の規定により記載すべき利害関係はない。
以
※1.上記の監査報告書の原本は当社(有価証券報告書提出会社)が別途保管しております。
2.XBRLデータは監査の対象には含まれていません。
116/116
上