2026年3月期決算短 決算短信 信〔日本基 日本基準 準〕(連結 連結) ) 2026年5月12日 東 上場会社名 スタンレー電気株式会社 コード番号 6923 URL https://www.stanley-electric.com 代表者 (役職名) 代表取締役社長執行役員 (氏名) 貝住泰昭 問合せ先責任者…
2026年3月期決算短
決算短信
信〔日本基
日本基準
準〕(連結
連結)
)
2026年5月12日
東
上場会社名 スタンレー電気株式会社
コード番号
6923
URL https://www.stanley-electric.com
代表者
(役職名) 代表取締役社長執行役員
(氏名) 貝住泰昭
問合せ先責任者 (役職名) 常務執行役員コーポレート本部長
(氏名) 桑田郁夫
定時株主総会開催予定日
2026年6月25日
配当支払開始予定日
有価証券報告書提出予定日
2026年6月24日
決算補足説明資料作成の有無 : 有
決算説明会開催の有無
: 有
( 証券アナリスト・機関投資家向け )
上場取引所
TEL 03(6866)2222
2026年6月8日
(百万円未満切捨て)
1.2026年3月期の連結業績(2025年4月1日~2026年3月31日)
(1)連結経営成績
(%表示は対前期増減率)
売上高
2026年3月期
2025年3月期
営業利益
親会社株主に帰属する
当期純利益
経常利益
百万円
%
百万円
%
百万円
%
百万円
%
518,456
509,565
1.7
7.9
42,674
49,002
△12.9
36.7
50,853
55,454
△8.3
15.4
32,813
32,058
2.4
21.0
(注)包括利益 2026年3月期
80,172百万円
1株当たり当期純利益
( 301.0 %)
2025年3月期
19,993百万円
潜在株式調整後
1株当たり当期純利益
自己資本
当期純利益率
総資産経常利益率売上高営業利益率
円銭
2026年3月期
2025年3月期
(参考) 持分法投資損益
円銭
240.51
205.73
2026年3月期
%
240.44
-
1,052百万円
2025年3月期
7.0
6.3
428百万円
( △75.8%)
%
%
6.5
7.6
8.2
9.6
(2)連結財政状態
総資産
純資産
自己資本比率
百万円
2026年3月期
2025年3月期
(参考) 自己資本
百万円
809,264
749,605
2026年3月期 454,213百万円
1株当たり純資産
%
円銭
571,938
56.1
598,906
64.8
2025年3月期 485,499百万円
3,695.49
3,255.93
(3)連結キャッシュ・フローの状況
現金及び現金同等物期末残高
営業活動によるキャッシュ・フロー
投資活動によるキャッシュ・フロー
財務活動によるキャッシュ・フロー
百万円
百万円
百万円
百万円
78,344
66,577
△48,901
△64,871
△31,712
△19,968
135,925
128,442
2026年3月期
2025年3月期
2.配当の状況
年間配当金
期末
第1四半期末第2四半期末第3四半期末
円銭
2025年3月期
2026年3月期
2027年3月期(予想)
円銭
-
-
-
32.00
49.00
55.00
円銭
-
-
-
配当金総額
(合計)
合計
配当性向
(連結)
純資産
配当率
(連結)
円銭
円銭
百万円
%
%
40.00
55.00
56.00
72.00
104.00
111.00
11,006
13,166
35.0
43.2
40.1
2.2
3.0
3.2027年3月期の連結業績予想(2026年4月1日~2027年3月31日)
(%表示は、通期は対前期、四半期は対前年同四半期増減率)
売上高
第2四半期(累計)
通期
営業利益
親会社株主に帰属する 1株当たり
当期純利益
当期純利益
経常利益
百万円
%
百万円
%
百万円
%
百万円
%
円銭
290,000
622,000
16.7
20.0
17,000
55,000
△7.9
28.9
18,000
58,000
△18.2
14.1
8,000
34,000
△21.3
3.6
65.09
276.62
※ 注記事項
(1)期中における連結範囲の重要な変更 : 有
新規
-
社 (社名)
、
1
除外
社 (社名)
株式会社スタンレー鶴岡
製作所
(2)会計方針の変更・会計上の見積りの変更・修正再表示
① 会計基準等の改正に伴う会計方針の変更
:無
② ①以外の会計方針の変更
:無
③ 会計上の見積りの変更
:無
④ 修正再表示
:無
(3)発行済株式数(普通株式)
① 期末発行済株式数 (自己株式を含む)
② 期末自己株式数
③ 期中平均株式数
2026年3月期
126,000,000 株 2025年3月期
152,000,000 株
2026年3月期
3,089,694 株 2025年3月期
2,887,924 株
2026年3月期
136,436,616 株 2025年3月期
155,828,256 株
(参考) 個別業績の概要
2026年3月期の個別業績(2025年4月1日~2026年3月31日)
(1)個別経営成績
(%表示は対前期増減率)
売上高
2026年3月期
2025年3月期
営業利益
経常利益
当期純利益
百万円
%
百万円
%
百万円
%
百万円
%
171,575
171,340
0.1
△1.1
1,034
4,563
△77.3
57.6
30,215
17,751
70.2
2.6
41,562
16,472
152.3
△13.1
1株当たり当期純利益
2026年3月期
2025年3月期
潜在株式調整後
1株当たり当期純利益
円銭
円銭
304.63
105.71
304.55
-
(2)個別財政状態
総資産
純資産
百万円
2026年3月期
2025年3月期
(参考) 自己資本
339,577
324,639
2026年3月期 162,421百万円
自己資本比率
百万円
1株当たり純資産
%
円銭
162,735
47.8
216,768
66.7
2025年3月期 216,376百万円
1,321.47
1,451.10
※ 決算短信は公認会計士又は監査法人の監査の対象外です
※ 業績予想の適切な利用に関する説明、 その他特記事項
当業績予想は、現時点で入手可能な情報に基づき当社が判断した見通しで、 リスクや不確実性を含んでおり、 その達成を当社として約束する趣旨の
ものではありません。実際の業績は、様々な重要な要素により、 これらの業績見通しとは大きく異なる結果となり得ることを、 ご承知おきください。業績予
想の前提条件その他の関連する事項については、決算短信【添付資料】 P.3「今後の見通し」をご覧ください。
決算補足説明資料は、決算発表後、速やかに当社ホームページに掲載する予定です。
スタンレー電気(株) (6923) 2026年3月期決算短信
○添付資料の目次
1.経営成績等の概況 ……………………………………………………………………………………2
(1)当期の経営成績の概況 …………………………………………………………………………2
(2)当期の財政状態の概況 …………………………………………………………………………3
(3)利益配分に関する基本方針及び当期・次期の配当 …………………………………………5
2.企業集団の状況 ………………………………………………………………………………………6
3.経営方針 ………………………………………………………………………………………………9
(1)会社の経営の基本方針 …………………………………………………………………………9
(2)目標とする経営指標 ……………………………………………………………………………9
(3)中長期的な会社の経営戦略 ……………………………………………………………………9
4.会計基準の選択に関する基本的な考え方 …………………………………………………………10
5.連結財務諸表及び主な注記 …………………………………………………………………………11
(1)連結貸借対照表 …………………………………………………………………………………11
(2)連結損益計算書及び連結包括利益計算書 ……………………………………………………13
(3)連結株主資本等変動計算書 ……………………………………………………………………15
(4)連結キャッシュ・フロー計算書 ………………………………………………………………17
(5)継続企業の前提に関する注記 …………………………………………………………………19
(6)連結財務諸表作成のための基本となる重要な事項 …………………………………………19
(7)会計方針の変更 …………………………………………………………………………………21
(8)連結財務諸表に関する注記事項 ………………………………………………………………22
(セグメント情報等の注記) ……………………………………………………………………22
(1株当たり情報) ………………………………………………………………………………25
(重要な後発事象) ………………………………………………………………………………26
6.個別財務諸表 …………………………………………………………………………………………28
(1)貸借対照表 ………………………………………………………………………………………28
(2)損益計算書 ………………………………………………………………………………………30
(3)株主資本等変動計算書 …………………………………………………………………………31
-1-
スタンレー電気(株) (6923) 2026年3月期決算短信
1.経営成績等の概況
(1)当期の経営成績の概況
①全般的な営業の概
全般的な営業の概況
況
売上高
(百万円)
営業利益
(百万円)
経常利益
(百万円)
親会社株主
に帰属する
当期純利益
(百万円)
自己資本
当期純利益率
総資産
経常利益率
当連結会計年度
(2026年3月期)
518,456
42,674
50,853
32,813
7.0%
6.5%
前連結会計年度
(2025年3月期)
509,565
49,002
55,454
32,058
6.3%
7.6%
1.7%
△12.9%
△8.3%
2.4%
-
-
増減率
当連結会計年度における世界経済は、中国で景気は緩やかに減速し、欧州及びアジアで持ち直しの動きがみら
れました。日本では、中東情勢の影響を注視する必要があるものの、景気は緩やかに回復しており、米国では一
部に弱さがみられるものの、緩やかな拡大が続きました。
当社並びにグループ各社(以下、当社グループ)の業績は、中国及びアジアにおける厳しい事業環境、米国の
関税及び半導体不足、並びに品質問題に関わる費用による影響を受けました。一方で、前連結会計年度の第3四
半期より連結子会社化しているStanley-Angstrom Electric da Amazonia Ltda.の通年寄与による増収効果があり
ました。
その結果、当連結会計年度における、売上高は5,184億5千6百万円(前期比1.7%増)、営業利益は426億7千4
百万円(前期比12.9%減)、経常利益は508億5千3百万円(前期比8.3%減)、親会社株主に帰属する当期純利益は
328億1千3百万円(前期比2.4%増)となりました。
②セグメント情報の概
セグメント情報の概況
況
売上高(百万円)
営業利益(百万円)
自動車
機器事業
コンポーネ
ンツ事業
電子応用
製品事業
当連結会計年度
(2026年3月期)
447,139
39,323
112,570
前連結会計年度
(2025年3月期)
440,130
37,065
1.6%
6.1%
増減率
自動車
機器事業
コンポーネ
ンツ事業
電子応用
製品事業
3,207
44,937
2,884
9,302
122
116,344
3,133
46,966
2,494
8,810
69
△3.2%
2.4%
△4.3%
15.6%
5.6%
75.8%
その他
その他
1)自動車機器事
自動車機器事業
業
当セグメントにおける主な製品は、自動車用ランプ、二輪車用ランプ等です。
関連する市場の動向について、自動車生産台数は、日本、米州、欧州では横ばい、アジア及び中国では増加と
なり、世界全体では微増となりました。また、二輪車生産台数は、日本、米州、アジアでいずれも増加となり、
世界全体でも増加となりました。
当社グループの自動車機器事業は、自動車用ランプでは、生産革新による合理化効果のプラスの影響があった
一方で、中国及びアジアにおける厳しい事業環境、米国の関税及び半導体不足、並びに品質問題に関わる費用に
よる影響を受けました。二輪車用ランプは、一部地域で減速感がみられたものの概ね堅調に推移しました。また、
前連結会計年度の第3四半期より連結子会社化しているStanley-Angstrom Electric da Amazonia Ltda.の通年寄
与による増収効果がありました。
その結果、当連結会計年度における自動車機器事業の売上高は 4,471億3千9百万円(前期比1.6%増)、営業利
益は449億3千7百万円(前期比4.3%減)となりました。
2)コンポーネンツ事
コンポーネンツ事業
業
当セグメントにおける主な製品は、LED、液晶等です。
主な関連する市場の動向については、車載市場は微増となりました。
-2-
スタンレー電気(株) (6923) 2026年3月期決算短信
このような市場環境のもと、当社グループのコンポーネンツ事業は、車載向け液晶の売上増によるプラス影響
がありました。また、前年度に計上した在庫の適正化を目的とする棚卸資産の処分による一過性費用が剥落した
影響がありました。
その結果、当連結会計年度におけるコンポーネンツ事業の売上高は393億2千3百万円(前期比6.1%増)、営業
利益は28億8千4百万円(前期比15.6%増)となりました。
3)電子応用製品事
電子応用製品事業
業
当セグメントにおける主な製品は、液晶用バックライト、操作パネル、LED照明、電子基板等です。
主な関連する市場の動向については、OA市場は減少、車載インテリア市場は微増、PC・タブレット市場は
増加となりました。
このような市場環境のもと、当社グループの電子応用製品事業は、中国及びアジアにおける厳しい市場環境に
よる影響を受けました。一方で、PC用バックライトの販売増と、前年度に計上した在庫の適正化を目的とする
棚卸資産の処分による一過性費用が剥落した影響がありました。
その結果、当連結会計年度における電子応用製品事業の売上高は1,125億7千万円(前期比3.2%減)、営業利益
は93億2百万円(前期比5.6%増)となりました。
③今後の見通
今後の見通し
し
今後の世界経済は、中東情勢の影響、中国市場の減速及び米国の通商政策等、依然として様々なリスクが存在
しています。
このような事業環境のもと、当社グループの2027年3月期連結業績予想につきまして、岩崎電気株式会社の連
結子会社化及びスタンレーモビリティエレクトリック株式会社の事業活動開始の影響を織り込み、売上高は6,220
億円(前期比20%増)、営業利益は550億円(前期比28.9%増)、経常利益は580億円(前期比14.1%増)、親会社株
主に帰属する当期純利益は340億円(前期比3.6%増)を見込んでおります。
なお、当業績予想につきましては、現時点で入手可能な情報に基づき当社が判断した見通しで、リスクや不確
実性を含んでおり、その達成を当社として約束する趣旨のものではありません。実際の業績は、様々な重要な要
素により、これらの業績見通しとは大きく異なる結果となり得ることを、ご承知おきください。
(2)当期の財政状態の概況
①資産、負債、純資産の状況に関する分
純資産の状況に関する分析
析
当連結会計年度末における総資産は8,092億6千4百万円となり、前連結会計年度末に比べ596億5千9百万円
増加しております。要因は、固定資産が386億4千2百万円増加したこと及び流動資産が210億1千7百万円増加
したことによるものです。固定資産の増加は、投資有価証券が減少したものの、有形固定資産が増加したこと等
によるものです。流動資産の増加は、現金及び預金が増加したこと等によるものです。
負債は2,373億2千5百万円となり、前連結会計年度末に比べ866億2千6百万円増加しております。主な要因
は、短期借入金が増加したこと等によるものです。
純資産は5,719億3千8百万円となり、前連結会計年度末に比べ269億6千7百万円減少しております。主な要
因は、その他の包括利益累計額が278億5千7百万円増加したものの、株主資本が591億4千2百万円減少したこ
と等によるものです。その他の包括利益累計額の増加は、為替換算調整勘定が増加したこと等によるものです。
株主資本の減少は、自己株式の取得等によるものです。
-3-
スタンレー電気(株) (6923) 2026年3月期決算短信
②キャッシュ
キャッシュ・
・フローの状況に関する分
フローの状況に関する分析
析
前連結会計年度
(2025年3月期)
(百万円)
当連結会計年度
(2026年3月期)
(百万円)
増減
(百万円)
営業活動によるキャッシュ・フロー
66,577
78,344
11,767
投資活動によるキャッシュ・フロー
△64,871
△48,901
15,970
財務活動によるキャッシュ・フロー
△19,968
△31,712
△11,743
現金及び現金同等物に係る換算差額
△423
9,751
10,175
現金及び現金同等物の増減額
△18,687
7,482
26,169
現金及び現金同等物の期首残高
147,130
128,442
△18,687
現金及び現金同等物の期末残高
128,442
135,925
7,482
当連結会計年度末における現金及び現金同等物(以下「資金」という。)は、前連結会計年度末に比べ74億8
千2百万円増加し、1,359億2千5百万円となりました。
(営業活動によるキャッシュ・フロー)
営業活動によるキャッシュ・フローは、売上債権の増減額の減少103億円等による資金減があったものの、負の
のれん発生益の減少100億6千万円、仕入債務の増減額の増加49億1千6百万円等による資金増により、前連結会
計年度に比べ117億6千7百万円増加し、783億4千4百万円となりました。
(投資活動によるキャッシュ・フロー)
投資活動によるキャッシュ・フローは、有形固定資産の取得による支出の増加114億7千7百万円等による資金
減があったものの、定期預金の払戻による収入の増加179億3千万円、有価証券及び投資有価証券の売却及び償還
による収入の増加55億1千万円等による資金増により、前連結会計年度に比べ159億7千万円増加し、△489億1
百万円となりました。
(財務活動によるキャッシュ・フロー)
財務活動によるキャッシュ・フローは、短期借入金の純増減額の増加767億円等による資金増があったものの、
自己株式の取得による支出の増加500億円、社債の発行による収入の減少398億7百万円等による資金減により、
前連結会計年度に比べ117億4千3百万円減少し、△317億1千2百万円となりました。
(参考) キャッシュ・フロー関連指標の推移
2022年3月期
2023年3月期
2024年3月期
2025年3月期
2026年3月期
自己資本比率 (%)
74.2
75.6
74.0
64.8
56.1
時価ベースの自己資本比率 (%)
63.5
77.1
63.7
55.8
43.4
キャッシュ・フロー対有利子負債
比率
0.3
0.2
0.2
0.7
1.5
327.0
444.7
349.3
197.3
87.3
インタレスト・カバレッジ・レシオ
(注) 自己資本比率:自己資本/総資産
時価ベースの自己資本比率:株式時価総額/総資産
キャッシュ・フロー対有利子負債比率:有利子負債/営業キャッシュ・フロー
インタレスト・カバレッジ・レシオ:営業キャッシュ・フロー/利払い
※ 各指標は、いずれも連結ベースの財務数値により計算しております。
※ 株式時価総額は、期末株価終値×期末発行済株式数(自己株式控除後)により計算しております。
※ 営業キャッシュ・フローは連結キャッシュ・フロー計算書の営業活動によるキャッシュ・フローを
利用しております。有利子負債は、連結貸借対照表に計上されている負債のうち、利子を支払ってい
る全ての負債を対象としております。また、利払いについては、連結キャッシュ・フロー計算書の利
息の支払額を利用しております。
-4-
スタンレー電気(株) (6923) 2026年3月期決算短信
(3)利益配分に関する基本方針及び当期・次期の配当
当社の配当金につきましては、安定した配当の維持及び資本効率を重視した適正な利益還元を基本としており、
株主資本配当率(DOE)3.5%または連結配当性向40%のいずれか高い方を採用することとしております。以上の
配当方針に基づき、当期の期末配当金は連結配当性向を算出基準として採用し、1株当たり55円を予定しており、
当中間配当金の1株当たり49円と合わせて年間配当金は104円とする予定です。
また、次期の配当金につきましては、年間配当金は、1株当たり111円とし、中間配当金は1株当たり55円、期末
配当金は1株当たり56円とする予定です。
なお、当社では、株主還元の充実、及び資本効率の向上を図るため、当期において、2025年6月10日開催の取締
役会決議に基づき、2025年7月1日から2026年1月28日までの期間に799億9千9百万円(2,629万株)の自己株式
取得を実施いたしました。また、2026年2月12日に781億3千2百万円(2,600万株)の自己株式の消却を行ってお
ります。
-5-
スタンレー電気(株) (6923) 2026年3月期決算短信
2.企業集団の状況
当社の企業集団は、当社、連結子会社44社及び持分法適用関連会社2社で構成され、自動車機器製品、コンポー
ネンツ製品、電子応用製品の製造販売を主な内容とし、さらに各事業に関連するサービス等の事業活動を展開して
おります。
国内関係会社は、主として当社の生産体制と一体となって、当社取扱製品の一部の製造を担当し、当社へ納入し
ております。海外関係会社は、当社得意先の海外進出への対応並びに現地市場の販路拡大等のため当社取扱製品の
製造販売を行っております。
当社グループの事業に係わる位置づけ、及びセグメントとの関連は、次のとおりであります。
-6-
スタンレー電気(株) (6923) 2026年3月期決算短信
事業系統図
-7-
スタンレー電気(株) (6923) 2026年3月期決算短信
(注)前記の他、持株会社として米州拠点にStanley Electric Holding of America, Inc.、 アジア・大洋州拠点にStanley Electric
Holding Asia-Pacific Pte. Ltd.、 THPI Co., Ltd.、中国拠点に斯坦雷電気(中国)投資有限公司、欧州拠点にStanley
Electric Holding Europe Co., Ltd. があります。
※1 ㈱スタンレーいわき製作所は自動車機器事業、電子応用製品事業及びその他の事業を展開しております。
2 当連結会計年度において、当社を吸収合併存続会社、㈱スタンレー鶴岡製作所を吸収合併消滅会社とする吸収合併を行
っており、吸収合併消滅会社の㈱スタンレー鶴岡製作所を連結の範囲から除外しております。
※3 当連結会計年度において、 スタンレーモビリティエレクトリック㈱、 Stanley Mobility Electric U.S. Co., Inc.、Stanley
Mobility Electric Mexico, S.A. de C.V.、Stanley Mobility Electric GmbH、Stanley Mobility Electric (Thailand)
Co., Ltd.、斯坦雷電気科技(深圳)有限公司を新たに設立したため、連結の範囲に含めております。
4 Hella-Stanley Holding Pty Ltdは、2026年3月25日をもって解散し、清算中であります。
-8-
スタンレー電気(株) (6923) 2026年3月期決算短信
3.経営方針
(1)会社の経営の基本方針
当社グループは、グループ共有の基本的価値観『スタンレーグループビジョン』(以下、ビジョン)に向け、光
の持つ無限の可能性を追求し、その価値の提供によって、広く社会に貢献することを目指しています。
本ビジョンのもと、「光の価値の限りなき追求」と「ものづくりを究める経営革新」によって生み出された多く
の価値を世界中の人々に提供する事業活動と、サステナビリティ基本方針に基づくESG活動を一体で推進し、
「競争力」のある企業となることで、持続可能な社会へ貢献してまいります。
(2)目標とする経営指標
当社グループの経営指標としては、2023年度からスタートしました第Ⅷ期中期3ヶ年経営計画を2024年5月にア
ップデートし、2026年3月期において売上高5,900億円、営業利益率10.5%(責任利益10%)、ROE8%の達成を
目標としておりました。しかしながら、当社グループを取り巻く事業環境は、第Ⅷ期中期3ヶ年経営計画策定時と
は著しく変化し、中国市場の低迷及び米国の通商政策等により、最終年度である2026年3月期の実績は、売上高
5,184億円、営業利益率8.2%、ROE7.0%となりました。
(3)中長期的な会社の経営戦略
当社グループでは、2023年度から「安全安心を実現し社会に貢献している
~光の力で夢を現実に変える~」を
指針として、第Ⅷ期中期3ヶ年経営計画をスタートさせました。これは、2020年に策定した「スタンレーグループ
第3長期経営目標」で示されている3ヶ年ごとの経営計画に、2030年に想定される外部環境を考慮したバックキャ
スティングによる視点を加えて策定したものです。その中の3つの大きなテーマは、以下のとおりです。
1. TADAS思想のものづくり
あらゆる人々に安全安心を届けたいという思いから生まれた思想が「TADAS」です。全ての機能を無
駄にすることなく使い切る、というTADAS思想のもと、あらゆる人々が価値を享受できる価格を実現し、
「安くて良いもの」を社会へ提供していきます。
2. 光の独自技術で新市場開拓
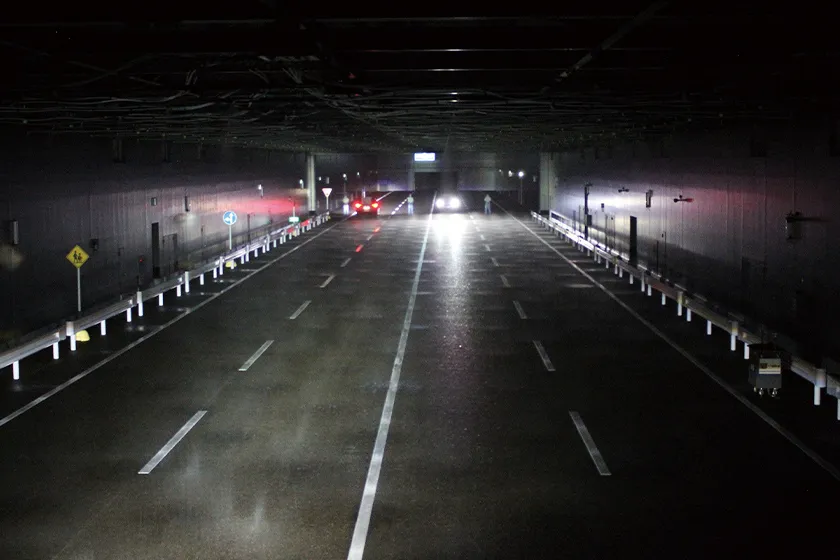
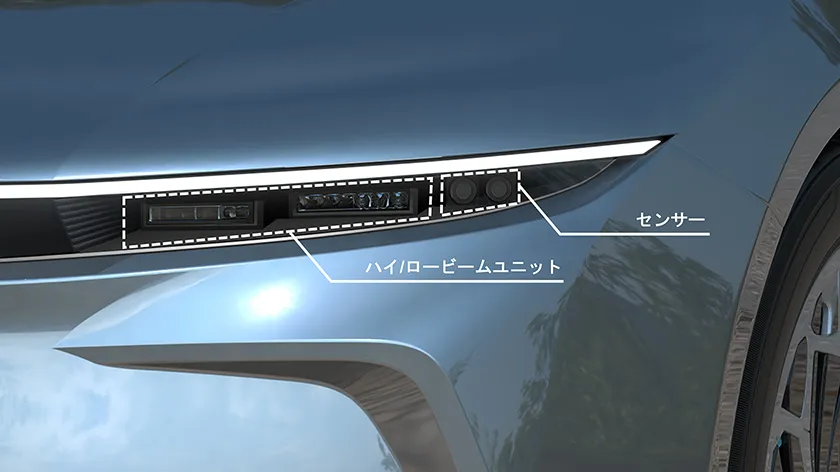
悪天候時の運転の安全性を向上させる車載用ランプシステムや、非可視光を用いた製品など、光の価値を
追求した独自の技術によって、他社との差別化を明確に図り、新たな製品を生み出し、新市場を開拓してい
きます。
3. One Stanleyでスピードのある挑戦
世界中の当社グループ社員が一丸となって、同じベクトルで挑戦し、成果を出していく姿がOne Stanleyで
す。One Stanleyとなることで、スピードのある価値提供をグローバルで実現していきます。
これらのテーマへの取り組みとして、生産革新による合理化を実施したほか、モビリティインフラシステム領域
への事業拡張を目的として三菱電機モビリティ株式会社との合弁会社を設立し、電子事業の強化を目的として岩崎
電気株式会社の連結子会社化を実施しました。また、アジア大洋州のハブとしてThai Stanley Electric Public
Co., Ltd.を連結化し、南米での設計・開発から生産まで一貫して行える体制の構築としてStanley-Angstrom
Electric da Amazonia Ltda.を連結子会社化するなど、グローバルで同時に価値提供できる基盤作りを行いまし
た。
合わせて、強固な財務体質を構築し積極的な投資を行いながら、収益性と資産効率性の向上に取り組みました。
当社グループを取り巻く事業環境は、自動車業界をはじめ関連する市場が大きく変化しており、当社グループも
開発スピードの向上やコストの最適化などが求められています。このような環境のもと、安定的に価値と収益を創
出する基盤構築を目的として、第Ⅸ期中期経営計画をスタートしました。第Ⅸ期中期経営計画の取り組みによって、
収益性と資産効率性の向上を図り、ROE10%を達成し、2030年「競争力のある企業」となることを目指します。
なお、第Ⅸ期中期経営計画の詳細は後日開示予定です。
-9-
スタンレー電気(株) (6923) 2026年3月期決算短信
4.会計基準の選択に関する基本的な考え方
当社グループは、連結財務諸表の期間比較可能性及び企業間の比較可能性を考慮し、当面は、日本基準で連結財
務諸表を作成する方針であります。
なお、IFRSの適用につきましては、国内外の諸情勢を考慮の上、適切に対応していく方針であります。
-10-
スタンレー電気(株) (6923) 2026年3月期決算短信
5.連結財務諸表及び主な注記
(1)連結貸借対照表
(単位:百万円)
前連結会計年度
(2025年3月31日)
資産の部
流動資産
現金及び預金
受取手形及び売掛金
有価証券
棚卸資産
その他
貸倒引当金
流動資産合計
固定資産
有形固定資産
建物及び構築物(純額)
機械装置及び運搬具(純額)
工具、器具及び備品(純額)
土地
リース資産(純額)
建設仮勘定
有形固定資産合計
無形固定資産
のれん
その他
無形固定資産合計
投資その他の資産
投資有価証券
退職給付に係る資産
繰延税金資産
その他
投資その他の資産合計
固定資産合計
資産合計
-11-
当連結会計年度
(2026年3月31日)
219,514
77,368
100
55,498
37,611
△54
390,038
226,985
84,360
-
56,341
43,423
△54
411,055
78,208
78,381
16,714
25,774
2,997
33,529
235,606
81,489
97,832
17,969
26,541
2,556
36,897
263,285
5,258
4,745
10,003
5,242
7,051
12,293
77,828
6,508
7,036
22,583
113,956
359,566
749,605
71,740
14,145
8,632
28,111
122,630
398,208
809,264
スタンレー電気(株) (6923) 2026年3月期決算短信
(単位:百万円)
前連結会計年度
(2025年3月31日)
負債の部
流動負債
支払手形及び買掛金
短期借入金
リース債務
未払法人税等
製品保証引当金
賞与引当金
役員賞与引当金
その他
流動負債合計
固定負債
社債
リース債務
長期未払法人税等
繰延税金負債
役員退職慰労引当金
その他の引当金
退職給付に係る負債
資産除去債務
その他
固定負債合計
負債合計
純資産の部
株主資本
資本金
資本剰余金
利益剰余金
自己株式
株主資本合計
その他の包括利益累計額
その他有価証券評価差額金
為替換算調整勘定
退職給付に係る調整累計額
その他の包括利益累計額合計
新株予約権
非支配株主持分
純資産合計
負債純資産合計
-12-
当連結会計年度
(2026年3月31日)
40,995
-
1,619
4,535
7,360
5,892
286
30,325
91,015
40,598
76,700
1,867
4,509
7,201
6,132
273
39,018
176,302
40,000
2,956
-
13,024
24
28
2,980
483
184
59,682
150,698
40,000
2,343
63
13,748
27
28
3,614
607
590
61,023
237,325
30,514
19,097
358,372
△7,668
400,316
30,514
19,228
300,711
△9,282
341,173
31,735
51,001
2,445
85,183
392
113,014
598,906
749,605
28,299
78,231
6,509
113,040
314
117,410
571,938
809,264
スタンレー電気(株) (6923) 2026年3月期決算短信
(2)連結損益計算書及び連結包括利益計算書
連結損益計算書
売上高
売上原価
売上総利益
販売費及び一般管理費
営業利益
営業外収益
受取利息
受取配当金
持分法による投資利益
為替差益
雑収入
営業外収益合計
営業外費用
支払利息
為替差損
外国源泉税
支払補償費
雑損失
営業外費用合計
経常利益
特別利益
固定資産売却益
投資有価証券売却益
負ののれん発生益
子会社清算益
特別利益合計
特別損失
段階取得に係る差損
減損損失
固定資産除却損
事業構造改善費用
関係会社清算損
特別退職金
棚卸資産廃棄損
退職給付制度終了損
従業員住宅積立金拠出額
特別調査費用
特別損失合計
税金等調整前当期純利益
法人税、住民税及び事業税
法人税等調整額
法人税等合計
当期純利益
非支配株主に帰属する当期純利益
親会社株主に帰属する当期純利益
前連結会計年度
(自 2024年4月1日
至 2025年3月31日)
509,565
403,892
105,672
56,669
49,002
(単位:百万円)
当連結会計年度
(自 2025年4月1日
至 2026年3月31日)
518,456
410,581
107,874
65,199
42,674
4,894
3,555
428
-
803
9,682
4,070
3,678
1,052
475
721
9,999
419
2,090
204
-
516
3,230
55,454
898
-
223
344
355
1,821
50,853
584
3,480
10,060
170
14,296
286
9,853
-
-
10,140
1,130
8,094
2,988
117
-
2,836
523
177
740
110
16,720
53,030
12,101
568
12,670
40,360
8,301
32,058
-
2,328
1,520
32
93
673
-
-
-
140
4,788
56,204
13,259
666
13,925
42,279
9,465
32,813
-13-
スタンレー電気(株) (6923) 2026年3月期決算短信
連結包括利益計算書
当期純利益
その他の包括利益
その他有価証券評価差額金
為替換算調整勘定
退職給付に係る調整額
持分法適用会社に対する持分相当額
その他の包括利益合計
包括利益
(内訳)
親会社株主に係る包括利益
非支配株主に係る包括利益
前連結会計年度
(自 2024年4月1日
至 2025年3月31日)
40,360
(単位:百万円)
当連結会計年度
(自 2025年4月1日
至 2026年3月31日)
42,279
△13,235
△6,302
△682
△146
△20,366
19,993
△3,460
37,417
4,049
△113
37,893
80,172
11,026
8,966
60,671
19,500
-14-
スタンレー電気(株) (6923) 2026年3月期決算短信
(3)連結株主資本等変動計算書
前連結会計年度(自 2024年4月1日
至 2025年3月31日)
(単位:百万円)
株主資本
資本金
当期首残高
資本剰余金
利益剰余金
自己株式
株主資本合計
30,514
29,669
386,872
△28,862
418,194
剰余金の配当
-
-
△9,533
-
△9,533
親会社株主に帰属する
当期純利益
-
-
32,058
-
32,058
自己株式の取得
-
-
-
△30,004
△30,004
自己株式の処分
-
-
3
147
150
自己株式の消却
-
-
△51,032
51,032
-
新株予約権の行使
-
-
3
18
21
連結範囲の変動
-
△11,285
-
-
△11,285
-
713
-
-
713
-
-
-
-
-
-
△10,572
△28,500
21,193
△17,878
30,514
19,097
358,372
△7,668
400,316
当期変動額
連結子会社株式の追加
取得による持分の増減
株主資本以外の項目の
当期変動額(純額)
当期変動額合計
当期末残高
その他の包括利益累計額
その他有価証券
退職給付に係る
為替換算調整勘定
評価差額金
調整累計額
当期首残高
新株予約権
非支配株主持分
純資産合計
44,860
58,233
3,122
388
64,564
589,362
剰余金の配当
-
-
-
-
-
△9,533
親会社株主に帰属する
当期純利益
-
-
-
-
-
32,058
自己株式の取得
-
-
-
-
-
△30,004
自己株式の処分
-
-
-
-
-
150
自己株式の消却
-
-
-
-
-
-
新株予約権の行使
-
-
-
-
-
21
連結範囲の変動
-
-
-
-
-
△11,285
-
-
-
-
-
713
△13,124
△7,231
△676
4
48,450
27,422
△13,124
△7,231
△676
4
48,450
9,543
31,735
51,001
2,445
392
113,014
598,906
当期変動額
連結子会社株式の追加
取得による持分の増減
株主資本以外の項目の
当期変動額(純額)
当期変動額合計
当期末残高
-15-
スタンレー電気(株) (6923) 2026年3月期決算短信
当連結会計年度(自 2025年4月1日
至 2026年3月31日)
(単位:百万円)
株主資本
資本金
当期首残高
資本剰余金
利益剰余金
自己株式
株主資本合計
30,514
19,097
358,372
△7,668
400,316
剰余金の配当
-
-
△12,371
-
△12,371
親会社株主に帰属する
当期純利益
-
-
32,813
-
32,813
自己株式の取得
-
-
-
△80,004
△80,004
自己株式の処分
-
-
11
165
176
自己株式の消却
-
-
△78,132
78,132
-
新株予約権の行使
-
-
17
93
110
連結範囲の変動
-
△311
-
-
△311
-
443
-
-
443
-
-
-
-
-
-
131
△57,661
△1,613
△59,142
30,514
19,228
300,711
△9,282
341,173
当期変動額
連結子会社株式の追加
取得による持分の増減
株主資本以外の項目の
当期変動額(純額)
当期変動額合計
当期末残高
その他の包括利益累計額
その他有価証券
退職給付に係る
為替換算調整勘定
評価差額金
調整累計額
当期首残高
新株予約権
非支配株主持分
純資産合計
31,735
51,001
2,445
392
113,014
598,906
剰余金の配当
-
-
-
-
-
△12,371
親会社株主に帰属する
当期純利益
-
-
-
-
-
32,813
自己株式の取得
-
-
-
-
-
△80,004
自己株式の処分
-
-
-
-
-
176
自己株式の消却
-
-
-
-
-
-
新株予約権の行使
-
-
-
-
-
110
連結範囲の変動
-
-
-
-
-
△311
-
-
-
-
-
443
△3,436
27,229
4,063
△78
4,396
32,175
当期変動額合計
△3,436
27,229
4,063
△78
4,396
△26,967
当期末残高
28,299
78,231
6,509
314
117,410
571,938
当期変動額
連結子会社株式の追加
取得による持分の増減
株主資本以外の項目の
当期変動額(純額)
-16-
スタンレー電気(株) (6923) 2026年3月期決算短信
(4)連結キャッシュ・フロー計算書
前連結会計年度
(自 2024年4月1日
至 2025年3月31日)
営業活動によるキャッシュ・フロー
税金等調整前当期純利益
減価償却費
減損損失
負ののれん発生益
貸倒引当金の増減額(△は減少)
賞与引当金の増減額(△は減少)
製品保証引当金の増減額(△は減少)
退職給付に係る負債の増減額(△は減少)
受取利息及び受取配当金
支払利息
持分法による投資損益(△は益)
段階取得に係る差損益(△は益)
固定資産除売却損益(△は益)
投資有価証券売却損益(△は益)
特別退職金
売上債権の増減額(△は増加)
棚卸資産の増減額(△は増加)
仕入債務の増減額(△は減少)
その他
小計
利息及び配当金の受取額
利息の支払額
法人税等の支払額
特別退職金の支払額
営業活動によるキャッシュ・フロー
投資活動によるキャッシュ・フロー
定期預金の預入による支出
定期預金の払戻による収入
長期定期預金の預入による支出
有形固定資産の取得による支出
有形固定資産の売却による収入
無形固定資産の取得による支出
無形固定資産の売却による収入
有価証券及び投資有価証券の売却及び
償還による収入
連結の範囲の変更を伴う子会社株式の取得によ
る支出
連結の範囲の変更を伴う子会社株式の取得によ
る収入
長期前払費用の取得による支出
その他
投資活動によるキャッシュ・フロー
-17-
(単位:百万円)
当連結会計年度
(自 2025年4月1日
至 2026年3月31日)
53,030
43,683
8,094
△10,060
28
787
△2,173
△172
△8,450
419
△428
1,130
2,403
△3,480
2,836
7,561
3,373
△5,605
△17,099
75,878
8,124
△337
△14,252
△2,836
66,577
56,204
41,815
2,328
-
△5
142
△265
△981
△7,749
898
△1,052
-
1,233
△9,853
673
△2,739
3,699
△689
2,754
86,415
7,414
△897
△13,913
△673
78,344
△132,389
119,945
△8,444
△43,783
479
△1,839
400
△126,705
137,876
-
△55,260
122
△2,346
-
6,269
11,780
△5,420
△4,516
8,214
-
△8,301
△4
△64,871
△9,237
△614
△48,901
スタンレー電気(株) (6923) 2026年3月期決算短信
前連結会計年度
(自 2024年4月1日
至 2025年3月31日)
財務活動によるキャッシュ・フロー
短期借入金の純増減額(△は減少)
社債の発行による収入
社債の償還による支出
自己株式の取得による支出
自己株式の売却による収入
配当金の支払額
非支配株主への配当金の支払額
連結の範囲の変更を伴わない子会社株式の取得
による支出
その他
財務活動によるキャッシュ・フロー
現金及び現金同等物に係る換算差額
現金及び現金同等物の増減額(△は減少)
現金及び現金同等物の期首残高
現金及び現金同等物の期末残高
-18-
(単位:百万円)
当連結会計年度
(自 2025年4月1日
至 2026年3月31日)
-
39,807
△10,000
△30,004
18
△9,531
△2,693
76,700
-
-
△80,004
91
△12,366
△14,981
△6,825
△403
△739
△19,968
△423
△18,687
147,130
128,442
△748
△31,712
9,751
7,482
128,442
135,925
スタンレー電気(株) (6923) 2026年3月期決算短信
(5)継続企業の前提に関する注記
該当事項はありません。
(6)連結財務諸表作成のための基本となる重要な事項
1.連結の範囲に関する事項
子会社44社を全て連結しております。
主要な連結子会社の名称
(株)スタンレー新潟製作所、Stanley Electric U.S. Co., Inc.、I I Stanley Co., Inc.、Stanley Electric Holding of America, Inc.、
Stanley Electric do Brasil Ltda.、Stanley Electric Manufacturing Mexico S.A. de C.V.、Thai Stanley Electric Public Co., Ltd.、
Vietnam Stanley Electric Co., Ltd.、天津斯坦雷電気有限公司、天津斯坦雷電気科技有限公司、広州斯坦雷電気有限公司、斯坦雷
電気(中国)投資有限公司
当連結会計年度において、 スタンレーモビリティエレクトリック(株)、 Stanley Mobility Electric U.S. Co., Inc.、
Stanley Mobility Electric Mexico, S.A. de C.V.、 Stanley Mobility Electric GmbH、 Stanley Mobility
Electric(Thailand) Co., Ltd.、斯坦雷電気科技(深圳)有限公司を新たに設立したため、連結の範囲に含めておりま
す。
なお、当社の連結子会社であった(株)スタンレー鶴岡製作所(以下、「スタンレー鶴岡製作所」)は、 2025年4月1日
付で当社を吸収合併存続会社、 スタンレー鶴岡製作所を吸収合併消滅会社とする吸収合併を行っており、吸収合併消滅
会社のスタンレー鶴岡製作所を当連結会計年度より連結の範囲から除外しております。
2.持分法の適用に関する事項
(1) 持分法を適用した関連会社数及び名称
2社
Hella-Stanley Holding Pty Ltd、Lumax Industries Ltd.
Hella-Stanley Holding Pty Ltdは、2026年3月25日をもって解散し、清算中であります。
(2) 持分法を適用しない関連会社のうち主要な会社等の名称
Sirivit-Stanley Co., Ltd.
持分法を適用しない理由
持分法非適用会社は、それぞれ当期純損益(持分に見合う額)及び利益剰余金(持分に見合う額)等に及ぼす影響が軽微であり、
かつ全体としても重要性がないため、持分法の適用から除外しております。
3.連結子会社の事業年度等に関する事項
決算日が連結決算日と異なる場合の内容等
連結子会社 の う ち、Stanley Electric Manufacturing Mexico S.A. de C.V.、Stanley Mobility Electric Mexico,
S.A. de C.V.、蘇州斯坦雷電気有限公司、深圳斯坦雷電気有限公司、天津斯坦雷電気有限公司、天津斯坦雷電気科技
有限公司、武漢斯坦雷電気有限公司、広州斯坦雷電気有限公司、斯坦雷電気科技(深圳)有限公司、上海斯坦雷電気有
限公司、斯坦雷電気貿易(深圳)有限公司及び斯坦雷電気(中国)投資有限公司の決算日はともに12月31日であります。
連結財務諸表の作成にあたり、これらの会社については、連結決算日現在で実施した仮決算に基づく財務諸表を使用しておりま
す。
4.会計方針に関する事項
(1) 重要な資産の評価基準及び評価方法
① 有価証券
満期保有目的の債券
償却原価法(定額法)
その他有価証券
市場価格のない株式等以外のもの
-19-
スタンレー電気(株) (6923) 2026年3月期決算短信
時価法
(評価差額は全部純資産直入法により処理し、売却原価は移動平均法により算出)
市場価格のない株式等
移動平均法による原価法
② デリバティブ
時価法
③ 棚卸資産
主として総平均法による原価法(収益性の低下による簿価切下げの方法)によっております。
(2) 重要な減価償却資産の減価償却の方法
① 有形固定資産(リース資産を除く)
定額法を採用しております。
なお、主な耐用年数は以下のとおりであります。
建物及び構築物
3~50年
機械装置及び運搬具
4~15年
工具、器具及び備品
2~20年
② 無形固定資産
定額法を採用しております。
なお、ソフトウエア(自社利用分)については、社内における利用可能期間(5年)に基づく定額法によっております。
③ リース資産
所有権移転外ファイナンス・リース取引に係るリース資産
リース期間を耐用年数とし、残存価額をゼロとする定額法によっております。
なお、一部の在外連結子会社については、国際財務報告基準に基づき財務諸表を作成しており、国際財務報
告基準第16号「リース」(以下「IFRS第16号」という。)を適用しております。IFRS第16号により、リ
ースの借手については、原則としてすべてのリースを貸借対照表に資産及び負債として計上しており、資産計
上された使用権資産の減価償却方法は定額法によっております。
(3) 重要な引当金の計上基準
① 貸倒引当金
債権の貸倒れによる損失に備えるため、主として一般債権については貸倒実績率による計算額を、貸倒懸念債権等特定の債権
については個別に回収可能性を検討し、回収不能見込額を計上しております。
② 賞与引当金
従業員の賞与の支払に備えるため、主として支給見込額基準により計上しております。
③ 役員賞与引当金
役員の賞与の支払に備えるため、支給見込額のうち当連結会計年度負担額を計上しております。
④ 役員退職慰労引当金
一部の連結子会社は、役員の退職慰労金の支出に備えて、役員退職慰労金規定に基づく当連結会計年度末要支給額を計上して
おります。
⑤ 製品保証引当金
製品保証に伴う費用の支出に備えるため、個別に算出した発生見込額を計上しております。
(4) 収益及び費用の計上基準
当社及び連結子会社は、自動車機器製品、コンポーネンツ製品、電子応用製品の製造販売を主な内容として、事業活動を展開して
おります。
当社及び連結子会社では、主に完成した製品を顧客に供給することを履行義務としており、顧客に製品が到着した時点で、履行義
務が充足されたと判断し収益を認識しております。
取引価格の算定については、顧客との契約において約束された対価から、値引き額等を見積り、控除した金額で算定しておりま
す。取引価格の履行義務への配分額の算定にあたっては、1つの契約につき複数の履行義務は識別されていないため、取引価格の
-20-
スタンレー電気(株) (6923) 2026年3月期決算短信
履行義務への配分は行っておりません。これらの履行義務に対する対価は、履行義務充足後、別途定める支払条件により概ね1年
以内に受領しており、重大な金融要素は含んでおりません。
(5) 退職給付に係る会計処理の方法
① 退職給付見込額の期間帰属方法
退職給付債務の算定にあたり、退職給付見込額を当連結会計年度末までの期間に帰属させる方法については、給付算定式基準
によっております。
② 過去勤務費用及び数理計算上の差異の費用処理方法
過去勤務費用は、その発生時の従業員の平均残存勤務期間以内の一定の年数(12年)による定額法により費用処理
しております。
数理計算上の差異は、各連結会計年度の発生時における従業員の平均残存勤務期間以内の一定の年数(9~12年)
による定額法により按分した額をそれぞれ発生の翌連結会計年度から費用処理することとしております。
(6) 重要なヘッジ会計の方法
① ヘッジ会計の方法
振当処理の要件を満たしている為替予約については、振当処理によっております。
② ヘッジ手段とヘッジ対象
ヘッジ手段:為替予約
ヘッジ対象:外貨建金銭債権
③ ヘッジ方針
為替予約の限度額を実需の範囲とし、ヘッジ手段をヘッジ対象の範囲内で将来の為替相場の変動によるリスクを回避する目的
で利用する方針であります。
④ ヘッジ有効性評価の方法
ヘッジ手段とヘッジ対象に関する重要な条件が同一であり、かつヘッジ開始時及びその後も継続して、相場変動を完全に相殺
するものと想定することができるため、ヘッジ有効性の判定は省略しております。
(7) のれんの償却方法及び償却期間
のれんの償却については、5年間から10年間での均等償却を行っております。なお、金額的に重要性がない
場合には、発生連結会計年度に全額償却しております。
(8) 連結キャッシュ・フロー計算書における資金の範囲
連結キャッシュ・フロー計算書における資金(現金及び現金同等物)は、手許現金、随時引き出し可能な預金及び容易に換金可
能であり、かつ、価値の変動について僅少なリスクしか負わない取得日から3か月以内に償還期限の到来する短期投資でありま
す。
(9) その他連結財務諸表作成のための重要な事項
グループ通算制度の適用
グループ通算制度を適用しております。
(7)会計方針の変更
該当事項はありません。
-21-
スタンレー電気(株) (6923) 2026年3月期決算短信
(8)連結財務諸表に関する注記事項
(セグメント情報等の注記)
【セグメント情報】
1.報告セグメントの概要
当社の報告セグメントは、当社の構成単位のうち分離された財務情報が入手可能であり、最高経営意思決定機関
が、経営資源の配分の決定及び業績を評価するために、定期的に検討を行う対象となっているものであります。
当社では、製品・サービス別の事業単位を置き、各事業単位は、取り扱う製品・サービスについて国内及び海外
の包括的な戦略を立案し、事業活動を展開しております。
従って、当社は、事業単位を基礎として主に販売市場の類似性、製品の特性に基づき「自動車機器事業」、「コ
ンポーネンツ事業」、「電子応用製品事業」を報告セグメントとしております。
「自動車機器事業」は、主に自動車メーカーに販売する自動車用照明製品を製造しております。「コンポーネン
ツ事業」は、主に電機・自動車関連メーカーに販売する電子デバイス製品を製造しております。「電子応用製品事
業」は、主に電機・自動車・自動車関連メーカーに販売する液晶用バックライト、ストロボ、操作パネル等の得意
先の仕様に合わせたユニットやモジュールといった電子応用製品を製造しております。
2.報告セグメントごとの売上高、利益又は損失、資産、負債その他の項目の金額の算定方法
報告されている事業セグメントの会計処理の方法は、「連結財務諸表作成のための基本となる重要な事項」にお
ける記載と概ね同一であります。報告セグメントの利益は、営業利益ベースの数値であります。セグメント間取引
は市場実勢価格に基づいております。
3.報告セグメントごとの売上高、利益又は損失、資産、負債その他の項目の金額に関する情報
Ⅰ 前連結会計年度(自
2024年4月1日
至 2025年3月31日)
1.報告セグメントごとの売上高及び利益又は損失の金額に関する情報
(単位:百万円)
自動車
機器事業
コンポーネ
ンツ事業
電子応用
製品事業
その他
(注)1
連結財務諸表
計上額
(注)3
調整額
(注)2
売上高
外部顧客への売上高
438,473
19,344
51,742
4
-
509,565
セグメント間の内部
売上高又は振替高
1,656
17,720
64,601
3,129
△87,108
-
440,130
37,065
116,344
3,133
△87,108
509,565
計
セグメント利益
46,966
2,494
8,810
69
△9,338
49,002
セグメント資産
285,570
43,391
64,528
2,041
354,072
749,605
28,069
2,984
5,944
13
6,596
43,608
その他の項目
減価償却費
有形固定資産及び無形
29,522
3,281
7,267
65
9,330
49,467
固定資産の増加額
(注) 1 「その他」の区分は、報告セグメントに含まれない身体障害者雇用促進事業、グループに対する金融・経営
サービス等の事業活動を含んでおります。
2 調整額は、以下のとおりであります。
(1) セグメント利益の調整額△9,338百万円には、各報告セグメントに配分していない全社費用△8,523百万
円が含まれております。全社費用は、主に報告セグメントに帰属しない基礎的試験研究費及び管理部門に係
る費用であります。
(2) セグメント資産の調整額354,072百万円には、各報告セグメントに帰属しない全社資産581,948百万円、
投資資本の調整額△94,683百万円、債権債務の調整額△89,526百万円等が含まれております。全社資産は、
主に報告セグメントに帰属しない余資運用資金(現金及び預金等)、長期投資資金(投資有価証券等)等の
管理部門及び基礎的試験研究活動に係る資産であります。
(3) 減価償却費の調整額6,596百万円は、各報告セグメントに帰属しない全社資産の減価償却費6,673百万円
等であります。
(4) 有形固定資産及び無形固定資産の増加額の調整額9,330百万円は、各報告セグメントに帰属しない全社資
産に対する投資10,285百万円等であります。
3 セグメント利益は、連結財務諸表の営業利益と調整を行っております。
-22-
スタンレー電気(株) (6923) 2026年3月期決算短信
2.報告セグメントごとの固定資産の減損損失又はのれん等に関する情報
(固定資産に係る重要な減損損失)
「自動車機器事業」「コンポーネンツ事業」「電子応用製品事業」及び各報告セグメントに帰属しない全社資産
において、有形固定資産及び無形固定資産の減損損失を計上しております。なお、当該減損損失の計上額は、当連
結会計年度においては「自動車機器事業」で2,633百万円、「コンポーネンツ事業」で4,048百万円、「電子応用製
品事業」で983百万円、各報告セグメントに帰属しない全社資産で428百万円であります。
3.報告セグメントごとの負ののれん発生益に関する情報
(重要な負ののれん発生益)
「自動車機器事業」において、持分法適用関連会社であったThai Stanley Electric Public Co., Ltd.の株式を
追加取得し、連結の範囲に含めたことにより、負ののれん発生益を計上しています。当該事象による負ののれん発
生益の計上額は、10,060百万円であります。なお、負ののれん発生益は特別利益のため、上記セグメント利益には
含まれておりません。
Ⅱ 当連結会計年度(自
2025年4月1日
至 2026年3月31日)
1.報告セグメントごとの売上高及び利益又は損失の金額に関する情報
(単位:百万円)
自動車
機器事業
コンポーネ
ンツ事業
電子応用
製品事業
その他
(注)1
連結財務諸表
計上額
(注)3
調整額
(注)2
売上高
外部顧客への売上高
445,215
20,356
52,879
4
-
518,456
セグメント間の内部
売上高又は振替高
1,923
18,967
59,690
3,203
△83,784
-
447,139
39,323
112,570
3,207
△83,784
518,456
セグメント利益
計
44,937
2,884
9,302
122
△14,572
42,674
セグメント資産
316,345
41,902
71,808
1,955
377,253
809,264
26,858
2,793
5,400
13
6,734
41,801
その他の項目
減価償却費
有形固定資産及び無形
32,004
3,456
7,942
14
11,191
54,608
固定資産の増加額
(注) 1 「その他」の区分は、報告セグメントに含まれない身体障害者雇用促進事業、グループに対する金融・経営
サービス等の事業活動を含んでおります。
2 調整額は、以下のとおりであります。
(1) セグメント利益の調整額△14,572百万円には、各報告セグメントに配分していない全社費用△13,971百
万円が含まれております。全社費用は、主に報告セグメントに帰属しない基礎的試験研究費及び管理部門に
係る費用であります。
(2) セグメント資産の調整額377,253百万円には、各報告セグメントに帰属しない全社資産615,006百万円、
投資資本の調整額△100,353百万円、債権債務の調整額△85,686百万円等が含まれております。全社資産は、
主に報告セグメントに帰属しない余資運用資金(現金及び預金等)、長期投資資金(投資有価証券等)等の
管理部門及び基礎的試験研究活動に係る資産であります。
(3) 減価償却費の調整額6,734百万円は、各報告セグメントに帰属しない全社資産の減価償却費7,571百万円
等であります。
(4) 有形固定資産及び無形固定資産の増加額の調整額11,191百万円は、各報告セグメントに帰属しない全社
資産に対する投資11,691百万円等であります。
3 セグメント利益は、連結財務諸表の営業利益と調整を行っております。
-23-
スタンレー電気(株) (6923) 2026年3月期決算短信
2.報告セグメントごとの固定資産の減損損失又はのれん等に関する情報
(固定資産に係る重要な減損損失)
「自動車機器事業」「コンポーネンツ事業」及び「電子応用製品事業」において、有形固定資産及び無形固定資
産の減損損失を計上しております。なお、当該減損損失の計上額は、当連結会計年度においては「自動車機器事
業」で1,760百万円、「コンポーネンツ事業」で196百万円、「電子応用製品事業」で372百万円であります。
3.報告セグメントごとの負ののれん発生益に関する情報
該当事項はありません。
-24-
スタンレー電気(株) (6923) 2026年3月期決算短信
(1株当たり情報)
(自
至
1株当たり純資産額
1株当たり当期純利益金額
潜在株式調整後1株当たり当期純利益金額
前連結会計年度
2024年4月1日
2025年3月31日)
(自
至
当連結会計年度
2025年4月1日
2026年3月31日)
3,255.93円
3,695.49円
205.73円
240.51円
-円
240.44円
(注)1.前連結会計年度の潜在株式調整後1株当たり当期純利益金額については、希薄化効果を有している潜在株式
が存在しないため記載しておりません。
2.1株当たり当期純利益金額及び潜在株式調整後1株当たり当期純利益金額の算定上の基礎は、以下のとおり
であります。
前連結会計年度
(自 2024年4月1日
至 2025年3月31日)
当連結会計年度
(自 2025年4月1日
至 2026年3月31日)
1株当たり当期純利益金額
親会社株主に帰属する当期純利益(百万円)
32,058
32,813
-
-
普通株式に係る親会社株主に帰属する当期純利益
(百万円)
32,058
32,813
普通株式の期中平均株式数(千株)
155,828
136,436
親会社株主に帰属する当期純利益調整額(百万円)
-
-
普通株式増加数(千株)
-
34
(-)
(34)
普通株主に帰属しない金額(百万円)
潜在株式調整後1株当たり当期純利益金額
(うち新株予約権)(千株)
希薄化効果を有しないため、潜在株式調整後1株当たり 2020年8月24日取締役会
当期純利益金額の算定に含まれなかった潜在株式の概要決議ストック・オプション
(株式の数 153千株)
2021年7月26日取締役会
決議ストック・オプション
(株式の数 174千株)
2022年10月31日取締役会
決議ストック・オプション
(株式の数 196千株)
2023年7月28日取締役会
決議ストック・オプション
(株式の数 210千株)
-25-
―
スタンレー電気(株) (6923) 2026年3月期決算短信
(重要な後発事象)
(取得による企業結合)
当社は、2026年1月29日開催の取締役会において、岩崎電気株式会社(以下、「岩崎電気」)の全株式を取得し
連結子会社化すること(以下、「本株式取得」)を決議し、2026年4月23日付で全株式の取得を完了し、連結子会
社化いたしました。その内容は以下の通りです。
(1)企業結合の概要
① 被取得企業の名称及びその事業の内容
被取得企業の名称
岩崎電気株式会社
事業の内容
各種光源、照明器具、光・環境機器(紫外線・赤外線・電子線)、関連ソリューション
などの開発・製造及び販売
② 企業結合を行った主な理由
当社グループは「光の価値の限りなき追求」を経営理念の第一に掲げ、自動車用ランプを中心とした「自
動車機器事業」、LEDなどのデバイスを提供する「コンポーネンツ事業」、車載センサーや光学モジュー
ル・ユニットを扱う「電子応用製品事業」の3つの事業を通じ、光が持つ様々な特性を生かした製品の開
発・製造・販売を手掛けております。
一方、岩崎電気は、照明ソリューション事業及び光・環境事業を二本柱として、屋外・公共照明を中心に、
長期にわたる取引実績と充実した営業・サービス網を活かして官公庁等との強固な取引関係を有するととも
に、多様な光技術を活用した硬化・殺菌・加熱等に用いられる産業用光源・照射装置において極めて高い市
場競争力を有しております。
当社は本株式取得により、自動車分野から自治体・公共インフラ、工場、商業施設まで光を活用した様々
なソリューションを提供する体制を強化します。また、スマート道路灯をはじめとする次世代公共照明の開
発を加速するとともに、国内のみならずASEAN・インド市場における道路灯事業の拡大を推進します。
今後、両社が有する強みを最大限に活かし、「コンポーネンツ事業」および「電子応用製品事業」において、
スピード感のある事業展開を実現してまいります。
③ 企業結合日
2026年4月23日(みなし取得日
2026年4月1日)
④ 企業結合の法的形式
現金を対価とする株式取得
⑤ 結合後企業の名称
変更ありません。
⑥ 取得した議決権比率
企業結合日直前に所有していた議決権比率
-%
企業結合日に取得した議決権比率
100.0%
取得後の議決権比率
100.0%
⑦ 取得企業を決定するに至った主な根拠
当社が現金を対価として株式を取得したためであります。
(2)被取得企業の取得原価及び対価の種類ごとの内訳
取得の対価
現金
76,696百万円(※)
取得原価
76,696百万円
(※)最終的な取得価額は、株式譲渡契約書に定める価格調整によって変動する可能性があります。
(3)主要な取得関連費用の内容及び金額
アドバイザリー費用
725百万円(概算)
-26-
スタンレー電気(株) (6923) 2026年3月期決算短信
(4)発生したのれんの金額、発生原因、償却方法及び償却期間
現時点では確定しておりません。
(5)企業結合日に受け入れた資産及び引き受けた負債の額並びにその主な内訳
現時点では確定しておりません。
(多額な資金の借入)
当社は、2026年3月18日開催の取締役会決議に基づき、上記(取得による企業結合)に記載した岩崎電気の株式
取得のため、2026年4月15日に金銭消費貸借契約を締結し、2026年4月20日に借入を実行いたしました。
(1)借入先
株式会社三井住友銀行・株式会社三菱UFJ銀行
(2)借入金額
70,000百万円
(3)借入金利
基準金利+スプレッド
(4)借入実行日
2026年4月20日
(5)返済期限
2027年4月20日
(6)返済方法
期日一括返済
(7)担保等の有無
無担保・無保証
(8)財務制限条項
各連結会計年度において、連結貸借対照表上の「純資産の部の合計金額」
を、4,492億円又は直前の連結会計年度末の「純資産の部の合計金額」の75%
以上に相当する金額のうち、いずれか高い方の金額以上に維持すること。
-27-
スタンレー電気(株) (6923) 2026年3月期決算短信
6.個別財務諸表
(1)貸借対照表
(単位:百万円)
前事業年度
(2025年3月31日)
資産の部
流動資産
現金及び預金
受取手形
電子記録債権
売掛金
有価証券
棚卸資産
短期貸付金
その他
流動資産合計
固定資産
有形固定資産
建物
構築物
機械及び装置
車両運搬具
工具、器具及び備品
土地
リース資産
建設仮勘定
有形固定資産合計
無形固定資産
ソフトウエア
その他
無形固定資産合計
投資その他の資産
投資有価証券
関係会社株式
出資金
関係会社出資金
長期前払費用
前払年金費用
その他
投資その他の資産合計
固定資産合計
資産合計
-28-
当事業年度
(2026年3月31日)
23,035
5
567
37,047
100
22,171
13,509
7,668
104,106
10,951
2
848
40,357
-
20,351
15,377
8,973
96,863
32,689
1,139
13,872
55
5,078
10,919
724
15,723
80,203
37,653
1,214
24,248
143
6,191
11,402
731
14,418
96,004
1,979
769
2,748
2,404
567
2,971
73,576
32,189
212
16,573
12,619
1,972
436
137,581
220,533
324,639
66,780
36,664
220
16,573
19,092
3,913
492
143,737
242,713
339,577
スタンレー電気(株) (6923) 2026年3月期決算短信
(単位:百万円)
前事業年度
(2025年3月31日)
負債の部
流動負債
買掛金
短期借入金
リース債務
未払金
未払費用
未払法人税等
製品保証引当金
賞与引当金
役員賞与引当金
その他の引当金
その他
流動負債合計
固定負債
社債
長期借入金
リース債務
長期未払法人税等
繰延税金負債
その他の引当金
資産除去債務
その他
固定負債合計
負債合計
純資産の部
株主資本
資本金
資本剰余金
資本準備金
資本剰余金合計
利益剰余金
利益準備金
その他利益剰余金
固定資産圧縮積立金
別途積立金
繰越利益剰余金
利益剰余金合計
自己株式
株主資本合計
評価・換算差額等
その他有価証券評価差額金
評価・換算差額等合計
新株予約権
純資産合計
負債純資産合計
-29-
当事業年度
(2026年3月31日)
15,379
9,338
199
10,906
5,602
177
6,071
2,917
220
7
214
51,032
15,732
82,097
255
7,493
4,986
1,038
6,108
3,194
220
-
227
121,353
40,000
5,190
533
-
10,672
-
417
23
56,838
107,870
40,000
5,397
489
63
9,062
28
422
23
55,487
176,841
30,514
30,514
29,825
29,825
29,825
29,825
3,201
3,201
1,277
22,320
105,128
131,927
△7,668
184,598
1,277
22,320
56,216
83,014
△9,282
134,072
31,777
31,777
392
216,768
324,639
28,348
28,348
314
162,735
339,577
スタンレー電気(株) (6923) 2026年3月期決算短信
(2)損益計算書
売上高
売上原価
売上総利益
販売費及び一般管理費
営業利益
営業外収益
受取利息及び配当金
為替差益
その他
営業外収益合計
営業外費用
支払利息
社債発行費
為替差損
外国源泉税
コミットメントフィー
その他
営業外費用合計
経常利益
特別利益
抱合せ株式消滅差益
固定資産売却益
投資有価証券売却益
関係会社清算益
子会社清算益
特別利益合計
特別損失
減損損失
固定資産除却損
特別調査費用
事業構造改善費用
特別損失合計
税引前当期純利益
法人税、住民税及び事業税
法人税等調整額
法人税等合計
当期純利益
前事業年度
(自 2024年4月1日
至 2025年3月31日)
171,340
138,362
32,978
28,414
4,563
(単位:百万円)
当事業年度
(自 2025年4月1日
至 2026年3月31日)
171,575
136,421
35,154
34,120
1,034
14,846
-
375
15,221
29,943
358
338
30,639
565
192
909
204
35
126
2,033
17,751
1,074
-
-
223
35
126
1,458
30,215
-
6
3,480
-
357
3,844
5,746
10
9,853
8
-
15,619
-
737
110
10
858
20,737
3,166
1,098
4,264
16,472
52
959
140
-
1,152
44,682
3,143
△23
3,120
41,562
-30-
スタンレー電気(株) (6923) 2026年3月期決算短信
(3)株主資本等変動計算書
前事業年度(自 2024年4月1日
至 2025年3月31日)
(単位:百万円)
株主資本
資本剰余金
資本金
資本準備金
当期首残高
利益剰余金
その他利益剰余金
資本剰余金
合計
利益準備金
固定資産
圧縮積立金
別途積立金
繰越利益
剰余金
利益剰余金
合計
30,514
29,825
29,825
3,201
1,289
22,320
149,202
176,013
剰余金の配当
-
-
-
-
-
-
△9,533
△9,533
税率変更に伴う
圧縮積立金の減少
-
-
-
-
△12
-
12
-
当期純利益
-
-
-
-
-
-
16,472
16,472
自己株式の取得
-
-
-
-
-
-
-
-
自己株式の処分
-
-
-
-
-
-
3
3
自己株式の消却
-
-
-
-
-
-
△51,032
△51,032
新株予約権の行使
-
-
-
-
-
-
3
3
株主資本以外の項目の
当期変動額(純額)
-
-
-
-
-
-
-
-
-
-
-
-
△12
-
△44,073
△44,086
30,514
29,825
29,825
3,201
1,277
22,320
105,128
131,927
新株予約権
純資産合計
当期変動額
当期変動額合計
当期末残高
株主資本
評価・換算差額等
その他有価証評価・換算
券評価差額金差額等合計
自己株式
株主資本合計
△28,862
207,490
44,755
44,755
388
252,634
剰余金の配当
-
△9,533
-
-
-
△9,533
税率変更に伴う
圧縮積立金の減少
-
-
-
-
-
-
当期首残高
当期変動額
当期純利益
-
16,472
-
-
-
16,472
自己株式の取得
△30,004
△30,004
-
-
-
△30,004
自己株式の処分
147
150
-
-
-
150
自己株式の消却
51,032
-
-
-
-
-
新株予約権の行使
18
21
-
-
-
21
株主資本以外の項目の
当期変動額(純額)
-
-
△12,977
△12,977
4
△12,973
当期変動額合計
21,193
△22,892
△12,977
△12,977
4
△35,865
当期末残高
△7,668
184,598
31,777
31,777
392
216,768
-31-
スタンレー電気(株) (6923) 2026年3月期決算短信
当事業年度(自 2025年4月1日
至 2026年3月31日)
(単位:百万円)
株主資本
資本剰余金
資本金
資本準備金
当期首残高
利益剰余金
その他利益剰余金
資本剰余金
合計
利益準備金
固定資産
圧縮積立金
別途積立金
繰越利益
剰余金
利益剰余金
合計
30,514
29,825
29,825
3,201
1,277
22,320
105,128
131,927
剰余金の配当
-
-
-
-
-
-
△12,371
△12,371
当期純利益
-
-
-
-
-
-
41,562
41,562
自己株式の取得
-
-
-
-
-
-
-
-
自己株式の処分
-
-
-
-
-
-
11
11
自己株式の消却
-
-
-
-
-
-
△78,132
△78,132
新株予約権の行使
-
-
-
-
-
-
17
17
株主資本以外の項目の
当期変動額(純額)
-
-
-
-
-
-
-
-
-
-
-
-
-
-
△48,912
△48,912
30,514
29,825
29,825
3,201
1,277
22,320
56,216
83,014
新株予約権
純資産合計
当期変動額
当期変動額合計
当期末残高
株主資本
評価・換算差額等
その他有価証評価・換算
券評価差額金差額等合計
自己株式
株主資本合計
△7,668
184,598
31,777
31,777
392
216,768
剰余金の配当
-
△12,371
-
-
-
△12,371
当期純利益
-
41,562
-
-
-
41,562
自己株式の取得
△80,004
△80,004
-
-
-
△80,004
自己株式の処分
165
176
-
-
-
176
自己株式の消却
78,132
-
-
-
-
-
新株予約権の行使
93
110
-
-
-
110
株主資本以外の項目の
当期変動額(純額)
-
-
△3,429
△3,429
△78
△3,507
当期変動額合計
△1,613
△50,525
△3,429
△3,429
△78
△54,032
当期末残高
△9,282
134,072
28,348
28,348
314
162,735
当期首残高
当期変動額
-32-
















 |
 |