OPTEX GROUP Company, Limited is a holding company that develops, manufactures, and sells detection sensors and related systems. The group operates through three main business segments: the SS business, which focuses on security, automatic door, and environmental sensors; the IA business, which provides factory automation equipment, image processing LED lighting, industrial computer systems, and automation machinery; and the EMS business, which offers contract manufacturing services for electronic devices. Key subsidiaries include Optex Co., Ltd., CCS Co., Ltd., and Optex MFG Co., Ltd. The company serves domestic and international markets, with overseas operations managed through entities such as OPTEX INCORPORATED, OPTEX (EUROPE) LIMITED, and OPTEX KOREA CO., LTD. The group also engages in outdoor activity and environmental experience learning operations through Opal Optex Co., Ltd.

Summarised from the annual report, fiscal year ended Dec 2025

Industry Electronic Components Homepage optex.co.jp
Sector Technology IR page optex.co.jp
Tags
infrared sensors, security systems, automatic doors, factory automation, industrial lighting, image processing, contract manufacturing, industrial computers, Optex Co. Ltd., Giken Trastem Co. Ltd., G-Nic, Enox, Three Aces, OPTEX INCORPORATED, FIBER SENSYS INC., OPTEX (EUROPE) LIMITED, OPTEX SECURITY SAS, OPTEX SECURITY B.V., OPTEX TECHNOLOGIES B.V., FARSIGHT SECURITY SERVICES LTD., RAYTEC LIMITED, ATEXOR OY, OPTEX KOREA CO. LTD., Optex FA Co. Ltd., CCS Co. Ltd., Sanritsu Automation Co. Ltd., Mitsutech Co. Ltd., Tokyo Kouden Kogyo Co. Ltd., Jick Optex Co. Ltd., Guangzhou Aotaisi Industrial Automation Control Equipment Co. Ltd., OPTEX FA INC., CCS America Inc., CCS Europe N.V., EFFILUX SAS, Gardasoft Vision Ltd., Xishasuxueguangxue (Shenzhen) Co. Ltd., CCS Asia PTE.LTD., CCS MV (THAILAND) CO. Ltd., CCS MV (Malaysia) Sdn.Bhd., CCS KOREA Inc., Optex MFG Co. Ltd., OPTEX (DONGGUAN) CO. LTD., OPTEX (H.K.) LTD., Opal Optex Co. Ltd.
Press page optex.co.jp/news

Metrics

Valuation  
Market cap ¥ 121.132B
Market cap (USD) $ 757.083M
P/E 14.68
PEG 1.27
P/BV 2.02
P/S 1.68
P/OCF 12.63
P/FCF 14.60
Dividend yield 1.7%
Turnover / mcap —
Returns  
ROE 12.4%
ROI 10.7%
ROIC 9.8%
Profit margin 10.0%
Growth  
Revenue growing Yes
Profits growing Yes
Revenue up 3y Yes
Revenue up 5y Yes
Earnings growth 3y (net profit CAGR) 11.5%
Quality  
Profitable Yes
Margin expanding Yes
Buying back stock No
Diluting (TTM) No
Debt/Equity —
Podcast bulls (TTM) Sign up
Podcast bears (TTM) Sign up
Podcast sentiment (TTM) Sign up
Podcast sentiment % (TTM) Sign up
News sentiment (TTM) 25
Quality score 50.0%
Insiders  
Buys, 1w Sign up
Buys, 1m Sign up
Buys, 1y Sign up
Sells, 1w Sign up
Sells, 1m Sign up
Sells, 1y Sign up

Sign up to see this company's insider trades

Figure FY 2025 FY 2024 FY 2023 FY 2022 FY 2021 FY 2020 FY 2019 FY 2018 FY 2017 FY 2016 FY 2015 FY 2014 FY 2013 FY 2012
Revenue 65.878B 63.269B 56.372B 54.811B 45.866B 34.846B 37.517B 40.113B 37.504B 31.027B 27.793B 25.678B 23.582B 20.699B
Net profit 6.595B 5.689B 4.608B 4.752B 3.762B 1.395B 2.197B 3.775B 3.386B 1.809B 2.051B 1.897B 1.62B 825M
Free cash flow 5.679B 5.915B 777M 289M 2.013B 2.509B 1.96B 723M 3.73B 2.861B 1.679B — — —

Figure FY 2025 FY 2024 FY 2023 FY 2022 FY 2021 FY 2020 FY 2019 FY 2018 FY 2017 FY 2016 FY 2015 FY 2014 FY 2013 FY 2012
Share price 2.555K 1.755K 1.788K 1.794K 1.644K 1.886K 1.656K 1.708K 5.953K 2.557K 1.506K 968.11 1.711K 999.35
Price performance 12m 0.46 -0.02 -0 0.09 -0.13 0.14 -0.03 -0.71 1.33 0.7 0.56 -0.43 0.71 —

Filed figures

Figure Dec 2016 Dec 2017 Dec 2018 Dec 2019 Dec 2020 Dec 2021 Dec 2022 Dec 2023 Dec 2024 Dec 2025
Balance sheet detail
Trade receivables (JPY) 7.84B 8.29B 8.94B 8.7B 8.31B 10.4B 24.4B 24.2B 27.8B 27.8B
↳ YoY growth +32.7% +5.8% +7.8% -2.7% -4.5% +25.8% +134.0% -0.9% +14.6% +0.1%
↳ 5y CAGR +7.1% +5.9% +24.1% +22.1% +26.1% +27.3%
Borrowings, current (JPY) 1.83B 784M 1.41B 3.37B 6.42B 10.7B 9.63B 6.71B 6.8B 4.65B
Borrowings, non-current (JPY) 160M 59M 1.71B 433M 232M 210M 1.25B 3.93B 2.1B 1.81B
Cash and deposits (JPY) 10B 12.3B 11.6B 12.4B 14.6B 17.1B 17.3B 17.1B 21.1B 22.9B
Intangible assets (JPY) 4.41B 3.97B 4.24B 3.83B 3.74B 3.2B 2.82B 2.38B 1.89B 2.17B
Net debt (borrowings + leases - cash) (JPY) -8.01B -11.5B -8.45B -8.6B -7.93B -6.23B -6.41B -6.48B -12.2B -16.4B
Cash flow detail
Operating cash flow (JPY) 3.49B 4.4B 1.96B 3.62B 3.89B 3.1B 1.67B 2.11B 7.7B 9.45B
Purchases of property, plant and equipment (JPY) -626M -674M -1.01B -1.39B -1.09B -930M -1.15B -1.16B -1.61B -3.23B
Purchases of intangible assets (JPY) -60M -155M -224M -269M -293M -159M -233M -181M -175M -545M
Change in receivables (cash effect) (JPY) -350M -340M -693M 248M 757M -1.98B -1.41B 524M -1.36B 374M
Change in inventories (cash effect) (JPY) -150M -848M -1.34B 116M 248M -2.54B -4.34B -4.29B 72M 231M
Change in payables (cash effect) (JPY) 415M 135M 242M -235M 82M 681M 325M -650M 142M 147M
Dividends paid (cash effect) (JPY) -662M -847M -1.04B -1.2B -1.08B -1.11B -1.17B -1.35B -1.43B -1.6B
Share buybacks (cash effect) (JPY) -1M -9M -1.5B -1B -1M -1B 0.00 0.00 0.00 0.00
Interest paid (cash effect) (JPY) -16M -12M -11M -14M -11M -32M -54M -67M -67M -78M
Income taxes paid (cash effect) (JPY) -976M -1.01B -2.06B -974M -933M -878M -2.43B -2.31B -2B -2.39B
Operating cash flow before change in receivables (JPY) 3.84B 4.74B 2.65B 3.37B 3.14B 5.09B 3.08B 1.59B 9.06B 9.08B
Free cash flow (OCF - PPE - intangibles) (JPY) 2.8B 3.58B 723M 1.96B 2.51B 2.01B 289M 777M 5.92B 5.68B
Income detail
Research and development expense (JPY) 2.32B 2.76B 2.88B 2.76B 2.75B 3.1B 3.38B 3.39B 3.7B 3.76B
↳ 5y CAGR +7.9% +6.0% +4.2% +3.3% +6.0% +6.5%
Total comprehensive income (JPY) 1.25B 4.33B 3.05B 2.15B 1.26B 4.76B 5.48B 5.82B 7.17B 7.59B
Comprehensive income to owners (JPY) 1.07B 3.97B 2.89B 2.14B 1.26B 4.75B 5.48B 5.81B 7.16B 7.59B
Provision for credit losses (JPY) 3M 0.00 5M -8M 2M 12M 405M 8M 57M 32M
Credit cost ratio (credit losses / average receivables) (%) 0.0% 0.0% 0.1% 0.1% 0.0% 0.1% 2.3% 0.0% 0.2% 0.1%
Reported Mar 27, 2017 Mar 26, 2018 Mar 28, 2019 Mar 26, 2020 Mar 26, 2021 Mar 25, 2022 Mar 24, 2023 Mar 27, 2024 Mar 28, 2025 Mar 26, 2026

Sign up to see institutional holdings

Sign Up

Podcast Mentions

Sign up to see podcast mentions and sentiment

Sign Up

2026年10月08日

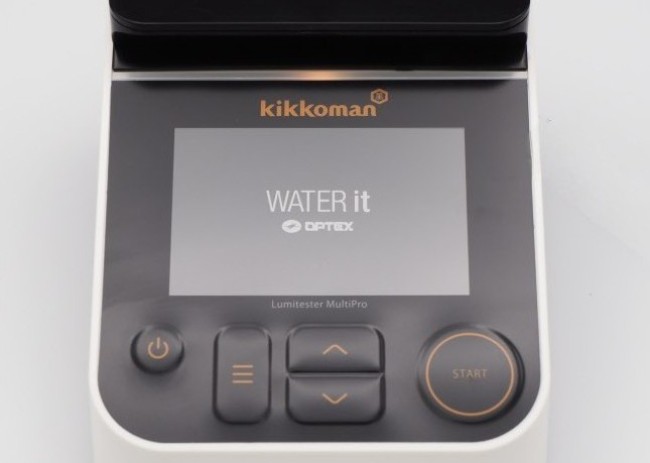
新型ATP測定器『ルミテスター MultiPro』をキッコーマンバイオケミファと共同開発

水環境や食品の微生物汚染を高感度でモニタリング

オプテックス株式会社(本社:滋賀県大津市、代表取締役社長:池田 和男、以下「オプテックス」)は、キッコーマンバイオケミファ株式会社(本社:東京都港区、代表取締役社長:浅見 芳昭、以下「キッコーマンバイオケミファ」)とATP検査用*1の高感度測定器「ルミテスター MultiPro」(以下「本製品」)を共同開発いたしました。本製品は2026年10月13日(火)より販売を開始いたします。
キッコーマン株式会社は1989年に、ホタルの光を生み出す酵素「ルシフェラーゼ」の遺伝子組換えによる量産化に成功し、その発光原理を利用したATP検査を事業化しました。2017年に共同で開発した簡単に検査できる衛生管理キット「ルミテスター Smart」の意匠は、令和6年度全国発明表彰で特許庁長官賞を受賞しています。

本製品は、衛生管理の熟練者向けに販売していた高感度測定器「ルミテスター C-110」の後継にあたり、測定の簡便化と多用途化を実現いたしました。

本製品の特徴

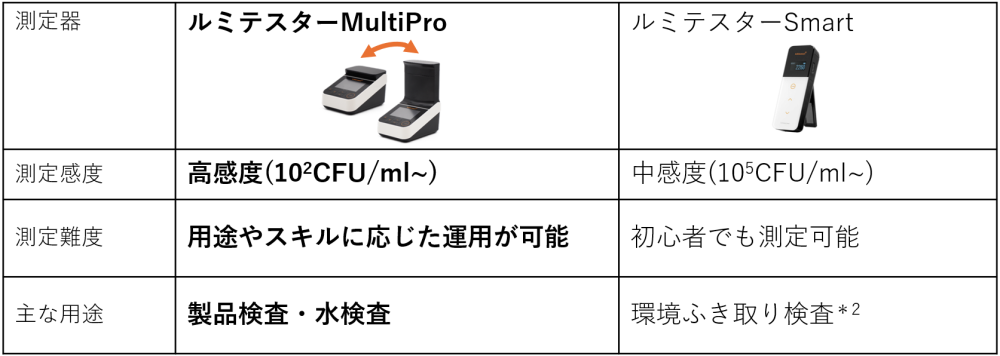
  • 高感度測定(10²CFU/ml~、検体1mlあたり菌数100個相当のATP量を検出)が可能で、水道水、井水、原水、純水や生産現場で使用される各種工業用水の微生物汚染の予防管理から、食品・飲料・化粧品の製品検査まで、幅広い分野に対応します。
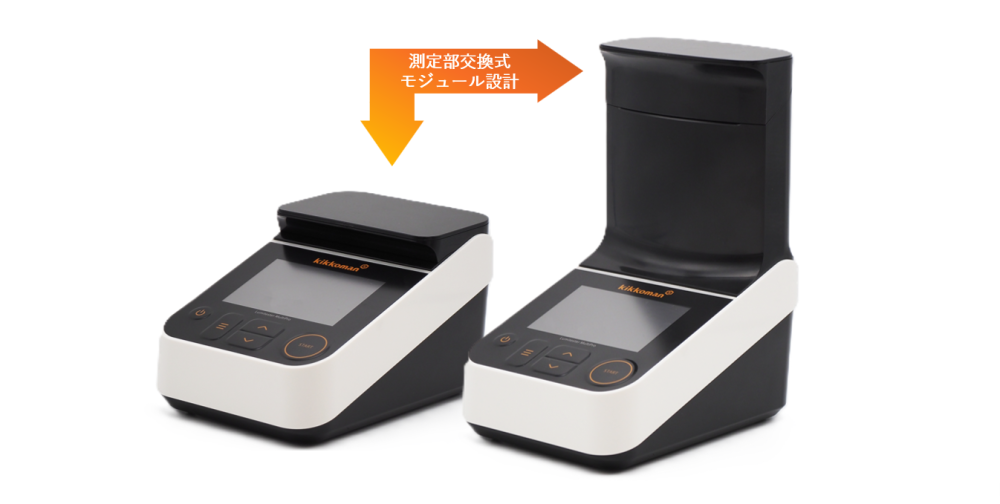
  • 測定部交換式モジュール設計により、1台で新商品の「ルシパック Pro液体中微生物検出キット」と従来品の「ルシフェール」の2タイプの専用検出キットに対応し、将来的な拡張性も備えています。
  • オプテックスが運営する水質管理モニタリングサービス「WATER it」と連携させることにより、水の管理がより簡単になります。
  • 初心者から熟練者まで、用途や分析スキルに応じた柔軟な運用が可能です。

本製品と従来機種との比較
オプテックスの役割

各社が連携し現場リサーチやペルソナの作成、コンセプトディスカッションを重ねながら共創的にプロジェクトを推進。特定した性能要件を基に、機構設計や電子回路設計・ソフト構築・測定機構の開発をオプテックスが担いました。*3

特に高感度領域においては、宇宙線による揺らぎを考慮する必要があるほどセンシティブな調整を実施しています。またオプテックスが提供する遠隔モニタリングシステム「WATER it データマネジメントシステム」とも連携しており、作業現場のDX化もサポートします。
(*1)ATP検査:生物のエネルギー物質ATP(アデノシン三リン酸)を測定し、汚れや微生物量を数値化する検査方法
(*2)環境ふき取り検査:表面をふき取り、付着したATP量を測定する衛生管理手法。約10秒で清浄度を確認可能
(*3)本意匠は、hyphenate株式会社(本社:東京都千代田区、代表取締役:浅沼 吾郎)との共同デザインです

今後の展望

「ルミテスター MultiPro」の測定部はモジュール構造を採用しており、用途に応じて交換できます。これにより将来的な拡張にも柔軟に対応します。オプテックスは今後も衛生・水質分野の発展に向け、パートナーの皆さまと共に価値創造を続けてまいります。

本件に関するお問い合わせ先

オプテックス株式会社 広報・販促課 蔭山/岡井

E-mail:[email protected]

オプテックスグループ株式会社

Copyright © 2026 OPTEX CO., LTD.
2025

ニュース

2025

もっと見る

オプテックスグループ株式会社

Copyright © 2026 OPTEX CO., LTD.

2026 Bull 0 Bear 0 Routine

ニュース

2026

もっと見る

オプテックスグループ株式会社

Copyright © 2026 OPTEX CO., LTD.
Prompts

OPTEX GROUP Company, Limited (ticker 6914), listed in Japan.

ETFs Holding OPTEX GROUP Company, Limited

ETF Weight in ETF Shares Market value As of
DFIS 0.03% 79,400 $ 1.452M Nov 12, 2026
AVDS 0.02% 5,100 $ 89.727K Nov 16, 2026
AVDE 0.01% 57,200 $ 1.006M Nov 16, 2026
AVSD 0.01% 2,800 $ 49.262K Nov 16, 2026
DXIV 0.01% 1,100 $ 20.122K Nov 12, 2026
DFIC 0.01% 47,300 $ 865.244K Nov 12, 2026
DFSI 0.01% 3,600 $ 65.854K Nov 12, 2026
DFAX 0.00% 28,900 $ 528.659K Nov 12, 2026
DFAI 0.00% 29,500 $ 539.634K Nov 12, 2026
AVDV 0.00% 54,400 $ 957.093K Nov 16, 2026