Consent Details [#IABV2SETTINGS#] About This website uses cookies We use cookies to personalise content and ads, to provide social media features and to analyse our traffic. We also share information about your use of our site with our social…
![logo]()
This website uses cookies
We use cookies to personalise content and ads, to provide social media features and to analyse our traffic. We also share information about your use of our site with our social media, advertising and analytics partners who may combine it with other information that you’ve provided to them or that they’ve collected from your use of their services.
[#GPC_BANNER_ICON#]
[#GPC_TOAST_TEXT#]
Consent Selection
Necessary
Preferences
Statistics
Marketing
Show details
Details
-
Necessary 27
Necessary cookies help make a website usable by enabling basic functions like page navigation and access to secure areas of the website. The website cannot function properly without these cookies.
-
Cookiebot
1
Learn more about this provider
CookieConsentStores the user's cookie consent state for the current domain
Maximum Storage Duration: 1 yearType: HTTP Cookie
-
Google
6
Learn more about this provider
Some of the data collected by this provider is for the purposes of personalization and measuring advertising effectiveness. The provider may use the IP Addresses for ads measurement and ads personalization.
test_cookieUsed to check if the user's browser supports cookies.
Maximum Storage Duration: 1 dayType: HTTP Cookie
_GRECAPTCHAThis cookie is used to distinguish between humans and bots. This is beneficial for the website, in order to make valid reports on the use of their website.
Maximum Storage Duration: 180 daysType: HTTP Cookie
rc::aThis cookie is used to distinguish between humans and bots. This is beneficial for the website, in order to make valid reports on the use of their website.
Maximum Storage Duration: PersistentType: HTML Local Storage
rc::bThis cookie is used to distinguish between humans and bots.
Maximum Storage Duration: SessionType: HTML Local Storage
rc::cThis cookie is used to distinguish between humans and bots.
Maximum Storage Duration: SessionType: HTML Local Storage
rc::fThis cookie is used to distinguish between humans and bots.
Maximum Storage Duration: PersistentType: HTML Local Storage
-
HubSpot
1
Learn more about this provider
cookietestThis cookie is used to determine if the visitor has accepted the cookie consent box.
Maximum Storage Duration: SessionType: HTTP Cookie
-
LinkedIn
2
Learn more about this provider
bcookieUsed in order to detect spam and improve the website's security.
Maximum Storage Duration: 1 yearType: HTTP Cookie
li_gcStores the user's cookie consent state for the current domain
Maximum Storage Duration: 180 daysType: HTTP Cookie
-
YouTube
1
Learn more about this provider
GPSUsed to determine whether the user is logged in on a YouTube account, when watching embedded videos.
Maximum Storage Duration: 1 dayType: HTTP Cookie
-
hsadspixel.net
hs-banner.com
linkedin.com
vimeo.com
11
**__cf_bm [x11]**This cookie is used to distinguish between humans and bots. This is beneficial for the website, in order to make valid reports on the use of their website.
Maximum Storage Duration: 1 dayType: HTTP Cookie
-
singaporetech.edu.sg
3
**incap_ses_#**Preserves users states across page requests.
Maximum Storage Duration: SessionType: HTTP Cookie
**nlbi_#**Used to ensure website security and fraud detection.
Maximum Storage Duration: SessionType: HTTP Cookie
**visid_incap_#**Preserves users states across page requests.
Maximum Storage Duration: 1 yearType: HTTP Cookie
-
sitlearn.singaporetech.edu.sg
2
ARRAffinityUsed to distribute traffic to the website on several servers in order to optimise response times.
Maximum Storage Duration: SessionType: HTTP Cookie
ARRAffinitySameSiteUsed to distribute traffic to the website on several servers in order to optimise response times.
Maximum Storage Duration: SessionType: HTTP Cookie
-
Preferences 4
Preference cookies enable a website to remember information that changes the way the website behaves or looks, like your preferred language or the region that you are in.
-
LinkedIn
1
Learn more about this provider
lidcRegisters which server-cluster is serving the visitor. This is used in context with load balancing, in order to optimize user experience.
Maximum Storage Duration: 1 dayType: HTTP Cookie
-
LiveChat
3
Learn more about this provider
__lc_cidNecessary for the functionality of the website's chat-box function.
Maximum Storage Duration: 400 daysType: HTTP Cookie
__lc_cstNecessary for the functionality of the website's chat-box function.
Maximum Storage Duration: 400 daysType: HTTP Cookie
__oauth_redirect_detectorAllows the website to recoqnise the visitor, in order to optimize the chat-box functionality.
Maximum Storage Duration: 1 dayType: HTTP Cookie
-
Statistics 7
Statistic cookies help website owners to understand how visitors interact with websites by collecting and reporting information anonymously.
-
HubSpot
4
Learn more about this provider
__hsscIdentifies if the cookie data needs to be updated in the visitor's browser.
Maximum Storage Duration: 1 dayType: HTTP Cookie
__hssrcUsed to recognise the visitor's browser upon reentry on the website.
Maximum Storage Duration: SessionType: HTTP Cookie
__hstcSets a unique ID for the session. This allows the website to obtain data on visitor behaviour for statistical purposes.
Maximum Storage Duration: 180 daysType: HTTP Cookie
hubspotutkSets a unique ID for the session. This allows the website to obtain data on visitor behaviour for statistical purposes.
Maximum Storage Duration: 180 daysType: HTTP Cookie
-
Livechat
1
Learn more about this provider
_livechat_has_visitedIdentifies the visitor across devices and visits, in order to optimize the chat-box function on the website.
Maximum Storage Duration: PersistentType: HTML Local Storage
-
Vimeo
1
Learn more about this provider
vuidCollects data on the user's visits to the website, such as which pages have been read.
Maximum Storage Duration: 2 yearsType: HTTP Cookie
-
sitlearn.singaporetech.edu.sg
1
Dynamics365PortalAnalyticsUsed to monitor website performance for statistical purposes.
Maximum Storage Duration: 3 monthsType: HTTP Cookie
-
Marketing 37
Marketing cookies are used to track visitors across websites. The intention is to display ads that are relevant and engaging for the individual user and thereby more valuable for publishers and third party advertisers.
-
Meta Platforms, Inc.
3
Learn more about this provider
lastExternalReferrerDetects how the user reached the website by registering their last URL-address.
Maximum Storage Duration: PersistentType: HTML Local Storage
lastExternalReferrerTimeDetects how the user reached the website by registering their last URL-address.
Maximum Storage Duration: PersistentType: HTML Local Storage
_fbpUsed by Facebook to deliver a series of advertisement products such as real time bidding from third party advertisers.
Maximum Storage Duration: 3 monthsType: HTTP Cookie
-
Google
9
Learn more about this provider
Some of the data collected by this provider is for the purposes of personalization and measuring advertising effectiveness. The provider may use the IP Addresses for ads measurement and ads personalization.
IDEUsed by Google DoubleClick to register and report the website user's actions after viewing or clicking one of the advertiser's ads with the purpose of measuring the efficacy of an ad and to present targeted ads to the user.
Maximum Storage Duration: 400 daysType: HTTP Cookie
**pagead/1p-user-list/#**Tracks if the user has shown interest in specific products or events across multiple websites and detects how the user navigates between sites. This is used for measurement of advertisement efforts and facilitates payment of referral-fees between websites.
Maximum Storage Duration: SessionType: Pixel Tracker
**ccm/conversion/10934208313/**Pending
Maximum Storage Duration: SessionType: Pixel Tracker
**ccm/conversion/16959030624/**Pending
Maximum Storage Duration: SessionType: Pixel Tracker
**ccm/conversion/698508317/**Pending
Maximum Storage Duration: SessionType: Pixel Tracker
_gaUsed to send data to Google Analytics about the visitor's device and behavior. Tracks the visitor across devices and marketing channels.
Maximum Storage Duration: 2 yearsType: HTTP Cookie
**_ga_#**Used to send data to Google Analytics about the visitor's device and behavior. Tracks the visitor across devices and marketing channels.
Maximum Storage Duration: 2 yearsType: HTTP Cookie
_gcl_auUsed by Google AdSense for experimenting with advertisement efficiency across websites using their services.
Maximum Storage Duration: 3 monthsType: HTTP Cookie
_gcl_lsTracks the conversion rate between the user and the advertisement banners on the website - This serves to optimise the relevance of the advertisements on the website.
Maximum Storage Duration: PersistentType: HTML Local Storage
-
HubSpot
1
Learn more about this provider
__ptq.gifSends data to the marketing platform Hubspot about the visitor's device and behaviour. Tracks the visitor across devices and marketing channels.
Maximum Storage Duration: SessionType: Pixel Tracker
-
Marketo
1
Learn more about this provider
_mkto_trkContains data on visitor behaviour and website interaction. This is used in context with the email marketing service Marketo.com, which allows the website to target visitors via email.
Maximum Storage Duration: 2 yearsType: HTTP Cookie
-
Vimeo
5
Learn more about this provider
orionV3#identityUsed to track user’s interaction with embedded content.
Maximum Storage Duration: PersistentType: IndexedDB
picox#eventsUsed to track user’s interaction with embedded content.
Maximum Storage Duration: PersistentType: IndexedDB
LOCAL_STORAGE_ID_PICOX_IDUsed to track user’s interaction with embedded content.
Maximum Storage Duration: PersistentType: HTML Local Storage
LOCAL_STORAGE_ID_VIMEO_PLAYERUsed to track user’s interaction with embedded content.
Maximum Storage Duration: PersistentType: HTML Local Storage
PLAYER_PICOX_SAMPLING_SEEDUsed to track user’s interaction with embedded content.
Maximum Storage Duration: PersistentType: HTML Local Storage
-
YouTube
18
Learn more about this provider
**LAST_RESULT_ENTRY_KEY [x2]**Used to track user’s interaction with embedded content.
Maximum Storage Duration: SessionType: HTTP Cookie
**TESTCOOKIESENABLED [x2]**Used to track user’s interaction with embedded content.
Maximum Storage Duration: 1 dayType: HTTP Cookie
**yt-icons-last-purged [x2]**Necessary for the implementation and functionality of YouTube video-content on the website.
Maximum Storage Duration: PersistentType: HTML Local Storage
**ytidb::LAST_RESULT_ENTRY_KEY [x2]**Used to track user’s interaction with embedded content.
Maximum Storage Duration: PersistentType: HTML Local Storage
**YtIdbMeta#databases [x2]**Used to track user’s interaction with embedded content.
Maximum Storage Duration: PersistentType: IndexedDB
__Secure-BUCKETPending
Maximum Storage Duration: 180 daysType: HTTP Cookie
__Secure-ROLLOUT_TOKENUsed to track user’s interaction with embedded content.
Maximum Storage Duration: 180 daysType: HTTP Cookie
__Secure-YECStores the user's video player preferences using embedded YouTube video
Maximum Storage Duration: SessionType: HTTP Cookie
__Secure-YNIDUsed to track user’s interaction with embedded content.
Maximum Storage Duration: 180 daysType: HTTP Cookie
LogsDatabaseV2:V#||LogsRequestsStoreUsed to track user’s interaction with embedded content.
Maximum Storage Duration: PersistentType: IndexedDB
ServiceWorkerLogsDatabase#SWHealthLogNecessary for the implementation and functionality of YouTube video-content on the website.
Maximum Storage Duration: PersistentType: IndexedDB
VISITOR_INFO1_LIVETries to estimate the users' bandwidth on pages with integrated YouTube videos.
Maximum Storage Duration: 180 daysType: HTTP Cookie
YSCRegisters a unique ID to keep statistics of what videos from YouTube the user has seen.
Maximum Storage Duration: SessionType: HTTP Cookie
-
Unclassified 19
Unclassified cookies are cookies that we are in the process of classifying, together with the providers of individual cookies.
-
Azure
3
Learn more about this provider
cisession_ddPending
Maximum Storage Duration: PersistentType: HTML Local Storage
cisession_previousPending
Maximum Storage Duration: PersistentType: HTML Local Storage
_msciPending
Maximum Storage Duration: 1 yearType: HTTP Cookie
-
Livechat
3
Learn more about this provider
@@lc_auth_token:f62bc99e-d0fd-4fe2-9a08-c565f3f5e42fPending
Maximum Storage Duration: PersistentType: HTML Local Storage
@@lc_privacy_policy:f62bc99e-d0fd-4fe2-9a08-c565f3f5e42fPending
Maximum Storage Duration: PersistentType: HTML Local Storage
f62bc99e-d0fd-4fe2-9a08-c565f3f5e42f:statePending
Maximum Storage Duration: PersistentType: HTML Local Storage
-
ar.mrc-s.com
3
mrc_ar_sessionPending
Maximum Storage Duration: SessionType: HTML Local Storage
mrc_service_pidPending
Maximum Storage Duration: PersistentType: HTML Local Storage
_pidPending
Maximum Storage Duration: 10 yearsType: HTTP Cookie
-
form.mrc-s.com
2
mrc_download_auth_e1pkknPending
Maximum Storage Duration: SessionType: HTML Local Storage
mrc_webform_zipcloud_addressPending
Maximum Storage Duration: SessionType: HTML Local Storage
-
j.wovn.io
6
__wovn__.ValidatePending
Maximum Storage Duration: 1 dayType: HTTP Cookie
wap_last_eventPending
Maximum Storage Duration: 20 yearsType: HTTP Cookie
WAPIDPending
Maximum Storage Duration: 20 yearsType: HTTP Cookie
wovn_mtm_showed_langsPending
Maximum Storage Duration: 1 yearType: HTTP Cookie
wovn_selected_langPending
Maximum Storage Duration: 1 yearType: HTTP Cookie
__wovn__.TranslationStorePending
Maximum Storage Duration: SessionType: HTML Local Storage
-
mrc-s.com
1
mrc_service_sidPending
Maximum Storage Duration: 400 daysType: HTTP Cookie
-
www.hioki.com
1
LANGCODEPending
Maximum Storage Duration: SessionType: HTTP Cookie
Cross-domain consent[#BULK_CONSENT_DOMAINS_COUNT#]
[#BULK_CONSENT_TITLE#]
List of domains your consent applies to: [#BULK_CONSENT_DOMAINS#]
Cookie declaration last updated on 9/28/26 by Cookiebot
[#IABV2_TITLE#]
[#IABV2_BODY_INTRO#]
[#IABV2_BODY_LEGITIMATE_INTEREST_INTRO#]
[#IABV2_BODY_PREFERENCE_INTRO#]
[#IABV2_LABEL_PURPOSES#]
[#IABV2_BODY_PURPOSES_INTRO#]
[#IABV2_BODY_PURPOSES#]
[#IABV2_LABEL_FEATURES#]
[#IABV2_BODY_FEATURES_INTRO#]
[#IABV2_BODY_FEATURES#]
[#IABV2_LABEL_PARTNERS#]
[#IABV2_BODY_PARTNERS_INTRO#]
[#IABV2_BODY_PARTNERS#]
About
Cookies are small text files that can be used by websites to make a user's experience more efficient.
The law states that we can store cookies on your device if they are strictly necessary for the operation of this site. For all other types of cookies we need your permission.
This site uses different types of cookies. Some cookies are placed by third party services that appear on our pages.
You can at any time change or withdraw your consent from the Cookie Declaration on our website.
Learn more about who we are, how you can contact us and how we process personal data in our Privacy Policy.
Please state your consent ID and date when you contact us regarding your consent.
Do not sell or share my personal information
Allow allCustomize
Allow selectionDeny
Skip to main content

Search Open MENU
Select your region & language
Americas
Europe
East Asia
Southeast Asia, Oceania
India
Worldwide
Close
Home
Newsroom
HIOKI Engineer Wins Best Paper Award at IPEC 2026 for High-Frequency Loss Analysis Model for Next-Generation Motor Design
News Sep. 11, 2026
HIOKI Engineer Wins Best Paper Award at IPEC 2026 for High-Frequency Loss Analysis Model for Next-Generation Motor Design
Hioki engineer Masakazu Akahane’s proposal, accounting for hidden capacitance and inductance in cables and motor windings, will help engineers pin down losses in performance.
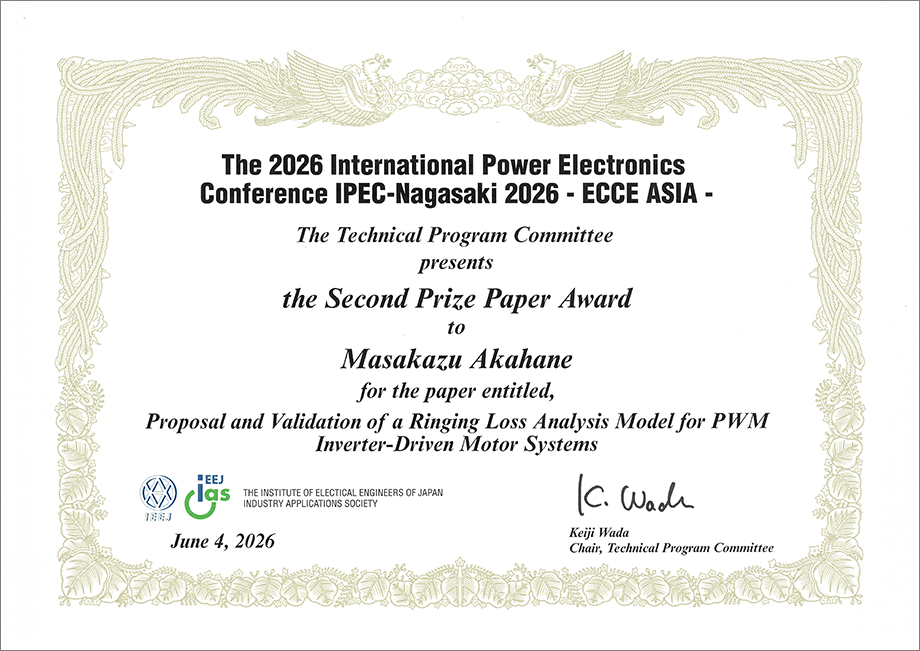
HIOKI E.E. Corporation is proud to announce that Masakazu Akahane, an engineer in the company's Sensing and Storage Unit, has received the Best Paper Award, Second Prize at the International Power Electronics Conference (IPEC-Nagasaki 2026 / ECCE Asia).
Co-authored with Professor Kan Akatsu of Yokohama National University, the paper - "Proposal and Validation of a Ringing Loss Analysis Model for PWM (Pulse-Width Modulation) Inverter-Driven Motor Systems"(*1) - proposes a new analytical model for a class of high-frequency energy losses that have historically been difficult to evaluate accurately, and have been insufficiently understood.
-
*1:M. Akahane, K. Hayashi and K. Akatsu, "Proposal and Validation of a Ringing Loss Analysis Model for PWM Inverter-Driven Motor Systems," 2026 International Power Electronics Conference (IPEC-Nagasaki 2026 - ECCE Asia), Nagasaki, Japan, 2026, pp. 1-6, doi: 10.23919/IPEC-Nagasaki2026-EC64663.2026.11596686.
-
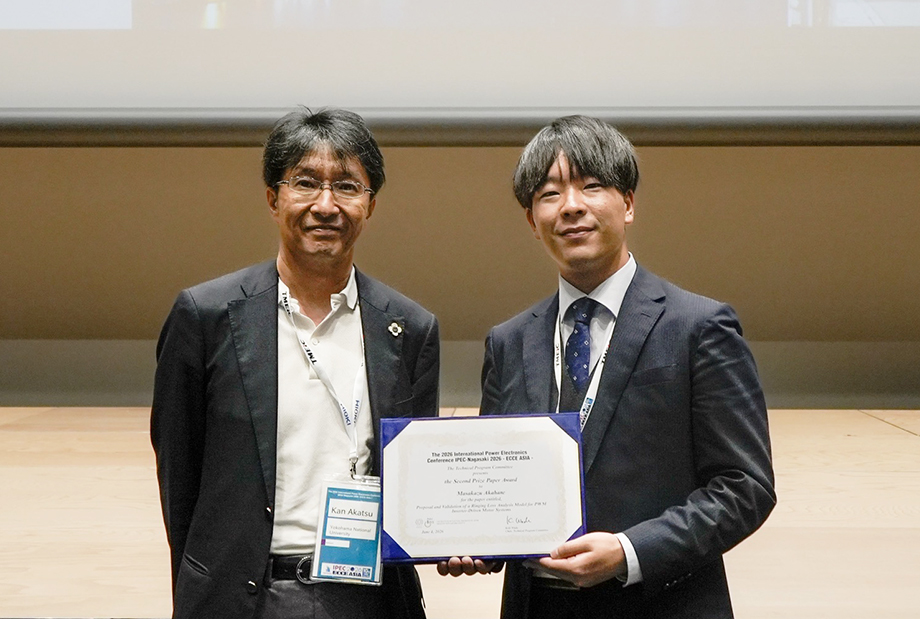
Professor Akatsu of Yokohama National University (left) and Masakazu Akahane of HIOKI's Sensing and Storage Unit (right)
Key developments and impacts
- Streamlining design processes: By predicting high-frequency losses during motor and inverter design, engineers can significantly reduce rework after prototyping, shortening development time and cutting costs. Validation through physical measurement confirmed the model's effectiveness, enabling ringing loss prediction at the design stage - a process previously considered difficult.
- Establishing measurement guidelines for high-accuracy efficiency and loss evaluation: Improving motor drive efficiency requires accurately capturing high-frequency, low-power-factor power components. The research technically validated the need for a power measurement system with wide bandwidth and high phase accuracy, and proposes measurement guidelines for next-generation inverter-motor development.
A New Approach to a Growing Challenge
With demand rising for higher efficiency in motor drive systems, like the ones in electric vehicles (EVs), industrial motor drives, and renewable energy systems, understanding the high-frequency energy losses associated with the switching operations of inverters using wide-bandgap (WBG) semiconductors such as Silicon Carbide (SiC) has become critical.
Next-generation semiconductors have enabled PWM (pulse-width modulation) inverters to run at higher switching speeds and voltages. But so-called "ringing losses" - high-frequency energy losses caused by voltage and current oscillations during switching events - increase correspondingly, presenting engineers with losses that are difficult to quantify and poorly understood at a system level.
These losses arise in part from unintended electrical properties such as hidden capacitances and inductance in the cables and motor windings connecting the inverter to the motor: properties that arise from how wires are wound and routed, and which are difficult to model accurately.
Akahane's paper clarifies the mechanism behind ringing loss and proposes a new analytical model to predict it. The paper shows that ringing loss rises proportionally with the motor's parasitic capacitance, the inverter's switching frequency, and the square of the DC bus voltage, giving engineers clear parameters to work with in next-generation motor drive design.
Model Validation Through HIOKI's Solutions
To confirm the model, the research team required instruments capable of capturing minute losses in the high-frequency range - a measurement challenge that conventional power analyzers could not meet.
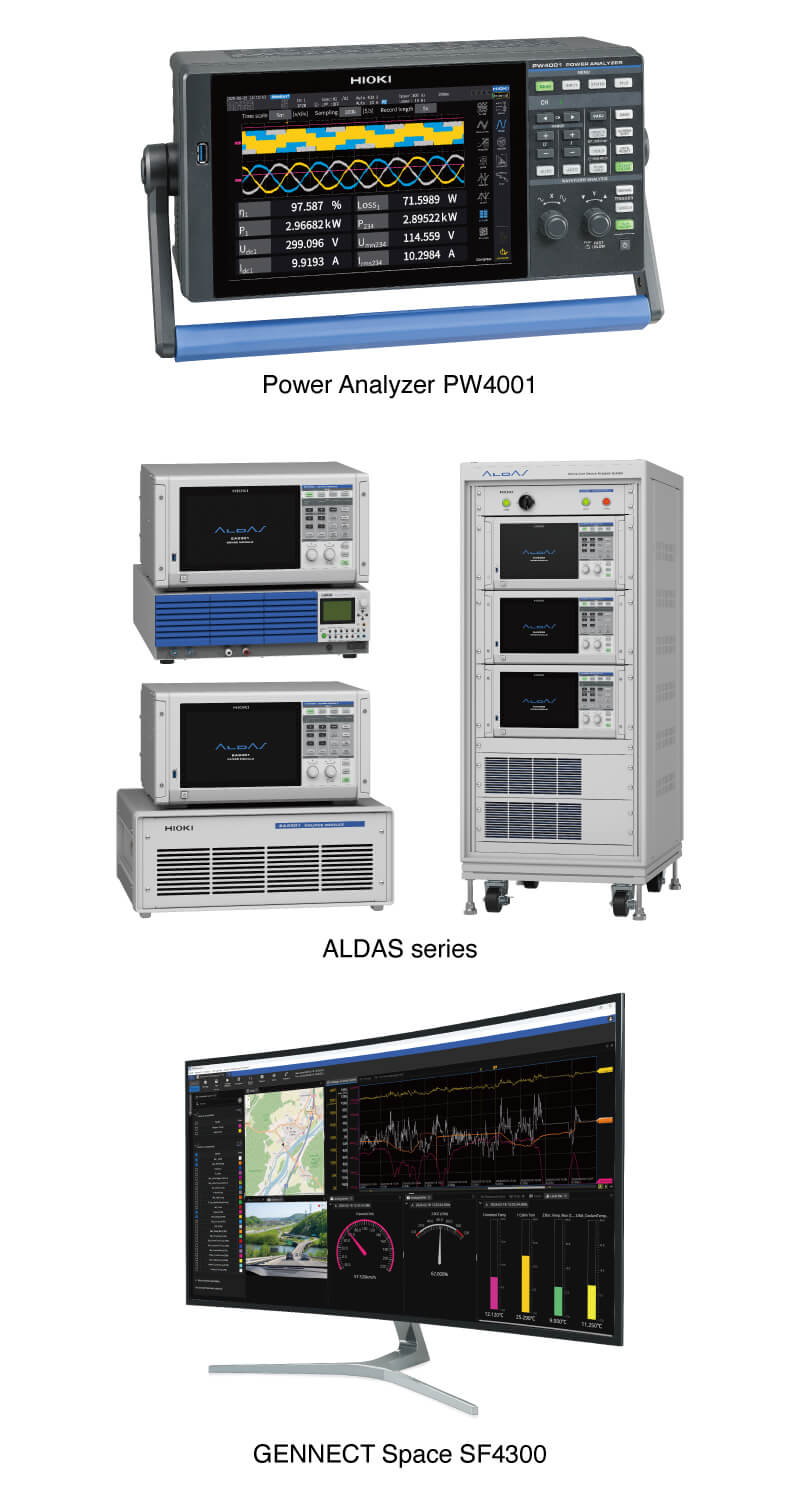
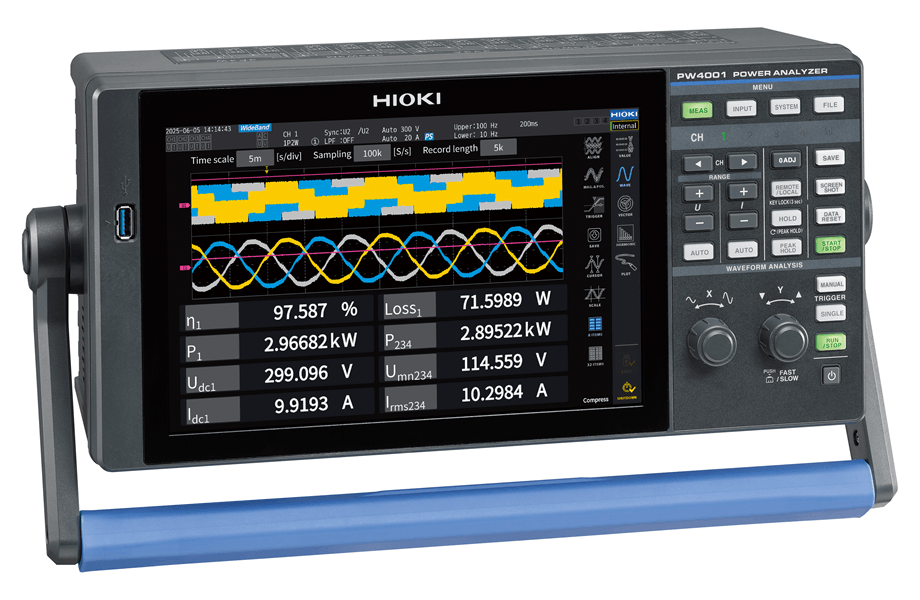
Akahane's team used HIOKI's own power measurement solution: the PW8001 Power Analyzer with the U7005 Input Unit and CT6904A Current Sensor. Close agreement between simulation results and empirical data confirmed the model's validity and demonstrated the unique capability of HIOKI's wideband solution to measure in frequency ranges where conventional instruments fell short. The resulting model lets engineers predict ringing loss at the design stage, reducing the need for costly physical testing.
The abstract is publicly available at the link here:
Proposal and Validation of a Ringing Loss Analysis Model for PWM Inverter-Driven Motor Systems | IEEE Conference Publication | IEEE Xplore
About the International Power Electronics Conference (IPEC)
The International Power Electronics Conference (IPEC) is one of the world’s leading conferences in the field of power electronics, including power conversion technologies and motor drives. Organized by the Institute of Electrical Engineers of Japan (IEEJ), with the IEEE Power Electronics Society and the IEEE Industry Applications Society as co-sponsors, it brings together researchers, engineers, and academic professionals from around the world to present and discuss the latest technologies.
Amid the rapidly accelerating trends toward energy transition and electrification, IPEC plays an important role as a venue where cutting-edge technologies across a wide range of fields—including electric vehicles (EVs), renewable energy, and industrial motor drives—are brought together.
The 10th IPEC was held in Nagasaki from May 31 to June 4, 2026.








 左から日置電機(株)チーム代表と日置フォレストプラザ(株)チームの代表(表彰式会場にて)