Consent Details [#IABV2SETTINGS#] About This website uses cookies We use cookies to personalise content and ads, to provide social media features and to analyse our traffic. We also share information about your use of our site with our social…
![logo]()
This website uses cookies
We use cookies to personalise content and ads, to provide social media features and to analyse our traffic. We also share information about your use of our site with our social media, advertising and analytics partners who may combine it with other information that you’ve provided to them or that they’ve collected from your use of their services.
Show more
[#GPC_BANNER_ICON#]
[#GPC_TOAST_TEXT#]
Consent Selection
Necessary
Preferences
Statistics
Marketing
Show details
Details
-
Necessary 49
Necessary cookies help make a website usable by enabling basic functions like page navigation and access to secure areas of the website. The website cannot function properly without these cookies.
-
Brightcove
1
Learn more about this provider
hapyak-env-versionThis cookie is necessary in order to enable you to move around the website and use its features, such as setting your privacy preferences, logging in or filling in forms. Without this cookie, services requested through usage of our website cannot be properly provided. Necessary cookie does not require consent from the user under applicable law.
Maximum Storage Duration: PersistentType: HTML Local Storage
-
Cookiebot
1
Learn more about this provider
CookieConsentStores the user's cookie consent state for the current domain
Maximum Storage Duration: 1 yearType: HTTP Cookie
-
OpenAI
2
Learn more about this provider
**_cfuvid [x2]**This cookie is a part of the services provided by Cloudflare - Including load-balancing, deliverance of website content and serving DNS connection for website operators.
Maximum Storage Duration: SessionType: HTTP Cookie
-
api-web.keyence.com
www.keyence.com
4
**AWSALB [x2]**Registers which server-cluster is serving the visitor. This is used in context with load balancing, in order to optimize user experience.
Maximum Storage Duration: 7 daysType: HTTP Cookie
**AWSALBCORS [x2]**Registers which server-cluster is serving the visitor. This is used in context with load balancing, in order to optimize user experience.
Maximum Storage Duration: 7 daysType: HTTP Cookie
-
bzr.openai.com
linkedin.com
3
**__cf_bm [x3]**This cookie is used to distinguish between humans and bots. This is beneficial for the website, in order to make valid reports on the use of their website.
Maximum Storage Duration: 1 dayType: HTTP Cookie
-
dev.visualwebsiteoptimizer.com
www.keyence.com
2
**_vwo_consent [x2]**This cookie is necessary in order to enable you to move around the website and use its features, such as setting your privacy preferences, logging in or filling in forms. Without this cookie, services requested through usage of our website cannot be properly provided. Necessary cookie does not require consent from the user under applicable law.
Maximum Storage Duration: SessionType: HTTP Cookie
-
keyence.co.jp
keyence.com
2
**AKA_A2 [x2]**This cookie is necessary for the cache function. A cache is used by the website to optimize the response time between the visitor and the website. The cache is usually stored on the visitor’s browser.
Maximum Storage Duration: 1 dayType: HTTP Cookie
-
keyence.com
11
_abckThis cookie is necessary in order to enable you to move around the website and use its features, such as setting your privacy preferences, logging in or filling in forms. Without this cookie, services requested through usage of our website cannot be properly provided. Necessary cookie does not require consent from the user under applicable law.
Maximum Storage Duration: 1 dayType: HTTP Cookie
alcThis cookie is necessary in order to enable you to move around the website and use its features, such as setting your privacy preferences, logging in or filling in forms. Without this cookie, services requested through usage of our website cannot be properly provided. Necessary cookie does not require consent from the user under applicable law.
Maximum Storage Duration: SessionType: HTTP Cookie
alvThis cookie is necessary in order to enable you to move around the website and use its features, such as setting your privacy preferences, logging in or filling in forms. Without this cookie, services requested through usage of our website cannot be properly provided. Necessary cookie does not require consent from the user under applicable law.
Maximum Storage Duration: SessionType: HTTP Cookie
authTokenIdThis cookie is necessary in order to enable you to move around the website and use its features, such as setting your privacy preferences, logging in or filling in forms. Without this cookie, services requested through usage of our website cannot be properly provided. Necessary cookie does not require consent from the user under applicable law.
Maximum Storage Duration: 399 daysType: HTTP Cookie
bm_szThis cookie is necessary in order to enable you to move around the website and use its features, such as setting your privacy preferences, logging in or filling in forms. Without this cookie, services requested through usage of our website cannot be properly provided. Necessary cookie does not require consent from the user under applicable law.
Maximum Storage Duration: 1 dayType: HTTP Cookie
common_language_childThis cookie is necessary in order to enable you to move around the website and use its features, such as setting your privacy preferences, logging in or filling in forms. Without this cookie, services requested through usage of our website cannot be properly provided. Necessary cookie does not require consent from the user under applicable law.
Maximum Storage Duration: SessionType: HTTP Cookie
JSESSIONIDPreserves users states across page requests.
Maximum Storage Duration: SessionType: HTTP Cookie
lnfeaThis cookie is necessary in order to enable you to move around the website and use its features, such as setting your privacy preferences, logging in or filling in forms. Without this cookie, services requested through usage of our website cannot be properly provided. Necessary cookie does not require consent from the user under applicable law.
Maximum Storage Duration: 400 daysType: HTTP Cookie
qrcodesettingIdThis cookie is necessary in order to enable you to move around the website and use its features, such as setting your privacy preferences, logging in or filling in forms. Without this cookie, services requested through usage of our website cannot be properly provided. Necessary cookie does not require consent from the user under applicable law.
Maximum Storage Duration: 399 daysType: HTTP Cookie
signinStatThis cookie is necessary in order to enable you to move around the website and use its features, such as setting your privacy preferences, logging in or filling in forms. Without this cookie, services requested through usage of our website cannot be properly provided. Necessary cookie does not require consent from the user under applicable law.
Maximum Storage Duration: 400 daysType: HTTP Cookie
visitorIdPreserves users states across page requests.
Maximum Storage Duration: 400 daysType: HTTP Cookie
-
s.go-mpulse.net
1
RTThis cookie is used to identify the visitor through an application. This allows the visitor to login to a website through their LinkedIn application for example.
Maximum Storage Duration: 7 daysType: HTTP Cookie
-
www.keyence.com
22
kpi_cart_modeThis cookie is necessary in order to enable you to move around the website and use its features, such as setting your privacy preferences, logging in or filling in forms. Without this cookie, services requested through usage of our website cannot be properly provided. Necessary cookie does not require consent from the user under applicable law.
Maximum Storage Duration: SessionType: HTTP Cookie
kpi_disconThis cookie is necessary in order to enable you to move around the website and use its features, such as setting your privacy preferences, logging in or filling in forms. Without this cookie, services requested through usage of our website cannot be properly provided. Necessary cookie does not require consent from the user under applicable law.
Maximum Storage Duration: SessionType: HTTP Cookie
kpi_download_agreementThis cookie is necessary in order to enable you to move around the website and use its features, such as setting your privacy preferences, logging in or filling in forms. Without this cookie, services requested through usage of our website cannot be properly provided. Necessary cookie does not require consent from the user under applicable law.
Maximum Storage Duration: SessionType: HTTP Cookie
kpi_has_addToListThis cookie is necessary in order to enable you to move around the website and use its features, such as setting your privacy preferences, logging in or filling in forms. Without this cookie, services requested through usage of our website cannot be properly provided. Necessary cookie does not require consent from the user under applicable law.
Maximum Storage Duration: SessionType: HTTP Cookie
_vwo_161387_configThis cookie is necessary in order to enable you to move around the website and use its features, such as setting your privacy preferences, logging in or filling in forms. Without this cookie, services requested through usage of our website cannot be properly provided. Necessary cookie does not require consent from the user under applicable law.
Maximum Storage Duration: PersistentType: HTML Local Storage
ApachePreserves the visitor's session state across page requests.
Maximum Storage Duration: 400 daysType: HTTP Cookie
cta_tcm:26-2086467_sessionThis cookie is necessary in order to enable you to move around the website and use its features, such as setting your privacy preferences, logging in or filling in forms. Without this cookie, services requested through usage of our website cannot be properly provided. Necessary cookie does not require consent from the user under applicable law.
Maximum Storage Duration: SessionType: HTTP Cookie
cta_tcm:26-2103006_sessionThis cookie is necessary in order to enable you to move around the website and use its features, such as setting your privacy preferences, logging in or filling in forms. Without this cookie, services requested through usage of our website cannot be properly provided. Necessary cookie does not require consent from the user under applicable law.
Maximum Storage Duration: SessionType: HTTP Cookie
cta_tcm:26-2146544_userThis cookie is necessary in order to enable you to move around the website and use its features, such as setting your privacy preferences, logging in or filling in forms. Without this cookie, services requested through usage of our website cannot be properly provided. Necessary cookie does not require consent from the user under applicable law.
Maximum Storage Duration: SessionType: HTTP Cookie
cta_tcm:26-2175295_sessionThis cookie is necessary in order to enable you to move around the website and use its features, such as setting your privacy preferences, logging in or filling in forms. Without this cookie, services requested through usage of our website cannot be properly provided. Necessary cookie does not require consent from the user under applicable law.
Maximum Storage Duration: SessionType: HTTP Cookie
cta_tcm:26-2272427_sessionThis cookie is necessary in order to enable you to move around the website and use its features, such as setting your privacy preferences, logging in or filling in forms. Without this cookie, services requested through usage of our website cannot be properly provided. Necessary cookie does not require consent from the user under applicable law.
Maximum Storage Duration: SessionType: HTTP Cookie
firebase-heartbeat-database#firebase-heartbeat-storeUsed in order to detect spam and improve the website's security.
Maximum Storage Duration: PersistentType: IndexedDB
items-selector_configuration-dataThis cookie is necessary in order to enable you to move around the website and use its features, such as setting your privacy preferences, logging in or filling in forms. Without this cookie, services requested through usage of our website cannot be properly provided. Necessary cookie does not require consent from the user under applicable law.
Maximum Storage Duration: SessionType: HTML Local Storage
items-selector_configuration-unitThis cookie is necessary in order to enable you to move around the website and use its features, such as setting your privacy preferences, logging in or filling in forms. Without this cookie, services requested through usage of our website cannot be properly provided. Necessary cookie does not require consent from the user under applicable law.
Maximum Storage Duration: SessionType: HTML Local Storage
items-selector_tokenThis cookie is necessary in order to enable you to move around the website and use its features, such as setting your privacy preferences, logging in or filling in forms. Without this cookie, services requested through usage of our website cannot be properly provided. Necessary cookie does not require consent from the user under applicable law.
Maximum Storage Duration: SessionType: HTML Local Storage
items-selector_zoom-cameras-criteriaThis cookie is necessary in order to enable you to move around the website and use its features, such as setting your privacy preferences, logging in or filling in forms. Without this cookie, services requested through usage of our website cannot be properly provided. Necessary cookie does not require consent from the user under applicable law.
Maximum Storage Duration: SessionType: HTML Local Storage
kpi_has_discontinued_comThis cookie is necessary in order to enable you to move around the website and use its features, such as setting your privacy preferences, logging in or filling in forms. Without this cookie, services requested through usage of our website cannot be properly provided. Necessary cookie does not require consent from the user under applicable law.
Maximum Storage Duration: 3 monthsType: HTTP Cookie
kpi_has_selectCategory_com_modelTypesThis cookie is necessary in order to enable you to move around the website and use its features, such as setting your privacy preferences, logging in or filling in forms. Without this cookie, services requested through usage of our website cannot be properly provided. Necessary cookie does not require consent from the user under applicable law.
Maximum Storage Duration: 3 monthsType: HTTP Cookie
kpi_has_selectLang_comThis cookie is necessary in order to enable you to move around the website and use its features, such as setting your privacy preferences, logging in or filling in forms. Without this cookie, services requested through usage of our website cannot be properly provided. Necessary cookie does not require consent from the user under applicable law.
Maximum Storage Duration: 3 monthsType: HTTP Cookie
kpi_has_selectLang_com_maThis cookie is necessary in order to enable you to move around the website and use its features, such as setting your privacy preferences, logging in or filling in forms. Without this cookie, services requested through usage of our website cannot be properly provided. Necessary cookie does not require consent from the user under applicable law.
Maximum Storage Duration: 3 monthsType: HTTP Cookie
suggestHigherSeriesCookieThis cookie is necessary in order to enable you to move around the website and use its features, such as setting your privacy preferences, logging in or filling in forms. Without this cookie, services requested through usage of our website cannot be properly provided. Necessary cookie does not require consent from the user under applicable law.
Maximum Storage Duration: SessionType: HTTP Cookie
what-intentDetermines the device used to access the website. This allows the website to be formatted accordingly.
Maximum Storage Duration: SessionType: HTML Local Storage
-
Preferences 4
Preference cookies enable a website to remember information that changes the way the website behaves or looks, like your preferred language or the region that you are in.
-
LinkedIn
1
Learn more about this provider
lidcRegisters which server-cluster is serving the visitor. This is used in context with load balancing, in order to optimize user experience.
Maximum Storage Duration: 1 dayType: HTTP Cookie
-
dtm00.deteql.net
2
deqwas_vcThis cookie allows the website to remember choices you make or information you enter (such as your username, language or the region you are in) and provide enhanced, more personal features. This is also used to enable requested functions such as playing videos.
Maximum Storage Duration: PersistentType: HTML Local Storage
deqwas_vcThis cookie allows the website to remember choices you make or information you enter (such as your username, language or the region you are in) and provide enhanced, more personal features. This is also used to enable requested functions such as playing videos.
Maximum Storage Duration: 1 yearType: HTTP Cookie
-
www.keyence.com
1
loglevel:userlikeUnique user ID that recognizes the user on returning visits.
Maximum Storage Duration: PersistentType: HTML Local Storage
-
Statistics 29
Statistic cookies help website owners to understand how visitors interact with websites by collecting and reporting information anonymously.
-
Google
2
Learn more about this provider
Some of the data collected by this provider is for the purposes of personalization and measuring advertising effectiveness. The provider may use the IP Addresses for ads measurement and ads personalization.
_gaRegisters a unique ID that is used to generate statistical data on how the visitor uses the website.
Maximum Storage Duration: 25 monthsType: HTTP Cookie
**_ga_#**Used by Google Analytics to collect data on the number of times a user has visited the website as well as dates for the first and most recent visit.
Maximum Storage Duration: 25 monthsType: HTTP Cookie
-
Microsoft
5
Learn more about this provider
c.gifCollects data on the user’s navigation and behavior on the website. This is used to compile statistical reports and heatmaps for the website owner.
Maximum Storage Duration: SessionType: Pixel Tracker
_clckCollects data on the user’s navigation and behavior on the website. This is used to compile statistical reports and heatmaps for the website owner.
Maximum Storage Duration: 1 yearType: HTTP Cookie
**_clsk [x2]**Registers statistical data on users' behaviour on the website. Used for internal analytics by the website operator.
Maximum Storage Duration: 1 dayType: HTTP Cookie
_cltkRegisters statistical data on users' behaviour on the website. Used for internal analytics by the website operator.
Maximum Storage Duration: SessionType: HTML Local Storage
-
User Insight
1
Learn more about this provider
APThis cookie collects information about how visitors use a website, for instance which pages visitors go to most often, and how visitors move around the site. They help us to improve the user friendliness of a website and therefore enhance the user’s experience.
Maximum Storage Duration: 400 daysType: HTTP Cookie
-
VWO
12
Learn more about this provider
_vis_opt_sUsed by Visual Website Optimizer to determine if the visitor is participating in a design experiment.
Maximum Storage Duration: 100 daysType: HTTP Cookie
_vis_opt_test_cookieUsed to check if the user's browser supports cookies.
Maximum Storage Duration: SessionType: HTTP Cookie
_vwo_dsCollects data on the user's visits to the website, such as the number of visits, average time spent on the website and what pages have been loaded with the purpose of generating reports for optimising the website content.
Maximum Storage Duration: 3 monthsType: HTTP Cookie
_vwo_referrerRegisters data on visitors' website-behaviour. This is used for internal analysis and website optimization.
Maximum Storage Duration: SessionType: HTTP Cookie
_vwo_snCollects statistics on the visitor's visits to the website, such as the number of visits, average time spent on the website and what pages have been read.
Maximum Storage Duration: 1 dayType: HTTP Cookie
_vwo_uuidUsed by Visual Website Optimizer to ensure that the same user interface variant is displayed for each visit, if the user is participating in a design experiment.
Maximum Storage Duration: 1 yearType: HTTP Cookie
_vwo_uuid_v2This cookie is set to make split-tests on the website, which optimizes the website's relevance towards the visitor – the cookie can also be set to improve the visitor's experience on a website.
Maximum Storage Duration: 1 yearType: HTTP Cookie
_vwo_dynThis cookie collects information about how visitors use a website, for instance which pages visitors go to most often, and how visitors move around the site. They help us to improve the user friendliness of a website and therefore enhance the user’s experience.
Maximum Storage Duration: PersistentType: HTML Local Storage
collect/v.gifPending
Maximum Storage Duration: SessionType: Pixel Tracker
e.gifUsed to distinguish between different users coming from the same IP-address.
Maximum Storage Duration: SessionType: Pixel Tracker
l.gifThis cookie is used by the website’s operator in context with multi-variate testing. This is a tool used to combine or change content on the website. This allows the website to find the best variation/edition of the site.
Maximum Storage Duration: SessionType: Pixel Tracker
vwoSnThis cookie is set to make split-tests on the website, which optimizes the website's relevance towards the visitor – the cookie can also be set to improve the visitor's experience on a website.
Maximum Storage Duration: PersistentType: HTML Local Storage
-
keyence.com
5
__ulfpcThis cookie collects information about how visitors use a website, for instance which pages visitors go to most often, and how visitors move around the site. They help us to improve the user friendliness of a website and therefore enhance the user’s experience.
Maximum Storage Duration: 399 daysType: HTTP Cookie
_ga_4VS2341H7GThis cookie collects information about how visitors use a website, for instance which pages visitors go to most often, and how visitors move around the site. They help us to improve the user friendliness of a website and therefore enhance the user’s experience.
Maximum Storage Duration: 399 daysType: HTTP Cookie
_gatUsed by Google Analytics to throttle request rate
Maximum Storage Duration: 5 daysType: HTTP Cookie
_gat_UA-55801687-1This cookie collects information about how visitors use a website, for instance which pages visitors go to most often, and how visitors move around the site. They help us to improve the user friendliness of a website and therefore enhance the user’s experience.
Maximum Storage Duration: SessionType: HTTP Cookie
_vis_opt_exp_#_combiUsed by Visual Website Optimizer to ensure that the same user interface variant is displayed for each visit, if the user is participating in a design experiment.
Maximum Storage Duration: 100 daysType: HTTP Cookie
-
searchable-tracker.searchable.workers.dev
3
sa_idThis cookie collects information about how visitors use a website, for instance which pages visitors go to most often, and how visitors move around the site. They help us to improve the user friendliness of a website and therefore enhance the user’s experience.
Maximum Storage Duration: PersistentType: HTML Local Storage
sa_sessionThis cookie collects information about how visitors use a website, for instance which pages visitors go to most often, and how visitors move around the site. They help us to improve the user friendliness of a website and therefore enhance the user’s experience.
Maximum Storage Duration: SessionType: HTML Local Storage
_sa_idThis cookie collects information about how visitors use a website, for instance which pages visitors go to most often, and how visitors move around the site. They help us to improve the user friendliness of a website and therefore enhance the user’s experience.
Maximum Storage Duration: SessionType: HTTP Cookie
-
www.keyence.com
1
vwo_apm_sentThis cookie collects information about how visitors use a website, for instance which pages visitors go to most often, and how visitors move around the site. They help us to improve the user friendliness of a website and therefore enhance the user’s experience.
Maximum Storage Duration: PersistentType: HTML Local Storage
-
Marketing 35
Marketing cookies are used to track visitors across websites. The intention is to display ads that are relevant and engaging for the individual user and thereby more valuable for publishers and third party advertisers.
-
Meta Platforms, Inc.
3
Learn more about this provider
lastExternalReferrerThis cookie is used to deliver adverts on third party websites more relevant to you and your interests. This is also used to limit the number of times you see an advertisement as well as help measure the effectiveness of an advertising campaign.
Maximum Storage Duration: PersistentType: HTML Local Storage
lastExternalReferrerTimeThis cookie is used to deliver adverts on third party websites more relevant to you and your interests. This is also used to limit the number of times you see an advertisement as well as help measure the effectiveness of an advertising campaign.
Maximum Storage Duration: PersistentType: HTML Local Storage
_fbpUsed by Facebook to deliver a series of advertisement products such as real time bidding from third party advertisers.
Maximum Storage Duration: 3 monthsType: HTTP Cookie
-
Brightcove
1
Learn more about this provider
v2/trackerUsed in context with video-advertisement. The cookie limits the number of times a user is shown the same advertisement. The cookie is also used to ensure relevance of the video-advertisement to the specific user.
Maximum Storage Duration: SessionType: Pixel Tracker
-
Google
9
Learn more about this provider
Some of the data collected by this provider is for the purposes of personalization and measuring advertising effectiveness. The provider may use the IP Addresses for ads measurement and ads personalization.
IDEUsed by Google DoubleClick to register and report the website user's actions after viewing or clicking one of the advertiser's ads with the purpose of measuring the efficacy of an ad and to present targeted ads to the user.
Maximum Storage Duration: 400 daysType: HTTP Cookie
test_cookieUsed to check if the user's browser supports cookies.
Maximum Storage Duration: 1 dayType: HTTP Cookie
**pagead/1p-user-list/#**Tracks if the user has shown interest in specific products or events across multiple websites and detects how the user navigates between sites. This is used for measurement of advertisement efforts and facilitates payment of referral-fees between websites.
Maximum Storage Duration: SessionType: Pixel Tracker
rc::eThis cookie is used to distinguish between humans and bots.
Maximum Storage Duration: SessionType: HTML Local Storage
rc::hThis cookie is used to distinguish between humans and bots.
Maximum Storage Duration: PersistentType: HTML Local Storage
pagead/gen_204Collects data on visitor behaviour from multiple websites, in order to present more relevant advertisement - This also allows the website to limit the number of times that they are shown the same advertisement.
Maximum Storage Duration: SessionType: Pixel Tracker
pagead/pingPending
Maximum Storage Duration: SessionType: Pixel Tracker
_gcl_auUsed by Google AdSense for experimenting with advertisement efficiency across websites using their services.
Maximum Storage Duration: 3 monthsType: HTTP Cookie
_gcl_lsThis cookie is used to deliver adverts on third party websites more relevant to you and your interests. This is also used to limit the number of times you see an advertisement as well as help measure the effectiveness of an advertising campaign.
Maximum Storage Duration: PersistentType: HTML Local Storage
-
LinkedIn
2
Learn more about this provider
bcookieUsed by the social networking service, LinkedIn, for tracking the use of embedded services.
Maximum Storage Duration: 1 yearType: HTTP Cookie
li_gcStores the user's cookie consent state for the current domain
Maximum Storage Duration: 180 daysType: HTTP Cookie
-
Microsoft
13
Learn more about this provider
_uetsidUsed to track visitors on multiple websites, in order to present relevant advertisement based on the visitor's preferences.
Maximum Storage Duration: PersistentType: HTML Local Storage
_uetsid_expContains the expiry-date for the cookie with corresponding name.
Maximum Storage Duration: PersistentType: HTML Local Storage
_uetvidUsed to track visitors on multiple websites, in order to present relevant advertisement based on the visitor's preferences.
Maximum Storage Duration: PersistentType: HTML Local Storage
_uetvid_expContains the expiry-date for the cookie with corresponding name.
Maximum Storage Duration: PersistentType: HTML Local Storage
**MR [x2]**Used to track visitors on multiple websites, in order to present relevant advertisement based on the visitor's preferences.
Maximum Storage Duration: 7 daysType: HTTP Cookie
**MUID [x2]**Used widely by Microsoft as a unique user ID. The cookie enables user tracking by synchronising the ID across many Microsoft domains.
Maximum Storage Duration: 1 yearType: HTTP Cookie
SRM_BTracks the user’s interaction with the website’s search-bar-function. This data can be used to present the user with relevant products or services.
Maximum Storage Duration: 1 yearType: HTTP Cookie
ANONCHKRegisters data on visitors from multiple visits and on multiple websites. This information is used to measure the efficiency of advertisement on websites.
Maximum Storage Duration: 1 dayType: HTTP Cookie
SMRegisters a unique ID that identifies the user's device during return visits across websites that use the same ad network. The ID is used to allow targeted ads.
Maximum Storage Duration: SessionType: HTTP Cookie
_uetsidCollects data on visitor behaviour from multiple websites, in order to present more relevant advertisement - This also allows the website to limit the number of times that they are shown the same advertisement.
Maximum Storage Duration: 1 dayType: HTTP Cookie
_uetvidUsed to track visitors on multiple websites, in order to present relevant advertisement based on the visitor's preferences.
Maximum Storage Duration: 1 yearType: HTTP Cookie
-
OpenAI
3
Learn more about this provider
**oaiq_cs:#**Tracks the conversion rate between the user and the advertisement banners on the website - This serves to optimise the relevance of the advertisements on the website.
Maximum Storage Duration: SessionType: HTML Local Storage
__oaiq_domain_probeThis cookie is used to deliver adverts on third party websites more relevant to you and your interests. This is also used to limit the number of times you see an advertisement as well as help measure the effectiveness of an advertising campaign.
Maximum Storage Duration: SessionType: HTTP Cookie
__obrefThis cookie is used to deliver adverts on third party websites more relevant to you and your interests. This is also used to limit the number of times you see an advertisement as well as help measure the effectiveness of an advertising campaign.
Maximum Storage Duration: SessionType: HTTP Cookie
-
Reddit
3
Learn more about this provider
**_rdt_uuid [x2]**Used to track visitors on multiple websites, in order to present relevant advertisement based on the visitor's preferences.
Maximum Storage Duration: 3 monthsType: HTTP Cookie
_rdt_cfgThis cookie is used to deliver adverts on third party websites more relevant to you and your interests. This is also used to limit the number of times you see an advertisement as well as help measure the effectiveness of an advertising campaign.
Maximum Storage Duration: SessionType: HTML Local Storage
-
s.go-mpulse.net
1
_boomr_akamaiXhrRetryCollects information on user preferences and/or interaction with web-campaign content - This is used on CRM-campaign-platform used by website owners for promoting events or products.
Maximum Storage Duration: PersistentType: HTML Local Storage
-
Unclassified 0
Unclassified cookies are cookies that we are in the process of classifying, together with the providers of individual cookies.
- We do not use cookies of this type.
Cross-domain consent[#BULK_CONSENT_DOMAINS_COUNT#]
[#BULK_CONSENT_TITLE#]
List of domains your consent applies to: [#BULK_CONSENT_DOMAINS#]
Cookie declaration last updated on 10/27/26 by Cookiebot
[#IABV2_TITLE#]
[#IABV2_BODY_INTRO#]
[#IABV2_BODY_LEGITIMATE_INTEREST_INTRO#]
[#IABV2_BODY_PREFERENCE_INTRO#]
[#IABV2_LABEL_PURPOSES#]
[#IABV2_BODY_PURPOSES_INTRO#]
[#IABV2_BODY_PURPOSES#]
[#IABV2_LABEL_FEATURES#]
[#IABV2_BODY_FEATURES_INTRO#]
[#IABV2_BODY_FEATURES#]
[#IABV2_LABEL_PARTNERS#]
[#IABV2_BODY_PARTNERS_INTRO#]
[#IABV2_BODY_PARTNERS#]
About
A cookie is a small piece of data (text file) that a website – when visited by a user – asks your browser to store on your device in order to remember information about you, such as your language preference or login information. Those cookies are set by us and called first-party cookies. We also use third-party cookies – which are cookies from a domain different than the domain of the website you are visiting – for our advertising and marketing efforts.
Do not sell or share my personal information
Deny Allow selection Customize
Allow all

1-888-539-3623
Introducing the New Standard of Pneumatic Control NEW Linear Cylinder Sensor & Smart Valve CS/SP Series
CS/SP Series Selection Tool
---------------------------
Use KEYENCE’s simple selection website with guided instructions to select the components required.
More Details
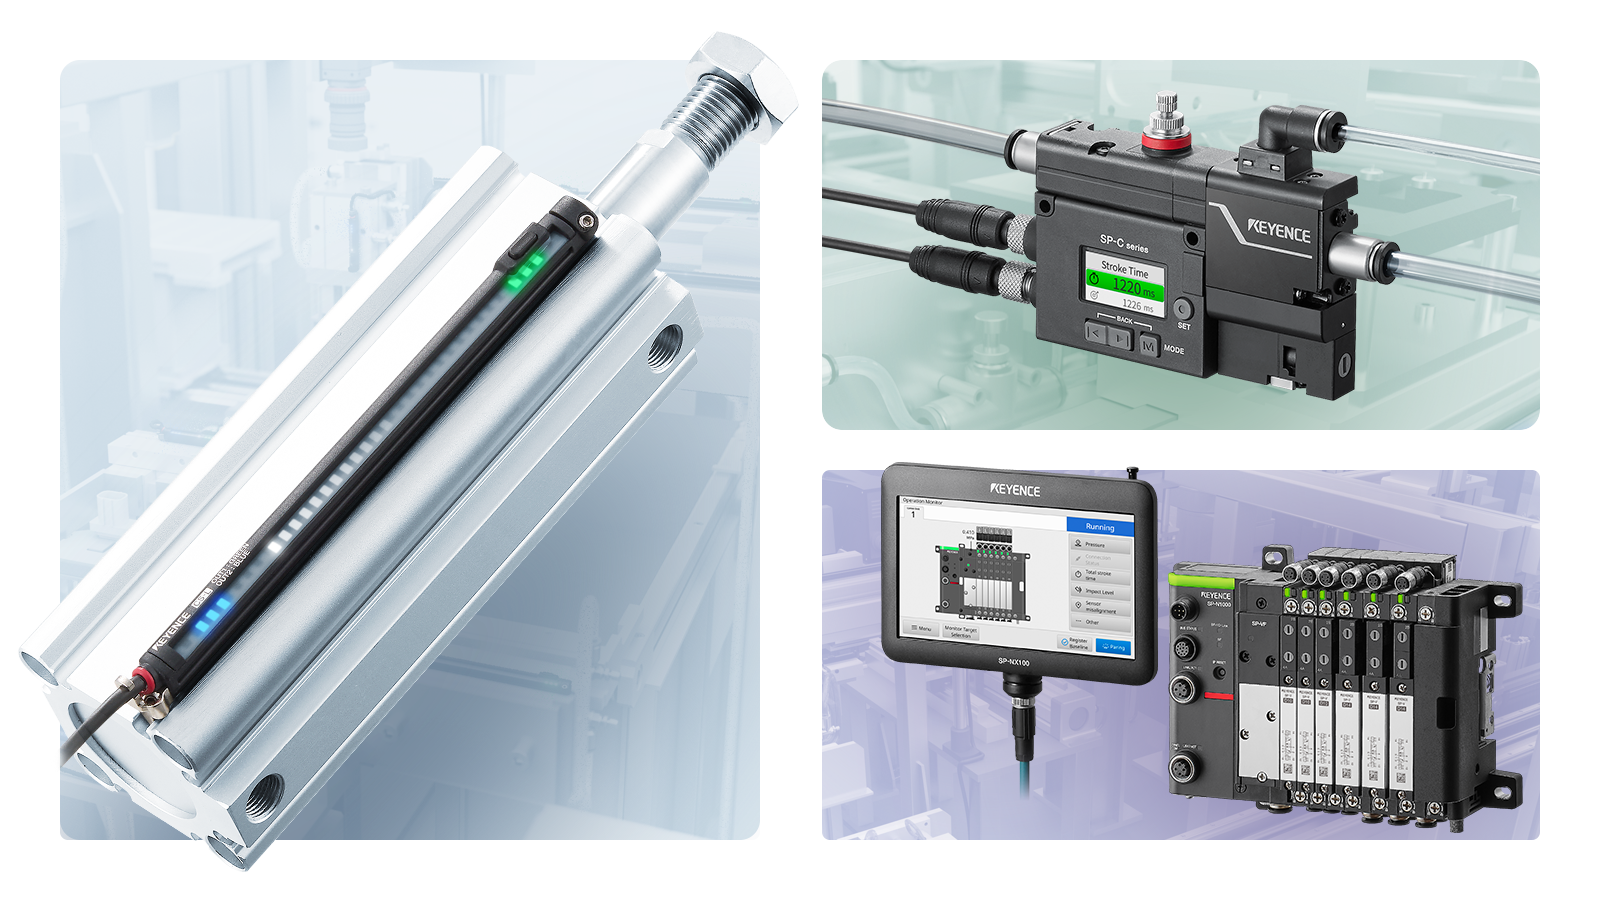
New Pneumatic Control Achieved with Linear Cylinder Sensors
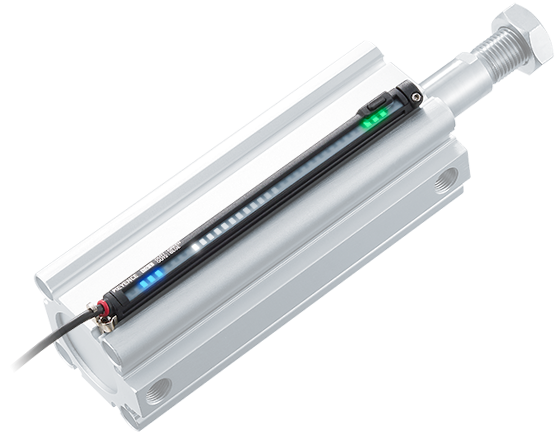
Pneumatic Cylinder Sensor with Visible Indication and Easy Installation Linear Cylinder Sensor CS-L

Video Player is loading.
Play Video
PlaySkip BackwardSkip Forward
Mute
Current Time 0:00
/
Duration 0:00
Loaded: 0%
0:00
Stream Type LIVE
Seek to live, currently behind liveLIVE
Remaining Time -0:00
1x
Playback Rate
- 2x
- 1.75x
- 1.5x
- 1.25x
- 1x, selected
- 0.75x
- 0.5x
Chapters
AD Audio Descriptions
Captions
- captions settings, opens captions settings dialog
- captions off, selected
Audio Track
Quality Levels
Picture-in-PictureFullscreen
This is a modal window.
Beginning of dialog window. Escape will cancel and close the window.
TextColorWhiteBlackRedGreenBlueYellowMagentaCyanOpacityOpaqueSemi-Transparent
Text BackgroundColorBlackWhiteRedGreenBlueYellowMagentaCyanOpacityOpaqueSemi-TransparentTransparent
Caption Area BackgroundColorBlackWhiteRedGreenBlueYellowMagentaCyanOpacityTransparentSemi-TransparentOpaque
Font Size50%75%100%125%150%175%200%300%400%
Text Edge StyleNoneRaisedDepressedUniformDrop shadow
Font FamilyProportional Sans-SerifMonospace Sans-SerifProportional SerifMonospace SerifCasualScriptSmall Caps
ResetDone
Close Modal Dialog
End of dialog window.
Close Modal Dialog
This is a modal window. This modal can be closed by pressing the Escape key or activating the close button.
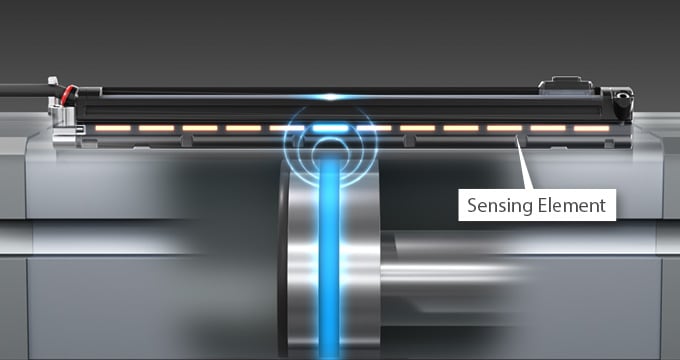
Live Piston Position Visibility
A large indicator light runs the full length of the sensor, delivering instant, real-time visibility of piston position for faster setup and simplified troubleshooting.
Easy Setup with 2-Point Teach
Unlike traditional cylinder sensors, no tedious alignment adjustments are required to ensure an output from the cylinder. Simply press the button to create a set point at the desired location of the stroke. Easily lock the settings into place to avoid unwanted changes after set up.
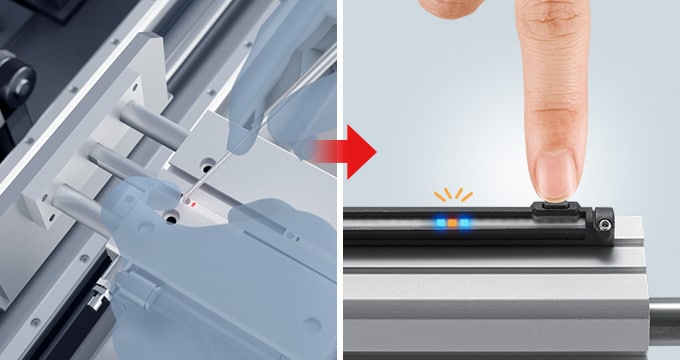
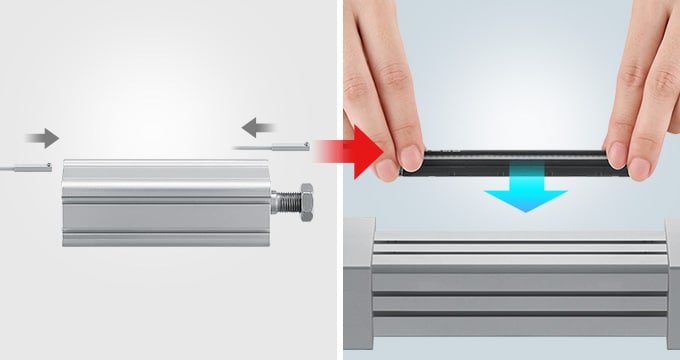
Install Without Cylinder Removal
Utilizing top-down installation, the CS can be installed without taking a cylinder off the machine. Simply press into the slot and tighten down.
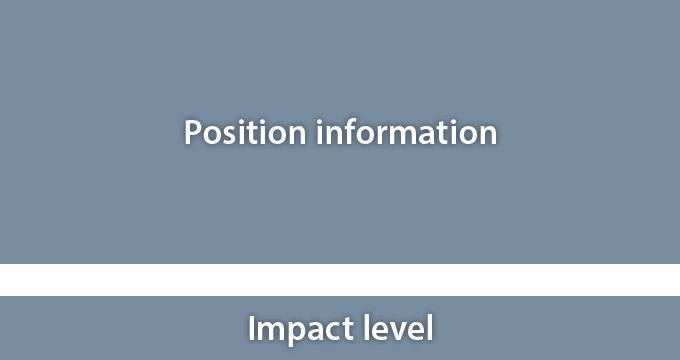
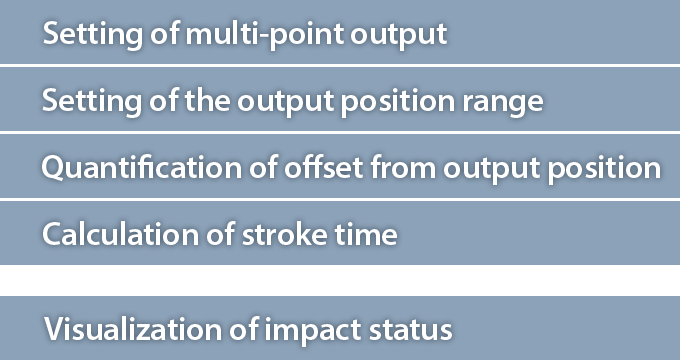
Indicates Cylinder Performance
Cylinder sensors can output the position information of the piston and the impact level, providing benefits in a wide variety of situations such as the calculation of cylinder stroke time and the early detection of device problems.
Only the PNP M8 connector type can be used.
Output information
Application
3 Critical Positions, All-in-One Sensor Linear Cylinder Sensor for Grippers CS-LG

3 Output Positions Regardless of Gripper Size
This sensor provides linear position sensing with an impressive 0.01mm 0.0004″ resolution, continuously monitoring piston movement with exceptional accuracy. Even within the gripper’s short stroke, the sensor reliably distinguishes between the three critical positions: Opened, Gripped, and Closed. With a single sensor, the system can detect a variety of mis-grip conditions, including missing, misplaced, or improperly handled workpieces, helping improve process reliability, reduce downtime, and enhance overall production quality.

Reduced Wiring
The CS-LG provides an output for each cylinder position with only one cable. This reduces the necessary cables by at least half, and cuts down on set-up time, parts required, and overall installation.

Top-Down Installation with Flush Mounting
Installing the CL-LG on the gripper is done from above. The small body of the sensor allows it to fit within the groove of the cylinder for a flush mount. The screw that locks the sensor into place features a metal design; durable even when strongly tightened down.

Easy Set-Up with Amplifier
After installing, setting the output locations for the CS-LG is simple and done in one of two ways; either through the amplifier or the SP Navigator software.
High-functionality amplifier display

SP Navigator display

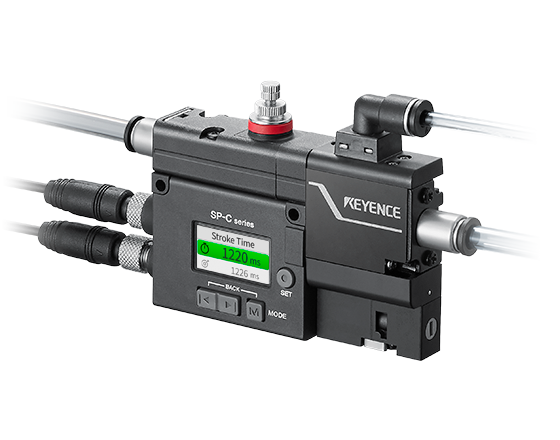
Increase Cylinder Speed Without Destructive Impact Smart Cushion Valve SP-C

Video Player is loading.
Play Video
PlaySkip BackwardSkip Forward
Mute
Current Time 0:00
/
Duration 0:00
Loaded: 0%
0:00
Stream Type LIVE
Seek to live, currently behind liveLIVE
Remaining Time -0:00
1x
Playback Rate
- 2x
- 1.75x
- 1.5x
- 1.25x
- 1x, selected
- 0.75x
- 0.5x
Chapters
AD Audio Descriptions
Captions
- captions settings, opens captions settings dialog
- captions off, selected
Audio Track
Quality Levels
Picture-in-PictureFullscreen
This is a modal window.
Beginning of dialog window. Escape will cancel and close the window.
TextColorWhiteBlackRedGreenBlueYellowMagentaCyanOpacityOpaqueSemi-Transparent
Text BackgroundColorBlackWhiteRedGreenBlueYellowMagentaCyanOpacityOpaqueSemi-TransparentTransparent
Caption Area BackgroundColorBlackWhiteRedGreenBlueYellowMagentaCyanOpacityTransparentSemi-TransparentOpaque
Font Size50%75%100%125%150%175%200%300%400%
Text Edge StyleNoneRaisedDepressedUniformDrop shadow
Font FamilyProportional Sans-SerifMonospace Sans-SerifProportional SerifMonospace SerifCasualScriptSmall Caps
ResetDone
Close Modal Dialog
End of dialog window.
Close Modal Dialog
This is a modal window. This modal can be closed by pressing the Escape key or activating the close button.
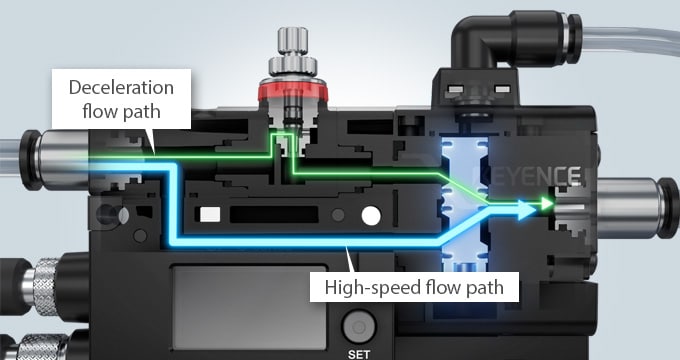
Reduces Impact by Switching Between High-Speed and Deceleration Flow Paths
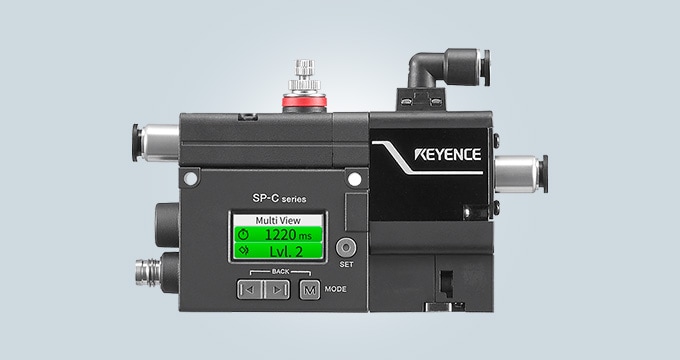
The valve has two internal flow paths. Using piston position from the CS Linear Cylinder Sensor, it automatically switches between the high-speed flow path and deceleration flow path. This allows the cylinder to slow down just before impact, providing stable shock absorption without mechanical wear and tear.
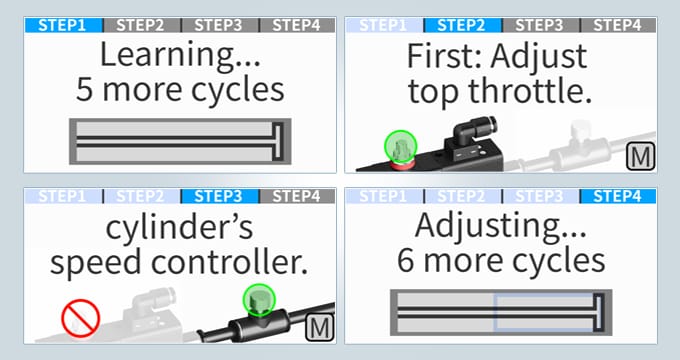
Simple 4-Step Set Up
Equipped with onboard configuration, set-up is easily done with a 4-step process on the display of the SP-C. No external license or software is required.
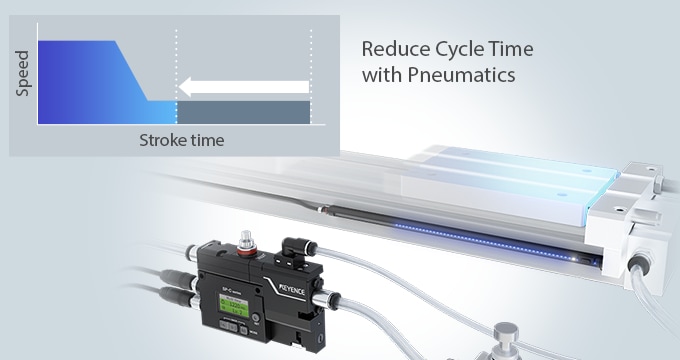
Reduce Cycle Time with Pneumatics
Increase the speed at which the cylinder operates to shave off cycle time without concern of damage to the machine, cylinder or product. Adjustable thresholds for deceleration allows for complete control.
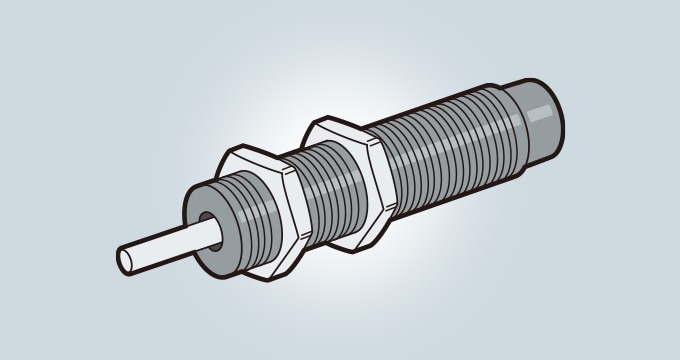
Long Term Durability
Shock absorbers are commonly used and are easily damaged and broken over time with wear and tear. Utilizing air cushioning, no parts or hardware are required to take the brunt of the force.
Method for direct shock absorption
Air cushion method
Design and Install Valve Manifold with Unmatched Flexibility Smart Valve Manifold SP-N/V

Video Player is loading.
Play Video
PlaySkip BackwardSkip Forward
Mute
Current Time 0:00
/
Duration 0:00
Loaded: 0%
0:00
Stream Type LIVE
Seek to live, currently behind liveLIVE
Remaining Time -0:00
1x
Playback Rate
- 2x
- 1.75x
- 1.5x
- 1.25x
- 1x, selected
- 0.75x
- 0.5x
Chapters
AD Audio Descriptions
Captions
- captions settings, opens captions settings dialog
- captions off, selected
Audio Track
Quality Levels
Picture-in-PictureFullscreen
This is a modal window.
Beginning of dialog window. Escape will cancel and close the window.
TextColorWhiteBlackRedGreenBlueYellowMagentaCyanOpacityOpaqueSemi-Transparent
Text BackgroundColorBlackWhiteRedGreenBlueYellowMagentaCyanOpacityOpaqueSemi-TransparentTransparent
Caption Area BackgroundColorBlackWhiteRedGreenBlueYellowMagentaCyanOpacityTransparentSemi-TransparentOpaque
Font Size50%75%100%125%150%175%200%300%400%
Text Edge StyleNoneRaisedDepressedUniformDrop shadow
Font FamilyProportional Sans-SerifMonospace Sans-SerifProportional SerifMonospace SerifCasualScriptSmall Caps
ResetDone
Close Modal Dialog
End of dialog window.
Close Modal Dialog
This is a modal window. This modal can be closed by pressing the Escape key or activating the close button.
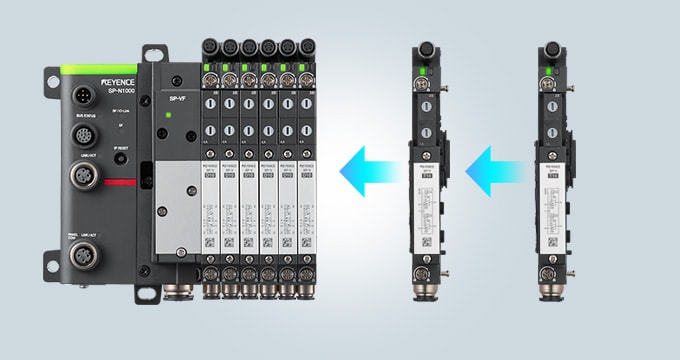
Fully Customizable Valve Manifolds
Select valve units without restrictions on type or size.
Easily add or remove valves at any time, regardless of your initial configuration.
Complete Pneumatic System Status Monitoring
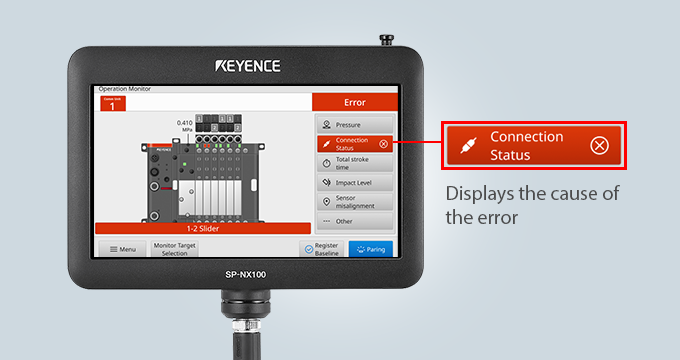
This series includes pre-programmed software for full pneumatic monitoring and control. Using the web server or control panel, remotely track operating conditions, check cylinder strokes, configure sensor outputs, receive detailed diagnostics on errors, access predictive maintenance alerts, and more.
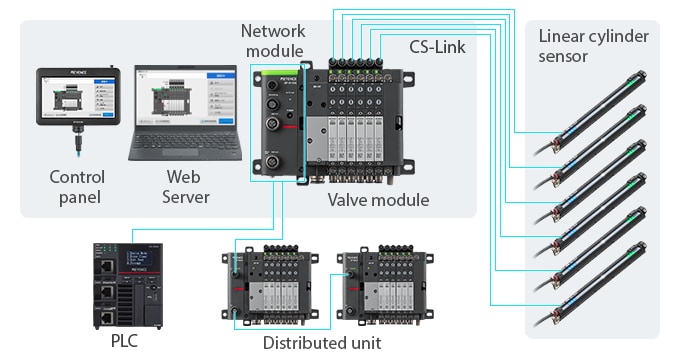
Reduce and Simplify Pneumatic Wiring
Wiring pneumatic cylinder sensors has never been simpler with the design of the SP-V valve. Each valve is equipped with a dedicated M8 QD connector to seamlessly integrate cylinder sensors that are installed on the machine. The dedicated connector removes the need for external IO blocks or additional wiring in the PLC. All outputs and data from the sensor will be taken back with the SP-N communication unit to decrease time on programming.

Reduce Downtime by Quickly Identifying the Cause of Problem
Understand at a glance the root cause of errors to eliminate the time spent troubleshooting with full pneumatic status control. Easily identify exactly where the error is occurring.
Learn more in the catalog
1-888-539-3623

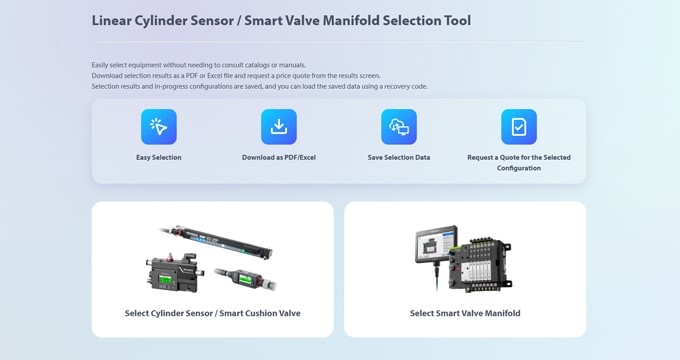
Use KEYENCE’s simple selection website with guided instructions to select the components required.
- Easily determine components needed based on application specifics
- Batch downloading of CAD files for selected models
- Downloadable item lists and configuration drawings
- Save selected items for future needs

tcm:26-2296263-64