===================================================================================================================================================== 日本語 中文 Global Network Reliability testing information site Test Navi Close TOP News Products…

=====================================================================================================================================================


Close


ESG Data
Environmental
■Greenhouse Gas Emissions
Greenhouse Gas Emissions Report (Independent Third Party Assurance Report)
Please scroll horizontally to look at table below.
|
|
|
|
|
|
|
|
|
|
Scope |
Unit |
2022/3 |
2023/3 |
2024/3*2 |
2025/3 |
| SCOPE 1*1 |
|
Consolidated |
t-CO2e |
3,293 |
3,576 |
3,622 |
3,768 |
| SCOPE 2 |
Market-based*1 |
t-CO2e |
4,248 |
3,717 |
4,285 |
5,563 |
5,855 |
| Location-based*1 |
t-CO2e |
11,895 |
11,541 |
13,138 |
14,351 |
15,099 |
|
| SCOPE 3 |
1 Purchased goods and services*1 |
t-CO2e |
71,871 |
107,925 |
117,497 |
103,340 |
104,222 |
| 2 Capital goods |
t-CO2e |
2,183 |
3,173 |
4,813 |
7,962 |
4,499 |
|
| 3 Fuel- and energy-related activities (not included in SCOPE 1 or 2) |
t-CO2e |
2,126 |
2,058 |
2,211 |
2,408 |
2,686 |
|
| 4 Upstream transportation and distribution |
t-CO2e |
395 |
506 |
461 |
1,964 |
2,442 |
|
| 5 Waste generated in operations |
t-CO2e |
28 |
22 |
151 |
369 |
286 |
|
| 6 Business travel |
t-CO2e |
255 |
609 |
626 |
948 |
1,344 |
|
| 7 Employee commuting |
t-CO2e |
1,459 |
1,518 |
1,563 |
1,898 |
1,909 |
|
| 8 Upstream leased assets |
t-CO2e |
- |
- |
- |
- |
- |
|
| 9 Downstream transportation and distribution |
t-CO2e |
450 |
537 |
552 |
503 |
500 |
|
| 10 Processing of sold products |
t-CO2e |
- |
- |
- |
- |
- |
|
| 11 Use of sold products*1 |
t-CO2e |
763,645 |
943,317 |
881,030 |
1,118,220 |
1,112,914 |
|
| 12 End-of-life treatment of sold products*1 |
t-CO2e |
33,448 |
31,947 |
31,520 |
45,490 |
42,743 |
|
| 13 Downstream leased assets |
t-CO2e |
- |
- |
- |
- |
- |
|
| 14 Franchises |
t-CO2e |
- |
- |
- |
- |
- |
|
| 15 Investments |
t-CO2e |
- |
- |
- |
- |
- |
|
| SCOPE 3 total |
t-CO2e |
875,859 |
1,091,612 |
1,040,425 |
1,283,101 |
1,273,544 |
|
| SCOPE 1, 2, 3 total*3 |
|
t-CO2e |
883,400 |
1,098,905 |
1,048,332 |
1,292,432 |
1,282,803 |
- *1 Figures are based on an independent third-party assurance report.
- *2 For the fiscal year ended March 2024, COSMOPIA HIGHTECH CORP.,is excluded.
- *3 SCOPE 2 utilizes a market-based approach.
■Energy Consumption
Please scroll horizontally to look at table below.
|
|
|
|
|
|
|
|
|
|
Scope |
Unit |
2022/3 |
2023/3 |
2024/3*1 |
2025/3 |
| Gasoline |
|
Consolidated |
kℓ |
528 |
555 |
540 |
555 |
| Kerosene |
|
kℓ |
- |
0 |
0 |
0 |
0 |
| Diesel fuel |
|
kℓ |
7 |
7 |
6 |
19 |
23 |
| LPG |
|
t |
0 |
0 |
0 |
3 |
6 |
| City gas |
|
1,000N㎥ |
110 |
90 |
73 |
74 |
92 |
| Natural gas |
|
1,000N㎥ |
163 |
167 |
147 |
252 |
278 |
| Electricity |
|
1,000kWh |
25,414 |
24,913 |
27,987 |
30,733 |
32,231 |
|
Renewable energy usage*2 |
1,000kWh |
17,717 |
18,124 |
20,266 |
20,724 |
21,551 |
| (self-generated electricity (solar)) |
1,000kWh |
80 |
89 |
54 |
58 |
21 |
|
- *1 For the fiscal year ended March 2024, COSMOPIA HIGHTECH CORP.,is excluded.
- *2 Renewable energy consumption includes in-house solar power generation, renewable electricity menu options, and certificates. Renewable energy certificates were accounted for through the fiscal year ended March 2025, while non-fossil certificates were accounted for in the fiscal year ended March 2026.
■Water Withdrawal and Water Emissions
Please scroll horizontally to look at table below.
|
Scope |
Unit |
2022/3 |
2023/3 |
2024/3* |
2025/3 |
2026/3 |
| Water withdrawal |
Consolidated |
1,000㎥ |
77 |
92 |
99 |
129 |
109 |
| Water emissions |
1,000㎥ |
73 |
89 |
99 |
118 |
101 |
|
- * For the fiscal year ended March 2024, COSMOPIA HIGHTECH CORP.,is excluded.
■Total Amount of Emissions
Please scroll horizontally to look at table below.
|
Scope |
Unit |
2022/3 |
2023/3 |
2024/3 |
2025/3 |
2026/3 |
| Total amount of waste and recycled materials |
Consolidated |
t |
1,701 |
1,207 |
1,282 |
1,185 |
1,159 |
| Waste disposed |
t |
840 |
542 |
479 |
467 |
389 |
|
| Recycled materials |
t |
861 |
664 |
803 |
718 |
769 |
|
- * For each fiscal year, ESPEC ENVIRONMENTAL EQUIPMENT (SHANGHAI) CO., LTD., a sales subsidiary, is excluded.
For the fiscal year ended March 31, 2022, SHANGHAI ESPEC ENVIRONMENTAL EQUIPMENT CORP., ESPEC KOREA CORP., and ESPEC ENGINEERING (THAILAND) CO., LTD. are excluded.
For the fiscal year ended March 31, 2023, SHANGHAI ESPEC ENVIRONMENTAL EQUIPMENT CORP. is excluded.
For the fiscal year ended March 2024, COSMOPIA HIGHTECH CORP.,is excluded.
■Fluorocarbon Recovery
Please scroll horizontally to look at table below.
|
Scope |
Unit |
2022/3 |
2023/3 |
2024/3 |
2025/3 |
2026/3 |
| Amount of Fluorocarbon Recovered |
Non-consolidated |
kg |
3,208 |
3,695 |
3,471 |
3,115 |
3,200 |
■Product Recycling Service*
Please scroll horizontally to look at table below.
| | | Scope | Unit | 2022/3 | 2023/3 | 2024/3 | 2025/3 | 2026/3 |
| --- | --- | --- | --- | --- | --- | --- | --- |
| Number of products recycled | | Non-consolidated | units | 431 | 473 | 482 | 489 | 433 |
- * We have been certified under the Ministry of the Environment's Wide-Area Certification System, and we collect our used environmental testing equipment for a fee and recycle it.
■Environmental Data
Please scroll horizontally to look at table below.
|
|
Scope |
Unit |
2022/3 |
2023/3 |
2024/3 |
2025/3 |
2026/3 |
| Number of company cars |
|
Domestic consolidated companies |
units |
251 |
251 |
254 |
256 |
263 |
|
(Number of eco-friendly cars) |
Domestic consolidated companies |
units |
87 |
94 |
95 |
96 |
91 |
| Office Paper Usage |
|
Domestic consolidated companies |
thousand sheets |
488 |
505 |
472 |
441 |
443 |
| Number of participants in ESPEC Green Schools |
|
Non-consolidated |
Persons |
88 |
229 |
225 |
125 |
57 |
| Number of seedlings provided for green curtains |
|
Non-consolidated |
Seedlings |
6,405 |
4,299 |
3,840 |
4,618 |
4,412 |
| Eco Test Pass Rate of Managers*1 |
|
Non-consolidated |
% |
100 |
100 |
100 |
100 |
99 |
| Eco Test Pass Rate of Staff*1 |
|
Non-consolidated |
% |
83 |
84 |
81 |
82 |
78 |
| ESPEC Foundation for Global Environment Research and Technology Cumulative grant amount |
|
Non-consolidated |
10 thousand yen |
14,741 |
15,641 |
16,491 |
17,391 |
18,291 |
|
Grants amount |
Non-consolidated |
10 thousand yen |
900 |
900 |
850 |
900 |
900 |
| Number of Grants |
Non-consolidated |
Cases |
18 |
18 |
18 |
17 |
17 |
|
| Number of trees planted through environmental preservation business |
|
ESPEC MIC CORP. |
Trees |
53,132 |
80,650 |
60,314 |
39,593 |
45,833 |
- *1 The Certification Test for Environmental Specialists (Eco Test), a certification test administered by the Tokyo Chamber of Commerce and Industry.
FY 2025 PRTR results
Calculation range: ESPEC CORP., ESPEC ASSIST CORP., ESPEC MIC CORP.,and ESPEC THERMAL TECH SYSTEM CORP.
Please scroll horizontally to look at table below.
(Units: kg)
| | Name of Class 1 chemical substance | | Ethyl Benzene | Xylene | Acephate | Toluene | Hexane | Benzene | Tritolyl Phosphate | Glyphosate and its ammonium, isopropylamine, potassium and sodium salt | Cyclo Hexane | Trimethyl benzene | Heptane | Methyl isobutyl ketone |
| --- | --- | --- | --- | --- | --- | --- | --- | --- | --- | --- | --- | --- | --- |
| | Number of Class 1 chemical substance | | 53 | 80 | 212 | 300 | 392 | 400 | 460 | 605 | 629 | 691 | 731 | 737 |
| | Amount handled annually | | 4.3 | 10.6 | 1.7 | 48.6 | 11.0 | 1.1 | 3.8 | 2.3 | 22.4 | 7.0 | 2.5 | 1.1 |
| Contained in product (Voluntary measurement item) | | - | - | - | - | - | - | 3.8 | - | - | - | - | - |
| Amount recycled (sold) (voluntary measurement item) | | - | - | - | - | - | - | - | - | - | - | - | - |
| Amounts released | (A) Amount released into atmosphere annually | 4.3 | 10.6 | - | 48.6 | 11.0 | 1.1 | - | - | 22.4 | 7.0 | 2.5 | 1.1 |
| (B) Amount released into public waters annually | - | - | - | - | - | - | - | - | - | - | - | - |
| (C) Amount released into soil at the business sites other than (D) | - | - | 1.7 | - | - | - | - | 2.3 | - | - | - | - |
| (D) Amount disposed of in landfill at the business sites | - | - | - | - | - | - | - | - | - | - | - | - |
| Amounts transferred | (A) Transferred to sewage | - | - | - | - | - | - | - | - | - | - | - | - |
| (B) Other than (A) transferred to outside business sites | - | - | - | - | - | - | - | - | - | - | - | - |
* Of the Class 1 Designated Chemical Substances, those that have been confirmed to be handled in quantiti es of 1 kg or more per year are listed above.
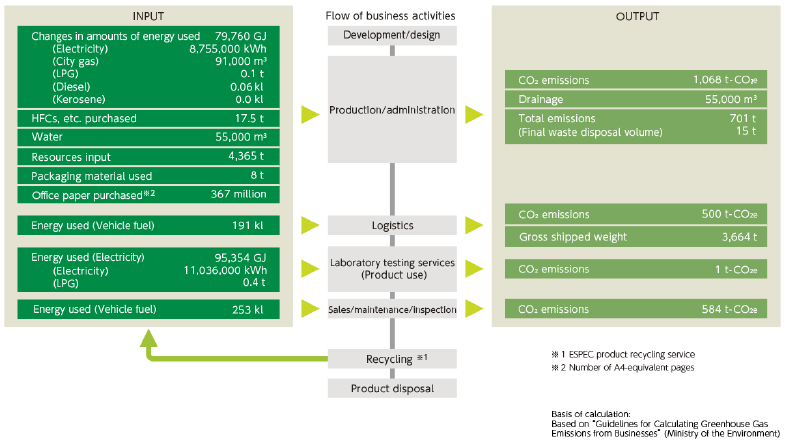
FY 2025 Business Activities Material Balance
Social
■Number of Employees*
Please scroll horizontally to look at table below.
|
|
Unit |
2020/3 |
2021/3 |
2022/3 |
2023/3 |
2024/3 |
2025/3 |
2026/3 |
| Number of employees in Japan and Overseas |
|
|
|
|
|
|
|
|
|
|
Total |
Persons |
1,512 |
1,526 |
1,628 |
1,691 |
1,775 |
1,860 |
1,898 |
| Domestic |
Persons |
857 |
850 |
901 |
906 |
982 |
1,042 |
1,053 |
|
| Overseas |
Persons |
655 |
676 |
727 |
785 |
793 |
818 |
845 |
|
| Number of employees by gender (non-consolidated) |
|
|
|
|
|
|
|
|
|
|
Non-consolidated total |
Persons |
786 |
780 |
770 |
778 |
790 |
838 |
845 |
| Male |
Persons |
673 |
658 |
643 |
636 |
633 |
663 |
659 |
|
| Male ratio |
% |
85.6 |
84.4 |
83.5 |
81.7 |
80.1 |
79.1 |
78.0 |
|
| Female |
Persons |
113 |
122 |
127 |
142 |
157 |
175 |
186 |
|
| Female ratio |
% |
14.4 |
15.6 |
16.5 |
18.3 |
19.9 |
20.9 |
22.0 |
|
| Number of Employees by Business |
|
|
|
|
|
|
|
|
|
| Consolidated |
Total (Consolidated ) |
Persons |
1,512 |
1,526 |
1,628 |
1,691 |
1,775 |
1,860 |
1,898 |
| Equipment Business |
Persons |
1,188 |
1,197 |
1,307 |
1,358 |
1,429 |
1,487 |
1,502 |
|
| Service Business |
Persons |
237 |
238 |
232 |
239 |
242 |
256 |
259 |
|
| Other Business |
Persons |
29 |
27 |
26 |
30 |
30 |
36 |
42 |
|
| Corporate (common) |
Persons |
58 |
64 |
63 |
64 |
74 |
81 |
95 |
|
| Non-consolidated |
Total (Non-consolidated) |
Persons |
786 |
780 |
770 |
778 |
790 |
838 |
845 |
| Equipment Business |
Persons |
515 |
504 |
502 |
506 |
506 |
533 |
529 |
|
| Service Business |
Persons |
213 |
212 |
205 |
208 |
210 |
224 |
221 |
|
| Other Business |
Persons |
- |
- |
- |
- |
- |
- |
- |
|
| Corporate (common) |
Persons |
58 |
64 |
63 |
64 |
74 |
81 |
95 |
|
- * The number of employees is as of the end of each fiscal year.
Employee-related Data(Non-consolidated)
Please scroll horizontally to look at table below.
|
|
Unit |
2020/3 |
2021/3 |
2022/3 |
2023/3 |
2024/3 |
2025/3 |
2026/3 |
| Average years of service |
|
|
|
|
|
|
|
|
|
|
Total |
Years |
17.4 |
19.2 |
19.1 |
17.2 |
17.0 |
15.3 |
14.4 |
| Male |
Years |
18.2 |
20.1 |
20.1 |
18.2 |
18.1 |
16.1 |
15.3 |
|
| Female |
Years |
12.8 |
13.8 |
14.0 |
12.5 |
12.6 |
12.0 |
11.5 |
|
| Average age |
|
|
|
|
|
|
|
|
|
|
Total |
Years old |
41.2 |
43.1 |
43.0 |
41.2 |
41.4 |
40.3 |
39.7 |
| Male |
Years old |
41.8 |
43.8 |
43.8 |
41.8 |
42.1 |
40.8 |
40.2 |
|
| Female |
Years old |
37.7 |
38.7 |
39.0 |
38.5 |
38.8 |
38.1 |
38.3 |
|
| Average annual salary*1 |
|
Thousands of yen |
6,548 |
6,455 |
5,889 |
6,149 |
6,826 |
7,630 |
7,928 |
| Number of hires |
|
|
|
|
|
|
|
|
|
|
Total number of hires |
Persons |
36 |
36 |
29 |
39 |
48 |
94 |
43 |
| Total number of new graduate hires |
Persons |
24 |
27 |
24 |
21 |
20 |
27 |
20 |
|
| Ratio of new graduates hired |
% |
66.7 |
75.0 |
82.8 |
53.8 |
41.7 |
28.7 |
46.5 |
|
| Total number of mid-career hired |
Persons |
12 |
9 |
5 |
18 |
28 |
67 |
23 |
|
| Ratio of mid-career hired |
% |
33.3 |
25.0 |
17.2 |
46.2 |
58.3 |
71.3 |
53.5 |
|
| Number of employees who left*2 |
|
Persons |
19 |
18 |
12 |
11 |
26 |
19 |
15 |
| Turnover rate*2 |
|
% |
2.4 |
2.3 |
1.6 |
1.4 |
3.3 |
2.3 |
1.8 |
| Monthly average overtime hours |
|
Hours |
21.2 |
11.0 |
15.5 |
22.6 |
20.1 |
21.9 |
20.7 |
| Annual paid leave utilization rate |
|
% |
73.4 |
65.8 |
69.1 |
75.1 |
74.3 |
77.8 |
83.8 |
- *1 Average annual employee salary includes bonuses and overtime pay.
- *2 Excluding mandatory retirement employees.
■Diversity Data(Non-consolidated)
Please scroll horizontally to look at table below.
|
|
Unit |
2020/3 |
2021/3 |
2022/3 |
2023/3 |
2024/3 |
2025/3 |
2026/3 |
| Female officers (board members and executive officers)*1 |
|
|
|
|
|
|
|
|
|
|
Total number of officers (board members and executive officers)*1 |
Persons |
16 |
16 |
16 |
14 |
14 |
14 |
14 |
| Female officers (board members and executive officers)*1 |
Persons |
1 |
1 |
2 |
2 |
2 |
2 |
2 |
|
| Ratio of female officers (board members and executive officers) |
% |
6.3 |
6.3 |
12.5 |
14.3 |
14.3 |
14.3 |
14.3 |
|
| Female managers |
Total number of managers*2 |
Persons |
86 |
85 |
83 |
86 |
84 |
82 |
86 |
| Number of female managers*2 |
Persons |
4 |
4 |
5 |
6 |
8 |
8 |
7 |
|
| Ratio of female managers |
% |
4.7 |
4.7 |
6.0 |
7.0 |
9.5 |
9.8 |
8.1 |
|
| Female new graduate hired |
Number of female new graduates hired*2 |
Persons |
11 |
6 |
6 |
8 |
11 |
7 |
5 |
| Ratio of female new graduates hired |
% |
40.7 |
25.0 |
28.6 |
40.0 |
39.3 |
30.4 |
25.0 |
|
| Gender pay gap |
|
% |
- |
- |
- |
70.3 |
72.5 |
73.5 |
72.6 |
| Number of re-employed retired employees |
|
Persons |
22 |
22 |
26 |
25 |
16 |
30 |
29 |
| Number of non-Japanese employees |
Number of foreign national hires |
Persons |
0 |
0 |
3 |
3 |
3 |
3 |
1 |
| Number of employees with disabilities |
Number of employees with disabilities*3 |
Persons |
15 |
14 |
16 |
16 |
16 |
18 |
17 |
| Ratio of employees with disabilities |
% |
2.20 |
2.20 |
2.50 |
2.47 |
2.37 |
2.46 |
2.35 |
|
- *1 The number of female officers (board members and executive officers) is as of the end of June of each fiscal year.
- *2 The total number of managers, the number of female managers, and the number of female new graduates hired are as of April 1 of the following fiscal year.
- *3 The number of employees with disabilities is as of the end of each fiscal year.
■Utilization of Childcare Leave and Shortened Working Hour Programs(Non-consolidated)
Please scroll horizontally to look at table below.
|
|
Unit |
2020/3 |
2021/3 |
2022/3 |
2023/3 |
2024/3 |
2025/3 |
2026/3 |
| Number of employees who started childcare leave |
|
Persons |
1 |
10 |
7 |
11 |
9 |
20 |
19 |
| Ratio of employees taking childcare leave |
|
|
|
|
|
|
|
|
|
|
Male |
% |
7.0 |
12.5 |
30.8 |
13.3 |
52.9 |
56.0 |
46.7 |
| Female |
% |
None |
100 |
100 |
100 |
100 |
100 |
100 |
|
| Number of employees who started shortened working hours |
|
Persons |
8 |
3 |
7 |
5 |
4 |
8 |
5 |
■Investment in Employee Education and Development(Non-consolidated)
Please scroll horizontally to look at table below.
|
|
|
|
|
|
|
|
|
|
|
|
Unit |
2020/3 |
2021/3 |
2022/3 |
2023/3 |
2024/3 |
2025/3 |
2026/3 |
| Investment in employee education and development |
|
million yen |
- |
- |
- |
101 |
129 |
135 |
125 |
| Utilization of Self-Development Education Support |
|
|
|
|
|
|
|
|
|
|
Self-development courses |
Persons |
321 |
324 |
337 |
318 |
228 |
336 |
289 |
| Correspondence course |
Persons |
152 |
185 |
171 |
160 |
141 |
158 |
161 |
|
| Recommended qualifications |
Persons |
86 |
63 |
78 |
78 |
294 |
312 |
352 |
|
| Foreign language learning |
Persons |
41 |
23 |
20 |
16 |
120 |
23 |
22 |
|
| Number of participants in the on-demand video learning program |
Persons |
- |
- |
- |
438 |
581 |
456 |
358 |
|
| Learning hours of the on-demand video learning program |
Hours |
- |
- |
- |
3,780 |
4,295 |
3,341 |
2,790 |
|
| Utilization of Executive Development Program |
|
|
|
|
|
|
|
|
|
|
University degree completion course |
Persons |
5 |
5 |
5 |
5 |
4 |
1 |
2 |
| Number of participants in overseas training system programs |
|
|
|
|
|
|
|
|
|
|
Number of employees utilizing the program |
Persons |
5 |
0 |
0 |
2 |
1 |
3 |
3 |
| Number of participants in the Round-up training courses* |
|
|
|
|
|
|
|
|
|
|
Number of participants |
Persons |
317 |
351 |
343 |
856 |
485 |
375 |
496 |
- * The workshop designed to promote understanding and penetration of our corporate philosophy. Includes some domestic group companies.
■Employee Health and Safety-related Data (Non-consolidated)
Please scroll horizontally to look at table below.
|
|
Unit |
2020/3 |
2021/3 |
2022/3 |
2023/3 |
2024/3 |
2025/3 |
2026/3 |
| Employee Health |
Rate of health checkup participation |
% |
100 |
100 |
100 |
100 |
100 |
100 |
100 |
| Absenteeism*1 |
% |
- |
- |
- |
- |
- |
1.6 |
1.9 |
|
| Presenteeism*2 |
% |
- |
- |
- |
- |
- |
36.2 |
35.5 |
|
| Work Engagement*3*4 |
- |
- |
- |
- |
- |
- |
B |
B |
|
| Employee Engagement*3*5 |
- |
- |
- |
- |
- |
- |
C |
B |
|
| Occupational accident (excluding non-lost-time accidents)*6 |
|
Cases |
1 |
0 |
2 |
0 |
1 |
0 |
0 |
| Frequency rate [calculated as (number of lost time accidents/total worked hours)×1,000,000]*6 |
|
- |
0.62 |
0 |
1.34 |
0 |
0.55 |
0 |
0 |
| Personal injury accidents by cars, motorcycles and bicycles |
|
Cases |
3 |
3 |
1 |
0 |
1 |
0 |
5 |
| At-fault accidents involving cars and motorcycles |
|
Cases |
12 |
19 |
11 |
11 |
13 |
17 |
14 |
- *1 Absence or leave due to mental or physical health issues. This indicator measures the percentage of all employees who are either recipients of the monthly salary compensation program due to personal injury or illness or those on long-term leave (excluding duplicates).
- *2 A state in which employees work despite experiencing mental or physical health issues. We use the productivity loss rate measured using the WHO-HPQ as an indicator.
- *3 Results from the engagement survey. (S: Excellent, A: Good, B: Average, C: Needs Improvement, D: Requires Immediate Improvement)
- *4 A proactive and positive mindset toward work.
- *5 A sense of attachment to the company or organization.
- *6 Excludes temporary workers.
■Number of patents held (Non-consolidated)
Please scroll horizontally to look at table below.
| | | Unit | 2020/3 | 2021/3 | 2022/3 | 2023/3 | 2024/3 | 2025/3 | 2026/3 |
| --- | --- | --- | --- | --- | --- | --- | --- | --- |
| Number of patents held | | Cases | - | - | - | 393 | 408 | 422 | 404 |
■Cumulative Number of Registrants on “Test Navi,” a Technical Information Website
Please scroll horizontally to look at table below.
| | | Unit | 2020/3 | 2021/3 | 2022/3 | 2023/3 | 2024/3 | 2025/3 | 2026/3 |
| --- | --- | --- | --- | --- | --- | --- | --- | --- |
| Number of registrants | | Persons | 19,570 | 20,931 | 22,154 | 23,076 | 23,927 | 24,772 | 25,448 |
Governance
■Board of Directors (Non-consolidated)
Please scroll horizontally to look at table below.
|
|
Unit |
2020/3 |
2021/3 |
2022/3 |
2023/3 |
2024/3 |
2025/3 |
2026/3 |
| Composition of Board of Directors |
|
|
|
|
|
|
|
|
|
|
Total |
Persons |
8 |
8 |
8 |
10 |
10 |
10 |
10 |
| Independent outside |
Persons |
2 |
2 |
2 |
4 |
4 |
4 |
4 |
|
| Ratio of independent outside |
% |
25 |
25 |
25 |
40 |
40 |
40 |
40 |
|
| Female |
Persons |
0 |
0 |
0 |
2 |
2 |
2 |
2 |
|
| Female ratio |
% |
0 |
0 |
0 |
20 |
20 |
20 |
20 |
|
| Number of meetings held |
|
Times |
13 |
13 |
13 |
13 |
13 |
13 |
13 |
| Attendance rates |
|
% |
98.7 |
100 |
100 |
100 |
99.2 |
100 |
96.9 |
- * The Company has transitioned from a company with an Audit & Supervisory Board to a company with an Audit & Supervisory Committee in June 2022.
■Audit & Supervisory Board (Non-consolidated)
Please scroll horizontally to look at table below.
|
|
Unit |
2020/3 |
2021/3 |
2022/3 |
2023/3 |
2024/3 |
2025/3 |
2026/3 |
| Composition of Audit & Supervisory Board |
|
|
|
|
|
|
|
|
|
|
Total |
Persons |
4 |
4 |
4 |
- |
- |
- |
- |
| Independent outside |
Persons |
2 |
3 |
3 |
- |
- |
- |
- |
|
| Ratio of independent outside |
% |
50 |
75 |
75 |
- |
- |
- |
- |
|
| Female |
Persons |
0 |
0 |
1 |
- |
- |
- |
- |
|
| Female ratio |
% |
0 |
0 |
25 |
- |
- |
- |
- |
|
| Number of meetings |
|
Times |
13 |
13 |
14 |
3 |
- |
- |
- |
| Attendance rates |
|
% |
94.2 |
100 |
100 |
100 |
- |
- |
- |
- * The Company has transitioned from a company with an Audit & Supervisory Board to a company with an Audit & Supervisory Committee in June 2022.
■Audit & Supervisory Committee (Non-consolidated)
Please scroll horizontally to look at table below.
|
|
Unit |
2020/3 |
2021/3 |
2022/3 |
2023/3 |
2024/3 |
2025/3 |
2026/3 |
| Composition of Audit & Supervisory Board |
|
|
|
|
|
|
|
|
|
|
Total |
Persons |
- |
- |
- |
3 |
3 |
3 |
3 |
| Independent outside |
Persons |
- |
- |
- |
2 |
2 |
2 |
2 |
|
| Ratio of independent outside |
% |
- |
- |
- |
67 |
67 |
67 |
67 |
|
| Female |
Persons |
- |
- |
- |
1 |
1 |
1 |
1 |
|
| Female ratio |
% |
- |
- |
- |
33 |
33 |
33 |
33 |
|
| Number of meetings |
|
Times |
- |
- |
- |
10 |
13 |
13 |
13 |
| Attendance rates |
|
% |
- |
- |
- |
100 |
100 |
100 |
100 |
- * The Company has transitioned from a company with an Audit & Supervisory Board to a company with an Audit & Supervisory Committee in June 2022.
■Voluntary Committee(s) Equivalent to Nomination Committee or Remuneration Committee (Non-consolidated)
Please scroll horizontally to look at table below.
|
|
Unit |
2020/3 |
2021/3 |
2022/3 |
2023/3 |
2024/3 |
2025/3 |
2026/3 |
| Voluntary Establishment of Committee(s) equivalent to Nomination Committee or Remuneration Committee |
|
‐ |
Established |
Established |
Established |
Established |
Established |
Established |
Established |
| Composition of Nomination and Compensation Committee* |
|
|
|
|
|
|
|
|
|
|
Total |
Persons |
3 |
3 |
5 |
5 |
5 |
5 |
5 |
| Committee chairperson |
- |
Inside director |
Inside director |
Outside director |
Outside director |
Outside director |
Outside director |
Outside director |
|
| Independent outside |
Persons |
2 |
2 |
3 |
3 |
3 |
3 |
3 |
|
| Ratio of independent outside |
% |
67 |
67 |
60 |
60 |
60 |
60 |
60 |
|
| Number of meetings |
|
Times |
2 |
5 |
4 |
2 |
2 |
2 |
2 |
| Attendance rates |
|
% |
100 |
100 |
100 |
100 |
100 |
100 |
100 |
- * The Company changed the name of the Personnel Advisory Committee, a voluntary body that deliberates on director appointments and compensation, to the Nomination and Compensation Advisory Committee in March 2021, ,and changed to the Nomination and Compensation Committee in March 2022.
■Compensation (Non-consolidated)
Please scroll horizontally to look at table below.
|
|
Unit |
2020/3 |
2021/3 |
2022/3 |
2023/3 |
2024/3 |
2025/3 |
2026/3 |
| Compensation of directors(Excluding directors who are Audit & Supervisory Committee Members) |
Total |
Million yen |
183 |
235 |
185 |
188 |
234 |
247 |
205 |
| Outside |
Million yen |
12 |
12 |
12 |
12 |
13 |
14 |
15 |
|
| Compensation of directors(Audit & Supervisory Committee Members) |
Total |
Million yen |
- |
- |
- |
22 |
33 |
35 |
37 |
| Outside |
Million yen |
- |
- |
- |
9 |
13 |
14 |
15 |
|
| Compensation of auditors |
Total |
Million yen |
50 |
34 |
36 |
9 |
- |
- |
- |
| Outside |
Million yen |
12 |
16 |
18 |
4 |
- |
- |
- |
|
| Total |
Total |
Million yen |
233 |
269 |
221 |
219 |
267 |
282 |
242 |
| Outside |
Million yen |
24 |
28 |
30 |
25 |
27 |
28 |
30 |
|
- * The Company has transitioned from a company with an Audit & Supervisory Board to a company with an Audit & Supervisory Committee in June 2022.
The Compensation of fiscal year ended March 2023, includes 4 directors (including 1 outside director) and 4 Audit & Supervisory Board members (including 3 outside Audit & Supervisory Board members) who retired at the conclusion of the 69th Ordinary General Meeting of Shareholders held in June 2022, as their terms of office had ended. Of these, 3 Audit & Supervisory Board members (including two outside Audit & Supervisory Board members) were newly appointed as directors who are Audit & Supervisory Committee members after retiring as Audit & Supervisory Board members at the conclusion of the 69th Ordinary General Meeting of Shareholders. Accordingly, in presenting the compensation of recipients for these officers, the portion for their time as Audit & Supervisory Board members is included in Audit & Supervisory Board members and the portion for their time as directors who are Audit & Supervisory Committee members in Directors (Audit & Supervisory committee member).
■Compliance (Non-consolidated)
Please scroll horizontally to look at table below.
| | | Unit | 2020/3 | 2021/3 | 2022/3 | 2023/3 | 2024/3 | 2025/3 | 2026/3 |
| --- | --- | --- | --- | --- | --- | --- | --- | --- |
| Total number of reports to the internal hotlines | | Cases | 0 | 0 | 0 | 0 | 1 | 0 | 0 |
| Number of compliance issues | | Cases | 2 | 2 | 1 | 3 | 2 | 2 | 0 |
Products & Services
Environmental Test Chambers
Secondary Battery-related Equipment
Measurement & Evaluation Systems / Burn-in Test Equipment
HALT/HASS
Indoor Farming & Growth Chamber
Catalog
Description Video
Products Search

Laboratory Testing Services
Total solution
Exhibition & Seminar Schedule
Support
Daily Inspection and Troubleshooting
The Online Diagnostics Service
Product support services for membership
Discontinued models and successor
About ESPEC
Message from the President
Corporate Philosophy (Identity)
ESPEC's History
Corporate Data
Business Summary
R&D and Technology
Production
Quality Assurance
For suppliers: Procurement Activities
IR
Management Policy
Business Financial Data
IR Library
IR Events
Stocks and Corporate Bonds
IR Sitemap
Sustainability
Message from the President
Sustainability Management
Stakeholder Engagement
Corporate Value Creation Process
Materiality (important issues)
ESPEC Programs and SDGs
Environment
Social
Governance
Fair and Transparent Management
ESG Data
ESPEC Foundation for Global Environment Research and Technology
External Recognition
Sustainability Sitemap
Inquiries

Copyright © ESPEC CORP. All rights reserved


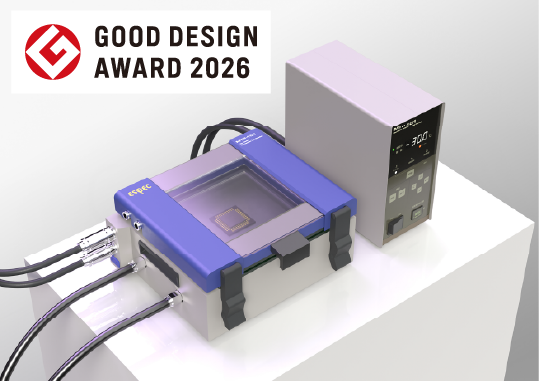 MTP-101 One-Device Temperature Test Chamber In recent years, with the spread of 5G communications and autonomous driving, managing heat generated by high-heat-generating components and high-density mounting boards has become a challenge. As a result, there is growing demand for test environments without airflow, where convection does not affect measurements. In addition, because the electrical properties of optical devices and high-frequency devices depend on temperature, evaluations for thermal design and thermal management have become necessary during product development.







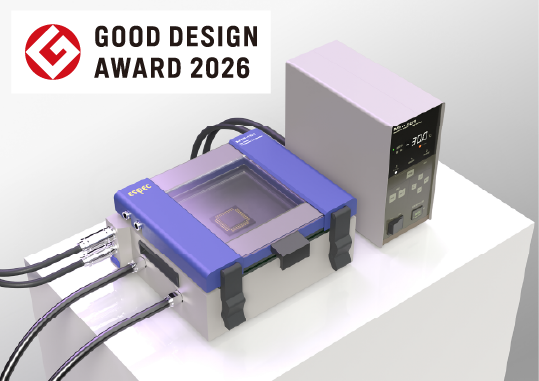 卓上型無風恒温槽 ワンデバイスチャンバー MTP-101 近年、5G通信・自動運転の普及に伴い、高発熱部品や高密度実装基板の熱対策が課題となっており、対流の影響がない無風状態の実験環境が重視されています。また、光デバイスや高周波デバイスにおいては、電気的性質が温度に依存するため、開発段階で「熱設計」や「サーマルマネジメント(熱管理)」のための評価が必要となっています。
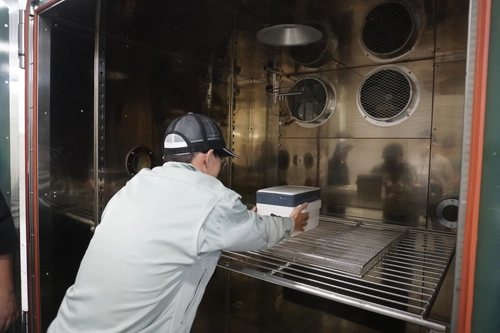 気球に搭載する機器を低温・低圧環境を再現する環境試験器にセット
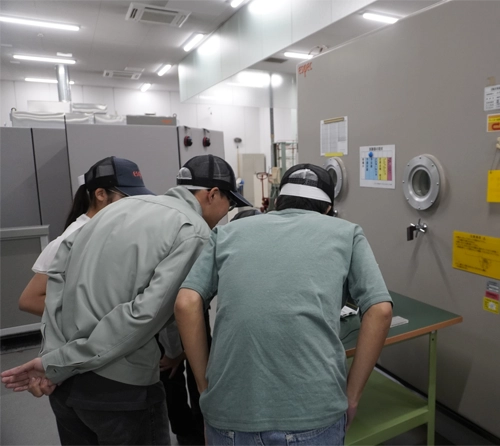 マイナス40℃、約0.1 kPaの環境下で、データが正常に取得できているか確認
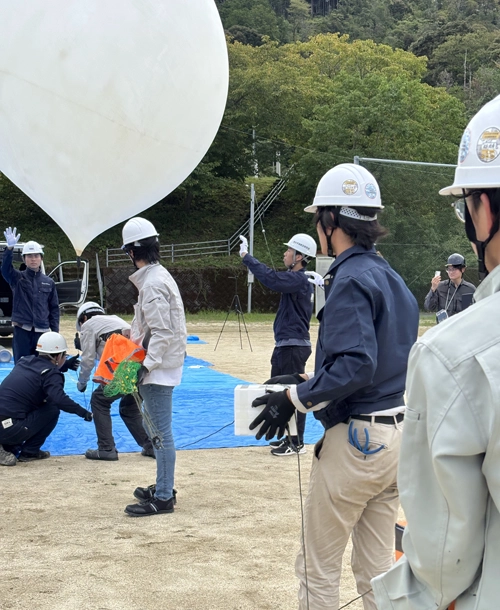 本番の様子
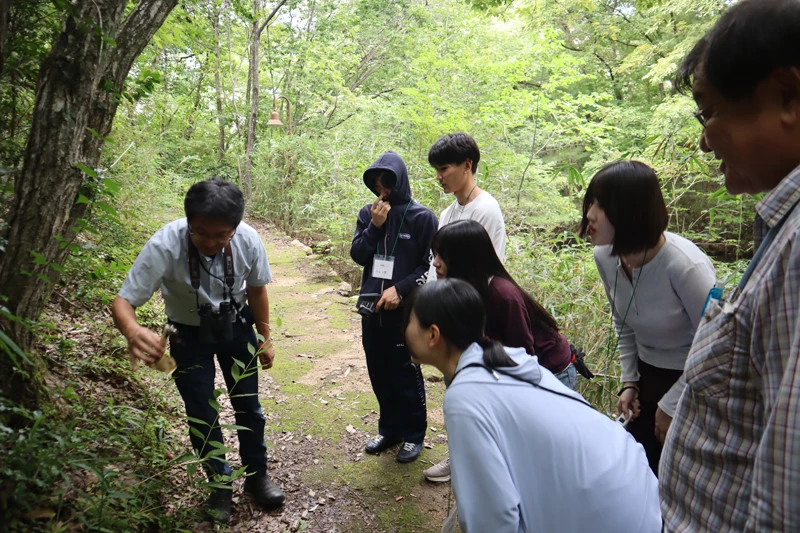 熱心に観察する学生たち
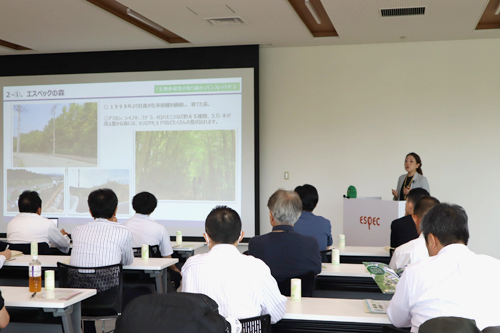 概要説明の様子
 ビオトープを見学する参加者
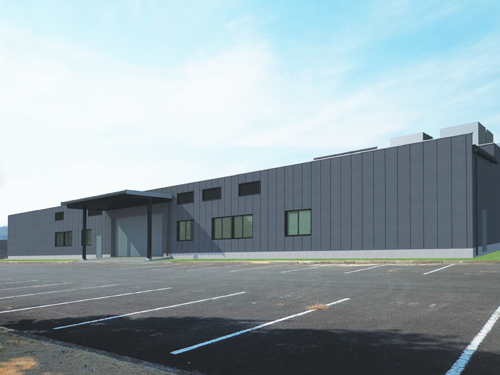
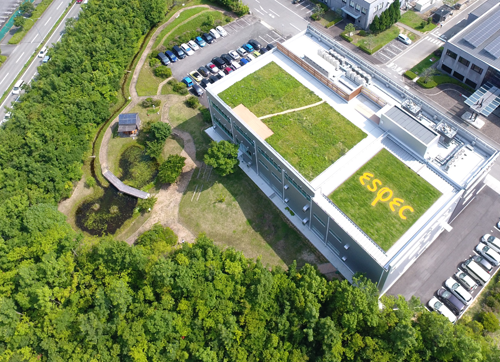 研究開発の拠点として、技術開発と新製品開発を行っています。地球上のさまざまな気象環境を再現する世界初の「全天候型試験ラボ」を公開し、社内外の技術の融合によるオープンイノベーションを促進しています。また、ISO/IEC17025 試験所認定を取得している神戸試験所や、恒温(恒湿)室の製造工場を設置しています。
事業所で使用する電力は全て再生可能エネルギーでまかなっており、敷地内にある社員が約3万本の在来種を植樹し育てた森や、ビオトープ、屋上草地は当社の生物多様性保全の取り組みを広く発信し、環境啓発を行う場としても活用しています。「いきもの共生事業所(ABINC)認証」、環境省の「自然共生サイト」認定を取得しているほか、2026年4月には「令和8年緑化推進運動功労者内閣総理大臣表彰」を受賞しました。
操業:2001年 総面積:31,911m² 緑地等総面積:14,693m² ※施設含む
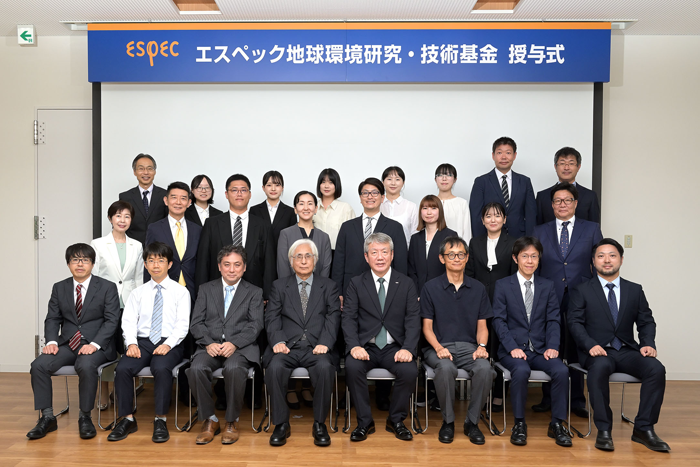 公益信託「エスペック地球環境研究・技術基金」
第29回授与式
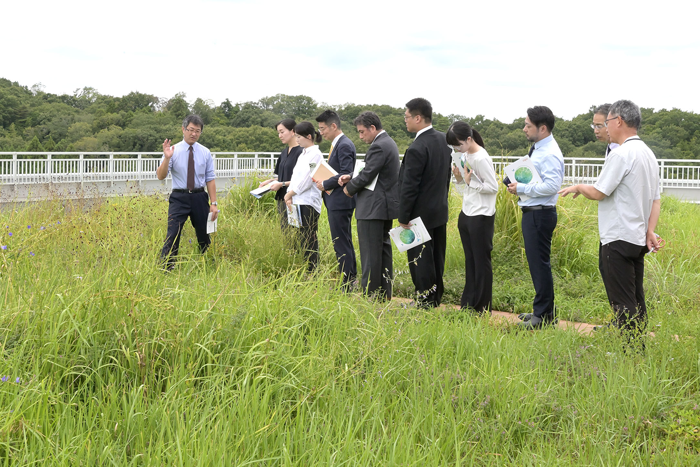 希望者を対象にキキョウやツリガネニンジンなどを含む
地域性在来種100%でつくった屋上草地を案内
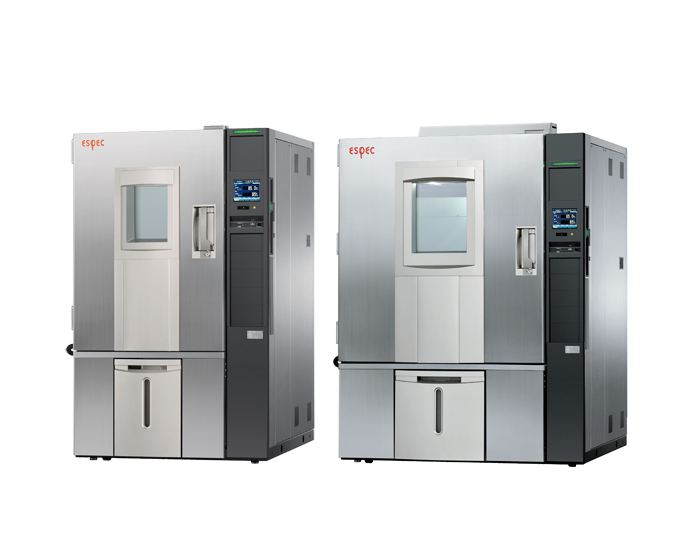 低温恒温(恒湿)器プラチナスJシリーズ
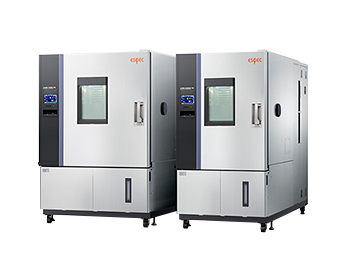 ハイパワー恒温(恒湿)器ARシリーズ
急速温度変化タイプ
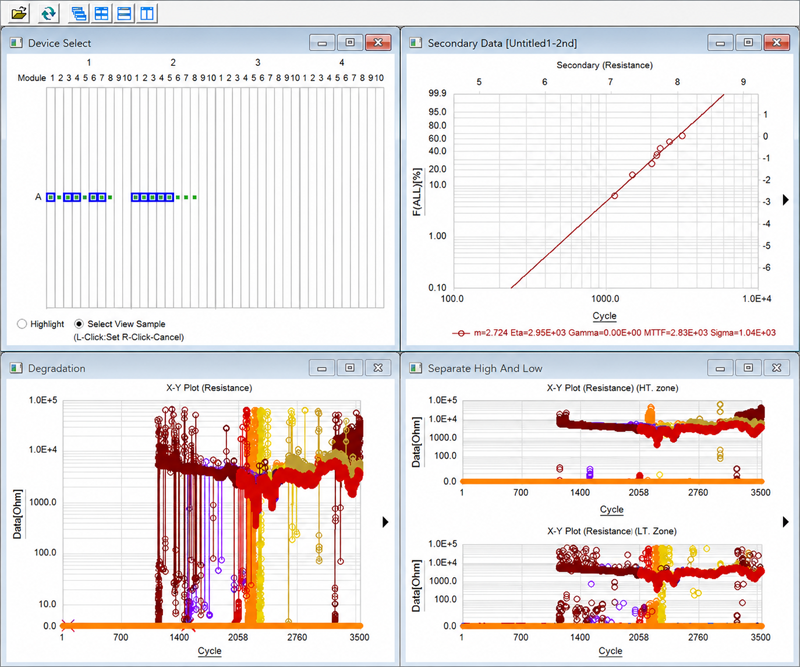 Real-time data updates during testing
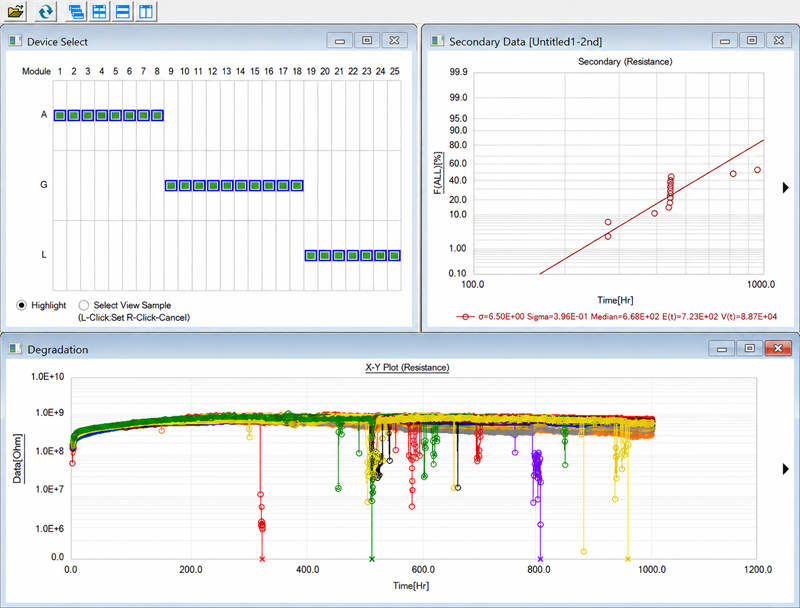 Real-time data updates during testing