Consolidated Financial Highlights for FY2025 ended March 31, 2026 Consolidated Financial Results for FY2025 Forecast for FY2026 Business Strategy (Securities Code: 6849) May 15, 2026 1 Consolidated Financial Results for FY2025 © Copyright NIHON…
Consolidated Financial Highlights
for FY2025 ended March 31, 2026
- Consolidated Financial Results for FY2025
- Forecast for FY2026
- Business Strategy
(Securities Code: 6849)
May 15, 2026
1
Consolidated Financial Results
for FY2025
© Copyright NIHON KOHDEN CORPORATION All Rights Reserved
1
- Executive Summary
FY2025
Increased sales / Decreased income YoY
Overall sales +4.3%; Domestic sales -0.6%, Overseas sales +13.1%, Operating income -9.5%
Sales:
Domestic sales increased excluding lower sales of locally purchased products and Abbott products. Sales of AEDs decreased
due to inventory adjustment at distributors. Sales of diagnostic information systems and clinical information systems achieved
double-digit growth. Sales of in-house consumables and services also increased
Overseas sales increased in all regions driven by double-digit growth in North America. Sales also increased favorably on a
local currency basis excluding the impact of the consolidation of Ad-Tech
Operating income decreased as domestic sales decreased and SG&A expenses increased due to wage increases and R&D
investments as well as higher depreciation caused by M&A and capital investments
FY2023
Overseas Sales Ratio
Consumables and
Services Sales Ratio
In-house Sales Ratio
Gross Profit Margin
SG&A Ratio
(Ref.) OP/employee
FY2024
35.9% 35.6%
Favorable growth in North America,
Impact of consolidation of Ad-Tech
Impact of consolidation of Ad-Tech
Lower sales of locally purchased
products and Abbott products in Japan,
73.5% 73.6%
Impact of consolidation of Ad-Tech
in cost including tariffs,
50.2% 52.0% Increase
Increase in inventory devaluation
due to missing actual sales
41.4% 42.8% Increased
forecasts, wage increases, R&D
investments, and higher depreciation
¥3.33 mil ¥3.48 mil
47.9% 49.7%
FY2025
FY2026 Targets
38.6%
38.7%
50.7%
50%
75.2%
75%
51.8%
53%
43.8%
38%
¥3.11 mil1 1.5 times or more2
*1 Excluding DOWELL’s employees. *2 Compared to FY2023.
© Copyright NIHON KOHDEN CORPORATION All Rights Reserved
2
- Consolidated Operating Results for FY2025
(Amounts of less than ¥1 million are rounded down)
FY2024
FY2025
YoY
(%)
Net sales
225,424
235,099
4.3
66,947
71,086
6.2
Domestic sales
145,237
144,406 - 0.6
44,083
44,213
0.3
Overseas sales
80,187
90,693 13.1
22,863
26,872 17.5
Gross profit
117,157
121,726
34,725
36,640
(Gross margin)
52.0%
51.8%
51.9%
51.5%
SG&A expenses
96,444
102,981
24,947
27,029
(SG&A ratio)
42.8%
43.8%
37.3%
38.0%
Operating income
20,713
18,745 - 9.5
9,778
9,610 - 1.7
(Operating margin)
9.2%
14.6%
13.5%
Ordinary income
20,373
6,866
10,661 55.3
5,961
8,104 36.0
Income attributable to
owners of parent
Average exchange rate (yen)
1 USD/1 EUR
14,098
152.4/163.5
3.9
22,544 10.7
150.5/174.2
+14% on a local currency basis
(+8% on a local currency basis
excluding impact of
consolidation of Ad-Tech)
6.8
8.0%
14,513
FY2024 FY2025 YoY
(%)
4Q
4Q
2.9
Foreign exchange gains/losses:
¥0.9 bn losses → ¥3.4 bn gains
Extraordinary losses:
Extra payments for early
retirements ¥2.4 bn
153.5/160.2
5.5
8.3
155.0/184.1
© Copyright NIHON KOHDEN CORPORATION All Rights Reserved
3
3.1) Breakdown of Operating Income for FY2025
(Amounts of less than ¥1 million are rounded down)
Impact of
Ad-Tech:
approx. 60%
FY2024
20,713
Increase in
gross profit from
sales increase
+4,486
Impact of
selling prices
and cost
+834
Main reasons for gross margin changes
• Increase in cost including tariff impact -0.9 pt
• Increase in inventory devaluation
-0.6 pt
• Higher selling prices of
+0.8 pt
in-house products
• Higher gross margin of IT systems
+0.4 pt
and services in Japan
• Favorable product mix
+0.2 pt
Impact of
Ad-Tech:
less than 50%
Increase
in SG&A*
-6,729
Currency
effect
-559
Items of increase/decrease
in SG&A expenses*
+¥2.71 bn
• Salaries
• Amortization of goodwill +¥0.93 bn
• Depreciation
+¥0.87 bn
• R&D expenses
+¥0.62 bn
FY2025
18,745
Benefit from
the reform of
the profit
structure
Approx.
2.2%pt
- Increase in SG&A indicates the amount as a factor of increase/decrease of operating income excluding the currency effect.
Items of increase/decrease in SG&A expenses indicate major components of increased/decreased SG&A expenses on a yen basis.
© Copyright NIHON KOHDEN CORPORATION All Rights Reserved
4
3.2) Breakdown of Operating Income for FY2025 4Q
(Amounts of less than ¥1 million are rounded down)
Impact of
Ad-Tech:
approx. 40%
FY2024
4Q
9,778
Impact of
selling prices
and cost
Increase in
+220
gross profit from
sales increase
+1,348
Main reasons for gross margin changes
• Increase in cost including tariff impact -1.6 pt
• Increase in inventory devaluation
-1.5 pt
• Favorable product mix
+1.3 pt
• Higher selling prices of
in-house products
+0.8 pt
• Higher gross margin of IT systems
and services in Japan
+0.5 pt
Impact of
Ad-Tech:
more than 50%
Increase
in SG&A*
-1,727
Currency
effect
-9
FY2025
4Q
9,610
Items of increase/decrease
in SG&A expenses*
+¥1.12 bn
• Salaries
• Depreciation
+¥0.31 bn
• R&D expenses
+¥0.30 bn
• Amortization of goodwill +¥0.24 bn
- Increase in SG&A indicates the amount as a factor of increase/decrease of operating income excluding the currency effect.
Items of increase/decrease in SG&A expenses indicate major components of increased/decreased SG&A expenses on a yen basis.
© Copyright NIHON KOHDEN CORPORATION All Rights Reserved
5
- Domestic Sales
Sales of in-house/
third-party products
Sales by market
Sales by product category
(Sales, millions of yen)
(¥100 million)
(¥100 million)
FY2024
FY2025
Physiological Measuring Equipment
36,247
36,824
1.6
Patient Monitors
46,194
45,927
Treatment Equipment
30,766
28,912
Other Medical Equipment
32,028
32,742
2.2
Total sales
145,237
144,406
Medical Devices
60,099
58,664
Consumables and Services
85,137
85,742
0.7
YoY(%)
(Reference)
[ Markets ]
Sales of AEDs decreased in the PAD market mainly due to inventory adjustment at distributors. Sales in the public hospital market
also decreased. Sales in the university, private hospital, and clinic markets increased.
[ Products ] In-house/third-party products: Sales of locally purchased products and ablation catheters decreased. Sales of in-house
consumables and services increased, while sales of in-house medical devices decreased slightly.
Physiological Measuring Equipment: Sales of diagnostic information systems achieved double-digit growth and sales of
neurology products also increased favorably. Sales of ECGs and polygraphs for cath lab decreased.
Patient Monitors: Sales of telemetry systems and transmitters decreased. Sales of clinical information systems achieved doubledigit growth. Sales of bedside monitors also increased.
Treatment Equipment: Sales of Abbott’s ablation catheters decreased. Sales of AEDs and defibrillators also decreased. Sales of
ventilators increased favorably, mainly for intubated-type ventilators.
Other Medical Equipment: Sales of installation and maintenance services for medical devices increased favorably and sales of
hematology instruments and reagents also increased. Sales of locally purchased products decreased.
© Copyright NIHON KOHDEN CORPORATION All Rights Reserved
6
- Overseas Sales
Overseas sales ratio
Overseas sales: YoY +13%
FY2024
(on a local currency basis:+14%,
on a local currency basis excluding consolidation of Ad-Tech: +8%)
Sales by region
(¥100 million)
Local currency
basis
Asia &
Other
+6%
Europe
+9%
+4%
Latin
America
+4%
+6%
North
America
+19%
+9%
+20%
38.6%
35.6%
Sales by product category
YoY
FY2025
(Sales, millions of yen)
Local
currency
basis (%)
FY2024
FY2025
YoY
(%)
Physiological Measuring
Equipment
10,627
16,812
58.2
58
Patient Monitors
38,771
38,331
-1
Treatment Equipment
22,417
27,373
22.1
23
Other Medical
Equipment
8,371
8,175
-1
Total sales
80,187
90,693
13.1
14
Medical Devices
53,204
57,332
7.8
9
Consumables and Services
26,982
33,361
23.6
24
(Reference)
[ Region ]
Sales increased in all regions driven by double-digit growth in North America. Sales increased favorably on a local currency basis
excluding the impact of the consolidation of Ad-Tech.
[ Products ] Physiological Measuring Equipment: Sales of neurology products including Ad-Tech increased significantly.
Treatment Equipment: Sales of ventilators increased significantly in North America, Europe, and Latin America.
Patient Monitors: Sales in North America and Europe decreased compared to the strong growth in FY24, while sales in Asia &
Other achieved double-digit growth. Sales increased favorably in FY25 4Q.
© Copyright NIHON KOHDEN CORPORATION All Rights Reserved
7
5.1) Sales in North America
Double-digit growth on yen basis / local currency basis excluding impact of consolidation of Ad-Tech
Significant growth of Physiological Measuring Equipment and Treatment Equipment,
Decline in sales of Patient Monitors compared to strong growth in FY24, while double-digit growth in
FY25 4Q
YoY
+19%
(Local currency basis +20%)
(¥100 million)
498
500
400
370
43
419
50
300
200
218
255
100
102
103
FY2023
FY2024
103
[ Product Category ] * YoY on a local currency basis
Physiological Measuring Equipment: over 100% growth
Double-digit growth on local currency basis excluding impact of
consolidation of Ad-Tech. Strong growth of home sleep recorders
244
Patient Monitors:
low-single-digit decline
Decline in medical devices, while double-digit growth in consumables such
as sensors. Double-digit growth in FY25 4Q driven by delivery and
installation of medical devices
138
Treatment Equipment:
mid-30% growth
Strong growth of ventilators and double-digit growth of AEDs: Strong growth
of mask-type / intubated-type ventilators, Expanded market share of AEDs
0
FY2025
© Copyright NIHON KOHDEN CORPORATION All Rights Reserved
8
5.2) Sales in Latin America
Increased on yen basis / local currency basis in FY25 thanks to double-digit growth in 4Q.
Steady growth mainly in Paraguay and Peru
(¥100 million)
60
YoY
+4%
(Local currency basis +6%)
[ Product Category ] * YoY on a local currency basis
60
4
Physiological Measuring Equipment: high-teen decline
Decline in sales of neurology products. Favorable growth of ECGs
50
40
29
53
5
20
56
4
17
Patient Monitors:
Decline mainly in Mexico and Brazil
21
Treatment Equipment:
low-30% growth
Significant growth of ventilators thanks to large orders in Paraguay.
Strong growth of AEDs
Other Medical Equipment:
mid-teen growth
Growth of maintenance services for medical devices in Mexico
30
20
16
16
10
10
11
12
FY2023
FY2024
FY2025
low-teen decline
0
© Copyright NIHON KOHDEN CORPORATION All Rights Reserved
9
5.3) Sales in Europe
Increased favorably, especially in Turkey, the U.K., and Italy
YoY
+9%
(Local currency basis +4%)
(¥100 million)
140
131
120
18
125
19
136
25
Physiological Measuring Equipment: mid-20% growth
Favorable growth of neurology products on local currency basis excluding
impact of consolidation of Ad-Tech
48
Patient Monitors:
Decline mainly in Germany
100
80
46
49
60
40
54
42
49
11
14
12
FY2023
FY2024
FY2025
20
0
[ Product Category ] * YoY on a local currency basis
high-single-digit decline
Treatment Equipment:
mid-teen growth
Significant growth of ventilators and defibrillators
Other Medical Equipment:
mid-teen decline
Decline in sales of hematology instruments and reagents
© Copyright NIHON KOHDEN CORPORATION All Rights Reserved
10
5.4) Sales in Asia & Other
Increased favorably, especially in Southeast Asia such as Thailand and Vietnam, in India, and in the
Middle East & Africa such as Morocco and Israel
FY25 4Q: Increased YoY, compared to decline in 3Q when it took time to comply with laws and regulations
YoY
+6%
(Local currency basis +9%)
(¥100 million)
250
200
150
234
42
74
203
30
61
216
34
62
Physiological Measuring Equipment: mid-teen growth
Double-digit growth of neurology products. Favorable growth of ECGs
72
Patient Monitors:
low-20% growth
Received large orders in Morocco.
Favorable growth in Southeast Asia and India
64
Treatment Equipment:
mid-single-digit growth
Double-digit growth of defibrillators and ventilators
Other Medical Equipment:
mid-single-digit decline
Decline in sales of hematology instruments. Steady growth of reagents
100
71
[ Product Category ] * YoY on a local currency basis
50
46
48
44
FY2023
FY2024
FY2025
0
© Copyright NIHON KOHDEN CORPORATION All Rights Reserved
11
(Ref.) Sales and Gross Margin by Product Category / Sales Ratio
(Sales, millions of yen)
FY2024
Physiological Measuring
Equipment
Patient Monitors
Treatment Equipment
Other
Medical Equipment
Total sales
FY2025
46,874
53,636
(43%)
(45%)
84,965
84,258
(65%)
(64%)
53,184
56,286
(44%)
(44%)
40,400
40,918
(45%)
(47%)
225,424
235,099
(52%)
(52%)
YoY(%)
14.4
Consumables and
Services
113,304
115,996
(54%)
(54%)
112,119
119,103
(50%)
(50%)
2.4
6.2
42%
58%
Patient Monitors
12%
88%
Treatment Equipment
22%
78%
Other Medical Equipment
68%
32%
Total
75.2%
24.8%
Medical Devices
81%
19%
Consumables and Services
70%
In-house products
Physiological Measuring Equipment
42%
Patient Monitors
(Reference)
Medical Devices
Physiological Measuring Equipment
Total
Third-party products
58%
54%
Treatment Equipment
Other Medical Equipment
30%
46%
61%
34%
49.3%
Medical Devices
39%
66%
50.7%
Consumables and Services
*The figures in parentheses in the table are gross profit margins.
© Copyright NIHON KOHDEN CORPORATION All Rights Reserved
12
(Ref.) Breakdown of Sales by Product Category
(Sales, millions of yen)
FY2024
FY2025
YoY (%)
Neurology Products
10,544
16,273
54.3
ECGs (Electrocardiographs)
6,280
6,230
Polygraphs for Cath Lab
17,841
17,521
Diagnostic Information Systems
6,343
7,116
12.2
Other Physiological Measuring Equipment *
5,864
6,494
10.7
Physiological Measuring Equipment
46,874
53,636
14.4
*Includes products of other companies.
FY2024
Patient Monitors
Clinical Information Systems
FY2025
FY2024
FY2025
YoY (%)
Defibrillators (for Hospital and Ambulance)
AEDs (Automated External Defibrillator)
Pacemakers / ICDs
Ventilators
Other Treatment Equipment
8,335
24,451
2,446
9,688
8,263
9,093
24,390
2,445
13,190
7,166
9.1
Treatment Equipment
53,184
56,286
5.8
(Ref.)AED Unit Sales (units)
Domestic Unit Sales (units)
117,000
63,800
115,400
57,900
FY2024
FY2025
YoY (%)
YoY (%)
84,965
84,258
Hematology Instruments
13,217
12,799
5,585
6,337
13.5
Imaging Systems and Others *
27,182
28,119
3.4
Other Medical Equipment
40,400
40,918
1.3
*Includes consumables, installation and maintenance services which are not part of
other categories.
© Copyright NIHON KOHDEN CORPORATION All Rights Reserved
13
- Financial Position
(Amounts of less than ¥1 million are rounded down)
FY2024
FY2024
FY2025
Change
Current assets
183,085
177,808
- 5,276 Current liabilities
Inventories
56,174
55,992
Property, plant & equipment
29,270
32,250
2,979 Non-current liabilities
Intangible assets
27,653
27,222
Investments & other assets
18,266
19,256
989 Net assets
Total assets
258,276
256,538
6.2
5.9
Inventory turnover (months)
Interest-bearing debt
Interest-bearing debt
- 1,737 Total liabilities & net assets
[Reasons for decrease of current assets]
Notes and accounts receivable
decreased by ¥1.3 bn.
[Reasons for increase of property, plant & equipment ]
Buildings and structures increased by ¥6.3 bn.
The Tsurugashima Production Center started operations
Equity ratio
FY2025
Change
72,296
49,428 - 22,867
26,030
50 - 25,980
4,685
27,286
22,601
ー
22,388
22,388
181,294
179,824
258,276
256,538
69.5%
70.1%
[Reasons for decrease of current liabilities]
Interest-bearing debt (short-term borrowings)
decreased by ¥25.9 bn.
[Reasons for increase of non-current liabilities]
Interest-bearing debt (long-term borrowings)
increased by ¥22.3 bn.
*Refinancing of short-term borrowings into long-term borrowings
© Copyright NIHON KOHDEN CORPORATION All Rights Reserved
14
- Cash Flows
(Amounts of less than ¥1 million are rounded down)
FY2024
Ⅰ . Net cash flows from
operating activities
Ⅱ . Net cash flows from
investing activities
Free cash flows
Ⅲ . Net cash flows from
financing activities
Effect of exchange rate change
on cash and cash equivalents
Net increase (decrease) in cash
and cash equivalents
Cash and cash equivalents
at end of period
ROE
FY2025
Change
15,286
21,055
5,768
16,853
12,770
22,622
2,550
485
1,405
919
2,576
9,392
43,061
45,637
2,576
7.8%
8.1%
(Billions of yen)
FY2024 FY2025
Change
Income before income taxes
21.5
19.9
-1.6
Decrease (increase) in accounts receivable
0.7
3.3
+2.6
Income taxes paid
-9.7
-7.6
+2.1
FY2024 FY2025
Change
Purchase of property, plant and equipment
-7.1
-5.7
+1.3
Purchase of shares of subsidiaries resulting in
change in scope of consolidation
-18.8
-0.5
+18.3
FY2024 FY2025
Change
Net increase (decrease) in short-term borrowings
25.3
-25.9
-51.3
Proceeds from long-term borrowings
―
25.5
+25.5
Decrease (increase) in deposits paid
-7.6
7.2
+14.9
Purchase of shares of subsidiaries not resulting
in change in scope of consolidation
―
-7.4
-7.4
© Copyright NIHON KOHDEN CORPORATION All Rights Reserved
15
- Capital Investment and R&D Expenses
(Amounts of less than ¥1 million are rounded down)
FY2024
Actual
FY2025
Original forecast
announced May 13
Revised forecast
announced Nov 10
Actual
Change
FY2026
Plan
Change
Capital investment
9,519
9,400
9,400
7,807
6,000
Depreciation
4,067
4,900
5,000
4,757
690
6,000
1,243
R&D expenses
6,826
7,200
7,400
7,453
626
7,700
247
FY2026 capital investment plan
Molds for new products, measuring equipment and jigs, products for demonstration, production equipment,
and introduction of new CRM1
PLM/MES2 systems
Capital Investments: approx. ¥3.0 bn
Tsurugashima Production Center
Total investments: approx. ¥11.0 bn
FY22: ¥0.3 bn, FY23: ¥0.5 bn, FY24: ¥0.9 bn
FY25: ¥0.9 bn, FY26 : ¥0.3 bn ~
PLM: Started operation in Sep. 2025
MES: Started operation in Nov. 2025
FY22: ¥2.3 bn (Acquisition of the site)
~FY24: ¥4.1 bn, FY25: ¥2.9 bn
(Building and facilities)
FY26: ¥0.3 bn (Facilities) ~
Construction: Started in July 2024
Completed in Oct. 2025
Operation: Started in Mar. 2026
*1 CRM: Customer Relationship Management including Sales Force Automation function *2 PLM: Product Life-cycle Management, MES: Manufacturing Execution System
© Copyright NIHON KOHDEN CORPORATION All Rights Reserved
16
2
Forecast for FY2026
© Copyright NIHON KOHDEN CORPORATION All Rights Reserved
17
- Business Environment
The global economic outlook is expected to remain uncertain due to geopolitical risks and policy
trends in the U.S., as well as higher oil prices and difficulties in procuring parts and components
Japan
Securing medical staff and promoting reforms in
their work style
Medical service fees will rise by 3.09% in June 2026.
Responses to price and wage inflation. Urgent measures to
address deterioration of medical institutions’ business environment
Transformation to a more efficient, higherquality healthcare system. Establishing
integrated community care systems
Funds for securing comprehensive medical and long-term care in
the community: FY2026 budget ¥96 bn for medical care
Deterioration of medical institutions' business due
to price and wage inflation
Subsidy program for improving operational efficiency and
workplace environment by introducing ICT in medical institutions
and for addressing price and wage inflation
International
U.S.
• Future policy trends such as tariffs and proposed
budget cuts to public health insurance should be
monitored carefully
Emerging countries
• China: Enforced new standards and preferential
treatment for domestically produced products
• Middle East & Africa, Southeast Asia: Concerns
about the impact of conflicts in the Middle East
• Moves to protectionism and tightening of laws and
regulatory requirements for medical devices in
each country
© Copyright NIHON KOHDEN CORPORATION All Rights Reserved
18
- Forecast for FY2026
FY2025
FY2026
YoY
Actual
Forecast
(%)
Net sales
235,099
232,500
Domestic sales
144,406
133,500
Overseas sales
Gross profit
90,693
121,726
99,000
129,000
9.2
6.0
51.8%
55.5%
102,981
105,500
43.8%
45.4%
Operating income
18,745
23,500
(Operating margin)
8.0%
10.1%
Ordinary income
22,544
23,500
4.2
Income attributable to
owners of parent
14,513
15,000
3.4
Overseas sales ratio
38.6%
42.6%
(Gross margin)
SG&A expenses
(SG&A ratio)
Average exchange rate (yen)
1 USD/1 EUR
150.5/174.2
150/175
2.4
(Amounts of less than ¥1 million are rounded down)
+8% on a comparable basis excluding
impact of discontinuation of Abbott
products and consolidation of DOWELL
+9% on a local currency basis
Overseas sales by region
FY2025
Actual
FY2026
Forecast
North America
49,808
56,300
13.0
Latin America
5,613
6,200
10.4
Europe
13,649
13,800
1.1
Asia & Other
21,621
22,700
5.0
Total
90,693
99,000
9.2
25.4
YoY
(%)
© Copyright NIHON KOHDEN CORPORATION All Rights Reserved
19
- Highlights of Forecast for FY2026
Domestic
sales
[ down
¥10.9 bn ]
Net sales
[ down ¥2.5 bn YoY ]
Overseas
sales
[ up ¥8.4 bn ]
Operating income
[ up ¥4.8 bn ]
Ordinary income
[ up ¥1.0 bn ]
Net income
• +8% on a comparable basis excluding impact of discontinuation of
Abbott products and consolidation of DOWELL
Focusing on providing in-house products, consumables, and services
Abbott products: Decline by ¥21.3 bn to ¥2.3 bn from ¥23.6 bn
Hospital / clinic markets: Growth by ¥9.7 bn by focusing on ventilators and DHS products
AEDs: Growth by ¥0.7 bn as inventory adjustment at distributors was settled down
• +9% on a yen basis, +9% on a local currency basis
• Aiming at sales growth in all regions
North America: Focusing on sales recovery of patient monitors, Sales growth of
ventilators and neurology products
Latin America, India: Steady demand for medical equipment
Middle East & Africa, Southeast Asia: Concerns about the impact of conflicts in the
Middle East
• Gross margin is expected to improve supported by a favorable product mix, while sales will
decrease due to the discontinuation of Abbott products
• SG&A expenses are expected to increase due to wage increases and higher depreciation
related to investments in internal IT systems
• Continuing implementation of measures in three key areas of the reform of the profit structure
[ up ¥0.5 bn ]
*The Company incorporates negative factors worth ¥1.8 bn for sales and ¥1.2 bn for operating income caused by conflicts in the
Middle East into its full-year forecast, reflecting anticipated lower sales and higher shipping costs, respectively.
© Copyright NIHON KOHDEN CORPORATION All Rights Reserved
20
(Ref.) Analysis of FY2026 Forecast
(¥100 million)
Sales
2,500
2,400
2,300
2,200
2,100
2,000
1,900
1,800
1,700
1,600
1,500
FY2025
2,350
Increase in sales Increase in
AED sales
in Japanese
in Japan
hospital and
+7
clinic market
¥23.6bn
Currency
bn
¥2.3
+97
Actual increase
effect
Impact
of
Abbott
in overseas sales
-1
DOWELL:
products
+85
more than 10%
-213
FY2026
2,325
AED unit sales in Japan
FY25: 57,900 units FY26: 61,400 units
Operating Income
300
250
200
150
100
50
0
FY2025
187
Increase in
Impact of
selling prices other SG&A Increase in
Depreciation
such as
and cost
Impact of
and R&D
Personnel
+78
increase/decrease
expenses
expenses
in sales
-16
-15
+2
Impact of
Including negative impact of discontinuation
of Abbott products and positive impact of
consolidation of DOWELL
DOWELL:
more than 50%
Currency
effect
-1
FY2026
235
Benefit from
the reform of
the profit
structure
Approx.
1.5%pt
© Copyright NIHON KOHDEN CORPORATION All Rights Reserved
21
(Ref.) Consolidated Forecast for FY2026 by Product Category /
Effect of Exchange Rates
FY2025
Actual
FY2026
Forecast
Composition
ratio (%)
YoY (Amounts of less than ¥1 million are rounded down)
(%)
Physiological Measuring Equipment
53,636
41,200
17.7 - 23.2 +6% excl. impact of discontinuation of Abbott products
Patient Monitors
84,258
92,300
39.7
9.5 +8% excl. impact of consolidation of DOWELL
Treatment Equipment
56,286
54,900
23.6
- 2.5 +10% excl. impact of discontinuation of Abbott products
Other Medical Equipment
40,918
44,100
19.0
7.8
Total
235,099
232,500
100.0
Medical Devices
115,996
126,500
54.4
9.1
Consumables and Services
119,103
106,000
45.6 - 11.0 +7% excl. impact of discontinuation of Abbott products
(Reference)
Estimated Exchange Rate Fluctuations for Full Fiscal Year
Sales
US Dollar
EURO
Operating
Income
0.52 bn yen 0.18 bn yen
0.06 bn yen 0.02 bn yen
© Copyright NIHON KOHDEN CORPORATION All Rights Reserved
22
3
Business Strategy
© Copyright NIHON KOHDEN CORPORATION All Rights Reserved
23
Long-term Vision and Three-year Business Plan
We contribute to the world by fighting disease and
improving health with advanced technology, and create
a fulfilling life for our employees.
Management
Philosophy
Long-term
Vision
Three-year
Business Plan
Core Values
Create a better future for people and healthcare
by solving global medical issues
Targets for
FY2029
Operating
Margin
15%
Overseas
Sales Ratio
45%
Apr. 2027 - Mar. 2030
PhaseⅢ: Realize BEACON 2030
Apr. 2024 - Mar. 2027
PhaseⅡ: Invest for growth
Apr. 2021 - Mar. 2024
PhaseⅠ: Strengthen foundation
Core values are shared by Nihon Kohden staff worldwide, helping to
connect them and contributing to the promotion of our Management
Philosophy, Long-term Vision, and Three-year Business Plan.
Integrity / Humbleness / Diversity / Initiative / Customer Centric / Goal Oriented / Creativity
© Copyright NIHON KOHDEN CORPORATION All Rights Reserved
24
Three Transformation for BEACON 2030
1
• Promote overseas business strategies emphasizing high growth and improved profitability
• Develop sophisticated value propositions and cultivate new businesses areas in domestic business
• Create new business models by utilizing our global business foundation
2
• Create a business model that helps solve medical issues
• Realize a value creation model that creates value from data, by utilizing our core strength in Human
Machine Interface* technology
3
• Establish an organizational and governance system in line with our corporate strategy
• Establish a development, production and sales system based on Global Supply Chain Management
• Strengthen global business deployment capabilities by establishing a Center of Excellence
- Human machine interface is the user interface that connects human and machine. For Nihon Kohden, this refers to sensor technology, signal processing technology,
and data analysis technology.
© Copyright NIHON KOHDEN CORPORATION All Rights Reserved
25
3 Indicators and 6 Key Measures
Implement the reform of the profit structure and make investments in growth areas,
and accelerate our transformation into a global MedTech company
- Growth
Sales CAGR
- Profitability
Operating income margin
- Capital efficiency
in FY2026
in FY2026
FY2023 - FY2026
5%
ROE
15%
12%
Enhance product
competitiveness
Implement the reform
of the profit structure
Introduce Nihon Kohden’s own
ROIC formula
Focus on growth of
North America Business
Advance global supply chain
management
Reduce cash conversion cycle
Practice of Sustainability Management
Medical
issues
Environmental
issues
Social
issues
© Copyright NIHON KOHDEN CORPORATION All Rights Reserved
26
Review of the 2nd year - 6 Key Measures
- Growth
Sales growth 4.3%
in FY2025
- Profitability
OPM 8.0%
in FY2025
- Capital efficiency
ROE 8.1%
in FY2025
Enhance product
competitiveness
Implement the reform
of the profit structure
Introduce Nihon Kohden’s own
ROIC formula
Launched new high-value-added
products and services
Achieved YoY 220 bps improvement
in operating margin in FY25
Accelerating implementation of
measures in three key areas toward
500 bps improvement in operating
margin (FY26 vs FY23)
Visualizing NK’s own ROIC in each
R&D, production, sales, and
administration division, and
providing feedback for improvement
in profitability and efficiency
Promoting monitoring of ROIC/CCC
at North American subsidiaries
Focus on growth of
North America Business
Advance global supply chain
management
Reduce cash conversion cycle
Significant growth in sales of
ventilators through continuing to
sign new contracts with major
IDNs/GPOs*1
Achieved double-digit sales growth
and recorded operating income
Started production of transport
monitors at Defibtech
Started operation of PLM/MES
systems*2
Started operations at Tsurugashima
Production Center
Preparing for production of medical
equipment in India
Increased inventories of finished
goods temporarily in preparation for
starting operation of PLM/MES
systems and Tsurugashima
Production Center
CCC remained at 215 days
compared to 225 days in FY24 and
forecast of 190 days
• Fully automatic AED • Transmitters
• On-site alarm analytics software
• Admission and discharge
management software
• AlarmSense alarm solution
*1 IDN: Integrated Delivery Network, GPO: Group Purchase Organization
*2 PLM: Product Life-cycle Management, MES: Manufacturing Execution System
© Copyright NIHON KOHDEN CORPORATION All Rights Reserved
27
Target and Forecast for the Last Year of
FY2023 Actual FY2026 Target FY2026 Forecast CAGR
Net sales
¥221.9 bn
¥256.0 bn
¥232.5 bn
+2%
Domestic sales
Overseas sales
¥142.3 bn
¥157.0 bn
¥133.5 bn
-2%
¥79.6 bn (35.9%) ¥99.0 bn (38.7%) ¥99.0 bn (42.6%)
+8%
(Overseas sales ratio)
Consumables and
services sales ratio
47.9%
50%
In-house sales ratio
73.5%
75%
Solution sales ratio
11%
11%
Gross profit margin
50.2%
53%
Operating income
¥19.5 bn (8.8%)
Income attributable
to owners of parent
¥17.0 bn
¥25.0 bn
ROIC
4.0%
12%
ROE
9.8%
12%
(Operating income margin)
Average exchange rate (yen)
1 USD/1 EUR
143.9/156.8
45.6%
55.5%
¥38.5 bn (15%) ¥23.5 bn (10.1%)
140/150
- Solution business, software/program, and maintenance services are included.
+6%
¥15.0 bn
Sales by region
Net sales
150/175
FY23 Actual
FY26 Target FY26 Forecast
CAGR
¥142.3 bn
¥37.0 bn
¥6.0 bn
¥13.1 bn
¥23.4 bn
¥157.0 bn
¥50.0 bn
¥6.0 bn
¥14.0 bn
¥29.0 bn
¥133.5 bn
¥56.3 bn
¥6.2 bn
¥13.8 bn
¥22.7 bn
-2%
+15%
© Copyright NIHON KOHDEN CORPORATION All Rights Reserved
28
Japan
North America
Latin America
Europe
Asia & Other
+1%
+2%
-1%
Difference b/w Target and Forecast in FY2026
Domestic
sales
[ down ¥23.5 bn ]
Net sales
[ down ¥23.5 bn ]
Overseas
sales
[ flat ]
down ¥6.3 bn
in actual sales
/ up ¥6.3 bn
in currency effect
Operating
Income
[ down ¥15 bn ]
Abbott products:
Down ¥24.8 bn
Locally purchased products:
Down ¥2.9 bn
In-house products:
Up ¥4.2 bn
Contributing to
gross margin
improvement
including consolidation of DOWELL and raising selling prices
Latin America, Southeast Asia, India: Generally in line with plan
China: Prolonged economic slowdown and anti-corruption campaign
⇒ Promoting partnerships with local companies
Middle East & Africa, Europe:
Geopolitical risks and delays in complying with laws and regulations
⇒ Generally completed complying with laws and regulations,
The impact of conflicts in the Middle East should be monitored
North America:
Customers are cautious about decision-making in patient monitor negotiations
⇒ Recovery trend in orders, Focusing on delivery and installation.
Creating synergies with Ad-Tech
• Gross profit due to shortfall in sales:
• COGS including tariffs / higher raw material prices:
• SG&A expenses including wage and price inflation:
• Costs related to M&A:
Down ¥7.1 bn
Up ¥4.6 bn
Up ¥1.0 bn
Up ¥4.1 bn
Steady sales growth
Continuing the reform
of the profit structure
© Copyright NIHON KOHDEN CORPORATION All Rights Reserved
29
Difference b/w Target and Forecast in FY2026
Sales
(¥100 million)
Target
2,560
Discontinuation of Locally
Abbott products purchased
products
-248
-29
Domestic
sales
+42
• Consolidation
of DOWELL
• Higher selling
prices
Japan -235
Operating Income
Target
385
Increase in
in-house products
in Japan
+21
Discontinuation
of Abbott
products
-55
Overseas
sales
shortfall
-37
Gross profit -117
Actual
overseas
sales
Currency
effect
-63
China
-50
Middle East
& Africa
-29
Europe
-18
+63
Forecast
2,325
International ±0
Increase in Increase in
SG&A
COGS
expenses
-46
-10
• Tariffs
• Wage
• Higher raw
increases
material prices • Inflation
M&A costs
-41
Currency
effect
+18
Forecast
235
SG&A expenses +51
© Copyright NIHON KOHDEN CORPORATION All Rights Reserved
30
Growth
Enhance product competitiveness
New products and services in FY2025/FY2026
Contributing to easing
medical staff workload
Improving hospital bed occupancy rate
Reducing length of hospital stays
Optimizing hospital management
Improving economics of medical care
Solution Business (ITS+DHS)
On-site alarm analytics software
• Analyzing real-time
alarm status and
causes for each patient
Launched in Japan
in FY2025 4Q
AlarmSense alarm solutions
Launched in the U.S. in FY2025 2Q
Planned to launch in Europe in FY2026
• Analyzing and displaying
alarm trends across the
hospital
• Reducing alarm fatigue for
medical
staff for each patient on-site
Visualizing
and and
analyzing
real-time alarm status
and causes
Admission
discharge
management software
• Automatically acquiring, Launched in Japan
in FY2025 4Q
aggregating, and
visualizing information
necessary for hospital bed
management, including
information on admission,
discharge, and transfer
Patient Monitoring
Business
Transmitters
ZS-730/720P
Launched in Japan
in FY2025 3Q
Next generation
central monitor
Planned to launch in
the U.S in FY2026
© Copyright NIHON KOHDEN CORPORATION All Rights Reserved
31
Growth
Focus on stable growth in Japan
Market
growth rate
Approx.1~2%
Phase II
sales target
CAGR 3%
(¥100 million)
FY2016 - FY2025
10-year sales
CAGR
In-house products +4.1%
+1.6%
(Ratio of consumables and services: 55%, FY25)
Medical devices +2.5%
Consumables & services +5.6%
Purchased
products
+1.8%
Locally
purchased
products
-20%
■In-house medical devices ■ In-house consumables and services
■Purchased products ■Locally purchased products
NEW!
Abbott products
¥23.6 bn → ¥2.3 bn
+8% YoY
excluding impact of
Abbott products and
consolidation of DOWELL
//
Medical devices
• Maintaining and expanding
higher market share of
each product by capturing
replacement demand
steadily
Established
Domestic Business Headquarters
Strengthening
domestic
business
structure
Consumables and services
• Improving CX* and medical
safety by promoting genuine
consumables and expanding
maintenance services plans
Promoting
crossdepartmental
transformation
Creating
new
growth
business
Solution Business (ITS+DHS)
• Promoting medical DX* and
contributing to improving quality and
economy of medical care
• Consolidated DOWELL as a subsidiary
(Feb. 2026)
[ Transfer of operations for Abbott products ] Completed approx. 65% as of Mar. 31, 2026 and planned to complete approx. 90% as of Sep. 30, 2026
- CX: Customer experience, DX: Digital transformation.
© Copyright NIHON KOHDEN CORPORATION All Rights Reserved
32
Growth
Focus on higher growth in North America
Market
growth rate
mid-single digit
Phase II
sales target
CAGR 11%
FY2016 - FY2025
10-year sales
CAGR
+13%
Treatment
Equipment
+20%
(¥100 million) ■Physiological Measuring Equipment ■Patient Monitors
■Treatment Equipment ■Other Medical Equipment
Physiological
Measuring
Equipment*
+14%
Patient Monitors
+10%
- Consolidated Ad-Tech in FY2025
No.1 market share for
mask-type ventilator
40% or more
+13% YoY on a local
FY2025
DHS products
= 16%
(Sales composition
in Patient Monitors)
in 2025 (Company’s estimate)
currency basis
Increasing number of
business negotiations for
intubated-type ventilators
//
Ventilators
• Signing new contracts
with major IDNs/GPOs*
• Expanding market
share
Patient Monitors
• Achieving differentiation by enhancing
DHS* products
• Expanding market share
• Proposals to facilities that have
installed our ventilators
Digital Health Platform
RemoteSense
AlarmSense
Physiological Measuring
Equipment
• Creating synergies b/w Neurology &
Ad-Tech products with high market share
• Increasing demand for home sleep
recorders
- IDN: Integrated Delivery Network, GPO: Group Purchase Organization, DHS: Digital Health Solutions
© Copyright NIHON KOHDEN CORPORATION All Rights Reserved
33
Profitability
FY2026
Target
Implement the reform of the profit structure
OPM
improvement
5%pt
Improvement: 80 bps in FY2024 300 bps (YoY +220 bps) in FY2025
Expected 450 bps (YoY +150 bps) in FY2026
Continuing to implement measures in three key areas to improve profitability
Target
Reform of profit structure
FY2023
OPM
8.8%
Cost increases
Sales growth and
-4.9%
optimization of
inventories
+6.1%
Product mix
Apx. +2%
Productivity
Apx. +2%
+Increase of in-house products +Wage increases
in Japan
- Discontinuation of
- Discontinuation of Abbott
Abbott products
products
- Career Change
- Overseas sales shortfall
Support Program
- Increase in COGS
Forecast
FY2023
OPM
8.8%
Sales growth /
changes in
COGS ratio
+2.1%
Cost increases
-5.3%
Supply chain
Apx. +1%
FY2026
OPM
Target
15%
+Restraining of cost
increase pressure
- Delay in implementation
of Value Engineering
measures
Product mix
Apx. +2%
Productivity
Apx. +2%
Supply chain
Apx. +0.5%
FY2026
OPM
Forecast
10.1%
© Copyright NIHON KOHDEN CORPORATION All Rights Reserved
34
Profitability
FY2026
Target
Implement the reform of the profit structure
OPM
improvement
5%pt
Area
Measures in FY2026
Theme
Details of measures
Sale pricing
Reviewing pricing policies both in Japan and
overseas
Review of product
line-up
Reviewing and optimizing the number of
products
Increasing in-house sales ratio
Product mix
Productivity
Improvement: 80 bps in FY2024 300 bps (YoY +220 bps) in FY2025
Expected 450 bps (YoY +150 bps) in FY2026
Continuing to implement measures in three key areas to improve profitability
Reviewing pricing policies such as raising selling prices
in Japan and internationally
Reviewing product line-up
Improving operational efficiency by introducing
Improving personnel
generative AI: 1.4 mil hours per year
productivity,
Focusing on core jobs and reallocating
resources: 900 k hours per year
including by utilizing
Reducing the increase of headcount and
generative AI
overtime hours
Reducing other
expenses
Reducing infrastructure costs such as utility
costs, rent, and communication expenses,
and reviewing traveling costs
Optimizing parts
Supply chain procurement
Refining price negotiations with suppliers
Promoting Value Analysis/Value Engineering
Restraining increase of headcount
through improving productivity by utilizing generative AI
Improved operational efficiency:
380k hours/year in FY24 ⇒ 1,990k hours/year in FY25
Target: over 2.5 mil hours/year in FY26
Introducing new CRM* / Enhancing call center functions
to improve productivity
Reviewing license fees, contracts for company vehicles and
parking facilities
Continuing price negotiations and reviewing suppliers
under inflation
Promoting Value Engineering at factories in Japan, U.S.,
and China
- CRM: Customer Relationship Management including Sales Force Automation function
© Copyright NIHON KOHDEN CORPORATION All Rights Reserved
35
Capital
efficiency
Introduce Nihon Kohden’s own ROIC formula
Visualizing NK’s own ROIC in each R&D, production, sales, and administration division,
Providing feedback for improvement in profitability and efficiency
Promoting monitoring of ROIC and CCC at subsidiaries in North America
Cost of capital: approx. 8%, calculated by CAPM and WACC
Adopted NPV and IRR as investment decision criteria, Target IRR of 12% in Phase II.
Investment decisions are made based on business strategies and the Three-year Business Plan.
The Board of Directors verifies the progress and effectiveness of investment projects beyond a certain amount every year
Consolidated ROIC = NOPAT ÷ Invested capital
- Invested capital・・・interest-bearing liabilities +shareholders’ equity
Nihon Kohden’s own ROIC calculation formula
Operating income
Invested capital (future investment* + accounts receivable
- inventory + property, plant and equipment - accounts payable)
- R&D costs and personnel expenses in last three years
Reduce cash conversion cycle
Securing inventories of parts and
components to ensure stable supply of
in-house products and consumables,
in response to shortages of memory
components, higher oil prices, and
procurement difficulties
FY2026 target
~195 days
Consolidated ROIC / NK’s own ROIC
15%
10%
5%
7.8%
6.8%
8.0%
4.0%
0%
FY2022
FY2023
6.4%
6.3%
6.4%
5.6%
FY2024
FY2025
7.4%
Consolidated ROIC
Nihon Kohden’s own
ROIC
FY2026
Forecast
Phase II target
~175 days
Mid-term target
~150 days
© Copyright NIHON KOHDEN CORPORATION All Rights Reserved
36
Capital Policy
Make investments for future business expansion and enhance shareholder returns
as well as securing a sound financial foundation.
1)
Investment
necessary for
future business
expansion
• R&D investments in patient monitors, ventilators, and Digital Health Solutions
• Capital investments for establishing a new plant in Tsurugashima, promoting corporate
digital transformation such as PLM/MES systems and generative AI,
and enhancing global supply chain management
• Consolidated Ad-Tech as a wholly owned subsidiary, DOWELL as a subsidiary
Phase II :
R&D investments Apx. ¥23.5 bn
Capital investments Apx. ¥25.0 bn
Growth investments
M&A
¥30 bn or more
-
Enhancement of
shareholder
returns
Phase II :
¥28 bn or more
*Considering additional shareholder
returns depending on the progress
of future investment plans
-
Sound financial
foundation
R&D
Investments
Capital
Investments
Human
Resource
Development
M&A and
Alliance
Dividends
Number of treasury
stock:
Increase dividends
in a stable
manner in
4,084k
shares
line with growth in business performance
Share
buyback
Consider in a flexible manner, taking into account
comprehensively our future business deployment,
investment plans, retained earnings, and stock price level
(Consolidated total return ratio: 70%)
Target: Consolidated Total Return Ratio of 35% or more
Number of treasury stock:
10,980k shares including ESOP
Full-year dividends forecasts:
FY25: 32 yen (Consolidated dividend payout ratio: 35.9%)
FY26: 33 yen (Consolidated dividend payout ratio: 35.4%)
Share buybacks:
FY25: ¥5.0 bn
(6.4% as of end March 2026)
Maintain a strong financial foundation to ensure a stable supply of medical equipment
© Copyright NIHON KOHDEN CORPORATION All Rights Reserved
37
Cash allocation policy and progress
Cash + Debt
Cash + Debt
FY2021-FY2023
Operating
cash flow
FY2024-FY2026
Operating cash
flow
¥80 bn
Phase II Plan
Growth investments /
M&A:
¥30.0 bn or more
Capital investments:
Apx. ¥25.0 bn
or more
¥38.7 bn
Shareholder returns:
¥28.0 bn or more
(Ref.) R&D investment:
Apx. ¥23.5 bn
Fundraising
policy
Necessary cash
and deposits
Progress in
FY2024-FY2025
Plan in
FY2026
Cash
Debt
¥26.0 bn
Operating
cash flow
¥36.3 bn
Growth
investments
¥24.6 bn
Exploring areas which
have synergies with
existing businesses
Capital
investments
¥17.3 bn
¥6.0 bn
Shareholder
¥5.3 bn
returns
¥25.3 bn
¥14.2 bn
¥7.7 bn
• Using its own funds as the Group’s main source of working capital and capital expenditure.
• Considering borrowing as an effective means of raising funds, when fundraising becomes necessary, such as for M&A
and new businesses and optimizing the weighted average cost of capital, which also takes into account the cost of debt.
• The level of cash and deposits on hand necessary for stable operations is approx. three months of monthly sales.
© Copyright NIHON KOHDEN CORPORATION All Rights Reserved
38
Disclaimer:
The contents of this document are based on the Company’s best judgments
at the time it was prepared and do not constitute a guarantee or promise
that the Company will achieve its numerical targets or implement the
measures described therein.
Information on products (including products under development) in this
document is not intended to make any advertisement or promotion.
These documents have been translated from Japanese originals for
reference purposes only. In the event of any discrepancy between these
translated documents and the Japanese originals, the originals shall prevail.
© Copyright NIHON KOHDEN CORPORATION All Rights Reserved






 Bedside monitors, CSM-1000 series, Lifescope G5 (CSM-1501/1502)
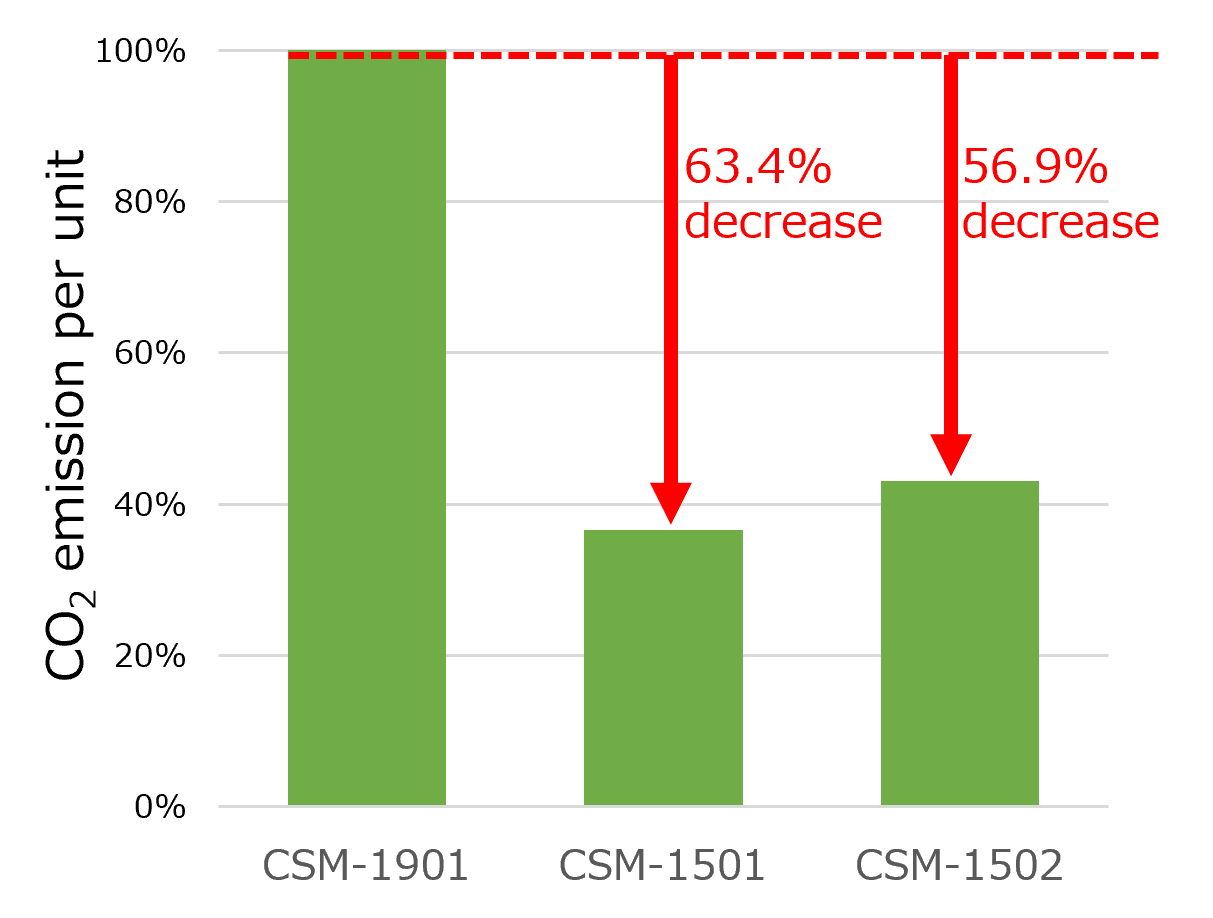 CO2 emission CSM-1501 63.4% reduction CSM-1502 56.9% reductionAnnual electrical energy consumption CSM-1501 74.7% reduction (Reduced by 492.2 kWh) CSM-1502 68.0% reduction (Reduced by 447.7 kWh)(Compared to the existing model, the CSM-1901.)
 Bedside monitors, CSM-1000 series, Lifescope G7 (CSM-1701/1702)
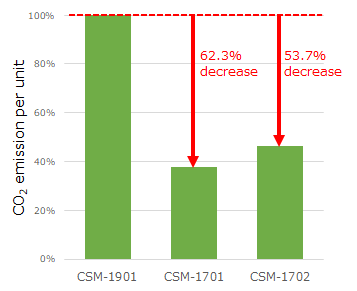 CO2 emission CSM-1701 56.2% reduction* CSM-1702 51.4% reduction*Annual electrical energy consumption CSM-1701 62.3% reduction (Reduced by 410.4 kWh) CSM-1702 52.9% reduction (Reduced by 348.3 kWh)(Compared to the existing model, the CSM-1901.)* The data has been recalculated and corrected.

 Automated external defibrillator, AED-3200 series, Cardiolife (AED-3200)
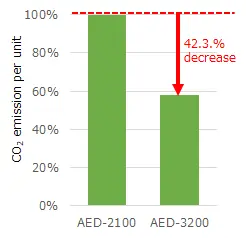 CO2 emission 42.3% reduction*Annual electrical energy consumption decreases slightly, as standby power accounts for most of the electricity consumption.(Compared to the existing model, the AED-2100.)* The data has been recalculated and corrected.
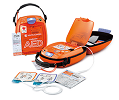 Automated external defibrillator, AED-3100 series, Cardiolife (AED-3100)
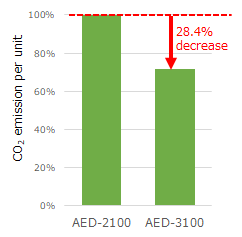 CO2 emission 28.4% reductionAnnual electrical energy consumption decreases slightly, as standby power accounts for most of the electricity consumption.(Compared to the existing model, the AED-2100.)
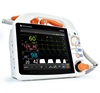 Defibrillator, TEC-1000 series, Cardiolife (TEC-1031)
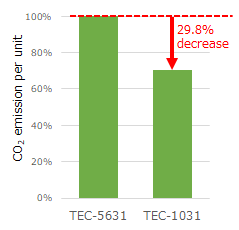 CO2 emission 29.8% reductionAnnual electrical energy consumption 52.7% reduction (Reduced by 38.6 kWh)(Compared to the existing model, the TEC-5631.)

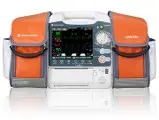 Defibrillator, cardiolife EMS, EMS-1052
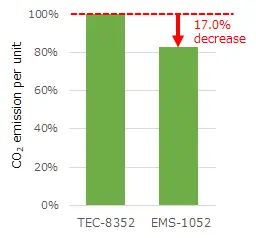 CO2 emission 17.0% reduction Annual electrical energy consumption 79.4% reduction (Reduced by 29.6kWh) (Compared to the existing model, the TEC-8352)
 Telemetry systems, WEP-1000 series (WEP-1400, Up to 8-patient monitoring)
 CO2 emission 22.8% reduction Annual electrical energy consumption 12.3% reduction (Reduced by 42.8 kWh) (Compared to the existing model, the WEP-5258.)
 Transmitters, ZS-720P
 CO2 emission 13.6% reductionAnnual battery consumption (AA alkaline primary battery) 8.3% reduction (Reduced by four batteries)(Compared to the existing model, the ZS-620.)
 Transmitters, ZS-730P
 CO2 emission 10.8% reductionAnnual battery consumption (AA alkaline primary battery) 41.8% reduction (Reduced by 46 batteries)(Compared to the existing model, the ZS-630.)

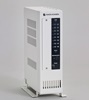 Wireless Central Unit, ORG-2100
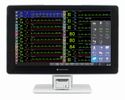 Central monitor, CNS-2101
 Mobile AED, AED-M100 series (AED-M100)
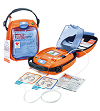 Automated external defibrillator, AED-3100 series, Cardiolife (AED-3150)
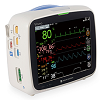 Bedside monitor, PVM-4000 series (PVM-4731/4733/4751/4753/4761/4763)
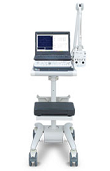 EMG/EP measuring system, MEB-9000 series (MEB-9600)
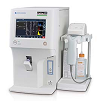 Automated hematology analyzer, MEK-1300 series Celltac α (MEK-1301/1302)
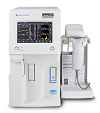 Automated hematology and ESR analyzer, MEK-1303, Celltac α+
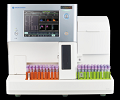 Automated hematology analyzer, MEK-9100, Celltac G
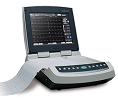 Electrocardiograph, ECG-2400 series (ECG-2450/2460)
 Transmitter, ZS-630P
 Transmitter, ZS-640P
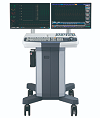 Polygraphs for cath lab, RMC-5000
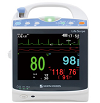 Bedside/transport monitors, BSM-1700 series, Life Scope PT (BSM-1733/1753/1763/1773)
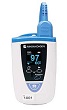 Transmitter, ZS-611P
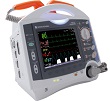 Defibrillator, TEC-8300 series, Cardiolife (TEC-8321/8322/8332/8342/8352)