|
Japan Aviation Electronics Industry, Limited manufactures and sells connectors, interface solution equipment, and electronic components for aerospace and defense applications. The company operates through four main segments: Connectors, Interface Solutions, Aerospace, and Other. The Connectors segment produces products for mobile devices, automotive systems including ADAS and ECU, industrial machinery, and gaming equipment. The Interface Solutions segment focuses on automotive touch panels and industrial or medical touch input monitors. The Aerospace segment supplies flight control devices, inertial navigation systems, and radio altimeters for defense and space, as well as vibration control equipment for semiconductor manufacturing and sensors for oilfield drilling. The company serves global markets through a network of subsidiaries and affiliates, including JAE Oregon, JAE Tijuana, JAE Taiwan, JAE Philippines, JAE Wuxi, JAE Hong Kong, JAE Wujiang, JAE Electronics, JAE Korea, JAE Shanghai, JAE Europe, and JAE Singapore. Domestic manufacturing and sales are supported by subsidiaries such as Hirosaki Aviation Electronics, Yamagata Aviation Electronics, Shinshu Aviation Electronics, Fuji Aviation Electronics, and JAE Yashiro. The group also provides logistics services through Nikko Logistics. Summarised from the annual report, fiscal year ended Mar 2026 |
Industry Electronic Components | Homepage jae.com |
| Sector Technology | IR page jae.com | |
|
Tags
connectors, aerospace electronics, automotive electronics, touch panels, defense electronics, industrial automation, semiconductor equipment, oilfield sensors, inertial navigation, flight control, Hirosaki Aviation Electronics, Yamagata Aviation Electronics, JAE Oregon Inc., JAE Tijuana S.A. de C.V., JAE Taiwan Ltd., JAE Philippines Inc., JAE Wuxi Co. Ltd., JAE Hong Kong Ltd., JAE Wujiang Co. Ltd., Fuji Aviation Electronics, Meiyu Giken, JAE Yashiro, JAE Electronics Inc., JAE Korea Inc., JAE Shanghai Co. Ltd., JAE Europe Ltd., JAE Singapore Pte Ltd., Shinshu Aviation Electronics, Nikko Logistics
|
Press page jae.com/releases |
Metrics
| Valuation | |
|---|---|
| Market cap | ¥ 174.932B |
| Market cap (USD) | $ 1.093B |
| P/E | 31.39 |
| PEG | — |
| P/BV | 1.22 |
| P/S | 0.73 |
| P/OCF | 14.58 |
| P/FCF | -15.32 |
| Dividend yield | 2.4% |
| Turnover / mcap | — |
| Returns | |
|---|---|
| ROE | 5.1% |
| ROI | 3.8% |
| ROIC | 3.3% |
| Profit margin | 3.1% |
| Growth | |
|---|---|
| Revenue growing | Yes |
| Profits growing | No |
| Revenue up 3y | No |
| Revenue up 5y | No |
| Earnings growth 3y (net profit CAGR) | -21.5% |
| Quality | |
|---|---|
| Profitable | Yes |
| Margin expanding | No |
| Buying back stock | Yes |
| Diluting (TTM) | No |
| Debt/Equity | — |
| Podcast bulls (TTM) | Sign up |
| Podcast bears (TTM) | Sign up |
| Podcast sentiment (TTM) | Sign up |
| Podcast sentiment % (TTM) | Sign up |
| News sentiment (TTM) | 18 |
| Quality score | -38.9% |
| Insiders | |
|---|---|
| Buys, 1w | Sign up |
| Buys, 1m | Sign up |
| Buys, 1y | Sign up |
| Sells, 1w | Sign up |
| Sells, 1m | Sign up |
| Sells, 1y | Sign up |
Sign up to see this company's insider trades
| Figure | FY 2026 | FY 2025 | FY 2024 | FY 2023 | FY 2022 | FY 2021 | FY 2020 | FY 2019 | FY 2018 | FY 2017 | FY 2016 | FY 2015 | FY 2014 | FY 2013 |
|---|---|---|---|---|---|---|---|---|---|---|---|---|---|---|
| Revenue | 227.872B | 221.644B | 225.781B | 235.864B | 225.079B | 209.711B | 208.106B | 222.14B | 253.947B | 209.51B | 179.494B | 191.155B | 159.771B | 129.6B |
| Net profit | 7.069B | 11.592B | 12.245B | 14.639B | 14.325B | 5.692B | 11.141B | 13.508B | 12.936B | 6.736B | 12.515B | 15.764B | 10.622B | 5.063B |
| Free cash flow | -6.758B | 18.294B | 14.489B | 9.882B | 5.473B | 10.926B | 4.04B | 15.37B | 14.899B | -273M | 12.566B | — | — | — |
| Figure | FY 2026 | FY 2025 | FY 2024 | FY 2023 | FY 2022 | FY 2021 | FY 2020 | FY 2019 | FY 2018 | FY 2017 | FY 2016 | FY 2015 | FY 2014 | FY 2013 |
|---|---|---|---|---|---|---|---|---|---|---|---|---|---|---|
| Share price | 2.252K | 2.613K | 2.483K | 2.3K | 1.988K | 1.79K | 1.298K | 1.545K | 1.505K | 1.431K | 1.322K | 2.917K | 1.544K | 708.42 |
| Price performance 12m | -0.14 | 0.05 | 0.08 | 0.16 | 0.11 | 0.38 | -0.16 | 0.03 | 0.05 | 0.08 | -0.55 | 0.89 | 1.18 | — |
Filed figures
Lines the statements and their notes report beside the headline figures, read from the filings' XBRL as filed (no restatement applied), with figures computed from one filing's own lines. Cash-flow lines carry their cash direction: an outflow is negative. Each period links to its filing; a figure's period, report date and tag are in its tooltip.
| Figure | Mar 2017 | Mar 2018 | Mar 2019 | Mar 2020 | Mar 2021 | Mar 2022 | Mar 2023 | Mar 2024 | Mar 2025 | Mar 2026 |
|---|---|---|---|---|---|---|---|---|---|---|
| Balance sheet detail | ||||||||||
| Trade receivables (JPY) | 42.1B | 46.5B | 35.7B | 38.3B | 43.1B | 86.3B | 86B | 82.9B | 75.3B | 77.8B |
| ↳ YoY growth | +37.9% | +10.5% | -23.3% | +7.2% | +12.7% | +100.3% | -0.3% | -3.6% | -9.2% | +3.3% |
| ↳ 5y CAGR | +7.1% | +15.4% | +13.1% | +18.4% | +14.5% | +12.5% | ||||
| Borrowings, current (JPY) | 8.12B | 6.19B | 4.91B | 3.71B | 9.21B | 9.61B | 7.3B | 10.5B | 6B | 11B |
| Borrowings, non-current (JPY) | 11.5B | 7.26B | 4.34B | 2.63B | 15.4B | 7.8B | 2.5B | 54B | 31B | 30.8B |
| Cash and deposits (JPY) | 36.5B | 39.4B | 47.2B | 44.3B | 70.1B | 65.6B | 63B | 68.3B | 52.9B | 48.5B |
| Intangible assets (JPY) | 3.09B | 3.41B | 3.13B | 2.63B | 2.39B | 2.61B | 2.66B | 2.7B | 2.66B | 3.1B |
| Net debt (borrowings + leases - cash) (JPY) | -17B | -26B | -37.9B | -38B | -45.5B | -48.1B | -53.2B | -3.8B | -15.9B | -6.75B |
| Cash flow detail | ||||||||||
| Operating cash flow (JPY) | 21.4B | 32.4B | 37.6B | 28.6B | 29.1B | 24.4B | 32.5B | 34.9B | 36.3B | 17B |
| Purchases of property, plant and equipment (JPY) | -21.7B | -17.5B | -22.2B | -24.5B | -18.2B | -19B | -22.6B | -20.4B | -18B | -23.7B |
| Change in receivables (cash effect) (JPY) | -11.7B | -4.26B | 10.9B | -3.04B | -3.99B | 1.26B | 686M | 3.15B | 3.78B | -117M |
| Change in inventories (cash effect) (JPY) | -3.26B | -2.46B | 988M | -2.59B | -396M | -6.67B | 1.24B | 1.56B | -1.03B | -2.64B |
| Change in payables (cash effect) (JPY) | 8.93B | 1.05B | -9.17B | 4.77B | 1.84B | -7.27B | -2.52B | -2.29B | 1.57B | -2.9B |
| Dividends paid (cash effect) (JPY) | -2.73B | -2.73B | -2.73B | -3.64B | -2.73B | -2.73B | -4.1B | -4.56B | -4.04B | -4.04B |
| Share buybacks (cash effect) (JPY) | — | — | — | — | — | — | 0.00 | -62.1B | 0.00 | 0.00 |
| Interest paid (cash effect) (JPY) | -86M | -79M | -57M | -55M | -95M | -108M | -82M | -60M | -636M | -814M |
| Income taxes paid (cash effect) (JPY) | -1.57B | -2.52B | -5.67B | -3.27B | -3.47B | -3.05B | -5.05B | -4.86B | -3.52B | -3.8B |
| Operating cash flow before change in receivables (JPY) | 33.1B | 36.7B | 26.7B | 31.6B | 33.1B | 23.2B | 31.8B | 31.7B | 32.6B | 17.1B |
| Free cash flow (OCF - PPE - intangibles) (JPY) | -273M | 14.9B | 15.4B | 4.04B | 10.9B | 5.47B | 9.88B | 14.5B | 18.3B | -6.76B |
| Income detail | ||||||||||
| Research and development expense (JPY) | 9.25B | 9.61B | 10.3B | 11.2B | 11.1B | 12.4B | 12.1B | 10.9B | 11.3B | 12.1B |
| ↳ 5y CAGR | +4.0% | +6.0% | +4.8% | +1.1% | +0.2% | +1.6% | ||||
| Total comprehensive income (JPY) | 7.09B | 13.6B | 13.5B | 8.35B | 9B | 18.5B | 17.3B | 22B | 10.8B | 13.4B |
| Comprehensive income to owners (JPY) | 7.09B | 13.6B | 13.5B | 8.35B | 9B | 18.5B | 17.3B | 22B | 10.8B | 13.4B |
| Provision for credit losses (JPY) | 29M | 12M | 9M | 25M | -17M | -3M | 9M | 36M | 38M | 15M |
| Credit cost ratio (credit losses / average receivables) (%) | 0.1% | 0.0% | 0.0% | 0.1% | 0.0% | 0.0% | 0.0% | 0.0% | 0.0% | 0.0% |
| Reported | Jun 21, 2017 | Jun 21, 2018 | Jun 21, 2019 | Jun 19, 2020 | Jun 23, 2021 | Jun 23, 2022 | Jun 19, 2024 | Jun 19, 2024 | Jun 18, 2025 | Jun 19, 2026 |
Sign up to see institutional holdings
Sign UpPodcast Mentions
Sign up to see podcast mentions and sentiment
Sign UpTimely disclosures published on TDnet, newest first, titles as filed in Japanese. The link opens the disclosure on TDnet. Filings with EDINET (periodic reports, extraordinary reports, offerings, holding and buy-back reports), newest first, titles as filed in Japanese. The link opens the filing on EDINET. Press releases from the company's own website, newest first.
ページの先頭です。
ページ内を移動するためのリンク
本文(c)へ
ここから本文です。
新着情報
第1回 [九州] 半導体ワールド 半導体装置 開発展 出展のお知らせ
2026年11月2日
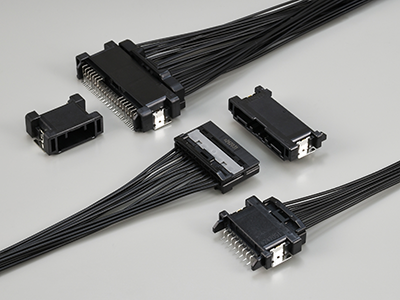
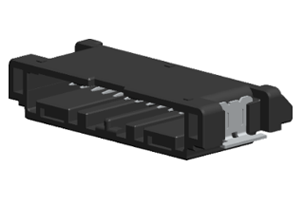
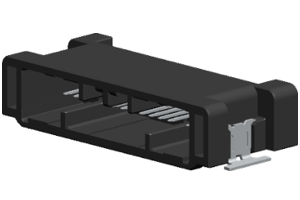
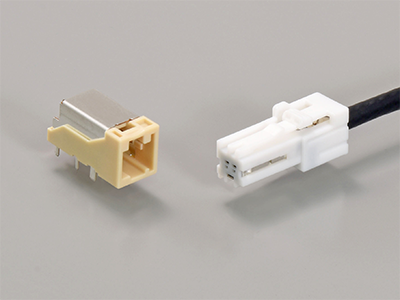
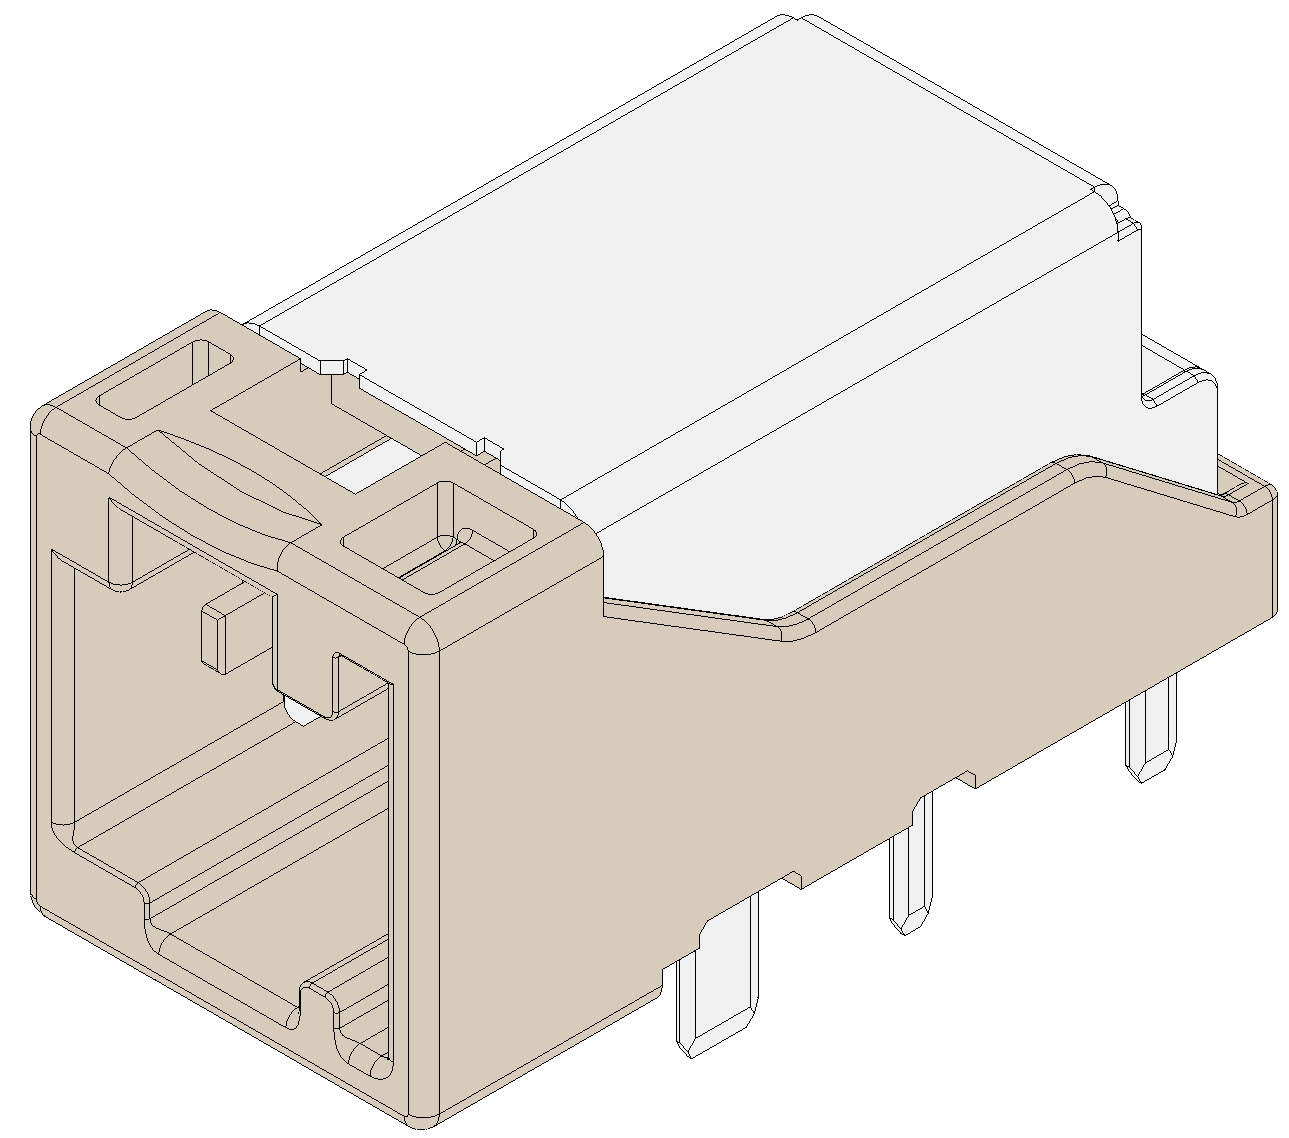
2026年12月2日(水)から開催される「「[九州] 半導体ワールド 半導体装置 開発展」に出展いたします。当社ブースでは、省配線を実現するSPEコネクタや、小型化・高密度化に貢献する各種コネクタの展示に加え、実際に製品に触れながら優れた操作性をご体感いただける嵌合デモをご用意しております。 さらに、真空環境に対応した高速リニアモータをはじめ、これらのモータに使用される高精度コイルや、高分解能・高安定性を実現した加速度計も展示いたします。 皆さまのご来場を心よりお待ちしております。
展示会名
第1回 [九州] 半導体ワールド 半導体装置 開発展 別ウィンドウで開く

会期
2026年12月2日(水)~ 4日(金) 10:00~17:00
会場
マリンメッセ福岡
当社ブース
No. 4-55
入場
無料(全来場者事前登録入場制) ※入場にはオンラインでの登録が必要です 来場者事前登録はこちらから別ウィンドウで開く
見どころ
-
省配線を実現するSPEコネクタや、小型・高密度化に貢献する各種コネクタ
-
製品に触れながら操作性を体感できる嵌合デモ
-
真空環境対応の高速リニアモータ
-
高精度コイル技術
-
高分解能・高安定性を実現した加速度計
お問い合わせ
会社全般
Tel. 03-3780-2711 Fax. 03-3780-2733
この頁に記載されている内容は、発表日時点の情報です。 ご覧になった時点で、内容が変更になっている可能性がありますのであらかじめご了承ください。
新着情報


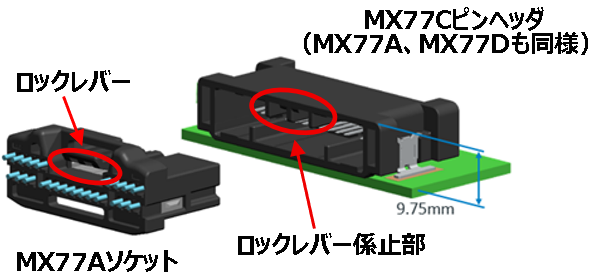
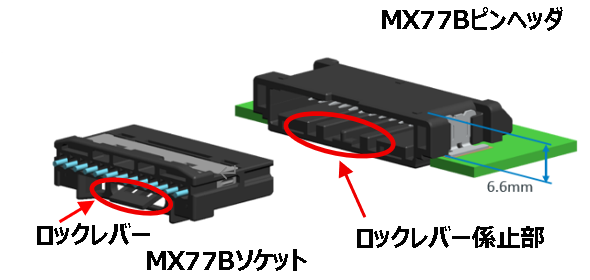
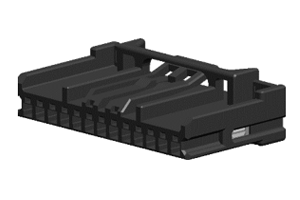
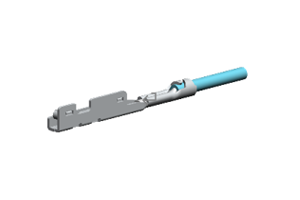
 別ウィンドウで開く





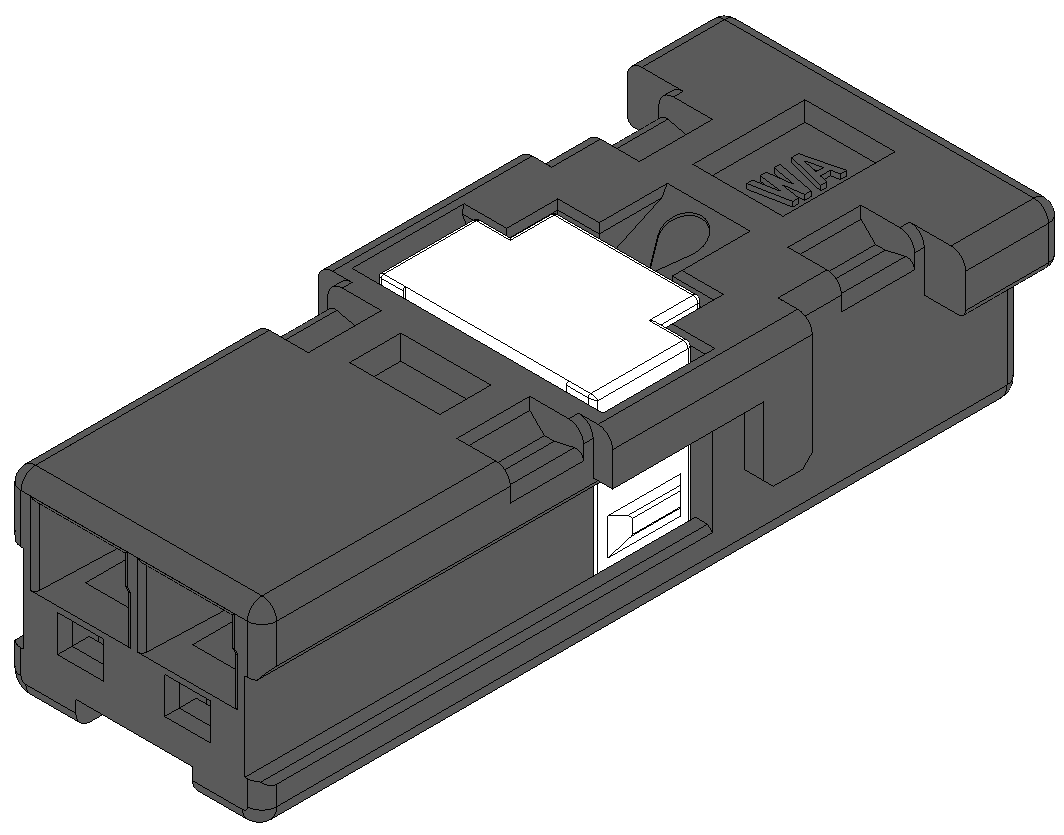
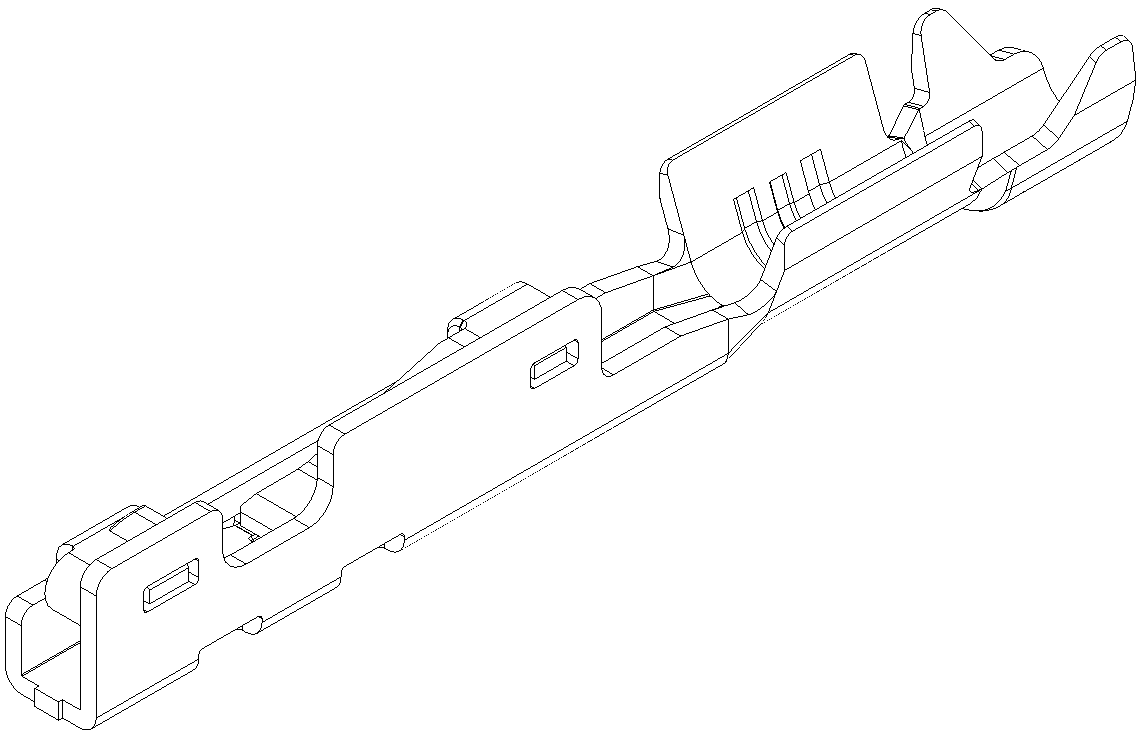

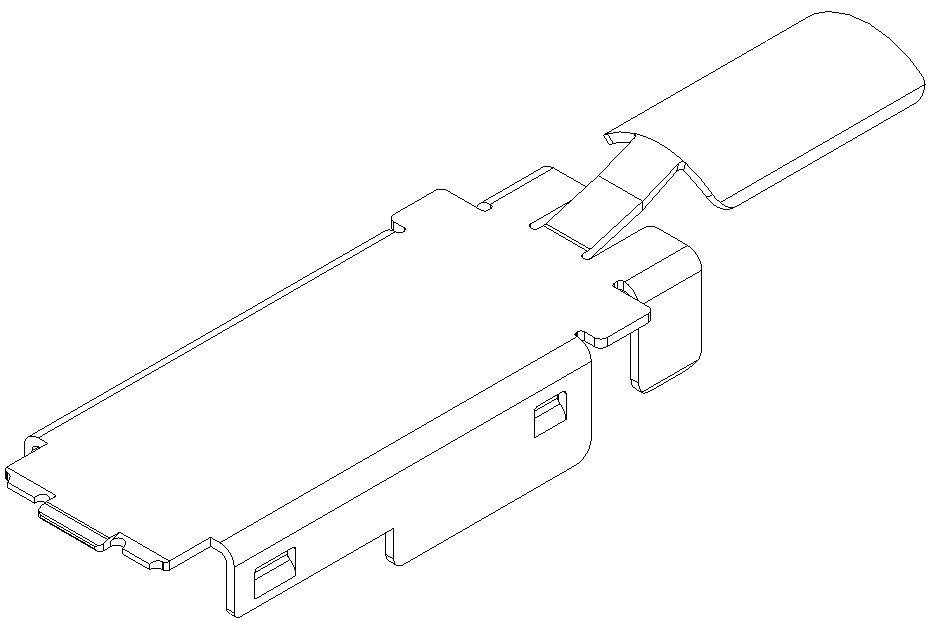
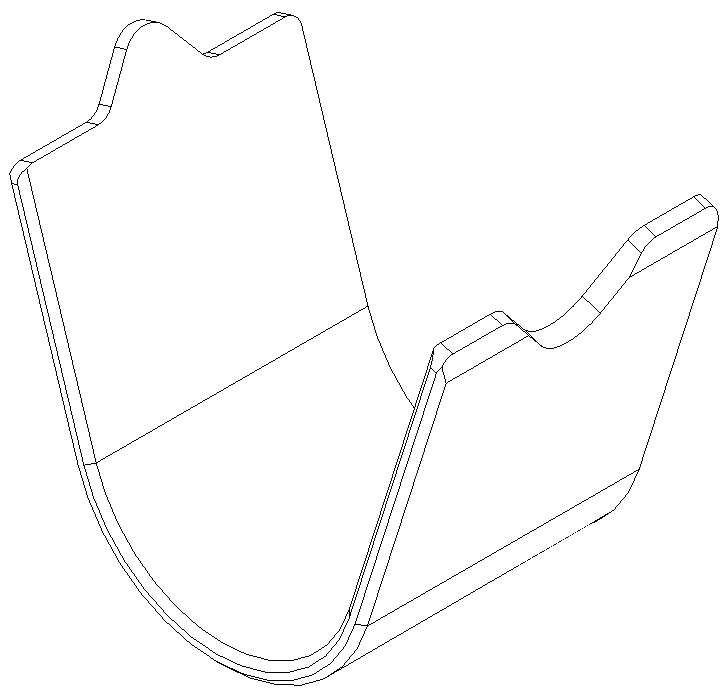


Prompts
Click prompts to add them under the company line, click again to take one out, then copy the result into your AI chat. Shared by Asian Century Stocks and Uncovered Thai Stocks. Thank you.
ETFs Holding Japan Aviation Electronics Industry, Limited
Exchange-traded funds whose newest published daily portfolio holds one of the company's listings, largest weight first.
| ETF | Weight in ETF | Shares | Market value | As of |
|---|---|---|---|---|
| AVDV | 0.02% | 214,400 | $ 2.981M | Nov 16, 2026 |
| AVSD | 0.02% | 5,600 | $ 77.853K | Nov 16, 2026 |
| AVDS | 0.02% | 6,200 | $ 86.194K | Nov 16, 2026 |
| DXIV | 0.02% | 3,200 | $ 46.269K | Nov 12, 2026 |
| DFIS | 0.02% | 71,600 | $ 1.035M | Nov 12, 2026 |
| DISV | 0.01% | 33,800 | $ 488.715K | Nov 12, 2026 |
| DFIC | 0.01% | 89,900 | $ 1.3M | Nov 12, 2026 |
| DFAX | 0.01% | 45,700 | $ 660.778K | Nov 12, 2026 |
| DFSI | 0.00% | 3,200 | $ 46.269K | Nov 12, 2026 |
| DFAI | 0.00% | 45,900 | $ 663.67K | Nov 12, 2026 |
| AVDE | 0.00% | 60,100 | $ 835.527K | Nov 16, 2026 |