2026.10.05 Don't wait for the future; create happiness for people with a venture spirit. Nikkei 150th Anniversary Special Project SINICTheory Gemba DX Sensing&Control+Think CarbonNeutrality Digital Society Healthy Life Expectancy Data Solution…




2026.10.05
Don't wait for the future; create happiness for people with a venture spirit.
Nikkei 150th Anniversary Special Project
OMRON participated in a special advertising project by The Nikkei, centered on its renowned column “Watashi no Rirekisho” (My Personal History). Launched in 1956, the column has been featuring prominent figures from a wide range of fields—including politics, business, culture, and sports—who share their life stories, experiences, and personal philosophies.
To commemorate The Nikkei’s 150th anniversary, the project revisits the philosophies and aspirations of selected business leaders, who have been featured in the column, through interviews with current business leaders to explore how the ideas have influenced their companies and their vision for the future.
OMRON has a particularly distinctive connection to the column. Two members of its founding family—Kazuma Tateishi, OMRON’s founder, and Yoshio Tateishi, its third president—have both been featured in it. Only a limited number of companies have had two members of their founding family featured in the column. The special feature featuring OMRON was published in the morning edition of The Nikkei on October 5, 2026.
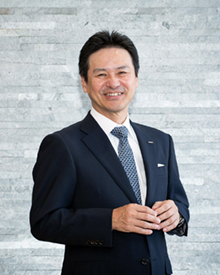 OMRON Corporation President and CEO Junta Tsujinaga
I wanted to participate in this special project to convey to many stakeholders that the 'practice of corporate philosophy,' passed down from these two figures, is inherited in our current management and is being carried out with strong conviction.
Through this project, I revisited past writings of Kazuma Tateishi and Yoshio Tateishi, and recognized that the roots of OMRON's management lie in three areas: thorough customer-centric approach, exploration of new markets, and management that brings out employees' potential for growth. I myself place a strong focus on the 'thorough customer-centric approach' in my management.
Please take a look below to see more about these roots and how we aim to carry them into the future, as well as my thoughts and ideas.
The following is a reproduction of the article:
Don't wait for the future; create happiness for people with a venture spirit.
OMRON leads the world in various businesses, including Industrial Automation business, by being among the first to introduce automation technologies. Looking back at the "Watashi No Rirekisyo (My Personal History)" written by the founder, Kazuma Tateishi, and the third-generation president, Yoshio Tateishi, it is repeatedly stated that the essence of the venture spirit lies in being the first to address customer issues and contributing to society through business. President and CEO Junta Tsujinaga re-reads the words of his predecessors and emphasizes, "We will faithfully continue the three pillars: being thoroughly customer-oriented, developing new growth markets, and managing in a way that brings out the potential of our employees."
As part of the Nikkei 150th Anniversary Special Project, we follow the legacy of the business leaders featured in the famous column that has run since 1956, exploring the present and future of companies that continue to take on new challenges.
Serving society and pursuing profit
“The person who makes others happiest is the one who becomes the happiest. This is the conclusion I have reached after looking back on my life of over seventy years, and it is also my core belief.” Kazuma Tateishi (Watashi No Rirekisyo: Vol. 1, "Born in Kumamoto," published May 24, 1974)
The origin of OMRON's management lies in the core beliefs that Kazuma Tateishi wrote at the beginning of his "Watashi No Rirekisyo." Having faced many hardships since childhood and gone through many twists and turns, he must have come to this conviction. His deep gratitude and desire to repay the people around him and society are palpable.
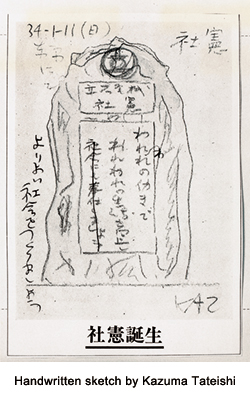
Kazuma applied this thought to his management, believing that "developing products that customers want ahead of others leads to serving society, which ultimately returns as the company's profit." To convey this philosophy clearly to young employees and to integrate management with employees, he compiled the company's constitution, the "Company Constitution."
In 1959, he formulated it as "Through our work, let us improve our lives and create a better society," and as it permeated the company, vitality was born, and business performance grew rapidly.
What made Kazuma exceptional was his commitment to putting the Company Constitution into practice. He established the "eight conditions" necessary for the company`s growth and incorporated them into his management. The eight conditions are: management philosophy, instinctive action, profit distribution, job satisfaction, management participation, new market development, independent technology, and leadership. These had a significant impact on OMRON's subsequent management.
For example, under the "new market development," he focused on the automation market ahead of others, opening up new markets such as manufacturing automation, automatic railway ticket gates, and traffic control systems, which led to the company's dramatic expansion. In later years, he expanded the business into health devices such as blood pressure monitors.
In "job satisfaction" and "management participation," he also maintained a management style that valued people and drew out their potential. In particular, he upheld the principle of "respect for humanity," placing employees above all else and maintaining a management style that drew out their potential. For example, he established a bold system called the "Producer System," under which young employees in their 20s and 30s were entrusted with managing spun-off factories. The system had two objectives : to give employees opportunities to experience the challenges of management from a young age and grow through their own efforts, while also fostering a culture of taking on challenges. Kazuma's management style, which encouraged employees to act autonomously while providing an environment in which they could demonstrate their potential, continues to be emphasized at OMRON today.
Kazuma was a wonderful manager who achieved many things. Those who knew him say he was a very strict person, but that was likely because he believed that customers and society, rather than himself, his family, or the company, should take priority, and that without them, a company cannot prosper. His attitude was even intimidating. Because he respected humanity and believed in people's potential, he maintained a management style that prioritized customers and society, refusing to compromise on himself or the company
Decided to move away from founder-led management, with the corporate philosophy as the driving force.
“My father ate his favorite unaju with gusto and then said, ‘Overcome the big-company disease.’ His tone, which used to be advisory, became strict. He said nothing more than that, without any further instructions.” Yoshio Tateishi (Watashi No Rirekisyo: 19th Edition, "Would you like to be president?", published November 20, 2012)
When Kazuma, his father, asked him to become the third-generation president, Yoshio hesitated because, unlike his father and his older brother, the second president, he came from a sales background and was not well-versed in technology. However, he recalls that he made up his mind after Kazuma advised him, "You should look at technology and products from the perspective of the market, customers, and consumers."
When Yoshio became president, he saw the reality within the company: the pace of management had slowed, and the company’s response to market and customer needs had become sluggish. Because Kazuma was a charismatic leader, a passive attitude of waiting for instructions had spread throughout the company. That was the "big-company disease" that Kazuma spoke of.
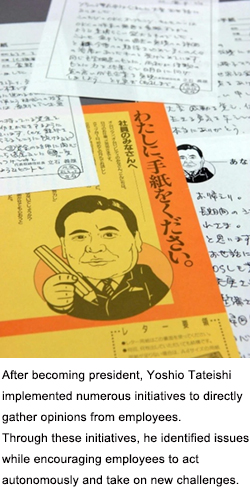
To overcome this challenge, Yoshio repeatedly engaged in dialogue with the employees supporting the front lines, seeking to understand matters from the perspective of the market, customers, and consumers. Believing that improving the company's internal structure was the fundamental solution, he took bold measures.
For example, the three-month "Long-term Refresh Leave" system for middle management. It was a bold measure to give managers time away from the workplace. I suspect that, in addition to wanting them to reflect on themselves, the goal was to ensure that teams could function even in the absence of managers. He encouraged autonomy on both sides. Like Kazuma, Yoshio also valued the autonomy of his employees.
Even when he began structural reforms in 2001, his commitment to encouraging employees to act autonomously remained unwavering. While making the difficult decision to offer voluntary retirement, he also sent a message of encouragement to employees who chose to stay, saying, "I want you to hone your skills to a professional level in your respective roles and increase your own value." At the same time, he insisted on maximizing customer satisfaction by strictly adhering to quality standards and meeting delivery deadlines, while also urging the company to double or even triple its productivity, never wavering from a customer-centric approach even in times of crisis.
He also made major decisions. Believing that the company does not belong to the founding family, but to the employees who support and nurture it, Yoshio shifted from "founding family management," which relied on the founder and the family as the center of gravity, to "corporate philosophy management," where the corporate philosophy serves as the basis for judgment and action.
At the same time, he introduced a "Long-term Vision" to provide direction for the company`s management in place of the founder. Furthermore, the company name was changed from Tateishi Electric to OMRON, making a strong statement that the company was moving away from being led by the founding family. By steering the company toward corporate philosophy management, Yoshio paved the way for the OMRON of today.
Developing new markets by leveraging strong devices and field data
I assumed the presidency in 2023. The guidelines I set upon assuming the presidency were to practice the corporate philosophy, return to a growth trajectory, and draw on Kazuma's life lessons to bring out the potential in people.
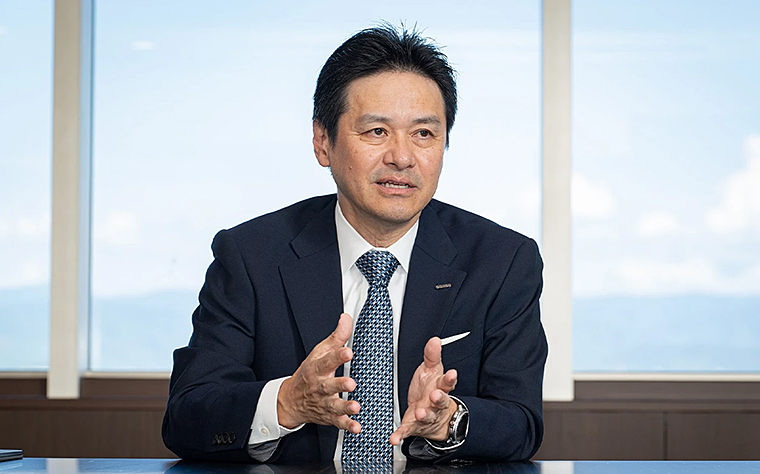
The reason I am committed to practicing the corporate philosophy is to contribute to society and our customers. I believe that we should dedicate all our efforts to being customer-centric. When I faced a significant deterioration in business performance immediately after assuming the presidency, I openly stated to the outside world that "customer-oriented activities have become diluted." As a result, a sense of urgency has been created within the company, and I feel that we have taken a step forward.
In the second stage, where we aim to return to a growth trajectory based on customer trust, I announced "Trusted Growth" in April. This is the first medium-term roadmap I have developed as president. The management issue I identified when I assumed the presidency was that while we were able to take short-term measures against immediate problems, we lacked sufficient consistent measures, over medium-to-long-term . To enable OMRON to grow again, we needed medium-to-long-term growth drivers that would allow us to pioneer markets that can contribute to society ahead of the rest of the world, just as the founder used the SINIC theory*1 to envision the future and work backward from it.
*1 SINIC theory (Seed-Innovation and Need-Impetus Cyclic evolution): A future prediction theory presented by Kazuma Tateishi and others at the International Society for Forecasting in 1970. This is the concept that science, technology, and society develop while mutually influencing each other, and it continues to live on at OMRON as a management compass.
To address this, I launched "GEMBA DX." To solve today's increasingly complex social issues, the use of data, in addition to hardware, is becoming increasingly important. We will combine the high-quality data obtained from our devices, one of our strengths, with other data, leveraging the field expertise we have cultiavted over many years. We will provide valuable information that can help address customers' essential issues. For example, in the factory automation field, there are "smart factories" that utilize AI, while in the healthcare field, there are preventive medical services optimized for each individual. We will develop new markets with OMRON's unique data solutions.
I also have a strong commitment to management that brings out human potential. First, I am implementing management that maximizes the company's cash-generating capability while ensuring that those who work hard to achieve results are appropriately rewarded. This follows the "High-Wage, High-Efficiency Management*2" advocated by Kazuma-san, which posits that higher wages boost employee morale and, as a result, inevitably improves productivity.
*2 High-Wage, High-Efficiency Management: One of Kazuma Tateishi's management principles. Management that aims for a virtuous cycle of improving corporate profitability by increasing employee productivity and efficiency, and returning those results to employees and society to foster development.
Specifically, I have appointed young people who lead next-generation management as heads of core businesses and key initiatives. I give them significant authority and hold them accountable for results. At the same time, the management team provides support to help them succeed. I have also established an evaluation system in which high rewards are obtained based on results. I believe that creating resources and opportunities for growth is one of the fastest ways to stimulate an entrepreneurial spirit.
Taking on challenges with a customer-centric approach at the core.
I feel that the series of measures I have undertaken since becoming president are gradually making progress in the company. I believe that by continuing to accumulate successful examples, the company's culture and atmosphere will change. However, we are still only halfway there. What does a customer-centric approach mean, and how do we put it into practice? I want every employee to thoroughly pursue what this means and put it into action with complete dedication. By doing so, we should be able to earn greater customer trust and make more people happy.
On October 1, 2026, we transferred the electronic components business through a stock transfer. To remain a company that continuously solves social issues, it is essential to continually evolve our business portfolio. Currently, our four main businesses are control equipment, healthcare, social systems, and data solutions. I believe these are areas where new challenges will arise and intensify, as well as opportunities to meet the evolving needs of customers and society . However, further into the future, if the needs of the world and social issues change significantly, we may engage in businesses that are completely different from what we do today.
What will never change is that OMRON will continue to be a company that solves social issues, guided by its corporate philosophy. Moving forward, we will continue to practice the management philosophy inherited from our founding era and, with a customer-centric approach at the core, remain steadfast in our mission to solve social issues through our businesses.
*This content was originally written in Japanese by the Nikkei and translated into English by OMRON Corporation.
Related Contents
Page
Top

Privacy Preference Center
When you visit any website, it may store or retrieve information on your browser, mostly in the form of cookies. This information might be about you, your preferences or your device and is mostly used to make the site work as you expect it to. The information does not usually directly identify you, but it can give you a more personalized web experience. Because we respect your right to privacy, you can choose not to allow some types of cookies. Click on the different category headings to find out more and change our default settings. However, blocking some types of cookies may impact your experience of the site and the services we are able to offer.
More information
Allow All
Manage Consent Preferences
Strictly Necessary Cookies
Always Active
These cookies are necessary for the website to function and cannot be switched off in our systems. They are usually only set in response to actions made by you which amount to a request for services, such as setting your privacy preferences, logging in or filling in forms. You can set your browser to block or alert you about these cookies, but some parts of the site will not then work. These cookies do not store any personally identifiable information.
Functional Cookies
Functional Cookies
These cookies enable the website to provide enhanced functionality and personalisation. They may be set by us or by third party providers whose services we have added to our pages. If you do not allow these cookies then some or all of these services may not function properly.
Performance Cookies
Performance Cookies
These cookies allow us to count visits and traffic sources so we can measure and improve the performance of our site. They help us to know which pages are the most and least popular and see how visitors move around the site. All information these cookies collect is aggregated and therefore anonymous. If you do not allow these cookies we will not know when you have visited our site, and will not be able to monitor its performance.
Targeting Cookies
Targeting Cookies
These cookies may be set through our site by our advertising partners. They may be used by those companies to build a profile of your interests and show you relevant adverts on other sites. They do not store directly personal information, but are based on uniquely identifying your browser and internet device. If you do not allow these cookies, you will experience less targeted advertising.
Cookie List
Clear
checkbox label label
Apply Cancel
Leg.Interest
checkbox label label
checkbox label label
checkbox label label
Reject All



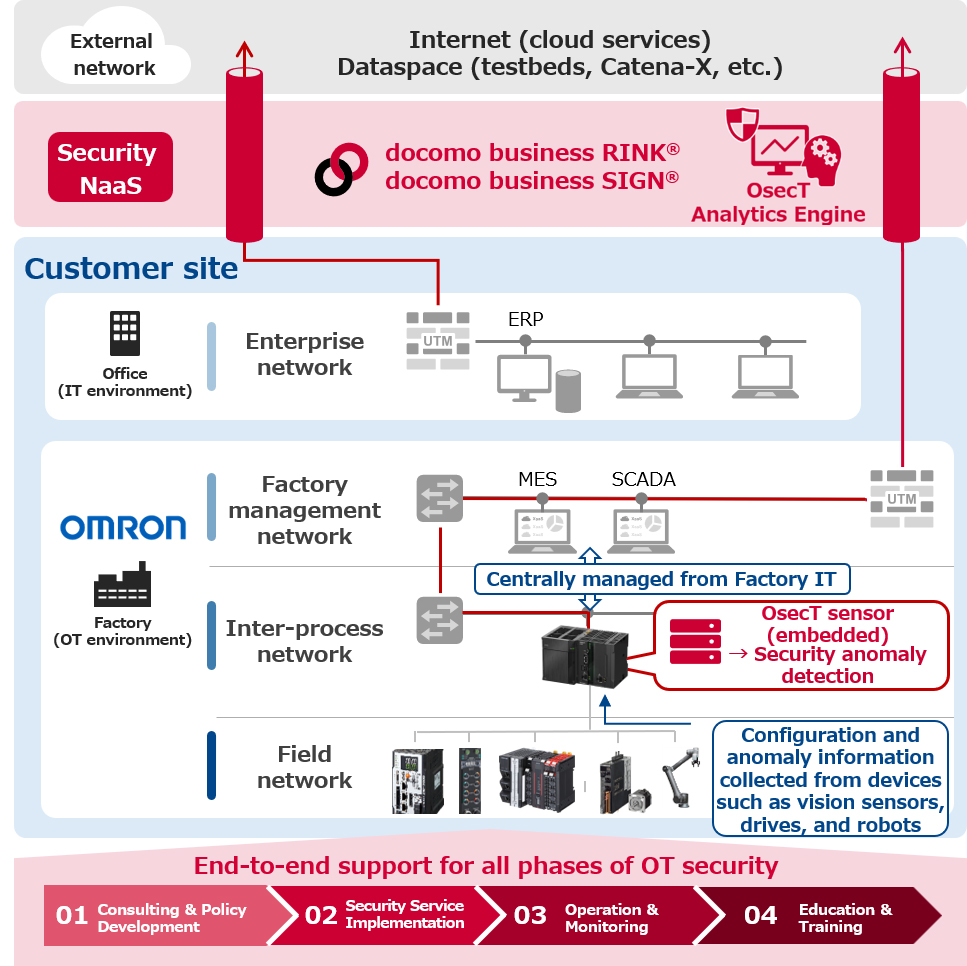 Illustration of the Collaboration
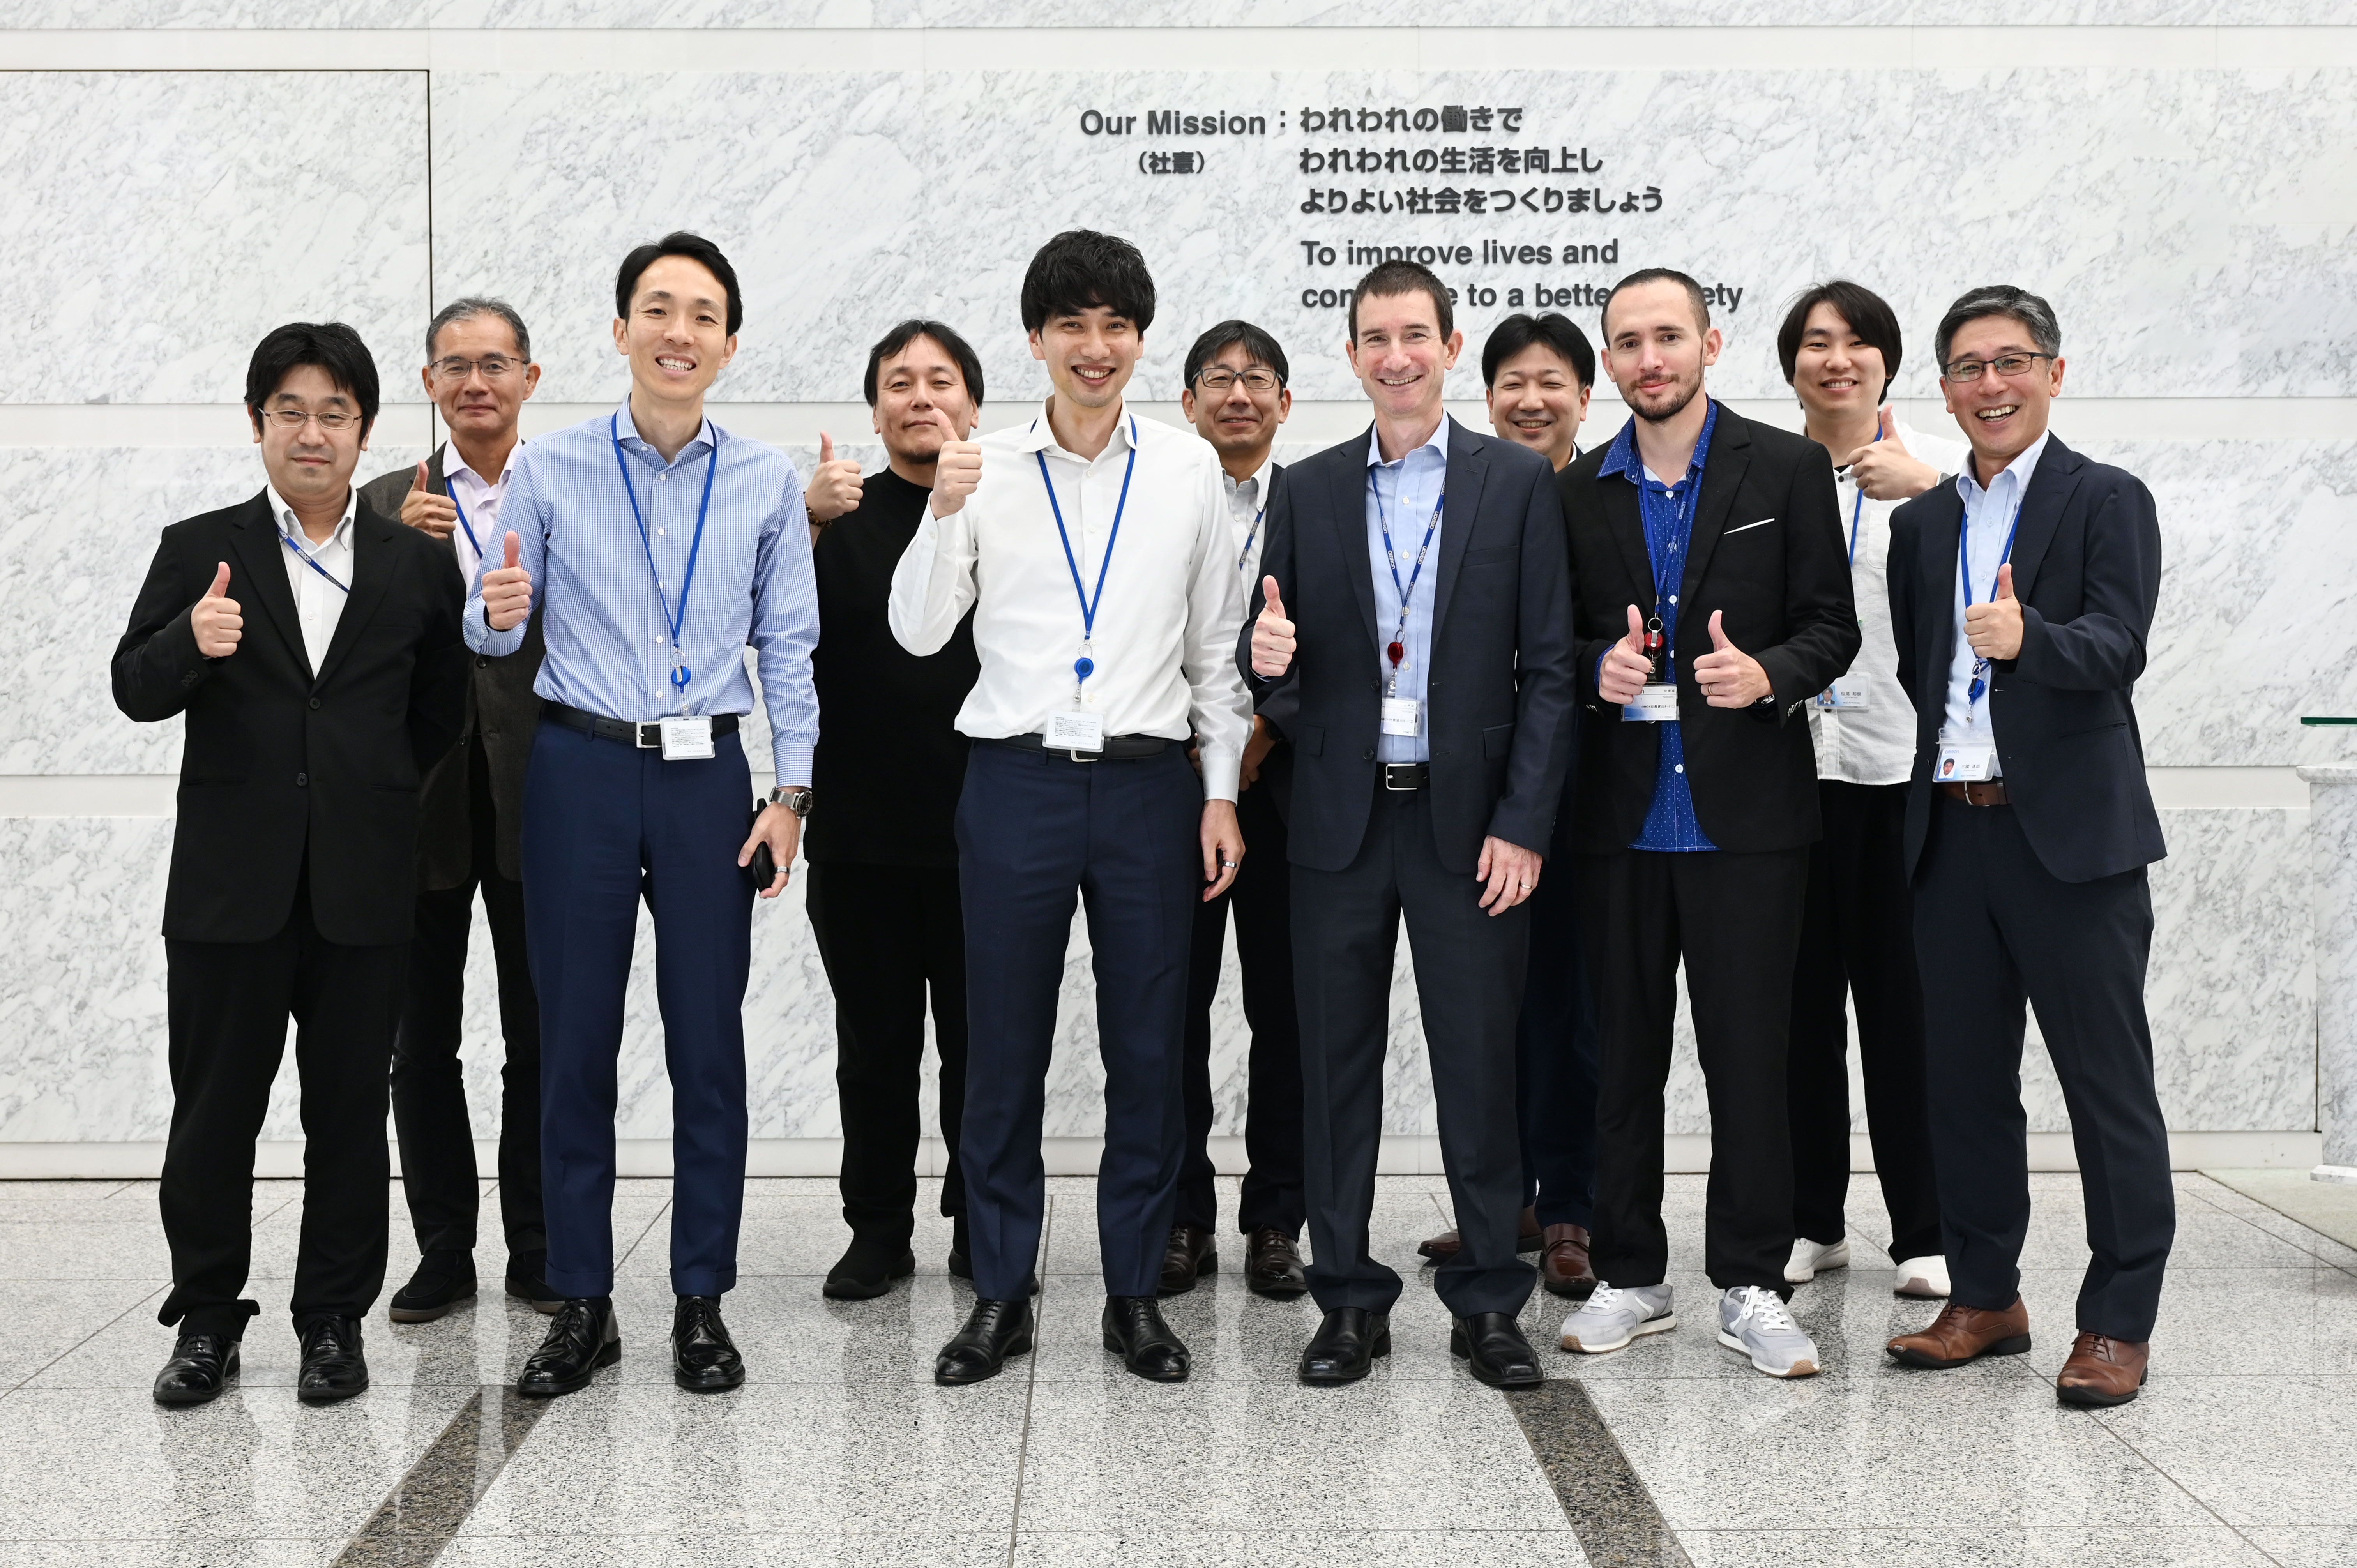 At OMRON Corporation Headquarters in Kyoto, Japan

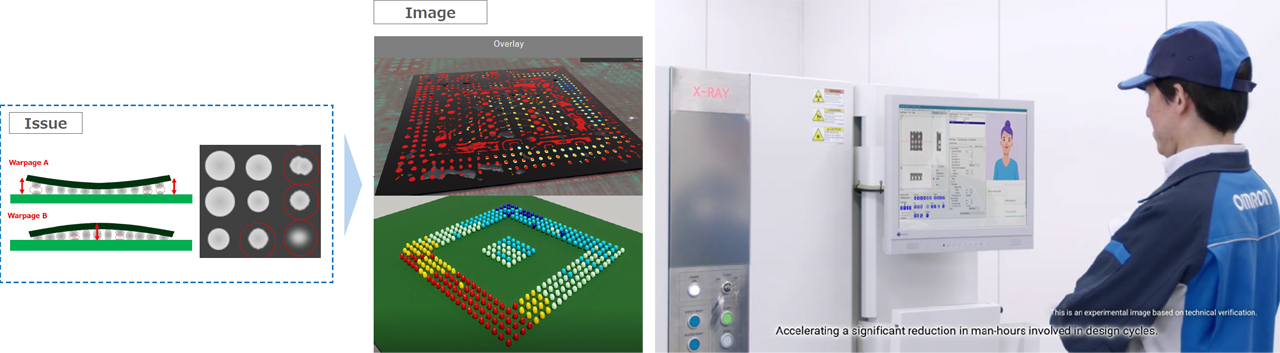 Achieving higher accuracy for skillless substrate inspection equipment.