Investors Guide KOHOKU KOGYO CO., LTD. 湖北工業株式会社 インベスターズガイド (Notes) Figures prior to the six months ended December 31, 2021 have not been audited. The forecast figures are based on information available at this point in time.…
Investors Guide
KOHOKU KOGYO CO., LTD.
湖北工業株式会社
インベスターズガイド
(Notes)
- Figures prior to the six months ended December 31, 2021 have not been audited.
- The forecast figures are based on information available at this point in time.
Accordingly, actual results may differ materially from those presented.
August 6, 2026
2026年8月6日
(注)
- 2021年12月期第2四半期以前の数値は、会計監査を受けておりません。
- 業績等の予想数字につきましては、現時点で得られた情報に基づいています。
従いまして実際の業績は記載の内容と大きく異なる可能性があります。
Company Profile 会社概要
Company Name
会社名
KOHOKU KOGYO CO.,LTD.
湖北工業株式会社
Business Contents 事業内容
Lead Terminals Business
◼
Foundation
リード端子事業
設立
August 8, 1959
1959年(昭和34年)8月8日
Representative
代表
Manufacturing and marketing of lead terminals
for aluminum electrolytic capacitors
アルミ電解コンデンサ用リード端子の製造・販売
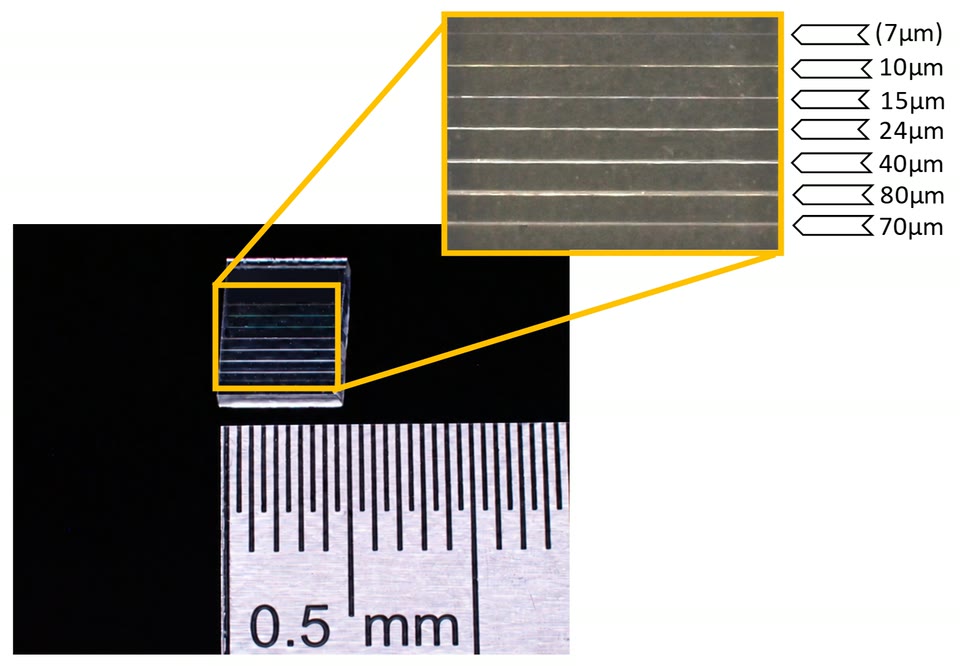
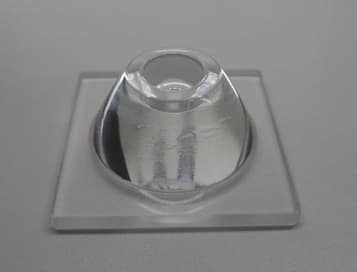
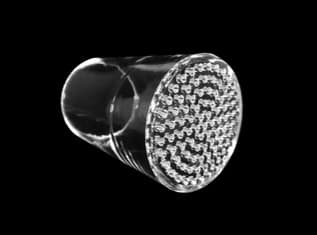
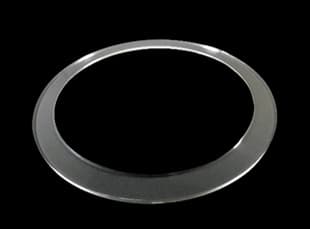
Optical Components and Devices Business
◼
光部品・デバイス事業
President & CEO Futoshi Ishii
代表取締役社長CEO 石井太
Capital
資本金
350 million yen
3億5,000万円
Number of Employees (As of June 30, 2026)
従業員数(2026年6月末)
Non-consolidated: 162
Consolidated: 1,792
非連結:162名
連結:1,792名
Location of the Headquarters
本社
1623,Takatsuki, Takatsuki-cho, Nagahama-shi,
Shiga, 529-0241, Japan
〒529-0241
滋賀県長浜市高月町高月1623番地
Manufacturing and marketing of optical components
and devices
光通信用部品の製造・販売
Group Companies グループ会社
•
•
•
•
•
•
•
KOHOKU ELECTRONICS (S) PTE. LTD.
KOHOKU ELECTRONICS (M) SDN. BHD.
DONGGUAN KOHOKU ELECTRONICS CO., LTD.
SUZHOU KOHOKU OPTO-ELECTRONICS CO., LTD.
KOHOKU LANKA (PVT) LTD.
EpiPhotonics. Co., Ltd.
EpiPhotonics USA, Inc.
1
Net Sales / Operating Profit / EBITDA / Profit Attributable to Owners of Parent
売上高 / 営業利益 / EBITDA / 親会社株主に帰属する当期純利益
Quarterly Trend 四半期トレンド
Annual Trend 年間トレンド
Millions of Yen 百万円
Millions of Yen 百万円
9,000
40%
31.7%
8,000
31.5%
31.3%
30.5%
27.2%
26.9%
26.7%
26.8%
30.1%
24.5%
23.7%
30%
20%
20.4%
20.2%
16.6%
18.8%
24,000
24.8%
21,000
23.1%
5,000
3,000
3,498 3,499
3,670
3,950
4,004
3,943
3,521
3,786
3,331
3,413
373
Q4
Q1
Q2 Q3
2021
Profit attributable to owners of parent
親会社株主に帰属する当期純利益
Q4
Q1
Q2 Q3
2022
Q4
564
Q1
Operating Profit 営業利益
379
Q2 Q3
2023
0%
13,472
12,000
3,558
11,176
3,117
7,847
6,754
1,992
1,731
1,626 1,679
1,389 1,622
1,385
1,385 1,425 1,462
1,378
1,267
1,219
1,235 1,114
1,152
1,016
1,150 1,246
1,237 1,217 1,225
1,031
1,024
1,141 1,149
858 1,066
1,102
1,119 1,090 1,062 979 1,072
1,027
839
960
897
934 886 930 875
912
860 970
846 779 793 743 724
769
730 738
765
635
670
629
608 517
156
Q2 Q3
2020
3,502
4,316
15,000
4,544
10%
14,620
9,000
1,113
926
982
1,000 802 624
526 500 575 422
292
304
Q1
3,771
4,604
4,430
15,924
15,673
2,532
2,000
0
4,294
3,102
2,541
20%
17,454
0%
4,973
3,000
22,238
18,000
3,954
30%
24.7%
20.9%
5,478
4,000
26.5%
10%
11.5%
6,000
30.4%
28.2%
26.8%
18.3% 18.6%
19.7%
40%
31.6%
28.7%
24.0% 24.0%
27.7%
7,000
26.5%
27,000
433
227
180
Q4
EBITDA
Q1
Q2 Q3
2024
Q4
Q1
6,000
3,054
2,960
3,000 2,577
1,562
376
Q2 Q3
2025
Net Sales 売上高
Q4
Q1
Q2 Q3
2026
4,887
4,642
4,576
4,126 3,884 3,593 3,939
Q4
Operating Profit Ratio 営業利益率
3,066
2,812
3,252
5,597
4,624 4,618
2,992
1,904
0
2020 2021 2022 2023 2024 2025 2026
Forecast
予想
EBITDA = Operating Profit + Depreciation 営業利益 + 減価償却費
2
Net Sales / Operating Profit (Lead Terminals)
(リード端子事業) 売上高 / 営業利益
Quarterly Trend 四半期トレンド
Annual Trend 年間トレンド
Millions of Yen 百万円
Millions of Yen 百万円
5,000
20%
4,750
7.9%
4,500
4,250
5.3%
5.2%
6.2%
6.7%
4.2%
1.5%
6.8%
4,000
3,750
9.7%
9.1%
4.9%
3.6%
-0.9%
3.4%
-1.3%
10.5% 9.6%
8.1%
15,000
20%
12.0%
8.6%
5.1% 5.8%
0%
12,000
10%
4.8%
2.8%
8.3%
-0.7%
10.4%
8.7%
7.5%
10%
4.0%
11,349
0.6%
0%
-1.7%
3,500
-5.4%
-10%
3,250
3,000
2,843
2,750
2,500
2,130
2,250
2,000
1,734
1,750
1,500
1,298
1,443
1,819
1,917
2,151
2,052
2,107
2,157
2,071
1,864
1,924
1,791
1,819
2,198
1,929
2,118
2,171
2,209
2,442
-20%
9,000
8,403
8,384
2,516
7,601
-30%
8,802
7,400
1,978
-40%
6,000
1,506
1,287
5,536
-50%
1,250
1,000
-60%
750
500
250
0
-250
113
68
54
157 122 185 104 105
72
89
-16
28
-34
228 212 210
132 177 107 114
128
-95
209
340
2021
2022
-16 -13
2023
-80%
Operating Profit 営業利益
2024
2025
Net Sales 売上高
1,178
-70%
Q1 Q2 Q3 Q4 Q1 Q2 Q3 Q4 Q1 Q2 Q3 Q4 Q1 Q2 Q3 Q4 Q1 Q2 Q3 Q4 Q1 Q2 Q3 Q4 Q1 Q2 Q3 Q4
2020
3,000
219
0
2026
Operating Profit Ratio 営業利益率
569
232
44
403
766
2020 2021 2022 2023 2024 2025 2026
Forecast
予想
3
Net Sales / Operating Profit (Optical Components and Devices)
(光部品・デバイス事業) 売上高 / 営業利益
Quarterly Trend 四半期トレンド
Annual Trend 年間トレンド
Millions of Yen 百万円
Millions of Yen 百万円
5,000
53.5%
50.4%
48.1%
53.3%
54.2%
53.6%
50.3%
49.3%
50.4%
49.0%
45.6%
47.3%
49.0%
47.7%
45.8%
52.8%
49.7%
43.7%
39.5%
45.1%
42.6%
60%
51.2%
50.7% 50.1%
47.0%
41.8%
45.6%
40%
44.6%
35.2%
10,888
20%
23.1%
20%
8,651
9,000
3,000
2,634
2,531
2,395
2,231
2,136
2,000
1,701
1,814
1,901
1,8521,835
1,820
1,753
1,764
1,699
1,679
1,6561,577
1,539
1,097
914
1,026
944
847
934
830
956 907 983
2,144
711 704
2,028
7,520
7,289
5,640
6,071
1,391
1,172 1,215
1,208
649
3,556 3,652
1,008
913
658
534
386
7,018
0%
5,575
1,668
1,580
1,020
804 817
0%
6,000
1,484
1,297
818
40%
12,000
35.2%
1,000
15,000
48.0%
41.2%
4,000
60%
3,000
3,536
3,857
2,767
2,358
555
237
0
0
Q1 Q2 Q3 Q4 Q1 Q2 Q3 Q4 Q1 Q2 Q3 Q4 Q1 Q2 Q3 Q4 Q1 Q2 Q3 Q4 Q1 Q2 Q3 Q4 Q1 Q2 Q3 Q4
2020
2021
2022
2023
Operating Profit 営業利益
2024
2025
Net Sales 売上高
2026
Operating Profit Ratio 営業利益率
2020 2021 2022 2023 2024 2025 2026
Forecast
予想
4
Regional Sales Trend (Total)
地域別売上高の推移(合計)
Quarterly Trend 四半期トレンド
Annual Trend 年間トレンド
Millions of Yen 百万円
Millions of Yen 百万円
8,000
7,000 61.2%
70.0%
69.1%
66.4% 67.0%
64.6%
64.3%
65.4% 65.5%
68.5% 69.2%
69.1%
62.3%
68.8%
67.3%
66.4%
64.8%
63.5%
4,000
3,529 3,503
3,000
2,000
1,000
526 536
3,677
603
3,910
3,954
4,004
4,294
3,943
684 650 766 746
3,771
684
3,521 3,502
719
3,331
3,413
3,117
4,604
4,430
4,316
736 3,786
694
643
3,558
606
642
528 593
565 661
15,924
15,673
894
14,620
4,544
2,848
2,350
20%
海外売上高比率
/Overseas
Sales Ratio
804
962
660
613
624
547
511 483
586
588
558
781 1,099 487
468 518 536
389 496
596
983
902
381
423 888
392
941
778
670
531
595
877
588
879
895 886 960
1,214 1,099
647 261 485
787
928 736
735
833
501
663
509
940 776
737 770
637
270 311 340 473
540
509
277 353
1,658
1,594
1,431
1,841
1,481
1,367
1,397
1,328
1,410
1,183
1,324
1,166
1,288
1,251
1,237
1,213
1,099
1,176
1,186
1,073
1,235
1,147
607 567
17,454
40%
848
768
60%
18,000
714 838
0%
68.0%
63.9%
5,478
4,973
66.5%
60%
6,000
5,000
80%
70.1%
67.8% 67.9%
62.6%
62.0%
24,000
80%
73.4%
12,000
2,109
2,166
13,472
2,346
2,510
40%
2,758
2,875
2,135
1,659
20%
3,571
2,952
アジア/Asia
3,620
3,762
2,028
中国/China
6,000
1,395
0%
1,641
2,580
3,320
5,254
4,856
4,757
2022
2023
2024
2,910
ヨーロッパ
/Europe
5,143
南北アメリカ
/Americas
5,586
0
Q1
Q2
Q3
2021
Q4
Q1
Q2
Q3
2022
Q4
Q1
Q2
Q3
2023
Q4
Q1
Q2
Q3
2024
Q4
Q1
Q2
Q3
2025
Q4
Q1
Q2
Q3
2026
Q4
日本 /Japan
0
2021
2025
5
Regional Sales Trend (Lead Terminals)
地域別売上高の推移(リード端子)
Quarterly Trend 四半期トレンド
Annual Trend 年間トレンド
Millions of Yen 百万円
Millions of Yen 百万円
4,000
60.1%
51.6%
52.6% 54.9%
55.9% 55.5%
53.7%
54.7%
54.3%
53.3%
53.2%
54.5% 54.8%
56.8%
53.3%
51.0%
54.6%
54.6%
51.7%
53.8%
50.6%
10,000
2,843
2,442
2,092
2,000
1,762
511
1,822
523
1,923
591
2,151
2,052
2,198
2,107
2,157
2,071
1,864
673 637 749 726 671
601
1,924
1,791
565
609
1,819
1,929
653
686
0
9
0
4
974 949 989 956 1,073
852 863 867 946 819 948 937 958 873 878 837 891 878
1,003
638 665
0
6
1,111
0
4
7,601
1,726
4,000
ヨーロッパ
/Europe
2,474
20%
2,736
0%
2,157
0
中国/China
1,313
40%
2,327
6,000
アジア/Asia
0
1
60%
8,802
8,403
7,400
2,300
海外売上高比率
/Overseas
Sales Ratio
52.9%
53.0%
43
1,142
54.9%
55.1%
2,785
647
492 570
8,000
20%
0%
561
53.5%
8,384
704
595 631
463 517 488 456
443 431 429
579
471
453
426
367
385
379
388
339
0
0
0
0
0
0
0
0
0
0
0
0
0
0
0
0
5
0
2
1
12
10 12
13
3
9
9
9 10
9
9 11
5
16
458
881
80%
40%
2,516
2,209
1,978
714 729 638
550
2,171
2,118
60%
54.5%
3,000
1,000
12,000
80%
2,000
3,531
1,854
1,785
1,558
0
0
51
33
3,762
3,480
0
0
25
21
3,791
4,144
南北アメリカ
/Americas
0
Q1 Q2 Q3 Q4 Q1 Q2 Q3 Q4 Q1 Q2 Q3 Q4 Q1 Q2 Q3 Q4 Q1 Q2 Q3 Q4 Q1 Q2 Q3 Q4
2021
2022
2023
2024
2025
2026
日本 /Japan
0
2021
2022
2023
2024
2025
6
Regional Sales Trend (Optical Components and Devices)
地域別売上高の推移(光部品・デバイス)
Quarterly Trend 四半期トレンド
Annual Trend 年間トレンド
Millions of Yen 百万円
Millions of Yen 百万円
4,000
12,000
76.9% 79.0% 81.2%
85.9% 84.4%
74.9%
72.5%
78.8% 79.8%
100%
84.3%
80.9%
88.4%
83.6%
78.8%
72.1%
70.8%
90.9%
89.8%
86.9%
80.0%
77.0%
80%
80.0%
83.3%
77.3%
74.6%
100%
87.2%
79.5%
60%
60%
40%
40%
9,000
3,000
2,531
2,395 7
2,000
1,817
1,766
14
79
895
1,753
1,680
13
92
12
82
886 960
10
127
1,901
13
144
2,136
1,852
16
103
1,835
4
1,699
19
79
13
53
877
1,214 1,099
1,656
5
9
65
1,578
1
25
778 670 531
588
2,231
2,144
6
11
75
1,668
1,539
4
41
1,484 888 983
1,297
7
24
6
3
100
38
595
647 261 485
261
496 488
301 329 459
261
515
654
628
343
387 367 341
268 289
Q2
Q3
Q3
2021
Q4
Q1
Q2
535
728
759
938
0%
7,018
210
198
382
2,028
168
1,580 902
781 1,099 139
487
50
3,762
3,620
アジア/Asia
923
729
中国/China
875 939
2022
Q4
Q1
Q2
Q3
2023
Q4
Q1
Q2
Q3
2024
Q4
Q1
Q2
1,352
2025
Q4
Q1
Q2
1,612
南北アメリカ
/Americas
478 483 516 527
Q3
6,071
Q3
2026
Q4
日本 /Japan
3,571
2,952
2,028
3,000
ヨーロッパ
/Europe
3,299
1,590
1,491
0%
21
2,546
726
349
336
334 310 274
227 194 143
195
381
62
36
280
101
19
海外売上高比率
/Overseas
Sales Ratio
139
7,520
7,289
6,000
962
4
774
20%
717
505
460 473 455
0
Q1
828
12
191
10
787
1,000
12
8,651
20%
2,634
80%
1,375
966
2,885
1,441
0
2021
2022
2023
2024
2025
7
Cost of Sales / SGA Expenses / Operating Profit / Gross Profit ratio
売上原価 / 販売費及び一般管理費 / 営業利益 / 売上総利益率
Annual Trend 年間トレンド
Quarterly Trend 四半期トレンド
Millions of Yen 百万円
Millions of Yen 百万円
47.5%
8,000
43.3%
43.5%
41.1%
42.9%
40.9%
7,000
38.9%
42.2%
42.0%
39.8%
43.7%
39.8%
41.8%
38.6%
43.0%
46.6%
50%
43.2%
40%
39.3%
38.1%
24,000
41.4%
38.5%
36.4%
34.6%
42.3%
46.0% 45.1%
21,000
40.7%
43.2% 43.6%
40%
38.0%
30%
18,000
6,000
20%
5,000
10%
2,926
4,000
3,000
1,982
2,068
2,097
2,412
2,382
2,418
2,458
2,399
2,288
2,049
1,753
1,766
1,661
1,000
50%
39.2%
30%
31.0%
2,000
45.8%
2,004
1,916
413 460 454 604 509 566 581
2,112
379
802
1,102
1,119
1,062
1,072
1,152
982 492
979
970
934
769 846 839 608
635
517
500
292
Q1
Q2 Q3 Q4
0
2020
Q1 Q2 Q3
2021
Q4 Q1 Q2
Q3 Q4 Q1
2022
Cost of Sales 売上原価
Q2 Q3 Q4
2023
1,385
8,561
Q1 Q2 Q3
728
670
1,141
Q4 Q1 Q2
2024
SGA Expenses 販売費及び一般管理費
0%
9,039
9,528
7,993
3,425
6,928
712
765
9,842
12,000
2,159
719
20%
10%
9,000
731 815
837
15,000
2,579
819
722
603 625 639 718
683 665
2,732
2,461
2,324
2,183
1,747
365
431
2,023
2,488
0%
12,059
1,385
6,000
1,932 2,260
747
1,425
1,731
3,000
2,577
2025
Q2 Q3 Q4
6,754
4,126 3,884
2,812
3,939
4,624
0
2020 2021 2022 2023 2024 2025 2026
Forecast
予想
2026
Operating Profit 営業利益
2,987
2,666
1,670
1,217
Q3 Q4 Q1
2,944
Gross Profit ratio 売上総利益率
8
Capital Expenditures / Depreciation
設備投資 / 減価償却費
Quarterly Trend 四半期トレンド
Annual Trend 年間トレンド
Millions of Yen 百万円
Millions of Yen 百万円
1,200
24.8%
25%
15%
12.8%
900
25%
3,000
940
14.4%
3,600
10.7%
9.1%
7.7%
7.6%
6.0%
4.9%
4.3%
11.2%
7.3%
6.7%
3.7%
2.6%
6.2%
3.7%
5.4%
5%
4.6%
3.6%
5.6%
5.8%
5.0%
5%
5.6%
2.8%
2.7%
2,400
7.1%
6.0%
4.7%
5.4%
600
15%
12.5%
10.9%
4.2%
1,800
1,692 1,710
504
385
306
300
234
209 171
133 144 148 156
145
140
124 123 130 130109 130
106
65
401 400
355
338
312
289
204
185 184 184
154 154 153
113
226 222
298
258
253
251
241 236 241
236 236
199
166
159
210
555
600 509
Q1 Q2 Q3 Q4 Q1 Q2 Q3 Q4 Q1 Q2 Q3 Q4 Q1 Q2 Q3 Q4 Q1 Q2 Q3 Q4 Q1 Q2 Q3 Q4 Q1 Q2 Q3 Q4
2021
2022
Depreciation 減価償却費
2023
2024
Capital Expenditure 設備投資
2025
947
914
244 260
0
2020
1,200
617
582 601
1,201
1,093
973 981
780
0
2020 2021 2022 2023 2024 2025 2026
2026
Capital Expenditures Ratio to Net Sales 対売上高設備投資比率
Forecast
予想
9
Capital Expenditures / Depreciation - Lead Terminals ・ Optical Components and Devices
設備投資 / 減価償却費 - リード端子事業・光部品・デバイス事業
Lead Terminals リード端子事業
Optical Components and Devices 光部品・デバイス事業
Millions of Yen 百万円
Millions of Yen 百万円
600
30%
600
30%
26.0%
25%
25%
500
500
20%
17.0%
500
20%
15%
13.0%
10.7%
400
6.6% 7.1%
6.3%
4.5%
300
2.6%
2.5%
8.5%
10%
4.1%
4.2%
2.9%
2.4%
304
1.7%
3.0%
1.0%
0.5%
7.2%
4.6%
0.2%
0%
0.6%
35
66
51
2023
Depreciation 減価償却費
2024
121 118
18 10
2025
80
48
46 48 48
55
17
5
2026
Capital Expenditure 設備投資
175
168
147
145
100
91
Q1 Q2 Q3 Q4 Q1 Q2 Q3 Q4 Q1 Q2 Q3 Q4 Q1 Q2 Q3 Q4 Q1 Q2 Q3 Q4 Q1 Q2 Q3 Q4
2022
0%
189
163
164
158
154
154
149
140 145 145
142 146
0
2021
5%
3.2%
1.6%
200
133
109
121
120 112
107
108
96 93
82
90
85
86
75 78 80
62
55
43
10%
6.7%
218
200
139
8.6%
6.5%
2.8%
1.8%
7.8%
3.5%
4.8%
3.5%
300
7.0%
5.1%
2.8% 3.7%
9.3%
8.8%
7.9%
236
219
100
400
5%
2.3%
0.7%
15%
11.4%
132
114
74 80
69
66
65
32
103
83
97 91 94 94 99
96
90 91
85
81 84
88
86
77
82
80
76
55
42
35
13
0
Q1 Q2 Q3 Q4 Q1 Q2 Q3 Q4 Q1 Q2 Q3 Q4 Q1 Q2 Q3 Q4 Q1 Q2 Q3 Q4 Q1 Q2 Q3 Q4
2021
2022
2023
2024
2025
2026
Capital Expenditures Ratio to Net Sales 対売上高設備投資比率
10
Research and Development Expenses
研究開発費
Quarterly Trend 四半期トレンド
Annual Trend 年間トレンド
Millions of Yen 百万円
Millions of Yen 百万円
400
10%
1,200
10%
7.9%
6.6%
5.3%
5.0%
300
2.3%
1.8% 1.8%
3.3%
3.7%
185
130
54
54
46
46
58
64
42
42
139
107
58
64
109
82
130
Q2
Q3
2020
Q4
Q1
Q2
213
Q3
2021
Q4
Q1
Q2
Q3
173
140
146
161
189
183
170
20
17
25
25
Q4
Q1
Q2
Q3
2022
R&D Expenses (Lead Terminals) 研究開発費(リード端子)
※ 2022年12月期以前はリード端子事業部の研究開発費は区分しておりません
2023
Q4
741
737
0%
146
22
26
25
Q1
Q2
Q3
2024
36
Q4
574
600
147
137
146
393
120
24
28
24
Q1
Q2
Q3
2025
37
Q4
696
200
393
200
23
27
Q1
Q2
618
553
123
112
628
526
162
200
39
5%
807
1.8%
800
400
122
145
0
Q1
159
168
82
187
206
109
107
3.3%
3.7%
0%
149
139
3.7%
641
169
165
145
1,000
2.7%
250
200
188
3.5%
5.1%
3.2%
3.0%
200
5%
4.2%
246
139
3.7%
3.5%
5.0%
2.8%
2.2%
100
5.5%
4.8%
4.7%
4.0%
1.8%
1.4%
3.5%
3.1%
5.0%
Q3
Q4
2026
R&D Expenses (Optical Components and Devices) 研究開発費(光部品・デバイス)
20
108
111
114
2022
2023
2024
2025
122
0
2020
2021
2026
Forecast
予想
R&D Ratio to Net Sales 対売上高研究開発費率
11
Return On Equity (ROE) / Return On Assets (ROA) / Return On Invested Capital (ROIC)
自己資本当期利益率(ROE)/ 総資産経常利益率(ROA)/ 投下資本利益率(ROIC)
ROE (Return On Equity) ROE(自己資本当期純利益率)
ROA (Return On Assets) ROA(総資産経常利益率)
ROIC (Return On Invested Capital) ROIC(投下資本利益率)
40%
40%
40%
35%
35%
30%
30%
35%
31.0%
28.3%
30%
25%
24.4%
25%
18.3%
20%
17.9%
15%
12.8%
10%
19.0%
20%
15.0%
15%
22.2%
9.9%
20%
18.1%
18.2%
12.8%
0%
2022
2023
15.0%
14.1%
12.2%
10%
5%
5%
2021
16.2% 15.3%
9.5%
5%
2020
18.2%
15%
16.0%
10%
25%
2024
2025
2026
0%
0%
2020
2021
2022
2023
2024
2025
2026
2020
2021
2022
2023
2024
2025
2026
Forecast
Forecast
Forecast
予想
予想
予想
Return On Equity (ROE) 自己資本利益率(ROE)
Return On Assets (ROA) 総資産利益率(ROA)
ROE = { Net Profit ÷ [ ( Equity Capital at the Beginning of Period+ Equity
Capital at the Ending of Period ) ÷ 2 ] } × 100
ROA = { Ordinary Profit ÷ [( Total Assets at the Beginning of Period+
Total Assets at the Ending of Period ) ÷ 2 ]} × 100
[当期純利益 ÷{(期首自己資本 + 期末自己資本)÷ 2 }]× 100
[経常利益 ÷{(期首総資産+期末総資産)÷ 2 }]× 100
Return On Invested Capital (ROIC) 投下資本利益率(ROIC)
ROIC = NOPAT(Net Operating income After Tax)÷Invested Capital(Equity
+Liabilities at year end)×100
NOPAT(税引き後営業利益)÷ 投下資本(期末株主資本+期末有利子負債)× 100
12
Equity Ratio
自己資本比率
Quarterly Trend 四半期トレンド
Annual Trend 年間トレンド
Millions of Yen 百万円
Millions of Yen 百万円
40,000
100%
35,000
30,000
25,000
20,000
15,000
67.2%
42.9%
38.5% 39.5%
43.4%
49.4%
51.1%
72.8%
78.0%
76.9%
53.9%
80%
79.9%
75.3%
31,213
4,662 4,945
5,550 5,766
7,505
75.3%
35,000
82.8%
81.7%
80.3%
80%
67.2%
60%
60%
28,684
30,000 43.4%
28,972
28,319
27,620
26,855
25,350
25,765
25,427
25,489
25,214
24,317
24,973
24,285
23,791
23,733
24,036
24,014
23,572
23,441
23,430
22,540
22,059
22,099
21,907
21,672
20,262
20,581
20,138
20,059
20,001
19,586
18,473
18,383
18,296
17,324
15,348 15,894
14,678 15,149
13,835
13,273
12,951
12,533
12,119
6,835
100%
84.1% 82.8% 81.9%81.7%
28,684
10,000
5,000
71.9%
81.6%81.7% 83.3%83.3%
80.3% 80.9%
77.7% 79.4%
40,000
28,319
40%
40%
20%
0%
24,973
23,430
22,540
23,441
20%
20,059
20,000
15,000
8,275
24,285
25,000
0%
18,296
15,149
13,273
10,000
5,766
5,000
0
Q1
Q2
Q3
2020
Q4
Q1
Q2
Q3
2021
Q4
Q1
Q2
Q3
2022
Total assets 資産合計
Q4
Q1
Q2
Q3
2023
Q4
Q1
Q2
Q3
2024
Total net assets 純資産合計
Q4
Q1
Q2
Q3
2025
Q4
Q1
Q2
Q3
2026
Equity ratio 自己資本比率
Q4
0
2020
2021
2022
2023
2024
2025
13
Number of Employees
人員推移
Quarterly Trend 四半期トレンド
People 人
2,000
1,628
1,583
1,551
1,578 1,581 1,600
1,639
1,693
1,662 1,664 1,659
1,710
1,500
797
740
733
1,549 1,560 1,536
1,528
1,460
775
754
749
770
808
849
817
794
795
1,792
1,632
1,658
1,482
1,755
1,430
1,488
1,524
1,395
755
961
733
703
685
1,000
830
829
811
677
766
825
1,015 1,064
Sri Lanka
(スリランカ)
946
Malaysia
(マレーシア)
157
160
157
109
164
141
132
146
145
162
146
170
130
179
127
180
134
189
144
192
167
188
171
177
189
190
371
353
351
365
358
360
365
360
344
351
355
363
171
171
178
181
214
212
207
190
196
190
182
189
186
168
146
135
184
179
163
167
170
171
178
179
141
500
375
186
252
215
203
200
204
203
197
210
207
203
200
194
179
143
147
146
147
152
158
161
159
161
165
164
161
161
167
168
167
165
166
169
171
166
167
167
164
163
164
Q1
Q2
Q3
Q4
Q1
Q2
Q3
Q4
Q1
Q2
Q3
Q4
Q1
Q2
Q3
Q4
Q1
Q2
Q3
Q4
Q1
Q2
Q3
Q4
Q1
Q2
Dongguan, China
(中国東莞)
Suzhou, China
(中国蘇州)
Japan and others
(日本ほか)
0
2020
2021
2022
2023
2024
2025
Q3
Q4
2026
14
Consolidated Balance Sheet (Current Assets / Non-Current Assets)
連結貸借対照表(流動資産 / 有形固定資産)
2021
Millions of Yen 百万円
Assets
資産の部
Current assets
流動資産
Cash and deposits
現金及び預金
Notes and accounts receivable - trade
受取手形及び売掛金
2022
Q3
Q4
Q2
9,657 10,275 17,366 16,633 17,985 17,597 17,227 16,697 17,320 17,121 16,735 16,759 18,345 17,982 18,331 13,184 13,859
15,315 17,027 17,491 19,097
3,108
3,563
4,135 10,951
9,211 10,496 10,158 10,363
9,658 10,139 10,758 10,864 10,482 11,026 10,623
3,899
4,049
3,985
4,003
3,019
3,041
Q1
Q2
3,110
Q3
2,693
Q4
2,450
Q1
2,733
Q2
受取手形、売掛金及び契約資産
756
電子記録債権
883
904
909
994
922
921
953
937
951
Work in process
仕掛品
Raw materials and supplies
原材料及び貯蔵品
Others
その他
Non-current assets
固定資産
Property, plant and equipment assets
有形固定資産
Buildings and structures, net
建物及び構築物(純額)
Machinery, equipment and vehicles, net
機械装置及び運搬具(純額)
Tools, furniture and fixtures, net
工具、器具及び備品(純額)
Land
土地
Leased assets, net
リース資産(純額)
Construction in progress
建設仮勘定
Q2
Q3
Q4
Q1
Q2
5,589
6,520
7,271
8,517
9,816 11,005
3,428
3,013
2,735
3,376
3,734
4,144
3,497
4,239
1,000
1,008
1,038
1,008
1,056
1,109
1,179
460
32
1,801
800
100
400
400
499
697
有価証券
製品
Q1
9,327
Securities
Finished goods
Q4
Q3
Q4
3,617
Notes and accounts receivable – trade, and contract assets
Electronically recorded monetary claims-operating
Q3
2026
8,882
3,388
Q4
2025
Q2
3,600
Q3
2024
Q1
3,257
Q1
2023
518
556
632
711
759
961
1,145
1,066
1,359
1,397
1,068
979
904
945
1,013
1,019
985
979
946
956
1,091
1,096
343
325
331
343
400
385
437
362
316
326
383
351
426
390
379
481
540
375
469
455
471
518
740
797
856
970
1,016
1,218
1,142
1,067
1,090
1,148
1,007
888
947
1,058
1,125
1,210
1,062
1,021
1,024
978
1,249
1,270
272
365
334
375
358
417
415
332
331
277
256
263
313
305
403
439
462
428
359
395
404
237
4,952
5,021
5,073
5,173
5,466
5,805
5,974
7,057
7,339
7,894
8,229
8,237
8,668
9,274
8,872 10,353 10,830 10,457
10,449 11,291 11,481 12,116
4,211
4,294
4,336
4,425
4,766
4,995
5,148
6,210
6,458
6,942
7,151
7,117
7,443
7,618
7,248
8,160
7,790
7,621
7,710
8,132
8,238
8,385
851
908
893
908
907
934
945
959
948
963
1,473
1,406
1,423
1,441
1,453
1,503
1,430
1,384
1,374
1,406
1,446
1,446
2,217
2,231
2,223
2,315
2,509
2,710
2,820
2,758
2,760
2,945
2,901
2,756
2,902
3,036
2,854
3,037
2,845
2,795
2,797
2,930
2,960
3,022
482
494
482
483
491
490
516
503
499
498
495
476
560
545
521
567
592
656
651
745
761
749
143
143
143
143
143
143
143
143
143
143
143
143
143
143
143
756
756
756
756
756
756
756
425
406
384
373
373
366
351
1,609
1,611
1,673
1,683
1,895
1,950
2,024
1,868
1,939
1,801
1,714
1,733
1,853
1,881
1,899
91
110
208
199
340
349
371
236
494
717
454
439
462
426
406
356
363
314
396
438
432
511
15
Consolidated Balance Sheet (Intangible assets / Investments and Other Assets)
連結貸借対照表(無形固定資産・投資その他の資産)
2021
Millions of Yen 百万円
Assets
資産の部
Intangible assets
無形固定資産
2022
2023
2024
Q2
Q3
Q4
Q1
Q2
Q3
Q4
Q1
Q2
Q3
Q4
Q1
Q2
Q3
Q4
Q1
Q2
Q3
Q4
Q1
Q2
96
95
93
94
97
101
104
134
172
240
296
330
366
790
796
899
921
694
718
759
788
866
325
308
291
292
のれん
その他
Investments and other assets
投資その他の資産
Investment securities
投資有価証券
Deferred tax assets
繰延税金資産
Others
その他
Allowance for doubtful accounts
貸倒引当金
Total assets
資産合計
2026
Q1
Goodwill
Others
2025
96
95
93
94
97
101
104
134
172
240
296
330
366
464
487
608
629
694
718
759
788
866
644
631
642
653
602
708
721
711
707
711
780
789
858
865
828
1,292
2,118
2,142
2,020
2,400
2,453
2,863
236
249
226
246
227
331
350
324
349
365
405
385
388
377
330
856
1,708
1,781
1,670
1,952
2,000
2,466
227
199
231
217
179
158
148
178
173
148
180
210
276
287
298
228
205
158
145
236
241
182
187
189
191
189
195
218
222
209
185
196
194
193
193
200
199
208
204
202
204
210
211
213
△6
△6
△6
Q3
Q4
13,835 14,678 15,348 22,540 22,099 23,791 23,572 24,285 24,036 25,214 25,350 24,973 25,427 27,620 26,855 28,684 24,014 24,317 25,765 28,319 28,972 31,213
16
Consolidated Balance Sheet (Current Liabilities)
連結貸借対照表(流動負債)
2021
Millions of Yen 百万円
Liabilities
負債の部
Current liabilities
流動負債
Accounts payable - trade
買掛金
Short-term borrowing
短期借入金
Current portion of bonds payable
1年内償還予定の社債
Current portion of long-term borrowings
1年内返済予定の長期借入金
Leased obligation
リース債務
Accounts payable - other
未払金
Income taxes payable
未払法人税等
Provision for bonuses
賞与引当金
2022
2025
2026
Q2
Q3
Q4
Q1
Q2
Q3
Q4
Q1
Q2
Q3
Q4
Q1
Q2
Q3
Q4
Q1
Q2
Q3
Q4
Q1
Q2
4,336
4,714
4,850
5,313
4,380
4,801
3,737
3,375
3,127
3,220
2,915
2,522
2,504
3,155
2,758
2,945
1,841
1,946
1,942
2,584
2,902
3,268
553
715
769
897
832
1,064
784
684
767
576
406
476
547
755
754
700
597
754
898
961
1,216
1,201
1,549
1,548
1,553
1,573
1,513
1,271
603
441
345
346
345
196
16
16
9
9
928
876
832
800
751
726
697
676
643
607
574
517
470
413
270
208
80
27
154
151
138
126
119
111
111
135
138
134
127
127
129
138
139
139
125
116
112
133
143
150
343
340
316
450
380
418
423
465
468
396
497
422
389
390
440
379
432
353
337
421
501
443
433
738
833
1,060
406
911
711
615
334
773
501
402
480
1,025
659
1,068
72
312
92
604
473
1,015
152
101
201
64
165
106
213
65
175
120
256
70
190
135
255
74
198
132
268
76
204
160
27
7
15
22
40
8
16
24
34
8
16
282
289
247
215
334
326
233
209
352
354
280
33
役員賞与引当金
その他
2024
Q1
Provision for bonuses for directors
Others
2023
206
225
194
296
30
212
190
191
260
254
264
206
Q3
Q4
34
17
Consolidated Balance Sheet (Non-current Liabilities)
連結貸借対照表(固定負債)
2021
Millions of Yen 百万円
Liabilities
負債の部
Non-current liabilities
固定負債
Long-term borrowings
長期借入金
Lease liabilities
リース債務
Deferred tax liabilities
繰延税金負債
Retirement benefit liabilities
退職給付に係る負債
Asset retirement obligations
資産除去債務
Others
その他
Total liabilities
負債合計
2022
2023
2024
2025
2026
Q1
Q2
Q3
Q4
Q1
Q2
Q3
Q4
Q1
Q2
Q3
Q4
Q1
Q2
Q3
Q4
Q1
Q2
Q3
Q4
Q1
Q2
Q3
2,663
2,458
2,222
2,076
1,823
1,665
1,451
2,613
2,435
2,407
2,296
2,391
2,341
2,405
2,189
2,309
2,171
2,108
2,150
2,293
2,336
2,456
1,926
1,751
1,530
1,402
1,175
1,025
832
726
532
417
282
208
80
52
496
466
445
434
429
424
398
1,623
1,620
1,686
1,701
1,902
1,956
2,036
1,876
1,961
1,833
1,770
1,801
1,920
1,954
1,979
48
47
49
53
37
36
37
82
96
110
115
80
99
108
105
127
120
120
130
148
154
254
113
114
119
109
103
102
105
104
109
116
120
123
129
133
132
145
142
142
143
149
153
147
65
65
65
65
65
66
66
66
66
66
67
67
67
67
67
68
68
68
68
69
69
69
12
12
12
11
11
10
10
10
9
9
8
8
8
7
7
6
6
6
5
5
5
4
7,000
7,173
7,073
7,390
6,204
6,466
5,189
5,988
5,562
5,628
5,212
4,913
4,845
5,561
4,948
5,254
4,012
4,054
4,092
4,877
5,239
5,724
Q4
18
Consolidated Balance Sheet (Net Assets)
連結貸借対照表(純資産)
2021
Millions of Yen 百万円
Net Assets
純資産の部
Shareholders’ equity
株主資本
Share capital
資本金
Capital surplus
資本剰余金
Retained earnings
利益剰余金
Treasury shares
自己株式
Accumulated other comprehensive income
その他の包括利益累計額
Valuation difference on available-for-sale securities
その他有価証券評価差額金
Foreign currency translation adjustment
為替換算調整勘定
Total net assets
純資産合計
Total liabilities and net assets
負債・純資産合計
2022
Q4
Q1
Q2
2023
Q3
Q4
Q1
Q2
2024
Q3
Q4
Q1
Q2
2025
Q3
Q4
Q1
Q2
2026
Q1
Q2
Q3
Q3
Q4
Q1
Q2
6,558
7,188
7,919 14,578 14,978 15,913 16,796 17,221 17,291 18,070 18,449 18,629 18,815 19,893 20,325 21,353 18,281 18,675 19,825 21,063 21,106 22,347
350
350
350
350
350
350
350
350
350
350
350
350
350
350
350
350
350
350
350
350
350
350
29
29
29
5,607
5,607
5,610
5,614
5,648
5,648
5,648
5,648
5,648
5,648
5,658
5,658
5,658
3,404
3,397
3,397
3,397
3,397
3,406
6,543
7,172
7,903
8,642
9,043
9,974 10,850 11,223 11,293 12,073 12,452 12,633 12,818 13,884 14,318 15,345 14,764 15,141 16,290 17,528 17,572 18,797
△ 363 △ 363 △ 363
△ 22
△ 22
△ 21
△ 18
△0
△0
△0
△1.2
△1
△1
△0
△1
△1
△236
△213
△213
△213
△213
△206
276
316
356
571
915
1,410
1,586
1,074
1,182
1,515
1,688
1,429
1,766
2,166
1,581
2,076
1,720
1,586
1,847
2,377
2,626
3,142
△5
△1
△ 16
6
△2
3
18
1
20
31
22
7
8
1
△33
△16
0
△0
42
67
87
396
281
318
373
564
917
1,407
1,568
1,073
1,162
1,484
1,666
1,422
1,758
2,164
1,614
2,093
1,719
1,587
1,804
2,309
2,539
2,746
6,835
7,505
8,275 15,149 15,894 17,324 18,383 18,296 18,473 19,586 20,138 20,059 20,581 22,059 21,907 23,430 20,001 20,262 21,672 23,441 23,733 25,489
Q3
Q4
13,835 14,678 15,348 22,540 22,099 23,791 23,572 24,285 24,036 25,214 25,350 24,973 25,427 27,620 26,855 28,684 24,014 24,317 25,765 28,319 28,972 31,213
19
Consolidated Statement of Income
連結損益計算書
2021
Millions of Yen 百万円
Net sales
売上高
Cost of sales
売上原価
Gross profit
売上総利益
Selling, general and administrative expenses
販売費及び一般管理費
Operating profit
営業利益
Non-operating income
営業外収益
Interest income and dividend income
受取利息及び配当金
Foreign exchange gains
為替差益
Gain on sale of goods
物品売却益
Others
その他
Non-operating expenses
営業外費用
Interest expenses
支払利息
2022
2023
2024
2025
Q1
Q2
Q3
Q4
Q1
Q2
Q3
Q4
Q1
Q2
Q3
Q4
Q1
Q2
Q3
Q4
Q1
Q2
Q3
Q4
Q1
Q2
3,498
3,499
3,670
3,950
3,954
4,004
3,943
3,771
3,521
3,502
3,331
3,117
3,413
4,294
4,430
3,786
3,558
4,316
4,604
4,973
4,544
5,478
1,982
2,068
2,097
2,412
2,382
2,458
2,288
2,399
2,049
2,023
2,004
1,916
2,112
2,418
2,324
2,183
2,159
2,461
2,488
2,732
2,579
2,926
1,516
1,430
1,573
1,538
1,571
1,546
1,654
1,372
1,471
1,479
1,327
1,201
1,301
1,875
2,105
1,602
1,398
1,854
2,116
2,241
1,965
2,551
413
460
454
604
509
566
581
603
625
639
718
683
665
722
719
837
728
712
731
815
747
819
1,102
970
1,119
934
1,062
979
1,072
769
846
839
608
517
635
1,152
1,385
765
670
1,141
1,385
1,425
1,217
1,731
223
△1
36
98
251
469
299
△393
61
543
226
△314
526
504
△781
790
69
27
21
32
133
117
0
2
2
3
1
2
4
6
7
35
31
28
56
42
74
40
54
24
27
20
34
21
191
△8
29
71
201
449
282
△425
30
496
185
△349
449
460
△866
745
94
82
25
1
2
3
2
8
6
8
0
0
0
2
0
5
4
2
20
48
10
6
17
24
10
10
5
19
1
9
5
14
2
△6
12
4
12
15
18
23
60
16
16
15
21
25
80
47
24
31
34
31
25
438
173
△121
△262
22
25
16
17
16
16
15
16
15
20
23
23
23
22
25
30
28
23
21
21
21
22
22
24
412
148
△147
△301
Foreign exchange losses
為替差損
Listing expenses
その他
Ordinary income
経常利益
Q3
Q4
45
上場関連費用
Others
2026
0
1
7
0
0
0
0
0
2
57
24
1
5
3
3
2
4
2
3
16
1,308
950
1,132
972
1,299
1,432
1,356
354
882
1,302
787
179
1,130
1,622
572
1,530
301
996
1,529
1,720
1
1,327
1,824
20
Consolidated Statement of Income
連結損益計算書
2021
Millions of Yen 百万円
Q1
Q2
2022
Q3
Extraordinary income
特別利益
Gain on sale of non-current assets
固定資産売却益
Q4
Q1
Q2
2023
Q3
Q4
Q1
0
0
0
0
0
0
0
0
0
0
0
0
Q2
2024
Q3
Q4
Q1
Q2
2025
Q3
Q4
Q1
Q2
8
Loss on sale and retirement of non-current assets
固定資産除売却損
△6
0
10
0
1
0
0
37
1
0
1
0
1
0
0
37
Impairment losses
減損損失
Loss on sale of investment securities
投資有価証券評価損
Profit before income taxes
税金等調整前四半期純利益
Total corporate tax, etc.
法人税等合計
Income taxes - current
法人税、住民税及び事業税
Income tax adjustment
法人税等調整額
Profit
四半期純利益
Profit attributable to owners of parent
親会社株主に帰属する当期純利益
Q4
Q1
Q2
Q3
Q4
155
補助金収入
特別損失
Q3
155
Subsidy income
Extraordinary losses
2026
98
146
310
4
4
97
145
310
8
△8
1,300
957
1,132
961
1,299
1,431
1,356
354
882
1,264
689
32
1,130
1,622
572
1,530
301
685
1,684
1,716
1,327
1,824
439
327
401
222
412
500
480
△19
318
485
309
△147
405
556
139
502
73
308
534
478
429
599
423
302
425
214
385
482
477
△40
307
456
331
△92
452
549
132
421
66
258
531
558
434
580
16
24
△ 23
8
26
17
3
21
10
28
△ 22
△55
△46
6
6
80
7
50
3
△80
△4
18
860
629
730
738
886
930
875
373
564
779
379
180
724
1,066
433
1,027
227
377
1,149
1,237
897
1,225
860
629
730
738
886
930
875
373
564
779
379
180
724
1,066
433
1,027
227
377
1,149
1,237
897
1,225
9
21
Consolidated Statement of Cash Flows
連結キャッシュフロー計算書
2021
Millions of Yen 百万円
Q2
Cash flows from operating activities 営業活動によるキャッシュ・フロー
Profit before income taxes 税金等調整前純利益
Depreciation 減価償却費
2022
Q4
Q2
2023
Q4
Q2
2024
Q4
Q2
2,067
1,710
2,126
803
2,540
4,083
2,257
2,093
2,730
1,711
2,147
721
2,753
2,102
986
3,400
3,151
278
304
327
364
373
406
459
488
478
494
504
243
Foreign exchange losses (gains) 為替差損益(△は益)
△ 49
△ 1,176
39
Listing related costs 上場関連費用
119
Increase (decrease) in retirement benefit liability 退職給付に係る負債の増減額
Loss (gain) on valuation of investment securities 投資有価証券評価損益(△は益)
Loss (gain) on sale and retirement of non-current assets 固定資産除売却損益(△は益)
Increase (decrease) in accounts payable – other 未払金の増減額(△は減少)
Decrease (increase) in other assets その他の資産の増減額(△は増加)
Increase (decrease) in other liabilities その他の負債の増減額(△は減少)
Subtotal 小計
Interest and dividends received 利息及び配当金の受取額
△6
△5
310
17
34
39
△3
31
△ 10
△ 42
△59
△99
△114
△79
△47
△55
36
46
46
56
51
43
44
47
△ 40
45
△ 58
47
△ 75
46
△198
△85
230
△181
△70
107
△ 320
△ 318
519
36
659
△1,131
490
△467
△664
1,261
△ 31
△ 270
630
7
△314
201
154
△397
57
△ 323
△ 134
△99
222
△44
96
125
178
38
△ 37
52
△47
62
△58
58
△57
82
△ 33
△ 10
30
△ 30
27
△12
25
△23
18
△18
2
9
8
5
12
1
2
△4
32
△ 284
143
9
Loss (gain) on sale of investment securities 投資有価証券売却損益(△は益)
Increase (decrease) in provision for bonuses for directors (and other officers) 役員賞与引当金の増減額(△は減少)
Q4
1,510
△3
33
Increase (decrease) in provision for bonuses 賞与引当金の増減額(△は減少)
Q2
1,557
Interest expenses 支払利息
Increase (decrease) in trade payables 仕入債務の増減額(△は減少)
Q4
1,197
Increase (decrease) in allowance for doubtful accounts 貸倒引当金の増減額(△は減少)
Decrease (increase) in inventories 棚卸資産の増減額(△は増加)
Q2
2,143
Amortization of goodwill のれん償却額
Decrease (increase) in trade receivables 売上債権の増減額(△は増加)
Q4
2026
889
Impairment loss 減損損失
Interest and dividend income 受取利息及び受取配当金
2025
41
△ 28
2
△ 21
1
△ 26
△3
△ 19
1,446
2
△ 36
33
△6
△1
△ 14
1
1
53
△ 32
△ 33
△ 15
37
4
△ 17
△ 93
40
△13
△27
10
16
34
△ 36
75
4
△20
△67
37
△23
42
107
△ 41
49
△90
110
△154
△6
△109
2,531
△ 146
2,229
2,347
2,091
2,755
2,018
2,603
1,771
3,398
4,652
4
1
8
39
61
98
113
79
44
53
103
Interest paid 利息の支払額
△ 34
△ 32
△ 31
△ 34
△ 49
△43
△56
△52
△43
△44
△45
Income taxes paid 法人税等の支払額
△ 525
△ 360
△ 1,002
△ 763
△ 571
△655
△350
△548
△1,004
△857
△577
22
Consolidated Statement of Cash Flows
連結キャッシュフロー計算書
2021
Millions of Yen 百万円
Cash flows from investing activities 投資活動によるキャッシュ・フロー
Payments into time deposits
2022
2023
Q2
Q4
Q2
Q4
Q2
△ 172
△ 233
△ 553
△1,396
定期預金の払戻による収入
Purchase of property, plant and equipment
有形固定資産の取得による支出
△ 345
△ 237
△ 449
△1
Q4
Q2
Q4
Q2
166
△1,200
△311
△2,803
△342
△855
△863
△158
1,083
△100
301
△956
148
1,031
△440
5
△ 417
△ 792
△645
△404
△1,029
△301
△388
△393
△100
△463
△298
△3
△3
△ 104
△0
△65
△54
△137
△0
△156
△503
△95
△1,061
△57
△204
△99
△99
7
2
0
△ 100
11
△2
△ 14
21
30
0
△69
△4
△22
△0
△3
△ 804
5,368
△ 1,422
△ 1,163
△ 1,044
△533
△1,276
△360
△3,550
△96
△925
△ 557
△7
△ 424
△7
△ 451
△9
△ 349
△ 376
△299
△369
△257
△181
△27
△ 106
△ 45
4
△ 75
△ 78
△ 400
△ 79
△ 809
△ 62
△ 105
△ 66
△155
△78
△294
△72
△33
△68
△69
△68
△70
△0
△0
△0
△636
△2,490
△ 494
143
△0
△34
△539
303
174
300
Proceeds from redemption of securities 投資有価証券の償還による収入
Other, net その他
Cash flows from financing activities 財務活動によるキャッシュ・フロー
Repayments of long-term borrowings
Redemption of bonds
長期借入金の返済による支出
社債の償還による支出
Listing related costs 上場関連費用
Net increase (decrease) in short-term borrowings
短期借入金の純増減額(△は減少)
Repayments of lease liabilities リース債務の返済による支出
Proceeds from sale and lease back transactions
100
セール・アンド・リースバックによる収入
Regarding purchase of treasury stock 自己株式の取得による支出
5,920
3
△ 57
149
110
△ 485
322
△ 130
現金及び現金同等物の増減額
62
7,388
299
426
3,501
3,563
△ 1,133
10,496
776
現金及び現金同等物の期首残高
△ 455
10,951
9,362
10,139
Cash and cash equivalents at end of period 現金及び現金同等物の期末残高
3,563
10,951
10,496
9,362
10,139
10,439
Proceeds from sales of treasury shares 自己株式の売却による収入
Dividends paid 配当金の支払額
Effect of exchange rate change on cash and cash equivalents
Net increase (decrease) in cash and cash equivalents
Cash and cash equivalents at beginning of period
Q4
△4
10
Purchase of investment securities 投資有価証券の取得による支出
Proceeds from sale of investment securities 投資有価証券の売却による収入
2026
Q2
Purchase of securities 有価証券の取得による支出
Purchase of intangible assets 無形固定資産の取得による支出
2025
Q4
△ 1,000
定期預金の預入による支出
Proceeds from withdrawal of time deposits
2024
現金及び現金同等物に係る換算差額
58
△28
△809
△189
308
△854
193
△3,278
9,799
1,897
2,487
10,439
△1,066
10,865
6,520
8,417
10,865
9,799
6,520
8,417
10,905
23
Disclaimer
This material is intended solely for the purpose of providing
information that will serve as a reference for investment decisions, and
is not intended to solicit the purchase or sale of the Company's shares.
Please make investment decisions based on your own judgment.
Forward-looking statements
Although this document contains forecasts and prospects for the future,
these are based on information available to the Company at the present
time and are subject to change due to trends in economic trends, raw
material prices, foreign exchange rates, and other factors.
免責事項
本資料は投資判断の参考となる情報提供のみを目的とし、当社株式の
売買等を勧誘するものではありません。投資に関する決定は、投資家
ご自身の判断において行われるようお願いします。
見通しに関する注意事項
本資料には将来についての予想や見通しが含まれていますが、これらは
当社が現時点で入手可能な情報に基づいており、経済動向や原材料価格、
為替相場等の動向により変動することがあります。