自己株券買付状況報告書(法24条の6第1項に基づくもの)
Bull 3
Bear 0
Capital return
6501
Fiscal year ends March
Quarters are offset from the calendar — Q1 is Apr–Jun
|
Hitachi, Ltd. is a diversified technology group operating across four main sectors: Digital Systems & Services, Energy, Mobility, and Connected Industries. The company develops, manufactures, and sells products and services including IT infrastructure, power grids, nuclear energy, rail systems, elevators, home appliances, and industrial equipment. Key digital offerings include the Lumada platform and HMAX AI solutions, which leverage domain knowledge and data analytics to provide digital services for social infrastructure. Major subsidiaries include Hitachi Vantara, Hitachi Energy, Hitachi Rail, Hitachi Astemo, and Hitachi High-Tech. The group serves customers globally, with regional operations managed through subsidiaries in the Americas, Asia, Europe, and India. Hitachi was founded in 1910 and has integrated its IT and operational technology capabilities to offer comprehensive solutions for energy, mobility, and industrial sectors. Summarised from the annual report, fiscal year ended Mar 2026 |
Industry Conglomerates | Homepage hitachi.com |
| Sector Industrials | IR page hitachi.com/ja-jp | |
|
Tags
digital infrastructure, power grids, nuclear energy, rail systems, elevators, home appliances, industrial equipment, ai solutions, cloud services, semiconductor manufacturing equipment, Lumada, HMAX, Hitachi Vantara, Hitachi Energy, Hitachi Rail, Hitachi Astemo, Hitachi High-Tech, Hitachi Global Life Solutions, Hitachi Plant Construction, Hitachi Systems, Hitachi Solutions, Hitachi Channel Solutions, Hitachi Digital, Hitachi Digital Services, Hitachi Payment Services, Hitachi Vantara Manufacturing, Hitachi GE Vernova Nuclear Energy, Hitachi Industrial Products, Hitachi Industrial Control Solutions, Hitachi Plant Services, Hitachi Power Solutions, Hitachi Elevator (China), Hitachi Global Air Power US, Hitachi Industrial Holdings Americas, JR Technology Group, Arcelik Hitachi Home Appliances, Hitachi Real Estate Partners, Hitachi America, Hitachi Asia, Hitachi (China), Hitachi Europe, Hitachi India, GlobalLogic Worldwide Holdings
|
Press page — |
Metrics
| Valuation | |
|---|---|
| Market cap | ¥ 24.787T |
| Market cap (USD) | $ 154.92B |
| P/E | 32.86 |
| PEG | 4.49 |
| P/BV | 3.69 |
| P/S | 2.17 |
| P/OCF | 14.43 |
| P/FCF | 21.55 |
| Dividend yield | 0.91% |
| Turnover / mcap | — |
| Returns | |
|---|---|
| ROE | 12.5% |
| ROI | 11.8% |
| ROIC | 11.8% |
| Profit margin | 7.6% |
| Growth | |
|---|---|
| Revenue growing | Yes |
| Profits growing | Yes |
| Revenue up 3y | No |
| Revenue up 5y | No |
| Earnings growth 3y (net profit CAGR) | 7.3% |
| Quality | |
|---|---|
| Profitable | Yes |
| Margin expanding | Yes |
| Buying back stock | Yes |
| Diluting (TTM) | No |
| Debt/Equity | — |
| Podcast bulls (TTM) | Sign up |
| Podcast bears (TTM) | Sign up |
| Podcast sentiment (TTM) | Sign up |
| Podcast sentiment % (TTM) | Sign up |
| News sentiment (TTM) | 0 |
| Quality score | 26.3% |
| Insiders | |
|---|---|
| Buys, 1w | Sign up |
| Buys, 1m | Sign up |
| Buys, 1y | Sign up |
| Sells, 1w | Sign up |
| Sells, 1m | Sign up |
| Sells, 1y | Sign up |
Sign up to see this company's insider trades
| Figure | FY 2026 | FY 2025 | FY 2024 | FY 2023 | FY 2022 | FY 2021 | FY 2020 | FY 2019 | FY 2018 | FY 2017 | FY 2016 | FY 2015 | FY 2014 | FY 2013 |
|---|---|---|---|---|---|---|---|---|---|---|---|---|---|---|
| Revenue | 10.587T | 9.783T | 9.729T | 10.881T | 10.265T | 8.729T | 8.767T | 9.481T | 9.369T | 9.162T | 10.034T | 9.775T | 9.666T | 1.912T |
| Net profit | 802.368B | 615.724B | 589.896B | 649.124B | 583.47B | 501.613B | 87.596B | 222.546B | 362.988B | 231.261B | 172.155B | 217.482B | 264.975B | 57.681B |
| Free cash flow | 1.17T | 925.393B | 723.738B | 574.407B | 432.975B | 538.378B | 238.026B | 227.674B | — | — | — | — | — | — |
| Figure | FY 2026 | FY 2025 | FY 2024 | FY 2023 | FY 2022 | FY 2021 | FY 2020 | FY 2019 | FY 2018 | FY 2017 | FY 2016 | FY 2015 | FY 2014 | FY 2013 |
|---|---|---|---|---|---|---|---|---|---|---|---|---|---|---|
| Share price | 4.464K | 3.456K | 13.89K | 7.272K | 6.174K | 5.01K | 3.139K | 3.591K | 772.02 | 603.35 | 2.637K | 4.117K | 762.28 | 543.56 |
| Price performance 12m | 0.29 | -0.75 | 0.91 | 0.18 | 0.23 | 0.6 | -0.13 | 3.65 | 0.28 | -0.77 | -0.36 | 4.4 | 0.4 | — |
Filed figures
Lines the statements and their notes report beside the headline figures, read from the filings' XBRL as filed (no restatement applied), with figures computed from one filing's own lines. Cash-flow lines carry their cash direction: an outflow is negative. Each period links to its filing; a figure's period, report date and tag are in its tooltip.
| Figure | Mar 2017 | Mar 2018 | Mar 2019 | Mar 2020 | Mar 2021 | Mar 2022 | Mar 2023 | Mar 2024 | Mar 2025 | Mar 2026 |
|---|---|---|---|---|---|---|---|---|---|---|
| Balance sheet detail | ||||||||||
| Borrowings, current (JPY) | — | 121B | 111B | 183B | 417B | 1.23T | 778B | 37.8B | 73.1B | 43.4B |
| Cash and deposits (JPY) | 765B | 698B | 808B | 812B | 1.02T | 969B | 833B | 705B | 866B | 1.32T |
| Intangible assets (JPY) | — | 1.05T | 960B | 480B | — | — | — | — | — | — |
| Right-of-use assets (JPY) | — | — | — | — | — | 312B | 243B | 225B | 250B | 296B |
| Net debt (borrowings + leases - cash) (JPY) | — | -577B | -697B | -629B | -599B | 265B | -55.6B | -668B | -793B | -1.28T |
| Cash flow detail | ||||||||||
| Operating cash flow (JPY) | 630B | 727B | 610B | 561B | 793B | 730B | 827B | 957B | 1.17T | 1.67T |
| Purchases of property, plant and equipment (JPY) | — | -352B | -382B | -323B | -255B | -297B | -253B | -233B | -247B | -352B |
| Purchases of intangible assets (JPY) | — | -91.5B | -89.9B | -98.4B | -118B | -143B | -158B | -152B | -145B | -146B |
| Change in inventories (cash effect) (JPY) | — | -181B | -150B | -143B | -47.9B | -330B | -244B | -88.3B | -42.8B | -125B |
| Dividends paid (cash effect) (JPY) | — | -67.6B | -77.2B | -91.7B | -96.6B | -111B | -129B | -144B | -189B | -205B |
| Share buybacks (cash effect) (JPY) | — | -292M | -231M | -166M | -159M | -251M | -200B | -100B | -200B | -352B |
| Interest paid (cash effect) (JPY) | — | -21.6B | -22.5B | -24.9B | -22.4B | -26.7B | -49.8B | -69.2B | -50.1B | -35.4B |
| Free cash flow (OCF - PPE - intangibles) (JPY) | — | 284B | 138B | 140B | 420B | 290B | 416B | 571B | 781B | 1.17T |
| Income detail | ||||||||||
| Research and development expense (JPY) | — | — | 323B | 294B | 294B | 317B | 316B | 290B | 259B | 290B |
| ↳ 5y CAGR | -2.1% | -2.5% | -0.2% | |||||||
| Total comprehensive income (JPY) | — | 516B | 263B | -11.1B | 935B | 1.13T | 1.02T | 1.08T | 563B | 1.33T |
| Comprehensive income to owners (JPY) | 299B | 382B | 171B | -8.47B | 838B | 958B | 906B | 1.01T | 523B | 1.27T |
| Segments | ||||||||||
| Automotive Systems · Segment revenue (JPY) | — | 1T | 971B | — | 988B | 1.6T | 1.92T | 1.16T | — | — |
| ↳ YoY growth | -3.0% | +61.8% | +20.2% | -39.4% | ||||||
| Automotive Systems · Segment operating income (JPY) | — | — | — | — | — | 62.3B | 73.4B | 50.7B | — | — |
| Connective Industries · Segment revenue (JPY) | — | — | — | — | — | 2.75T | 2.98T | 3.06T | 3.16T | 3.26T |
| ↳ YoY growth | +8.1% | +2.8% | +3.4% | +3.1% | ||||||
| Connective Industries · Segment operating income (JPY) | — | — | — | — | — | 258B | 312B | 321B | 362B | 367B |
| Construction Machinery · Segment revenue (JPY) | — | 959B | 1.03T | — | — | — | — | — | — | — |
| ↳ YoY growth | +7.8% | |||||||||
| Digital Systems And Services · Segment revenue (JPY) | — | — | — | — | — | 2.15T | 2.39T | 2.6T | 2.83T | 2.94T |
| ↳ YoY growth | +10.9% | +8.8% | +9.0% | +3.8% | ||||||
| Digital Systems And Services · Segment operating income (JPY) | — | — | — | — | — | 281B | 294B | 333B | 397B | 450B |
| Electronic Systems And Equipment · Segment revenue (JPY) | — | 1.09T | 951B | — | — | — | — | — | — | — |
| ↳ YoY growth | -12.5% | |||||||||
| Energy · Segment revenue (JPY) | — | — | 454B | 399B | 1.11T | 1.45T | — | — | 2.63T | 3.22T |
| ↳ YoY growth | -12.1% | +177.5% | +30.7% | +22.6% | ||||||
| Energy · Segment operating income (JPY) | — | — | — | — | — | — | — | — | 252B | 416B |
| Green Energy And Mobility · Segment revenue (JPY) | — | — | — | — | — | 2.05T | 2.49T | 3.05T | 3.92T | — |
| ↳ YoY growth | +21.5% | +22.5% | +28.3% | |||||||
| Green Energy And Mobility · Segment operating income (JPY) | — | — | — | — | — | 92.3B | 133B | 199B | 369B | — |
| High Functional Materials And Components · Segment revenue (JPY) | — | 1.66T | 1.7T | — | — | — | — | — | — | — |
| ↳ YoY growth | +2.8% | |||||||||
| Hitachi Chemical · Segment revenue (JPY) | — | — | 681B | 631B | — | — | — | — | — | — |
| ↳ YoY growth | -7.3% | |||||||||
| Hitachi Construction Machinery · Segment revenue (JPY) | — | — | 1.03T | 931B | 813B | 1.02T | 475B | — | — | — |
| ↳ YoY growth | -9.9% | -12.7% | +26.0% | -53.6% | ||||||
| Hitachi Construction Machinery · Segment operating income (JPY) | — | — | — | — | — | 100B | 43.2B | — | — | — |
| Hitachi High Tech · Segment revenue (JPY) | — | — | 731B | 695B | — | — | — | — | — | — |
| ↳ YoY growth | -5.0% | |||||||||
| Hitachi Metals · Segment revenue (JPY) | — | — | 1.02T | 881B | 762B | 943B | 848B | — | — | — |
| ↳ YoY growth | -13.9% | -13.6% | +23.8% | -10.1% | ||||||
| Hitachi Metals · Segment operating income (JPY) | — | — | — | — | — | 30.7B | 43.1B | — | — | — |
| IT · Segment revenue (JPY) | — | — | 2.12T | 2.1T | 2.05T | 2.15T | — | — | — | — |
| ↳ YoY growth | -1.0% | -2.4% | +5.1% | |||||||
| Industry · Segment revenue (JPY) | — | — | 895B | 841B | 830B | 901B | — | — | — | — |
| ↳ YoY growth | -6.1% | -1.3% | +8.5% | |||||||
| Information And Telecommunication Systems · Segment revenue (JPY) | — | 2.01T | 2.07T | — | — | — | — | — | — | — |
| ↳ YoY growth | +2.8% | |||||||||
| Mobility · Segment revenue (JPY) | — | — | 1.21T | 1.14T | 1.2T | 1.43T | — | — | 1.17T | 1.32T |
| ↳ YoY growth | -5.7% | +4.8% | +18.8% | +12.8% | ||||||
| Mobility · Segment operating income (JPY) | — | — | — | — | — | — | — | — | 94.9B | 108B |
| Smart Life · Segment revenue (JPY) | — | — | 1.65T | 1.47T | 2.24T | 1.03T | — | — | — | — |
| ↳ YoY growth | -10.7% | +52.1% | -54.0% | |||||||
| Smart Life And Ecofriendly Systems · Segment revenue (JPY) | — | 540B | 485B | — | — | — | — | — | — | — |
| ↳ YoY growth | -10.2% | |||||||||
| Social Infrastructure And Industrial Systems · Segment revenue (JPY) | — | 2.38T | 2.54T | — | — | — | — | — | — | — |
| ↳ YoY growth | +6.9% | |||||||||
| Reported | Jun 21, 2017 | Jun 19, 2019 | Aug 31, 2020 | Aug 31, 2020 | Jun 22, 2022 | Jun 21, 2023 | Jun 21, 2023 | Jun 21, 2024 | Jun 22, 2026 | Jun 22, 2026 |
Sign up to see institutional holdings
Sign UpPodcast Mentions
Sign up to see podcast mentions and sentiment
Sign UpTimely disclosures published on TDnet, newest first, titles as filed in Japanese. The link opens the disclosure on TDnet. Filings with EDINET (periodic reports, extraordinary reports, offerings, holding and buy-back reports), newest first, titles as filed in Japanese. The link opens the filing on EDINET. Press releases from the company's own website, newest first.
自己株式の取得状況に関するお知らせ
Bull 0
Bear 0
Routine
シェアする:
ニュースリリースカテゴリー
経営
関連情報
ページの先頭へ
 新しいタブで開く
 新しいタブで開く
 新しいタブで開く
 新しいタブで開く
 新しいタブで開く
古物営業法に基づく表示 電子公告 日立のソーシャルメディアについて サイトマップ お問い合わせ
© Hitachi, Ltd. 1994, 2026. All rights reserved.
 図1 AIデータセンターにおける冷却全体像(イメージ)
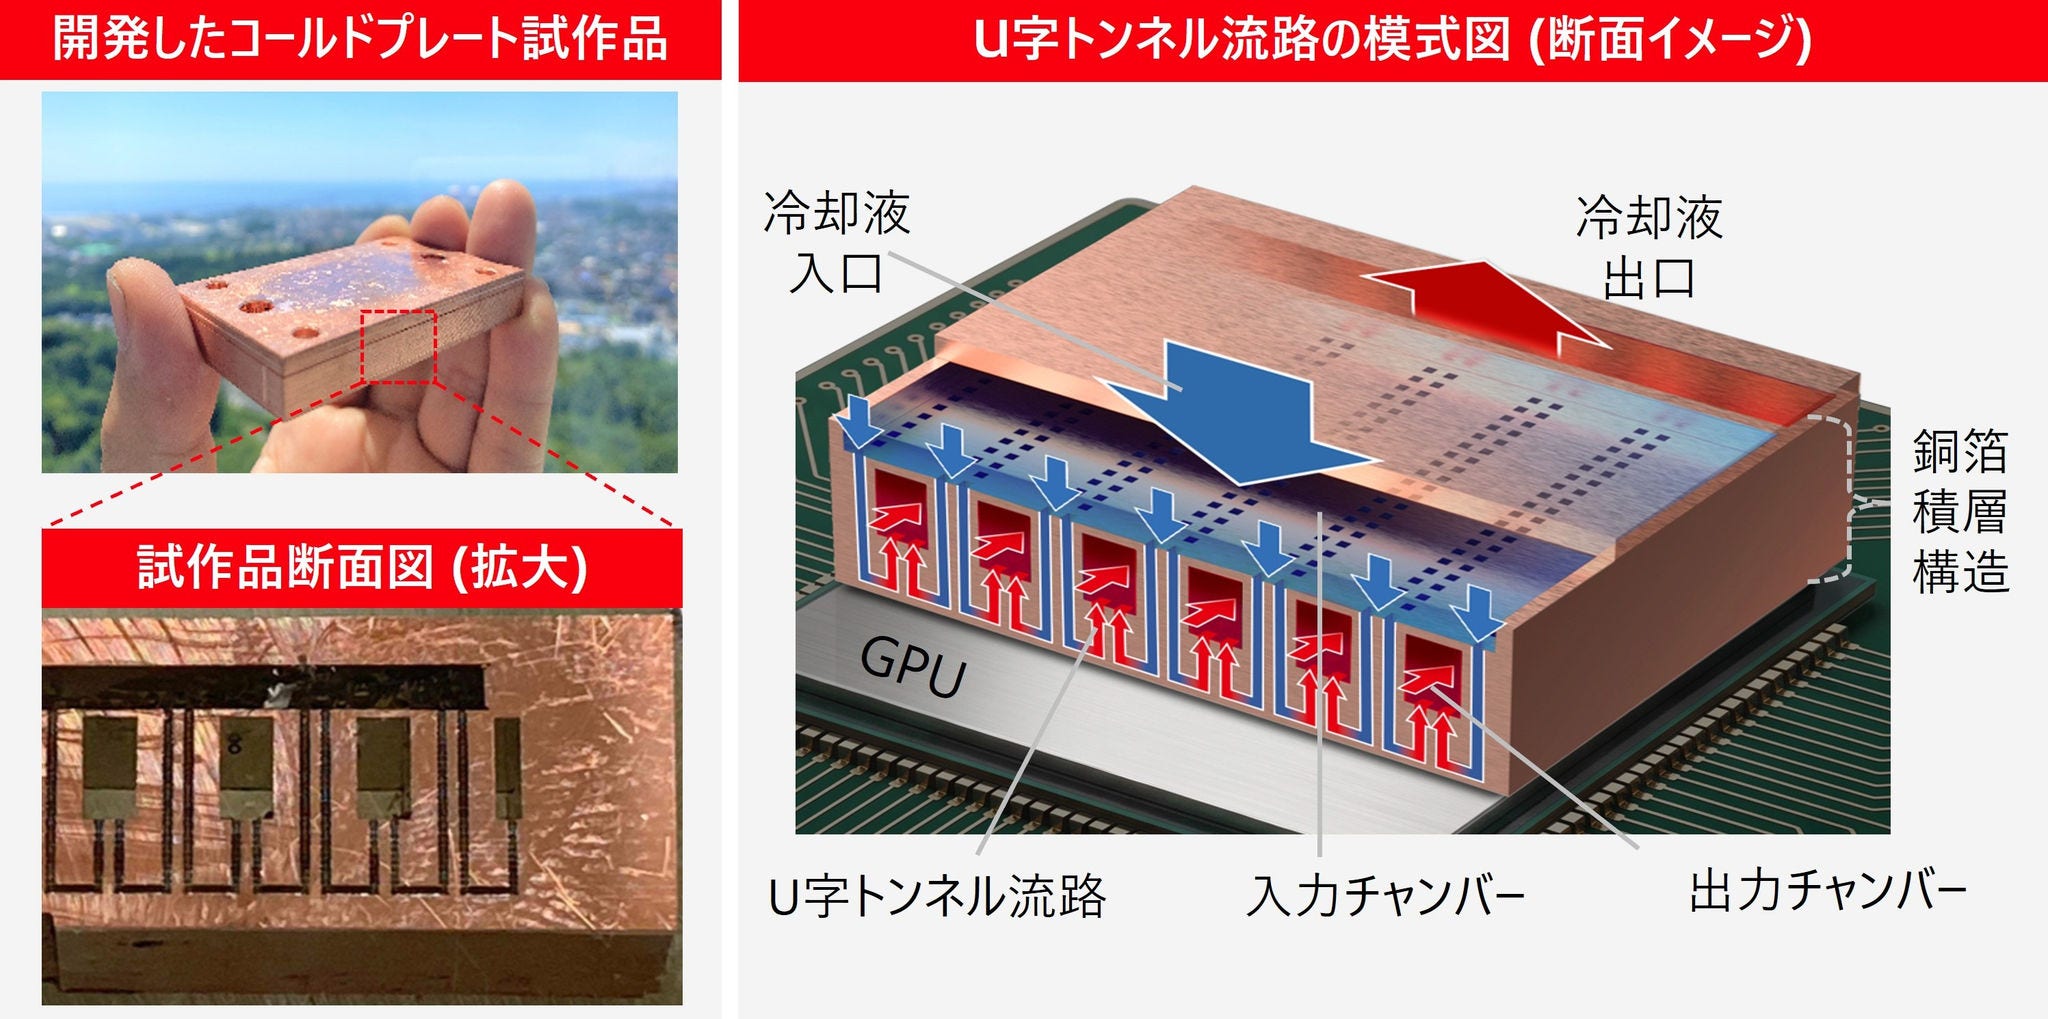 図2: GPU冷却用コールドプレート試作品と独自のU字トンネル流路の模式図
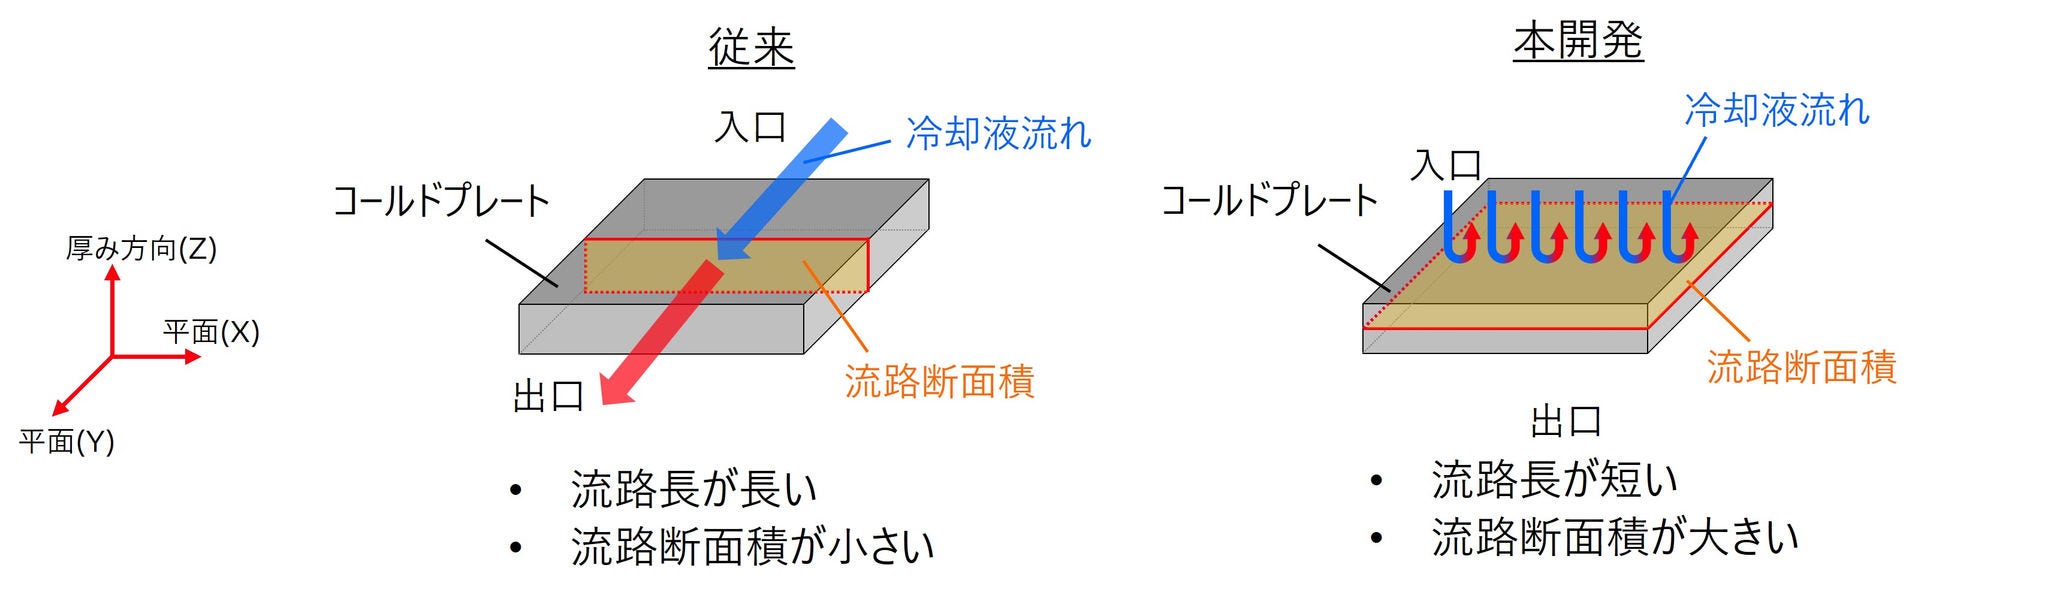 図3 従来構造と本開発構造の比較
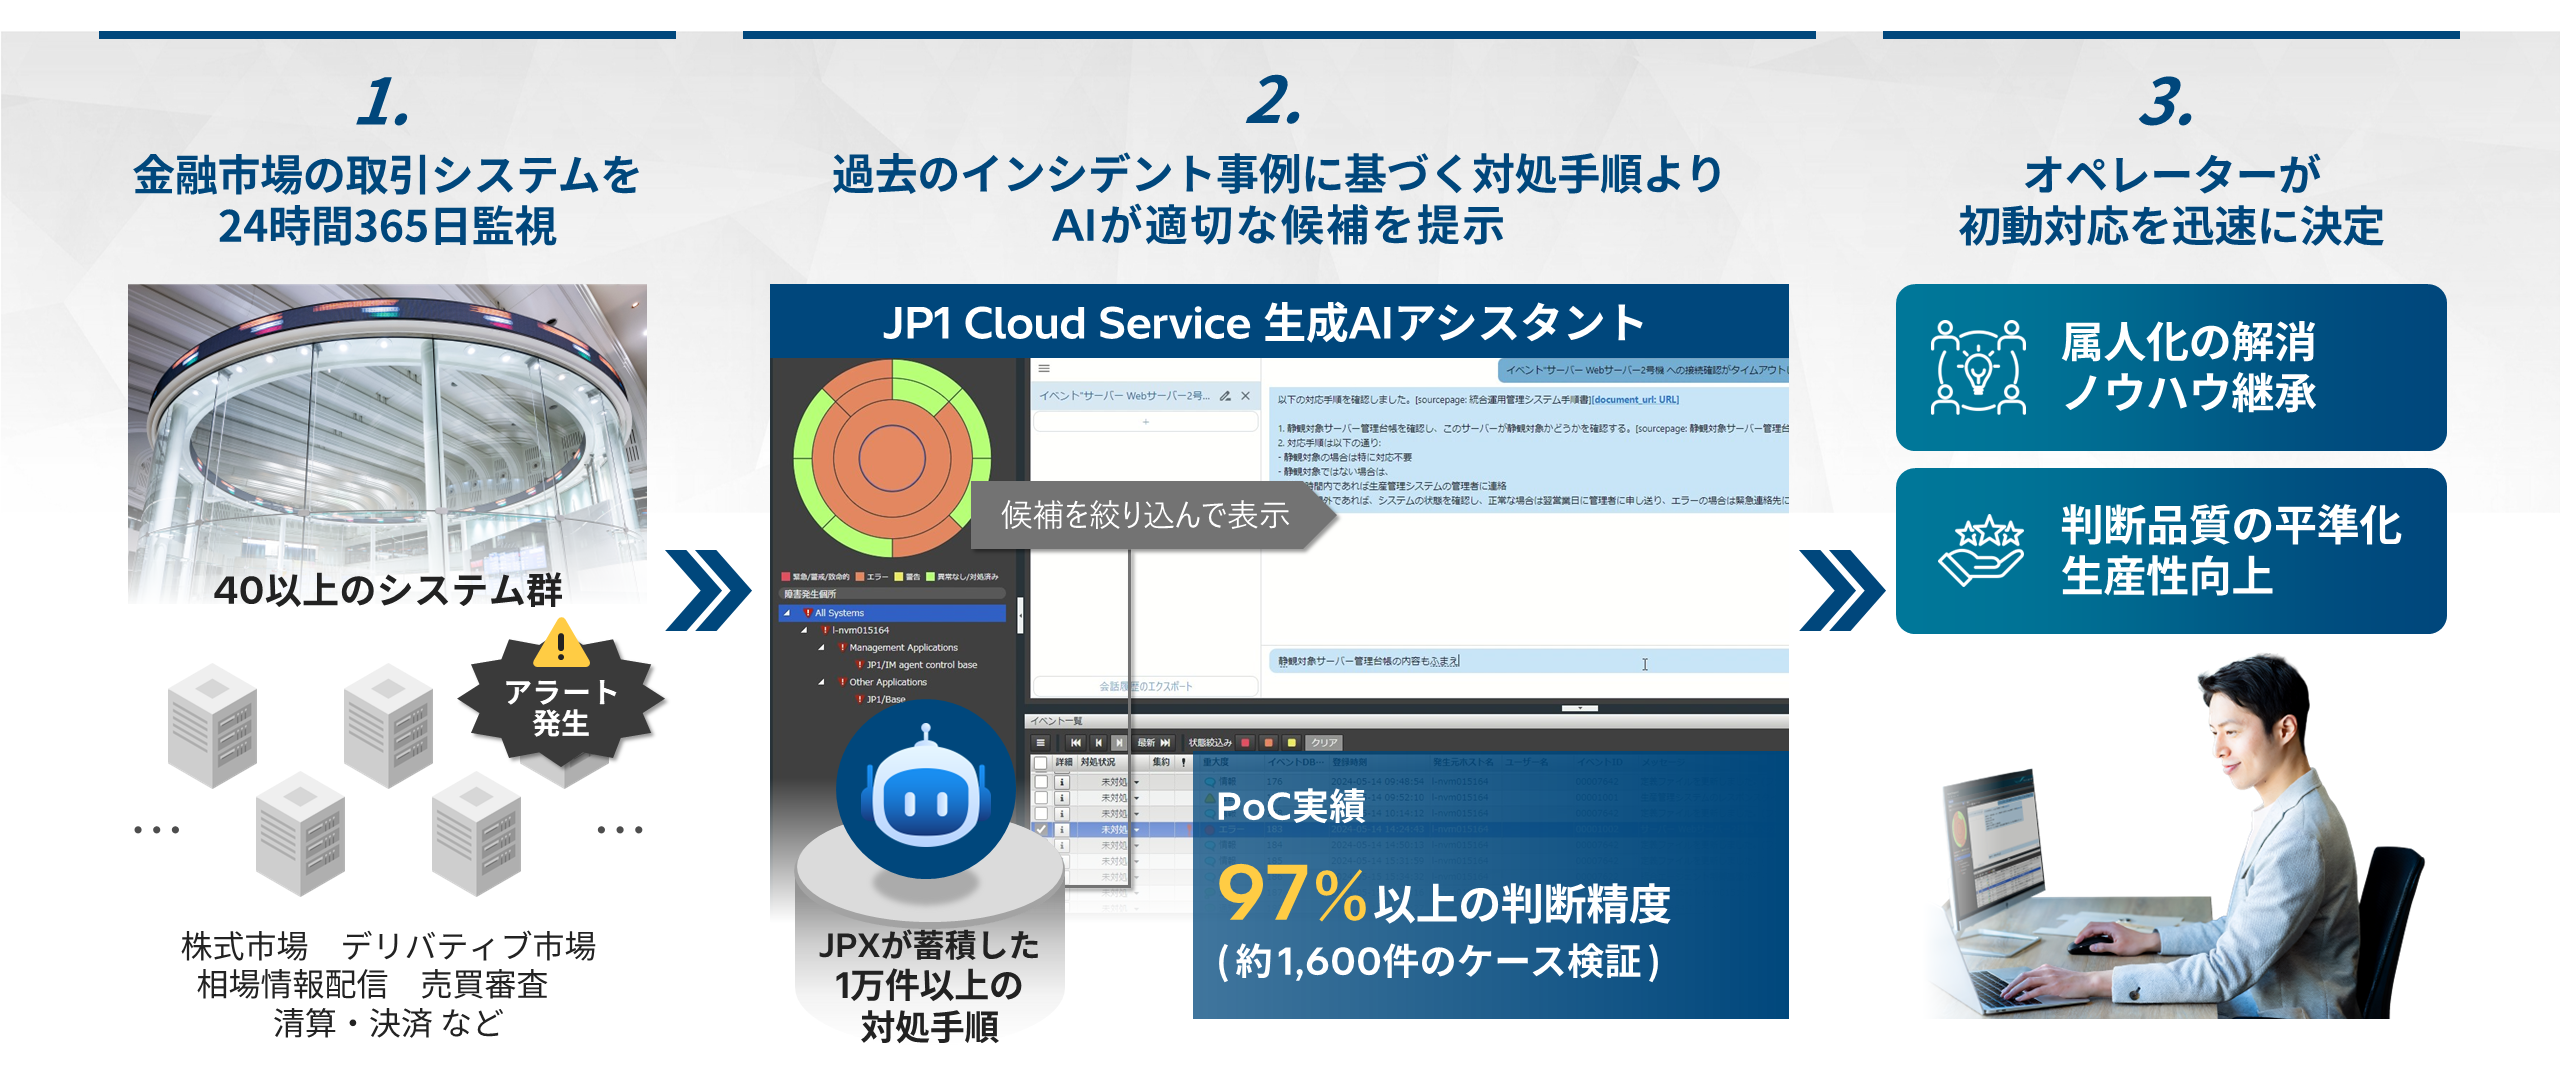 「JP1 Cloud Service 生成AIアシスタント」によるアラート対処判断支援の概要
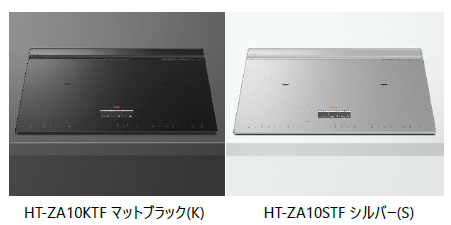
 HT-ZA10KTF マットブラック(K) ※設置画像はイメージ
Prompts
Click prompts to add them under the company line, click again to take one out, then copy the result into your AI chat. Shared by Asian Century Stocks and Uncovered Thai Stocks. Thank you.
Hitachi, Ltd. (ticker 6501), listed in Japan.
Copied
ETFs Holding Hitachi, Ltd.
Exchange-traded funds whose newest published daily portfolio holds one of the company's listings, largest weight first.
| ETF | Weight in ETF | Shares | Market value | As of |
|---|---|---|---|---|
| PGRI | 3.84% | 9,600 | $ 264.092K | Jun 30, 2026 |
| JDVI | 3.46% | 892,200 | $ 24.544M | Jun 30, 2026 |
| JPAN | 2.97% | 10,800 | $ 297.104K | Jun 30, 2026 |
| DTAN | 2.14% | 15,424 | $ 465.687K | Nov 17, 2026 |
| CGXU | 2.02% | 4,236,600 | $ 130.067M | Nov 16, 2026 |
| CGIE | 1.60% | 1,270,700 | $ 39.011M | Nov 16, 2026 |
| UMMA | 1.45% | 125,584 | $ 4.276M | Aug 31, 2026 |
| RGEF | 0.93% | 235,408 | $ 7.223M | Nov 17, 2026 |
| DIHP | 0.92% | 1,943,100 | $ 60.529M | Nov 12, 2026 |
| CGGE | 0.88% | 937,400 | $ 28.779M | Nov 16, 2026 |
| CGNG | 0.67% | 644,900 | $ 19.799M | Nov 16, 2026 |
| NTSI | 0.63% | 113,900 | $ 3.133M | Jun 30, 2026 |
| DWMF | 0.57% | 7,000 | $ 192.567K | Jun 30, 2026 |
| DFSI | 0.51% | 193,800 | $ 6.037M | Nov 12, 2026 |
| CGIC | 0.46% | 382,500 | $ 11.743M | Nov 16, 2026 |
| DFAI | 0.44% | 2,598,000 | $ 80.93M | Nov 12, 2026 |
| FLSP | 0.42% | 144,800 | $ 3.983M | Jun 30, 2026 |
| JHID | 0.39% | 1,559 | $ 42.887K | Jun 30, 2026 |
| DFIC | 0.30% | 1,498,100 | $ 46.667M | Nov 12, 2026 |
| AVDE | 0.27% | 1,769,400 | $ 53.399M | Nov 16, 2026 |
| IVSI | 0.24% | 700 | $ 19.248K | Jun 30, 2026 |
| DXIV | 0.24% | 18,400 | $ 573.173K | Nov 12, 2026 |
| DFAX | 0.22% | 845,200 | $ 26.329M | Nov 12, 2026 |
| GEW | 0.20% | 8,639 | $ 294.078K | Aug 31, 2026 |
| AVSD | 0.03% | 3,800 | $ 114.68K | Nov 16, 2026 |