2027年3月期 第2四半期(中間期)決算短信〔日本基準〕(連結) 2026年10月30日 上場取引所 東 URL https://www.niv.co.jp/ (氏名) 李太煥 (氏名) 梅嵜篤史 TEL 0463-82-1311 配当支払開始予定日 2026年12月4日 上場会社名 株式会社NITTAN コ ー ド 番号 6493…
2027年3月期
第2四半期(中間期)決算短信〔日本基準〕(連結)
2026年10月30日
上場取引所
東
URL https://www.niv.co.jp/
(氏名) 李太煥
(氏名) 梅嵜篤史
TEL 0463-82-1311
配当支払開始予定日
2026年12月4日
上場会社名
株式会社NITTAN
コ ー ド 番号
6493
代
表
者 (役職名) 代表取締役社長
問合せ先責任者 (役職名) 経理部部長
半期報告書提出予定日
2026年11月13日
決算補足説明資料作成の有無
:有
決算説明会開催の有無
:有
(個人投資家・機関投資家及びアナリスト向け )
(百万円未満切捨て)
1.2027年3月期第2四半期(中間期)の連結業績(2026年4月1日~2026年9月30日)
(1)連結経営成績(累計)
(%表示は、対前年中間期増減率)
売上高
営業利益
百万円
%
親会社株主に帰属
する中間純利益
経常利益
百万円
%
百万円
%
百万円
%
2027年3月期中間期
28,536
16.8
2,347
36.1
2,316
24.8
1,169 △15.3
2026年3月期中間期
24,440
△4.4
1,725
715.0
1,855
276.7
1,380
―
(注) 包括利益
2027年3月期中間期
3,347百万円( 392.5%)
2026年3月期中間期
679百万円( △32.5%)
潜在株式調整後
1株当たり
1株当たり
中間純利益
中間純利益
円
2027年3月期中間期
2026年3月期中間期
銭
円
40.59
47.94
銭
36.87
―
(2)連結財政状態
総資産
純資産
百万円
自己資本比率
百万円
2027年3月期中間期
74,874
2026年3月期
66,918
(参考) 自己資本 2027年3月期中間期 32,903百万円
%
45,778
40,344
2026年3月期
43.9
46.3
30,979百万円
2.配当の状況
年間配当金
第1四半期末第2四半期末第3四半期末
円
銭
円
銭
円
2026年3月期
―
7.00
2027年3月期
―
10.00
2027年3月期(予想)
(注) 直近に公表されている配当予想からの修正の有無 : 無
期末
合計
銭
円
銭
―
13.00
円
20.00
銭
―
10.00
20.00
3.2027年3月期の連結業績予想(2026年4月1日~2027年3月31日)
売上高
百万円
営業利益
%
百万円
(%表示は、対前期増減率)
親会社株主に帰属
1株当たり
する当期純利益
当期純利益
経常利益
%
通期
59,000 14.2
4,200
5.1
(注) 直近に公表されている業績予想からの修正の有無 : 有
百万円
%
4,100 △7.3
百万円
%
2,000 △10.2
円
銭
69.37
※ 注記事項
(1)当中間期における連結範囲の重要な変更
新規
(注)
: 有
3社 (社名) 新和精密株式会社他 2社、除外
(2)中間連結財務諸表の作成に特有の会計処理の適用
(注)
―社 (社名)
詳細は、第2四半期(中間期)決算短信(添付資料)12ページ「2.中間連結財務諸表及び主な注記
(4) 中間連結財務諸表に関する注記事項(連結の範囲又は持分法適用の範囲の変更に関する注記)」
をご覧ください。
: 有
詳細は、第2四半期(中間期)決算短信(添付資料)12ページ「2.中間連結財務諸表及び主な注記
(4)中間連結財務諸表に関する注記事項(中間連結財務諸表の作成に特有の会計処理の適用)」をご覧
ください。
(3)会計方針の変更・会計上の見積りの変更・修正再表示
① 会計基準等の改正に伴う会計方針の変更
: 無
②
①以外の会計方針の変更
: 無
③
会計上の見積りの変更
: 無
④
修正再表示
: 無
(4)発行済株式数(普通株式)
① 期末発行済株式数 (自己株式を含む)
2027年3月期中間期
28,978,860株 2026年3月期
28,978,860株
147,947株 2026年3月期
173,517株
期末自己株式数
2027年3月期中間期
③
期中平均株式数(中間期)
2027年3月期中間期
※
※
②
28,813,851株 2026年3月期中間期
28,785,253株
第2四半期(中間期)決算短信は公認会計士又は監査法人のレビューの対象外です
業績予想の適切な利用に関する説明、その他特記事項
本資料に記載されている業績見通し等の将来に関する記述は、当社が現在入手可能な情報に基づき作成したもので
あります。実際の業績は、今後様々な要因によって異なる結果となる場合があります。なお、業績予想に関する事
項につきましては、第2四半期(中間期)決算短信(添付資料)5ページ「連結業績予想などの将来予測情報に関
する説明」をご覧ください。
(株)NITTAN(6493)
2027年3月期
第2四半期(中間期)決算短信
○添付資料の目次
1.経営成績等の概況 ………………………………………………………………………………………………2
(1)当中間期の経営成績の概況 ………………………………………………………………………………2
(2)当中間期の財政状態の概況 ………………………………………………………………………………5
(3)連結業績予想などの将来予測情報に関する説明 ………………………………………………………5
2.中間連結財務諸表及び主な注記 ………………………………………………………………………………6
(1)中間連結貸借対照表 ………………………………………………………………………………………6
(2)中間連結損益計算書及び中間連結包括利益計算書 ……………………………………………………8
中間連結損益計算書 ……………………………………………………………………………………………8
中間連結包括利益計算書 ………………………………………………………………………………………9
(3)中間連結キャッシュ・フロー計算書 ……………………………………………………………………10
(4)中間連結財務諸表に関する注記事項 ……………………………………………………………………12
(継続企業の前提に関する注記) ……………………………………………………………………………12
(株主資本の金額に著しい変動があった場合の注記) ……………………………………………………12
(中間連結財務諸表の作成に特有の会計処理の適用) ……………………………………………………12
(連結の範囲又は持分法適用の範囲の変更) ………………………………………………………………12
(セグメント情報等) …………………………………………………………………………………………13
(企業結合等関係) ……………………………………………………………………………………………15
3.その他 ……………………………………………………………………………………………………………17
1
(株)NITTAN(6493)
2027年3月期
第2四半期(中間期)決算短信
1.経営成績等の概況
(1)当中間期の経営成績の概況
当中間連結会計期間における世界経済は、一部の地域に弱さがみられるものの、緩やかな持ち直しの動きが続きま
した。一方で、中東情勢をはじめとする地政学的リスクや各国の通商政策の動向などにより、先行き不透明な状況が
続いております。
日本経済につきましては、景気は緩やかに回復しており、個人消費は持ち直しの動きがみられ、設備投資は持ち直
しているほか、雇用情勢は改善の動きがみられております。一方で、消費者物価は緩やかに上昇しており、中東情勢
や金融資本市場の変動等について引き続き留意する必要があります。
また、当社グループが最も影響を受ける自動車業界におきましては、日本市場において持ち直しの動きがみられる
一方で、各国の通商政策や地政学的リスクなどにより、事業環境は依然として不透明な状況が続いております。
このような状況下、当社グループは、「基盤強化」、「永続的発展」、「企業風土改革」を柱とするグローバル経
営方針を掲げ、当社グループのパーパスである「多様な技術を駆使し、脱炭素化社会の実現に貢献する」ことを目指
し、国内外で競争力を高める施策や取り組みを積極的に展開してまいりました。その実現に向けた当社グループの中
長期経営VISIONである「NITTAN Challenge 10(以下、NC10)」につきましても、VISION Ⅰ(ICE有効活用領域)及び
VISION Ⅱ(xEV・異業種領域)における各アイテムの拡大と事業化に向けた開発を着実に進めております。また、
2026年6月に公表した新中期経営計画に基づき、NC10の実現に向け、3年間で収益性及び営業キャッシュ・フローの
最大化を目指すとともに、成長市場であるインドにおける高付加価値バルブを含むエンジンバルブ事業の拡大及び中
空バルブの拡販に取り組んできました。
イ ン ド 市場 に つ い て は、2025 年 6 月、現代自動車 グ ル ー プ の Hyundai Motor India 及 び PT Hyundai Motor
Manufacturing Indonesiaから、当社の高付加価値製品である軸中空エンジンバルブ及び傘中空エンジンバルブのコス
ト、性能面における優位性を評価いただき、受注を獲得しました。また、Royal Enfieldからも新たな受注を獲得し、
同年11月には工場拡張工事を完了するなど、量産体制の強化を進めております。さらに、事業拡大に向けた生産能力
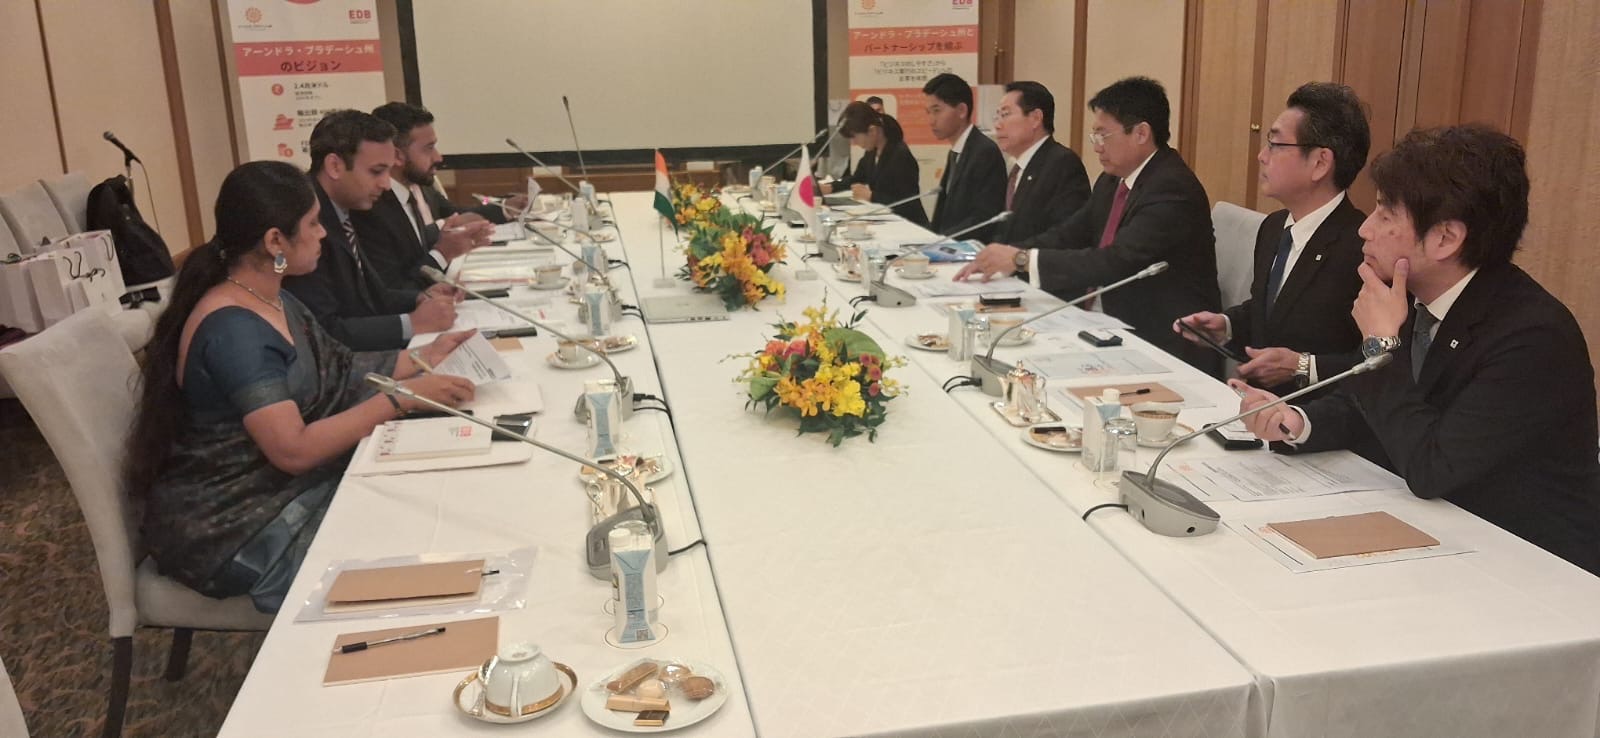
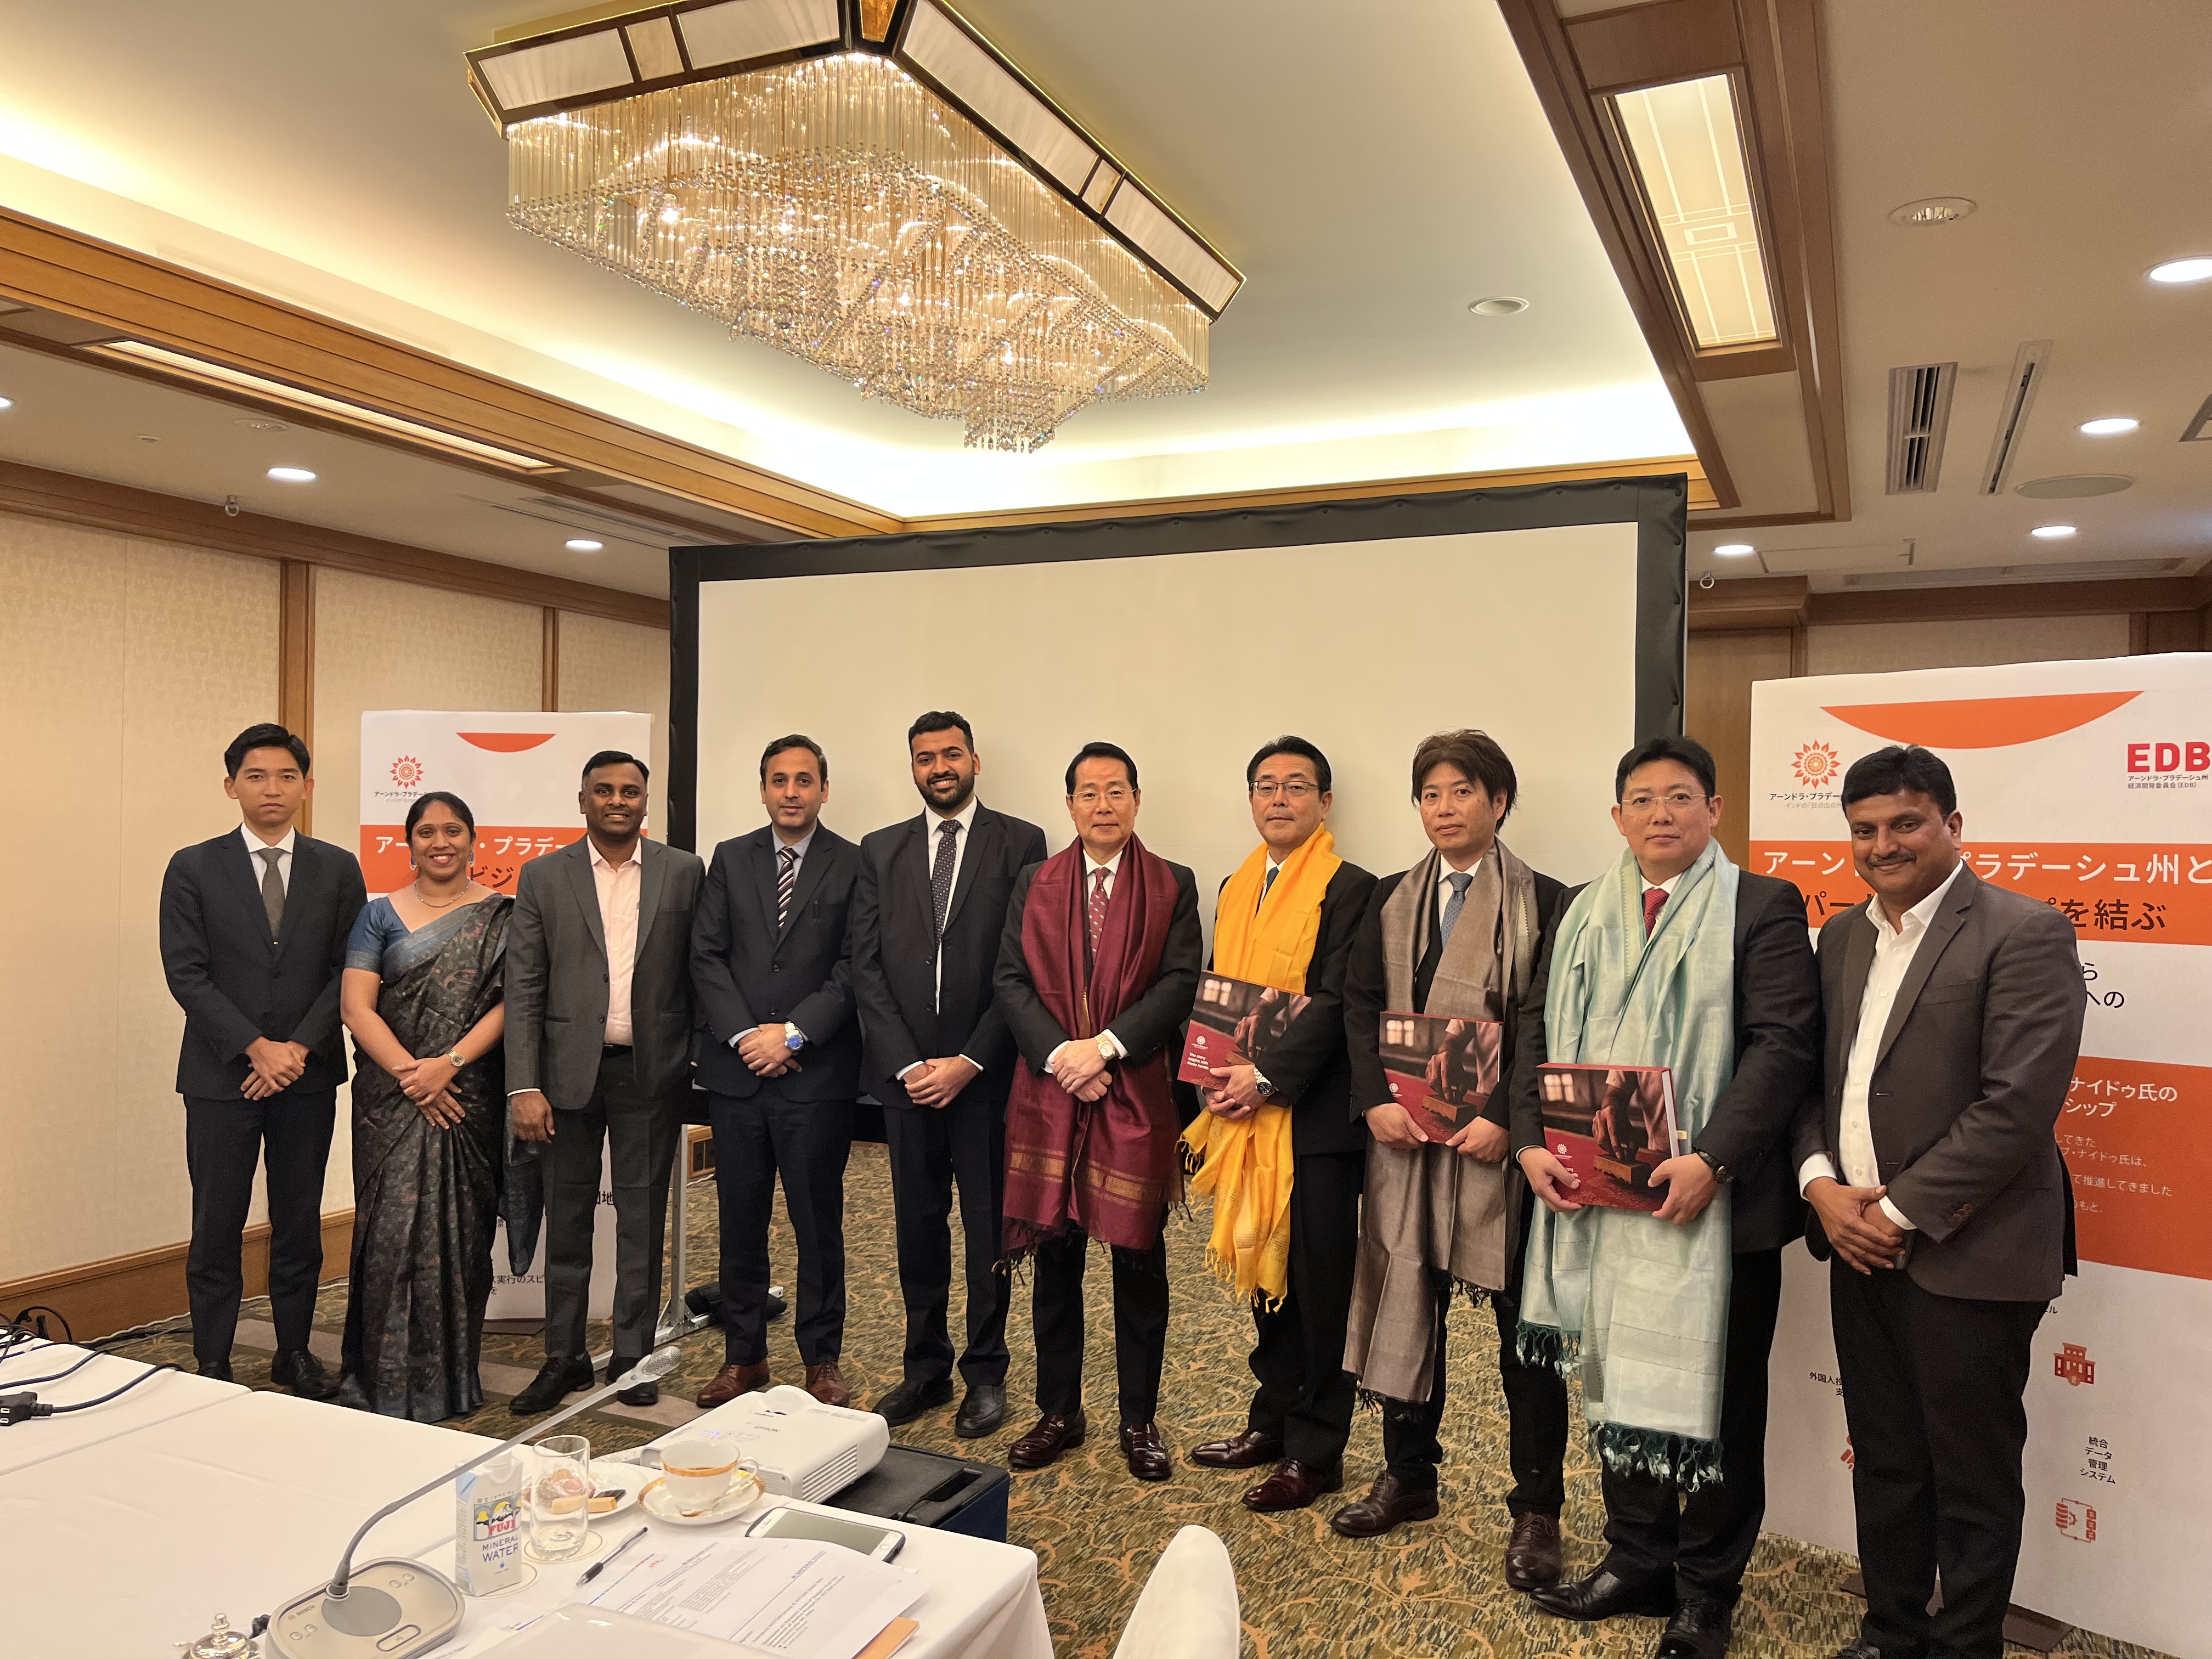
の増強を見据え、インド・アンドラ・プラデシュ州政府及び在日インド大使館などの関係者との協議を進めておりま
す。
加えて、経済産業省による「令和7年度補正グローバルサウス未来志向型共創等事業(大型実証非ASEAN加盟
国)」に採択されました。本事業では、軽量化と冷却性能の向上を図る傘中空技術と、耐摩耗性・耐久性の向上を図
る盛金補強技術を組み合わせたエンジンバルブの製造ラインを当社インド子会社Nittan India Tech Pvt. Ltd.に開
発・導入し、日本で培った技術をインドの原材料・製造環境に適合させながら、品質、コスト、量産性及び商業性の
検証を進めてまいります。
さらに、自動車メーカーを中心とする取引先から、当社グループの品質、技術力及び環境への取り組みについて評
価を受ける機会も増えております。2026年4月にはマツダ株式会社から当社山陽工場が「カーボンニュートラル改善
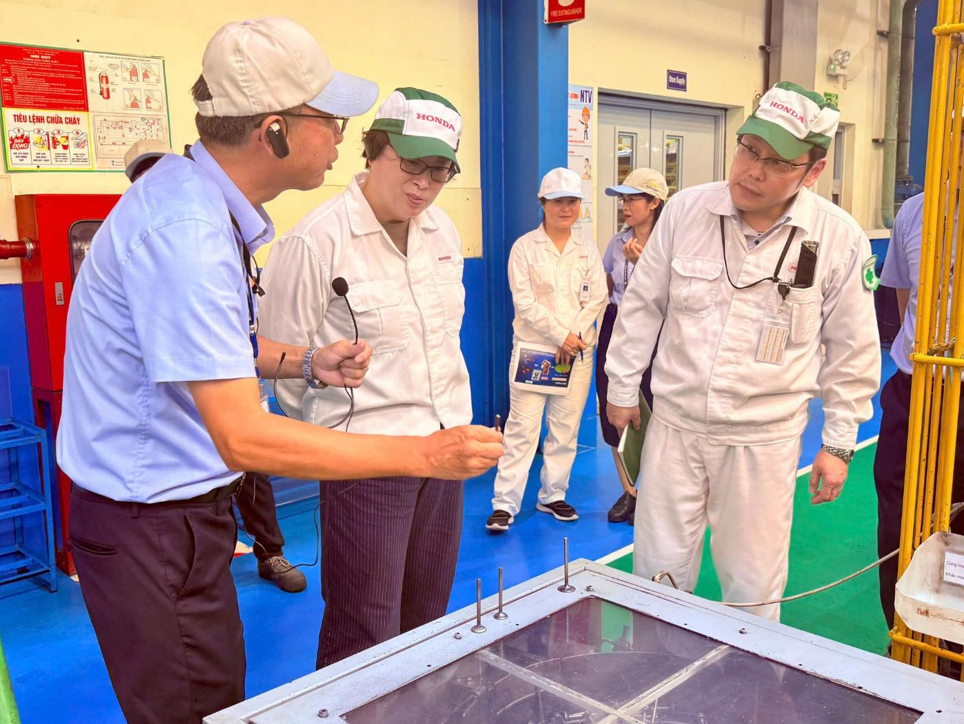
賞」を3年連続で受賞したほか、同年8月にはHonda Vietnamから最高評価となる「Supplier of the Year」を受賞し
ました。また、同年10月には、マルチ・スズキ・インディア向けFFV(Flexible Fuel Vehicle:フレックス燃料車)
用エンジンバルブの開発における技術的貢献が評価され、技術開発優秀取引先に認定されました。同バルブは現在、
同社向けFFV用製品として量産されています。
また、当社グループが長年培ってきた品質、技術力及びグローバル供給体制を活かし、自動車メーカーのサプライ
チェーン安定化に向けた供給対応にも取り組んでおります。2026年3月に韓国で発生した自動車部品サプライヤーの
工場火災を受け、現代自動車グループ向けエンジンバルブの供給支援要請への対応を進めたほか、同年7月には
Volkswagenグループ向けエンジンバルブを受注しました。こうした取り組みを通じ、グローバルな供給体制を活かし
た事業機会の拡大を進めております。
2
(株)NITTAN(6493)
2027年3月期
第2四半期(中間期)決算短信
このような経営環境のもと、当社グループの当中間連結会計期間の経営成績につきましては、売上高は、一部の海
外拠点並びに舶用部品事業及び歯車事業における販売減少等はあったものの、国内における中空エンジンバルブを中
心とした高付加価値製品及び北米向けエンジンバルブの販売増加、当中間連結会計期間から新和精密グループを連結
子会社化したことによる売上寄与、工作機械の売上増加並びに為替影響等により、前年同期に比べ増収となりまし
た。この結果、売上高は285億36百万円(前年同期比16.8%増)となりました。
損益面につきましては、一部拠点における減収や収益性低下の影響等はあったものの、国内における中空エンジン
バルブの販売増加及び収益性の改善、北米拠点における生産体制の効率化、並びに歯車事業における損失幅の縮小等
により、前年同期に比べ増益となりました。この結果、営業利益は23億47百万円(前年同期比36.1%増)、経常利益
は23億16百万円(前年同期比24.8%増)となりました。一方、親会社株主に帰属する中間純利益につきましては、前
年同期に保有株式及び土地建物の売却益を特別利益として計上していたこと等により、11億69百万円(前年同期比
15.3%減)となりました。
2026年5月に公表した当期業績見通しでは、前期の保有株式及び土地建物の売却益を特別利益とした一過性の増益
要因が剥落するとともに、需要が伸びているインド拠点への更なる成長投資と為替レート1ドル=150円を想定した影
響を見込んだ減益見通しを発表しました。しかし当中間連結会計期間の経営成績は、これらの減益見通し要因をカバ
ーした上で、当社グループの基礎収益性が健全であることを示す結果となりました。
セグメント別の経営成績は、次のとおりであります。
<小型エンジンバルブ>
当セグメントの売上高につきましては、国内事業において、現代自動車グループ向けの供給支援に伴う軸中空バル
ブ及び傘中空バルブをはじめとする高付加価値エンジンバルブの販売増加や北米向けエンジンバルブの販売増加等に
より、四輪車用エンジンバルブは前年同期に比べ増収となりました。また、二輪車用エンジンバルブについても、北
米及びインド向け販売増加により、前年同期に比べ増収となりました。
海外事業においては、中国の一部拠点における販売減少等はあったものの、アジアを中心とした複数拠点において
販売が増加しました。
一方、汎用エンジンバルブは、海外向け製品の販売不振等により、前年同期に比べ減収となりました。
損益面につきましては、中国の一部拠点等における減益要因はあったものの、国内における中空エンジンバルブの
販売増加及び収益性の改善に加え、北米拠点における生産体制の効率化等により、前年同期に比べ増益となりまし
た。
この結果、売上高は221億86百万円(前年同期比12.8%増)、セグメント利益(営業利益)は21億94百万円(前年同
期比23.0%増)となりました。
<バルブリフター>
当中間連結会計期間より新和精密グループを連結子会社化したことに伴い、従来「その他」に含めていたバルブリ
フター事業について、報告セグメントとして「バルブリフター」を新設しております。なお、前年同期のセグメント
情報については、変更後の報告セグメントの区分に基づき作成しております。当セグメントの売上高につきましては、
当中間連結会計期間より新和精密グループを連結子会社としたこと等により、前年同期に比べ大幅な増収となりまし
た。損益面につきましても、同グループの連結子会社化等により、前年同期の損失計上から黒字に転換いたしまし
た。
この結果、売上高は18億52百万円(前年同期は59百万円)、セグメント利益(営業利益)は95百万円(前年同期は
セグメント損失(営業損失)7百万円)となりました。
3
(株)NITTAN(6493)
2027年3月期
第2四半期(中間期)決算短信
<舶用部品>
当セグメントの売上高につきましては、堅調な需要環境が継続する一方、受注残の解消に伴う販売の減少等により、
前年同期に比べ減収となりました。損益面につきましては、減収となったものの、生産体制の安定化及び収益性の改
善等により、前年同期に比べ増益となりました。
この結果、売上高は23億73百万円(前年同期比6.9%減)、セグメント利益(営業利益)は1億31百万円(前年同期
比17.2%増)となりました。
なお、当セグメントの売上高は、セグメント間の内部売上高又は振替高26百万円を含んでおります。
<歯車>
当セグメントの売上高につきましては、自動車用製品の販売減少等により、前年同期に比べ減収となりました。損
益面につきましては、減収の影響はあったものの、事業構造改革の進展及び固定費の削減等により、前年同期に比べ
損失幅が縮小いたしました。
この結果、売上高は6億18百万円(前年同期比25.2%減)、セグメント損失(営業損失)は44百万円(前年同期は
セグメント損失(営業損失)1億56百万円)となりました。
<その他>
当セグメントの売上高につきましては、工作機械の売上増加等により、前年同期に比べ増収となりました。損益面
につきましては、一部事業における減益要因はあったものの、工作機械及びその他事業における収益改善等により、
前年同期に比べ損失幅が縮小いたしました。
この結果、売上高は30億1百万円(前年同期比46.4%増)、セグメント損失(営業損失)は12百万円(前年同期は
セグメント損失(営業損失)90百万円)となりました。
なお、当セグメントの売上高は、セグメント間の内部売上高又は振替高14億70百万円を含んでおります。
4
(株)NITTAN(6493)
2027年3月期
第2四半期(中間期)決算短信
(2)当中間期の財政状態の概況
① 資産、負債及び純資産の状況
当中間連結会計期間末における総資産は、748億74百万円となり、前連結会計年度末と比較して79億56百万円の増加
となりました。
資産の部の流動資産は、356億75百万円となり、前連結会計年度末と比較し31億48百万円の増加となりました。この
主な要因は、電子記録債権15億32百万円、現金及び預金が13億81百万円増加したことなどによるものであります。
固定資産は、391億99百万円となり、前連結会計年度末と比較して48億7百万円の増加となりました。この主な要因
は、建物及び構築物(純額)が21億71百万円、建設仮勘定が10億33百万円、機械装置及び運搬具(純額)が9億29百
万円、無形固定資産が5億12百万円増加したことなどによるものであります。
負債の部の流動負債は、149億76百万円となり、前連結会計年度末と比較して4億74百万円の増加となりました。こ
の主な要因は、未払法人税等が2億89百万円増加したことなどによるものであります。
固定負債は、141億19百万円となり、前連結会計年度末と比較して20億48百万円の増加となりました。この主な要因
は、繰延税金負債が7億92百万円、長期借入金が6億62百万円、その他に含まれるもののうちリース債務が2億62百
万円増加したことなどによるものであります。
純資産の部は、457億78百万円となり、前連結会計年度末と比較して54億33百万円の増加となりました。この主な要
因は、非支配株主持分が35億9百万円、その他有価証券評価差額金が11億13百万円、利益剰余金が7億95百万円増加
したことなどによるものであります。
② キャッシュ・フローの状況
当中間連結会計期間末における現金及び現金同等物(以下「資金」という)の残高は129億46百万円となりました。
当中間連結会計期間における各キャッシュ・フローの状況とそれらの要因は次のとおりであります。
(営業活動によるキャッシュ・フロー)
営業活動により、41億98百万円の資金増加(前年同期は、37億31百万円の資金増加)となりました。これは主とし
て、税金等調整前中間純利益26億9百万円や非資金取引である減価償却費20億69百万円の計上によるものでありま
す。
(投資活動によるキャッシュ・フロー)
投資活動により、12億46百万円の資金減少(前年同期は、10億9百万円の資金減少)となりました。これは主とし
て、連結の範囲の変更を伴う子会社株式の取得による収入9億72百万円を計上した一方で、有形及び無形固定資産の
取得による支出22億48百万円が発生したことによるものであります。
(財務活動によるキャッシュ・フロー)
財務活動により、15億13百万円の資金減少(前年同期は、19億21百万円の資金減少)となりました。これは主とし
て、非支配株主への配当金の支払額13億34百万円によるものであります。
(3)連結業績予想などの将来予測情報に関する説明
2027年3月期の業績予想は、直近の業績動向などを踏まえ、修正致しました。
詳細につきましては、本日公表の「通期業績予想の修正に関するお知らせ」をご参照ください。
5
(株)NITTAN(6493)
2027年3月期
第2四半期(中間期)決算短信
2.中間連結財務諸表及び主な注記
(1)中間連結貸借対照表
(単位:千円)
前連結会計年度
(2026年3月31日)
資産の部
流動資産
現金及び預金
受取手形及び売掛金
電子記録債権
商品及び製品
仕掛品
原材料及び貯蔵品
その他
流動資産合計
固定資産
有形固定資産
建物及び構築物(純額)
機械装置及び運搬具(純額)
土地
建設仮勘定
その他(純額)
有形固定資産合計
無形固定資産
投資その他の資産
投資有価証券
出資金
長期貸付金
繰延税金資産
退職給付に係る資産
その他
貸倒引当金
投資その他の資産合計
固定資産合計
資産合計
6
当中間連結会計期間
(2026年9月30日)
11,565,178
8,711,726
253,024
3,705,616
2,204,822
5,117,632
968,304
32,526,305
12,946,672
8,186,003
1,785,282
3,082,727
2,575,397
5,662,881
1,436,061
35,675,026
8,277,222
11,970,565
1,478,724
2,012,707
842,237
24,581,457
1,600,375
10,448,492
12,899,614
1,478,637
3,046,502
908,455
28,781,703
2,112,519
6,832,121
213,521
31,729
622,596
161,102
377,091
△27,701
8,210,462
34,392,295
66,918,600
6,713,523
230,197
33,057
604,370
168,627
583,962
△28,240
8,305,501
39,199,724
74,874,750
(株)NITTAN(6493)
2027年3月期
第2四半期(中間期)決算短信
(単位:千円)
前連結会計年度
(2026年3月31日)
負債の部
流動負債
買掛金
電子記録債務
短期借入金
未払法人税等
賞与引当金
役員賞与引当金
その他
流動負債合計
固定負債
転換社債型新株予約権付社債
長期借入金
繰延税金負債
退職給付に係る負債
その他
固定負債合計
負債合計
純資産の部
株主資本
資本金
資本剰余金
利益剰余金
自己株式
株主資本合計
その他の包括利益累計額
その他有価証券評価差額金
為替換算調整勘定
退職給付に係る調整累計額
その他の包括利益累計額合計
新株予約権
非支配株主持分
純資産合計
負債純資産合計
7
当中間連結会計期間
(2026年9月30日)
4,093,924
156,916
4,739,650
286,817
411,155
33,538
4,780,285
14,502,287
4,227,505
250,977
4,549,546
575,949
403,017
―
4,969,961
14,976,957
1,494,500
4,655,153
2,047,431
3,170,450
703,826
12,071,362
26,573,649
1,494,500
5,317,400
2,839,890
3,315,810
1,151,765
14,119,367
29,096,324
4,530,543
4,499,653
16,125,290
△48,385
25,107,101
4,530,543
4,504,887
16,920,324
△41,273
25,914,481
2,947,550
2,230,331
694,131
5,872,013
2,177
9,363,657
40,344,950
66,918,600
4,061,039
2,469,756
457,937
6,988,732
2,177
12,873,034
45,778,426
74,874,750
(株)NITTAN(6493)
2027年3月期
第2四半期(中間期)決算短信
前中間連結会計期間
(自 2025年4月1日
至 2025年9月30日)
24,440,243
20,217,374
4,222,868
2,497,800
1,725,068
(単位:千円)
当中間連結会計期間
(自 2026年4月1日
至 2026年9月30日)
28,536,134
23,325,620
5,210,513
2,863,074
2,347,438
63,357
133,190
112,185
―
58,735
367,468
59,297
124,399
―
81,956
77,450
343,103
135,996
76,230
―
24,397
236,623
1,855,912
146,147
76,891
59,126
91,425
373,591
2,316,951
84,785
592,872
―
677,657
564
29,674
287,806
318,045
4,188
―
4,188
2,529,381
609,327
1,920,054
539,960
1,380,094
10,313
14,929
25,242
2,609,754
665,197
1,944,556
775,052
1,169,503
(2)中間連結損益計算書及び中間連結包括利益計算書
中間連結損益計算書
売上高
売上原価
売上総利益
販売費及び一般管理費
営業利益
営業外収益
受取利息
受取配当金
持分法による投資利益
受取補償金
雑収入
営業外収益合計
営業外費用
支払利息
為替差損
持分法による投資損失
雑損失
営業外費用合計
経常利益
特別利益
固定資産売却益
投資有価証券売却益
段階取得に係る差益
特別利益合計
特別損失
固定資産除却損
減損損失
特別損失合計
税金等調整前中間純利益
法人税等
中間純利益
非支配株主に帰属する中間純利益
親会社株主に帰属する中間純利益
8
(株)NITTAN(6493)
2027年3月期
第2四半期(中間期)決算短信
前中間連結会計期間
(自 2025年4月1日
至 2025年9月30日)
1,920,054
(単位:千円)
当中間連結会計期間
(自 2026年4月1日
至 2026年9月30日)
1,944,556
127,244
△1,353,874
68,378
△81,994
△1,240,245
679,808
1,113,440
867,869
△222,152
△355,949
1,403,206
3,347,763
639,894
39,914
2,286,223
1,061,540
中間連結包括利益計算書
中間純利益
その他の包括利益
その他有価証券評価差額金
為替換算調整勘定
退職給付に係る調整額
持分法適用会社に対する持分相当額
その他の包括利益合計
中間包括利益
(内訳)
親会社株主に係る中間包括利益
非支配株主に係る中間包括利益
9
(株)NITTAN(6493)
2027年3月期
第2四半期(中間期)決算短信
(3)中間連結キャッシュ・フロー計算書
(単位:千円)
当中間連結会計期間
(自 2026年4月1日
至 2026年9月30日)
前中間連結会計期間
(自 2025年4月1日
至 2025年9月30日)
営業活動によるキャッシュ・フロー
税金等調整前中間純利益
減価償却費
のれん償却額
減損損失
貸倒引当金の増減額(△は減少)
退職給付に係る負債の増減額(△は減少)
受取利息及び受取配当金
支払利息
為替差損益(△は益)
持分法による投資損益(△は益)
投資有価証券売却損益(△は益)
有形及び無形固定資産除売却損益(△は益)
段階取得に係る差損益(△は益)
売上債権の増減額(△は増加)
棚卸資産の増減額(△は増加)
仕入債務の増減額(△は減少)
未払消費税等の増減額(△は減少)
その他
小計
利息及び配当金の受取額
利息の支払額
法人税等の支払額
保険金の受取額
営業活動によるキャッシュ・フロー
投資活動によるキャッシュ・フロー
有形及び無形固定資産の取得による支出
有形及び無形固定資産の売却による収入
投資有価証券の取得による支出
投資有価証券の売却による収入
連結の範囲の変更を伴う子会社株式の取得によ
る収入
貸付けによる支出
貸付金の回収による収入
その他
投資活動によるキャッシュ・フロー
10
2,529,381
1,871,752
9,030
―
△100
34,763
△196,547
135,996
69,127
△112,185
△592,872
△80,596
―
432,078
494,280
△789,484
17,219
△45,602
3,776,242
205,921
△127,706
△652,813
530,026
3,731,671
2,609,754
2,069,850
16,842
14,929
―
28,476
△183,696
146,147
55,124
59,126
△29,674
9,748
△287,806
684,383
615,301
△602,121
△55,036
△378,944
4,772,402
194,534
△139,848
△628,095
―
4,198,992
△2,307,769
192,818
△745
1,110,842
△2,248,194
564
△44
61,900
―
972,859
△12,710
5,450
2,386
△1,009,726
△6,626
4,911
△31,425
△1,246,055
(株)NITTAN(6493)
2027年3月期
前中間連結会計期間
(自 2025年4月1日
至 2025年9月30日)
財務活動によるキャッシュ・フロー
短期借入金の増減額(△は減少)
長期借入れによる収入
長期借入金の返済による支出
社債の償還による支出
セール・アンド・リースバックによる収入
リース債務の返済による支出
自己株式の売却による収入
自己株式の取得による支出
配当金の支払額
非支配株主への配当金の支払額
財務活動によるキャッシュ・フロー
現金及び現金同等物に係る換算差額
現金及び現金同等物の増減額(△は減少)
現金及び現金同等物の期首残高
現金及び現金同等物の中間期末残高
△490,691
359,306
△880,611
△54,000
―
△38,278
―
△110
△172,770
△644,006
△1,921,163
△355,645
445,136
9,272,996
9,718,132
11
第2四半期(中間期)決算短信
(単位:千円)
当中間連結会計期間
(自 2026年4月1日
至 2026年9月30日)
△250,410
1,383,568
△1,203,544
―
339,500
△74,452
5
△40
△373,570
△1,334,849
△1,513,793
△57,650
1,381,493
11,565,178
12,946,672
(株)NITTAN(6493)
2027年3月期
第2四半期(中間期)決算短信
(4)中間連結財務諸表に関する注記事項
(継続企業の前提に関する注記)
該当事項はありません。
(株主資本の金額に著しい変動があった場合の注記)
該当事項はありません。
(中間連結財務諸表の作成に特有の会計処理の適用)
(法人税等の計算)
当連結会計年度の税引前当期純利益に対する税効果会計適用後の実効税率を合理的に見積り、税引前中間純利益
に当該見積実効税率を乗じて計算する方法を採用しております。ただし、当該見積実効税率を用いて税金費用を計
算すると著しく合理性を欠く結果となる場合には、法定実効税率を使用する方法によっております。
なお、法人税等調整額は法人税等に含めて表示しております。
(連結の範囲又は持分法適用の範囲の変更)
1.連結の範囲の重要な変更
当中間連結会計期間において、持分法適用関連会社であった新和精密株式会社の株式を追加取得したことに伴
い、同社及び同社の子会社である日照柳成新和汽車部件有限公司並びにSTP株式会社を連結の範囲に含めておりま
す。
2.持分法適用の範囲の重要な変更
当中間連結会計期間において、新和精密株式会社の株式を追加取得し、連結の範囲に含めたため、同社及び同
社子会社である日照柳成新和汽車部件有限公司を持分法適用の範囲から除外しております。
また、当中間連結会計期間において、持分法適用関連会社であった北京柳成新和汽車部件有限公司の清算が結
了したため、持分法適用の範囲から除外しております。
12
(株)NITTAN(6493)
2027年3月期
第2四半期(中間期)決算短信
(セグメント情報等)
【セグメント情報】
Ⅰ
前中間連結会計期間(自
2025年4月1日
至 2025年9月30日)
1.報告セグメントごとの売上高及び利益又は損失の金額に関する情報並びに収益の分解情報
(単位:千円)
報告セグメント
小型エンジ
ンバルブ
バルブ
リフター
舶用部品
歯車
計
その他
(注)
合計
売上高
日本
5,453,340
59,063
2,501,512
826,445
8,840,361
1,105,578
9,945,940
アジア
7,790,870
―
―
―
7,790,870
257,759
8,048,630
北米
4,782,344
―
―
―
4,782,344
―
4,782,344
欧州
1,648,838
―
―
―
1,648,838
―
1,648,838
顧客との契約から
生じる収益
19,675,394
59,063
2,501,512
826,445
23,062,415
1,363,338
24,425,754
―
―
―
―
―
14,488
14,488
外部顧客への売上高
19,675,394
59,063
2,501,512
826,445
23,062,415
1,377,827
24,440,243
セグメント間の内部
売上高又は振替高
―
―
49,239
―
49,239
672,865
722,105
計
19,675,394
59,063
2,550,752
826,445
23,111,655
2,050,693
25,162,348
セグメント利益又は
損失(△)
1,783,712
△7,383
112,160
△156,257
1,732,232
△90,091
1,642,140
その他の収益
(注)「その他」の区分は報告セグメントに含まれない事業セグメントであり、可変動弁、工作機械製造販売、機械加
工、表面処理、不動産賃貸、ロイヤルティー等を含んでおります。
2.報告セグメントの利益又は損失の金額の合計額と中間連結損益計算書計上額との差額及び当該差額の主な内容
(差異調整に関する事項)
(単位:千円)
利益
金額
報告セグメント計
1,732,232
「その他」の区分の利益
△90,091
セグメント間取引消去
167,712
全社費用(注)
△84,785
中間連結損益計算書の営業利益
1,725,068
(注) 全社費用は、主に報告セグメントに帰属しない親会社の一般管理費に係る費用であります。
13
(株)NITTAN(6493)
Ⅱ
当中間連結会計期間(自
2026年4月1日
2027年3月期
第2四半期(中間期)決算短信
至 2026年9月30日)
1.報告セグメントごとの売上高及び利益又は損失の金額に関する情報並びに収益の分解情報
(単位:千円)
報告セグメント
小型エンジ
ンバルブ
バルブ
リフター
舶用部品
歯車
計
その他
(注)
合計
売上高
日本
6,317,502
68,772
2,347,079
618,499
9,351,854
1,204,727
10,556,582
アジア
8,720,214
1,783,798
―
―
10,504,012
313,570
10,817,583
北米
5,289,975
―
―
―
5,289,975
―
5,289,975
欧州
1,859,157
―
―
―
1,859,157
―
1,859,157
顧客との契約から
生じる収益
22,186,849
1,852,570
2,347,079
618,499
27,005,000
1,518,298
28,523,298
―
―
―
―
―
12,835
12,835
外部顧客への売上高
22,186,849
1,852,570
2,347,079
618,499
27,005,000
1,531,134
28,536,134
セグメント間の内部
売上高又は振替高
―
―
26,785
―
26,785
1,470,566
1,497,352
計
22,186,849
1,852,570
2,373,864
618,499
27,031,785
3,001,701
30,033,486
セグメント利益又は
損失(△)
2,194,557
95,528
131,464
△44,253
2,377,296
△12,721
2,364,574
その他の収益
(注)「その他」の区分は報告セグメントに含まれない事業セグメントであり、可変動弁、工作機械製造販売、機械加
工、表面処理、不動産賃貸、ロイヤルティー等を含んでおります。
2.報告セグメントごとの資産に関する情報
(子会社の取得による資産の著しい増加)
当中間連結会計期間において、新和精密株式会社及び同社の子会社である日照柳成新和汽車部件有限公司並びに
STP株式会社を連結の範囲に含めたことにより、前連結会計年度の末日に比べ、「バルブリフター」のセグメント資
産が6,439,596千円増加しております。
3.報告セグメントの利益又は損失の金額の合計額と中間連結損益計算書計上額との差額及び当該差額の主な内容
(差異調整に関する事項)
(単位:千円)
利益
金額
報告セグメント計
2,377,296
「その他」の区分の利益
△12,721
セグメント間取引消去
75,083
全社費用(注)
△92,219
中間連結損益計算書の営業利益
2,347,438
(注) 全社費用は、主に報告セグメントに帰属しない親会社の一般管理費に係る費用であります。
14
(株)NITTAN(6493)
2027年3月期
第2四半期(中間期)決算短信
4.報告セグメントごとの固定資産の減損損失又はのれん等に関する情報
(のれんの金額の重要な変動)
「バルブリフター」セグメントにおいて、当中間連結会計期間より、新和精密株式会社及び同社の子会社である
日照柳成新和汽車部件有限公司並びにSTP株式会社を連結子会社としました。これにより、のれんを312,446千円計
上しております。
なお、のれんの金額は、当中間連会計期間末において取得原価の配分が完了していないため、暫定的に算定され
た金額であります。
5.報告セグメントの変更等に関する事項
当中間連結会計期間より、新和精密株式会社及び同社の子会社である日照柳成新和汽車部件有限公司並びにSTP株
式会社を連結子会社化したことに伴い、従来「その他」に含まれていた「バルブリフター」について、量的な重要
性が増したため、報告セグメントとして表示する方法に変更しております。
なお、前中間連結会計期間のセグメント情報については、変更後の区分により作成したものを記載しておりま
す。
(企業結合等関係)
(取得による企業結合)
当社は、2026年2月27日開催の取締役会において、韓国の持分法適用関連会社である新和精密株式会社の株式を
韓国の合弁パートナー企業である柳成企業株式会社から16%相当を追加取得し、連結子会社化することについて決
議いたしました。
また、2026年5月28日付で株式譲渡契約を締結し、2026年6月15日付で株式を取得いたしました。
1.企業結合の概要
(1) 被取得企業の名称及び事業内容
企業の名称:新和精密株式会社
事業の内容:バルブリフターの製造販売
(2) 企業結合の目的
当社はこれまで自動車部品の大量生産を中心に事業を行ってまいりました。現在、中長期経営VISION
「NITTAN Challenge 10(NC10)」のもと、新和精密株式会社において北米やインドでの販売拡大を進めてお
り、今回の株式追加取得によるマジョリティ化によって、インドにおける当社子会社のニッタンインディアテ
ックとの連携強化やインド事業の継続的な拡大が期待できます。
本株式取得により、既存技術を活用した新製品開発への取組みを一層推進するとともに、グループ内の経営
資源の共有や事業提携を通じてシナジーを創出し、事業価値の向上を図ることを目的として、株式を取得いた
しました。
(3) 企業結合日
2026年6月15日(株式取得日)
2026年4月1日(みなし取得日)
(4) 企業結合の法的形式
現金を対価とする株式取得
(5) 結合後企業の名称
変更はありません。
(6) 取得した議決権比率
取得日直前に所有していた議決権比率 35%
取得日に追加取得した議決権比率
16%
取得後の議決権比率
51%
(7) 取得企業を決定するに至った主な根拠
当社が現金を対価として株式を取得したことによるものです。
15
(株)NITTAN(6493)
2027年3月期
第2四半期(中間期)決算短信
2.中間連結会計期間に係る中間連結損益計算書に含まれる被取得企業の業績の期間
被取得企業の決算日は12月31日であり、連結決算日と3ヶ月異なっているため、当中間連結会計期間において
は、中間連結損益計算書に被取得企業の2026年4月1日から2026年6月30日までの業績が含まれております。
3.被取得企業の取得原価及び対価の種類ごとの内訳
追加取得直前に保有していた被取得企業持分の企業結合日における時価
企業結合日に追加取得した被取得企業持分の対価
現金
取得原価
2,864,118千円
1,309,311千円
4,173,429千円
4.主な取得関連費用の内容及び金額
アドバイザリー費用等:2,000千円
5.被取得企業の取得原価と取得するに至った取引ごとの取得原価の合計額との差額
段階取得に係る差益:287,806千円
6.発生したのれんの金額、発生原因、償却方法及び償却期間
(1) 発生したのれんの金額
312,446千円
なお、のれんの金額は、当中間連結会計期間末において取得原価の配分が完了していないため、暫定的に算
定された金額であります。
(2) 発生原因
主として今後の事業展開によって期待される将来の超過収益力によるものであります。
(3) 償却方法及び償却期間
超過収益力の効果が発現する期間にわたって均等償却しております。なお、償却期間については算定中であ
ります。
16
(株)NITTAN(6493)
2027年3月期
第2四半期(中間期)決算短信
3.その他
(1)所在地別セグメント情報
Ⅰ 前中間連結会計期間(自
2025年4月1日至
2025年9月30日)
(単位:千円)
売上高
(1) 外部顧客に
対する売上高
(2) セグメント間の
内部売上高又は
振替高
計
日本
アジア
北米
欧州
合計
10,218,189
7,790,870
4,782,344
1,648,838
24,440,243
713,109
1,304,971
―
10,931,298
9,095,842
4,782,344
営業利益又は
△97,256
1,001,192
453,422
営業損失(△)
(注)1 国又は地域の区分は地理的近接度によっております。
2
消去
又は全社
連結
―
24,440,243
143
2,018,223 △2,018,223
―
1,648,981
26,458,467 △2,018,223
24,440,243
1,406,014
1,725,068
48,655
319,054
本邦以外の区分に属する主な国又は地域
アジア・・・台湾、中国、インドネシア、タイ、ベトナム、インド
北米・・・アメリカ
欧州・・・ポーランド
Ⅱ 当中間連結会計期間(自
2026年4月1日至
2026年9月30日)
(単位:千円)
日本
アジア
北米
欧州
合計
10,569,417
10,817,583
5,289,975
1,859,157
28,536,134
(2) セグメント間の
内部売上高又は
振替高
1,613,267
1,391,811
―
計
12,182,684
12,209,395
5,289,975
売上高
(1) 外部顧客に
対する売上高
営業利益又は
245,844
1,204,061
736,672
営業損失(△)
(注)1 国又は地域の区分は地理的近接度によっております。
2
28,536,134
―
3,005,078 △3,005,078
―
1,859,157
31,541,213 △3,005,078
28,536,134
2,211,623
2,347,438
25,045
アジア・・・台湾、中国、韓国、インドネシア、タイ、ベトナム、インド
欧州・・・ポーランド
17
連結
―
本邦以外の区分に属する主な国又は地域
北米・・・アメリカ
消去
又は全社
135,815