EDINET提出書類 大豊工業株式会社(E02199) 有価証券報告書 【表紙】 【提出書類】 有価証券報告書 【根拠条文】 金融商品取引法第24条第1項 【提出先】 関東財務局長 【提出日】 2026年6月22日 【事業年度】 第120期(自 【会社名】 大豊工業株式会社 【英訳名】 TAIH…
EDINET提出書類
大豊工業株式会社(E02199)
有価証券報告書
【表紙】
【提出書類】
有価証券報告書
【根拠条文】
金融商品取引法第24条第1項
【提出先】
関東財務局長
【提出日】
2026年6月22日
【事業年度】
第120期(自
【会社名】
大豊工業株式会社
【英訳名】
TAIHO KOGYO CO., LTD.
【代表者の役職氏名】
代表取締役社長
【本店の所在の場所】
愛知県豊田市緑ケ丘三丁目65番地
【電話番号】
豊田(0565)28−2225
【事務連絡者氏名】
経理部長
【最寄りの連絡場所】
愛知県豊田市緑ケ丘三丁目65番地
【電話番号】
豊田(0565)28−2225
【事務連絡者氏名】
経理部長
【縦覧に供する場所】
株式会社東京証券取引所
2025年4月1日
山
山
新
本
本
美
至
俊
2026年3月31日)
生
要
要
(東京都中央区日本橋兜町2番1号)
株式会社名古屋証券取引所
(名古屋市中区栄三丁目8番20号)
1/126
EDINET提出書類
大豊工業株式会社(E02199)
有価証券報告書
第一部【企業情報】
第1【企業の概況】
1【主要な経営指標等の推移】
(1)連結経営指標等
回次
第116期
第117期
第118期
第119期
第120期
決算年月
2022年3月
2023年3月
2024年3月
2025年3月
2026年3月
売上高
(百万円)
98,820
105,161
112,044
112,789
119,378
経常利益
(百万円)
1,650
1,211
3,236
910
3,007
親会社株主に帰属する当期
純利益又は親会社株主に帰 (百万円)
属する当期純損失(△)
621
399
1,747
△4,187
△5,967
包括利益
(百万円)
2,871
1,783
6,183
△2,197
△4,237
純資産額
(百万円)
66,305
67,085
72,587
69,283
64,344
総資産額
(百万円)
114,379
113,774
119,457
122,336
114,384
1株当たり純資産額
(円)
2,262.24
2,307.30
2,488.39
2,423.24
2,242.42
1株当たり当期純利益又は
1株当たり当期純損失
(△)
(円)
21.42
13.86
60.56
△145.69
△210.68
潜在株式調整後1株当たり
当期純利益
(円)
21.35
13.84
60.42
−
−
自己資本比率
(%)
57.4
58.4
60.2
56.1
55.7
自己資本利益率
(%)
1.0
0.6
2.4
△6.1
△9.4
株価収益率
(倍)
33.0
45.8
15.5
△4.1
△4.8
営業活動によるキャッ
シュ・フロー
(百万円)
7,100
5,870
10,739
6,245
8,467
投資活動によるキャッ
シュ・フロー
(百万円)
△4,725
△5,843
△6,220
△10,201
△5,768
財務活動によるキャッ
シュ・フロー
(百万円)
△3,732
△4,025
△1,008
2,071
△2,056
現金及び現金同等物の期末
(百万円)
残高
19,615
16,080
20,046
18,852
19,687
従業員数
4,332
4,212
4,107
4,090
4,089
〔389〕
〔357〕
〔361〕
〔349〕
〔372〕
〔ほか、平均臨時雇用人
員〕
(名)
(注)1
第119期および第120期の潜在株式調整後1株当たり当期純利益金額については、当期純損失のため記載して
おりません。
2 「収益認識に関する会計基準」(企業会計基準第29号 2020年3月31日)等を第116期の期首から適用して
おり、第116期以降に係る主要な経営指標等については、当該会計基準等を適用した後の指標等となっており
ます。
2/126
EDINET提出書類
大豊工業株式会社(E02199)
有価証券報告書
(2)提出会社の経営指標等
回次
第116期
第117期
第118期
第119期
第120期
決算年月
2022年3月
2023年3月
2024年3月
2025年3月
2026年3月
売上高
(百万円)
55,248
56,499
62,035
62,119
64,302
経常利益又は経常損失
(△)
(百万円)
1,137
△6
1,286
111
1,809
当期純利益又は当期純損失
(百万円)
(△)
△467
1,385
824
△3,359
△6,040
資本金
(百万円)
6,712
6,712
6,712
6,712
6,712
(千株)
29,172
29,172
29,172
29,172
29,172
純資産額
(百万円)
43,065
43,638
44,820
40,118
33,277
総資産額
(百万円)
83,015
80,467
83,823
84,648
74,957
1株当たり純資産額
(円)
1,479.02
1,510.66
1,547.59
1,414.67
1,170.82
1株当たり配当額
(円)
22.00
20.00
20.00
20.00
28.00
(1株当たり中間配当額)
(円)
(12.00)
(10.00)
(10.00)
(10.00)
(10.00)
1株当たり当期純利益又は
1株当たり当期純損失
(△)
(円)
△16.12
48.04
28.57
△116.87
△213.25
潜在株式調整後1株当たり
当期純利益
(円)
−
47.97
28.50
−
−
自己資本比率
(%)
51.7
54.1
53.4
47.3
44.3
自己資本利益率
(%)
△1.1
3.2
1.8
△8.4
△18.2
株価収益率
(倍)
−
13.2
32.8
△5.1
△4.8
配当性向
(%)
△136.5
41.6
70.0
△17.1
△13.1
2,009
1,960
1,904
1,896
1,885
〔165〕
〔136〕
〔142〕
〔152〕
〔166〕
発行済株式総数
従業員数
〔ほか、平均臨時雇用人
員〕
(名)
株主総利回り
(%)
101.9
70.0
65.3
95.5
65.2
(比較指標:TOPIX業種別
指数〔機械〕)
(%)
(94.5)
(100.2)
(143.6)
(134.3)
(197.8)
最高株価
(円)
1,164
747
990
942
1,155
最低株価
(円)
603
596
620
561
469
(注)1
最高株価および最低株価は、2022年4月3日以前は東京証券取引所市場第一部におけるものであり、2022年
4月4日以降は東京証券取引所プライム市場、2023年10月20日以降は東京証券取引所スタンダード市場にお
けるものであります。
2
第116期、第119期および第120期の潜在株式調整後1株当たり当期純利益金額については、当期純損失のた
め記載しておりません。
「収益認識に関する会計基準」(企業会計基準第29号 2020年3月31日)等を第116期の期首から適用して
おり、第116期以降に係る主要な経営指標等については、当該会計基準等を適用した後の指標等となってお
ります。
3
3/126
EDINET提出書類
大豊工業株式会社(E02199)
有価証券報告書
2【沿革】
年月
概要
1939年12月
精密機及び精密機械器具の製造並びに販売等を目的として、愛知県幡豆郡西尾町(現西尾市)に資本金180,000円で西尾精機
株式会社設立。
挙母町(現豊田市)へ移転し、商号を西尾精機株式会社から大豊工業株式会社へ改称。
営業の目的から「精密機」を削除し、「自動車、自転車及び紡績機の部分品」等を追加。
青銅鋳物ブシュ用機械加工工場を新設し、トヨタ自動車工業株式会社(現トヨタ自動車株式会社)からの依頼を受け、青銅鋳
物ブシュの機械加工開始。
アルミダイカスト工場を新設し、ダイカスト製品の生産開始。
米国フェデラル モーグル バワー ベアリング社(現フェデラル モーグル コーポレーション)とすべり軸受に関する技
術導入契約締結。
細谷工場新設。
1944年1月
1945年11月
1946年10月
1958年10月
1961年7月
1969年8月
1973年5月
1977年7月
1978年11月
米国リバノイスオートメーション社との合弁会社「株式会社大豊リバノイスオートメーション」を設立。(現連結子会社)
フェデラル モーグル コーポレーション社との技術導入契約の終結。
「株式会社大豊リバノイスオートメーション」を「大豊精機株式会社」に社名を変更し、リバノイスオートメーション社の出
資を引き継ぎ子会社となる。(現連結子会社)
1981年12月
1985年4月
1991年11月
1996年10月
1997年9月
1998年8月
米国現地法人「タイホウ コーポレーション オブ アメリカ」を子会社として設立。(現連結子会社)
豊田市グリーンテクノピア工場団地に土地を取得し、篠原工場新設。
鹿児島県出水市に九州工場新設。
米国現地法人「タイホウ
コーポレーション
インドネシア現地法人「タイホウ
1999年1月
3月
4月
7月
2000年3月
4月
2001年3月
6月
10月
2002年10月
12月
2003年4月
7月
10月
オブ
アメリカ」の工場操業。(現連結子会社)
米国自動車ビッグ3の品質管理要求規格である「QS-9000」の認証を取得。
技術本館建設。
ヌサンタラ
株式会社」を三井物産株式会社との合弁で子会社として設立。(現連結子会
社)
ドイツ(デュッセルドルフ市)に欧州駐在員事務所を設置。
名古屋証券取引所市場第二部に株式を上場。
愛知県春日井市に春日井工場を新設。
株式会社ティーイーティーを子会社として設立。(現連結子会社)
東京証券取引所市場第二部に株式を上場。
幸海工場新設。
ハンガリー現地法人「タイホウ コーポレーション オブ ヨーロッパ有限会社」を子会社として設立。(現連結子会社)
東京証券取引所及び名古屋証券取引所の市場第一部に上場。
韓国現地法人「韓国大豊株式会社」を三井物産株式会社等との合弁で子会社として設立。(現連結子会社)
株式会社タイホウライフサービスを子会社として設立。(現連結子会社)
中国における軸受製品の製造に関して、中国莱州市電業公司及び中国芝興有限公司より中国煙台春生滑動軸承有限公司の資本
持分の100%を取得し、子会社とする。
大豊工業(煙台)有限公司を子会社として設立。(現連結子会社)
第2幸海工場建設。
大豊工業(煙台)有限公司による、中国煙台春生滑動軸承有限公司の吸収合併。
タイ国現地法人「タイホウ コーポレーション オブ タイランド株式会社」を現地企業との合弁により設立。(現連結子会
社)
11月
2004年8月
10月
2005年4月
10月
2007年2月
2012年7月
日本ガスケット株式会社を買収し38.9%を取得。(なお、2004年3月にて追加取得を実施し、当社出資比率39.6%)
株式会社タイホウパーツセンターを子会社として設立。
当社連結子会社大豊精機株式会社が豊田花本地区企業団地(豊田市)に工業用地を取得し、工場新設。
大豊岐阜株式会社を子会社として設立。
株式交換により、日本ガスケット株式会社を完全子会社化。(現連結子会社)
タイホウ マニュファクチャリング オブ テネシーLLCを子会社として設立。
中国現地法人「常州恒業軸瓦材料有限公司」の資本持分の100%を取得し、子会社とする。(現連結子会社)
2013年10月
2015年12月
2018年1月
タイホウ コーポレーション オブ タイランド株式会社への増資により当社出資比率が増加。(当社出資比率74.0%)
当社連結子会社株式会社タイホウパーツセンターが当社連結子会社大豊岐阜株式会社へ吸収合併。
当社連結子会社ニッポンガスケット オブ アメリカ株式会社が当社連結子会社タイホウ マニュファクチャリング オブ
テネシーLLCへ吸収合併。
タイホウ マニュファクチャリング オブ テネシー株式会社へ商号変更。
2019年4月
2022年4月
当社連結子会社大豊岐阜株式会社が当社へ吸収合併。
東京証券取引所の市場区分の見直しにより、東京証券取引所の市場第一部からプライム市場に移行
2023年10月
名古屋証券取引所の市場区分の見直しにより、名古屋証券取引所の市場第一部からプレミア市場に移行
東京証券取引所の市場区分の再選択により、東京証券取引所のプライム市場からスタンダード市場に移行
4/126
EDINET提出書類
大豊工業株式会社(E02199)
有価証券報告書
3【事業の内容】
当社の企業集団は、当社、連結子会社14社および持分法適用関連会社1社および非連結子会社1社により構成さ
れ、その主な事業は各種自動車部品および搬送装置・精密金型等の自動車製造用設備の製造・販売であります。
当社グループの事業に係る位置付けおよびセグメントとの関連は次のとおりであります。
なお、セグメントと同一の区分であります。
自動車部品関連事業
当社グループは、メタル・ブシュ等の軸受製品・システム製品・ダイカスト製品・ガスケット製品他の自動車部品
を製造・販売しております。連結子会社のタイホウ コーポレーション オブ アメリカは、米国において軸受製
品、システム製品の製造・販売をしております。タイホウ ヌサンタラ(株)は、インドネシアにおいて軸受製品、ダ
イカスト製品の製造・販売をしております。タイホウ コーポレーション オブ ヨーロッパ(有)は、ハンガリーに
おいて軸受製品の製造・販売をしております。韓国大豊(株)は、韓国において軸受製品の製造・販売をしておりま
す。大豊工業(煙台)有限公司は、中国において軸受製品の製造・販売をしております。常州恒業軸瓦材料有限公司
は、中国において軸受製品素材の製造・販売をしております。大豊精機(株)は、自動車用足回り部品の製造・販売を
しております。日本ガスケット(株)は、ガスケット製品の製造・販売をしております。ニッポンガスケットタイラン
ド(株)は、タイにおいてガスケット製品の製造・販売をしております。タイホウ コーポレーション オブ タイラ
ンド(株)は、タイにおいてシステム製品の製造・販売をしております。タイホウ マニュファクチャリング オブ
テネシー(株)は、アメリカにおいてガスケット製品の製造・販売をしております。YANTAI NIPPON GASKET CO.,LTD.
は、中国においてガスケット製品の製造・販売をしております。
関連会社のアストラニッポンガスケットインドネシア(株)は、インドネシアにおいてガスケット製品の製造・販売
をしております。
自動車製造用設備関連事業
当社グループは、精密金型を製造・販売しております。連結子会社の大豊精機(株)は、搬送装置、溶接機、金型、
設備部品等の自動車製造用設備の製造・販売をしております。(株)ティーイーティーは、金型、設備部品等の自動車
製造用設備の製造・販売をしております。
当社は、連結子会社の大豊精機(株)および(株)ティーイーティーに製品の加工を委託しております。
当社は、生産に必要な設備および設備部品等を大豊精機(株)および(株)ティーイーティーより購入しております。
その他
連結子会社の(株)タイホウライフサービスは、営繕、福利厚生事業を行っております。
上記の企業集団の状況について事業系統図を示すと次のとおりであります。
5/126
EDINET提出書類
大豊工業株式会社(E02199)
有価証券報告書
4【関係会社の状況】
2026年3月31日現在
名称
住所
資本金
又は出資金
議決権
主要な事業の の所有
割合
内容
(%)
関係内容
役員の
兼任
(名)
資金援助
営業上の取引
当社より
1,700百
設備及び設備部品の購
設備の
賃貸借
(連結子会社)
大豊精機
株式会社
(注)4、5
愛知県
百万円
豊田市
878
愛知県
豊田市
百万円
自動車製造用
設備関連事業
自動車部品
関連事業
100.0
兼任
2
転籍
1
兼任
2
転籍
2
兼任
2
転籍
2
兼任
2
転籍
1
兼任
1
出向
1
兼任
1
出向
2
兼任
2
出向
1
兼任
2
出向
1
兼任
3
出向
1
兼任
3
出向
1
兼任
3
出向
2
兼任
2
自動車製造用
株式会社
ティーイーティー
75
設備関連事業
自動車部品
100.0
関連事業
株式会社
タイホウライフサービス
愛知県
豊田市
百万円
日本ガスケット
愛知県
豊田市
百万円
株式会社
(注)4
タイホウ コーポレー
ション オブ アメリ
アメリカ
オハイオ州
カ
ティフィン市
(注)4
タイホウ
ヌサンタラ
株式会社
(注)4
タイホウ
コーポレー
ション
パ
オブ
有限会社
ヨーロッ
ペシュト県
ウィハルチャン
千米ドル
百万フォリ
ント
1,800
中国
山東省煙台市
千人民元
中国
江蘇省常州市
千人民元
タイ
プラチンブリ県
千バーツ
アメリカ
テネシー州
千米ドル
タイ
パトゥムタニ県
千バーツ
中国
山東省煙台市
千人民元
(注)4
タイホウ
コーポレー
オブ
タイラン
100.0
自動車部品
194,851
百万ウォン
有限公司
自動車部品
関連事業
百万ルピア
(注)4
常州恒業軸瓦材料
100.0
17,550
町
有限公司 (注)4
その他
自動車部品
関連事業
韓国
大邱広域市
大豊工業(煙台)
ション
ド
ハンガリー
757
(注)4
韓国大豊
株式会社
インドネシア
カラワン県
カラワン市
20
10,420
291,061
186,508
103,000
関連事業
100.0
100.0
自動車部品
関連事業
100.0
自動車部品
関連事業
92.1
自動車部品
関連事業
100.0
自動車部品
関連事業
100.0
自動車部品
関連事業
74.0
万円貸付
け
当社より
25百万円
貸付け
入、当社金型の加工
当社金型の加工設備及
び設備部品の購入
工場用地及
び設備の賃
貸
工場用地及
び設備の賃
貸
−
人材斡旋、清掃業務及
び生協業務
事務所の賃
貸
−
業務提携、技術提携
設備の賃貸
借
当社より
1,112百
万円貸付
け
自動車部品の販売、
自動車部品素材の供給
−
−
自動車部品の販売、
自動車部品素材の供給
−
当社より
181百万
円貸付け
自動車部品の販売、
自動車部品素材の供給
−
−
自動車部品の販売、
自動車部品素材の供給
−
−
自動車部品の販売、
自動車部品素材の供給
−
−
自動車部品素材の供給
−
−
自動車部品の販売
−
−
−
−
−
−
−
株式会社
タイホウ マニュファク
チャリング オブ テネ
シー 株式会社(注)
6,500
自動車部品
関連事業
(100.0)
100.0
自動車部品
関連事業
兼任
2
(100.0) 出向
1
自動車部品
関連事業
(100.0)
自動車部品
関連事業
(50.0)
2、4
ニッポンガスケット
タイランド
株式会社(注)2、4
YANTAI NIPPON GASKET
CO.,LTD. (注)2
203,200
22,208
100.0
100.0
兼任
2
−
−
−
兼任
2
−
−
−
(持分法適用関連会社)
アストラニッポンガス
ケットインドネシア
株式会社(注)2
(注)1
2
3
4
インドネシア
カラワン県
カラワン市
百万ルピア
29,458
50.0
「主要な事業の内容」欄には、セグメント情報に記載された名称を記載しております。
「議決権の所有」欄の(内書き)は間接所有の割合です。
その他の関係会社であるトヨタ自動車(株)については、「第5経理の状況1連結財務諸表等(1)連結財務諸
表注記事項(関連当事者情報)」の項で記載しているため、記載を省略しております。また、同社は有価証
券報告書を提出している会社です。
特定子会社に該当いたします。
6/126
EDINET提出書類
大豊工業株式会社(E02199)
有価証券報告書
5
大豊精機(株)については、売上高(連結会社相互間の内部売上高を除く)の連結売上高に占める割合が10%
を超えております。
大豊精機(株)
① 売上高
15,296百万円
481百万円
② 経常利益
③
当期純利益
314百万円
④
純資産額
7,497百万円
⑤
総資産額
12,348百万円
7/126
EDINET提出書類
大豊工業株式会社(E02199)
有価証券報告書
第2【事業の状況】
1【経営方針、経営環境及び対処すべき課題等】
(1)経営方針
<社是>
・私たちは時流に先んじ、合理主義に基づき優れた製品をもって顧客の信頼に応える - 信頼の大豊 ‒
<使命>
・大豊グループはトライボロジーを基盤とした製品とエンジニアリングをもって社会に貢献する
<2030年に向けて>
− 目指す姿 −
・常に社会のニーズを把握して、技術(材料・工法)を極めて、新たな商品を生み出す集団
− 持続的成長に向けて −
・既存事業の強化〜構造改革と徹底的なロス低減を推進し収益性向上を図る 〜
− 企業価値最大化 −
・新領域・新事業創出〜 グループシーズの結集とリソーセスシフトを実現し、コア技術を生かした新たなソ
リューションを提供する 〜
− 基盤:大事にする価値観 −
・「人」を大事にする会社であり続ける事
(2)優先的に対処すべき事業上の課題
− 持続的成長に向けて −
・既存事業のパワートレイン部品は、将来の成長投資の源泉として収益性を高めるべく、開発プロセス改革なら
びにDX推進により生産性向上を図り、高付加価値事業へのシフトを実現すると共に、グローバル資産の有効活
用を推進して参ります。
− 企業価値最大化 −
・これまで培った技術を結集し、社会課題への解決と電動化への貢献に向けた新領域/新事業の創出を推進して参
ります。成長戦略では、電池部品・設備・パワー半導体冷却器や「水」のサーキュラーエコノミーに着眼した
新たなソリューションの提案にむけて、大豊グループ一体となった開発推進体制の構築ならびにリソーセスの
最適配分を推進して参ります。
− 基盤:大事にする価値観 −
・事業戦略を推進させるのは「人」であり、会社の最も大切な資本という考え方の下、積極的な人への投資、若
手主体のプロジェクト推進、働きやすい環境づくりやエンゲージメント向上を図ってまいります。
・アジャイル開発拠点「篠原BASE」では、将来にむけた人材育成のために、オープンでフラットな組織体制を構
築し、新たな価値創造を推進して参ります。
・ガバナンス強化については、コンプライアンスの徹底、リスクマネジメントの強化等を整備するだけでなく、
それらを運用する「人」の育成にも注力し、全てのステークホルダーから信頼される企業を目指して参りま
す。
(3)経営上の目標の達成状況を判断するための客観的な指標等
当社グループは、事業の成長性と収益性を重視する観点から、売上高および営業利益を経営上の目標達成状況を判
断するための客観的な指標として位置付けております。当連結会計年度における連結売上高は119,378百万円とな
り、2025年10月30日に開示しております連結売上高目標117,000百万円に比べ、2,378百万円(2.0%増)の増収となり
ました。連結営業利益は2,589百万円となり、連結営業利益目標2,300百万円に比べ、289百万円(12.6%増)の増益
となりました。引き続き当該指標の改善に邁進していく所存です。
なお、文中の将来に関する事項は、当連結会計年度末現在において当社グループが判断したものであります。
8/126
EDINET提出書類
大豊工業株式会社(E02199)
有価証券報告書
2【サステナビリティに関する考え方及び取組】
サステナビリティの基本的な考え方及び取組みは、次のとおりであります。
なお、文中の将来に関する事項は、当連結会計年度末現在において当社グループが判断したものであります。
(1)サステナビリティの基本的な考え方
当社におけるサステナビリティの基本的な考えは「トライボロジーを基盤とした製品とエンジニアリングをもっ
て社会に貢献する」ことです。これは、従来から定めていた「使命」そのものです。社会動向の変化に応じて経営
戦略は時代とともに変化していきますが、企業としての成長や存続そのものが社会に貢献してきたことを今後も続
けていくことが、サステナビリティであると考えています。
(2)ガバナンス
2022年2月から、気候関連問題を含む持続可能な社会への貢献に向けた活動を目的として「サステナビリティ委
員会」を設置しております。当委員会では社会・環境問題をはじめとする解決すべき重要な課題(マテリアリティ)
を特定し、事業を通じた当該課題への取り組みを取締役会に報告しています。原則1回/年以上開催し、構成メン
バーは取締役5名(うち社外取締役2名)となっています。
(図)ガバナンス体制図
9/126
EDINET提出書類
大豊工業株式会社(E02199)
有価証券報告書
(図)マテリアリティと主な取り組み
(3)戦略
解決すべき重要な課題(マテリアリティ)のうち、将来的な気候変動問題による影響を移行リスク(2℃以下)、
物理的リスク(4℃)に分けて分類し、リスクと機会の抽出を行いました。
また、抽出したリスクと機会についてそれぞれ当社グループへの財務影響の大きさを予測し掲載しています。今
後は事業への影響について精度を高めるとともに、それぞれのリスクと機会に対する取り組みを進めてまいりま
す。人的資本の戦略については、(5)指標及び目標に記載をしたとおりであります。
(図)シナリオ分析
10/126
EDINET提出書類
大豊工業株式会社(E02199)
有価証券報告書
(4)リスク管理
気候関連問題によるリスクを含め重要課題(マテリアリティ)を特定し、対応策の検討を行っています。特定方法
としては抽出した事象について評価・分析を行い、経営陣による評価のもと、当社のマテリアリティとしていま
す。
また、特定において、取り組むべきマテリアリティを「社会にとっての重要度」と「大豊にとっての重要度」の
2つの観点からプライオリティを決定しています。
特定したマテリアリティの例として、地球環境に貢献する製品の開発や脱炭素社会の実現、環境負荷物質の低減
による循環型社会への貢献を定めています。
主な取り組みとして、新製品開発やCO2を始めとした環境負荷物質の低減等を行っています。
また、物理的リスクに関するものとしては災害対策本部主導のもと、サプライチェーンマネジメントの強靭化を
含むBCM体制の強化を推進しています。
(5)指標及び目標
気候関連リスクに対して大きくCO2、廃棄物、水資源などの目標値を定めています。CO2の削減シナリオで、2035
年のカーボンニュートラル達成に向けた取り組みを推進しています。2030年に50%削減を目指し、日常改善の実施
や工程刷新、エネルギー転換を実施しています。
(図)CO2削減シナリオ
11/126
EDINET提出書類
大豊工業株式会社(E02199)
有価証券報告書
当社における人材の育成に関する方針及び社内環境整備に関する方針、その基本的な考え方と取り組みは次の通
りです。
人材の育成
方針
基本的な
考え方
・会社の経営理念に基づき、会社の発展と従業員の自己成長のため、創造性と実践力を持った
人材の育成を図ります。
・2030年に向けて大切にしたい基盤は「人」を大事にする会社であることです。
そのために「誰かが喜ぶために」主体的に考動できる人材づくり、「会社の永続」と
「従業員の幸せ(やりがい)」のバランスが取れた会社を目指します。
<実践型リーダーシップ教育の導入>
・25年度より教育のあり方を抜本的に見直し、これまでの座学中心のある意味で”詰め込み型
の教育スタイル”から、より職場での実践を重視した”実践型の教育スタイル”への転換を
推進してきました。具体的な取り組みとして、階層別教育の一つである、リーダーシップ教
育の刷新を図りました。これまでは受講生が一同に会議室に集まり、座学を中心に、教わる
こと(input)が中心の教育となっており、実践の場(output)とは離れた教育スタイルとなっ
ていました。これを刷新して、座学はミニマムとし、そこで学んだことを職場に持ち帰り、
職場実践の中で、部署横断での問題解決テーマの選定、他部署メンバーも巻き込んだチーム
編成とその運営、上司/メンバーと共同での問題解決の実践を行う教育に大きく転換を図り
ました。実践型教育を通じ、より実践力を持った人材の育成を図っていきます。
取り組み
<挑戦を後押しする共創の場”篠原BASE”の設置>
・当社は、一人ひとりの挑戦する意欲を尊重し、それを実現できる環境を整えることで、個人
の成長と組織活性化を図り、新たな価値創造を実現していきたいと考えています。その取り
組みのひとつが、25年に篠原工場内に開設したスタートアップ型実証工房”篠原BASE”で
す。ここでは、若手従業員を中心に営業・調達・開発・生産技術・評価など多様な人材が集
い、課題解決に挑戦しています。マーケティングから試作・設計まで一貫して経験できる環
境は、学びと実践の場であり、挑戦を通じてリーダーシップや実行力が育まれています。私
たちは、従業員の挑戦を応援しながら、個人と企業がともに成長できる風土を築いていきま
す。
<普遍的に大切なものを共有し成長に繋げる”大豊手帳”発刊>
・26年1月に全社員を対象として"大豊手帳"を発刊しました。大豊手帳は、大豊の社員として
普遍的に大切にしている価値観や心構えを仲間と共有し、それを一人ひとりが振り返り気づ
きを得ることで人間的成長に繋げていくとともに、迷った時に立ち返るためのものとして発
刊しています。大豊手帳を通じて、原点回帰して大豊のDNAを振り返り、気づきを得てそれ
を残していくことで、一人ひとりのさらなる成長と組織力の向上を図っていきます。
12/126
EDINET提出書類
大豊工業株式会社(E02199)
有価証券報告書
社内環境整備
方針
・従業員一人ひとりが「仕事と家庭の両立」「夢や目標を持って仕事に取り組む」等、
自分らしく輝き、仕事で成果を出せる働きやすい職場づくりを推進します。
また各自のキャリア(ライフ)プランを主体的に描いた上で、自己研鑽しながらいきいきと
活躍してもらうための仕組み、制度を充実させます。
・従業員一人ひとりが能力を最大限発揮するための仕掛け・仕組みづくりに取り組みます。
基本的な
考え方
・従業員一人ひとりがワークライフバランスを考えて自分の働き方を選択できる制度を整えま
す。
・従業員が笑顔でいきいきと働き続けられる会社であるため、従業員の健康維持増進に向けて
健康経営に取り組みます。
<一人ひとりが能力を最大限発揮するための人事制度構築>
・年齢や性別等に関わらず、一人ひとりがその持ちうる能力を最大限発揮するための人事制度
構築を進めています。具体的な取り組みとして、昇格の基準について、従来の年功序列的な
要素を排除し、より意欲と能力を重視した基準への見直しを図りました。また、60歳以降の
再雇用者についても、これまで積み上げたスキル/経験をより活かし活躍してもらうことを
目的に、その期待値や働き方、働きに見合ったメリハリある賃金体系/水準への見直しを図
る等、再雇用制度の改訂を行いました。
取り組み
<キャリア形成面談の充実>
・一人ひとりが意識を変え、自身のキャリアプランを自ら考え、主体的に行動できる人材が育
つ会社としていくために、24年度より上司との定期面談を「目標(業務)管理」から「キャリ
ア形成」主体の位置付け/内容へと見直しました。そのためのツールとして、1on1シート
を「育成重視の対話型ツール」へ大きく見直し、自らの強み弱みの把握、上司部下双方での
対話を通じた、具体的なキャリアプラン、それを実現するための行動を明記する仕様として
います。今後もキャリア形成を支援する教育の充実を図る等、一層の取組み強化を進めてい
きます。
<労使議論の拡充(働き方向上委員会)を通じた働き方の変革>
・従来は春と秋の労使協議に限定されていた労使議論の場を拡充し、特に働き方に関する労使
での課題議論を年間通じてタイムリーに実施することを狙いとして、”働き方向上委員会”
を設置しました。25年度は、”社内応援のあり方””年次有給休暇の取得促進”等につい
て、労使で議論を実施し、課題認識と対応方向性を確認しました。次年度以降も、より良い
働き方の実現に向けて労使議論を継続的に実施し、具体的施策に繋げていきます。
<健康経営にむけた取り組み>
・従業員が笑顔でいきいきと働き続けられる会社であるため、その健康維持増進に向けた健康
経営に取り組んでいます。”体の健康づくり””心の健康づくり”の両面で取り組みを進め
ており、例えば、心の健康づくりでは、メンタルヘルスに関する早期の発見・介入・治療へ
の対応のため、若年層従業員へのメンタルセルフケア教育、職制へのメンタルラインケア
(傾聴)教育、公認心理師による心の相談会等を実施しています。健康経営方針に基づき、
中長期で健康施策投資計画を立案し取り組みを推進しており、経済産業省と日本健康会議が
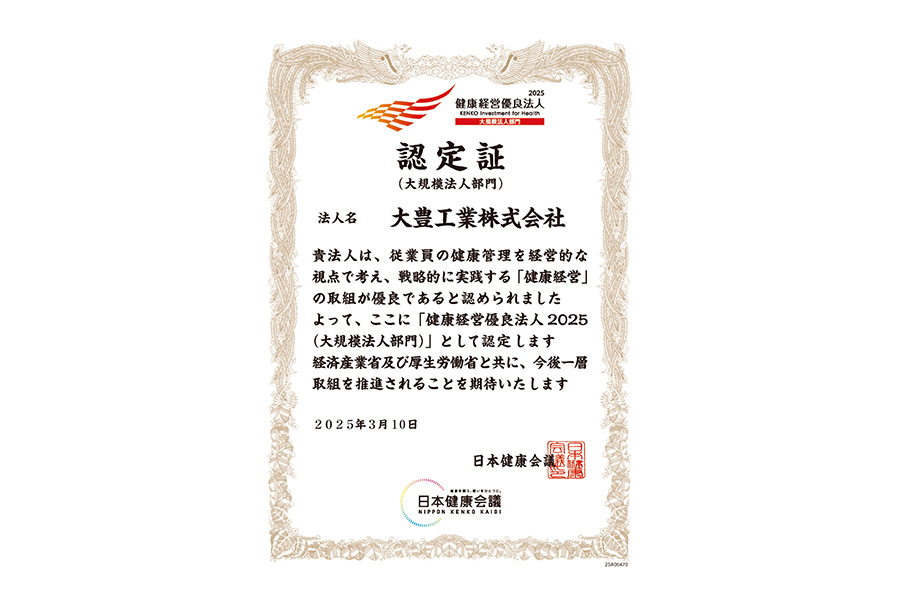
共同で実施する健康経営優良法人2026(大規模法人部門)に認定されております。
尚、当社はグループ各社と連携し、人的資本経営における重要課題への取り組みを推進しておりますが、全ての
グループ会社で同一の取り組みが行われているものではないため、当社の内容を記載しております。
13/126
EDINET提出書類
大豊工業株式会社(E02199)
有価証券報告書
3【事業等のリスク】
有価証券報告書に記載した事業の状況、経理の状況等に関する事項のうち、経営者が連結会社の財政状態、経営成
績及びキャッシュ・フローの状況に重要な影響を与える可能性があると認識している主要なリスクは、以下のとおり
であります。
なお、文中の将来に関する事項は、当連結会計年度末現在において当社グループが判断したものであります。
1.特定の得意先への販売依存度
当社グループは、自動車部品および自動車製造用設備の製造・販売を主な事業としており、国内外の主要な自動
車メーカーおよび自動車部品メーカーにOEM製品を中心に販売しております。これらの得意先の中で、トヨタ自動
車(株)への販売依存度が最も高く、当期におきましては総販売額に占める割合は27.2%となっています。
従いまして、顧客企業の販売動向の変化、調達方針の変更、予期しない契約の打ち切り、また直近の資材供給不
足のような顧客企業の動向に直接的な影響を与える事象等が生じた場合、当社グループの経営成績および財政状態
等に悪影響を及ぼす可能性があります。
当社グループでは、欧米や中国、アジア等の海外の自動車メーカーへの拡販活動により、特定の得意先への販売
依存によるリスクを低減してまいります。
2.為替レートの変動
当社グループの事業には、全世界における製品の生産と販売が含まれています。各地域における売上、費用、資
産を含む現地通貨建ての項目は、連結財務諸表作成のために円換算されています。従いまして、換算時の為替レー
トにより、円換算後の価値が影響を受ける可能性があります。
一般に、他の通貨に対する円高(特に当社グループの売上の重要部分を占める米ドルに対する円高)は、当社グ
ループに悪影響を及ぼし、円安は好影響をもたらします。
また、当社グループが日本で生産し、輸出する事業においては、他の通貨に対する円高は、製品の価格競争力を
低下させ、経営成績および財政状態等に悪影響を及ぼす可能性があります。
なお、米ドルに対して円が1円変動した場合、為替レート変動が経常利益に与える影響は年間約30百万円と試算
しております。
当社グループでは、スムーズな現地生産化の促進や、資材の現地調達拡大等を図るとともに、各国での生産コス
ト低減による収益安定化を推進しておりますが、当社グループの経営成績は為替相場変動により重要な影響を受け
る可能性があります。
3.資材価格の変動
当社グループは、製品の製造に使用する原材料や部品を複数の供給元から調達しております。供給元とは取引基
本契約を締結し、安定的な取引を前提としておりますが、市況の変化による価格の高騰や品不足の結果、当社グ
ループの製造原価の上昇を招き、当社グループの経営成績および財政状態に悪影響を及ぼす可能性があります。
4.退職給付に係る負債
当社グループの従業員退職給付費用および債務は、割引率などの数理計算上の前提条件や年金資産の長期期待収
益率に基づいて算出されております。従いまして、割引率の低下や年金資産の減少など実際の結果が前提条件と異
なる場合は、将来の期間に認識される費用および計上される債務に大きな影響を及ぼす可能性があります。
当社グループでは、年金資産の運用にあたり、より安定性の高い資産での運用を継続することにより、リスクを
低減してまいります。
5.製品の欠陥に関するリスク
当社グループは製品の品質の確保・向上に努めておりますが、大規模なリコール等につながる製品の欠陥が発生
した場合には、当社グループの評価に重大な影響を与え、当社グループの経営成績及び財政状態に悪影響を及ぼす
可能性があります。
14/126
EDINET提出書類
大豊工業株式会社(E02199)
有価証券報告書
4【経営者による財政状態、経営成績及びキャッシュ・フローの状況の分析】
業績等の概要
(1)業績
当連結会計年度における世界経済は、各国の金融政策や物価動向に加え、地政学リスクの高まり等を背景に、引
き続き予断を許さない状況が続きました。
自動車業界におきましては、半導体をはじめとする供給制約の緩和が進んだものの、主要市場における需要動向
は総じて力強さを欠き、競争環境は一層厳しさを増しました。また、自動車の電動化・自動化の進展に伴う競争環
境の変化、ならびに資材供給の不確実性および価格上昇の影響など、依然として先行きは不透明な一面を残してお
ります。
このような状況の中、当連結会計年度の業績は、連結売上高は、前年度より6,588百万円の増収となる119,378百
万円となり、連結営業利益は1,978百万円増益の2,589百万円となりました。
a.財政状態
当連結会計年度末の資産合計は、前連結会計年度末に比べ7,952百万円減少し、114,384百万円となりました。
当連結会計年度末の負債合計は、前連結会計年度末に比べ3,012百万円減少し、50,040百万円となりました。
当連結会計年度末の純資産合計は、前連結会計年度末に比べ4,939百万円減少し、64,344百万円となりました。
b.経営成績
当連結会計年度の経営成績は、連結売上高は119,378百万円となり、前連結会計年度に比べ、6,588百万円(前年
度比5.8%増)の増収となりました。利益面では、連結営業利益は2,589百万円(前年度比323.8%増)、連結経常利
益は3,007百万円(前年度比230.1%増)、親会社株主に帰属する当期純損失は5,967百万円(前年度は当期純損失
4,187百万円)となりました。
(2)キャッシュ・フローの状況
当連結会計年度末における現金及び現金同等物(以下「資金」という。)は、19,687百万円となり前連結会計年
度末より835百万円増加(前年度比4.4%増)いたしました。
(営業活動によるキャッシュ・フロー)
営業活動の結果得られた資金は、8,467百万円となり、前連結会計年度末に比べ2,222百万円増加(前年度比
35.6%増)いたしました。営業活動によるキャッシュ・フローの増加要因は、主に減損損失の計上9,168百万円、
減少要因は税金等調整前当期純損失の増加4,105百万円、投資有価証券売却益の発生1,661百万円によるものであり
ます。
(投資活動によるキャッシュ・フロー)
投資活動の結果使用した資金は、5,768百万円となり、前連結会計年度末に比べ4,433百万円減少(前年度比
43.5%減)いたしました。投資活動によるキャッシュ・フローの支出減少要因は、主に有形固定資産の取得による
支出の減少5,515百万円、投資有価証券の売却による収入の増加1,516百万円によるものであります。
(財務活動によるキャッシュ・フロー)
財務活動の結果使用した資金は、2,056百万円(前年同期は2,071百万円の取得)となりました。財務活動による
キャッシュ・フローの減少要因は、主に長期借入れによる収入の減少8,000百万円、長期借入金の返済による支出
の減少3,487百万円によるものであります。
15/126
EDINET提出書類
大豊工業株式会社(E02199)
有価証券報告書
(3)生産、受注及び販売の実績
a.生産実績
当連結会計年度における生産実績をセグメントごとに示すと、次のとおりであります。
セグメントの名称
生産高(百万円)
前年同期比(%)
自動車部品関連事業
105,791
5.6
自動車製造用設備関連事業
13,142
5.3
118,934
5.5
合計
(注)1
2
セグメント間取引については、相殺消去しております。
金額算出基礎は、販売価格で計算しております。
b.受注実績
当連結会計年度における受注実績をセグメントごとに示すと、次のとおりであります。
なお、自動車製造用設備関連事業を除く製品については見込生産を行っております。
セグメントの名称
受注高(百万円)
前年同期比(%)
受注残高(百万円)
前年同期比(%)
12,199
△16.8
5,599
△14.5
自動車製造用設備関連事業
c.販売実績
当連結会計年度における販売実績をセグメントごとに示すと、次のとおりであります。
セグメントの名称
販売高(百万円)
前年同期比(%)
軸受製品
47,405
3.0
システム製品
22,261
9.8
ダイカスト製品
13,620
12.6
ガスケット製品
18,042
5.1
その他
4,735
2.6
106,066
5.9
13,147
5.5
164
△3.4
119,378
5.8
自動車部品関連事業
計
自動車製造用設備関連事業
その他
合計
(注)1
2
セグメント間取引については、相殺消去しております。
主な相手先別の販売実績及び当該販売実績の総販売実績に対する割合は、次のとおりであります。
相手先
前連結会計年度
2024年4月1日
2025年3月31日)
販売高(百万円)
トヨタ自動車(株)
当連結会計年度
2025年4月1日
2026年3月31日)
(自
至
(自
至
割合(%)
31,552
27.9
16/126
販売高(百万円)
32,531
割合(%)
27.2
EDINET提出書類
大豊工業株式会社(E02199)
有価証券報告書
(4)経営者の視点による経営成績等の状況に関する分析・検討内容
a.重要な会計上の見積り及び当該見積りに用いた仮定
当社グループの連結財務諸表は、わが国において一般に公正妥当と認められている会計基準に基づき作成されて
おります。この連結財務諸表の作成にあたって、会計方針の選択、資産・負債及び収益・費用の報告金額及び開示
に影響を与える見積りを必要とします。経営者は、これらの見積りについて過去の実績等を勘案し合理的に判断し
ておりますが、実際の結果は見積りの不確実性があるため、これらの見積りと異なる結果となる場合があります。
当社グループの連結財務諸表で採用する重要な会計方針、会計上の見積り及び当該見積りに用いた仮定について
は、「第5経理の状況1連結財務諸表等(1)連結財務諸表注記事項(連結財務諸表作成のための基本となる重要な
事項)、(重要な会計上の見積り)」に記載しておりますが、特に以下の重要な会計方針が連結財務諸表作成にお
ける重要な見積りの判断に大きな影響を及ぼすと考えております。
①
減損損失
当社グループは、事業用資産を各セグメント内の製品別にグルーピングしております。減損損失の認識の判定
は、各セグメント内における製品別の将来キャッシュ・フローの見積りを使用しており、製品の売上高の予測と
設備投資に関連する将来キャッシュ・フローを主要な仮定としております。翌連結会計年度以降の売上高及び設
備投資に関連する将来キャッシュ・フローの仮定が顧客の生産計画等の変化や設備投資計画が前提から大きく異
なった場合には、翌連結会計年度の減損損失に影響を与える可能性があります。
② 繰延税金資産
当社グループは、収益力に基づく一時差異等加減算前課税所得に基づき、将来の税負担を軽減する効果を有す
る範囲内で繰延税金資産を計上しております。収益力に基づく一時差異等加減算前課税所得は、将来計画に基づ
いております。将来計画は製品の売上高の予測から変動費や固定費などの各種費用の予測を控除して算定してお
ります。また、製品の売上高の予測を主要な仮定としており、製品の売上高の予測は顧客の生産計画等を基礎と
して算出しております。翌連結会計年度以降の売上高の予測の仮定が顧客の生産計画等の変化により大きく異
なった場合には、翌連結会計年度の繰延税金資産及び法人税等調整額の増減に影響を与える可能性があります。
③ 製品保証引当金
北米の当社連結子会社において生産した製品の一部に不具合が発生する恐れがあることから得意先より市場回
収処置(リコール)の届出が米国運輸省道路交通安全局(National Highway Traffic Safety Administration)
に行われたことに伴い、対象台数等の現時点で入手可能な情報に基づき、保証費用の発生見込み額として製品保
証引当金を計上しております。
これらの計算には不確実性が含まれているため、予測不能な前提条件の変化等により、実際の保証費用が異な
り、結果として製品保証引当金の追加計上又は戻入が必要となる可能性があります。
b.財政状態の分析
① 流動資産
当連結会計年度末における流動資産の残高は66,161百万円であり、前連結会計年度末に比べ2,259百万円増加
しております。現金及び預金の3,308百万円の増加、原材料及び貯蔵品の171百万円の増加、電子記録債権の496
百万円の減少が主な要因であります。
② 固定資産
当連結会計年度末における固定資産の残高は48,222百万円であり、前連結会計年度末に比べ10,211百万円減少
しております。機械装置及び運搬具の6,559百万円の減少、建設仮勘定の3,653百万円の減少、建物及び構築物の
1,299百万円の減少、退職給付に係る資産の957百万円の増加が主な要因であります。
③ 流動負債
当連結会計年度末における流動負債の残高は37,789百万円であり、前連結会計年度末に比べ12,410百万円増加
しております。1年内返済予定の長期借入金の14,111百万円の増加、資産除去債務の359百万円の増加、電子記
録債務の4,119百万円の減少が主な要因であります。
④ 固定負債
当連結会計年度末における固定負債の残高は12,250百万円であり、前連結会計年度末に比べ15,423百万円減少
しております。長期借入金の15,457百万円の減少が主な要因であります。
⑤ 純資産
当連結会計年度末における純資産の残高は64,344百万円であり、前連結会計年度末に比べ4,939百万円減少し
ております。利益剰余金の6,533百万円の減少、為替換算調整勘定の874百万円の増加、退職給付に係る調整累計
額の557百万円の増加が主な要因であります。
17/126
EDINET提出書類
大豊工業株式会社(E02199)
有価証券報告書
c.キャッシュ・フローの分析
「業績等の概要」の「(2)キャッシュ・フローの状況」で述べておりますように当社グループの資金状況は、
当連結会計年度末における現金及び現金同等物(以下「資金」という。)は、19,687百万円となり、前連結会計年
度末より835百万円増加いたしました。
① 営業活動によるキャッシュ・フロー
営業活動の結果得られた資金は、8,467百万円となり、前連結会計年度に比べ2,222百万円増加(前年度比
35.6%増)いたしました。営業活動によるキャッシュ・フローの増加要因は、減損損失の計上9,168百万円、減
少要因は税金等調整前当期純損失の増加4,105百万円、投資有価証券売却益の発生1,661百万円によるものです。
② 投資活動によるキャッシュ・フロー
投資活動の結果使用した資金は、5,768百万円となり、前連結会計年度に比べ4,433百万円減少(前年度比
43.5%減)いたしました。投資活動によるキャッシュ・フローの支出減少要因は、有形固定資産の取得による支
出の減少5,515百万円、投資有価証券の売却による収入の増加1,516百万円によるものです。
③ 財務活動によるキャッシュ・フロー
財務活動の結果使用した資金は、2,056百万円(前年同期は2,071百万円の取得)となりました。財務活動によ
るキャッシュ・フローの減少要因は、長期借入れによる収入の減少8,000百万円、長期借入金の返済による支出
の減少3,487百万円によるものです。
d.経営成績の分析
① 売上高
当連結会計年度における売上高は、119,378百万円となり、前連結会計年度に比べ6,588百万円増加(前年度比
5.8%増)いたしました。これは主として、自動車部品関連事業の売上が増加したことによるものです。
② 営業利益
当連結会計年度における営業利益は、2,589百万円となり、前連結会計年度に比べ1,978百万円増加(前年度比
323.8%増)いたしました。
③
営業外損益
当連結会計年度における営業外収益は、883百万円となり前連結会計年度に比べ96百万円増加(前年度比
12.2%増)いたしました。これは主として、為替差益の増加によるものです。また、営業外費用は、465百万円
となり21百万円減少(前年度比4.5%減)いたしました。これは主として、固定資産除却損(営業外費用合計)
の減少によるものです。
④ 経常利益
当連結会計年度における経常利益は、3,007百万円となり、前述の要因により、前連結会計年度に比べ2,096百
万円増加(前年度比230.1%増)いたしました。
⑤ 特別損益
当連結会計年度における特別利益は、1,692百万円となり、前連結会計年度に比べ1,449百万円増加(前年度比
597.6%増)いたしました。これは主として、投資有価証券売却益の増加によるものです。また、特別損失は、
9,295百万円となり、7,651百万円増加(前年度比465.3%増)いたしました。これは主として、減損損失の増加
によるものです。
⑥ 税金等調整前当期純利益
当連結会計年度における税金等調整前当期純損失は、4,596百万円となり、前述の要因により、前連結会計年
度に比べ4,105百万円減少(前年度は税金等調整前当期純損失490百万円)いたしました。
⑦ 法人税等
当連結会計年度における法人税等は、1,205百万円となりました。
⑧ 非支配株主に帰属する当期純利益
当連結会計年度における非支配株主に帰属する当期純利益は、連結子会社における利益の増加などにより、前
連結会計年度に比べ、49百万円増加(前年度比42.3%増)して、166百万円となりました。
⑨ 親会社株主に帰属する当期純利益
当連結会計年度における親会社株主に帰属する当期純損失は、5,967百万円となり、前連結会計年度に比べ
1,780百万円減少(前年度は当期純損失4,187百万円)いたしました。1株当たり当期純損失は△210.68円(前連
結会計年度は1株当たり当期純損失△145.69円)となりました。
セグメントごとの財政状態及び経営成績の状況に関する認識及び分析・検討内容は以下のとおりです。
18/126
EDINET提出書類
大豊工業株式会社(E02199)
有価証券報告書
(自動車部品事業)
① 軸受製品では、コンプレッサーを中心とした製品の日本、欧州、北米、中国での生産増により、連結売上高は
47,405百万円(前年度比1,395百万円増、3.0%増)となりました。
② システム製品では、バキュームポンプ製品を中心とした製品の生産増により、連結売上高は22,261百万円(前
年度比1,995百万円増、9.8%増)となりました。
③ ダイカスト製品では、電動化対応製品の売上拡大により連結売上高は13,620百万円(前年度比1,526百万円
増、12.6%増)となりました。
④ ガスケット製品では、市場の回復に伴い日本、北米での生産増により連結売上高は18,042百万円(前年度比
876百万円増、5.1%増)となりました。
⑤ その他製品では、連結売上高4,735百万円(前年度比121百万円増、2.6%増)となりました。
(自動車製造用設備事業)
自動車製造用設備関連事業では、設備事業が増加し、連結売上高は13,147百万円(前年度比680百万円増、5.5%
増)となりました。
e.資本の財源及び資金の流動性
① 資金需要
当社グループの資金需要の主なものは、製品製造のための材料、部品の購入及び設備投資によるものでありま
す。また、長期借入金返済のための資金需要も大きくなっております。
② 財務政策
当社グループは、設備投資は継続して実施するものの、財務の健全性を保つために、投資金額の抑制を図り資
金負担を軽減するとともに、営業活動によるキャッシュ・フローを生み出すことによって、将来必要な運転資金
及び設備資金を調達することを考えております。
f.経営成績等の状況に関する認識及び分析・検討内容
当社グループの経営に影響を与える大きな要因としては、市場動向等があります。
自動車産業を取り巻く事業環境は、電動化・自動化等に関する技術動向や環境規制への対応、各国市場における
競争環境の変化などにより、継続的な変化が生じております。これらの動向に加え、経済情勢や政策動向等の影響
もあり、事業環境の先行きについては不確実性が存在しております。このような状況のもと、当社グループは、す
べり軸受を中心とした既存事業の維持・強化に取り組むとともに、収益性の確保および事業基盤の安定化を図って
まいります。また、「地球環境とお客様への貢献」を基本的な考え方とし、「グローバル供給を支える製造・生産
技術」、「製品技術・生産技術の改善」、「人財力の強化」等を通じて、競争力の維持・向上に努めてまいりま
す。
g.経営方針、経営戦略、経営上の目標の達成状況を判断するための客観的な指標等
当社グループは、売上高および営業利益を重要な経営指標として位置付けております。
当社グループは、連結業績予想を2025年4月24日に開示いたしましたが、合理化努力の進展や原材料影響、投資
抑制による減価償却費の低減などにより2025年10月30日に修正しております。
当連結会計年度における連結売上高は119,378百万円となり、2025年10月30日に開示しております連結売上高目
標117,000百万円に比べ、2,378百万円(2.0%増)の増収となりました。連結営業利益は2,589百万円となり、連結営
業利益目標2,300百万円に比べ、289百万円(12.6%増)の増益となりました。引き続き当該指標の改善に邁進して
いく所存です。
5【重要な契約等】
該当事項はありません。
19/126
EDINET提出書類
大豊工業株式会社(E02199)
有価証券報告書
6【研究開発活動】
当社グループは、トライボロジー(摩擦/摩耗/潤滑技術)をコア技術として、自動車メーカーのニーズはもとよ
り、環境、社会の動向を捉え、解決すべき課題を明確にしながら、自動車用各種すべり軸受や各種機能部品の研究開
発を行っており、“動きを支える”機能部品の創造に努めております。
当連結会計年度の研究開発活動は、守りと攻めの両軸で既存製品拡大と新領域へのチャレンジを進め、次世代軸受
に向けた新技術・新材料の研究とその応用製品開発、ならびに高付加価値のシステム製品の開発を重点に実施いたし
ました。
また、HEV、PHEV、BEV、FCEV等電動車両の今後の増加に向け、当社グループの保有技術を活かし、電池、電力変
換、モータ、燃料電池分野の新製品開発に着手しております。一部製品につきましては、ホームページ掲載、展示会
出展、客先提案等を実施しております。
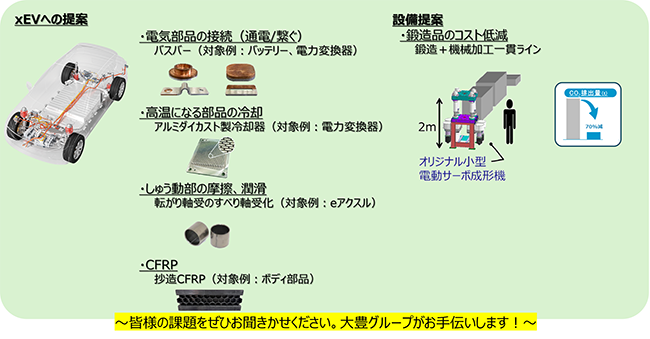
HEV、BEVについては、当社のクラッド生産技術の活用をキーワードとして、電池用端子の開発を行っており、既に
多くの問い合わせを頂いております。現在は電力変換部品として当社のダイカスト生産技術が活用できるパワーモ
ジュール用の精密フィンを有するヒートシンクの開発にも着手しております。
FCEVに関しては、水素社会実現への貢献に向け発電評価装置を導入し、設計提案・受託評価を実施できる体制も整
え、受託評価につきましては既にお引き合いを頂いております。
それに加え、今までの当社の軸受を支えてきた基盤技術(材料技術、CAE)に関しても、新製品開発に向け体制を
整えました。新材料開発については多くの大学と共同開発を推進しており、最先端の技術を取り入れております。
なお、自動車分野に加え、産業用排水処理分野の研究開発をしております。生産技術や設備設計の知見を活かし、
環境課題の解決に向けた新規事業として取り組んでいます。現在は、処理負荷の高いめっき・表面処理排水を対象
に、小型で高性能な処理システム「アクアブレイナ」の開発を進めており、実証実験や市場検証などを実施中です。
セグメントの研究開発活動を示すと、次のとおりであります。
自動車部品関連事業
1)軸受製品
高性能エンジンやHEV、PHEV、中国の環境規制に対応したエンジン用軸受、ブシュ、コンプレッサー用特殊軸
受、各種軸受などを継続し開発してきました。特に、低燃費化のための摩擦低減を実現すべく様々な取り組みを実
施しております。
①主にガソリンエンジン用として、樹脂コーティングも進化させました。信頼性を向上したもの・低燃費に貢献
する等のバリエーションが増え、樹脂コーティング付軸受の採用が拡大しています。
②ディーゼルエンジンの高筒圧化に対応するため、世界で初めてオーバーレイにBi-Sb合金を用いたエンジン用
軸受は、従来課題となっていた耐疲労性と耐酸性を飛躍的に向上させました。この製品は2022年の自動車技術会に
て技術開発賞を受賞しております。また、厚膜の樹脂コーティングやコンロッド用の新ソリッドブッシュも量産化
しました。これらの新軸受は海外拠点(中国)で生産しており、中国市場において更に競争力を強化することが出
来ました。
③車両用電動コンプレッサーでは、転がり軸受をすべり化することで、長寿命、低振動・低騒音に貢献出来る事
から、海外メーカーへの供給を開始しました。非常に高評価で、海外メーカーの採用が拡大しています。
④開発期間短縮・コスト削減の対応として、製品開発へMBD(モデルベース開発)の適用を進めています。軸受
だけでなく、その周囲についてもより良くするための提案をしており、システムの開発初期から参画させていただ
いております。その実績から、最近では計算解析や実験の受託業務を多数実施させていただいております。
また、完全子会社化した中国で最大のアルミ軸受素材メーカー「常州恒業軸瓦材料有限公司」では、アルミ鋳造
ラインを導入し、素材から加工までの完全一貫生産体制を構築しています。
これらの技術および生産の取り組みが認められ、国内外の自動車メーカーへの納入も拡大し、グローバル展開を
積極的に推進しております。
2)ダイカスト製品
ダイカスト製品では、デジタルエンジニアリングを基軸とした製品設計、CAE解析(流動解析、凝固解析など)を用
いた最適金型方案設計、生産技術と製造の一気通貫でモノづくりを推進し、短納期で高品質、低コストな製品を提供
し顧客ニーズに応えております。
また、自動車の電動化に伴い、HV、BEV製品に取り組み、2020年からPCUインバーターケース、コンバーターケース
の量産を開始し、この1年で多くの製品が量産開始しました。現在も電動化製品への移行・拡大を推進しておりま
す。
3)ガスケット製品
20/126
EDINET提出書類
大豊工業株式会社(E02199)
有価証券報告書
エンジン用メタルヘッドガスケットについては、連結子会社の日本ガスケット(株)によるノウハウ、CAE解析を活
かした開発により、顧客と綿密な連携のもと、高機能化、低コスト化、短期間開発を推進しております。特にCAE解
析技術を活用したシール性能評価手法の高度化により、顧客のエンジン開発に貢献しております。
4)システム製品他
市場実績のある商用車向けの電子制御式EGRバルブをベースとし、多段ターボチャージャ用切換えバルブ、2020
年には排気後処理装置の温度制御に用いる排気スロットルバルブを量産化しました。これらの技術を深化させ、
Euro7に向けバルブ製品の市場拡大を行っています。
バキュームポンプは、高性能・信頼性に加え、複数のポンプサイズをシリーズ化する事で低コスト設計と部品共
通化による良品廉価なシステム提案、車両重量に合わせて最良なポンプサイズをご提案できることで幅広く採用さ
れ、現在は国内1拠点、海外2拠点(タイ、北米)でグローバルに対応しております。
ホイール用のバランスウェイトは、グローバルシェア約11%(世界3位)の生産量を誇ります。2022年から、車
体の振動低減にも採用されるようになりました。
エンジン用バランスシャフトギヤについては、2012年に樹脂化し、量産実績が10年以上となりました。
現在は、抄造製法の強みである長繊維でも高い分散性とランダムな配向性を活かした製品開発に発展させておりま
す。2022年6月には国産物流ドローン向けにリサイクル炭素繊維を用いた抄造CFRP製品を納入開始しました。リサ
イクル炭素繊維を用いた製品は、環境面での評価も高く、今後は自動車以外の分野におけるご要望にも対応して参
ります。
自動車製造用設備関連事業
当社連結子会社の大豊精機(株)において、自動車製造用設備についての試験研究および開発を進めております。
画像検査を用いた人の眼からAI画像検査移行への取り組みや工程の無人化、協働ロボットの導入、従来の素材より
高性能な素材の使用、鍛造工法の研究・開発に取り組んでおります。
当社グループの研究開発費の総額は、3,472百万円であり、自動車部品関連事業の研究開発費の金額は3,371百万
円、自動車製造用設備関連事業の研究開発費の金額は101百万円となっております。
21/126
EDINET提出書類
大豊工業株式会社(E02199)
有価証券報告書
第3【設備の状況】
1【設備投資等の概要】
当企業集団は、新製品立上げや生産能力増強、維持更新などを目的に、当連結会計年度は総額5,079百万円の設備
投資を実施いたしました。
セグメント別設備投資の内訳は、次のとおりであります。
自動車部品関連事業
自動車部品関連事業では、提出会社において、新製品立上げや生産能力増強を中心とした設備投資を実施いたしま
した。連結子会社において、主な国内子会社として日本ガスケット(株)による新製品立上げや生産能力増強目的の投
資を中心に実施いたしました。又、海外では、主な子会社として、大豊工業(煙台)有限公司による新製品立上げや維
持更新目的の投資を中心に実施いたしました。
上記の設備投資を含めた自動車部品関連事業セグメント全体の設備投資額は、総額4,744百万円であります。
自動車製造用設備関連事業
自動車製造用設備関連事業では、国内連結子会社の生産規模拡大を目的とした土地買収を中心に総額335百万円の
設備投資を実施いたしました。
なお、重要な設備の除却、売却等はありません。
2【主要な設備の状況】
当社グループにおける主要な設備は、以下のとおりであります。
類似の事業を営む事業所が多数設立されているため代表的な事業所名を示しそれらについてセグメントごとに主た
る設備の状況を開示しております。
(1)提出会社
2026年3月31日現在
帳簿価額(百万円)
事業所名
(所在地)
セグメントの
名称
設備の内容
本社及び本社工場
自動車部品
関連事業
自動車部品生
産設備
1,141
435
自動車部品
関連事業
自動車部品生
産設備及び研
究開発設備
945
1,441
自動車部品
関連事業
自動車製造用
設備関連事業
自動車部品生
産設備及び精
密金型製造設
備
200
304
自動車部品
(鹿児島県出水市) 関連事業
自動車部品生
産設備
297
515
幸海工場
自動車部品
関連事業
自動車部品生
産設備
274
939
岐阜工場
自動車部品
(岐阜県可児郡御嵩
関連事業
町)
自動車部品生
産設備
563
645
自動車部品生
産設備
32
1
(愛知県豊田市)
細谷工場
(愛知県豊田市)
篠原工場
(愛知県豊田市)
九州工場
(愛知県豊田市)
土岐工場
(岐阜県土岐市)
自動車部品
関連事業
建物
及び構築物
土地
機械装置
及び運搬具 (面積㎡)
22/126
564
(59,055)
92
(48,981)
899
(36,088)
353
(44,241)
2,550
(63,238)
2,269
(99,684)
311
(13,014)
リース資産
その他
合計
従業員数
(名)
4
251
2,395
395
25
222
2,725
652
16
86
1,505
134
18
1,183
159
6
26
3,795
207
8
124
3,609
304
5
349
27
EDINET提出書類
大豊工業株式会社(E02199)
有価証券報告書
(2)国内子会社
2026年3月31日現在
帳簿価額(百万円)
会社名
(所在地)
セグメントの
名称
大豊精機株式会社
自動車製造用
設備関連事業
(愛知県豊田市)
設備の内容
自動車部品
関連事業
株式会社
(愛知県豊田市)
自動車部品
関連事業
土地
機械装置
及び運搬具 (面積㎡)
自動車製造設
備組付装置、
金型製造設備
及び自動車部
1,409
440
160
470
1,023
757
3,908
(92,213)
リース資産
その他
合計
従業員数
(名)
4
297
6,061
361
45
676
107
205
2,755
282
品生産設備
自動車製造用
株式会社ティーイー
設備関連事業
ティー
自動車部品
(愛知県春日井市)
関連事業
日本ガスケット
建物
及び構築物
金型製造設備
及び自動車部
0
品生産設備
自動車部品生
産設備
769
(63,959)
(3)在外子会社
2026年3月31日現在
帳簿価額(百万円)
会社名
(所在地)
セグメントの
名称
設備の内容
タイホウ コーポレーション オ
ブ アメリカ
(アメリカ オハイオ州 ティ
自動車部品
自動車部品生
関連事業
産設備
自動車部品
関連事業
自動車部品生
産設備
自動車部品
自動車部品生
関連事業
産設備
自動車部品
関連事業
自動車部品生
産設備
大豊工業(煙台)有限公司
自動車部品
自動車部品生
(中国山東省
関連事業
産設備
自動車部品
関連事業
自動車部品
関連事業
建物
機械装置
及び構築物及び運搬具
590
403
152
369
207
226
376
42
1,114
2,536
自動車部品素
材生産設備
50
523
自動車部品生
産設備
324
75
土地
(面積㎡)
39
その他
合計
従業員数
(名)
11
1,044
212
2
524
98
10
518
111
8
709
93
792
4,443
492
70
643
88
38
735
82
(82,551)
フィン市)
タイホウ ヌサンタラ株式会社
(インドネシア カラワン県 カ
ラワン市)
タイホウ コーポレーション オ
ブ ヨーロッパ有限会社
(ハンガリー ペシュト県 ウィ
73
(49,998)
ハルチャン町)
韓国大豊株式会社
(韓国
大邱広域市)
煙台市)
常州恒業軸瓦材料有限公司
(中国江蘇省
常州市)
タイホウ コーポレーション
ブ タイランド株式会社
(タイ
プラチンブリ県)
(注)1
2
3
4
オ
281
(17,980)
295
(6,780)
帳簿価額には、建設仮勘定金額を含んでおりません。
国内子会社において、株式会社ティーイーティーは、提出会社より土地を賃借しており、土地勘定には記載
しておりません。取得価額及び面積は、1,066百万円(26,743㎡)であります。
在外子会社において、タイホウ ヌサンタラ株式会社、大豊工業(煙台)有限公司、常州恒業軸瓦材料有限
公司は、土地使用権取得のみに関するものであり、上記土地勘定には記載しておりません。同取得価額相当
は、それぞれタイホウ ヌサンタラ株式会社が115百万円(30,200㎡)、大豊工業(煙台)有限公司が745百
万円(126,611㎡)、常州恒業軸瓦材料有限公司が102百万円(24,531㎡)であります。
現在休止中の主要な設備はありません。
23/126
EDINET提出書類
大豊工業株式会社(E02199)
有価証券報告書
3【設備の新設、除却等の計画】
(1)重要な設備の新設等
当社グループの当連結会計年度後1年間の設備投資予定額は、10,262百万円であり、事業所別の主要な設備投資の内訳
は次のとおりであります。
投資予定額(百万円)
(自 2026年4月1日
至 2027年3月31日)
事業所名
(所在地)
セグメントの
名称
主要設備の内容
本社及び本社工場
自動車部品
関連事業
ダイカスト製品製造
設備等
1,280
自動車部品
関連事業
軸受製品製造設備等
2,598
自動車部品
関連事業
軸受製品製造設備等
自動車部品
関連事業
軸受製品製造設備等
自動車部品
関連事業
軸受製品製造設備等
会社名
(愛知県豊田市)
細谷工場
(愛知県豊田市)
篠原工場
(愛知県豊田市)
(鹿児島県出水市)
幸海工場
(愛知県豊田市)
岐阜工場
(岐阜県可児郡御嵩町)
自動車部品
関連事業
本社及び本社工場
自動車製造用
(愛知県豊田市)
設備関連事業
株式会社ティーイー
ティー
春日井工場
日本ガスケット株式
会社
滋賀工場
タイホウ コーポ
レーション オブ
本社及び本社工場
(アメリカ オハイオ州
アメリカ
ティフィン市)
大豊精機株式会社
タイホウ
ヌサンタ
ラ株式会社
タイホウ コーポ
レーション オブ
ヨーロッパ有限会社
大豊工業(煙台)有
限公司
常州恒業軸瓦材料有
限公司
タイホウ コーポ
レーション オブ
タイランド株式会社
(愛知県春日井市)
(滋賀県米原市)
本社及び本社工場
(インドネシア カラワン
県
カラワン市)
本社及び本社工場
(ハンガリー ぺシュト県
ウイハルチャン町)
本社及び本社工場
(中国
山東省
煙台市)
本社及び本社工場
(中国
江蘇省
常州市)
本社及び本社工場
(タイ プラチンブリ県)
新製品立上げ・能
力増強・更新・合理
化
新製品立上げ・能
力増強・更新・合理
化
1,297
新製品立上げ・能
力増強・更新・合理
化
提出会社
九州工場
目的
298
新製品立上げ・能
力増強・更新・合理
化
608
新製品立上げ・能
力増強・更新・合理
化
ダイカスト製品製造
設備等
1,086
軸受製品製造設備等
新製品立上げ・能
力増強・更新・合理
化
新製品立上げ・能
軸受製品製造設備等
642
自動車部品
関連事業
加工設備等
73
新製品立上げ・能
力増強・更新・合理
化
自動車部品
関連事業
軸受製品製造設備等
1,167
新製品立上げ・能
力増強・更新・合理
化
自動車部品
関連事業
軸受製品製造設備等
80
能力増強・
更新・合理化
軸受製品製造設備等
280
新製品立上げ・能
力増強・更新・合理
化
自動車部品
関連事業
軸受製品製造設備等
54
能力増強
自動車部品
関連事業
軸受製品製造設備等
504
新製品立上げ・能
力増強・更新・合理
化
自動車部品
関連事業
軸受製品製造設備等
19
基礎投資・IT
自動車部品
関連事業
軸受製品製造設備等
7
更新・合理化
自動車部品
関連事業
(注)上記設備計画の今後の所要資金は、自己資金を充当する予定であります。
(2)重要な設備の除却等
生産能力に重要な影響を及ぼすような設備の売却・除却等の計画はありません。
24/126
力増強・更新・合理
化
EDINET提出書類
大豊工業株式会社(E02199)
有価証券報告書
第4【提出会社の状況】
1【株式等の状況】
(1)【株式の総数等】
①【株式の総数】
種類
発行可能株式総数(株)
普通株式
48,400,000
計
48,400,000
②【発行済株式】
種類
事業年度末現在発行数
(株)
(2026年3月31日)
提出日現在発行数
(株)
(2026年6月22日)
(注)
普通株式
29,172,457
29,172,457
計
29,172,457
29,172,457
(注)
上場金融商品取引所名又は登録
認可金融商品取引業協会名
東京証券取引所
(スタンダード市場)
名古屋証券取引所
(プレミア市場)
−
内容
単元株式数は
100株でありま
す。
−
提出日現在の発行数には、2026年6月1日からこの有価証券報告書提出日までの新株予約権の行使により発行
された株式数は、含まれておりません。
25/126
EDINET提出書類
大豊工業株式会社(E02199)
有価証券報告書
(2)【新株予約権等の状況】
①【ストックオプション制度の内容】
会社法第236条、第238条及び第239条の規定に基づくストックオプションの内容等は次のとおりでありま
す。
株主総会の特別決議(2021年6月15日)
事業年度末現在
(2026年3月31日)
提出日の前月末現在
(2026年5月31日)
700(注)1
同左
普通株式
同左
新株予約権の目的となる株式の数(株)
70,000(注)2
同左
新株予約権の行使時の払込金額(円)
977(注)3
同左
新株予約権の行使期間
2023年8月1日〜
2026年7月31日
同左
新株予約権の行使により株式を発行する場
合の株式の発行価格及び資本組入額(円)
発行価格
資本組入額
同左
新株予約権の数(個)
新株予約権の目的となる株式の種類
977
489
①
新株予約権の行使の条件
対象取締役・執行役員の退任、
対象従業員の退職及び死亡の取扱
いは以下のとおりとする。
・当社の取締役、従業員の地位を
有さなくなった場合、当社子会社
の取締役、執行役員の地位を有さ
なくなった場合には、地位喪失日
又は権利行使期間の開始日のいず
れか遅い方から6ヶ月間に限り新
株予約権を行使することが出来
る。ただし、新株予約権割当契約
に定める条件により、行使可能な
新株予約権の数及び行使可能期間
等について制限がなされ、又は新
株予約権を当社に返還すべきこと
となることがある。
・死亡した場合は相続人は新株予
約権を行使することはできないも
のとする。
② その他、権利行使の条件は、本
総会及び新株予約権発行の取締役
会決議に基づき、当社と新株予約
権の割当を受けたものとの間で締
結する新株予約権割当契約に定め
るものとする。
同左
新株予約権の譲渡に関する事項
新株予約権を譲渡するときは、当社
取締役会の承認を要する。
同左
付与対象者の区分及び人数
当社取締役3名、当社執行役員14
名、当社子会社取締役、執行役員15
名、当社従業員9名
同左
(注)4
同左
組織再編成行為に伴う新株予約権の交付に
関する事項
(注)1
新株予約権1個につき目的となる株式数は、100株であります。
26/126
EDINET提出書類
大豊工業株式会社(E02199)
有価証券報告書
2
3
新株予約権を発行する日(以下「発行日」とする。)以降、当社普通株式の株式分割または株式併合を行う
場合には、次の算式により付与株式数を調整し、調整の結果生じる1株未満の株式は、これを切り捨てる。
新株予約権の目的たる株式総数は、調整後付与株式数に当該時点で行使及び消却されていない新株予約権の
総数を乗じた数とする。
調整後付与株式数=調整前付与株式数×株式分割または株式併合の比率
また、発行日以降、当社が資本の減少、合併または会社分割を行う場合等、付与株式数の調整を必要とする
やむを得ない事由が生じたときは、資本の減少、合併または会社分割の条件等を勘案の上、合理的な範囲で
付与株式数を調整し、新株予約権の目的たる株式の総数は、調整後株式数に当該時点で行使及び消却されて
いない新株予約権の総数を乗じた数とする。
また、付与株式数の調整を行うときは、当社は調整後付与株式数を適用する日の前日までに、必要な事項を
新株予約権原簿に記載された各新株予約権を保有する者(以下、「新株予約権者」という。)に公告または
通知する。ただし、当該適用の日の前日までに公告または通知を行うことができない場合には、以後速やか
に公告または通知するものとする。
行使価額は、発行日の属する月の前月の各日(取引が成立しない日を除く。)の東京証券取引所における当
社普通株式の普通取引の終値(以下「終値」という。)の平均値に1.025を乗じた金額(1円未満の端数は
切上げ)、または発行日の終値(当日に終値がない場合は、それに先立つ直近日の終値)のいずれか高い金
額とする。
なお、発行日以降、以下の事由が生じた場合には、次の算式により行使価額を調整し、調整の結果生じる1
円未満の端数は、これを切り上げる。
① 当社普通株式の分割または株式併合を行う場合
1
調整後行使価額=調整前行使価額×
株式分割または株式併合の比率
② 時価を下回る価額で当社普通株式につき、新株式の発行または自己株式の処分を行う場合(会社法第
194条の規定(単元未満株主による単元未満株式売渡請求)に基づく自己株式の売渡し、当社普通株式
に転換される証券もしくは転換できる証券の転換、または当社普通株式の交付を請求できる新株予約権
(新株予約権付社債に付されたものを含む。)の行使による場合を除く。)には、行使価額を次の算式
により調整し、調整の結果生じる1円未満の端数は、これを切り上げるものとする。
既発行株式数+
調整後行使価額=調整前行使価額×
4
新規発行株式数×1株当たり払込金額
時価
既発行株式数+新規発行株式数
なお、上記算式において、「既発行株式数」とは当社の発行済株式総数から当社の保有する自己株式の
総数を控除した数とし、また、自己株式を処分する場合には、「新規発行株式数」を「処分する自己株
式数」に読み替えるものとする。
③ 当社が資本の減少、合併または会社分割を行う場合等、行使価額の調整を必要とするやむを得ない事由
が生じたときは、資本の減少、合併または会社分割の条件等を勘案の上、合理的な範囲で行使価額を調
整するものとする。
当社が、合併(当社が合併により消滅する場合に限る。)、吸収分割、新設分割、株式交換または株式移転
(以上を総称して以下、「組織再編行為」という。)をする場合において、組織再編行為の効力発生の時点
において残存する新株予約権(以下、「残存新株予約権」という。)の新株予約権者に対し、それぞれの場
合につき、会社法第236条第1項第8号のイからホまでに掲げる株式会社(以下、「再編対象会社」とい
う。)の新株予約権を以下の条件に基づきそれぞれ交付することとする。この場合においては、残存新株予
約権は消滅し、再編対象会社は新株予約権を新たに発行するものとする。ただし、以下の条件に沿って再編
対象会社の新株予約権を交付する旨を、吸収合併契約、新設合併契約、吸収分割契約、新設分割計画、株式
交換契約または株式移転計画において定めた場合に限るものとする。
(1)交付する再編対象会社の新株予約権の数
残存新株予約権の新株予約権者が保有する新株予約権の数と同一の数をそれぞれ交付するものとする。
(2)新株予約権の目的である再編対象会社の株式の種類
再編対象会社の普通株式とする。
(3)新株予約権の目的である再編対象会社の株式の数
組織再編行為の条件等を勘案の上、上記2に準じて決定する。
(4)新株予約権の行使に際して出資される財産の価額
交付される各新株予約権の行使に際して出資される財産の価額は、上記3に定められる行使価額を組織
再編の条件等を勘案の上調整して得られる再編後払込金額に、上記(3)に従って決定される当該新株予
約権の目的である再編対象会社の株式の数を乗じて得られる金額とする。
27/126
EDINET提出書類
大豊工業株式会社(E02199)
有価証券報告書
(5)新株予約権の行使可能期間
上記「新株予約権の行使期間」に定める行使することができる期間の開始日と組織再編行為の効力発生
日のうちいずれか遅い日から、行使することができる期間の満了日までとする。
(6)新株予約権の行使により株式を発行する場合における増加する資本金及び資本準備金に関する事項
増加する資本金の額は、会社計算規則第17条第1項に従い算出される資本金等増加限度額の2分の1の
金額とし、計算の結果生じる1円未満の端数は、これを切り上げるものとする。増加する資本準備金の
額は、上記の資本金等増加限度額から上記に定める増加する資本金の額を減じた額とする。
(7)譲渡による新株予約権の取得の制限
譲渡による新株予約権の取得については、再編対象会社の取締役会の承認を要するものとする。
(8)新株予約権の取得条項
以下の①、②、③、④及び⑤の議案につき当社株主総会で承認された場合(株主総会決議が不要の場合
は、当社の取締役会決議又は代表執行役の決定がなされた場合)は、取締役会が別途定める日に、当社
は無償で新株予約権を取得することができる。
① 当社が消滅会社となる合併契約承認の議案
② 当社が分割会社となる分割契約若しくは分割計画承認の議案
③ 当社が完全子会社となる株式交換契約若しくは株式移転計画承認の議案
④ 当社の発行する全部の株式の内容として譲渡による当該株式の取得について当社の承認を要するこ
とについての定めを設ける定款の変更承認の議案
⑤ 新株予約権の目的である株式の内容として譲渡による当該株式の取得について当社の承認を要する
こと若しくは当該種類の株式について当社が株主総会の決議によってその全部を取得することにつ
いての定めを設ける定款の変更承認の議案
28/126
EDINET提出書類
大豊工業株式会社(E02199)
有価証券報告書
株主総会の特別決議(2022年6月17日)
事業年度末現在
(2026年3月31日)
提出日の前月末現在
(2026年5月31日)
240(注)1
同左
普通株式
同左
新株予約権の目的となる株式の数(株)
24,000(注)2
同左
新株予約権の行使時の払込金額(円)
718(注)3
同左
新株予約権の行使期間
2024年8月1日〜
2027年7月31日
同左
新株予約権の行使により株式を発行する場
合の株式の発行価格及び資本組入額(円)
発行価格
資本組入額
同左
新株予約権の数(個)
新株予約権の目的となる株式の種類
718
359
①
新株予約権の行使の条件
対象取締役・執行役員の退任、
対象従業員の退職及び死亡の取扱
いは以下のとおりとする。
・当社の取締役、従業員の地位を
有さなくなった場合、当社子会社
の取締役、執行役員の地位を有さ
なくなった場合には、地位喪失日
又は権利行使期間の開始日のいず
れか遅い方から6ヶ月間に限り新
株予約権を行使することが出来
る。ただし、新株予約権割当契約
に定める条件により、行使可能な
新株予約権の数及び行使可能期間
等について制限がなされ、又は新
株予約権を当社に返還すべきこと
となることがある。
・死亡した場合は相続人は新株予
約権を行使することはできないも
のとする。
② その他、権利行使の条件は、本
総会及び新株予約権発行の取締役
会決議に基づき、当社と新株予約
権の割当を受けたものとの間で締
結する新株予約権割当契約に定め
るものとする。
同左
新株予約権の譲渡に関する事項
新株予約権を譲渡するときは、当社
取締役会の承認を要する。
同左
付与対象者の区分及び人数
当社取締役3名、当社執行役員14
名、当社子会社取締役、執行役員14
名、当社従業員6名
同左
(注)4
同左
組織再編成行為に伴う新株予約権の交付に
関する事項
(注)1
新株予約権1個につき目的となる株式数は、100株であります。
29/126
EDINET提出書類
大豊工業株式会社(E02199)
有価証券報告書
2
3
新株予約権を発行する日(以下「発行日」とする。)以降、当社普通株式の株式分割または株式併合を行う
場合には、次の算式により付与株式数を調整し、調整の結果生じる1株未満の株式は、これを切り捨てる。
新株予約権の目的たる株式総数は、調整後付与株式数に当該時点で行使及び消却されていない新株予約権の
総数を乗じた数とする。
調整後付与株式数=調整前付与株式数×株式分割または株式併合の比率
また、発行日以降、当社が資本の減少、合併または会社分割を行う場合等、付与株式数の調整を必要とする
やむを得ない事由が生じたときは、資本の減少、合併または会社分割の条件等を勘案の上、合理的な範囲で
付与株式数を調整し、新株予約権の目的たる株式の総数は、調整後株式数に当該時点で行使及び消却されて
いない新株予約権の総数を乗じた数とする。
また、付与株式数の調整を行うときは、当社は調整後付与株式数を適用する日の前日までに、必要な事項を
新株予約権原簿に記載された各新株予約権を保有する者(以下、「新株予約権者」という。)に公告または
通知する。ただし、当該適用の日の前日までに公告または通知を行うことができない場合には、以後速やか
に公告または通知するものとする。
行使価額は、発行日の属する月の前月の各日(取引が成立しない日を除く。)の東京証券取引所における当
社普通株式の普通取引の終値(以下「終値」という。)の平均値に1.025を乗じた金額(1円未満の端数は
切上げ)、または発行日の終値(当日に終値がない場合は、それに先立つ直近日の終値)のいずれか高い金
額とする。
なお、発行日以降、以下の事由が生じた場合には、次の算式により行使価額を調整し、調整の結果生じる1
円未満の端数は、これを切り上げる。
① 当社普通株式の分割または株式併合を行う場合
1
調整後行使価額=調整前行使価額×
株式分割または株式併合の比率
② 時価を下回る価額で当社普通株式につき、新株式の発行または自己株式の処分を行う場合(会社法第
194条の規定(単元未満株主による単元未満株式売渡請求)に基づく自己株式の売渡し、当社普通株式
に転換される証券もしくは転換できる証券の転換、または当社普通株式の交付を請求できる新株予約権
(新株予約権付社債に付されたものを含む。)の行使による場合を除く。)には、行使価額を次の算式
により調整し、調整の結果生じる1円未満の端数は、これを切り上げるものとする。
既発行株式数+
調整後行使価額=調整前行使価額×
4
新規発行株式数×1株当たり払込金額
時価
既発行株式数+新規発行株式数
なお、上記算式において、「既発行株式数」とは当社の発行済株式総数から当社の保有する自己株式の
総数を控除した数とし、また、自己株式を処分する場合には、「新規発行株式数」を「処分する自己株
式数」に読み替えるものとする。
③ 当社が資本の減少、合併または会社分割を行う場合等、行使価額の調整を必要とするやむを得ない事由
が生じたときは、資本の減少、合併または会社分割の条件等を勘案の上、合理的な範囲で行使価額を調
整するものとする。
当社が、合併(当社が合併により消滅する場合に限る。)、吸収分割、新設分割、株式交換または株式移転
(以上を総称して以下、「組織再編行為」という。)をする場合において、組織再編行為の効力発生の時点
において残存する新株予約権(以下、「残存新株予約権」という。)の新株予約権者に対し、それぞれの場
合につき、会社法第236条第1項第8号のイからホまでに掲げる株式会社(以下、「再編対象会社」とい
う。)の新株予約権を以下の条件に基づきそれぞれ交付することとする。この場合においては、残存新株予
約権は消滅し、再編対象会社は新株予約権を新たに発行するものとする。ただし、以下の条件に沿って再編
対象会社の新株予約権を交付する旨を、吸収合併契約、新設合併契約、吸収分割契約、新設分割計画、株式
交換契約または株式移転計画において定めた場合に限るものとする。
(1)交付する再編対象会社の新株予約権の数
残存新株予約権の新株予約権者が保有する新株予約権の数と同一の数をそれぞれ交付するものとする。
(2)新株予約権の目的である再編対象会社の株式の種類
再編対象会社の普通株式とする。
(3)新株予約権の目的である再編対象会社の株式の数
組織再編行為の条件等を勘案の上、上記2に準じて決定する。
(4)新株予約権の行使に際して出資される財産の価額
交付される各新株予約権の行使に際して出資される財産の価額は、上記3に定められる行使価額を組織
再編の条件等を勘案の上調整して得られる再編後払込金額に、上記(3)に従って決定される当該新株予
約権の目的である再編対象会社の株式の数を乗じて得られる金額とする。
30/126
EDINET提出書類
大豊工業株式会社(E02199)
有価証券報告書
(5)新株予約権の行使可能期間
上記「新株予約権の行使期間」に定める行使することができる期間の開始日と組織再編行為の効力発生
日のうちいずれか遅い日から、行使することができる期間の満了日までとする。
(6)新株予約権の行使により株式を発行する場合における増加する資本金及び資本準備金に関する事項
増加する資本金の額は、会社計算規則第17条第1項に従い算出される資本金等増加限度額の2分の1の
金額とし、計算の結果生じる1円未満の端数は、これを切り上げるものとする。増加する資本準備金の
額は、上記の資本金等増加限度額から上記に定める増加する資本金の額を減じた額とする。
(7)譲渡による新株予約権の取得の制限
譲渡による新株予約権の取得については、再編対象会社の取締役会の承認を要するものとする。
(8)新株予約権の取得条項
以下の①、②、③、④及び⑤の議案につき当社株主総会で承認された場合(株主総会決議が不要の場合
は、当社の取締役会決議又は代表執行役の決定がなされた場合)は、取締役会が別途定める日に、当社
は無償で新株予約権を取得することができる。
① 当社が消滅会社となる合併契約承認の議案
② 当社が分割会社となる分割契約若しくは分割計画承認の議案
③ 当社が完全子会社となる株式交換契約若しくは株式移転計画承認の議案
④ 当社の発行する全部の株式の内容として譲渡による当該株式の取得について当社の承認を要するこ
とについての定めを設ける定款の変更承認の議案
⑤ 新株予約権の目的である株式の内容として譲渡による当該株式の取得について当社の承認を要する
こと若しくは当該種類の株式について当社が株主総会の決議によってその全部を取得することにつ
いての定めを設ける定款の変更承認の議案
31/126
EDINET提出書類
大豊工業株式会社(E02199)
有価証券報告書
株主総会の特別決議(2023年6月16日)
事業年度末現在
(2026年3月31日)
提出日の前月末現在
(2026年5月31日)
1,560(注)1
同左
普通株式
同左
新株予約権の目的となる株式の数(株)
156,000(注)2
同左
新株予約権の行使時の払込金額(円)
915(注)3
同左
新株予約権の行使期間
2025年8月1日〜
2028年7月31日
同左
新株予約権の行使により株式を発行する場
合の株式の発行価格及び資本組入額(円)
発行価格
資本組入額
同左
新株予約権の数(個)
新株予約権の目的となる株式の種類
915
458
①
新株予約権の行使の条件
対象取締役・執行役員の退任、
対象従業員の退職及び死亡の取扱
いは以下のとおりとする。
・当社の取締役、従業員の地位を
有さなくなった場合、当社子会社
の取締役、執行役員の地位を有さ
なくなった場合には、地位喪失日
又は権利行使期間の開始日のいず
れか遅い方から6ヶ月間に限り新
株予約権を行使することが出来
る。ただし、新株予約権割当契約
に定める条件により、行使可能な
新株予約権の数及び行使可能期間
等について制限がなされ、又は新
株予約権を当社に返還すべきこと
となることがある。
・死亡した場合は相続人は新株予
約権を行使することはできないも
のとする。
② その他、権利行使の条件は、本
総会及び新株予約権発行の取締役
会決議に基づき、当社と新株予約
権の割当を受けたものとの間で締
結する新株予約権割当契約に定め
るものとする。
同左
新株予約権の譲渡に関する事項
新株予約権を譲渡するときは、当社
取締役会の承認を要する。
同左
付与対象者の区分及び人数
当社取締役3名、当社執行役員12
名、当社子会社取締役、執行役員15
名、当社従業員5名
同左
(注)4
同左
組織再編成行為に伴う新株予約権の交付に
関する事項
(注)1
新株予約権1個につき目的となる株式数は、100株であります。
32/126
EDINET提出書類
大豊工業株式会社(E02199)
有価証券報告書
2
3
新株予約権を発行する日(以下「発行日」とする。)以降、当社普通株式の株式分割または株式併合を行う
場合には、次の算式により付与株式数を調整し、調整の結果生じる1株未満の株式は、これを切り捨てる。
新株予約権の目的たる株式総数は、調整後付与株式数に当該時点で行使及び消却されていない新株予約権の
総数を乗じた数とする。
調整後付与株式数=調整前付与株式数×株式分割または株式併合の比率
また、発行日以降、当社が資本の減少、合併または会社分割を行う場合等、付与株式数の調整を必要とする
やむを得ない事由が生じたときは、資本の減少、合併または会社分割の条件等を勘案の上、合理的な範囲で
付与株式数を調整し、新株予約権の目的たる株式の総数は、調整後株式数に当該時点で行使及び消却されて
いない新株予約権の総数を乗じた数とする。
また、付与株式数の調整を行うときは、当社は調整後付与株式数を適用する日の前日までに、必要な事項を
新株予約権原簿に記載された各新株予約権を保有する者(以下、「新株予約権者」という。)に公告または
通知する。ただし、当該適用の日の前日までに公告または通知を行うことができない場合には、以後速やか
に公告または通知するものとする。
行使価額は、発行日の属する月の前月の各日(取引が成立しない日を除く。)の東京証券取引所における当
社普通株式の普通取引の終値(以下「終値」という。)の平均値に1.025を乗じた金額(1円未満の端数は
切上げ)、または発行日の終値(当日に終値がない場合は、それに先立つ直近日の終値)のいずれか高い金
額とする。
なお、発行日以降、以下の事由が生じた場合には、次の算式により行使価額を調整し、調整の結果生じる1
円未満の端数は、これを切り上げる。
① 当社普通株式の分割または株式併合を行う場合
1
調整後行使価額=調整前行使価額×
株式分割または株式併合の比率
② 時価を下回る価額で当社普通株式につき、新株式の発行または自己株式の処分を行う場合(会社法第
194条の規定(単元未満株主による単元未満株式売渡請求)に基づく自己株式の売渡し、当社普通株式
に転換される証券もしくは転換できる証券の転換、または当社普通株式の交付を請求できる新株予約権
(新株予約権付社債に付されたものを含む。)の行使による場合を除く。)には、行使価額を次の算式
により調整し、調整の結果生じる1円未満の端数は、これを切り上げるものとする。
既発行株式数+
調整後行使価額=調整前行使価額×
4
新規発行株式数×1株当たり払込金額
時価
既発行株式数+新規発行株式数
なお、上記算式において、「既発行株式数」とは当社の発行済株式総数から当社の保有する自己株式の
総数を控除した数とし、また、自己株式を処分する場合には、「新規発行株式数」を「処分する自己株
式数」に読み替えるものとする。
③ 当社が資本の減少、合併または会社分割を行う場合等、行使価額の調整を必要とするやむを得ない事由
が生じたときは、資本の減少、合併または会社分割の条件等を勘案の上、合理的な範囲で行使価額を調
整するものとする。
当社が、合併(当社が合併により消滅する場合に限る。)、吸収分割、新設分割、株式交換または株式移転
(以上を総称して以下、「組織再編行為」という。)をする場合において、組織再編行為の効力発生の時点
において残存する新株予約権(以下、「残存新株予約権」という。)の新株予約権者に対し、それぞれの場
合につき、会社法第236条第1項第8号のイからホまでに掲げる株式会社(以下、「再編対象会社」とい
う。)の新株予約権を以下の条件に基づきそれぞれ交付することとする。この場合においては、残存新株予
約権は消滅し、再編対象会社は新株予約権を新たに発行するものとする。ただし、以下の条件に沿って再編
対象会社の新株予約権を交付する旨を、吸収合併契約、新設合併契約、吸収分割契約、新設分割計画、株式
交換契約または株式移転計画において定めた場合に限るものとする。
(1)交付する再編対象会社の新株予約権の数
残存新株予約権の新株予約権者が保有する新株予約権の数と同一の数をそれぞれ交付するものとする。
(2)新株予約権の目的である再編対象会社の株式の種類
再編対象会社の普通株式とする。
(3)新株予約権の目的である再編対象会社の株式の数
組織再編行為の条件等を勘案の上、上記2に準じて決定する。
(4)新株予約権の行使に際して出資される財産の価額
交付される各新株予約権の行使に際して出資される財産の価額は、上記3に定められる行使価額を組織
再編の条件等を勘案の上調整して得られる再編後払込金額に、上記(3)に従って決定される当該新株予
約権の目的である再編対象会社の株式の数を乗じて得られる金額とする。
33/126
EDINET提出書類
大豊工業株式会社(E02199)
有価証券報告書
(5)新株予約権の行使可能期間
上記「新株予約権の行使期間」に定める行使することができる期間の開始日と組織再編行為の効力発生
日のうちいずれか遅い日から、行使することができる期間の満了日までとする。
(6)新株予約権の行使により株式を発行する場合における増加する資本金及び資本準備金に関する事項
増加する資本金の額は、会社計算規則第17条第1項に従い算出される資本金等増加限度額の2分の1の
金額とし、計算の結果生じる1円未満の端数は、これを切り上げるものとする。増加する資本準備金の
額は、上記の資本金等増加限度額から上記に定める増加する資本金の額を減じた額とする。
(7)譲渡による新株予約権の取得の制限
譲渡による新株予約権の取得については、再編対象会社の取締役会の承認を要するものとする。
(8)新株予約権の取得条項
以下の①、②、③、④及び⑤の議案につき当社株主総会で承認された場合(株主総会決議が不要の場合
は、当社の取締役会決議又は代表執行役の決定がなされた場合)は、取締役会が別途定める日に、当社
は無償で新株予約権を取得することができる。
① 当社が消滅会社となる合併契約承認の議案
② 当社が分割会社となる分割契約若しくは分割計画承認の議案
③ 当社が完全子会社となる株式交換契約若しくは株式移転計画承認の議案
④ 当社の発行する全部の株式の内容として譲渡による当該株式の取得について当社の承認を要するこ
とについての定めを設ける定款の変更承認の議案
⑤ 新株予約権の目的である株式の内容として譲渡による当該株式の取得について当社の承認を要する
こと若しくは当該種類の株式について当社が株主総会の決議によってその全部を取得することにつ
いての定めを設ける定款の変更承認の議案
②【ライツプランの内容】
該当事項はありません。
③【その他の新株予約権等の状況】
該当事項はありません。
(3)【行使価額修正条項付新株予約権付社債券等の行使状況等】
該当事項はありません。
(4)【発行済株式総数、資本金等の推移】
年月日
2018年4月1日〜
2019年3月31日
(注)
(注)
発行済株式
総数増減数
(株)
発行済株式
総数残高
(株)
資本金増減額
資本金残高
(百万円)
51,000
29,172,457
33
新株予約権の行使による増加であります。
34/126
(百万円)
資本準備金
増減額
(百万円)
資本準備金
残高
(百万円)
6,712
33
10,342
EDINET提出書類
大豊工業株式会社(E02199)
有価証券報告書
(5)【所有者別状況】
2026年3月31日現在
株式の状況(1単元の株式数100株)
区分
政府及び
地方公共
団体
金融機関
株主数(人)
所有株式数
(単元)
所有株式数の割
合(%)
(注)
外国法人等
金融商品
取引業者
その他の
法人
17
26
97
76
10
4,694
4,920
−
58,651
3,161
135,712
17,863
34
76,092
291,513
21,157
20.11
1.08
46.55
6.13
0.01
26.11
100
−
個人以外
個人
その他
単元未満
株式の状況
(株)
個人
計
自己株式783,200株は、「個人その他」に7,832単元含まれております。
(6)【大株主の状況】
2026年3月31日現在
氏名又は名称
所有株式数
(千株)
住所
トヨタ自動車株式会社
愛知県豊田市トヨタ町1番地
日本マスタートラスト信託銀行株式会
東京都港区赤坂1丁目8番1号
社(信託口)
発行済株式(自
己株式を除
く。)の総数に
対する所有株式
数の割合(%)
9,676
34.09
4,631
16.31
株式会社豊田自動織機
愛知県刈谷市豊田町2丁目1
1,427
5.03
日本発条株式会社
神奈川県横浜市金沢区福浦3丁目10
1,344
4.74
大豊工業従業員持株会
愛知県豊田市緑ケ丘三丁目65番地
794
2.80
大豊工業取引先持株会
愛知県豊田市緑ケ丘三丁目65番地
431
1.52
株式会社日本カストディ銀行(信託
口)
東京都中央区晴海1丁目8−12
363
1.28
351
1.24
STATE STREET BAN
K AND TRUST COMPA
東京都港区港南2丁目15-1
NY 505044
ターシティA棟
(常任代理人株式会社みずほ銀行決
済営業部)
品川イン
豊田信用金庫
愛知県豊田市元城町1丁目48番地
294
1.04
橋本律子
京都府京都市下京区
282
0.99
19,596
69.03
計
−
(注)1.上記の所有株式数のうち、信託業務に係る株式数は次のとおりであります。
日本マスタートラスト信託銀行株式会社(信託口)
株式会社日本カストディ銀行(信託口)
4,631千株
363千株
2.2026年3月23日付で公衆の縦覧に供されている大量保有報告書(変更報告書)において、fundnote株式会社
が2026年3月13日現在で以下の株式を所有している旨が記載されているものの、当社として2026年3月31日
現在における実質所有株式数の確認ができないため、上記大株主の状況には含めておりません。なお、その
大量報告書(変更報告書)の内容は次のとおりであります。
氏名又は名称
fundnote株式会社
住所
東京都港区芝5-29-20クロスオフィス三田
35/126
保有株式等の数
(千株)
株券等保有割合
(%)
2,531
8.68
EDINET提出書類
大豊工業株式会社(E02199)
有価証券報告書
(7)【議決権の状況】
①【発行済株式】
2026年3月31日現在
区分
株式数(株)
議決権の数(個)
内容
無議決権株式
−
−
−
議決権制限株式(自己株式等)
−
−
−
議決権制限株式(その他)
−
−
−
完全議決権株式(自己株式等)
(自己保有株式)
783,200
普通株式
−
−
完全議決権株式(その他)
普通株式
28,368,100
単元未満株式
普通株式
21,157
−
−
発行済株式総数
29,172,457
−
−
総株主の議決権
−
283,681
−
283,681
−
②【自己株式等】
2026年3月31日現在
所有者の氏名
又は名称
所有者の住所
自己名義
所有株式数
(株)
他人名義
所有株式数
(株)
所有株式数
の合計
(株)
発行済株式
総数に対する
所有株式数
の割合(%)
(自己保有株式)
大豊工業株式会社
愛知県豊田市緑ケ丘三丁目
65番地
783,200
783,200
2.68
計
−
783,200
783,200
2.68
36/126
EDINET提出書類
大豊工業株式会社(E02199)
有価証券報告書
2【自己株式の取得等の状況】
【株式の種類等】会社法第155条第7号に該当する普通株式の取得
(1)【株主総会決議による取得の状況】
該当事項はありません。
(2)【取締役会決議による取得の状況】
該当事項はありません。
(3)【株主総会決議又は取締役会決議に基づかないものの内容】
区分
株式数(株)
価額の総額(円)
当事業年度における取得自己株式
10
6,660
当期間における取得自己株式
(注)
当期間における取得自己株式には、2026年6月1日からこの有価証券報告書提出日までの単元未満株式の買取
りによる株式は含まれておりません。
(4)【取得自己株式の処理状況及び保有状況】
当事業年度
区分
当期間
処分価額の総額
(円)
株式数(株)
処分価額の総額
(円)
株式数(株)
引き受ける者の募集を行った取得自己
株式
消却の処分を行った取得自己株式
合併、株式交換、株式交付、会社分割
に係る移転を行った取得自己株式
その他(ストックオプションの権利行
使により処分した取得自己株式)
79,000
55,576,500
保有自己株式数
783,200
−
783,200
−
(注)
当期間における取得自己株式には、2026年6月1日から有価証券報告書提出日までの取得自己株式は含まれて
おりません。
37/126
EDINET提出書類
大豊工業株式会社(E02199)
有価証券報告書
3【配当政策】
当社は、株主への利益還元と事業の成長及び経営基盤の強化のための内部留保を総合的に勘案し、長期にわたり安
定的な配当の継続を基本に考えております。
当社は、中間配当と期末配当の年2回の剰余金の配当を行うことを基本方針としております。
また、「会社法第459条第1項の規定に基づき、取締役会の決議をもって剰余金の配当等を行うことができる。」
旨を定款に定めております。
当事業年度の配当につきましては、継続的な安定配当の基本方針のもと、1株当たり18円の配当とし、中間配当
(10円)と合わせて28円としております。
内部留保した資金は、将来にわたる株主利益を確保するため、将来の事業成長のための投資及び財務体質の強化に
活用してまいります。
当社は、「取締役会の決議により、毎年9月30日を基準日として、中間配当を行うことができる。」旨を定款に定
めております。
なお、当事業年度に係る剰余金の配当は、以下のとおりであります。
決議年月日
配当金の総額(百万円)
1株当たり配当額(円)
2025年10月30日
取締役会決議
283
10
2026年4月27日
取締役会決議
511
18
38/126
EDINET提出書類
大豊工業株式会社(E02199)
有価証券報告書
4【コーポレート・ガバナンスの状況等】
(1)【コーポレート・ガバナンスの概要】
① コーポレート・ガバナンスに関する基本的な考え方
当社のコーポレート・ガバナンスに関する基本的な考え方は、企業は、株主から資本を託され、事業活動を通
じて利益をあげ、継続的に株主価値を増大させることです。この株主の負託に応えることが企業経営の基本的使
命であり、この基本的な使命を踏まえた上で、企業は、従業員、顧客を含む取引先、債権者、地域社会等のス
テークホルダーに対するそれぞれの責任を果たしていかなければなりません。これらを踏まえて事業活動を行う
ためには、コーポレート・ガバナンスの確立が不可欠です。このコーポレート・ガバナンスを「株主に代わっ
て、経営の効率性や適法性等をチェックする仕組み」であると捉え、コーポレート・ガバナンスの充実に取り組
んでおります。
②
企業統治の体制の概要及び当該体制を採用する理由
会社の機関として、株主総会、取締役会、監査役会、会計監査人などの法律上の機能に加え、取締役会の下
位機関として、常勤役員会を設置するとともに、コーポレート・ガバナンスを補完する仕組みとして、コンプ
ライアンス委員会を設置し、コンプライアンスを統括しております。また、不祥事の早期発見のために、内部
通報制度を設けております。
これらの体制により、当社のコーポレート・ガバナンスは十分に機能していると判断しております。
(イ)取締役会
取締役会は、原則として毎月1回開催し、法令で定められた事項のほか、経営に関わる重要事項の意思決定
をする権限があります。また、取締役の業務執行の監督機関としても位置付けております。取締役会は、代表
取締役社長の新美俊生を議長とし、取締役5名(うち社外取締役2名)で構成されております。また、監査役
4名(うち社外監査役2名)が出席し、取締役の業務執行を監査する体制となっております。
2026年6月23日開催予定の定時株主総会の議案として、「取締役6名選任の件」を提案しており、当該議案
が可決された場合、取締役6名(うち2名が社外取締役)となる予定です。なお、構成員の氏名は「(2)役員
の状況 ① 役員一覧」に記載しております。
(ロ)監査役会
当社は、監査役会制度を採用しております。監査方針、監査計画を定めて、監査役会を定期的に開催し、監
査に関する重要事項について報告を受けて、協議を行っております。監査役会は、常勤監査役の舩越七洋を議
長とし、監査役4名(うち2名が社外監査役)で構成されております。監査役には、取締役の業務執行を監査
するために、取締役会等の重要会議への出席権限があり、必要に応じて意見陳述できるほか、稟議案件の監査
等、経営管理体制のチェックができる仕組みになっております。
2026年6月23日開催予定の定時株主総会の議案として、「監査役2名選任の件」を提案しており、当該議案
が可決された場合は監査役5名(うち3名が社外監査役)となる予定です。なお、構成員の氏名は「(2)役員
の状況 ① 役員一覧」に記載しております。
(ハ)会計監査人
当社は、太陽有限責任監査法人と監査契約を締結し、会社法監査及び金融商品取引法監査を受けておりま
す。
(ニ)常勤役員会
常勤役員会は、取締役会の下位機関として、業務執行に関する報告について審議し、決定する権限がありま
す。経営上重要な事項については、十分な審議を行ったうえで取締役会に上程することにしております。代表
取締役社長の新美俊生を議長とし、取締役、執行役員、常勤監査役により構成されております。なお、常勤監
査役は、審議内容の監査の目的で参加しております。
(ホ)役員人事報酬委員会
当社は、取締役の指名・報酬等に関する手続きの公正性・透明性・客観性を強化し、コーポレート・ガバナ
ンス体制の一層の充実を図ることを目的として、取締役会の諮問機関として、役員人事報酬委員会を設置して
おります。役員人事報酬委員会は、代表取締役社長の新美俊生を委員長とし、取締役3名(うち社外取締役2
名)により構成されております。なお、構成員の氏名は「(1)コーポレート・ガバナンスの概要 ⑨ 取締役
会の活動状況」に記載しております。
(ヘ)コンプライアンス委員会
当社は、コンプライアンスの向上を図ることを目的として、コンプライアンス委員会を設置しております。
コンプライアンス委員会は、企業倫理と法令等を遵守する体制の確立を指示する権限があり、コンプライアン
ス情報の提供や会社としての対応確認を行っております。コンプライアンス委員会は、代表取締役社長の新美
俊生を委員長とし、取締役(社外取締役を含む)、常勤監査役、本部長及び顧問弁護士により構成されており
ます。常勤監査役は、審議内容の監査の目的で参加しております。
39/126
EDINET提出書類
大豊工業株式会社(E02199)
有価証券報告書
(ト)サステナビリティ委員会
当社は、社会・環境問題をはじめとする持続的な社会の実現のために解決すべき重要な課題を特定し、事業
を通じた当該課題への取り組みをより一層推進することを目的として、サステナビリティ委員会を設置してお
ります。サステナビリティ委員会は、代表取締役社長の新美俊生を委員長とし、取締役(社外取締役を含む)
により構成されております。
当社のコーポレート・ガバナンス体制は、下記のとおりであります。
③ 企業統治に関するその他の事項
(イ)会社の機関の内容および内部統制システム整備の状況
当社は、会社法および会社法施行規則に基づき、「取締役の職務の執行が法令および定款に適合することを
確保するための体制その他株式会社の業務の適正を確保するために必要なものとして法務省令で定める体制」
を整備しております。
当社が「業務の適正を確保するための体制」として取締役会において決議した事項は、次のとおりでありま
す。
1)取締役の職務の執行が法令及び定款に適合することを確保するための体制
①「経営理念」「大豊社員の行動指針」等に基づき、取締役が法令及び社会規範を遵守した行動をするよう
徹底します。
②取締役の職務執行が全体として適正かつ健全に行われるために、取締役会・常勤役員会・経営会議等の会
議体による意思決定および相互牽制を図ります。
③コンプライアンスを統括する組織として、社長を委員長とし、取締役、常勤監査役、本部長および顧問弁
護士をメンバーとするコンプライアンス委員会を設置します。
④主な法令の啓発を目的として「役員ハンドブック」を配付します。
⑤財務報告の信頼性を確保するための内部統制システムを構築し、整備運用を図ります。
40/126
EDINET提出書類
大豊工業株式会社(E02199)
有価証券報告書
2)取締役の職務の執行に係る情報の保存及び管理に関する体制
①取締役会議事録・稟議決裁書等を文書管理規程等の社内規程に従って適切に保存し、管理します。
②取締役および監査役の要求があるときは、これを閲覧に供します。
③情報セキュリティ委員会を定期的に開催するとともに、情報セキュリティに関するルールを定め、役員・
理事および全社員に周知し、機密管理に努めます。
3)損失の危険の管理に関する規程その他の体制
①内部監査部門を設置し、毎年定期的に内部監査を実施します。
②予算制度・稟議制度により、資金の流れを管理することで、リスク管理をします。
③災害(地震・火災等)発生に備えて、建物および設備等の予防保全を行うとともに、BCMマニュアル及び
体制を整備し、関係者を定期的に教育・訓練します。
④安全、品質、環境、情報管理、コンプライアンス等に係るリスクについては、各担当部署がリスク管理体
制を整備し、適切なリスク管理体制の運用を行います。
4)取締役の職務の執行が効率的に行われることを確保するための体制
①中長期の経営方針および年度ごとの会社方針を基に、各部での活動方針を具体化し、一貫した方針管理を
行います。
②組織規程・業務分掌および職務権限基準表に関する規程に基づき取締役の職務の執行が効率的に行われる
体制を整備し、定期的に当該組織と業務分掌を見直します。
③原則として毎月取締役会を開催し、重要事項の決定等を行います。
④取締役会の機能を強化し、経営効率を向上させるため、常勤役員が出席する常勤役員会を毎月開催し、取
締役会付議事項の事前審議およびその他の経営重要事項について審議を行います。
⑤経営意思決定・業務執行のスピードアップを図るために、取締役数を必要最小限にするとともに、執行役
員制度を採用し、効率的な経営を実施します。
⑥各機能の課題について取締役会で議論し、業務執行を指示することで早期改善を図ります。
5)使用人の職務の執行が法令及び定款に適合することを確保するための体制
①「経営理念」「大豊社員の行動指針」等を「大豊手帳」等を通じて、従業員が法令及び社会規範を遵守し
た行動をするよう徹底します。
②主な法令の啓発と周知徹底を図るために、各部門のコンプライアンス担当者をメンバーとするコンプライ
アンス推進会議を定期的に開催します。
③階層別教育によりコンプライアンスの徹底を図るとともに、全社員に「大豊社員の行動指針」を配付し、
その定着浸透度チェックを毎年実施します。
④内部監査部門による定期的な内部監査を実施します。また、不祥事の早期発見のために、内部通報制度を
設けています。
6)株式会社並びにその親会社及び子会社から成る企業集団における業務の適正を確保するための体制
①グループ全体で経営理念、ビジョン、会社方針等を共有します。
②子会社を管理する部署を設置し、子会社から業務報告および情報の収集・伝達に関するルールを定め、情
報交換を通じて、子会社の業務の適正性・適法性を確認します。
③グループ全体の内部統制の強化とコンプライアンス意識の醸成を子会社と連携して推進します。
イ.子会社の取締役等の職務の執行に係る事項の当該株式会社への報告に関する体制
定期的に子会社との会議等を開催し、子会社の経営・事業活動を適切に管理・監督します。
ロ.子会社の損失の危険の管理に関する規程その他の体制
子会社の安全、品質、環境、情報管理、コンプライアンス等のリスクについて、子会社のリスク管理体
制の整備を求めます。
ハ.子会社の取締役等の職務の執行が効率的に行われることを確保するための体制
子会社の取締役に対し、迅速に意思決定を行い、業務が効率的に行われることを求めます。
ニ.子会社の取締役等および使用人の職務の執行が法令及び定款に適合することを確保するための体制
子会社に対して法令等遵守体制の整備を求め、その状況を点検します。
41/126
EDINET提出書類
大豊工業株式会社(E02199)
有価証券報告書
7)監査役がその職務を補助すべき使用人を置くことを求めた場合における当該使用人に関する体制、当該使
用人の取締役からの独立性に関する体制及び当該使用人に対する監査役の指示の実効性の確保に関する体
制
①監査業務の充実のために、監査役の職務の補助業務を担当する使用人を置きます。
②当該使用人の任命・異動・評価・懲戒については、取締役と監査役が意見交換をします。
③当該使用人は、監査役から指揮命令を受けた場合、業務執行側の指揮命令権は及ばないものとします。
8)監査役への報告に関する体制及び当該報告をした者が当該報告をしたことを理由として不利な取扱いを受
けないことを確保するための体制
①取締役・執行役員・使用人および子会社を管理する部署は、当社または子会社の職務執行に関して重大な
法令・定款違反もしくは不正行為の事実ならびに会社に著しい損害を及ぼすおそれのある事実を知ったと
きには、直ちに監査役に報告します。
②当社および子会社の取締役・執行役員・使用人は、監査役から業務執行について報告を求められたとき
は、速やかに適切な報告をします。
③監査役に報告した者に対して、報告を行ったことを理由として、不利益な取扱いをすることを禁止し、そ
の旨を周知します。
9)監査役の職務の執行について生ずる費用の前払又は償還の手続その他の当該職務の執行について生ずる費
用又は債務の処理に係る方針に関する事項
①監査役の職務執行に関する予算を毎年設けます。
②監査役から職務の執行につき、所要の費用の請求があった場合、監査役の職務執行に必要でないと認めら
れる場合を除き、その費用を負担します。
10)その他監査役の監査が実効的に行われることを確保するための体制
代表取締役・取締役は、監査役との会合を持ち、意思の疎通を図ります。また、業務の適正を確保する上
で重要な会議等への監査役の出席、重要な書類を閲覧する体制を確保します。さらに、監査役が会計監査
人と定期的に情報交換できる体制を確保します。
11)反社会的勢力排除に向けた基本的な考え方とその整備状況
当社および子会社は、企業の社会的責任を十分認識し、反社会的勢力に対しては、会社として法律に則
し、顧問弁護士、警察等とも連携し、組織的に対応し、毅然とした態度で臨み、不当要求を拒絶し、それ
ら勢力との取引や資金提供を疑われるような一切の関係を遮断します。
このために対応部署を設け、社内体制を整備し、社外と連携しております。
④ 定款における取締役の定数または取締役の資格制限についての定め等
(イ)取締役の定数
当社の取締役は10名以内とする旨を定款に定めております。
(ロ)取締役の選任
当社は、取締役の選任決議は、議決権を行使することができる株主の議決権の3分の1以上を有する株主が
出席し、その議決権の過半数をもって行い、累積投票によらない旨を定款に定めております。
⑤ 株主総会決議事項を取締役会で決議することができることとした場合等
(イ)剰余金の配当等
当社は、取締役会の決議によって、毎年9月30日を基準日とした会社法第454条第5項に規定する剰余金の
配当を行うことができる旨および会社法第459条第1項各号に掲げる事項を定めることができる旨を、定款で
定めております。これは、剰余金の配当等を機動的に実施することができるようにするためであります。
(ロ)自己の株式の取得
当社は、自己の株式の取得について、経営環境の変化に対応した機動的な資本政策を遂行できるよう、会社
法第165条第2項の規定により、取締役会の決議によって市場取引等により、自己の株式を取得することがで
きる旨を定款で定めております。
(ハ)取締役および監査役の責任免除
当社は、取締役および監査役が職務を遂行するにあたり、期待される役割を十分に発揮できるよう、会社法
第425条第1項の規定により、善意でかつ重大な過失がない場合は、取締役および監査役の損害賠償責任を法
令の定める額を限度として、取締役会の決議によって免除できる旨を定款で定めております。
⑥ 責任限定契約の概要
当社は、会社法第427条第1項の規定に基づき、取締役(業務執行取締役等である者を除く。)および監査役
との間において、会社法第423条第1項の損害賠償責任を限定する契約を締結しています。当該契約に基づく損
42/126
EDINET提出書類
大豊工業株式会社(E02199)
有価証券報告書
害賠償責任の限度額は、法令が定める額を限度としています。なお、当該責任限定が認められるのは、当該取締
役または当該監査役が職務を行うについて善意でかつ重大な過失がないときに限られます。
⑦
役員等を被保険者として締結している役員等賠償責任保険契約の内容の概要
当社は、保険会社との間で、取締役、監査役、執行役員を被保険者として役員等賠償責任保険契約を締結して
おります。被保険者が当社の役員としての業務につき行った行為(不作為を含む。)に起因して損害賠償請求が
なされたことにより、被保険者が被る損害賠償金や争訴費用等を補償するものであります。ただし、贈収賄など
の犯罪行為や意図的に違法行為を行った役員自身の損害等は補償対象外とすることにより、役員等の職務の執行
の適正性が損なわれないように措置を講じております。保険料は全額当社が負担しております。
⑧
株主総会の特別決議要件
当社は、会社法第309条第2項に定める株主総会の特別決議要件について、機動的に行えるよう、議決権を行
使することができる株主の議決権の3分の1以上を有する株主が出席し、その議決権の3分の2以上をもってこ
れを行う旨を定款で定めております。
⑨
取締役会の活動状況
取締役会は、原則として毎月1回開催しており、当事業年度において当社は合計13回開催しております。
個々の取締役の出席状況については次のとおりです。
区分
氏名
出席状況(出席率)
取締役
新美
俊生
全13回中13回(100%)
取締役
粟津
滋喜
全13回中13回(100%)
取締役
加納
知広
全13回中13回(100%)
社外取締役
佐藤
邦夫
全13回中12回(92%)
社外取締役
岩井
善郎
全13回中13回(100%)
43/126
EDINET提出書類
大豊工業株式会社(E02199)
有価証券報告書
<取締役会の具体的な検討内容>2026年3月期
テーマ
経営・事業戦略
具体的な検討内容
・中期経営計画、中長期事業戦略
・国内外子会社事業戦略
・業務執行報告(業績、生産、品質、安全、技術・開発、知財、重点リスク管理等)
・取締役会決議事項の進捗
コーポレート
・決算関連
・取締役、役員人事
・サステナビリティ施策
・内部統制システム
・役員報酬
投融資案件
・国内外生産能力増強に伴う設備投資
・国内外子会社資金融資
また、当社は2021年11月1日に取締役会の諮問機関として役員人事報酬委員会を設置しております。
当事業年度における活動、各委員の出席状況については以下のとおりです。
<役員人事報酬委員会の構成および活動状況>
区分
氏名
出席状況(出席率)
取締役
新美
俊生
全2回中2回(100%)
社外取締役
佐藤
邦夫
全2回中2回(100%)
社外取締役
岩井
善郎
全2回中2回(100%)
役員人事報酬委員会の委員は、社外取締役が過半数を占める割合で構成し、代表取締役社長が委員長を務めて
おります。取締役会の諮問機関として客観的かつ公正な観点から、取締役の選任・解任に関する事項、取締役の
報酬等に関する事項などについて審議し、取締役会へ答申しております。
44/126
EDINET提出書類
大豊工業株式会社(E02199)
有価証券報告書
(2)【役員の状況】
① 役員一覧
1.2026年6月22日(有価証券報告書提出日)現在の当社の役員の状況は、以下のとおりです。
男性8名女性1名 (役員のうち女性の比率11.1%)
役職名
氏名
生年月日
略歴
任期
所有株式数
(千株)
1984年4月 トヨタ自動車株式会社入社
2009年1月同社内外装生技部長
2013年4月同社生技管理部長
代表取締役社長
新美
俊生
1962年1月12日生
2017年4月同社生技管理領域長、広瀬工場長
2018年1月同社本社・広瀬・衣浦工場長
(注)3
13
(注)3
28
(注)3
12
(注)3
−
(注)3
−
2021年1月 トヨタモーターノースアメリカ
執行副社長
2023年1月当社執行役員
2023年6月当社代表取締役社長就任(現任)
代表取締役副社長
粟津
滋喜
1964年3月21日生
1986年4月当社入社
2009年1月当社経営企画部部長
2012年6月 タイホウコーポレーションオブ
アメリカ社長
2014年6月当社執行役員
2023年6月当社代表取締役
2024年6月当社代表取締役副社長就任(現任)
1987年4月 トヨタ自動車株式会社入社
2007年1月同社第2エンジン技術部主査
代表取締役
加納
知広
1962年10月2日生
2007年11月
2013年1月
2013年4月
2016年4月
2017年1月
2017年6月
2023年6月
同社エンジンプロジェクト推進部主査
同社エンジン設計部主査
同社TNGA企画部主査
同社コーポレート戦略部グループ長
当社理事
当社執行役員
当社代表取締役就任(現任)
2009年9月株式会社三井住友銀行投資銀行統括部参与
2010年4月日興コーディアル証券株式会社 (現SMBC
日興証券株式会社)常務執行役員
2011年4月同社常務執行役員名古屋駐在
2012年3月同社専務執行役員名古屋駐在兼名古屋事業
法人本部長
2014年3月同社専務取締役名古屋駐在兼名古屋事業法
取締役
佐藤
邦夫
1955年1月20日生
人本部長
2016年7月同社顧問
2017年4月 べステラ株式会社
社外取締役
グッドインシュアランスサービス株式会社
取締役就任(現任)
2017年6月当社社外取締役就任(現任)
2021年10月中央電力株式会社社外監査役
2022年12月株式会社ティア 社外監査役就任(現任)
2023年6月株式会社オートウェーブ
社外監査役就任
(現任)
1991年10月福井大学工学部教授
2010年5月株式会社パルメソ 社外取締役就任(現任)
2012年4月福井大学工学研究科長・工学部長
2013年4月同大学理事(研究・国際担当)・副学長
2016年4月同大学理事(研究、産学・社会連携担当)・
取締役
岩井
善郎
1949年9月16日生
副学長
2019年4月同大学名誉教授
同大学産学官連携本部
特命教授
2020年6月当社社外取締役就任(現任)
2024年4月福井大学産学官連携本部客員教授就任
(現任)
45/126
EDINET提出書類
大豊工業株式会社(E02199)
有価証券報告書
役職名
氏名
生年月日
略歴
任期
所有株式数
(千株)
2003年10月当社入社
2013年1月当社経理部原価管理室室長
監査役
舩越
七洋
1974年7月14日生
2019年1月当社経理部部長
2020年6月当社監査室室長
(注)4
2
(注)5
0
(注)6
−
(注)6
−
2022年6月当社常勤監査役就任(現任)
監査役
芦原
克宏
1970年6月21日生
1994年4月
2014年1月
2019年1月
2022年1月
2024年6月
当社入社
当社第1開発部室長
当社第1開発部部長
当社技術企画推進部部長
当社経営企画・IT領域領域長
2025年6月当社常勤監査役就任(現任)
2004年11月監査法人トーマツ
(現有限責任監査法人トーマツ)入社
2008年6月公認会計士登録
2017年8月榎本幸子公認会計士事務所開設
2020年7月榎本商事株式会社監査役就任(現任)
2021年4月名古屋家庭裁判所家事調停委員就任
2023年6月当社社外監査役就任(現任)
監査役
榎本
幸子
1974年5月26日生
2023年10月名古屋地方裁判所及び名古屋簡易裁判所民事
調停委員(現任)
2024年6月萩原電気ホールディングス株式会社
社外取締役監査等委員就任
2025年1月名古屋簡易裁判所司法委員就任(現任)
2025年6月大成温調株式会社社外取締役
監査等委員就任(現任)
2026年4月 MIRAINIホールディングス株式会社
社外取締役監査等委員就任(現任)
2004年10月 TMI総合法律事務所勤務
2012年3月弁護士法人TMIパートナーズ代表社員就任
2012年4月 TMI総合法律事務所名古屋オフィス
監査役
尾形
和哉
1975年8月22日生
設立・勤務(現任)
2014年1月 TMI総合法律事務所 パートナー就任
2017年10月株式会社カルテットコミュニケーションズ
社外監査役就任(現任)
2020年4月小島プレス工業株式会社社外監査役就任
2026年1月当社社外監査役就任(現任)
計
56
(注)1
取締役
佐藤邦夫および岩井善郎は、社外取締役であります。
2
監査役
榎本幸子および尾形和哉は、社外監査役であります。
3
4
5
6
7
2025年6月19日開催の定時株主総会の終結の時から1年間
2022年6月17日開催の定時株主総会の終結の時から4年間
2025年6月19日開催の定時株主総会の終結の時から4年間
2023年6月16日開催の定時株主総会の終結の時から4年間
当社は、コーポレート・ガバナンスの強化および経営意思決定・業務執行のスピードアップを図るため、執
行役員制度を導入しております。
46/126
EDINET提出書類
大豊工業株式会社(E02199)
有価証券報告書
2.2026年6月23日開催予定の定時株主総会の議案(決議事項)として、「取締役6名選任の件」及び「監査役2
名選任の件」を上程しており、当該決議が承認可決されますと、当社の役員の状況及びその任期は、以下の通りと
なる予定です。
なお、役員の役職等については、当該定時株主総会の直後に開催が予定される取締役会の決議事項の内容(役職
等)を含めて記載しています。
男性10名女性1名 (役員のうち女性の比率9.1%)
役職名
氏名
生年月日
略歴
任期
所有株式数
(千株)
1984年4月 トヨタ自動車株式会社入社
2009年1月同社内外装生技部長
2013年4月同社生技管理部長
代表取締役社長
新美
俊生
1962年1月12日生
2017年4月同社生技管理領域長、広瀬工場長
2018年1月同社本社・広瀬・衣浦工場長
(注)3
13
(注)3
12
1966年12月29日生
1989年4月 トヨタ自動車株式会社入社
2005年1月同社グローバル人事部グローバル人事室
グループ長
2007年1月 トヨタ自動車(中国)投資有限公司副社長
2011年1月 トヨタ自動車株式会社人材開発部
第2人事室室長
2014年1月同社関連事業室主査
2017年4月 トヨタ・モーター・マニュファクチャリン
グ・デ・グアナファト副社長
2020年1月当社理事
2021年6月当社執行役員
2026年6月当社代表取締役就任(現任)
(注)3
6
1967年8月26日生
1989年4月当社入社
2007年1月 タイホウコーポレーションオブ
アメリカPEマネージャー
2012年1月当社細谷工場工場長付主査
2018年6月 タイホウコーポレーションオブ
アメリカ社長
2022年1月当社細谷工場製造部部長
2023年6月当社執行役員
2026年6月当社代表取締役就任(現任)
(注)3
0
2021年1月 トヨタモーターノースアメリカ
執行副社長
2023年1月当社執行役員
2023年6月当社代表取締役社長就任(現任)
1987年4月 トヨタ自動車株式会社入社
2007年1月同社第2エンジン技術部主査
2007年11月同社エンジンプロジェクト推進部主査
2013年1月同社エンジン設計部主査
代表取締役副社長
加納
知広
1962年10月2日生
2013年4月同社TNGA企画部主査
2016年4月同社コーポレート戦略部グループ長
2017年1月当社理事
2017年6月当社執行役員
2023年6月当社代表取締役
2026年6月当社代表取締役副社長就任(現任)
取締役
取締役
竹村
横井
康行
明彦
47/126
EDINET提出書類
大豊工業株式会社(E02199)
有価証券報告書
役職名
氏名
生年月日
略歴
任期
所有株式数
(千株)
2009年9月株式会社三井住友銀行投資銀行統括部参与
2010年4月日興コーディアル証券株式会社 (現SMBC
日興証券株式会社)常務執行役員
2011年4月同社常務執行役員名古屋駐在
2012年3月同社専務執行役員名古屋駐在兼名古屋事業
法人本部長
2014年3月同社専務取締役名古屋駐在兼名古屋事業法
取締役
佐藤
邦夫
1955年1月20日生
人本部長
2016年7月同社顧問
2017年4月 べステラ株式会社
(注)3
−
(注)3
−
(注)4
5
(注)5
0
社外取締役
グッドインシュアランスサービス株式会社
取締役就任(現任)
2017年6月当社社外取締役就任(現任)
2021年10月中央電力株式会社社外監査役
2022年12月株式会社ティア 社外監査役就任(現任)
2023年6月株式会社オートウェーブ
社外監査役就任
(現任)
1991年10月福井大学工学部教授
2010年5月株式会社パルメソ 社外取締役就任(現任)
2012年4月福井大学工学研究科長・工学部長
2013年4月同大学理事(研究・国際担当)・副学長
2016年4月同大学理事(研究、産学・社会連携担当)・
取締役
岩井
善郎
副学長
1949年9月16日生
2019年4月同大学名誉教授
同大学産学官連携本部
特命教授
2020年6月当社社外取締役就任(現任)
2024年4月福井大学産学官連携本部客員教授就任
(現任)
1986年4月当社入社
2002年3月当社経理部経理室室長
2005年3月 タイホウコーポレーションオブ
監査役
岩本
恒明
1963年8月25日生
2009年1月
2012年6月
2017年6月
2018年1月
2018年6月
2022年6月
2024年1月
アメリカCFO
当社経理部副部長
大豊工業(煙台)有限公司副総経理
当社調達部主査
当社調達部部長
当社理事
当社執行役員
奥田工業株式会社代表取締役社長
(当社執行役員待遇)
2026年6月当社常勤監査役就任(現任)
監査役
芦原
克宏
1970年6月21日生
1994年4月
2014年1月
2019年1月
2022年1月
2024年6月
当社入社
当社第1開発部室長
当社第1開発部部長
当社技術企画推進部部長
当社経営企画・IT領域領域長
2025年6月当社常勤監査役就任(現任)
48/126
EDINET提出書類
大豊工業株式会社(E02199)
有価証券報告書
役職名
氏名
生年月日
略歴
任期
所有株式数
(千株)
2004年11月監査法人トーマツ
(現有限責任監査法人トーマツ)入社
2008年6月公認会計士登録
2017年8月榎本幸子公認会計士事務所開設
2020年7月榎本商事株式会社監査役就任(現任)
2021年4月名古屋家庭裁判所家事調停委員就任
2023年6月当社社外監査役就任(現任)
監査役
榎本
幸子
1974年5月26日生
2023年10月名古屋地方裁判所及び名古屋簡易裁判所民事
調停委員(現任)
(注)6
−
(注)6
−
(注)4
−
2024年6月萩原電気ホールディングス株式会社
社外取締役監査等委員就任
2025年1月名古屋簡易裁判所司法委員就任(現任)
2025年6月大成温調株式会社社外取締役
監査等委員就任(現任)
2026年4月 MIRAINIホールディングス株式会社
社外取締役監査等委員就任(現任)
2004年10月 TMI総合法律事務所勤務
2012年3月弁護士法人TMIパートナーズ代表社員就任
2012年4月 TMI総合法律事務所名古屋オフィス
監査役
尾形
和哉
1975年8月22日生
設立・勤務(現任)
2014年1月 TMI総合法律事務所 パートナー就任
2017年10月株式会社カルテットコミュニケーションズ
社外監査役就任(現任)
2020年4月小島プレス工業株式会社社外監査役就任
2026年1月当社社外監査役就任(現任)
2005年4月株式会社ブリヂストン入社
2006年10月 トヨタ自動車株式会社入社
2018年1月同社人事部グループ長
2020年1月株式会社日本経済新聞社出向
2021年1月 トヨタ自動車株式会社先進技術統括部
監査役
鬼村
洋平
1981年5月25日生
人事室室長
2021年10月同社人事部グループ長
2021年11月同社人事部労政室室長
2026年1月同社ユニット部品調達部パワトレユニット
部品室室長(現任)
2026年6月当社社外監査役就任(現任)
計
38
(注)1
取締役
佐藤邦夫および岩井善郎は、社外取締役であります。
2
監査役
榎本幸子、尾形和哉および鬼村洋平は、社外監査役であります。
3
4
5
6
7
2026年6月23日開催の定時株主総会の終結の時から1年間
2026年6月23日開催の定時株主総会の終結の時から4年間
2025年6月19日開催の定時株主総会の終結の時から4年間
2023年6月16日開催の定時株主総会の終結の時から4年間
当社は、コーポレート・ガバナンスの強化および経営意思決定・業務執行のスピードアップを図るため、執
行役員制度を導入しております。
49/126
EDINET提出書類
大豊工業株式会社(E02199)
有価証券報告書
② 社外役員の状況
(イ)社外取締役
有価証券報告書提出日現在、当社の社外取締役は2名であります。佐藤邦夫は、銀行・証券業界の経験者であ
り、特別な利害関係はありません。また、岩井善郎は、大学経営の経験者であり、特別な利害関係はありません。
社外取締役の独立性に関する基準として、証券取引所が定める独立役員の要件をもとに判断を行っており、両氏
を証券取引所の定めに基づく独立役員として、技術と経営の両面における豊富な知識と経験を当社経営に反映して
いただくとともに、経営意思決定の透明性を高めることで、コーポレート・ガバナンスの強化を図っております。
なお当社は、2026年6月23日開催予定の定時株主総会の議案(決議事項)として「取締役6名選任の件」、「監
査役2名選任の件」を提案しており、当該議案が承認可決されますと、引き続き2名の社外取締役となります。
(ロ)社外監査役
有価証券報告書提出日現在、当社は社外監査役を2名選任しております。
榎本幸子は榎本幸子公認会計士事務所所長であり、当社との取引関係はありません。尾形和哉はTMI総合法律
事務所の弁護士であり、当社との取引関係はありません。
社外監査役の独立性に関する基準として、証券取引所が定める独立役員の要件をもとに判断を行っており、両氏
を証券取引所の定めに基づく独立役員として、公認会計士および弁護士としての経験と専門的見地から意見をいた
だいております。
なお当社は、2026年6月23日開催予定の定時株主総会の議案(決議事項)として「取締役6名選任の件」、「監
査役2名選任の件」を提案しており、当該議案が承認可決されますと、社外監査役3名となります。新任社外監査
役である鬼村洋平は、トヨタ自動車株式会社のユニット部品調達部 パワトレユニット部品室室長であります。
トヨタ自動車株式会社は、当社議決権の34.1%を所有しており、最大の販売先であります。その他特別な利害関係
はありません。
③ 社外取締役又は社外監査役による監督又は監査と内部監査、監査役監査及び会計監査との相互連携並びに内部
統制部門との関係
社外取締役には、取締役会への出席を通じ、専門分野はもとより豊富な経験や幅広い見識、独立した立場からの
助言、提言により経営の管理監督機能を発揮いただいております。また、主要部署からの定期的な業務執行状況の
報告および相談に対する助言、提言をいただいております。
社外監査役には、取締役会への出席、重要書類の閲覧等を実施し、独立した立場から経営の監視機能の役割を
担っていただくとともに、事業会社での豊富な経験や他社での監査役経験を通して得た幅広い見識をもとに、公正
かつ客観的に意見を述べていただいております。社外監査役の選任については、各々の専門分野や経営に関する豊
富な経験と知見を有する人物を選任しております。主な活動として、監査役会を通じて他の監査役と連携を取りな
がら、会計監査人および内部統制監査機能を含む内部監査部門とそれぞれの監査計画、実施状況、監査結果につい
て定期的に会合をもち、必要に応じ随時連絡を行い、意見交換と情報の共有化を図り効率的かつ効果的な監査を進
めております。
50/126
EDINET提出書類
大豊工業株式会社(E02199)
有価証券報告書
(3)【監査の状況】
① 内部監査および監査役監査の組織、人員および手続、内部監査、監査役監査および会計監査の相互連携
当社は、監査役会制度を採用しており、監査の方針、監査計画を定めて、監査役会を定期的に開催し、監査に
関する重要事項について報告を受けて、協議を行っております。有価証券報告書提出日現在、監査役会は、常勤
監査役の舩越七洋を議長とし、芦原克宏、榎本幸子(社外監査役)、尾形和哉(社外監査役)により構成されて
おります。榎本幸子、尾形和哉は証券取引所の定めに基づく独立役員に指定しております。榎本幸子は公認会計
士として、尾形和哉は弁護士としての経験と専門的見地から意見をいただいております。監査役は、監査室(内
部監査部門)、顧問弁護士、公認会計士等と連携を図るとともに、代表取締役との定期的な懇談、重要な会議体
への参加、書類の閲覧及び子会社の常勤監査役と情報交換等により、取締役の業務執行を監査しております。
当社内部監査部門は社長を直轄とする組織として、監査室を設置しており、責任者を室長とする7名で構成し
ております。
当社の内部監査は「内部監査規程」に基づき、企業経営が適法かつ正確に実行され、内部統制が効率的に機能
しているか、また不正の未然防止を目的として監査しております。財務報告に係る内部統制を含めた内部統制シ
ステム及び業務プロセスの整備・運用状況を独立の立場で監査し、その結果を取締役会等に報告しております。
当事業年度では、当社の全部署に対し業務監査(購買・資産プロセス)を実施し、主に諸規程類への準拠性及
び内部統制手続きの有効性を評価し、課題と改善提案を行うとともに、全従業員に対しコンプライアンス調査を
毎年実施し、従業員の意識の変化を捉え、コンプライアンス教育を通してリスク低減を図っております。
また、子会社・関連会社には内部統制及びコンプライアンスの実態調査を実施し、組織体系、主要規程類、業
務プロセス等の整備・運用状況を評価し、定期会議の中で課題と改善提案を行うことで内部統制の実効性とコン
プライアンス意識の更なる向上へ努めております。
監査室は監査役及び会計監査人と相互連携を図っております。具体的には、監査役とは定期的にコンプライア
ンスに関する情報や内部監査の実施結果等を共有しております。また会計監査人及び監査役と四半期ごとの定期
報告会を通して意見交換を実施しております。
さらに、当社は、コンプライアンスを統括する組織として、社長を委員長とし、取締役、常勤監査役、本部長
および顧問弁護士をメンバーとするコンプライアンス委員会を設置しております。また、不祥事の早期発見のた
めに、内部通報制度を設けております。
当事業年度において当社は監査役会を合計14回開催しており、個々の監査役の出席状況については次のとおりで
す。
区分
(注)1
2
3
氏名
出席状況(出席率)
常勤監査役
舩越
七洋
全14回中14回(100%)
常勤監査役
芦原
克宏
全11回中11回(100%)
社外監査役
加藤
貴己
全10回中10回(100%)
社外監査役
榎本
幸子
全14回中14回(100%)
社外監査役
尾形
和哉
全4回中4回(100%)
全回数が異なるのは、就任時期および退任時期の違いによるものです。
加藤貴己は2025年12月31日をもって監査役を辞任したため、辞任までの出席回数を記載しております。
尾形和哉は2026年1月1日をもって監査役に就任したため、就任後の出席回数を記載しております。
監査役会における主な検討事項は、監査の方針及び監査実施計画、内部統制システムの整備・運用状況、会計
監査人の監査の方法及び結果の相当性等です。
また、監査役の活動として、取締役等との意思疎通、取締役会その他重要な会議への出席、重要な決裁書類等
の閲覧、本社及び主要な事業所における業務及び財産状況の調査、子会社の取締役及び監査役等との意思疎通・
情報交換や子会社からの事業報告の確認及び子会社の往査、会計監査人からの監査の実施状況・結果の報告の確
認を行っております。
なお当社は、2026年6月23日開催予定の定時株主総会の議案(決議事項)として、「監査役2名選任の件」を
提案しており、当該議案が承認可決されますと、監査役会は5名の監査役(うち3名は社外監査役)で構成され
ることになります。
51/126
EDINET提出書類
大豊工業株式会社(E02199)
有価証券報告書
② 会計監査の状況
a.監査法人の名称
太陽有限責任監査法人
b.継続監査期間
6年間
c.業務を執行した公認会計士
指定有限責任社員業務執行社員
指定有限責任社員業務執行社員
古田
本田
賢司
一暁
d.監査業務に係る補助者の構成
当社の会計監査業務に係る補助者は、公認会計士10名、その他の補助者13名であります。
e.監査法人の選定方針と理由
当社の監査役会は監査公認会計士等の選定に関して、次の方針と理由に基づき実施します。監査法人の監
査品質管理が適切であり外部機関による検査結果と対応が適切であること、監査チームは独立性を保持した
適切なメンバーで構成され適切な監査計画を実施していること、監査報酬の水準が適切であること、監査役
等との連携が適切であること、経営者等とのコミュニケーションが適切であること、海外のネットワーク
ファームとの連携が適切であること、不正リスクの評価と対応が適切であること。
また、会計監査人の解任又は不再任の決定の方針として、監査役会は会計監査人が会社法第340条第1項各
号のいずれかに該当すると認められる場合、監査役全員の同意により解任いたします。また、上記の場合の
他、会計監査人による適正な監査の遂行が困難であると認められる場合など、その必要があると判断した場
合、株主総会に提出する会計監査人の解任または会計監査人を再任しないことに関する議案の内容は、監査
役会が決定します。
f.監査役及び監査役会による監査法人の評価
当社の監査役会は監査法人に対して評価を行っております。監査法人の今期の監査活動に対し、選定方針
の各項目について評価した結果、特に不適切な事実は認められませんでした。
52/126
EDINET提出書類
大豊工業株式会社(E02199)
有価証券報告書
③ 監査報酬の内容等
a.監査公認会計士等に対する報酬の内容
前連結会計年度
区分
監査証明業務に
基づく報酬(百万円)
当連結会計年度
非監査業務に
監査証明業務に
基づく報酬(百万円) 基づく報酬(百万円)
非監査業務に
基づく報酬(百万円)
提出会社
35
−
36
−
連結子会社
16
−
16
−
計
52
−
53
−
監査公認会計士等の提出会社に対する非監査業務の内容は、以下のとおりです。
前連結会計年度
該当事項はありません。
当連結会計年度
該当事項はありません。
b.監査公認会計士等と同一のネットワークに対する報酬(a.を除く)
前連結会計年度
区分
監査証明業務に
基づく報酬(百万円)
当連結会計年度
非監査業務に
監査証明業務に
基づく報酬(百万円) 基づく報酬(百万円)
非監査業務に
基づく報酬(百万円)
提出会社
−
−
−
−
連結子会社
11
6
9
3
計
11
6
9
3
(前連結会計年度)
連結子会社における非監査業務の内容は、主に移転価格税制に関する助言業務、税務コンサルティング業務
等に対する報酬であります。
(当連結会計年度)
連結子会社における非監査業務の内容は、主に移転価格税制に関する助言業務に対する報酬であります。
c.その他の重要な監査証明業務に基づく報酬の内容
該当事項はありません。
d.監査報酬の決定方針
監査報酬は、監査法人から提出を受けた監査計画の内容の検討を行い、監査役会の同意及び社内稟議決裁の
上、監査報酬額を決定しております。
e.監査役会が会計監査人の報酬等に同意した理由
監査役会は、会計監査人の監査計画の内容、会計監査の職務執行状況や報酬見積りの算出根拠などを確認
し、検討した結果、会計監査人の報酬等につき、会社法第399条第1項の同意を行っております。
53/126
EDINET提出書類
大豊工業株式会社(E02199)
有価証券報告書
(4)【役員の報酬等】
当社は、2025年4月24日開催の取締役会において、取締役の個人別の報酬等の内容にかかる決定方針を決議して
おります。
また、取締役会は、当事業年度にかかる取締役の個人別の報酬等について、取締役会にて説明され可決されてい
ることから、その内容は決定方針に沿うものであると判断しております。
役員の報酬等の額又はその算定方法の決定に関する方針に係る事項
取締役の報酬等は、①基本報酬、②賞与、③ストックオプション(非金銭報酬)により、監査役の報酬等は、
①基本報酬、②賞与により構成しております。
取締役の基本報酬は、月例の固定報酬とし、職位、職責に応じて他社水準、当社の業績、従業員給与の水準も
考慮しながら、総合的に勘案して決定しており、賞与は、事業年度ごとの業績向上に対する意識を高めるため業
績指標である連結営業利益を反映した現金報酬とし、各事業年度の連結営業利益の対前期比増減を総合的に勘案
し算出された額を賞与として毎年、一定の時期に支給しております。なお、ストックオプションは、毎年一定の
時期に無償で新株予約権を発行しておりましたが、2024年4月25日開催の取締役会において、2024年度以降、新
たにストックオプションとして新株予約権を発行しないことを決議しております。
取締役および監査役の報酬については、株主総会で決議された上限の範囲内において、各々の職位および業績
等を勘案して決定しております。賞与については、業績等を考慮して金額を決定しております。
また、2021年11月1日に取締役会の諮問機関として設置された「役員人事報酬委員会」は、取締役の個人別の
報酬等の決定に関する方針、取締役の個人別報酬案、その他報酬に関する重要事項について審議し、取締役会に
答申しており、代表取締役社長に委任される事項については代表取締役社長に答申しております。
取締役会は、「役員人事報酬委員会」の答申をふまえ、取締役の個人別の報酬等の決定に関する方針を決定いた
します。
当社の役員の報酬等に関する株主総会の決議年月日は、2022年6月17日であり、決議の内容は、取締役の基本
報酬額上限年額200百万円以内(うち社外取締役分年額20百万円以内)、及び監査役の基本報酬額上限年額60百
万円以内、取締役のストックオプション報酬額上限年額30百万円以内(社外取締役を除く)であります。
2022年6月17日株主総会終結時点の取締役および監査役の員数は5名(うち社外取締役2名)、4名(うち社
外監査役3名)であります。
当社の役員の報酬等の額又はその算定方法の決定に関する方針の決定権限を有する者の名称及び権限の内容・
裁量の範囲は以下のとおりです。
(基本報酬・賞与)
取締役の基本報酬は、取締役会で総額決議し、個人配分は代表取締役社長がその具体的内容について委任をう
けるものとし、その権限の内容は各取締役の基本報酬の額であります。監査役の基本報酬は、監査役会で個人配
分含め総額を協議、決定しております。
取締役の賞与は、株主総会で総額決議し、個人配分は代表取締役社長がその具体的内容について委任をうける
ものとし、その権限の内容は各取締役の賞与の評価配分であります。監査役の賞与は株主総会で総額決議し、監
査役会で個人配分を協議、決定しております。
(ストックオプション)
ストックオプション委員会及び株主総会で総枠決議し、個人の配分はストックオプション委員会及び取締役会
で決議しております。
また、ストックオプション委員会における手続きとしては、代表取締役社長、代表取締役副社長および監査役
を委員会メンバーとし、新株予約権付与時点で在籍している対象者に対して、一定の付与基準に基づき、公正に
付与されるよう決議しております。
なお、当事業年度における当社の取締役の報酬等の額の決定過程における取締役会の活動は、2023年6月16日
の取締役会において、取締役基本報酬の総額を決議しており、取締役基本報酬及び賞与の個人配分は代表取締役
社長に一任しております。また、ストックオプションとしては、2023年4月26日の取締役会において、ストック
オプションの総枠を決議し、2023年7月27日の取締役会において、個人配分を決議しております。
業績連動報酬である賞与に係る指標は連結営業利益であり、会社の収益状況を示す財務数値であることから、
当該指標を選択しております。業績連動報酬の額の決定方法は、当該指標の対前期比増減率等を総合的に勘案
し、決定しております。
なお、当事業年度における業績連動報酬に係る指標の目標は610百万円であり、実績は2,589百万円でありま
す。
54/126
EDINET提出書類
大豊工業株式会社(E02199)
有価証券報告書
②
提出会社の役員区分ごとの報酬等の総額、報酬等の種類別の総額及び対象となる役員の員数
報酬等の種類別の総額(百万円)
役員区分
報酬等の総額
(百万円)
固定報酬
業績連動報酬
ストックオプ
ション
対象となる
役員の員数
(名)
取締役
(社外取締役を除く)
120
93
26
1
3
監査役
(社外監査役を除く)
27
17
9
−
2
社外役員
14
14
0
−
5
③提出会社の役員ごとの連結報酬等の総額等
連結報酬等の総額が1億円以上である者が存在しないため、記載しておりません。
55/126
EDINET提出書類
大豊工業株式会社(E02199)
有価証券報告書
(5)【株式の保有状況】
① 投資株式の区分の基準及び考え方
保有目的が取引先との取引関係強化、地域貢献等を目的とした株式を純投資目的以外の投資株式、保有目的が
株式値上がりの利益等による利益確保を目的とした株式を純投資目的の投資株式に区分しております。
なお、当社が所有する株式は全て、純投資目的以外の投資株式であります。
②
保有目的が純投資目的以外の目的である投資株式
a.保有方針及び保有の合理性を検証する方法並びに個別銘柄の保有の適否に関する検証の内容
(保有方針)
今後も当社が持続的な成長を続けていくためには、開発・調達・生産・販売等の過程において、様々な企
業との協力関係が不可欠です。そのために、中長期的視点から当社の企業価値向上に資すると認める以下株
式について、政策保有株式として保有します。
(1)事業上関係の深い取引先については、経済合理性を評価した上で、取引関係強化のため株式を保有し
ます。
(2)地域からの出資要請を受けた会社等、地域社会との関係維持、地域貢献の観点より必要と判断した場
合に株式を保有します。
また、定期的に保有の妥当性について検討します。保有の意義が希薄と考えられる政策保有株式について
は、処分・縮減していく事を検討します。
(保有の合理性を検証する方法)
個別銘柄毎に、当社との関係性(事業上の取引関係、地域貢献等)を踏まえた保有意義の再確認や、保有
に伴う便益やリスクが資本コストに見合っているか等の具体的な精査を行うことにより、保有の適否を毎年
検証しております。
(個別銘柄の保有の適否に関する検証の内容)
上記検証方法により検証した結果、全ての銘柄について保有の合理性があると判断しております。
b.銘柄数及び貸借対照表計上額
銘柄数
(銘柄)
貸借対照表計上額の
合計額(百万円)
非上場株式
25
226
非上場株式以外の株式
16
1,615
(当事業年度において株式数が増加した銘柄)
該当事項はありません。
(当事業年度において株式数が減少した銘柄)
銘柄数
(銘柄)
貸借対照表計上額の
合計額(百万円)
非上場株式
1
0
非上場株式以外の株式
1
1,035
56/126
EDINET提出書類
大豊工業株式会社(E02199)
有価証券報告書
c.特定投資株式及びみなし保有株式の銘柄ごとの株式数、貸借対照表計上額等に関する情報
特定投資株式
当事業年度
前事業年度
株式数(株)
株式数(株)
貸借対照表計上額
(百万円)
貸借対照表計上額
(百万円)
144,990
862
168,000
315
40,000
77
29,000
53
47,133
77
30,000
65
東海東京フィナン
シャル・ホールディ
ングス(株)
(株)三井住友フィナ
ンシャルグループ
銘柄
豊田通商(株)
スズキ(株)
(株)デンソー
愛三工業(株)
(株)ジェイテクト
(株)アイシン
豊田合成(株)
(株)ファインシン
ター
(株)東海理化電機製
作所
日野自動車(株)
フタバ産業(株)
中央発條(株)
共和レザー(株)
(株)三菱UFJフィ
ナンシャル・グルー
プ
保有目的、業務提携等の概要、
定量的な保有効果
及び株式数が増加した理由(注)
当社の株式の
保有の有無
144,990
361
168,000
304
40,000
73
29,000
60
47,133
53
30,000
48
自動車部品関連事業の取引の関係強化の
ため
無
自動車部品関連事業の取引の関係強化の
ため
無
自動車部品関連事業の取引の関係強化の
ため
無
業界の動向把握・情報収集のため
無
自動車部品関連事業の取引の関係強化の
ため
無
自動車部品関連事業の取引の関係強化の
ため
無
78,750
78,750
56
38
安定的な資金調達等の金融取引の関係強
化のため
有
6,234
31
5,000
20
15,300
21
5,000
14
20,000
7
5,000
4
2,000
7
1,000
0
6,234
23
5,000
13
15,300
12
5,000
11
20,000
8
5,000
3
2,000
3
1,000
0
安定的な資金調達等の金融取引の関係強
化のため
有
自動車部品関連事業の取引の関係強化の
ため
無
自動車部品関連事業の取引の関係強化の
ため
有
業界の動向把握・情報収集のため
無
自動車部品関連事業の取引の関係強化の
ため
無
業界の動向把握・情報収集のため
有
業界の動向把握・情報収集のため
無
業界の動向把握・情報収集のため
無
100
100
0
0
安定的な資金調達等の金融取引の関係強
化のため
有
81,500
−
−
有
1,035
−
(注)特定投資株式における定量的な保有効果につきましては、事業上の機密事項に該当するため記載しており
ません。なお、保有の合理性につきましては、個別銘柄毎に、当社との関係性(事業上の取引関係、地域
貢献等)を踏まえた保有意義の再確認や、保有に伴う便益やリスクが資本コストに見合っているか等の具
体的な精査を行うことにより、保有の適否を毎年検証しており、当事業年度末における全ての銘柄におい
て保有の合理性があると判断しております。
③ 保有目的が純投資目的である投資株式
該当事項はありません。
(株)豊田自動織機
57/126
EDINET提出書類
大豊工業株式会社(E02199)
有価証券報告書
5【従業員の状況等】
(1)【人材戦略に関する基本方針等】
当社はVISION2030とその実現に向けた中期経営計画(2025-2027年度)〜お客様と仲間の笑顔のために〜を策
定し、会社の持続的な成長と従業員の幸せの実現に向け、人的資本経営に取り組んでいます。
経営計画と統合された人材戦略の方針として、マテリアリティ(重要課題)の一つとして“多様な人材が働き
がいを持ち、総活躍できる風土、しくみづくり”を特定しております。その実現に向けて実行計画を策定し、
その状況について、取締役会、及びサステナビリティ委員会の中で定期レビューと議論を実施しております。
また、VISION2030において、人的資本経営を経営基盤強化の重要取り組みに位置付けており、具体的には、以
下の三本の柱を人的資本戦略の中心に据え、取り組みを推進しております。
人的資本戦略の柱
Ⅰ.高い目標と道のりを示し、導く、マネジメント
Ⅱ.一人ひとり能力を最大限発揮するための仕掛け・しくみ
Ⅲ.変化・失敗を恐れず誰かのために挑戦する風土づくり
さらにVISION達成に向けた中期経営計画(2025-2027年度)の構造改革テーマとして、”DXによる効率
化”、”事技職の生産性向上”を営業利益効果とともに掲げて推進しており、人財力の向上/働き方の変革を
通じた経営目標の達成を目指しております。
このように、当社は、人的資本を経営計画の中心に据え、人財力の向上、それを通じた会社の持続的成長と
企業価値の向上に取り組んでまいります。
また、従業員の給与等の決定に関する方針については、マルチステークホルダー方針にて開示している通
り、当社は、生み出した収益・成果に基づいて、「賃金決定の大原則」にのっとり、当社の状況を踏まえた適
切な方法による賃金の引上げを行うとともに、それ以外の総合的な処遇改善としても、従業員のエンゲージメ
ント向上や更なる生産性の向上に資するよう、教育訓練等を中心に積極的に取り組むことを通じて、従業員へ
の持続的な還元を目指します。具体的には、労働組合との真摯な対話を通じて、魅力ある賃金水準の実現
と、従業員の成果や頑張りに報いる賞与の支給を行ってまいります。
※マルチステークホルダー方針
https://www.taihonet.co.jp/sustainability/multistakeholder/
(2)【従業員の状況】
①連結会社の状況
2026年3月31日現在
セグメントの名称
従業員数(名)
3,328
(199)
自動車製造用設備関連事業
328
(32)
その他
23
(110)
全社(共通)
410
(31)
4,089
(372)
自動車部品関連事業
合計
(注)1
2
3
4
従業員数は、就業人員であります。
臨時従業員数は、年間の平均人員を( )外数で記載しております。
臨時従業員には、パートタイマー及び期間契約の従業員を含み、派遣社員を除いております。
全社(共通)は、総務、人事、経理等の管理部門の従業員であります。
②提出会社の状況
2026年3月31日現在
従業員数(名)
1,885
(166)
平均年齢(歳)
平均勤続年数(年)
40.4
16.7
セグメントの名称
平均年間給与(円)
6,697,966
従業員数(名)
58/126
平均年間給与の
対前事業年度増減率
(%)
2.1
EDINET提出書類
大豊工業株式会社(E02199)
有価証券報告書
自動車部品関連事業
全社(共通)
合計
(注)1
2
3
4
5
1,777
(166)
108
(-)
1,885
(166)
従業員数は、就業人員であります。
平均給与には、賞与及び基準外賃金を含んでおります。
臨時従業員数は、年間の平均人員を( )外数で記載しております。
臨時従業員には、パートタイマー及び期間契約の従業員を含み、派遣社員を除いております。
全社(共通)は、総務、人事、経理等の管理部門の従業員であります。
③労働組合の状況
労使間に特記すべき事項はありません。
④管理的地位にある労働者に占める女性労働者の割合、男性労働者の育児休業取得率及び労働者の男女の賃金の額の
差異
ア.提出会社
当事業年度
管理的地位にある
労働者に占める女
性労働者の割合
(%)
(注1)
男性労働者の育児休業取得率(%)
(注2)
正規雇用労働者
パート・有期労働
者
73.0
100.0
1.8
(注)1
2
労働者の男女の賃金の額の差異(%)
(注1)
全労働者
正規雇用労働者
パート・有期労働
者
74.8
89.4
73.1
「女性の職業生活における活躍の推進に関する法律」(平成27年法律第64号)の規定に基づき算出したも
のであります。
「育児休業、介護休業等育児又は家族介護を行う労働者の福祉に関する法律」(平成3年法律第76号)の規
定に基づき、「育児休業、介護休業等育児又は家族介護を行う労働者の福祉に関する法律施行規則」(平
成3年労働省令第25号)第71条の6第1号における育児休業等の取得割合を算出したものであります。
イ.連結子会社
当事業年度
名称
管理的地位
にある労働
者に占める
女性労働者
の割合
(%)
(注1)
男性労働者の育児休業取得
率(%)
(注2)
労働者の男女の賃金の額の差異(%)
(注1)
正規雇用労
働者
非正規雇用労
働者(注3)
全労働者
正規雇用労働 パート・有
者
期労働者
大豊精機株式会社
0.0
77.8
−
63.5
62.5
74.7
日本ガスケット株式会社
1.9
30.0
−
70.2
70.8
77.2
(注)1
2
3
「女性の職業生活における活躍の推進に関する法律」(平成27年法律第64号)の規定に基づき算出したも
のであります。
「育児休業、介護休業等育児又は家族介護を行う労働者の福祉に関する法律」(平成3年法律第76号)の規
定に基づき、「育児休業、介護休業等育児又は家族介護を行う労働者の福祉に関する法律施行規則」(平
成3年労働省令第25号)第71条の6第1号における育児休業等の取得割合を算出したものであります。
「−」は男性の育児休業取得の対象となる従業員がいないことを示しています。
59/126
EDINET提出書類
大豊工業株式会社(E02199)
有価証券報告書
第5【経理の状況】
1
連結財務諸表及び財務諸表の作成方法について
(1)当社の連結財務諸表は、「連結財務諸表の用語、様式及び作成方法に関する規則」(昭和51年大蔵省令第28号。
以下「連結財務諸表規則」という。)に基づいて作成しております。
(2)当社の財務諸表は、「財務諸表等の用語、様式及び作成方法に関する規則」(昭和38年大蔵省令第59号。以下
「財務諸表等規則」という。)に基づいて作成しております。
また、当社は、特例財務諸表提出会社に該当し、財務諸表等規則第127条の規定により財務諸表を作成しており
ます。
2
監査証明について
当社は、金融商品取引法第193条の2第1項の規定に基づき、連結会計年度(2025年4月1日から2026年3月31日
まで)の連結財務諸表及び事業年度(2025年4月1日から2026年3月31日まで)の財務諸表について、太陽有限責任
監査法人により監査を受けております。
3
連結財務諸表等の適正性を確保するための特段の取組について
当社は、連結財務諸表等の適正性を確保するための特段の取組を行っております。具体的には、会計基準等の内容
を適切に把握し、連結財務諸表等を適正に作成することができる体制を整備するため、公益財団法人財務会計基準機
構へ加入し、会計基準等の最新情報の把握に努めております。
また、会計処理基準等の新設・改廃に関する情報は専門誌の購読、外部団体等が主催する研修会への参加などでも
入手し、適正な連結財務諸表等の作成に努めております。
60/126
EDINET提出書類
大豊工業株式会社(E02199)
有価証券報告書
1【連結財務諸表等】
(1)【連結財務諸表】
①【連結貸借対照表】
(単位:百万円)
前連結会計年度
(2025年3月31日)
資産の部
流動資産
現金及び預金
受取手形及び売掛金
電子記録債権
契約資産
商品及び製品
仕掛品
原材料及び貯蔵品
その他
貸倒引当金
流動資産合計
固定資産
有形固定資産
建物及び構築物
当連結会計年度
(2026年3月31日)
19,952
19,109
3,194
1,294
6,082
3,138
8,446
2,759
△75
63,902
23,260
18,756
2,698
780
5,917
3,097
8,617
3,108
△75
66,161
※3 38,876
※3 39,604
減価償却累計額
建物及び構築物(純額)
機械装置及び運搬具
※1 △28,265
※1 △30,293
10,610
9,310
※3 106,815
※3 109,930
減価償却累計額
機械装置及び運搬具(純額)
工具、器具及び備品
※1 △89,893
※1 △99,567
16,922
10,362
※3 16,834
※3 17,663
減価償却累計額
工具、器具及び備品(純額)
土地
リース資産
減価償却累計額
リース資産(純額)
建設仮勘定
有形固定資産合計
無形固定資産
リース資産
その他
無形固定資産合計
投資その他の資産
投資有価証券
繰延税金資産
退職給付に係る資産
その他
貸倒引当金
投資その他の資産合計
固定資産合計
資産合計
※1 △15,346
※1 △16,296
1,488
※3 13,732
441
△284
156
5,241
48,152
61/126
1,366
※3 13,956
472
△312
159
1,588
36,744
0
1,685
1,685
0
2,016
2,017
※2 5,063
※2 5,202
713
2,293
※2 534
△9
8,595
58,434
122,336
602
3,251
※2 413
△9
9,460
48,222
114,384
EDINET提出書類
大豊工業株式会社(E02199)
有価証券報告書
(単位:百万円)
前連結会計年度
(2025年3月31日)
負債の部
流動負債
支払手形及び買掛金
電子記録債務
短期借入金
1年内返済予定の長期借入金
リース債務
未払費用
未払法人税等
役員賞与引当金
製品保証引当金
資産除去債務
損害補償損失引当金
その他
流動負債合計
固定負債
長期借入金
リース債務
繰延税金負債
退職給付に係る負債
役員退職慰労引当金
資産除去債務
その他
固定負債合計
負債合計
純資産の部
株主資本
資本金
資本剰余金
利益剰余金
自己株式
株主資本合計
その他の包括利益累計額
その他有価証券評価差額金
為替換算調整勘定
退職給付に係る調整累計額
その他の包括利益累計額合計
新株予約権
非支配株主持分
純資産合計
負債純資産合計
62/126
当連結会計年度
(2026年3月31日)
7,826
6,565
446
1,328
39
6,258
390
123
218
−
−
2,182
25,379
8,014
2,446
647
15,439
31
6,489
708
133
181
359
43
3,295
37,789
24,239
63
1,885
527
135
755
67
27,673
53,052
8,782
71
2,225
595
159
324
90
12,250
50,040
6,712
10,164
42,161
△644
58,394
6,712
10,175
35,628
△589
51,926
2,554
6,318
1,335
10,208
69
612
69,283
122,336
2,647
7,193
1,893
11,733
39
644
64,344
114,384
EDINET提出書類
大豊工業株式会社(E02199)
有価証券報告書
②【連結損益計算書及び連結包括利益計算書】
【連結損益計算書】
(単位:百万円)
前連結会計年度
(自 2024年4月1日
至 2025年3月31日)
売上高
売上原価
売上総利益
販売費及び一般管理費
荷造運搬費
役員報酬
従業員給料
賞与
退職給付費用
法定福利費
福利厚生費
役員退職慰労引当金繰入額
役員賞与引当金繰入額
賃借料
旅費及び交通費
減価償却費
研究開発費
その他
販売費及び一般管理費合計
営業利益
営業外収益
受取利息
受取配当金
為替差益
貸倒引当金戻入額
持分法による投資利益
その他
営業外収益合計
営業外費用
支払利息
固定資産除却損
減価償却費
その他
営業外費用合計
経常利益
63/126
当連結会計年度
(自 2025年4月1日
至 2026年3月31日)
112,789
119,378
※1 96,952
※1 101,710
15,837
17,667
1,121
306
3,387
1,146
141
709
524
48
124
183
238
623
※2 3,853
2,815
15,226
610
1,121
307
3,427
1,155
150
710
486
46
135
181
239
680
※2 3,472
2,961
15,078
2,589
89
148
229
81
0
237
787
99
160
417
1
10
195
883
152
164
※3 144
※3 106
140
49
487
910
155
39
465
3,007
EDINET提出書類
大豊工業株式会社(E02199)
有価証券報告書
(単位:百万円)
前連結会計年度
(自 2024年4月1日
至 2025年3月31日)
特別利益
新株予約権戻入益
固定資産売却益
投資有価証券売却益
特別利益合計
特別損失
固定資産売却損
固定資産除却損
投資有価証券評価損
減損損失
製品保証引当金繰入額
抱合せ株式消滅差損
損害補償損失引当金繰入額
その他
特別損失合計
税金等調整前当期純損失(△)
法人税、住民税及び事業税
法人税等調整額
法人税等合計
当期純損失(△)
非支配株主に帰属する当期純利益
親会社株主に帰属する当期純損失(△)
当連結会計年度
(自 2025年4月1日
至 2026年3月31日)
48
25
※4 27
※4 4
166
242
1,662
1,692
※5 5
※5 0
※6 66
※6 3
50
※7 1,462
59
−
−
0
1,644
△490
936
2,642
3,579
△4,070
116
△4,187
64/126
0
※7 9,168
67
10
43
0
9,295
△4,596
1,073
131
1,205
△5,801
166
△5,967
EDINET提出書類
大豊工業株式会社(E02199)
有価証券報告書
【連結包括利益計算書】
(単位:百万円)
前連結会計年度
(自 2024年4月1日
至 2025年3月31日)
当期純損失(△)
その他の包括利益
その他有価証券評価差額金
為替換算調整勘定
退職給付に係る調整額
持分法適用会社に対する持分相当額
その他の包括利益合計
包括利益
(内訳)
親会社株主に係る包括利益
非支配株主に係る包括利益
65/126
当連結会計年度
(自 2025年4月1日
至 2026年3月31日)
△4,070
△5,801
△957
2,191
633
5
※1 1,873
93
902
572
△4
※1 1,564
△2,197
△4,237
△2,365
168
△4,441
204
EDINET提出書類
大豊工業株式会社(E02199)
有価証券報告書
③【連結株主資本等変動計算書】
前連結会計年度(自 2024年4月1日
至
2025年3月31日)
(単位:百万円)
株主資本
資本金
当期首残高
資本剰余金
6,712
利益剰余金
10,165
自己株式
46,929
株主資本合計
△278
63,529
当期変動額
剰余金の配当
親会社株主に帰属する当期
純損失(△)
△578
△578
△4,187
△4,187
自己株式の取得
自己株式の処分
△0
海外連結子会社における
従業員奨励福利基金への
積立金
△373
△373
7
6
△2
△2
株主資本以外の項目の
当期変動額(純額)
当期変動額合計
当期末残高
6,712
△0
△4,768
△365
△5,134
10,164
42,161
△644
58,394
その他の包括利益累計額
その他
有価証券
評価差額金
当期首残高
3,512
為替換算調整退職給付に係る
勘定
調整累計額
4,153
721
その他の
包括利益
累計額合計
新株予約権
非支配株主持分
純資産合計
8,386
93
577
72,587
当期変動額
剰余金の配当
△578
親会社株主に帰属する当期
純損失(△)
△4,187
自己株式の取得
△373
自己株式の処分
6
海外連結子会社における
従業員奨励福利基金への
積立金
株主資本以外の項目の
当期変動額(純額)
△2
△957
2,164
614
1,821
△24
35
1,831
当期変動額合計
△957
2,164
614
1,821
△24
35
△3,303
当期末残高
2,554
6,318
1,335
10,208
69
612
69,283
66/126
EDINET提出書類
大豊工業株式会社(E02199)
有価証券報告書
当連結会計年度(自
2025年4月1日
至
2026年3月31日)
(単位:百万円)
株主資本
資本金
当期首残高
資本剰余金
6,712
利益剰余金
10,164
自己株式
42,161
株主資本合計
△644
58,394
当期変動額
剰余金の配当
親会社株主に帰属する当期
純損失(△)
△566
△566
△5,967
△5,967
自己株式の取得
自己株式の処分
10
△0
△0
55
66
海外連結子会社における
従業員奨励福利基金への
積立金
株主資本以外の項目の
当期変動額(純額)
当期変動額合計
当期末残高
6,712
10
△6,533
55
△6,467
10,175
35,628
△589
51,926
その他の包括利益累計額
その他
有価証券
評価差額金
当期首残高
2,554
為替換算調整退職給付に係る
勘定
調整累計額
6,318
1,335
その他の
包括利益
累計額合計
新株予約権
非支配株主持分
純資産合計
10,208
69
612
69,283
当期変動額
剰余金の配当
△566
親会社株主に帰属する当期
純損失(△)
△5,967
自己株式の取得
△0
自己株式の処分
66
海外連結子会社における
従業員奨励福利基金への
積立金
株主資本以外の項目の
当期変動額(純額)
当期変動額合計
当期末残高
93
874
557
1,525
△29
32
1,528
93
874
557
1,525
△29
32
△4,939
2,647
7,193
1,893
11,733
39
644
64,344
67/126
EDINET提出書類
大豊工業株式会社(E02199)
有価証券報告書
④【連結キャッシュ・フロー計算書】
(単位:百万円)
前連結会計年度
(自 2024年4月1日
至 2025年3月31日)
営業活動によるキャッシュ・フロー
税金等調整前当期純損失(△)
減価償却費
減損損失
退職給付に係る負債の増減額(△は減少)
退職給付に係る資産の増減額(△は増加)
役員退職慰労引当金の増減額(△は減少)
役員賞与引当金の増減額(△は減少)
製品保証引当金の増減額(△は減少)
貸倒引当金の増減額(△は減少)
受取利息及び受取配当金
支払利息
投資有価証券売却損益(△は益)
投資有価証券評価損益(△は益)
固定資産除却損
固定資産売却損益(△は益)
持分法による投資損益(△は益)
売上債権の増減額(△は増加)
契約資産の増減額(△は増加)
棚卸資産の増減額(△は増加)
仕入債務の増減額(△は減少)
未払消費税等の増減額(△は減少)
その他
小計
利息及び配当金の受取額
利息の支払額
法人税等の支払額
営業活動によるキャッシュ・フロー
△490
7,256
1,462
68
△90
△44
△8
△184
△126
△237
152
△165
50
211
△22
△0
239
△175
△1,063
1,408
△693
△338
7,207
227
△155
△1,033
6,245
68/126
当連結会計年度
(自 2025年4月1日
至 2026年3月31日)
△4,596
7,164
9,168
25
△89
24
10
△36
△2
△259
164
△1,661
0
109
△4
△10
1,172
514
381
△4,086
1,005
142
9,139
261
△155
△778
8,467
EDINET提出書類
大豊工業株式会社(E02199)
有価証券報告書
(単位:百万円)
前連結会計年度
(自 2024年4月1日
至 2025年3月31日)
投資活動によるキャッシュ・フロー
定期預金の預入による支出
定期預金の払戻による収入
有形固定資産の取得による支出
有形固定資産の売却による収入
投資有価証券の売却による収入
貸付けによる支出
貸付金の回収による収入
その他
投資活動によるキャッシュ・フロー
財務活動によるキャッシュ・フロー
短期借入れによる収入
短期借入金の返済による支出
長期借入れによる収入
長期借入金の返済による支出
ストック・オプションの行使による収入
自己株式の取得による支出
ファイナンス・リース債務の返済による支出
配当金の支払額
非支配株主への配当金の支払額
財務活動によるキャッシュ・フロー
現金及び現金同等物に係る換算差額
現金及び現金同等物の増減額(△は減少)
現金及び現金同等物の期首残高
現金及び現金同等物の期末残高
69/126
当連結会計年度
(自 2025年4月1日
至 2026年3月31日)
△254
262
△10,069
63
168
△0
46
△417
△10,201
△2,269
18
△4,554
34
1,684
△3
81
△760
△5,768
711
△618
8,000
△4,905
5
△373
△36
△578
△133
2,071
690
△1,193
20,046
※1 18,852
754
△679
−
△1,417
55
△0
△34
△566
△169
△2,056
192
835
18,852
※1 19,687
EDINET提出書類
大豊工業株式会社(E02199)
有価証券報告書
【注記事項】
(連結財務諸表作成のための基本となる重要な事項)
1 連結の範囲に関する事項
① 連結子会社
国内子会社は、大豊精機(株)、日本ガスケット(株)、(株)ティーイーティー、(株)タイホウラ
イフサービスの4社であり、海外子会社は、タイホウ コーポレーション オブ アメリカ、タイホウ
ヌサンタラ(株)、タイホウ コーポレーション オブ ヨーロッパ(有)、韓国大豊(株)、大豊工業
(煙台)有限公司、タイホウ コーポレーション オブ タイランド(株)、常州恒業軸瓦材料有限公
司、タイホウ マニュファクチャリング オブ テネシー(株)、ニッポンガスケット タイランド
(株)、YANTAI NIPPON GASKET CO.,LTD.の10社であり、それらの14社を連結の範囲に含めております。
②
非連結子会社
非連結子会社の名称
天津大豊精機汽車設備有限公司
なお、非連結子会社であった(株)豊和産業は2026年1月1日を効力発生日として大豊精機(株)を吸収合
併存続会社とする吸収合併により消滅し、子会社ではなくなりました。
連結の範囲から除いた理由
上記非連結子会社は、小規模であり、総資産、売上高、当期純損益及び利益剰余金等は、連結財務諸
表に重要な影響を及ぼしていないため、連結の範囲から除外しております。
2
持分法の適用に関する事項
① 持分法を適用した関連会社
アストラニッポンガスケットインドネシア(株)であります。
② 持分法を適用しない非連結子会社
非連結子会社の名称
天津大豊精機汽車設備有限公司
持分法を適用しない理由
上記非連結子会社は、小規模であり、当期純損益及び利益剰余金等は、連結財務諸表に重要な影響を
及ぼしていないため、持分法の適用から除外しております。
③ 持分法適用会社のうち、決算日が連結決算日と異なる会社については、各社の事業年度に係る財務諸表
を使用しております。
3
連結子会社の事業年度等に関する事項
連結子会社のうち、国内連結子会社の決算日は当社の決算日と同じであります。また、海外連結子会社の
決算日は、12月31日であります。
連結財務諸表の作成に当たっては、決算日の差異が3ヶ月を超えていないため、同決算日現在の財務諸表
を使用し、連結決算日との間に生じた重要な取引については、連結上必要な調整を行っております。
4
会計方針に関する事項
(1)重要な資産の評価基準及び評価方法
① 有価証券の評価基準及び評価方法
・その他有価証券
市場価格のない株式等以外のもの
…期末決算日の市場価格等に基づく時価法(評価差額は全部純資産直入法により処理し、売却原価は
主として移動平均法により算定)
市場価格のない株式等
…主として移動平均法による原価法
70/126
EDINET提出書類
大豊工業株式会社(E02199)
有価証券報告書
②
棚卸資産の評価基準及び評価方法
評価基準は原価法(貸借対照表価額は収益性の低下に基づく簿価切下げの方法)によっております。
製品及び仕掛品
当社及び国内連結子会社は主として下記によっております。
自動車部品関連事業
総平均法
自動車製造用設備関連事業
個別法
海外連結子会社
主として先入先出法
原材料
当社
総平均法
国内連結子会社
主として総平均法
海外連結子会社
主として先入先出法
貯蔵品
当社
先入先出法
国内連結子会社
主として先入先出法
海外連結子会社
主として先入先出法
(2)重要な減価償却資産の減価償却の方法
① 有形固定資産(リース資産を除く)
当社及び国内連結子会社は主として定率法によっております。
なお、耐用年数及び残存価額については、法人税法に規定する方法と同一の基準によっております。
海外連結子会社は定額法によっております。
② 無形固定資産(リース資産を除く)
定額法によっております。
なお、ソフトウエア(自社利用分)については、社内における利用可能期間(主として5年)に基づ
く定額法によっております。
③ リース資産
所有権移転外ファイナンス・リース取引に係るリース資産
リース期間を耐用年数とし、残存価額をゼロとする定額法によっております。
(3)重要な引当金の計上基準
① 貸倒引当金
当社、国内連結子会社及び一部の海外連結子会社は、期末現在の売上債権等の貸倒れによる損失に備
えるために、一般債権については、貸倒実績率等により、貸倒懸念債権等特定の債権については、個別
に回収可能性を検討し回収不能見込額を計上しております。
② 役員退職慰労引当金
国内連結子会社は、役員の退職慰労金の支出に備えるため、内規に基づく連結会計年度末要支給額を
残高基準として計上しております。
③ 役員賞与引当金
当社及び国内連結子会社は、役員に対して支給する賞与の支出に充てるため、当連結会計年度におけ
る支給見込額に基づき、当連結会計年度に見合う分を計上しております。
④ 製品保証引当金
主に製品の品質に関する保証費用の支出に備えるため、今後必要と見込まれる金額を計上しておりま
す。
⑤ 損害補償損失引当金
一部の国内連結子会社は、将来の損害補償損失に備えるため、当連結会計年度末において発生の可能
性が高く、かつ、損失の金額を合理的に見積もることが可能なものについて、その損失見込額を計上し
ております。
(4)重要な収益及び費用の計上基準
当社の顧客との契約から生じる収益に関する主要な事業における主な履行義務の内容及び当該履行義務
を充足する通常の時点(収益を認識する通常の時点)は以下のとおりであります。
71/126
EDINET提出書類
大豊工業株式会社(E02199)
有価証券報告書
①
自動車部品関連事業
各種自動車部品の製造・販売を主な事業とし、これらの製品の販売については引渡時点において顧客
が当該製品に対する支配を獲得し、履行義務が充足されると判断していることから、製品の引渡時点で
収益を認識しております。ただし、主な製品の国内の販売については、出荷時から当該製品の支配が顧
客に移転されるまでの期間が通常の期間であるため、出荷時点で収益を認識しております。
また、収益は顧客との契約において約束された対価で測定しております。取引の対価は履行義務を充
足してから1年以内に受領しており、重要な金融要素は含まれておりません。
② 自動車製造用設備関連事業
主に自動車製造用設備の製造及び販売にかかる工事契約を締結し、当該契約については一定の期間に
わたり履行義務が充足されると判断し、履行義務の充足に係る進捗度に基づき収益を認識しておりま
す。
また、少額または工期がごく短い工事については、完全に履行義務を充足する顧客が検収した時点で
収益を認識しております。進捗度の測定は、各報告期間の期末日までに発生した工事原価が、予想され
る工事原価の合計に占める割合に基づいて行っております。
(5)退職給付に係る会計処理の方法
① 退職給付見込額の期間帰属方法
退職給付債務の算定にあたり、退職給付見込額を当連結会計年度末までの期間に帰属させる方法につ
いては、給付算定式基準によっております。
② 数理計算上の差異、過去勤務費用の費用処理方法
過去勤務費用については、その発生時における従業員の平均残存勤務期間以内の一定の年数(12〜14
年)による定額法により費用処理しております。
数理計算上の差異については、各連結会計年度の発生時における従業員の平均残存勤務期間以内の一
定の年数(12〜14年)による定額法により按分した額をそれぞれ発生の翌連結会計年度から費用処理し
ております。
③ 未認識数理計算上の差異および未認識過去勤務費用の会計処理方法
未認識数理計算上の差異および未認識過去勤務費用については、税効果を調整の上、純資産の部にお
けるその他の包括利益累計額の退職給付に係る調整累計額に計上しております。
(6)重要な外貨建の資産又は負債の本邦通貨への換算の基準
外貨建金銭債権債務は、決算日の直物為替相場により円貨に換算し、換算差額は損益として処理して
おります。なお、海外連結子会社等の資産、負債は、決算日の直物為替相場により円貨に換算、収益及
び費用は、期中平均相場により円貨に換算し、換算差額は非支配株主持分及び純資産の部における為替
換算調整勘定に含めております。
(7)連結キャッシュ・フロー計算書における資金の範囲
手許現金、要求払預金及び取得日から3ヶ月以内に満期日又は償還日の到来する流動性の高い、容易
に換金可能であり、かつ、価値の変動について僅少なリスクしか負わない短期的な投資からなっており
ます。
72/126
EDINET提出書類
大豊工業株式会社(E02199)
有価証券報告書
(会計方針の変更)
該当事項はありません。
(会計上の見積りの変更)
(退職給付に係る会計処理の数理計算上の差異及び過去勤務費用の費用処理年数の変更)
退職給付に係る会計処理の数理計算上の差異及び過去勤務費用の費用処理年数について、従来、従業員の平均
残存勤務期間以内の一定年数として、数理計算上の差異は12〜17年、過去勤務費用は17〜18年で費用処理してお
りましたが、平均残存勤務期間がこれを下回ったため、当連結会計年度より費用処理年数を、数理計算上の差異
は12〜14年、過去勤務費用は12〜14年に変更しております。
この変更による当連結会計年度の損益に与える影響は軽微であります。
(未適用の会計基準等)
1.リースに関する会計基準等
・「リースに関する会計基準」(企業会計基準第34号 2024年9月13日企業会計基準委員会)
・「リースに関する会計基準の適用指針」(企業会計基準適用指針第33号 2024年9月13日企業会計基準委
員会) 等
(1)概要
企業会計基準委員会において、日本基準を国際的に整合性のあるものとする取組みの一環として、借手の
全てのリースについて資産及び負債を認識するリースに関する会計基準の開発に向けて、国際的な会計基準
を踏まえた検討が行われ、基本的な方針として、IFRS第16号の単一の会計処理モデルを基礎とするものの、
IFRS第16号の全ての定めを採り入れるのではなく、主要な定めのみを採り入れることにより、簡素で利便性
が高く、かつ、IFRS第16号の定めを個別財務諸表に用いても、基本的に修正が不要となることを目指した
リース会計基準等が公表されました。
借手の会計処理として、借手のリースの費用配分の方法については、IFRS第16号と同様に、リースがファ
イナンス・リースであるかオペレーティング・リースであるかにかかわらず、全てのリースについて使用権
資産に係る減価償却費及びリース負債に係る利息相当額を計上する単一の会計処理モデルが適用されます。
(2)適用予定日
2028年3月期の期首から適用します。
(3)当該会計基準等の適用による影響
「リースに関する会計基準」等の適用による連結財務諸表に与える影響額については、現時点で評価中で
あります。
2.後発事象に関する会計基準等
・「後発事象に関する会計基準」(企業会計基準第41号 2026年1月9日企業会計基準委員会)
・「後発事象に関する会計基準の適用指針」(企業会計基準適用指針第35号 2026年1月9日企業会計基準
委員会)
(1)概要
「後発事象に関する会計基準」等は、後発事象の定義、会計処理及び開示等を取り扱う包括的な会計基準
を設定することを優先的な課題とし、日本公認会計士協会監査・保証基準委員会監査基準報告書560
実務指針第1号「後発事象に関する監査上の取扱い」で示されている会計に関する内容を原則として踏襲
して企業会計基準委員会に移管することを基本的な方針として、表現の見直し及び後発事象の評価期間の
整理を行うとともに、財務諸表の公表の承認に関する注記を新たに求める等、後発事象に関する会計処理
及び開示について定めたものであります。
(2)適用予定日
2028年3月期の期首から適用します。
73/126
EDINET提出書類
大豊工業株式会社(E02199)
有価証券報告書
(重要な会計上の見積り)
1.減損損失
(1)当連結会計年度の連結財務諸表に計上した金額
(単位:百万円)
前連結会計年度
減損損失
当連結会計年度
750
9,168
(2)識別した項目に係る重要な会計上の見積りに関する情報
①見積りの算出方法
減損損失の認識の判定は、各セグメント内における製品別の将来キャッシュ・フローの見積りを使用して
おります。
事業用資産について各セグメント内の製品別にグルーピングを行っております。減損の兆候が把握された
資産グループについては、将来キャッシュ・フローを見積り、割引前将来キャッシュ・フローの総額が当該
事業区分の固定資産の帳簿価額を下回り減損損失の認識が必要と判定された場合、帳簿価額を回収可能価額
まで減額し、当該減少額は減損損失として認識します。
②主要な仮定
減損の兆候を識別した資産グループの割引前将来キャッシュ・フローの見積りは、資産グループごとの将
来計画に基づいております。資産グループごとの将来計画は、製品の売上高の予測から変動費や固定費など
の各種費用の予測を控除して算定しております。また、減損の兆候を識別した資産グループの割引前将来
キャッシュ・フローの見積りの算定には設備投資に関連する将来キャッシュ・フローも含めております。
製品の売上高の予測を主要な仮定としており、製品の売上高の予測は顧客の生産計画等を基礎として算出
しております。生産計画等は主要顧客における自動車生産台数の見通しに影響を受けることになります。
③翌連結会計年度の連結財務諸表に与える影響
当社グループを取り巻く事業環境は先行き不透明な状況が存在していることから、主要顧客の自動車生産
台数の見通しの変化等により、翌連結会計年度以降の見通しが大きく異なった場合には、翌連結会計年度の
減損損失に影響を与える可能性があります。
2.繰延税金資産
(1)当連結会計年度の連結財務諸表に計上した金額
(単位:百万円)
前連結会計年度
繰延税金資産
当連結会計年度
713
602
(2)識別した項目に係る重要な会計上の見積りに関する情報
①見積りの算出方法
収益力に基づく一時差異等加減算前課税所得に基づき、将来の税負担を軽減する効果を有する範囲内で繰
延税金資産を計上しております。
②主要な仮定
収益力に基づく一時差異等加減算前課税所得は、将来計画に基づいております。将来計画は製品の売上高
の予測から変動費や固定費などの各種費用の予測を控除して算定しております。また、製品の売上高の予測
を主要な仮定としており、製品の売上高の予測は顧客の生産計画等を基礎として算出しております。
③翌連結会計年度の連結財務諸表に与える影響
翌連結会計年度以降の売上高の予測の仮定が顧客の生産計画等の変化により大きく異なった場合には、翌
連結会計年度の繰延税金資産及び法人税等調整額の増減に影響を与える可能性があります。
74/126
EDINET提出書類
大豊工業株式会社(E02199)
有価証券報告書
3.製品保証引当金
(1)当連結会計年度の連結財務諸表に計上した金額
(単位:百万円)
前連結会計年度
製品保証引当金
当連結会計年度
218
181
(2)識別した項目に係る重要な会計上の見積りに関する情報
①見積りの算出方法
主に製品の品質に関する保証費用の支出に備えるため、今後必要と見込まれる金額を計上しております。
②主要な仮定
保証費用は、対象となる交換台数、交換費用等を主要な仮定として、入手可能な情報に基づき見積り計上
をしております。
③翌連結会計年度の連結財務諸表に与える影響
見積り計上にあたっての上記前提条件は不確実性の高い将来情報であり、予測不能な前提条件の変化等に
より、実際の保証費用と異なる場合があり、製品保証引当金の追加計上又は戻入が必要となる可能性があり
ます。
(表示方法の変更)
(連結キャッシュ・フロー計算書関係)
前連結会計年度において、「営業活動によるキャッシュ・フロー」の「売上債権の増減額 (△は増加)」に
含めて表示していた「契約資産の増減額(△は増加)」は、開示の明瞭性を高める観点から当連結会計年度より
独立して表示しております。この表示方法の変更を反映させるため、前連結会計年度の連結財務諸表の組替えを
行っております。
この結果、前連結会計年度の連結キャッシュ・フロー計算書において「営業活動によるキャッシュ・フロー」
の「売上債権の増減額(△は増加)」に表示していた64百万円は、「売上債権の増減額(△は増加)」239百万
円および「契約資産の増減額(△は増加)」△175百万円として組替えております。
※1
(連結貸借対照表関係)
有形固定資産の減価償却累計額には、減損損失累計額が含まれております。
※2
非連結子会社及び関連会社に対するものは、次のとおりであります。
前連結会計年度
(2025年3月31日)
投資有価証券(株式)
(うち、共同支配企業に対する投資の金額)
投資その他の資産その他(出資金)
※3
257百万円
257百万円
95百万円
266百万円
266百万円
95百万円
国庫補助金等に係る資産の取得価額の直接圧縮累計額
前連結会計年度
(2025年3月31日)
建物及び構築物
機械装置及び運搬具
工具、器具及び備品
土地
4
当連結会計年度
(2026年3月31日)
208百万円
190百万円
0百万円
50百万円
当連結会計年度
(2026年3月31日)
208百万円
190百万円
0百万円
50百万円
保証債務
連結会社以外の会社の金融機関からの借入に対して、債務保証を行っております。
前連結会計年度
(2025年3月31日)
(株)豊和産業
156百万円
75/126
当連結会計年度
(2026年3月31日)
―百万円
EDINET提出書類
大豊工業株式会社(E02199)
有価証券報告書
※1
(連結損益計算書関係)
棚卸資産の収益性の低下による簿価切下額
前連結会計年度
(自 2024年4月1日
至 2025年3月31日)
売上原価
※2
589百万円
一般管理費
機械装置及び運搬具
その他
計
当連結会計年度
2025年4月1日
2026年3月31日)
(自
至
128百万円
16百万円
50百万円
56百万円
144百万円
106百万円
固定資産売却益(特別利益)の内容
前連結会計年度
2024年4月1日
2025年3月31日)
(自
至
機械装置及び運搬具
その他
計
当連結会計年度
2025年4月1日
2026年3月31日)
(自
至
24百万円
3百万円
3百万円
0百万円
27百万円
4百万円
固定資産売却損(特別損失)の内訳
前連結会計年度
2024年4月1日
2025年3月31日)
(自
至
機械装置及び運搬具
その他
計
※6
3,472百万円
固定資産除却損(営業外費用)の内容
前連結会計年度
2024年4月1日
2025年3月31日)
※5
当連結会計年度
(自 2025年4月1日
至 2026年3月31日)
3,853百万円
(自
至
※4
490百万円
一般管理費及び当期製造費用に含まれる研究開発費の総額は、次のとおりであります。
前連結会計年度
(自 2024年4月1日
至 2025年3月31日)
※3
当連結会計年度
(自 2025年4月1日
至 2026年3月31日)
当連結会計年度
2025年4月1日
2026年3月31日)
(自
至
−百万円
5百万円
0百万円
0百万円
5百万円
0百万円
固定資産除却損(特別損失)の内訳
前連結会計年度
2024年4月1日
2025年3月31日)
(自
至
建物及び構築物
機械装置及び運搬具
その他
計
76/126
当連結会計年度
2025年4月1日
2026年3月31日)
(自
至
65百万円
0百万円
0百万円
3百万円
−百万円
0百万円
66百万円
3百万円
EDINET提出書類
大豊工業株式会社(E02199)
有価証券報告書
※7 減損損失
前連結会計年度(自
2024年4月1日
至
2025年3月31日)
以下の資産グループについて減損損失を計上しております。
場所
用途
種類
大豊工業株式会社
(愛知県豊田市)
事業用資産
建物及び構築物
金額
712百万円
当社の2025年3月26日開催の取締役会において、環境対策のための工事計画が承認され、当該工事計画の決定に
基づき減損損失を計上しております。
場所
大豊精機株式会社
(愛知県豊田市)
用途
種類
事業用資産
建物及び構築物
機械装置及び運搬具
工具、器具及び備品
土地
建設仮勘定
金額
249百万円
190百万円
50百万円
20百万円
239百万円
当社グループは、事業用資産を各セグメント内の製品別にグルーピングしております。
前連結会計年度では、当社グループ連結子会社である大豊精機株式会社の自動車部品関連セグメントにおい
て、事業環境の変化を背景とした受注の減少により収益性の低下が見込まれることから、減損の兆候を識別し、
対象となる固定資産について減損の判定を行いました。その結果、当セグメント内の資産グループについては、
割引前将来キャッシュ・フローの総額が帳簿価額を下回ると判断したため、帳簿価額を回収可能価額まで減額
し、当該減少額を減損損失として計上しております。
なお、回収可能価額は正味売却価額により算定しております。正味売却価額は外部専門家から入手した不動産鑑
定評価額等を用いて合理的に算出しており、他への転用や売却が困難な資産等については、備忘価額により評価
しております
当連結会計年度(自
2025年4月1日
至
2026年3月31日)
当社グループが計上した減損損失のうち、主なものは以下のとおりです。
場所
大豊工業株式会社
(愛知県豊田市)
用途
種類
事業用資産
建物及び構築物
機械装置及び運搬具
工具、器具及び備品
建設仮勘定
金額
856百万円
6,738百万円
375百万円
1,152百万円
当社グループは、事業用資産を各セグメント内の製品別にグルーピングしております。
当社の自動車部品関連セグメントの非軸受製品(ダイカスト製品等)に係る資産グループについては、事業環
境の変化を背景とした将来の見通しにおいて、受注の減少に伴う収益性の低下が見込まれることから、割引前将
来キャッシュ・フローの総額が帳簿価額を下回ると判断したため、帳簿価額を回収可能価額まで減額し、当該減
少額を減損損失として計上しております。計上された減損損失は連結調整後の金額であります。
回収可能価額は正味売却価額により算定しております。正味売却価額は外部専門家から入手した不動産鑑定評
価額等を用いて合理的に算出しており、他への転用や売却が困難な資産等については、備忘価額により評価して
おります。
77/126
EDINET提出書類
大豊工業株式会社(E02199)
有価証券報告書
(連結包括利益計算書関係)
※1 その他の包括利益に係る組替調整額並びに法人税等及び税効果額
前連結会計年度
(自 2024年4月1日
至 2025年3月31日)
当連結会計年度
2025年4月1日
2026年3月31日)
(自
至
その他有価証券評価差額金
当期発生額
△1,338百万円
1,814百万円
組替調整額
−百万円
△1,659百万円
△1,338百万円
381百万円
154百万円
△61百万円
△957百万円
93百万円
2,191百万円
902百万円
2,191百万円
902百万円
法人税等及び税効果調整前
法人税等及び税効果額
その他有価証券評価差額金
為替換算調整勘定
当期発生額
為替換算調整勘定
退職給付に係る調整額
当期発生額
906百万円
883百万円
組替調整額
23百万円
△50百万円
法人税等及び税効果額
929百万円
△295百万円
832百万円
△259百万円
退職給付に係る調整額
633百万円
572百万円
5百万円
△4百万円
5百万円
△4百万円
1,873百万円
1,564百万円
法人税等及び税効果調整前
持分法適用会社に対する持分相当額
当期発生額
持分法適用会社に対する持分相当額
その他の包括利益合計
78/126
EDINET提出書類
大豊工業株式会社(E02199)
有価証券報告書
(連結株主資本等変動計算書関係)
前連結会計年度(自 2024年4月1日
1 発行済株式に関する事項
株式の種類
当連結会計年度期首
普通株式(株)
29,172,457
2
至
2025年3月31日)
増加
減少
当連結会計年度末
−
−
29,172,457
自己株式に関する事項
株式の種類
当連結会計年度期首
普通株式(株)
271,888
増加
減少
600,302
(変動事由の概要)
取締役会の決議に基づく取得による増加
単元未満株式の買取りによる増加
ストック・オプションの権利行使による減少
3
当連結会計年度末
10,000
862,190
600,000株
302株
10,000株
新株予約権等に関する事項
目的となる株式の数(株)
会社名
目的となる
株式の種類
内訳
ストック・オプション
としての新株予約権
提出会社
当連結会計
年度期首
−
増加
減少
当連結会計
年度末残高
当連結会計
(百万円)
年度末
−
−
−
−
69
−
−
−
−
69
1株当たり配当額
(円)
基準日
効力発生日
合計
4
配当に関する事項
(1)配当金支払額
決議
株式の種類
配当金の総額
(百万円)
2024年4月25日
取締役会
普通株式
289
10
2024年3月31日
2024年6月5日
2024年10月30日
取締役会
普通株式
289
10
2024年9月30日
2024年11月26日
(2)基準日が当連結会計年度に属する配当のうち、配当の効力発生日が翌連結会計年度となるもの
決議
株式の種類
配当の原資
配当金の総額
(百万円)
1株当たり配
当額(円)
2025年4月24日
取締役会
普通株式
利益剰余金
283
10
79/126
基準日
効力発生日
2025年3月31日
2025年6月4日
EDINET提出書類
大豊工業株式会社(E02199)
有価証券報告書
当連結会計年度(自 2025年4月1日
1 発行済株式に関する事項
株式の種類
当連結会計年度期首
普通株式(株)
29,172,457
2
至
2026年3月31日)
増加
減少
当連結会計年度末
−
−
29,172,457
自己株式に関する事項
株式の種類
当連結会計年度期首
普通株式(株)
862,190
増加
減少
10
(変動事由の概要)
単元未満株式の買取りによる増加
ストック・オプションの権利行使による減少
3
当連結会計年度末
79,000
783,200
10株
79,000株
新株予約権等に関する事項
目的となる株式の数(株)
会社名
目的となる
株式の種類
内訳
ストック・オプション
としての新株予約権
提出会社
当連結会計
年度期首
−
増加
減少
当連結会計
年度末残高
当連結会計
(百万円)
年度末
−
−
−
−
39
−
−
−
−
39
1株当たり配当額
(円)
基準日
効力発生日
合計
4
配当に関する事項
(1)配当金支払額
決議
株式の種類
配当金の総額
(百万円)
2025年4月24日
取締役会
普通株式
283
10
2025年3月31日
2025年6月4日
2025年10月30日
取締役会
普通株式
283
10
2025年9月30日
2025年11月26日
(2)基準日が当連結会計年度に属する配当のうち、配当の効力発生日が翌連結会計年度となるもの
決議
株式の種類
配当の原資
配当金の総額
(百万円)
1株当たり配
当額(円)
2026年4月27日
取締役会
普通株式
利益剰余金
511
18
基準日
効力発生日
2026年3月31日
2026年6月5日
(連結キャッシュ・フロー計算書関係)
※1 現金及び現金同等物の期末残高と連結貸借対照表に掲記されている科目の金額との関係は、次のとおり
であります。
前連結会計年度
(自 2024年4月1日
至 2025年3月31日)
当連結会計年度
2025年4月1日
2026年3月31日)
(自
至
現金及び預金勘定
19,952百万円
23,260百万円
預入期間が3ヶ月を超える定期預金、定期積金
△1,099百万円
△3,573百万円
現金及び現金同等物
18,852百万円
19,687百万円
80/126
EDINET提出書類
大豊工業株式会社(E02199)
有価証券報告書
(リース取引関係)
1 ファイナンス・リース取引
(借主側)
所有権移転外ファイナンス・リース取引
① リース資産の内容
主として、連結財務諸表提出会社における機械装置及び運搬具であります。
② リース資産の減価償却の方法
リース期間を耐用年数とし、残存価額を零とする定額法によっております。
2
オペレーティング・リース取引
(借主側)
オペレーティング・リース取引のうち解約不能のものに係る未経過リース料
(単位:百万円)
前連結会計年度
(2025年3月31日)
当連結会計年度
(2026年3月31日)
1年内
36
45
1年超
40
130
77
175
合計
81/126
EDINET提出書類
大豊工業株式会社(E02199)
有価証券報告書
(金融商品関係)
1.金融商品の状況に関する事項
(1)金融商品に対する取組方針
当社グループは、自動車部品事業及び自動車製造用設備事業を行うための設備投資計画に照らして、必
要な資金(主に銀行借入)を調達しております。一時的な余資については主に短期的な預金等で資金運用
し、また、短期的な運転資金については銀行借入により調達しております。
(2)金融商品の内容及びそのリスク並びにリスク管理体制
営業債権である受取手形及び売掛金、電子記録債権、未収入金は、顧客の信用リスクに晒されていま
す。当該リスクに関しては、当社グループの販売管理規程に従い、取引先ごとの期日管理及び残高管理を
行うとともに、財務状況等の悪化等による回収懸念の早期把握や軽減を図っております。連結子会社につ
いても、当社の販売管理規程に準じて、同様の管理を行っております。
投資有価証券である株式は、市場価格の変動リスクに晒されていますが、主に業務上の関係を有する企
業の株式であり、定期的に取引先の市場環境や財務状況などをモニタリングしております。
営業債務である支払手形及び買掛金、電子記録債務、未払金は、そのすべてが1年以内の支払期日で
す。
借入金のうち、短期借入金は主に運転資金に係る資金調達であり、長期借入金(原則として5年以内)
は主に設備投資に係る資金調達です。
また、営業債務や借入金は、流動性リスク(支払期日に支払いを実行できなくなるリスク)に晒されて
いますが、当社グループでは、各社が月次に資金繰計画を作成するなどの方法により管理しております。
(3)金融商品の時価等に関する事項についての補足説明
金融商品の時価の算定においては変動要因を織り込んでいるため、異なる前提条件等を採用することに
より、当該価額が変動することもあります。
(4)信用リスクの集中
当期の連結決算日現在における営業債権のうち17.9%が特定の大口顧客に対するものでありますが、格
付の高い信用できる企業でありますので、信用リスクがあるとは考えておりません。
2.金融商品の時価等に関する事項
連結貸借対照表計上額、時価及びこれらの差額については、次のとおりであります。
前連結会計年度(2025年3月31日)
連結貸借対照表計上額
(百万円)
時価(百万円)
差額(百万円)
(1)投資有価証券(*2)
4,571
4,571
−
資産計
4,571
4,571
−
(1)1年以内返済予定の長期借入金
1,328
1,318
△10
(2)長期借入金
24,239
23,768
△471
25,567
25,086
△481
負債計
82/126
EDINET提出書類
大豊工業株式会社(E02199)
有価証券報告書
当連結会計年度(2026年3月31日)
連結貸借対照表計上額
(百万円)
時価(百万円)
差額(百万円)
(1)投資有価証券(*2)
4,705
4,705
−
資産計
4,705
4,705
−
(1)1年以内返済予定の長期借入金
15,439
15,372
△67
(2)長期借入金
8,782
8,574
△208
24,221
23,946
△275
負債計
(*1)「現金及び預金」については、現金であること、及び預金が短期間で決済されるため時価が帳簿価額に近似す
るものであることから、注記を省略しております。また、「受取手形及び売掛金」、「電子記録債権」、「未
収入金」、「支払手形及び買掛金」、「電子記録債務」、「未払金」及び「短期借入金」は短期間で決済され
るため時価が帳簿価額に近似するものであることから、注記を省略しております。
(*2) 市場価格のない株式等は、「(1)投資有価証券」には含まれておりません。当該金融商品の連結貸借対照表
計上額は以下のとおりであります。
前連結会計年度
(百万円)
区分
非上場株式
(注)1
当連結会計年度
(百万円)
492
496
金銭債権の連結決算日後の償還予定額
前連結会計年度(2025年3月31日)
1年以内
(百万円)
1年超
5年以内
(百万円)
5年超
10年以内
(百万円)
10年超
(百万円)
現金及び預金
19,952
−
−
−
受取手形及び売掛金
19,109
−
−
−
電子記録債権
3,194
−
−
−
未収入金
1,522
−
−
−
43,777
−
−
−
合計
当連結会計年度(2026年3月31日)
1年以内
(百万円)
1年超
5年以内
(百万円)
5年超
10年以内
(百万円)
10年超
(百万円)
現金及び預金
23,260
−
−
−
受取手形及び売掛金
18,756
−
−
−
電子記録債権
2,698
−
−
−
未収入金
1,316
−
−
−
46,032
−
−
−
合計
83/126
EDINET提出書類
大豊工業株式会社(E02199)
有価証券報告書
(注)2
短期借入金、1年以内返済予定の長期借入金及び長期借入金の連結決算日後の返済予定額
前連結会計年度(2025年3月31日)
区分
短期借入金
1年以内返済予定の長
期借入金
長期借入金
合計
1年以内
(百万円)
1年超
2年以内
(百万円)
2年超
3年以内
(百万円)
3年超
4年以内
(百万円)
4年超
5年以内
(百万円)
5年超
(百万円)
446
−
−
−
−
−
1,328
−
−
−
−
−
−
16,239
5,000
3,000
−
−
1,774
16,239
5,000
3,000
−
−
1年以内
(百万円)
1年超
2年以内
(百万円)
2年超
3年以内
(百万円)
3年超
4年以内
(百万円)
4年超
5年以内
(百万円)
5年超
(百万円)
647
−
−
−
−
−
15,439
−
−
−
−
−
−
5,782
3,000
−
−
−
16,086
5,782
3,000
−
−
−
当連結会計年度(2026年3月31日)
区分
短期借入金
1年以内返済予定の長
期借入金
長期借入金
合計
3.金融商品の時価のレベルごとの内訳等に関する事項
金融商品の時価を、時価の算定に用いたインプットの観察可能性及び重要性に応じて、以下の3つのレベ
ルに分類しております。
レベル1の時価:同一の資産又は負債の活発な市場における(無調整の)相場価格により算定した時価
レベル2の時価:レベル1のインプット以外の直接又は間接的に観察可能なインプットを用いて算定した
時価
レベル3の時価:重要な観察できないインプットを使用して算定した時価
時価の算定に重要な影響を与えるインプットを複数使用している場合には、それらのインプットがそれぞ
れ属するレベルのうち、時価の算定における優先順位が最も低いレベルに時価を分類しております。
(1)時価で連結貸借対照表に計上している金融商品
前連結会計年度(2025年3月31日)
時価(百万円)
区分
レベル1
レベル2
レベル3
合計
投資有価証券
その他有価証券
株式
4,421
−
−
4,421
その他
149
−
−
149
4,571
−
−
4,571
資産計
84/126
EDINET提出書類
大豊工業株式会社(E02199)
有価証券報告書
当連結会計年度(2026年3月31日)
時価(百万円)
区分
レベル1
レベル2
レベル3
合計
投資有価証券
その他有価証券
株式
4,555
−
−
4,555
その他
149
−
−
149
4,705
−
−
4,705
資産計
(2)時価で連結貸借対照表に計上している金融商品以外の金融商品
前連結会計年度(2025年3月31日)
時価(百万円)
区分
レベル1
レベル2
レベル3
合計
1年以内返済予定の長期借入金
−
1,318
−
1,318
長期借入金
−
23,768
−
23,768
−
25,086
−
25,086
負債計
当連結会計年度(2026年3月31日)
時価(百万円)
区分
レベル1
レベル2
レベル3
合計
1年以内返済予定の長期借入金
−
15,372
−
15,372
長期借入金
−
8,574
−
8,574
−
23,946
−
23,946
負債計
(注)
時価の算定に用いた評価技法及び時価の算定に係るインプットの説明
投資有価証券
上場株式等は相場価格等を用いて評価しております。上場株式等は活発な市場で取引されているため、その
時価をレベル1の時価に分類しております。
1年以内返済予定の長期借入金、並びに長期借入金
これらの時価については、元利金の合計額を、新規に同様の借入を行った場合に想定される利率で割り引い
た現在価値により算定しており、レベル2の時価に分類しております。
85/126
EDINET提出書類
大豊工業株式会社(E02199)
有価証券報告書
(有価証券関係)
1 満期保有目的の債券
前連結会計年度(2025年3月31日)
該当事項はありません。
当連結会計年度(2026年3月31日)
該当事項はありません。
2
その他有価証券
前連結会計年度(2025年3月31日)
種類
連結貸借対照表計上
額(百万円)
(1)株式
連結貸借対照表計上額が (2)債券
取得原価を超えるもの
(3)その他
小計
(1)株式
連結貸借対照表計上額が (2)債券
取得原価を超えないもの (3)その他
小計
合計
取得原価
(百万円)
差額
(百万円)
4,418
429
3,989
−
−
−
−
−
−
4,418
429
3,989
2
3
△0
−
−
−
149
150
△0
152
153
△0
4,571
582
3,989
当連結会計年度(2026年3月31日)
種類
連結貸借対照表計上
額(百万円)
(1)株式
連結貸借対照表計上額が (2)債券
取得原価を超えるもの
(3)その他
小計
(1)株式
連結貸借対照表計上額が (2)債券
取得原価を超えないもの (3)その他
小計
合計
86/126
取得原価
(百万円)
差額
(百万円)
4,553
409
4,144
−
−
−
−
−
−
4,553
409
4,144
2
3
△0
−
−
−
149
150
△0
151
153
△1
4,705
562
4,143
EDINET提出書類
大豊工業株式会社(E02199)
有価証券報告書
3
連結会計年度中に売却したその他有価証券
前連結会計年度(自 2024年4月1日至
種類
2025年3月31日)
売却益の合計額
(百万円)
売却額(百万円)
売却損の合計額
(百万円)
(1)株式
167
166
−
(2)債券
−
−
−
(3)その他
−
−
−
167
166
−
合計
当連結会計年度(自
種類
2025年4月1日
至
2026年3月31日)
売却益の合計額
(百万円)
売却額(百万円)
売却損の合計額
(百万円)
(1)株式
1,683
1,662
−
(2)債券
−
−
−
(3)その他
−
−
−
1,683
1,662
−
合計
4
減損処理を行った有価証券
前連結会計年度中に減損処理を行った有価証券(自 2024年4月1日至 2025年3月31日)
当連結会計年度において、有価証券について50百万円(その他有価証券の株式50百万円)減損処理を
行っております。
当連結会計年度中に減損処理を行った有価証券(自 2025年4月1日至 2026年3月31日)
当連結会計年度において、有価証券について金額が軽微であるため、記載を省略しております。
87/126
EDINET提出書類
大豊工業株式会社(E02199)
有価証券報告書
(退職給付関係)
1 採用している退職給付制度の概要
連結財務諸表提出会社、大豊精機(株)及び日本ガスケット(株)は確定給付年金制度及び、確定拠出年
金制度を設けております。日本ガスケット(株)は、2026年4月より、従業員の職務および評価等に基づき
付与されるポイントの累計数に応じて一時金または年金を支給するポイント制へ移行するため、2026年3月
に確定給付年金制度の改定を実施いたしました。制度の改定に伴う未認識過去勤務費用の発生額は74百万円
であります。一部の連結子会社では、退職金制度を設けております。また、一部の海外連結子会社は、確定
拠出型制度等を設けております。さらに、一部の国内連結子会社は、総合型の厚生年金基金に加入しており
ます。
確定拠出制度と同様に会計処理する、複数事業主制度の厚生年金基金への要拠出額は、前連結会計年度43
百万円、当連結会計年度44百万円であります。
なお、一部の連結子会社は、退職給付に係る負債及び退職給付費用の計算に、退職給付に係る期末自己都
合要支給額を退職給付債務とする方法を用いた簡便法を適用しております。
(1)複数事業主制度の直近の積立状況
前連結会計年度
(2025年3月31日)
当連結会計年度
(2026年3月31日)
日本自動車部品工業
企業年金基金
日本自動車部品工業
企業年金基金
年金資産の額
76,277百万円
76,596百万円
年金財政計算上の数理債務の額と最低
責任準備金の額との合計額
49,620百万円
48,772百万円
差引額
26,656百万円
27,824百万円
(2)制度全体に占める当社グループの掛金拠出割合
前連結会計年度
(2025年3月31日)
当連結会計年度
(2026年3月31日)
1.59%
1.65%
日本自動車部品工業企業年金基金
(3)補足説明
前連結会計年度の上記(1)の差引額の主な要因は、年金財政上の過去勤務債務残高4,930百万円であり
ます。本制度における過去勤務債務の償却方法は期間3年3ヶ月の元利均等償却であります。
当連結会計年度の上記(1)の差引額の主な要因は、年金財政上の過去勤務債務残高3,440百万円であり
ます。本制度における過去勤務債務の償却方法は期間2年3ヶ月の元利均等償却であります。
なお、特別掛金の額はあらかじめ定められた掛金率を掛金拠出時の標準給与の額に乗じることで算出さ
れるため、上記(2)の割合は当社グループの実際の負担割合とは一致しておりません。
2.確定給付制度
(1)原則法を採用した制度の、退職給付債務の期首残高と期末残高の調整表
前連結会計年度
(自 2024年4月1日
至 2025年3月31日)
退職給付債務の期首残高
12,408百万円
勤務費用
630
利息費用
数理計算上の差異の発生額
当連結会計年度
2025年4月1日
2026年3月31日)
(自
至
11,047百万円
531
128
245
△1,410
△ 250
△708
△ 899
過去勤務費用の発生額
−
△ 74
退職給付債務の期末残高
11,047
10,601
退職給付の支払額
88/126
EDINET提出書類
大豊工業株式会社(E02199)
有価証券報告書
(2)原則法を採用した制度の、年金資産の期首残高と期末残高の調整表
前連結会計年度
(自 2024年4月1日
至 2025年3月31日)
年金資産の期首残高
当連結会計年度
2025年4月1日
2026年3月31日)
(自
至
13,728百万円
期待運用収益
数理計算上の差異の発生額
13,329百万円
355
345
△540
567
事業主からの拠出額
494
497
退職給付の支払額
△708
△ 899
年金資産の期末残高
13,329
13,840
(3)簡便法を適用した制度の、退職給付債務の期首残高と期末残高の調整表
前連結会計年度
(自 2024年4月1日
至 2025年3月31日)
退職給付債務の期首残高
当連結会計年度
2025年4月1日
2026年3月31日)
(自
至
603百万円
退職給付費用
その他
退職給付債務の期末残高
653百万円
151
194
△101
△111
653
737
(4)退職給付債務及び年金資産の期末残高と連結貸借対照表に計上された退職給付に係る負債及び退職給付に
係る資産の調整表
前連結会計年度
当連結会計年度
(2025年3月31日)
(2026年3月31日)
積立型制度の退職給付債務
11,290百万円
10,859百万円
△ 13,995
年金資産
△13,469
△ 3,135
△2,178
非積立型制度の退職給付債務
411
479
△ 2,656
連結貸借対照表に計上された負債と資産の純額
△1,766
退職給付に係る負債
退職給付に係る資産
連結貸借対照表に計上された負債と資産の純額
527
△2,293
△1,766
595
△3,251
△ 2,656
(5)退職給付費用及びその内訳項目の金額
前連結会計年度
(自 2024年4月1日
至 2025年3月31日)
① 勤務費用
630百万円
② 利息費用
128
③ 期待運用収益
△355
④ 数理計算上の差異の費用処理額
5
⑤ 過去勤務費用の費用処理額
17
⑥ 簡便法で計算した退職給付費用
151
⑦ 厚生年金基金への拠出額
43
⑧ 確定給付制度に係る退職給付費用
620
⑨ その他
106
⑩ 計(⑧+⑨)
727
(注)「⑨ その他」は確定拠出年金への掛金支払額を含んでおります。
当連結会計年度
2025年4月1日
2026年3月31日)
531百万円
245
△345
△92
41
194
44
620
81
702
(自
至
(6)退職給付に係る調整額
退職給付に係る調整額に計上した項目(法人税等及び税効果控除前)の内訳は次のとおりでありま
す。
前連結会計年度
当連結会計年度
(自 2024年4月1日
(自 2025年4月1日
至 2025年3月31日)
至 2026年3月31日)
過去勤務費用
△17百万円
△116百万円
数理計算上の差異
△911
△715
合計
△929
△832
(7)退職給付に係る調整累計額
89/126
EDINET提出書類
大豊工業株式会社(E02199)
有価証券報告書
退職給付に係る調整累計額に計上した項目(法人税等及び税効果控除前)の内訳は次のとおりであり
ます。
前連結会計年度
当連結会計年度
(2025年3月31日)
(2026年3月31日)
未認識過去勤務費用
195百万円
79百万円
未認識数理計算上の差異
△2,120
△2,844
合計
△1,925
△2,765
(8)年金資産に関する事項
① 年金資産の主な内訳
年金資産合計に対する主な分類ごとの比率は、次のとおりであります。
前連結会計年度
当連結会計年度
(2025年3月31日)
(2026年3月31日)
債券
43%
45%
株式
24
24
現金及び預金
2
1
生保一般勘定
22
20
その他
9
10
合計
100
100
(注)その他にオルタナティブ投資を含めています。
② 長期期待運用収益率の設定方法
年金資産の長期期待運用収益率を決定するため、現在及び予想される年金資産の配分と、年金資産
を構成する多様な資産からの現在及び将来期待される長期の収益率を考慮しております。
(9)数理計算上の計算基礎に関する事項
当連結会計年度末における主要な数理計算上の計算基礎
前連結会計年度
(2025年3月31日)
割引率
2.0〜2.2%
長期期待運用収益率
2.5〜3.0
当連結会計年度
(2026年3月31日)
2.2〜2.8%
2.5〜3.0
3.確定拠出制度
当社及び連結子会社の確定拠出制度への要拠出額は、前連結会計年度199百万円、当連結会計年度188百万
円であります。
90/126
EDINET提出書類
大豊工業株式会社(E02199)
有価証券報告書
(ストック・オプション等関係)
1 ストック・オプションにかかる費用計上額及び科目名
(単位:百万円)
前連結会計年度
2024年4月1日
2025年3月31日)
当連結会計年度
2025年4月1日
2026年3月31日)
(自
至
一般管理費の株式報酬費
2
(自
至
24
5
権利不行使による失効により利益として計上した金額及び科目名
(単位:百万円)
前連結会計年度
2024年4月1日
2025年3月31日)
当連結会計年度
2025年4月1日
2026年3月31日)
(自
至
新株予約権戻入益
(自
至
48
25
3
ストック・オプションの内容、規模及びその変動状況
(1)ストック・オプションの内容
2020年
ストック・オプション
2021年
ストック・オプション
2022年
ストック・オプション
2023年
ストック・オプション
付与対象者の区当社取締役 6名
分及び人数
当社執行役員 10名
当社子会社取締役、執
行役員 16名
当社従業員 13名
当社取締役 3名
当社執行役員 14名
当社子会社取締役、執
行役員 15名
当社従業員 9名
当社取締役 3名
当社執行役員 14名
当社子会社取締役、執
行役員 14名
当社従業員 6名
当社取締役 3名
当社執行役員 12名
当社子会社取締役、執行
役員 15名
当社従業員 5名
株式の種類別の 普通株式 292,000株
ストック・オプ
ションの数
(注)
普通株式 284,000株
普通株式 289,000株
普通株式 252,000株
付与日
2020年8月7日
2021年8月6日
2022年8月5日
2023年8月4日
権利確定条件
権利確定条件は付され
ておりません
権利確定条件は付され
ておりません
権利確定条件は付され
ておりません
権利確定条件は付されて
おりません
対象勤務期間
対象勤務期間の定めは
ありません
対象勤務期間の定めは
ありません
対象勤務期間の定めは
ありません
対象勤務期間の定めはあ
りません
権利行使期間
2022年8月1日〜
2025年7月31日
2023年8月1日〜
2026年7月31日
2024年8月1日〜
2027年7月31日
2025年8月1日〜
2028年7月31日
(注)
株式数に換算して記載しております。
91/126
EDINET提出書類
大豊工業株式会社(E02199)
有価証券報告書
(2)ストック・オプションの規模及びその変動状況
当連結会計年度(2026年3月期)において存在したストック・オプションを対象とし、ストック・オプ
ションの数については、株式数に換算して記載しております。
① ストック・オプションの数
2020年
2021年
2022年
2023年
ストック・オプショ ストック・オプショ
ストック・オプショ ストック・オプショ
ン
ン
ン
ン
権利確定前(株)
前連結会計年度末
252,000
付与
失効
権利確定
252,000
未確定残
29,000
99,000
128,000
権利確定
252,000
権利行使
7,000
72,000
失効
22,000
29,000
32,000
96,000
70,000
24,000
156,000
2021年
ストック・オプショ
ン
2022年
ストック・オプショ
ン
2023年
ストック・オプショ
ン
権利確定後(株)
前連結会計年度末
未行使残
②
単価情報
2020年
ストック・オプショ
ン
権利行使価格(円)
552
977
718
915
行使時平均株価(円)
625
957
付与日における
公正な評価単価(円)
70
194
141
142
4
ストック・オプションの公正な評価単価の見積方法
当連結会計年度において付与されたストック・オプションはありません。
5
ストック・オプションの権利確定数の見積方法
基本的には、将来の失効数の合理的な見積りは困難であるため、実績の失効数のみ反映させる方法を
採用しております。
92/126
EDINET提出書類
大豊工業株式会社(E02199)
有価証券報告書
1
(税効果会計関係)
繰延税金資産及び繰延税金負債の発生の主な原因別の内訳
前連結会計年度
(2025年3月31日)
当連結会計年度
(2026年3月31日)
(繰延税金資産)
退職給付に係る負債
141百万円
147百万円
減価償却費
961百万円
936百万円
未払賞与
824百万円
898百万円
役員退職慰労引当金
42百万円
49百万円
未払事業税
35百万円
58百万円
固定資産減損損失
879百万円
3,521百万円
繰越欠損金(注)2
棚卸資産未実現利益
固定資産未実現利益
棚卸資産評価減
2,761百万円
55百万円
88百万円
96百万円
2,647百万円
58百万円
69百万円
67百万円
761百万円
969百万円
その他
繰延税金資産小計
6,647百万円
9,425百万円
税務上の繰越欠損金に係る評価性引当額(注)2
△2,759百万円
△2,647百万円
将来減算一時差異等の合計に係る評価性引当額
△2,134百万円
△5,017百万円
評価性引当額小計(注)1
△4,893百万円
△7,665百万円
1,753百万円
1,759百万円
△713百万円
△1,005百万円
その他有価証券評価差額金
△1,195百万円
△1,256百万円
海外子会社の減価償却費
△651百万円
△632百万円
固定資産圧縮積立金
△155百万円
△152百万円
連結子会社の土地時価評価差額
その他
△92百万円
△116百万円
△92百万円
△242百万円
△2,925百万円
△3,382百万円
繰延税金資産合計
(繰延税金負債)
退職給付に係る資産
繰延税金負債合計
繰延税金資産(負債)の純額
△1,171百万円
△1,622百万円
(注)1.評価性引当額が2,771百万円増加しております。この主な増加は、当社において固定資産減損損失に係る将来
減算一時差異が増加したことに伴い、評価性引当額を追加計上したことによるものであります。
(注)2.税務上の繰越欠損金及びその繰延税金資産の繰越期限別の金額
(前連結会計年度)
1年以内
(百万円)
1年超
2年以内
(百万円)
2年超
3年以内
(百万円)
3年超
4年以内
(百万円)
4年超
5年以内
(百万円)
5年超
(百万円)
合計
(百万円)
税務上の繰越
欠損金(※1)
33
193
50
23
63
2,397
2,761
評価性引当額
△33
△193
△50
△21
△62
△2,397
△2,759
繰延税金資産
−
−
−
1
1
−
(※2)
2
(※1)
(※2)
税務上の繰越欠損金は、法定実効税率を乗じた額であります。
税務上の繰越欠損金に係る繰延税金資産は、将来の収益力に基づく課税所得の見込みにより、回収可能
と判断しております。
93/126
EDINET提出書類
大豊工業株式会社(E02199)
有価証券報告書
(当連結会計年度)
1年以内
(百万円)
1年超
2年以内
(百万円)
2年超
3年以内
(百万円)
3年超
4年以内
(百万円)
4年超
5年以内
(百万円)
5年超
(百万円)
合計
(百万円)
税務上の繰越
欠損金(※1)
80
158
27
66
390
1,924
2,647
評価性引当額
△80
△158
△27
△66
△390
△1,924
△2,647
繰延税金資産
−
−
−
−
−
−
−
(※1)
2
税務上の繰越欠損金は、法定実効税率を乗じた額であります。
法定実効税率と税効果会計適用後の法人税等の負担率との差異の原因となった主な項目別の内訳
前連結会計年度(2025年3月31日)
前連結会計年度は、税金等調整前当期純損失であるため注記を省略しております。
当連結会計年度(2026年3月31日)
当連結会計年度は、税金等調整前当期純損失であるため注記を省略しております。
(資産除去債務関係)
前連結会計年度(自 2024年4月1日至 2025年3月31日)
重要性が乏しいため、記載を省略しております。
当連結会計年度(自 2025年4月1日至 2026年3月31日)
重要性が乏しいため、記載を省略しております。
94/126
EDINET提出書類
大豊工業株式会社(E02199)
有価証券報告書
(収益認識関係)
1.顧客との契約から生じる収益を分解した情報
当社グループの売上高は、顧客との契約から生じる収益であり、当社グループの報告セグメントを財又はサービ
スの種類別に分解した場合の内訳は、以下のとおりです。
前連結会計年度(自
2024年4月1日
至
2025年3月31日)
(単位:百万円)
報告セグメント
自動車部品
関連事業
自動車製造用
設備関連事業
その他
(注)
計
計
軸受製品
46,010
−
46,010
−
46,010
システム製品
20,266
−
20,266
−
20,266
ダイカスト製品
12,094
−
12,094
−
12,094
ガスケット製品
17,166
−
17,166
−
17,166
−
12,467
12,467
−
12,467
4,614
−
4,614
170
4,784
顧客との契約から生じる収益
100,152
12,467
112,619
170
112,789
外部顧客への売上高
100,152
12,467
112,619
170
112,789
自動車製造用設備
その他
(注)「その他」の区分は報告セグメントに含まれない事業セグメントであり、物品の小売等のサービスを含んでおりま
す。
当連結会計年度(自
2025年4月1日
至
2026年3月31日)
(単位:百万円)
報告セグメント
自動車部品
関連事業
自動車製造用
設備関連事業
その他
(注)
計
計
軸受製品
47,405
−
47,405
−
47,405
システム製品
22,261
−
22,261
−
22,261
ダイカスト製品
13,620
−
13,620
−
13,620
ガスケット製品
18,042
−
18,042
−
18,042
−
13,147
13,147
−
13,147
4,735
−
4,735
164
4,900
顧客との契約から生じる収益
106,066
13,147
119,213
164
119,378
外部顧客への売上高
106,066
13,147
119,213
164
119,378
自動車製造用設備
その他
(注)「その他」の区分は報告セグメントに含まれない事業セグメントであり、物品の小売等のサービスを含んでおりま
す。
2.顧客との契約から生じる収益を理解するための基礎となる情報
顧客との契約から生じる収益を理解するための基礎となる情報は「注記事項(連結財務諸表作成のための基本
となる重要な事項)4 会計方針に関する事項」に記載のとおりです。
95/126
EDINET提出書類
大豊工業株式会社(E02199)
有価証券報告書
3.顧客との契約に基づく履行義務の充足と当該契約から生じるキャッシュ・フローとの関係並びに当連結会計年
度末において存在する顧客との契約から翌連結会計年度以降に認識すると見込まれる収益の金額及び時期に関
する情報
(1)契約資産及び契約負債の残高等
(単位:百万円)
前連結会計年度
当連結会計年度
契約資産(期首残高)
1,119
1,294
契約資産(期末残高)
1,294
780
契約負債(期首残高)
98
122
契約負債(期末残高)
122
655
(注) 契約資産は、自動車製造用設備関連事業における請負契約において、履行義務の充足に係る進捗度に基
づいて認識した対価に対する未請求の権利であり、顧客の検収時に顧客との契約から生じた債権に振り替
えております。
契約負債は、主に自動車部品関連事業及び自動車製造設備関連事業における顧客からの前受金であり、
収益の認識に伴い取り崩しております。当連結会計年度の期首時点の契約負債残高は、概ね当連結会計年
度の収益として認識しており、翌連結会計年度以降に繰り越される金額に重要性はありません。
(2)残存履行義務に配分した取引価格
当社グループにおいては、予想契約期間が1年を超える重要な取引はありません。また、顧客との契約から生
じる対価の中に、取引価格に含まれていない重要な金額はありません。
96/126
EDINET提出書類
大豊工業株式会社(E02199)
有価証券報告書
(セグメント情報等)
【セグメント情報】
1 報告セグメントの概要
当社の報告セグメントは、当社の構成単位のうち分離された財務情報が入手可能であり、取締役会が、
経営資源の配分の決定及び業績を評価するために、定期的に検討を行う対象となっているものでありま
す。
当社は、本社で取り扱う製品・サービスについて国内及び海外の包括的な戦略を立案し、事業活動を展
開しております。
従って、当社は製品・サービス別セグメントから構成されており、「自動車部品関連事業」及び「自動
車製造用設備関連事業」の2つを報告セグメントとしております。
「自動車部品関連事業」は、軸受製品・システム製品・ダイカスト製品・ガスケット製品他の製造販売
をしております。「自動車製造用設備関連事業」は、搬送装置・金型・溶接機・設備部品の製造販売をし
ております。
2 報告セグメントごとの売上高、利益又は損失、資産、その他の項目の金額の算定方法
(報告セグメントごとの売上高及び利益又は損失の金額の算定方法の変更)
当連結会計期間期首より、報告セグメントごとの業績をより適切に評価するため、報告セグメントの
算定方法を変更し、従来「調整額」に含めていた一般管理費用を各セグメントに配賦しております。
なお、前連結会計期間のセグメント情報について、変更後の算定方法で作成しており、前連結会計期間
の「報告セグメントごとの売上高及び利益又は損失の金額に関する情報」に記載しております。
3 報告セグメントごとの売上高、利益又は損失、資産、その他の項目の金額に関する情報
前連結会計年度(自
2024年4月1日
至
2025年3月31日)
(単位:百万円)
報告セグメント
その他
(注)1
合計
調整額
(注)2
連結財務諸
表計上額
(注)3
自動車部品
関連事業
自動車製造
用設備関連
事業
100,152
12,467
112,619
170
112,789
112,789
260
260
567
827
△827
100,152
12,727
112,879
737
113,617
△827
112,789
300
333
634
△24
609
0
610
97,867
8,957
106,824
322
107,147
15,189
122,336
減価償却費
6,833
278
7,112
3
7,115
140
7,256
有形固定資産及び無形
固定資産の増加額
8,605
2,153
10,758
0
10,759
94
10,854
計
売上高
外部顧客への売上高
セグメント間の内部売
上高又は振替高
計
セグメント利益又は損失
(△)
セグメント資産
その他の項目
(注)1
2
3
「その他」の区分は報告セグメントに含まれない事業セグメントであり、物品の小売等のサービス等を含ん
でおります。
調整額は、以下のとおりであります。
(1)セグメント利益の調整額0百万円は、主に全社費用(主に報告セグメントに帰属しない一般管理費)と
なっております。
(2)セグメント資産の調整額15,189百万円は、連結財務諸表提出会社での余資運用資金(現金預金)、長期
投資資金(投資有価証券)及び管理部門に係る資産等であります。
(3)有形固定資産及び無形固定資産の増加額の調整額94百万円は、報告セグメントに配分していない全社資
産であります。
セグメント利益は、連結損益計算書の営業利益と調整を行っております。
97/126
EDINET提出書類
大豊工業株式会社(E02199)
有価証券報告書
当連結会計年度(自
2025年4月1日
至
2026年3月31日)
(単位:百万円)
報告セグメント
その他
(注)1
合計
調整額
(注)2
連結財務諸
表計上額
(注)3
自動車部品
関連事業
自動車製造
用設備関連
事業
106,066
13,147
119,213
164
119,378
119,378
179
179
523
702
△702
計
106,066
13,327
119,393
687
120,081
△702
119,378
セグメント利益又は損失
(△)
2,109
501
2,611
△50
2,560
28
2,589
セグメント資産
89,631
8,536
98,167
252
98,419
15,964
114,384
減価償却費
6,642
353
6,995
2
6,998
166
7,164
有形固定資産及び無形
固定資産の増加額
4,556
68
4,624
4,624
291
4,916
計
売上高
外部顧客への売上高
セグメント間の内部売
上高又は振替高
その他の項目
(注)1
2
3
「その他」の区分は報告セグメントに含まれない事業セグメントであり、物品の小売等のサービス等を含ん
でおります。
調整額は、以下のとおりであります。
(1)セグメント利益の調整額28百万円は、主に全社費用(主に報告セグメントに帰属しない一般管理費)と
なっております。
(2)セグメント資産の調整額15,964百万円は、連結財務諸表提出会社での余資運用資金(現金預金)、長期
投資資金(投資有価証券)及び管理部門に係る資産等であります。
(3)有形固定資産及び無形固定資産の増加額の調整額291百万円は、報告セグメントに配分していない全社
資産であります。
セグメント利益は、連結損益計算書の営業利益と調整を行っております。
98/126
EDINET提出書類
大豊工業株式会社(E02199)
有価証券報告書
【関連情報】
前連結会計年度(自 2024年4月1日至 2025年3月31日)
1 製品及びサービスごとの情報
セグメント情報に同様の情報を開示しているため、記載を省略しております。
2 地域ごとの情報
(1)売上高
(単位:百万円)
日本
米国
68,730
(注)
中国
12,671
アジアその他
10,690
その他
11,119
合計
9,578
112,789
売上高は顧客の所在地を基礎とし、国又は地域に分類しております。
(2)有形固定資産
(単位:百万円)
日本
米国
中国
37,720
3
1,729
アジアその他
5,323
その他
2,867
合計
511
48,152
主要な顧客ごとの情報
(単位:百万円)
顧客の名称又は氏名
売上高
関連するセグメント名
トヨタ自動車(株)
31,552
自動車部品関連事業及び自動車製造用設備関連事業
当連結会計年度(自 2025年4月1日至 2026年3月31日)
1 製品及びサービスごとの情報
セグメント情報に同様の情報を開示しているため、記載を省略しております。
2 地域ごとの情報
(1)売上高
(単位:百万円)
日本
米国
72,712
(注)
中国
14,543
アジアその他
11,127
10,381
売上高は顧客の所在地を基礎とし、国又は地域に分類しております。
99/126
その他
10,612
合計
119,378
EDINET提出書類
大豊工業株式会社(E02199)
有価証券報告書
(2)有形固定資産
(単位:百万円)
日本
米国
27,034
3
中国
1,460
アジアその他
4,863
その他
2,809
合計
576
36,744
主要な顧客ごとの情報
(単位:百万円)
顧客の名称又は氏名
売上高
トヨタ自動車(株)
関連するセグメント名
32,531
自動車部品関連事業及び自動車製造用設備関連事業
【報告セグメントごとの固定資産の減損損失に関する情報】
前連結会計年度(自 2024年4月1日至 2025年3月31日)
当連結会計年度において、自動車部品関連事業に係る減損損失は1,462百万円であります。
当連結会計年度(自 2025年4月1日至 2026年3月31日)
当連結会計年度において、自動車部品関連事業に係る減損損失は9,168百万円であります。
【報告セグメントごとののれんの償却額及び未償却残高に関する情報】
前連結会計年度(自 2024年4月1日至 2025年3月31日)
該当事項はありません。
当連結会計年度(自 2025年4月1日
該当事項はありません。
至
2026年3月31日)
【報告セグメントごとの負ののれん発生益に関する情報】
前連結会計年度(自 2024年4月1日至 2025年3月31日)
該当事項はありません。
当連結会計年度(自 2025年4月1日
該当事項はありません。
至
2026年3月31日)
100/126
EDINET提出書類
大豊工業株式会社(E02199)
有価証券報告書
【関連当事者情報】
1 関連当事者との取引
(1)連結財務諸表提出会社と関連当事者との取引
連結財務諸表提出会社の親会社及び主要株主(会社等に限る。)等
前連結会計年度(自 2024年4月1日至 2025年3月31日)
種類
その他の
関係会社
会社等の名
称又は氏名
所在地
トヨタ自動愛知県豊田
車株式会社市
資本金又は
出資金
(百万円)
事業の内容
又は職業
635,402
自動車及び
同部品等の
製造・販売
議決権等の所
有(被所有)
割合(%)
(被所有)
直接 34.2
間接 0.0
関連当事者
との関係
取引の内容
取引金額
(百万円)
当社製品の
販売等
自動車部品
及び精密金
型の販売
15,134
科目
売掛金
電子記録
債権
期末残高
(百万円)
1,936
(注)取引条件及び取引条件の決定方針等
製品の販売価格については、市場価格、材料価格変動を含めた総原価を勘案し、半期ごとに交渉の上、決定し
ております。また、取引価格以外の取引条件については、一般取引と同様に決定しております。
当連結会計年度(自
種類
会社等の名
称又は氏名
所在地
その他の
トヨタ自動愛知県豊田
関係会社
車株式会社市
2025年4月1日
資本金又は
出資金
(百万円)
635,402
至
2026年3月31日)
事業の内容
又は職業
議決権等の所
有(被所有)
割合(%)
自動車及び
同部品等の
(被所有)
製造・販売
間接 0.0
直接 34.1
関連当事者
との関係
取引の内容
当社製品の
自動車部品
及び精密金
販売等
取引金額
(百万円)
15,539
型の販売
科目
売掛金
電子記録
債権
期末残高
(百万円)
1,623
(注)取引条件及び取引条件の決定方針等
製品の販売価格については、市場価格、材料価格変動を含めた総原価を勘案し、半期ごとに交渉の上、決定し
ております。また、取引価格以外の取引条件については、一般取引と同様に決定しております。
(2)連結財務諸表提出会社の連結子会社と関連当事者との取引
連結財務諸表提出会社の親会社及び主要株主(会社等に限る。)等
① 大豊精機株式会社
前連結会計年度(自 2024年4月1日至 2025年3月31日)
種類
会社等の名
称
所在地
その他の
トヨタ自動愛知県豊
関係会社
車株式会社田市
資本金又は
出資金
事業の内容
(百万円)
635,402
自動車及び
同部品等の
製造・販売
議決権等の所
有(被所有)
割合(%)
(被所有)
直接 34.2
間接 0.0
関連当事者
との関係
取引の内容
当社グルー
プ製品の販
売
自動車部品及び
精密金型の販売
取引金額
(百万円)
8,830
科目
売掛金
電子記録
債権
期末残高
(百万円)
1,583
(注)取引条件及び取引条件の決定方針等
製品の販売価格については、市場価格、材料価格変動を含めた総原価を勘案し、半期ごとに交渉の上、決定し
ております。また、取引価格以外の取引条件については、一般取引と同様に決定しております。
当連結会計年度(自
種類
その他の
関係会社
会社等の名
称
所在地
トヨタ自動愛知県豊
車株式会社田市
2025年4月1日
資本金又は
出資金
事業の内容
(百万円)
635,402
自動車及び
同部品等の
製造・販売
至
2026年3月31日)
議決権等の所
有(被所有)
割合(%)
(被所有)
直接 34.1
間接 0.0
関連当事者
との関係
取引の内容
当社グルー
プ製品の販
売
自動車部品及び
精密金型の販売
取引金額
(百万円)
9,303
科目
売掛金
電子記録
債権
期末残高
(百万円)
1,559
(注)取引条件及び取引条件の決定方針等
製品の販売価格については、市場価格、材料価格変動を含めた総原価を勘案し、半期ごとに交渉の上、決定し
ております。また、取引価格以外の取引条件については、一般取引と同様に決定しております。
101/126
EDINET提出書類
大豊工業株式会社(E02199)
有価証券報告書
②
種類
その他の
関係会社
会社等の名
称
日本ガスケット株式会社
前連結会計年度(自 2024年4月1日
所在地
トヨタ自動愛知県豊
車株式会社田市
資本金又は
出資金
事業の内容
(百万円)
635,402
自動車及び
同部品等の
製造・販売
至
2025年3月31日)
議決権等の所
関連当事者
有(被所有)
との関係
割合(%)
(被所有)
当社グルー
プ製品の販
売
直接 34.2
間接 0.0
取引の内容
取引金額
(百万円)
自動車部品の
販売
7,587
科目
売掛金
電子記録
債権
期末残高
(百万円)
1,026
(注)取引条件及び取引条件の決定方針等
製品の販売価格については、市場価格、材料価格変動を含めた総原価を勘案し、半期ごとに交渉の上、決定し
ております。また、取引価格以外の取引条件については、一般取引と同様に決定しております。
当連結会計年度(自
種類
会社等の名
称
所在地
その他の
トヨタ自動愛知県豊
関係会社
車株式会社田市
2025年4月1日
資本金又は
出資金
事業の内容
(百万円)
635,402
至
2026年3月31日)
議決権等の所
関連当事者
有(被所有)
との関係
割合(%)
自動車及び
同部品等の
(被所有)
直接 34.1
当社グルー
プ製品の販
製造・販売
間接 0.0
売
取引の内容
自動車部品の
販売
取引金額
(百万円)
7,688
科目
売掛金
電子記録
債権
期末残高
(百万円)
1,014
(注)取引条件及び取引条件の決定方針等
製品の販売価格については、市場価格、材料価格変動を含めた総原価を勘案し、半期ごとに交渉の上、決定し
ております。また、取引価格以外の取引条件については、一般取引と同様に決定しております。
102/126
EDINET提出書類
大豊工業株式会社(E02199)
有価証券報告書
(1株当たり情報)
前連結会計年度
2024年4月1日
2025年3月31日)
当連結会計年度
2025年4月1日
2026年3月31日)
(自
至
(自
至
1株当たり純資産額
2,423.24円
2,242.42円
1株当たり当期純損失(△)
△145.69円
△210.68円
−円
−円
潜在株式調整後1株当たり当期純利益
(注)1
潜在株式調整後1株当たり当期純利益については、潜在株式は存在するものの、1株当たり当期純損失であ
るため記載をしておりません。
2 1株当たり当期純損失(△)および潜在株式調整後1株当たり当期純利益の算定上の基礎は、以下のとおり
であります。
項目
前連結会計年度
2024年4月1日
2025年3月31日)
当連結会計年度
2025年4月1日
2026年3月31日)
(自
至
(自
至
1株当たり当期純損失(△)
親会社株主に帰属する当期純損失
(△)(百万円)
△4,187
△5,967
普通株式に係る親会社株主に帰属す
る当期純損失(△)(百万円)
△4,187
△5,967
28,742,451
28,325,646
13,318
2,499
普通株式の期中平均株式数(株)
潜在株式調整後1株当たり当期純利益
普通株式増加数(株)
(うち新株予約権)(株)
希薄化効果を有しないため、潜在株式
調整後1株当たり当期純利益金額の算
定に含まれなかった潜在株式の概要
(注)3
(−)
−
(−)
−
1株当たり純資産額の算定上の基礎は、以下のとおりであります。
項目
前連結会計年度
(2025年3月31日)
純資産の部の合計額(百万円)
当連結会計年度
(2026年3月31日)
69,283
64,344
純資産の部の合計額から控除する金額
(百万円)
681
683
(うち新株予約権)(百万円)
(69)
(39)
(うち非支配株主持分)(百万円)
(612)
(644)
普通株式に係る期末の純資産額
(百万円)
1株当たり純資産額の算定に用いられ
た期末の普通株式の数(株)
103/126
68,602
63,660
28,310,267
28,389,257
EDINET提出書類
大豊工業株式会社(E02199)
有価証券報告書
(重要な後発事象)
(別途積立金の取り崩し)
当社は2026年4月27日開催の取締役会において、別途積立金の取り崩しを行うことを決議し、以下のとおり
取り崩しを行いました。なお、当社は会社法第459条第1項各号に掲げる事項を取締役会決議により行うことが
出来る旨を定款に定めております。
1.実施内容
(1)減少する剰余金の項目及びその額
別途積立金
7,710百万円
(2)増加する剰余金の項目及びその額
繰越利益剰余金
7,710百万円
2.実施の目的
安定的な配当を実施するため。
3.効力発生日
2026年4月27日
104/126
EDINET提出書類
大豊工業株式会社(E02199)
有価証券報告書
⑤【連結附属明細表】
【社債明細表】
該当事項はありません。
【借入金等明細表】
当期首残高
(百万円)
当期末残高
(百万円)
平均利率
(%)
446
647
3.19
−
1年以内に返済予定の長期借入金
1,328
15,439
0.32
−
1年以内に返済予定のリース債務
39
31
−
−
長期借入金(1年以内に返済予定のものを除く)
24,239
8,782
0.86
2027年6月11日〜
2031年9月30日
リース債務(1年以内に返済予定のものを除く)
63
71
−
2027年11月30日〜
2032年2月17日
26,117
24,972
−
−
区分
短期借入金
合計
(注)1
返済期限
2
「平均利率」については、借入金等の期末残高に対する加重平均利率を記載しております。なお、リース債
務については、利息相当額を控除する前の金額でリース債務を連結貸借対照表に計上しているため記載を省
略しております。
長期借入金及びリース債務(1年以内に返済予定のものを除く)の連結決算日後5年以内における返済金額
は以下のとおりであります。
1年超2年以内
(百万円)
区分
2年超3年以内
(百万円)
3年超4年以内
(百万円)
4年超5年以内
(百万円)
長期借入金
5,782
3,000
−
−
リース債務
38
27
4
0
合計
5,820
3,027
4
0
【資産除去債務明細表】
当連結会計年度期首及び当連結会計年度末における資産除去債務の金額が当連結会計年度期首及び当連結会計
年度末における負債及び純資産の合計額の100分の1以下であるため、連結財務諸表規則第92条の2の規定によ
り記載を省略しております。
(2)【その他】
当連結会計年度における半期情報等
(累計期間)
中間連結会計期間
当連結会計年度
売上高
(百万円)
58,548
119,378
税金等調整前中間(当期)
純利益又は純損失(△)
(百万円)
1,470
△4,596
親会社株主に帰属する
中間(当期)純利益又は
純損失(△)
(百万円)
857
△5,967
1株当たり中間(当期)
純利益又は純損失(△)
(円)
30.30
△210.68
105/126
EDINET提出書類
大豊工業株式会社(E02199)
有価証券報告書
2【財務諸表等】
(1)【財務諸表】
①【貸借対照表】
(単位:百万円)
前事業年度
(2025年3月31日)
資産の部
流動資産
現金及び預金
電子記録債権
売掛金
商品及び製品
仕掛品
原材料及び貯蔵品
未収入金
前払費用
短期貸付金
1年内回収予定の長期貸付金
その他
流動資産合計
固定資産
有形固定資産
建物
構築物
機械及び装置
車両運搬具
工具、器具及び備品
土地
リース資産
建設仮勘定
有形固定資産合計
無形固定資産
ソフトウエア
ソフトウエア仮勘定
その他
無形固定資産合計
投資その他の資産
投資有価証券
関係会社株式
出資金
関係会社出資金
長期貸付金
破産更生債権等
その他
貸倒引当金
投資その他の資産合計
固定資産合計
資産合計
106/126
当事業年度
(2026年3月31日)
9,980
11,442
※1 2,270
※1 1,866
※1 9,584
※1 9,298
1,873
1,519
2,762
※1 2,550
37
−
※1 360
547
31,486
2,041
1,665
2,807
※1 2,764
52
※1 40
※1 1,437
535
33,952
※2 4,131
※2 3,226
※2 324
※2 225
※2 10,265
※2 4,264
17
16
※2 559
※2 474
※2 8,106
※2 8,106
48
4,525
27,978
59
967
17,340
442
156
11
610
249
696
10
956
2,430
10,630
18
8,363
※1 2,925
120
90
△5
24,573
53,161
84,648
1,992
10,672
18
8,363
※1 1,581
−
84
△4
22,707
41,005
74,957
EDINET提出書類
大豊工業株式会社(E02199)
有価証券報告書
(単位:百万円)
前事業年度
(2025年3月31日)
負債の部
流動負債
買掛金
電子記録債務
短期借入金
1年内返済予定の長期借入金
リース債務
未払金
未払費用
未払法人税等
未払消費税等
預り金
役員賞与引当金
前受金
製品保証引当金
資産除去債務
流動負債合計
固定負債
長期借入金
リース債務
繰延税金負債
退職給付引当金
資産除去債務
長期未払金
債務保証損失引当金
固定負債合計
負債合計
純資産の部
株主資本
資本金
資本剰余金
資本準備金
その他資本剰余金
資本剰余金合計
利益剰余金
利益準備金
その他利益剰余金
別途積立金
繰越利益剰余金
利益剰余金合計
自己株式
株主資本合計
評価・換算差額等
その他有価証券評価差額金
評価・換算差額等合計
新株予約権
純資産合計
負債純資産合計
107/126
当事業年度
(2026年3月31日)
※1 4,455
※1 4,712
※1 2,325
※1 857
4,975
1,000
13
※1 1,280
3,742
109
−
153
32
80
218
−
18,387
4,047
14,500
16
※1 812
3,862
182
550
149
35
215
181
359
30,483
22,500
35
595
608
742
4
1,655
26,142
44,529
8,000
43
491
581
311
−
1,769
11,196
41,680
6,712
6,712
10,342
8
10,350
10,342
18
10,361
1,098
1,098
17,710
3,388
22,197
△667
38,592
17,710
△3,217
15,590
△611
32,052
1,457
1,457
69
40,118
84,648
1,186
1,186
39
33,277
74,957
EDINET提出書類
大豊工業株式会社(E02199)
有価証券報告書
②【損益計算書】
(単位:百万円)
(自
至
前事業年度
2024年4月1日
2025年3月31日)
(自
至
当事業年度
2025年4月1日
2026年3月31日)
売上高
※1 62,119
※1 64,302
売上原価
売上総利益
※1 55,690
※1 57,666
6,428
※2 8,305
※2 7,770
△1,876
△1,134
※1 1,948
※1 2,915
※1 111
※1 101
※1 275
※1 257
2,335
3,274
※1 81
118
55
86
5
346
111
100
69
76
80
4
331
1,809
18
48
−
67
6
25
1,662
1,693
5
0
−
712
59
0
777
△598
153
2,606
2,760
△3,359
−
0
0
9,250
−
67
9,318
△5,815
224
−
224
△6,040
販売費及び一般管理費
営業損失(△)
営業外収益
受取利息及び受取配当金
受取賃貸料
その他
営業外収益合計
営業外費用
支払利息
固定資産除却損
賃貸設備減価償却費
休止固定資産減価償却費
その他
営業外費用合計
経常利益
特別利益
固定資産売却益
新株予約権戻入益
投資有価証券売却益
特別利益合計
特別損失
固定資産売却損
固定資産除却損
投資有価証券評価損
減損損失
製品保証引当金繰入額
その他
特別損失合計
税引前当期純損失(△)
法人税、住民税及び事業税
法人税等調整額
法人税等合計
当期純損失(△)
108/126
6,635
EDINET提出書類
大豊工業株式会社(E02199)
有価証券報告書
③【株主資本等変動計算書】
前事業年度(自 2024年4月1日
至
2025年3月31日)
(単位:百万円)
株主資本
資本剰余金
その他利益剰余金
資本金
資本準備金
当期首残高
利益剰余金
6,712
10,342
その他
資本剰余金
利益準備金
資本剰余金
合計
9
10,351
1,098
利益剰余金
合計
別途積立金
繰越利益
剰余金
17,710
7,325
26,134
△578
△578
△3,359
△3,359
当期変動額
剰余金の配当
当期純損失(△)
自己株式の取得
自己株式の処分
△0
△0
株主資本以外の項目の
当期変動額(純額)
当期変動額合計
当期末残高
−
−
△0
△0
−
−
△3,937
△3,937
6,712
10,342
8
10,350
1,098
17,710
3,388
22,197
新株予約権
その他
評価・換算
有価証券
差額等合計
評価差額金
純資産合計
株主資本
当期首残高
評価・換算差額等
自己株式
株主資本
合計
△301
42,896
1,829
1,829
93
44,820
当期変動額
剰余金の配当
当期純損失(△)
△578
△578
△3,359
△3,359
自己株式の取得
△373
△373
△373
自己株式の処分
7
6
6
株主資本以外の項目の
当期変動額(純額)
−
△372
△372
△24
△397
当期変動額合計
△365
△4,303
△372
△372
△24
△4,701
当期末残高
△667
38,592
1,457
1,457
69
40,118
109/126
EDINET提出書類
大豊工業株式会社(E02199)
有価証券報告書
当事業年度(自
2025年4月1日
至
2026年3月31日)
(単位:百万円)
株主資本
資本剰余金
その他利益剰余金
資本金
資本準備金
当期首残高
利益剰余金
6,712
10,342
その他
資本剰余金
利益準備金
資本剰余金
合計
8
10,350
1,098
利益剰余金
合計
別途積立金
繰越利益
剰余金
17,710
3,388
22,197
△566
△566
△6,040
△6,040
当期変動額
剰余金の配当
当期純損失(△)
自己株式の取得
自己株式の処分
10
10
株主資本以外の項目の
当期変動額(純額)
当期変動額合計
当期末残高
−
−
10
10
−
−
△6,606
△6,606
6,712
10,342
18
10,361
1,098
17,710
△3,217
15,590
新株予約権
その他
評価・換算
有価証券
差額等合計
評価差額金
純資産合計
株主資本
当期首残高
評価・換算差額等
自己株式
株主資本
合計
△667
38,592
1,457
1,457
69
40,118
当期変動額
剰余金の配当
当期純損失(△)
△566
△566
△6,040
△6,040
自己株式の取得
△0
△0
△0
自己株式の処分
55
66
66
株主資本以外の項目の
当期変動額(純額)
当期変動額合計
当期末残高
−
△270
△270
△29
△300
55
△6,540
△270
△270
△29
△6,841
△611
32,052
1,186
1,186
39
33,277
110/126
EDINET提出書類
大豊工業株式会社(E02199)
有価証券報告書
【注記事項】
(重要な会計方針)
(1) 資産の評価基準および評価方法
① 有価証券の評価基準及び評価方法
・子会社株式及び関連会社株式
移動平均法による原価法を採用しております。
・その他有価証券
市場価格のない株式等以外のもの
…期末決算日の市場価格等に基づく時価法(評価差額は全部純資産直入法により処理し、売却原価
は移動平均法により算定)を採用しております。
市場価格のない株式等
…移動平均法による原価法を採用しております。
② 棚卸資産の評価基準及び評価方法
評価基準は原価法(収益性の低下による簿価切下げの方法)によっております。
・製品・仕掛品・原材料………総平均法
・貯蔵品…………………………先入先出法
(2) 固定資産の減価償却の方法
① 有形固定資産(リース資産を除く)
定率法によっております。
② 無形固定資産(リース資産を除く)
定額法によっております。
なお、ソフトウエア(自社利用分)については、社内における利用可能期間(5年)に基づく定額法に
よっております。
③
リース資産
所有権移転外ファイナンス・リース取引に係るリース資産については、リース期間を耐用年数とし、残
存価額をゼロとして定額法により算定する方法によっております。
(3) 引当金の計上基準
① 貸倒引当金
売上債権等の貸倒れによる損失に備えるため、一般債権については、貸倒実績率等により、貸倒懸念債
権等特定の債権については、個別に回収可能性を検討し、回収不能見込額を計上しております。
② 退職給付引当金
従業員の退職給付に備えるため、当事業年度末における退職給付債務および年金資産の見込額に基づき
計上しております。
・退職給付見込額の期間帰属方法
退職給付債務の算定にあたり、退職給付見込額を当事業年度末までの期間に帰属させる方法について
は、給付算定式基準によっております。
・数理計算上の差異、過去勤務費用の費用処理方法
過去勤務費用については、その発生時における従業員の平均残存勤務期間以内の一定の年数(14年)
による定額法により費用処理しております。
数理計算上の差異については、各事業年度の発生時における従業員の平均残存勤務期間以内の一定の
年数(14年)による定額法により按分した額をそれぞれ発生の翌事業年度から費用処理しております。
③ 役員賞与引当金
役員に対して支給する賞与の支出に充てるため、当事業年度における支給見込額に基づき、当事業年度
に見合う分を計上しております。
④ 債務保証損失引当金
債務保証に係る損失に備えるため、被保証者の財政状態等を勘案し、損失負担見込額を計上しておりま
す。
⑤ 製品保証引当金
主に製品の品質に関する保証費用の支出に備えるため、今後必要と見込まれる金額を計上しておりま
す。
111/126
EDINET提出書類
大豊工業株式会社(E02199)
有価証券報告書
(4)
収益及び費用の計上基準
当社の顧客との契約から生じる収益に関する主要な事業における主な履行義務の内容及び当該履行義務を
充足する通常の時点(収益を認識する通常の時点)は以下のとおりであります。
自動車部品関連事業
各種自動車部品の製造・販売を主な事業とし、これらの製品の販売については引渡時点において顧客が
当該製品に対する支配を獲得し、履行義務が充足されると判断していることから、製品の引渡時点で収
益を認識しております。ただし、主な製品の国内の販売については、出荷時から当該製品の支配が顧客
に移転されるまでの期間が通常の期間であるため、出荷時点で収益を認識しております。
また、収益は顧客との契約において約束された対価で測定しております。取引の対価は履行義務を充足
してから1年以内に受領しており、重要な金融要素は含まれておりません。
(5)
その他財務諸表作成のための基本となる重要な事項
退職給付に係る会計処理
退職給付に係る未認識数理計算上の差異、未認識過去勤務費用の会計処理方法は、連結財務諸表におけ
るこれらの会計処理の方法と異なっております。
(重要な会計上の見積り)
1.減損損失
(1)当事業年度の財務諸表に計上した金額
(単位:百万円)
前事業年度
減損損失
当事業年度
−
9,250
(2)識別した項目に係る重要な会計上の見積りに関する情報
(1)の金額の算出方法は、連結財務諸表「注記事項(重要な会計上の見積り)1.減損損失」の内容と同
一であります。
2.製品保証引当金
(1)当事業年度の財務諸表に計上した金額
(単位:百万円)
前事業年度
製品保証引当金
当事業年度
218
181
(2)識別した項目に係る重要な会計上の見積りに関する情報
(1)の金額の算出方法は、連結財務諸表「注記事項(重要な会計上の見積り)3.製品保証引当金」の内
容と同一であります。
112/126
EDINET提出書類
大豊工業株式会社(E02199)
有価証券報告書
(会計方針の変更)
該当事項はありません。
(会計上の見積りの変更)
(退職給付に係る会計処理の数理計算上の差異及び過去勤務費用の費用処理年数の変更)
退職給付に係る会計処理の数理計算上の差異及び過去勤務費用の費用処理年数について、従来、従業員の平均
残存勤務期間以内の一定年数として、数理計算上の差異は17年、過去勤務費用は17年で費用処理しておりました
が、平均残存勤務期間がこれを下回ったため、当事業年度より費用処理年数を、数理計算上の差異は14年、過去
勤務費用は14年に変更しております。
この変更による当事業年度の損益に与える影響は軽微であります。
(表示方法の変更)
(貸借対照表関係)
前事業年度において「流動資産」の「短期貸付金」に含めて表示しておりました「1年内回収予定の長期貸付
金」は、開示の明瞭性を高めるため、当事業年度より独立掲載することといたしました。この表示方法の変更を
反映させるため、前事業年度の財務諸表の組替えを行っております。
この結果、前事業年度の貸借対照表において、「流動資産」の「短期貸付金」に表示していた360百万円は、
「1年内回収予定の長期貸付金」360百万円として組み替えております。
(貸借対照表関係)
※1 関係会社に対する金銭債権及び金銭債務(区分表示したものを除く)
前事業年度
(2025年3月31日)
当事業年度
(2026年3月31日)
短期金銭債権
5,075百万円
6,333百万円
長期金銭債権
短期金銭債務
2,925百万円
6,092百万円
1,581百万円
4,944百万円
※2
圧縮記帳額
国庫補助金等により有形固定資産の取得価額から控除している圧縮記帳額及びその内訳は以下のとおり
であります。
前事業年度
(2025年3月31日)
建物及び構築物
機械装置及び運搬具
工具、器具及び備品
土地
3
当事業年度
(2026年3月31日)
208百万円
190百万円
0百万円
50百万円
208百万円
190百万円
0百万円
50百万円
保証債務
下記の連結子会社の金融機関からの借入に対して、債務保証を行っております。
前事業年度
(2025年3月31日)
当事業年度
(2026年3月31日)
タイホウ コーポレーション オブ アメリカ
1,655百万円
1,769百万円
常州恒業軸瓦材料有限公司
タイホウ コーポレーション オブ ヨーロッパ
239百万円
127百万円
327百万円
369百万円
206百万円
106百万円
有限会社
タイホウ ヌサンタラ株式会社
113/126
EDINET提出書類
大豊工業株式会社(E02199)
有価証券報告書
(損益計算書関係)
※1 関係会社との取引高
(自
至
前事業年度
2024年4月1日
2025年3月31日)
(自
至
当事業年度
2025年4月1日
2026年3月31日)
営業取引に対する取引高
売上高
仕入高
営業取引以外の取引による取引高
※2
25,785百万円
10,173百万円
26,080百万円
10,023百万円
1,949百万円
2,914百万円
販売費に属する費用のおおよその割合は前事業年度7%、当事業年度7%、一般管理費に属する費用のお
およその割合は前事業年度93%、当事業年度93%であります。
販売費及び一般管理費のうち主要な費目及び金額は次のとおりであります。
(自
至
前事業年度
2024年4月1日
2025年3月31日)
研究開発費
荷造運搬費
給料
減価償却費
3,175百万円
647百万円
1,402百万円
366百万円
(自
至
当事業年度
2025年4月1日
2026年3月31日)
2,769百万円
591百万円
1,361百万円
381百万円
(有価証券関係)
前事業年度(2025年3月31日現在)
子会社株式及び関連会社株式(貸借対照表計上額子会社株式10,431百万円)、関係会社出資金(貸借対照
表計上額関係会社出資金8,363百万円)は、市場価格の無い株式等のため、記載しておりません。
当事業年度(2026年3月31日現在)
子会社株式及び関連会社株式(貸借対照表計上額子会社株式10,431百万円)、関係会社出資金(貸借対照
表計上額関係会社出資金8,363百万円)は、市場価格の無い株式等のため、記載しておりません。
114/126
EDINET提出書類
大豊工業株式会社(E02199)
有価証券報告書
(税効果会計関係)
繰延税金資産及び繰延税金負債の発生の主な原因別の内訳
1
前事業年度
(2025年3月31日)
当事業年度
(2026年3月31日)
(繰延税金資産)
退職給付引当金
減価償却費
未払賞与
関係会社株式・出資金評価損
債務保証損失引当金繰入額
棚卸資産評価減
繰越欠損金
減損損失
その他
182百万円
491百万円
586百万円
2,121百万円
497百万円
85百万円
1,896百万円
214百万円
279百万円
180百万円
493百万円
640百万円
2,185百万円
548百万円
54百万円
1,805百万円
2,865百万円
527百万円
繰延税金資産小計
評価性引当額
6,356百万円
△6,356百万円
9,300百万円
△9,300百万円
繰延税金資産合計
−
−
その他有価証券評価差額金
△595百万円
△491百万円
繰延税金負債合計
△595百万円
△491百万円
△595百万円
△491百万円
(繰延税金負債)
繰延税金資産(負債)の純額
2 法定実効税率と税効果会計適用後の法人税等の負担率との差異の原因となった主な項目別の内訳
前事業年度(2025年3月31日)
前事業年度は、税引前当期純損失であるため注記を省略しております。
当事業年度(2026年3月31日)
当事業年度は、税引前当期純損失であるため注記を省略しております。
(収益認識関係)
顧客との契約から生じる収益を理解するための基礎となる情報は、連結財務諸表「注記事項(収益認識関
係)」に記載されている内容と同一のため、注記を省略しております。
(重要な後発事象)
連結財務諸表「注記事項(重要な後発事象)」に記載されている内容と同一のため、注記を省略しておりま
す。
115/126
EDINET提出書類
大豊工業株式会社(E02199)
有価証券報告書
④【附属明細表】
【有形固定資産等明細表】
(単位:百万円)
区分
有形固定
資産
当期首残高
当期増加額
当期減少額
当期償却額
当期末残高
減価償却累計
額
4,131
329
0
3,226
16,020
324
5
225
2,509
10,265
3,988
71
4,264
67,127
17
34
0
16
262
559
911
1
474
7,566
8,106
1,235
(822)
104
(34)
9,919
(6,818)
35
(16)
994
(381)
8,106
48
26
1
14
59
174
4,525
2,916
6,474
(1,179)
967
27,978
8,212
6,548
(1,179)
12,301
(8,071)
17,340
93,660
442
93
287
249
ソフトウエア
仮勘定
156
608
67
696
リース資産
電話加入権
5
5
施設利用権
5
0
5
計
610
701
67
287
956
資産の種類
建物
構築物
機械及び装置
車両運搬具
工具、器具及び
備品
土地
リース資産
建設仮勘定
計
無形固定
資産
ソフトウエア
(注1)当期償却額の内書は、減損損失です。
(注2)当期減少額の内書は、減損損失です。
(注3)減価償却累計額には、減損損失累計額が含まれております。
(注4)増加の主な内容
(イ)建物
(ロ)機械及び装置
(ハ)工具、器具及び備品
(ニ)建設仮勘定
本社工場
工場インフラ工事
129百万円
岐阜工場
工場インフラ工事
50百万円
九州工場
工場インフラ工事
67百万円
岐阜工場
軸受製品・システム製品・ダイカスト製品製造設備 1,812百万円
本社工場
ダイカスト製品製造設備
536百万円
岐阜工場
軸受製品・システム製品・ダイカスト製品治具・工
具
355百万円
本社工場
ダイカスト製品治具・工具
282百万円
篠原工場
システム製品製造設備
120百万円
岐阜工場
軸受製品・システム製品・ダイカスト製品製造設備
979百万円
本社工場
ダイカスト製品治具・工具
555百万円
幸海工場
軸受製品製造設備
98百万円
116/126
EDINET提出書類
大豊工業株式会社(E02199)
有価証券報告書
【引当金明細表】
(単位:百万円)
区分
当期首残高
当期増加額
当期減少額
当期末残高
貸倒引当金
5
0
4
役員賞与引当金
32
35
32
35
製品保証引当金
218
73
110
181
退職給付引当金
608
324
351
581
1,655
113
1,769
債務保証損失引当金
(2)【主な資産及び負債の内容】
連結財務諸表を作成しているため、記載を省略しております。
(3)【その他】
該当事項はありません。
117/126
EDINET提出書類
大豊工業株式会社(E02199)
有価証券報告書
第6【提出会社の株式事務の概要】
事業年度
4月1日から3月31日まで
定時株主総会
6月中
基準日
3月31日
剰余金の配当の基準日
9月30日、3月31日
1単元の株式数
100株
単元未満株式の買取り
取扱場所
(特別口座)
東京都千代田区丸の内一丁目4番5号三菱UFJ信託銀行株式会社
株主名簿管理人
(特別口座)
東京都千代田区丸の内一丁目4番5号三菱UFJ信託銀行株式会社
取次所
−
買取手数料
株式の売買の委託に係る手数料相当額として別途定める金額
証券代行部
公告掲載方法
当社の公告方法は、電子公告としております。
ただし事故その他やむを得ない事由により電子公告をすることができないときは、日
本経済新聞に掲載しております。
当社の公告掲載URLは次のとおりであります。
https://www.taihonet.co.jp/
株主に対する特典
なし
(注)
当社の単元未満株主は、その有する単元未満株式について、次に掲げる権利以外の権利を行使することができ
ません。
会社法第189条第2項各号に掲げる権利
剰余金の配当を受ける権利
株主の有する株式数に応じて募集株式の割当ておよび募集新株予約権の割当てを受ける権利
118/126
EDINET提出書類
大豊工業株式会社(E02199)
有価証券報告書
第7【提出会社の参考情報】
1【提出会社の親会社等の情報】
当社に親会社等はありません。
2【その他の参考情報】
当事業年度の開始日から有価証券報告書提出日までの間に、次の書類を提出しております。
(1)有価証券報告書及びその添付書類並びに確認書
事業年度第119期(自 2024年4月1日至 2025年3月31日)
2025年6月19日関東財務局長に提出。
(2)内部統制報告書
事業年度第119期(自 2024年4月1日
2025年6月19日関東財務局長に提出。
至
2025年3月31日)
(3)半期報告書及び確認書
第120期中(自 2025年4月1日至 2025年9月30日)
2025年11月12日関東財務局長に提出。
(4)臨時報告書
企業内容等の開示に関する内閣府令第19条第2項第9号の2(株主総会における議決権行使の結果)の規定に基
づく臨時報告書
2025年6月20日関東財務局長に提出。
企業内容等の開示に関する内閣府令第19条第2項第4号(主要株主の異動)の規定に基づく臨時報告書
2026年6月10日関東財務局長に提出。
119/126
EDINET提出書類
大豊工業株式会社(E02199)
有価証券報告書
第二部【提出会社の保証会社等の情報】
該当事項はありません。
120/126
EDINET提出書類
大豊工業株式会社(E02199)
有価証券報告書
独立監査人の監査報告書及び内部統制監査報告書
2026年6月22日
大豊工業株式会社
取
締
役
会
御
中
太陽有限責任監査法人
名古屋事務所
指定有限責任社員
公認会計士
業務執行社員
古
田
賢
司
指定有限責任社員
公認会計士
業務執行社員
本
田
一
暁
<連結財務諸表監査>
監査意見
当監査法人は、金融商品取引法第193条の2第1項の規定に基づく監査証明を行うため、「経理の状況」に掲げられて
いる大豊工業株式会社の2025年4月1日から2026年3月31日までの連結会計年度の連結財務諸表、すなわち、連結貸借対
照表、連結損益計算書、連結包括利益計算書、連結株主資本等変動計算書、連結キャッシュ・フロー計算書、連結財務諸
表作成のための基本となる重要な事項、その他の注記及び連結附属明細表について監査を行った。
当監査法人は、上記の連結財務諸表が、我が国において一般に公正妥当と認められる企業会計の基準に準拠して、大豊
工業株式会社及び連結子会社の2026年3月31日現在の財政状態並びに同日をもって終了する連結会計年度の経営成績及び
キャッシュ・フローの状況を、全ての重要な点において適正に表示しているものと認める。
監査意見の根拠
当監査法人は、我が国において一般に公正妥当と認められる監査の基準に準拠して監査を行った。監査の基準における
当監査法人の責任は、「連結財務諸表監査における監査人の責任」に記載されている。当監査法人は、我が国における職
業倫理に関する規定(社会的影響度の高い事業体の財務諸表監査に適用される規定を含む。)に従って、会社及び連結子
会社から独立しており、また、監査人としてのその他の倫理上の責任を果たしている。当監査法人は、意見表明の基礎と
なる十分かつ適切な監査証拠を入手したと判断している。
監査上の主要な検討事項
監査上の主要な検討事項とは、当連結会計年度の連結財務諸表の監査において、監査人が職業的専門家として特に重要
であると判断した事項である。監査上の主要な検討事項は、連結財務諸表全体に対する監査の実施過程及び監査意見の形
成において対応した事項であり、当監査法人は、当該事項に対して個別に意見を表明するものではない。
121/126
EDINET提出書類
大豊工業株式会社(E02199)
有価証券報告書
大豊工業株式会社における固定資産の減損損失の認識の判定及び測定
監査上の主要な検討事項の内容及び決定理由
監査上の対応
会社の当連結会計年度の連結貸借対照表に計上されてい
る有形固定資産及び無形固定資産は38,761百万円である
が、そのうち大豊工業株式会社が特に重要である。会社を
取り巻く経済環境として、資材価格の上昇等に加え、自動
車業界における電動化や自動化の進展に伴う競争環境の変
化により大きな影響を受けている。大豊工業株式会社の自
動車部品関連セグメントの非軸受製品(ダイカスト製品
等)に係る資産グループについて、事業環境の変化を背景
として将来の見通しにおいて受注の減少が見込まれてお
り、これに伴う収益性の低下が認められる。
会社は、事業用資産について各セグメント内の製品別に
グルーピングを行い、減損の兆候を把握している。減損の
兆候があり減損損失を認識するかどうかの判定を行う場合
には、割引前将来キャッシュ・フローの総額を見積り、減
損損失を認識するかどうかの判定をしている。
減損損失を認識するかどうかの判定及び使用価値の算定
において見積られる将来キャッシュ・フローは、資産グ
ループごとの将来計画(以下、「将来計画」という)に基
づいている。将来計画は、製品の売上高の予測から変動費
や固定費などの各種費用の予測を控除して算定している。
また、製品の売上高の予測は顧客の生産計画等を基礎とし
て策定している。製品の売上高の予測に大きな影響を与え
る主要顧客における自動車生産台数の見通しについては、
先行きが不透明な状況が存在していることから、将来計画
におけるこれらの仮定には不確実性が伴う。
また、減損損失の測定の根拠となる正味売却価額は、外
部の専門評価機関を利用して算定されており、その算定に
は高い専門性を伴う。
以上より、当監査法人は、大豊工業株式会社における固
定資産の減損損失の認識の判定及び測定が、当連結会計年
度の連結財務諸表監査において特に重要であり、監査上の
主要な検討事項に該当すると判断した。
当監査法人は、大豊工業株式会社における固定資産の減
損損失の認識の判定及び測定の合理性を評価するため、主
に以下の監査手続を実施した。
・将来計画が取締役会により承認されていることを確か
めた。
・将来計画の不確実性を評価するために、製品の売上高
について過去の計画とその実績の比較を実施した。
・将来計画の重要な仮定となる主要顧客における自動車
生産台数の見通しの影響について、経営者に質問をし説明
を求めるとともに、将来計画に適切に反映されていること
を確かめた。
・将来計画に含まれる製品の売上高の予測について、顧
客から入手した内示等との照合及び過去の実績から計画さ
れた期間にわたる趨勢分析を実施した。
・会社が将来計画に対して考慮したストレスの合理性に
ついて、将来計画と過去実績との比較や市場環境に照らし
て検討をした。
・正味売却価額の算定の基礎となる不動産の鑑定評価額
について、経営者が利用した外部専門家の適格性、能力及
び客観性を評価した。
・不動産鑑定評価額の妥当性を確かめるために、当監査
法人が利用する外部の専門家を関与させ、鑑定評価の前提
条件や採用した評価手法について検討した。
その他の記載内容
その他の記載内容は、有価証券報告書に含まれる情報のうち、連結財務諸表及び財務諸表並びにこれらの監査報告書以
外の情報である。経営者の責任は、その他の記載内容を作成し開示することにある。また、監査役及び監査役会の責任
は、その他の記載内容の報告プロセスの整備及び運用における取締役の職務の執行を監視することにある。
当監査法人の連結財務諸表に対する監査意見の対象にはその他の記載内容は含まれておらず、当監査法人はその他の記
載内容に対して意見を表明するものではない。
連結財務諸表監査における当監査法人の責任は、その他の記載内容を通読し、通読の過程において、その他の記載内容
と連結財務諸表又は当監査法人が監査の過程で得た知識との間に重要な相違があるかどうか検討すること、また、そのよ
うな重要な相違以外にその他の記載内容に重要な誤りの兆候があるかどうか注意を払うことにある。
当監査法人は、実施した作業に基づき、その他の記載内容に重要な誤りがあると判断した場合には、その事実を報告す
ることが求められている。
その他の記載内容に関して、当監査法人が報告すべき事項はない。
122/126
EDINET提出書類
大豊工業株式会社(E02199)
有価証券報告書
連結財務諸表に対する経営者並びに監査役及び監査役会の責任
経営者の責任は、我が国において一般に公正妥当と認められる企業会計の基準に準拠して連結財務諸表を作成し適正に
表示することにある。これには、不正又は誤謬による重要な虚偽表示のない連結財務諸表を作成し適正に表示するために
経営者が必要と判断した内部統制を整備及び運用することが含まれる。
連結財務諸表を作成するに当たり、経営者は、継続企業の前提に基づき連結財務諸表を作成することが適切であるかど
うかを評価し、我が国において一般に公正妥当と認められる企業会計の基準に基づいて継続企業に関する事項を開示する
必要がある場合には当該事項を開示する責任がある。
監査役及び監査役会の責任は、財務報告プロセスの整備及び運用における取締役の職務の執行を監視することにある。
連結財務諸表監査における監査人の責任
監査人の責任は、監査人が実施した監査に基づいて、全体としての連結財務諸表に不正又は誤謬による重要な虚偽表示
がないかどうかについて合理的な保証を得て、監査報告書において独立の立場から連結財務諸表に対する意見を表明する
ことにある。虚偽表示は、不正又は誤謬により発生する可能性があり、個別に又は集計すると、連結財務諸表の利用者の
意思決定に影響を与えると合理的に見込まれる場合に、重要性があると判断される。
監査人は、我が国において一般に公正妥当と認められる監査の基準に従って、監査の過程を通じて、職業的専門家とし
ての判断を行い、職業的懐疑心を保持して以下を実施する。
・不正又は誤謬による重要な虚偽表示リスクを識別し、評価する。また、重要な虚偽表示リスクに対応した監査手続を立
案し、実施する。監査手続の選択及び適用は監査人の判断による。さらに、意見表明の基礎となる十分かつ適切な監査証
拠を入手する。
・連結財務諸表監査の目的は、内部統制の有効性について意見表明するためのものではないが、監査人は、リスク評価の
実施に際して、状況に応じた適切な監査手続を立案するために、監査に関連する内部統制を検討する。
・経営者が採用した会計方針及びその適用方法の適切性、並びに経営者によって行われた会計上の見積りの合理性及び関
連する注記事項の妥当性を評価する。
・経営者が継続企業を前提として連結財務諸表を作成することが適切であるかどうか、また、入手した監査証拠に基づ
き、継続企業の前提に重要な疑義を生じさせるような事象又は状況に関して重要な不確実性が認められるかどうか結論付
ける。継続企業の前提に関する重要な不確実性が認められる場合は、監査報告書において連結財務諸表の注記事項に注意
を喚起すること、又は重要な不確実性に関する連結財務諸表の注記事項が適切でない場合は、連結財務諸表に対して除外
事項付意見を表明することが求められている。監査人の結論は、監査報告書日までに入手した監査証拠に基づいている
が、将来の事象や状況により、企業は継続企業として存続できなくなる可能性がある。
・連結財務諸表の表示及び注記事項が、我が国において一般に公正妥当と認められる企業会計の基準に準拠しているかど
うかとともに、関連する注記事項を含めた連結財務諸表の表示、構成及び内容、並びに連結財務諸表が基礎となる取引や
会計事象を適正に表示しているかどうかを評価する。
・連結財務諸表に対する意見表明の基礎となる、会社及び連結子会社の財務情報に関する十分かつ適切な監査証拠を入手
するために、連結財務諸表の監査を計画し実施する。監査人は、連結財務諸表の監査に関する指揮、監督及び査閲に関し
て責任がある。監査人は、単独で監査意見に対して責任を負う。
監査人は、監査役及び監査役会に対して、計画した監査の範囲とその実施時期、監査の実施過程で識別した内部統制の
重要な不備を含む監査上の重要な発見事項、及び監査の基準で求められているその他の事項について報告を行う。
監査人は、監査役及び監査役会に対して、独立性についての我が国における職業倫理に関する規定を遵守したこと、並
びに監査人の独立性に影響を与えると合理的に考えられる事項、及び阻害要因を除去するための対応策を講じている場合
又は阻害要因を許容可能な水準にまで軽減するためのセーフガードを適用している場合はその内容について報告を行う。
監査人は、監査役及び監査役会と協議した事項のうち、当連結会計年度の連結財務諸表の監査で特に重要であると判断
した事項を監査上の主要な検討事項と決定し、監査報告書において記載する。ただし、法令等により当該事項の公表が禁
止されている場合や、極めて限定的ではあるが、監査報告書において報告することにより生じる不利益が公共の利益を上
回ると合理的に見込まれるため、監査人が報告すべきでないと判断した場合は、当該事項を記載しない。
<内部統制監査>
監査意見
当監査法人は、金融商品取引法第193条の2第2項の規定に基づく監査証明を行うため、大豊工業株式会社の2026年3
月31日現在の内部統制報告書について監査を行った。
当監査法人は、大豊工業株式会社が2026年3月31日現在の財務報告に係る内部統制は有効であると表示した上記の内部
統制報告書が、我が国において一般に公正妥当と認められる財務報告に係る内部統制の評価の基準に準拠して、財務報告
に係る内部統制の評価結果について、全ての重要な点において適正に表示しているものと認める。
123/126
EDINET提出書類
大豊工業株式会社(E02199)
有価証券報告書
監査意見の根拠
当監査法人は、我が国において一般に公正妥当と認められる財務報告に係る内部統制の監査の基準に準拠して内部統制
監査を行った。財務報告に係る内部統制の監査の基準における当監査法人の責任は、「内部統制監査における監査人の責
任」に記載されている。当監査法人は、我が国における職業倫理に関する規定(社会的影響度の高い事業体の財務諸表監
査に適用される規定を含む。)に従って、会社及び連結子会社から独立しており、また、監査人としてのその他の倫理上
の責任を果たしている。当監査法人は、意見表明の基礎となる十分かつ適切な監査証拠を入手したと判断している。
内部統制報告書に対する経営者並びに監査役及び監査役会の責任
経営者の責任は、財務報告に係る内部統制を整備及び運用し、我が国において一般に公正妥当と認められる財務報告に
係る内部統制の評価の基準に準拠して内部統制報告書を作成し適正に表示することにある。
監査役及び監査役会の責任は、財務報告に係る内部統制の整備及び運用状況を監視、検証することにある。
なお、財務報告に係る内部統制により財務報告の虚偽の記載を完全には防止又は発見することができない可能性があ
る。
内部統制監査における監査人の責任
監査人の責任は、監査人が実施した内部統制監査に基づいて、内部統制報告書に重要な虚偽表示がないかどうかについ
て合理的な保証を得て、内部統制監査報告書において独立の立場から内部統制報告書に対する意見を表明することにあ
る。
監査人は、我が国において一般に公正妥当と認められる財務報告に係る内部統制の監査の基準に従って、監査の過程を
通じて、職業的専門家としての判断を行い、職業的懐疑心を保持して以下を実施する。
・内部統制報告書における財務報告に係る内部統制の評価結果について監査証拠を入手するための監査手続を実施する。
内部統制監査の監査手続は、監査人の判断により、財務報告の信頼性に及ぼす影響の重要性に基づいて選択及び適用され
る。
・財務報告に係る内部統制の評価範囲、評価手続及び評価結果について経営者が行った記載を含め、全体としての内部統
制報告書の表示を検討する。
・内部統制報告書における財務報告に係る内部統制の評価結果に関する十分かつ適切な監査証拠を入手するために、内部
統制の監査を計画し実施する。監査人は、内部統制報告書の監査に関する指揮、監督及び査閲に関して責任がある。監査
人は、単独で監査意見に対して責任を負う。
監査人は、監査役及び監査役会に対して、計画した内部統制監査の範囲とその実施時期、内部統制監査の実施結果、識
別した内部統制の開示すべき重要な不備、その是正結果、及び内部統制の監査の基準で求められているその他の事項につ
いて報告を行う。
監査人は、監査役及び監査役会に対して、独立性についての我が国における職業倫理に関する規定を遵守したこと、並
びに監査人の独立性に影響を与えると合理的に考えられる事項、及び阻害要因を除去するための対応策を講じている場合
又は阻害要因を許容可能な水準にまで軽減するためのセーフガードを適用している場合はその内容について報告を行う。
<報酬関連情報>
当監査法人及び当監査法人と同一のネットワークに属する者に対する、会社及び子会社の監査証明業務に基づく報酬及
び非監査業務に基づく報酬の額は、「提出会社の状況」に含まれるコーポレート・ガバナンスの状況等(3)【監査の状
況】に記載されている。
利害関係
会社及び連結子会社と当監査法人又は業務執行社員との間には、公認会計士法の規定により記載すべき利害関係はな
い。
以
上
(注)1.上記は監査報告書の原本に記載された事項を電子化したものであり、その原本は当社(有価証券報告書提出会
社)が別途保管しております。
2.XBRLデータは監査の対象には含まれていません。
124/126
EDINET提出書類
大豊工業株式会社(E02199)
有価証券報告書
独
立
監
査
人
の
監
査
報
告
書
2026年6月22日
大豊工業株式会社
取
締
役
会
御
中
太陽有限責任監査法人
名古屋事務所
指定有限責任社員
公認会計士
業務執行社員
古
田
賢
司
指定有限責任社員
公認会計士
業務執行社員
本
田
一
暁
<財務諸表監査>
監査意見
当監査法人は、金融商品取引法第193条の2第1項の規定に基づく監査証明を行うため、「経理の状況」に掲げられて
いる大豊工業株式会社の2025年4月1日から2026年3月31日までの第120期事業年度の財務諸表、すなわち、貸借対照
表、損益計算書、株主資本等変動計算書、重要な会計方針、その他の注記及び附属明細表について監査を行った。
当監査法人は、上記の財務諸表が、我が国において一般に公正妥当と認められる企業会計の基準に準拠して、大豊工業
株式会社の2026年3月31日現在の財政状態及び同日をもって終了する事業年度の経営成績を、全ての重要な点において適
正に表示しているものと認める。
監査意見の根拠
当監査法人は、我が国において一般に公正妥当と認められる監査の基準に準拠して監査を行った。監査の基準における
当監査法人の責任は、「財務諸表監査における監査人の責任」に記載されている。当監査法人は、我が国における職業倫
理に関する規定(社会的影響度の高い事業体の財務諸表監査に適用される規定を含む。)に従って、会社から独立してお
り、また、監査人としてのその他の倫理上の責任を果たしている。当監査法人は、意見表明の基礎となる十分かつ適切な
監査証拠を入手したと判断している。
監査上の主要な検討事項
監査上の主要な検討事項とは、当事業年度の財務諸表の監査において、監査人が職業的専門家として特に重要であると
判断した事項である。監査上の主要な検討事項は、財務諸表全体に対する監査の実施過程及び監査意見の形成において対
応した事項であり、当監査法人は、当該事項に対して個別に意見を表明するものではない。
固定資産の減損損失の認識の判定及び測定
連結財務諸表の監査報告書に記載されている監査上の主要な検討事項(大豊工業株式会社における固定資産の減損損失
の認識の判定及び測定)と同一内容であるため、記載を省略している。
その他の記載内容
その他の記載内容は、有価証券報告書に含まれる情報のうち、連結財務諸表及び財務諸表並びにこれらの監査報告書以
外の情報である。経営者の責任は、その他の記載内容を作成し開示することにある。また、監査役及び監査役会の責任
は、その他の記載内容の報告プロセスの整備及び運用における取締役の職務の執行を監視することにある。
当監査法人の財務諸表に対する監査意見の対象にはその他の記載内容は含まれておらず、当監査法人はその他の記載内
容に対して意見を表明するものではない。
財務諸表監査における当監査法人の責任は、その他の記載内容を通読し、通読の過程において、その他の記載内容と財
務諸表又は当監査法人が監査の過程で得た知識との間に重要な相違があるかどうか検討すること、また、そのような重要
な相違以外にその他の記載内容に重要な誤りの兆候があるかどうか注意を払うことにある。
当監査法人は、実施した作業に基づき、その他の記載内容に重要な誤りがあると判断した場合には、その事実を報告す
ることが求められている。
その他の記載内容に関して、当監査法人が報告すべき事項はない。
125/126
EDINET提出書類
大豊工業株式会社(E02199)
有価証券報告書
財務諸表に対する経営者並びに監査役及び監査役会の責任
経営者の責任は、我が国において一般に公正妥当と認められる企業会計の基準に準拠して財務諸表を作成し適正に表示
することにある。これには、不正又は誤謬による重要な虚偽表示のない財務諸表を作成し適正に表示するために経営者が
必要と判断した内部統制を整備及び運用することが含まれる。
財務諸表を作成するに当たり、経営者は、継続企業の前提に基づき財務諸表を作成することが適切であるかどうかを評
価し、我が国において一般に公正妥当と認められる企業会計の基準に基づいて継続企業に関する事項を開示する必要があ
る場合には当該事項を開示する責任がある。
監査役及び監査役会の責任は、財務報告プロセスの整備及び運用における取締役の職務の執行を監視することにある。
財務諸表監査における監査人の責任
監査人の責任は、監査人が実施した監査に基づいて、全体としての財務諸表に不正又は誤謬による重要な虚偽表示がな
いかどうかについて合理的な保証を得て、監査報告書において独立の立場から財務諸表に対する意見を表明することにあ
る。虚偽表示は、不正又は誤謬により発生する可能性があり、個別に又は集計すると、財務諸表の利用者の意思決定に影
響を与えると合理的に見込まれる場合に、重要性があると判断される。
監査人は、我が国において一般に公正妥当と認められる監査の基準に従って、監査の過程を通じて、職業的専門家とし
ての判断を行い、職業的懐疑心を保持して以下を実施する。
・不正又は誤謬による重要な虚偽表示リスクを識別し、評価する。また、重要な虚偽表示リスクに対応した監査手続を立
案し、実施する。監査手続の選択及び適用は監査人の判断による。さらに、意見表明の基礎となる十分かつ適切な監査証
拠を入手する。
・財務諸表監査の目的は、内部統制の有効性について意見表明するためのものではないが、監査人は、リスク評価の実施
に際して、状況に応じた適切な監査手続を立案するために、監査に関連する内部統制を検討する。
・経営者が採用した会計方針及びその適用方法の適切性、並びに経営者によって行われた会計上の見積りの合理性及び関
連する注記事項の妥当性を評価する。
・経営者が継続企業を前提として財務諸表を作成することが適切であるかどうか、また、入手した監査証拠に基づき、継
続企業の前提に重要な疑義を生じさせるような事象又は状況に関して重要な不確実性が認められるかどうか結論付ける。
継続企業の前提に関する重要な不確実性が認められる場合は、監査報告書において財務諸表の注記事項に注意を喚起する
こと、又は重要な不確実性に関する財務諸表の注記事項が適切でない場合は、財務諸表に対して除外事項付意見を表明す
ることが求められている。監査人の結論は、監査報告書日までに入手した監査証拠に基づいているが、将来の事象や状況
により、企業は継続企業として存続できなくなる可能性がある。
・財務諸表の表示及び注記事項が、我が国において一般に公正妥当と認められる企業会計の基準に準拠しているかどうか
とともに、関連する注記事項を含めた財務諸表の表示、構成及び内容、並びに財務諸表が基礎となる取引や会計事象を適
正に表示しているかどうかを評価する。
監査人は、監査役及び監査役会に対して、計画した監査の範囲とその実施時期、監査の実施過程で識別した内部統制の
重要な不備を含む監査上の重要な発見事項、及び監査の基準で求められているその他の事項について報告を行う。
監査人は、監査役及び監査役会に対して、独立性についての我が国における職業倫理に関する規定を遵守したこと、並
びに監査人の独立性に影響を与えると合理的に考えられる事項、及び阻害要因を除去するための対応策を講じている場合
又は阻害要因を許容可能な水準にまで軽減するためのセーフガードを適用している場合はその内容について報告を行う。
監査人は、監査役及び監査役会と協議した事項のうち、当事業年度の財務諸表の監査で特に重要であると判断した事項
を監査上の主要な検討事項と決定し、監査報告書において記載する。ただし、法令等により当該事項の公表が禁止されて
いる場合や、極めて限定的ではあるが、監査報告書において報告することにより生じる不利益が公共の利益を上回ると合
理的に見込まれるため、監査人が報告すべきでないと判断した場合は、当該事項を記載しない。
<報酬関連情報>
報酬関連情報は、連結財務諸表の監査報告書に記載されている。
利害関係
会社と当監査法人又は業務執行社員との間には、公認会計士法の規定により記載すべき利害関係はない。
以
(注)1.上記の監査報告書の原本は当社(有価証券報告書提出会社)が別途保管しております。
2.XBRLデータは監査の対象には含まれていません。
126/126
上

 お問い合わせ
 English