自己株券買付状況報告書(法24条の6第1項に基づくもの)
Bull 2
Bear 0
Capital return
6454
Fiscal year ends March
Quarters are offset from the calendar — Q1 is Apr–Jun
|
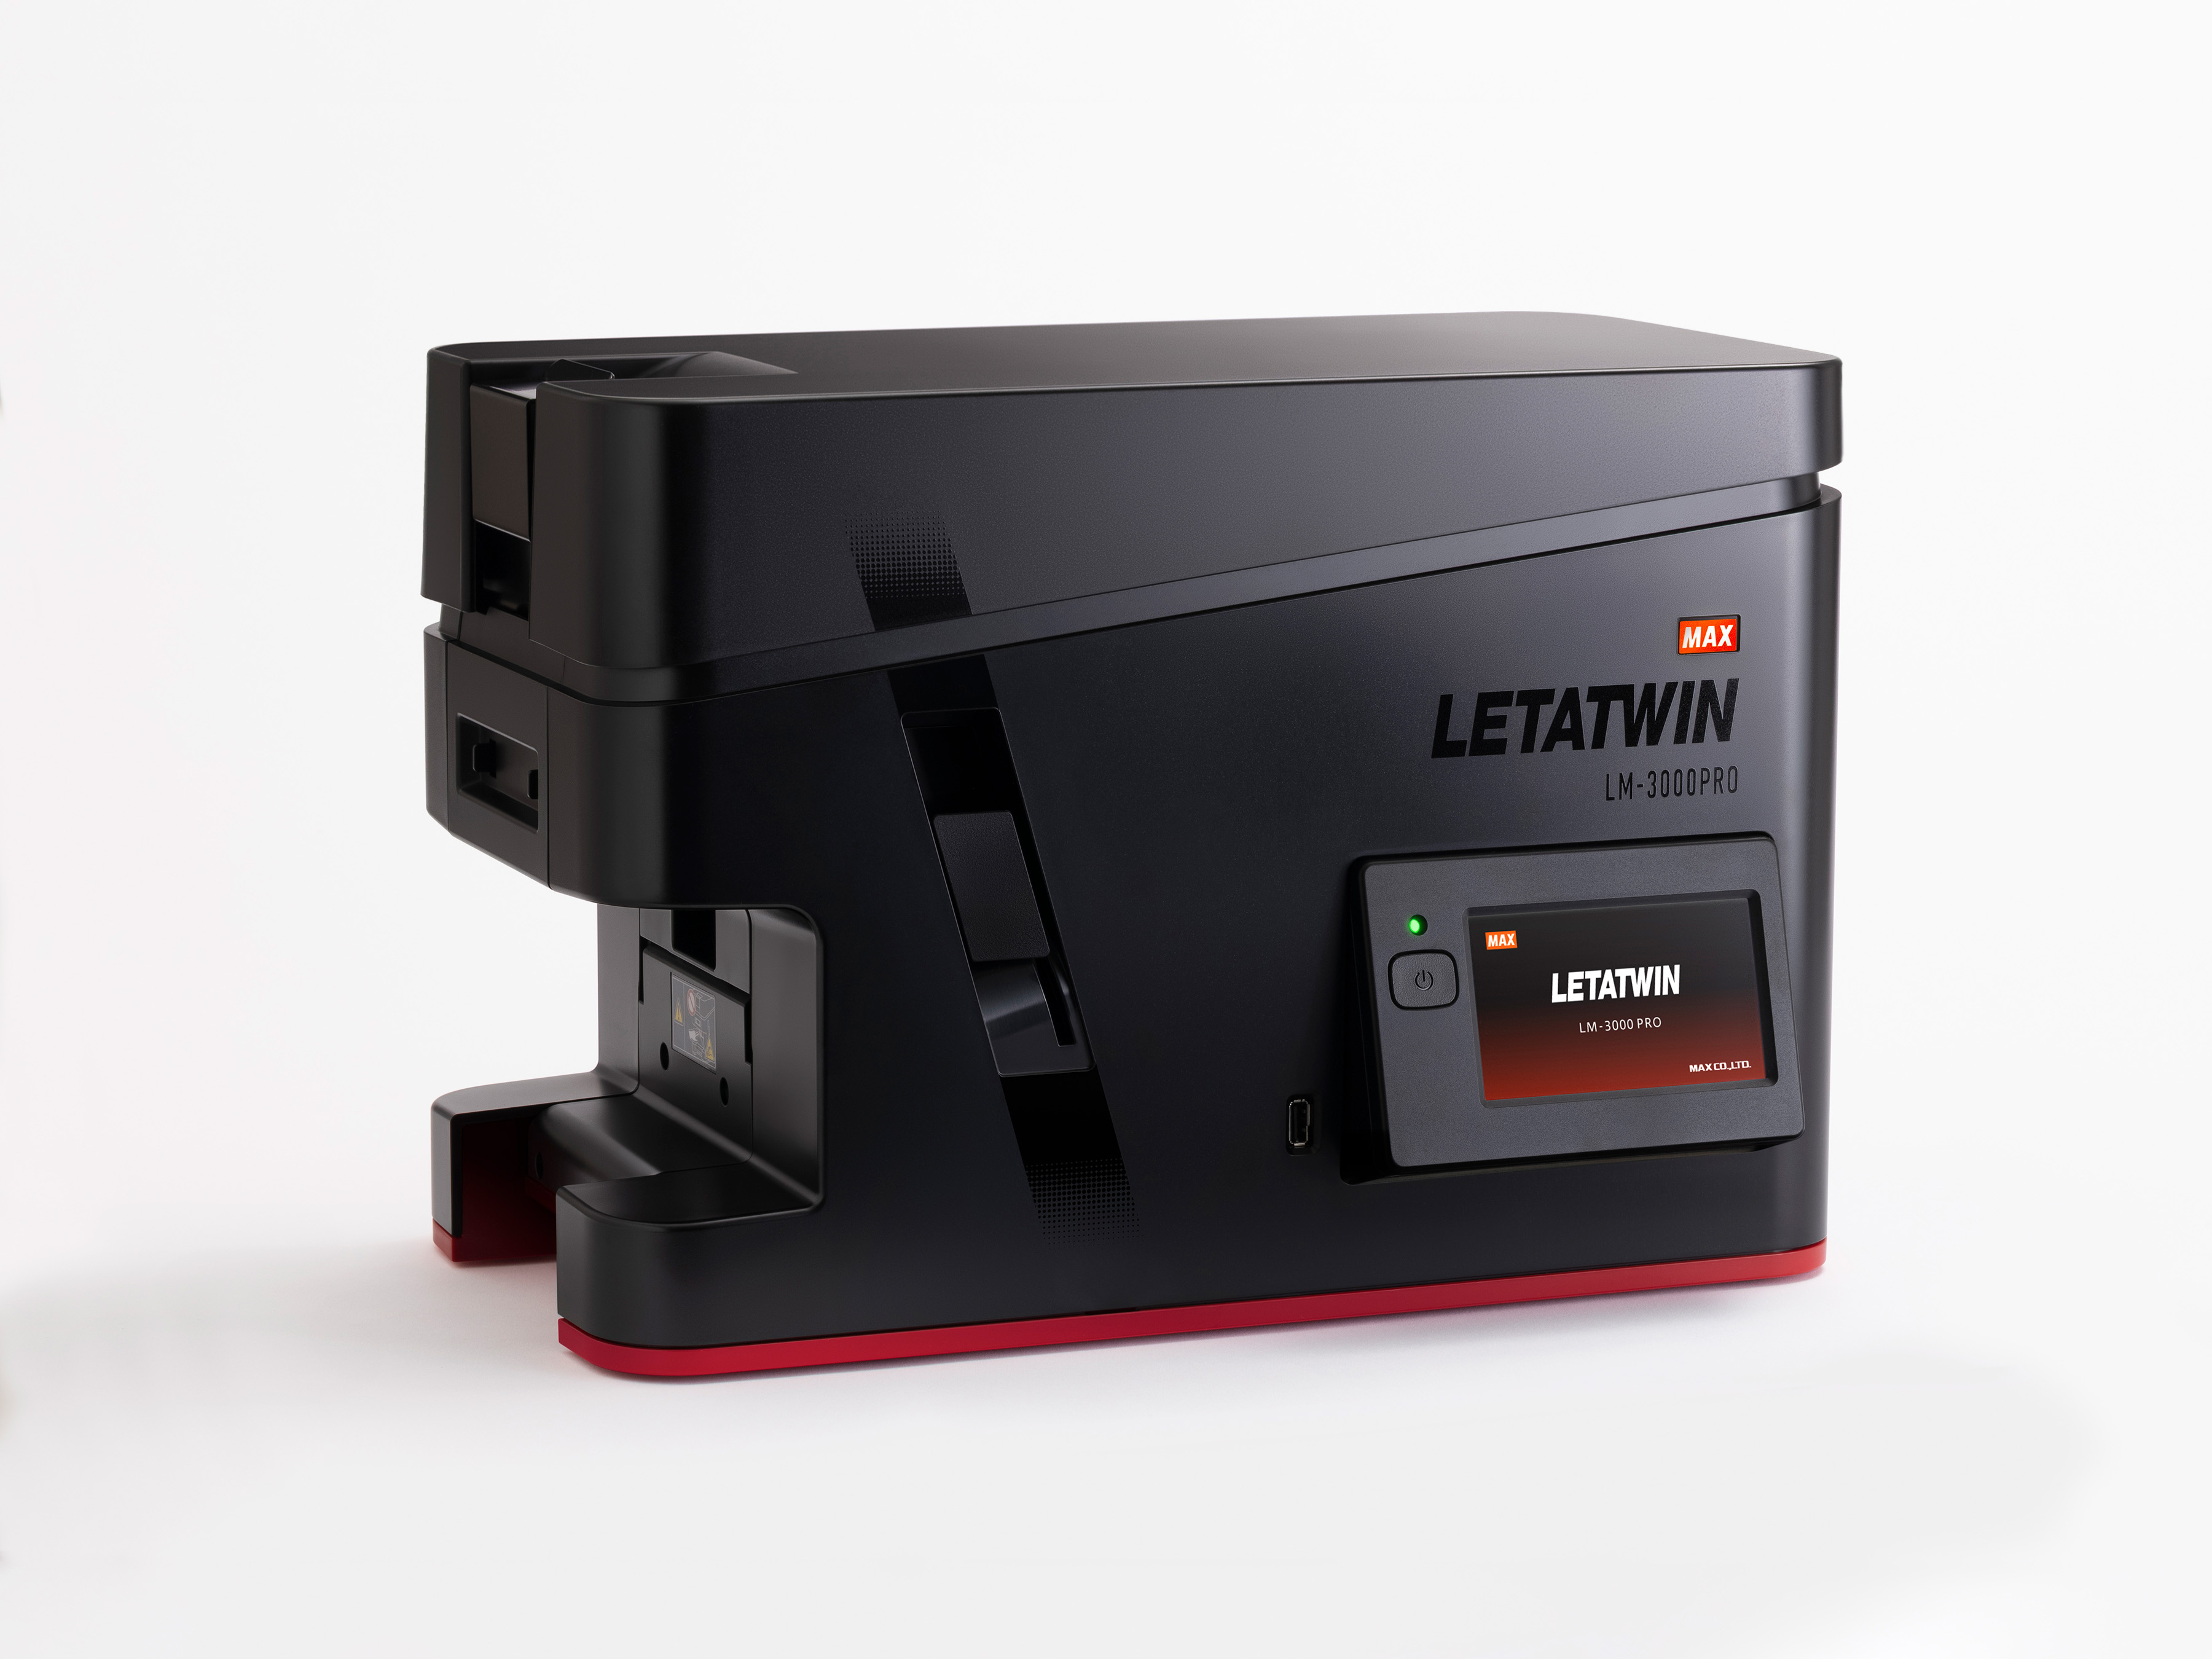
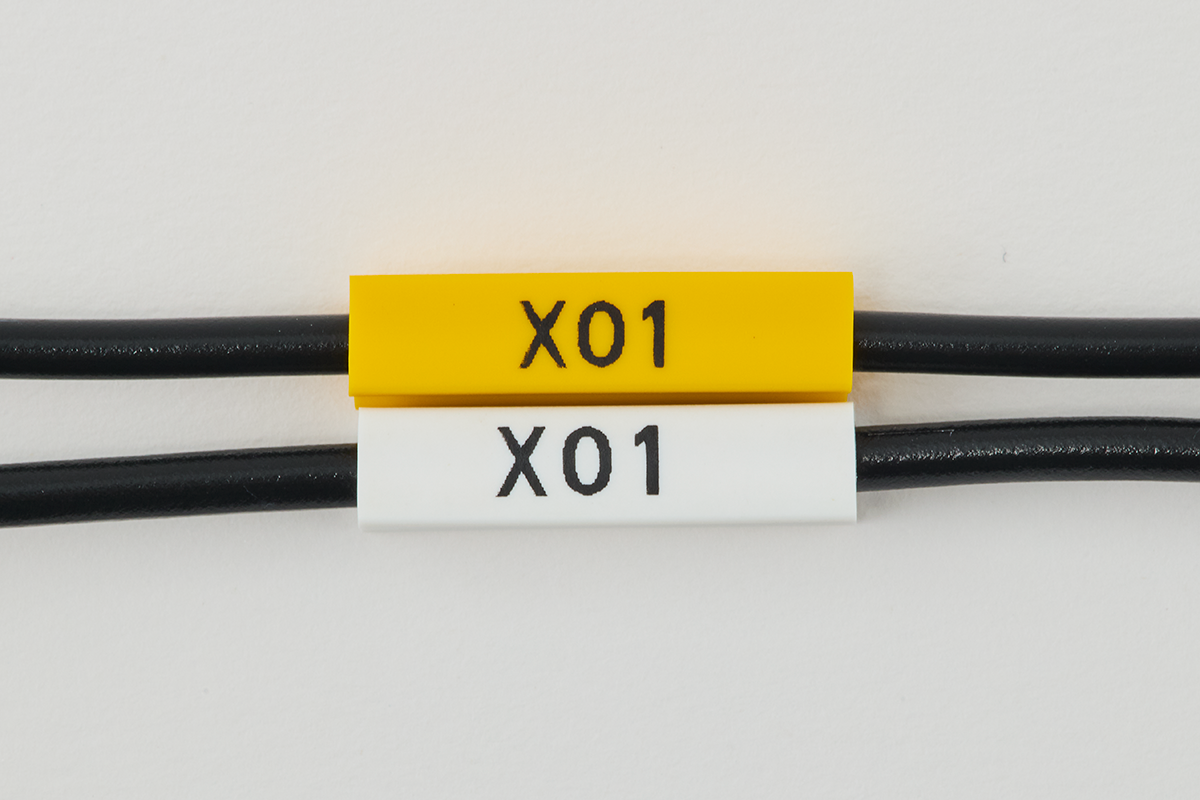
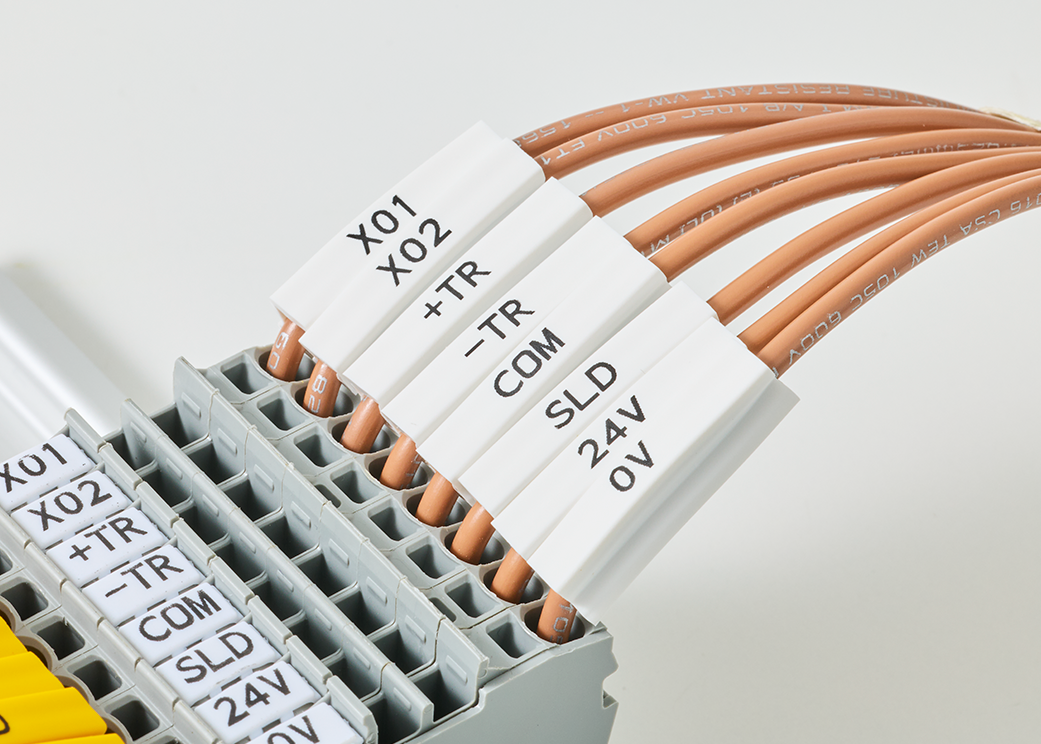
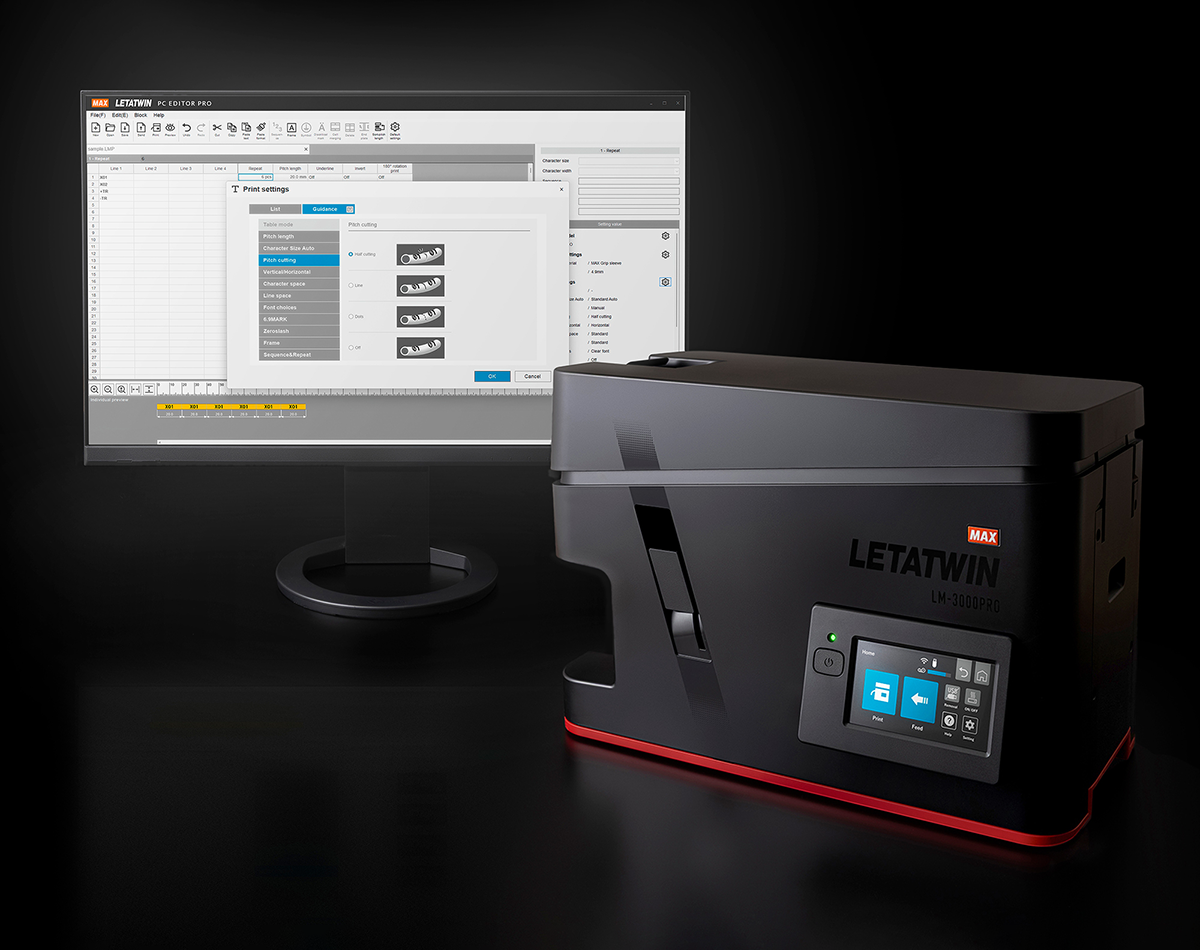
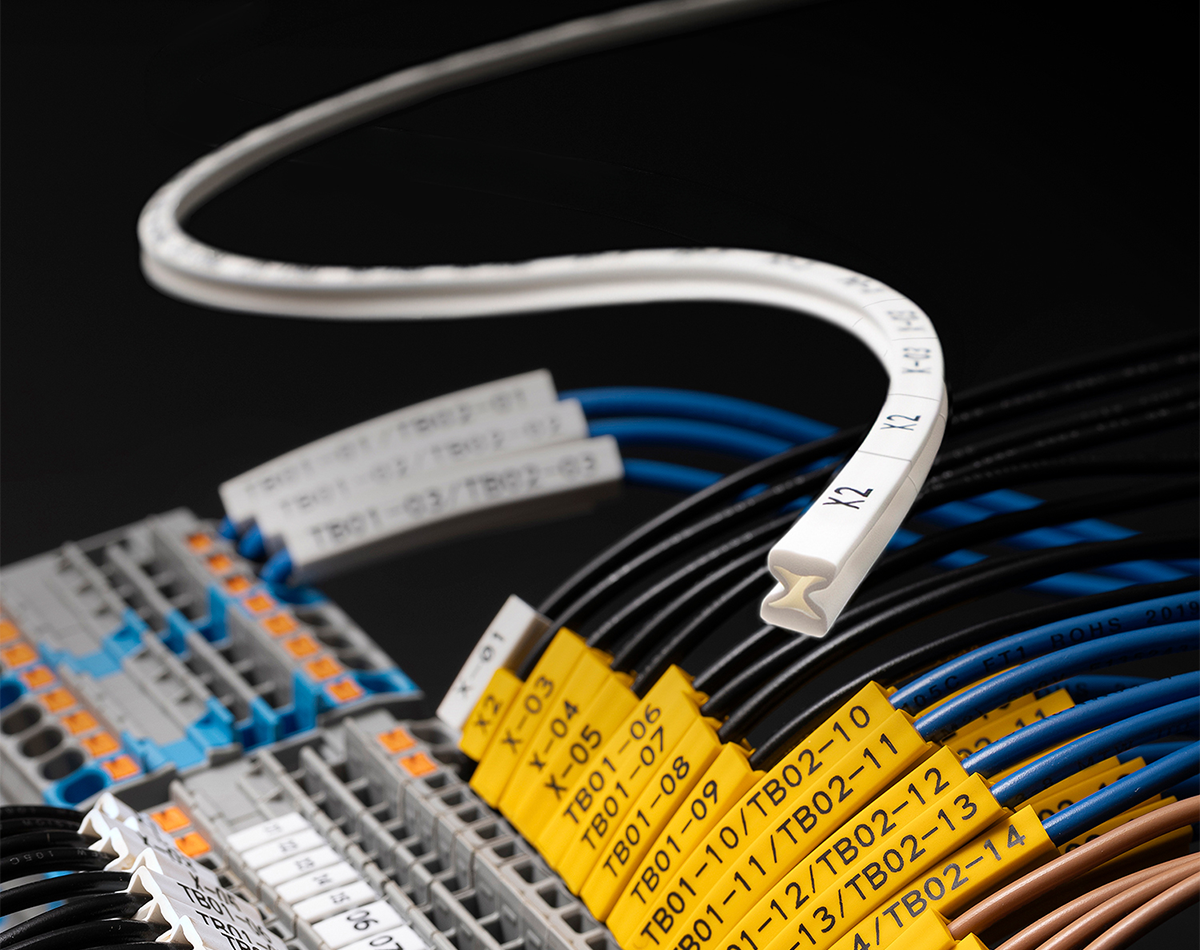
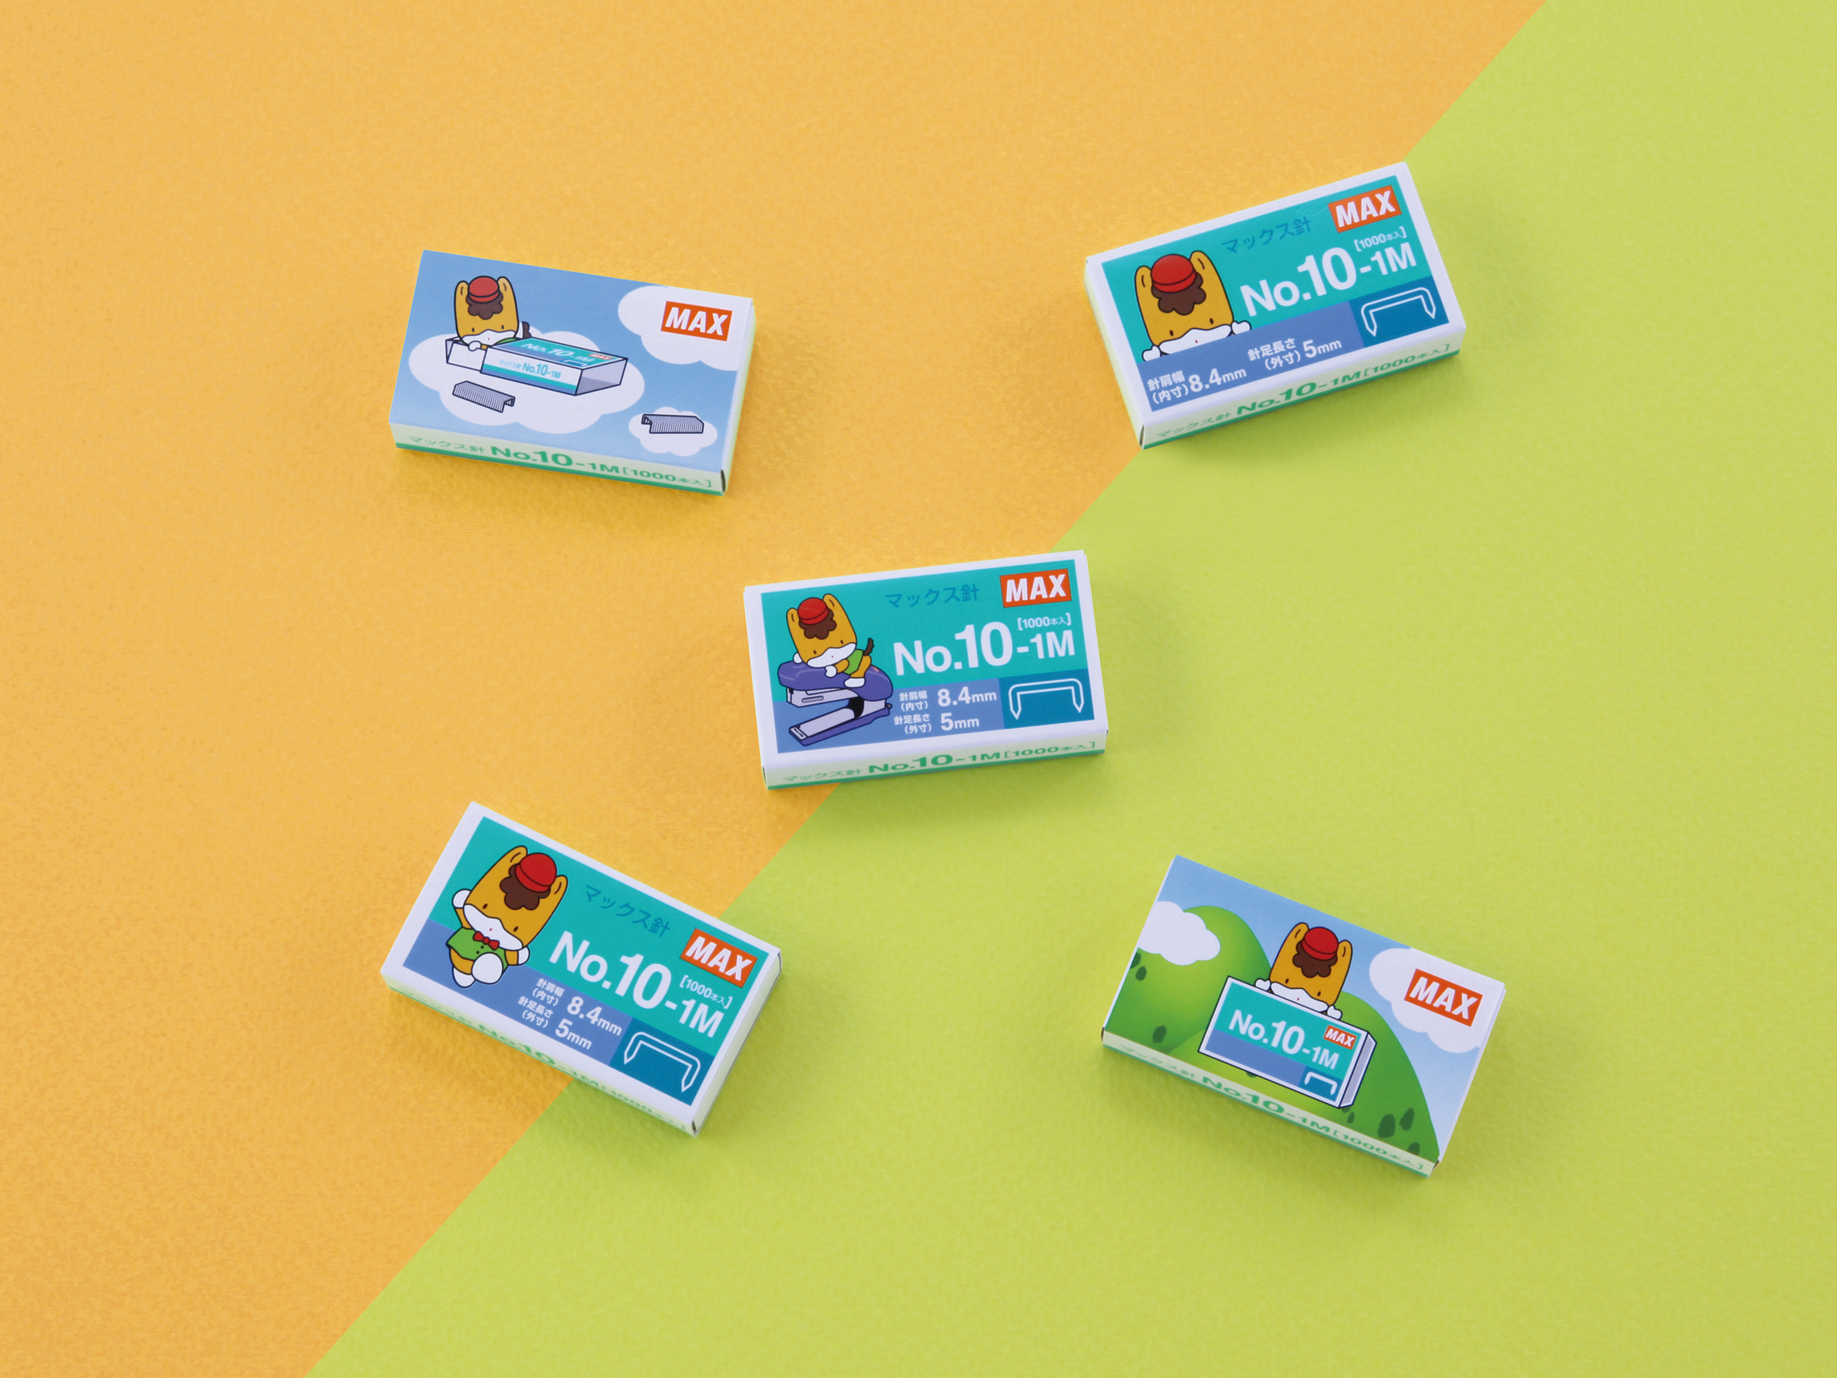
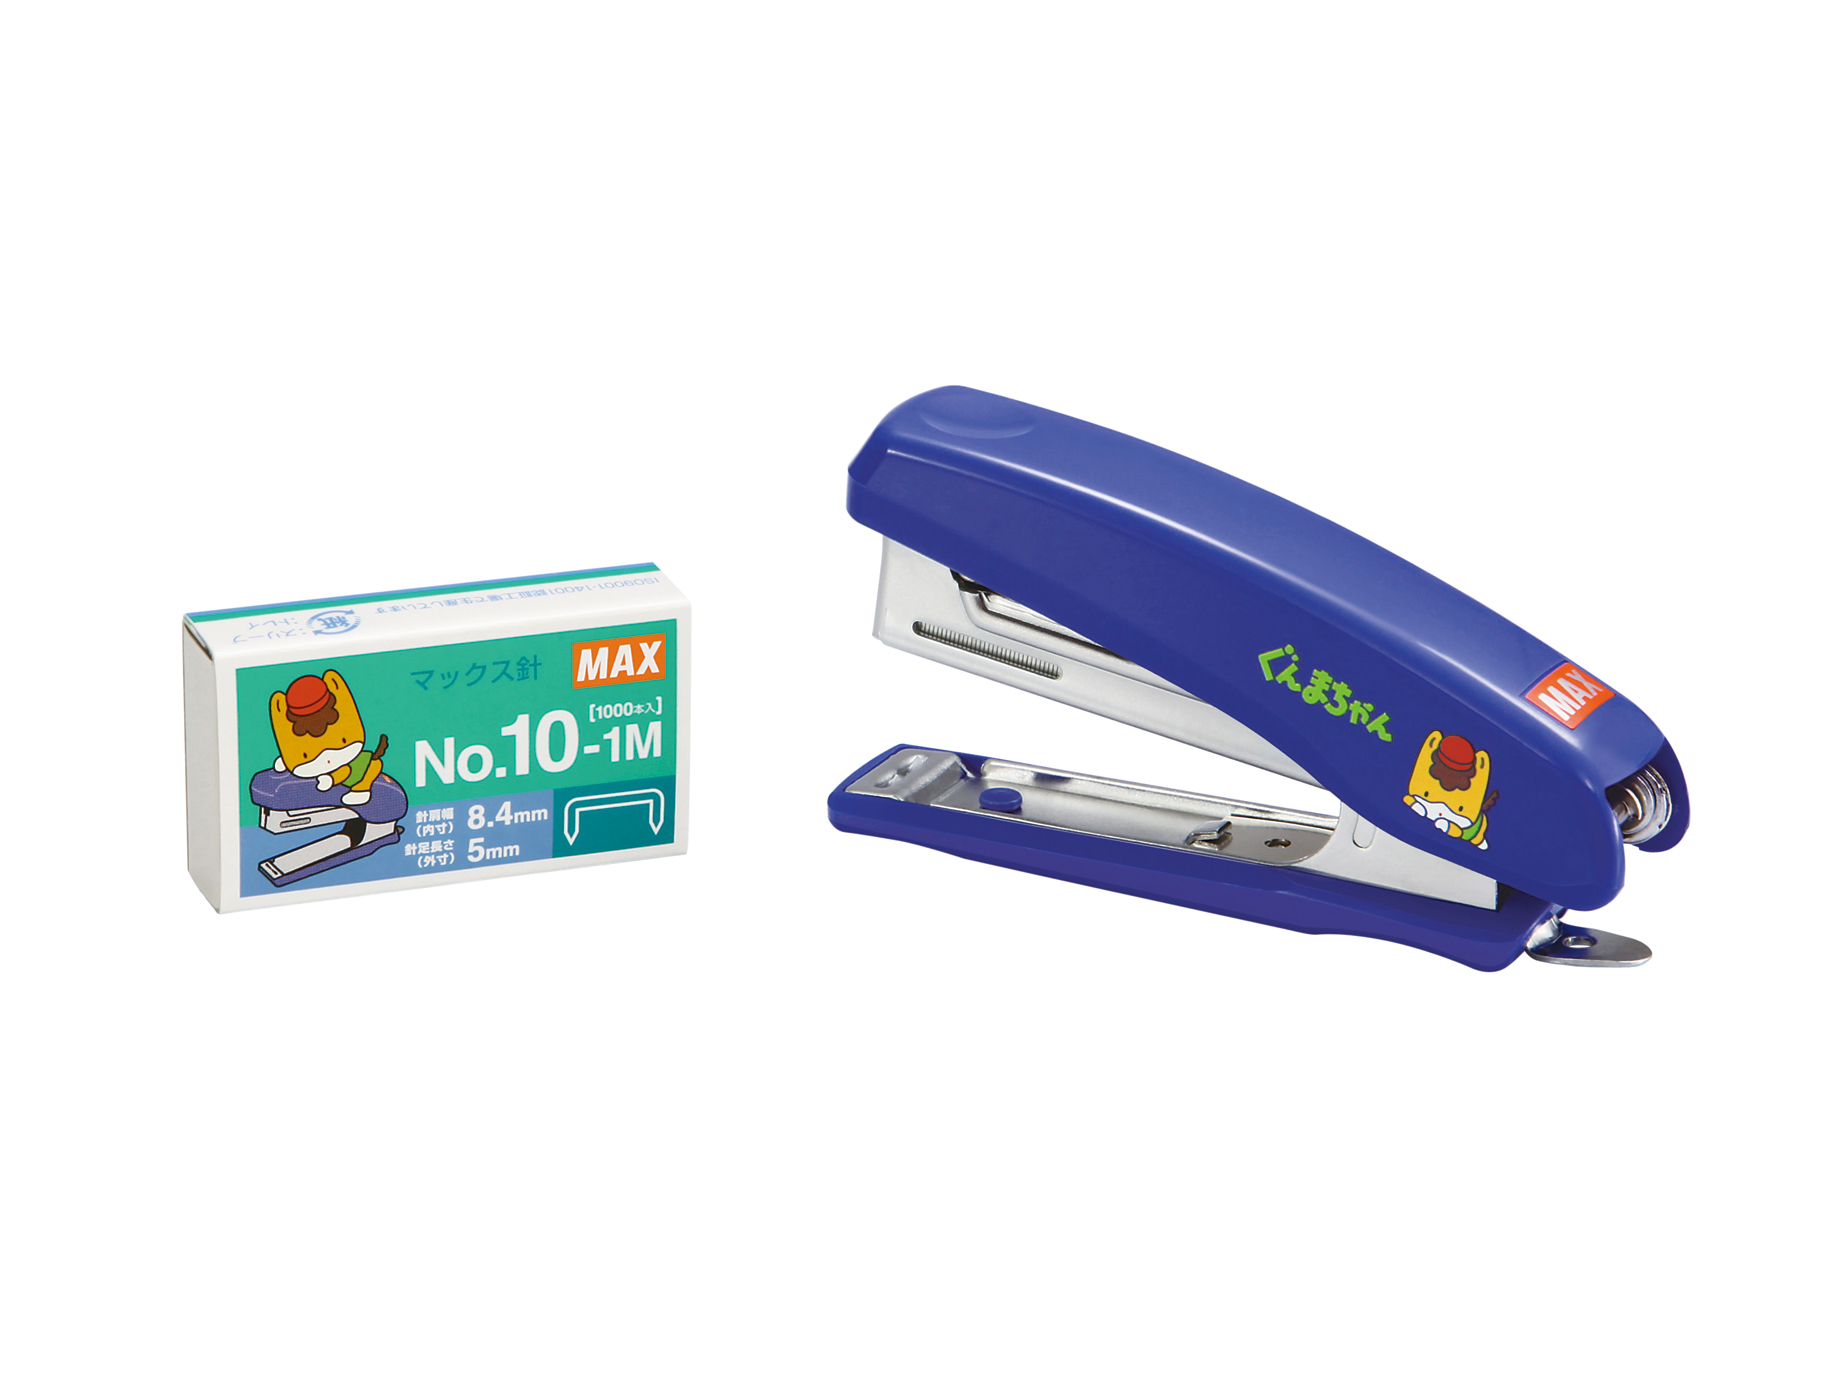
Max Co., Ltd. is a manufacturer and seller of office, industrial, and healthcare rehabilitation (HCR) equipment. The company produces office supplies such as staplers, time recorders, character display devices, and auto-staplers, alongside industrial machinery including nail drivers, air compressors, rebar tying machines, and charging tools. Its HCR segment focuses on standard and special wheelchairs. The group operates through subsidiaries including MAX (THAILAND) CO., LTD., MAX FASTENERS (M) SDN. BHD., and Kawamura Cycle Co., Ltd., which handles HCR production. Domestic sales are supported by Max Sales Co., Ltd., while international distribution is managed by entities such as MAX USA CORP. Additional group companies provide logistics, warehousing, and after-sales engineering services. Summarised from the annual report, fiscal year ended Mar 2026 |
Industry Specialty Industrial Machinery | Homepage max-ltd.co.jp |
| Sector Industrials | IR page max-ltd.co.jp | |
|
Tags
office equipment, staplers, time recorders, industrial machinery, nail drivers, air compressors, rebar tying machines, wheelchairs, healthcare rehabilitation, logistics services, MAX (THAILAND) CO. LTD., MAX FASTENERS (M) SDN. BHD., Kawamura Cycle Co. Ltd., Max Sales Co. Ltd., MAX USA CORP., Max Logistics Warehouse Co. Ltd., Max Engineering Service Co. Ltd.
|
Press page max-ltd.co.jp/about/ir/ir_news |
Metrics
| Valuation | |
|---|---|
| Market cap | ¥ 342.702B |
| Market cap (USD) | $ 2.142B |
| P/E | 22.73 |
| PEG | 1.03 |
| P/BV | 3.10 |
| P/S | 3.23 |
| P/OCF | 20.92 |
| P/FCF | 27.36 |
| Dividend yield | 8.0% |
| Turnover / mcap | — |
| Returns | |
|---|---|
| ROE | 12.5% |
| ROI | 11.9% |
| ROIC | 11.3% |
| Profit margin | 13.9% |
| Growth | |
|---|---|
| Revenue growing | Yes |
| Profits growing | Yes |
| Revenue up 3y | Yes |
| Revenue up 5y | Yes |
| Earnings growth 3y (net profit CAGR) | 22.2% |
| Quality | |
|---|---|
| Profitable | Yes |
| Margin expanding | Yes |
| Buying back stock | Yes |
| Diluting (TTM) | — |
| Debt/Equity | — |
| Podcast bulls (TTM) | Sign up |
| Podcast bears (TTM) | Sign up |
| Podcast sentiment (TTM) | Sign up |
| Podcast sentiment % (TTM) | Sign up |
| News sentiment (TTM) | 0 |
| Quality score | 47.1% |
| Insiders | |
|---|---|
| Buys, 1w | Sign up |
| Buys, 1m | Sign up |
| Buys, 1y | Sign up |
| Sells, 1w | Sign up |
| Sells, 1m | Sign up |
| Sells, 1y | Sign up |
Sign up to see this company's insider trades
| Figure | FY 2026 | FY 2025 | FY 2024 | FY 2023 | FY 2022 | FY 2021 | FY 2020 | FY 2019 | FY 2018 | FY 2017 | FY 2016 | FY 2015 | FY 2014 | FY 2013 |
|---|---|---|---|---|---|---|---|---|---|---|---|---|---|---|
| Revenue | 99.607B | 91.839B | 86.638B | 84.316B | 73.958B | 64.029B | 69.671B | 70.118B | 68.138B | 66.967B | 66.51B | 64.95B | 64.791B | 57.57B |
| Net profit | 13.891B | 11.225B | 10.435B | 7.619B | 6.09B | 5.153B | 5.51B | 5.064B | 4.654B | 4.726B | 3.512B | 3.222B | 2.809B | 2.49B |
| Free cash flow | 11.415B | 11.879B | 9.176B | 4.675B | 1.469B | 3.855B | 5.431B | 4.582B | 4.203B | 6.424B | 3.439B | — | — | — |
| Figure | FY 2026 | FY 2025 | FY 2024 | FY 2023 | FY 2022 | FY 2021 | FY 2020 | FY 2019 | FY 2018 | FY 2017 | FY 2016 | FY 2015 | FY 2014 | FY 2013 |
|---|---|---|---|---|---|---|---|---|---|---|---|---|---|---|
| Share price | 1.605K | 4.244K | 3.254K | 2.119K | 1.703K | 1.637K | 1.664K | 1.627K | 1.366K | 1.48K | 1.156K | 1.415K | 1.145K | 1.168K |
| Price performance 12m | -0.62 | 0.3 | 0.54 | 0.24 | 0.04 | -0.02 | 0.02 | 0.19 | -0.08 | 0.28 | -0.18 | 0.24 | -0.02 | — |
Filed figures
Lines the statements and their notes report beside the headline figures, read from the filings' XBRL as filed (no restatement applied), with figures computed from one filing's own lines. Cash-flow lines carry their cash direction: an outflow is negative. Each period links to its filing; a figure's period, report date and tag are in its tooltip.
| Figure | Mar 2017 | Mar 2018 | Mar 2019 | Mar 2020 | Mar 2021 | Mar 2022 | Mar 2023 | Mar 2024 | Mar 2025 | Mar 2026 |
|---|---|---|---|---|---|---|---|---|---|---|
| Balance sheet detail | ||||||||||
| Trade receivables (JPY) | 14.7B | 14.9B | 14.4B | 13.5B | 12.6B | 13.8B | 14.7B | 15.8B | 15.6B | 16.8B |
| ↳ YoY growth | +2.7% | +0.7% | -3.1% | -6.0% | -6.6% | +9.1% | +6.8% | +7.1% | -1.3% | +7.8% |
| ↳ 5y CAGR | -2.5% | -1.3% | -0.2% | +1.8% | +2.8% | +5.8% | ||||
| Borrowings, current (JPY) | 1.95B | 1.85B | 1.85B | 1.85B | 1.85B | 2B | 1.85B | 1.05B | 750M | 750M |
| Borrowings, non-current (JPY) | 50M | 150M | 150M | 150M | 150M | — | 125M | 125M | 125M | 125M |
| Lease liabilities (JPY) | 440M | 483M | 450M | 566M | 601M | 633M | 673M | 591M | 643M | 666M |
| Cash and deposits (JPY) | 22B | 23.7B | 22.2B | 21.8B | 21.4B | 23.3B | 27.6B | 31.6B | 40.2B | 40.3B |
| Intangible assets (JPY) | 496M | 403M | 228M | 316M | 332M | 440M | 454M | 514M | 566M | 719M |
| Net debt (borrowings + leases - cash) (JPY) | -19.5B | -21.2B | -19.7B | -19.3B | -18.8B | -20.7B | -25B | -29.9B | -38.7B | -38.7B |
| Cash flow detail | ||||||||||
| Operating cash flow (JPY) | 8.51B | 6.86B | 7.81B | 8.33B | 8.8B | 5.63B | 8.25B | 12.1B | 14.6B | 14.8B |
| Purchases of property, plant and equipment (JPY) | -2B | -2.55B | -3.16B | -2.72B | -4.94B | -4.16B | -3.39B | -2.71B | -2.71B | -3.02B |
| Purchases of intangible assets (JPY) | -88M | -110M | -76M | -177M | -136M | -227M | -186M | -236M | -247M | -366M |
| Change in receivables (cash effect) (JPY) | -537M | -27M | 441M | 701M | 1.04B | -940M | -714M | -632M | 192M | -755M |
| Change in inventories (cash effect) (JPY) | 222M | -98M | -676M | -94M | -401M | -2.23B | -2.33B | 887M | 539M | -1.41B |
| Change in payables (cash effect) (JPY) | -64M | -165M | -23M | -393M | 338M | 523M | -70M | -610M | 45M | 344M |
| Dividends paid (cash effect) (JPY) | -1.92B | -2.07B | -2.07B | -2.15B | -2.25B | -2.29B | -3.02B | -3.69B | -4.69B | -5.24B |
| Share buybacks (cash effect) (JPY) | -8M | -7M | -532M | -1M | -1.98B | -744M | 0.00 | -2.43B | -2.3B | -5.6B |
| Interest paid (cash effect) (JPY) | -45M | -39M | -33M | -39M | -44M | -62M | -40M | -32M | -24M | -15M |
| Income taxes paid (cash effect) (JPY) | -1.33B | -2.06B | -1.9B | -2.31B | -2.11B | -1.7B | -2.92B | -4.3B | -2.86B | -3.99B |
| Operating cash flow before change in receivables (JPY) | 9.05B | 6.89B | 7.37B | 7.63B | 7.76B | 6.57B | 8.96B | 12.8B | 14.4B | 15.6B |
| Free cash flow (OCF - PPE - intangibles) (JPY) | 6.42B | 4.2B | 4.58B | 5.43B | 3.72B | 1.24B | 4.68B | 9.18B | 11.6B | 11.4B |
| Income detail | ||||||||||
| Research and development expense (JPY) | 2.98B | 2.87B | 2.93B | 3.08B | 3.13B | 3.4B | 3.79B | 4.35B | 4.37B | 4.58B |
| ↳ 5y CAGR | +4.5% | +2.7% | +5.7% | +8.2% | +7.3% | +7.9% | ||||
| Total comprehensive income (JPY) | 4.88B | 6.44B | 4.98B | 4.18B | 6.95B | 7.51B | 8.8B | 16.9B | 13.1B | 20.2B |
| Comprehensive income to owners (JPY) | 4.89B | 6.43B | 4.97B | 4.18B | 6.95B | 7.51B | 8.79B | 16.9B | 13.1B | 20.2B |
| Provision for credit losses (JPY) | — | 0.00 | 0.00 | 0.00 | 9M | 2M | — | 0.00 | 6M | 112M |
| Credit cost ratio (credit losses / average receivables) (%) | — | 0.0% | 0.0% | 0.0% | 0.1% | 0.0% | — | 0.0% | 0.0% | 0.7% |
| Reported | Jun 29, 2017 | Jun 28, 2018 | Jun 26, 2019 | Jul 29, 2020 | Jun 29, 2021 | Jun 29, 2022 | Jun 28, 2023 | Jun 26, 2024 | Jun 24, 2025 | Jun 23, 2026 |
Sign up to see institutional holdings
Sign UpPodcast Mentions
Sign up to see podcast mentions and sentiment
Sign UpTimely disclosures published on TDnet, newest first, titles as filed in Japanese. The link opens the disclosure on TDnet. Filings with EDINET (periodic reports, extraordinary reports, offerings, holding and buy-back reports), newest first, titles as filed in Japanese. The link opens the filing on EDINET. Press releases from the company's own website, newest first.
決算・業績 2027年3月期 第2四半期(中間期)決算説明会 質疑応答録
Bull 3
Bear 0
Guidance
マックス株式会社 2027 年3月期第2四半期(中間期)決算説明会質疑応答録
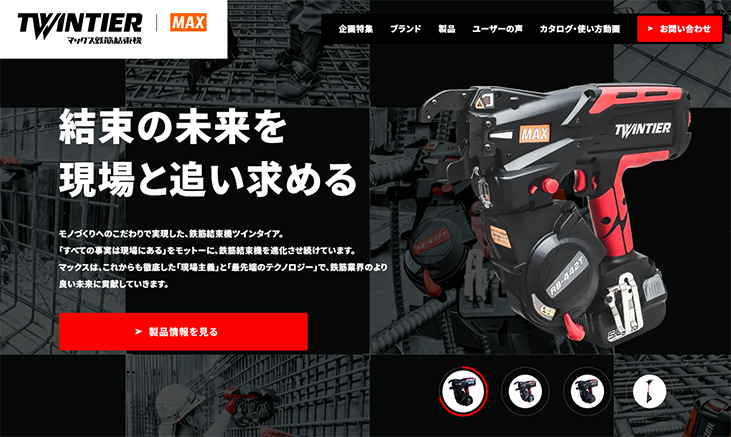
この質疑応答録は、2026 年 10 月 29 日(木)に開催したアナリスト、ファンドマネージャ向け決算 説明会にて、ご参加の皆さまからいただいた質問とその回答の概要です。 ■インダストリアル機器部門について [質問1] 鉄筋結束機の機械・消耗品の販売数量伸率が第2四半期(3カ月間)の欧州において鈍化した要因は、 第2四半期から第3四半期への出荷時期のズレが発生したことによると説明がありました。その背景 や具体的な状況を教えてください。 [回答1] さまざまな要因により9月に予定していた出荷の一部が 10 月にずれ込んだことによるもので、出荷時期 のズレによる影響が比較的大きくなりました。 [質問2] 欧州にて 2026 年3月期の第4四半期から 2027 年3月期第1四半期にかけて実施したプロモーション による反動減や今後の見通しについて教えてください。 [回答2] 第2四半期は代理店やディーラーのセールアウト促進を目的としたプロモーションを実施し、その状況を 踏まえると、第1四半期までに実施したプロモーションによる反動減などの影響はほぼなかったと認識し ています。また、インフラを中心とした市況は安定していることから、第3四半期以降も引き続き堅調に 推移するものと考えています。 ■オフィス機器部門について [質問3] 2027 年3月期通期計画におけるオフィス機器部門の下方修正について、その要因を教えてください。 [回答3] 為替の影響などによるコスト上昇に加え、ペーパーレス化に伴う市場の縮小を反映しています。文字表示 機器は増収となっているため、今後も同事業に注力していきたいと考えています。 ■全社状況について [質問4] 今期が中期経営計画の最終年度となりますが、当初計画を大幅に上回る実績が見込まれています。当初 計画との差異が生じた主な要因について教えてください。 [回答4] 鉄筋結束機の需要が想定を上回ったことが主な要因です。鉄筋結束機の製品ラインアップの充実や関連製 品であるメッシュ筋カッタの投入が市場ニーズに合致したことに加え、インフラを中心とする建設需要の 活発化などが、鉄筋結束機の機械と消耗品の大幅な伸長につながったと考えています。次期中期経営計画 に向けては、需要予測の精度向上に向けた分析やデータ収集にも取り組んでいます。
[質問5] 米国の関税還付及び欧州の保護貿易措置の影響額について教えてください。 [回答5] 具体的な影響額は公表していませんが、2026 年3月期(前期)におけるコスト増約 11 億円のうち、米国関税 による影響は約7割を占めています。当該影響の大部分が、今期第2四半期に還付金として戻ってきた形 となります。一方、現地在庫の関係により、米国関税による損益計算書上のコスト増は前期の第2四半期 から影響が顕在化したため、今期第1四半期は米国関税による原価アップ(コスト増)も発生しています。 また、欧州での保護貿易措置の強化によるコスト増も発生しています。 [質問6] 鉄筋結束の自律移動結束ロボットの発売予定時期を教えてください。また、ロボット技術については、 社外の技術やノウハウを積極的に活用していく方針でしょうか。 [回答6] 具体的な発売時期は現時点で申し上げられませんが、市場テストを行いながら改良を進めている段階です。 ロボット技術については、ゼネコンなど社外のニーズを取り込むとともに、AI を含む外部との協業やプラ ットフォームの活用を通じて、必要な技術を獲得していくことを考えています。 [質問7] 現中期経営計画のキャッシュフローアロケーションにおけるキャッシュアウトの想定に対して、計画 どおりの投入がされずに、余剰資金が発生した場合の考え方について教えてください。 [回答7] 事業拡大投資は、今回の技術研究センター(仮称)の新設にとどまらず、継続して検討を進めています。 また、研究開発投資や経営基盤強化投資についても投資を予定しています。 [質問8] 今回の業績予想修正には、欧州の保護貿易措置によるコスト増加の影響は含まれていますか。 [回答8] 計画に織り込んでいます。
本資料に記載されている業績見通し等の将来に関する内容は、当社が 2026 年 10 月 29 日現在入手している情報 及び合理的であると判断する一定の前提に基づいており、実際の業績等は様々な要因により大きく異なる可能性 があることをご了承ください。






Prompts
Click prompts to add them under the company line, click again to take one out, then copy the result into your AI chat. Shared by Asian Century Stocks and Uncovered Thai Stocks. Thank you.
Max Co., Ltd. (ticker 6454), listed in Japan.
Copied
ETFs Holding Max Co., Ltd.
Exchange-traded funds whose newest published daily portfolio holds one of the company's listings, largest weight first.
| ETF | Weight in ETF | Shares | Market value | As of |
|---|---|---|---|---|
| AVDS | 0.03% | 10,500 | $ 116.914K | Nov 16, 2026 |
| DFIS | 0.01% | 60,900 | $ 695.837K | Nov 12, 2026 |
| DXIV | 0.01% | 2,100 | $ 23.994K | Nov 12, 2026 |
| DFSI | 0.00% | 4,800 | $ 54.844K | Nov 12, 2026 |
| DFIC | 0.00% | 55,600 | $ 635.28K | Nov 12, 2026 |
| DFAX | 0.00% | 42,400 | $ 484.458K | Nov 12, 2026 |
| DFAI | 0.00% | 33,200 | $ 379.34K | Nov 12, 2026 |
| AVDE | 0.00% | 17,000 | $ 189.289K | Nov 16, 2026 |