自己株式取得に係る事項の決定に関するお知らせ(会社法第165 条第2項の規定による定款の定めに基づく自己株式の取得)
Bull 3
Bear 0
Capital return
6440
|
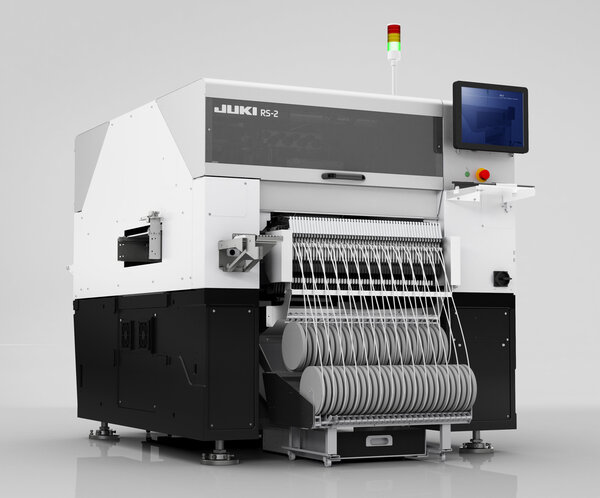
Juki Corporation is a manufacturer of industrial and household sewing machines, surface mount technology (SMT) equipment, and IoT-related systems. The company operates through two primary business segments: the Sewing Business, which produces industrial and household sewing machines and related automation systems, and the Industrial Machinery Business, which develops SMT mounters, peripheral equipment, and contract processing services. Juki serves global markets through a network of subsidiaries including JUKI AMERICA, INC., JUKI SINGAPORE PTE. LTD., JUKI ITALIA S.P.A., and JUKI AUTOMATION SYSTEMS GMBH. The group also includes JUKI MACHINERY BANGLADESH LTD. and ESSEGI AUTOMATION S.r.l. as key operational entities. The company provides contract manufacturing of products and parts alongside its core machinery sales. Summarised from the annual report, fiscal year ended Dec 2025 |
Industry Specialty Industrial Machinery | Homepage juki.co.jp |
| Sector Industrials | IR page juki.co.jp | |
|
Tags
sewing machines, industrial sewing, household sewing, smt equipment, surface mount technology, iot systems, contract manufacturing, automation, JUKI (HONG KONG) LTD., JUKI AMERICA INC., JUKI SINGAPORE PTE. LTD., JUKI CENTRAL EUROPE SP. ZO.O., JUKI ITALIA S.P.A., JUKI INDIA PVT. LTD., JUKI (Thailand) Co. Ltd., JUKI(VIETNAM)CO. LTD., JUKI MACHINERY BANGLADESH LTD., JUKI AUTOMATION SYSTEMS GMBH, JUKI SMT ASIA CO. LTD., JUKI DO BRASIL COMERCIO E SERVICOS DE MAQUINAS LTDA., ESSEGI AUTOMATION S.r.l.
|
Press page juki.co.jp/news |
Metrics
| Valuation | |
|---|---|
| Market cap | ¥ 25.184B |
| Market cap (USD) | $ 157.974M |
| P/E | 17.06 |
| PEG | — |
| P/BV | 0.78 |
| P/S | 0.28 |
| P/OCF | 2.15 |
| P/FCF | 2.60 |
| Dividend yield | 1.2% |
| Turnover / mcap | — |
| Returns | |
|---|---|
| ROE | 4.3% |
| ROI | 1.4% |
| ROIC | 1.8% |
| Profit margin | 1.6% |
| Growth | |
|---|---|
| Revenue growing | No |
| Profits growing | Yes |
| Revenue up 3y | No |
| Revenue up 5y | No |
| Earnings growth 3y (net profit CAGR) | — |
| Quality | |
|---|---|
| Profitable | Yes |
| Margin expanding | Yes |
| Buying back stock | No |
| Diluting (TTM) | No |
| Debt/Equity | — |
| Podcast bulls (TTM) | Sign up |
| Podcast bears (TTM) | Sign up |
| Podcast sentiment (TTM) | Sign up |
| Podcast sentiment % (TTM) | Sign up |
| News sentiment (TTM) | 3 |
| Quality score | 0% |
| Insiders | |
|---|---|
| Buys, 1w | Sign up |
| Buys, 1m | Sign up |
| Buys, 1y | Sign up |
| Sells, 1w | Sign up |
| Sells, 1m | Sign up |
| Sells, 1y | Sign up |
Sign up to see this company's insider trades
| Figure | FY 2025 | FY 2024 | FY 2023 | FY 2022 | FY 2021 | FY 2020 | FY 2019 | FY 2018 | FY 2017 | FY 2016 | FY 2015 | FY 2014 | FY 2013 | FY 2012 |
|---|---|---|---|---|---|---|---|---|---|---|---|---|---|---|
| Revenue | 88.761B | 95.185B | 94.75B | 117.454B | 101.292B | 70.401B | 99.169B | 112.064B | 103.659B | 97.724B | 112.865B | 107.581B | 94.385B | 75.831B |
| Net profit | 1.399B | -3.235B | -7.035B | -78M | 2.154B | -4.688B | 1.763B | 6.64B | 5.642B | 1.883B | 3.853B | 6.058B | 3.006B | -8.342B |
| Free cash flow | 9.684B | 6.63B | -325M | -16.862B | -7.617B | 5.923B | 792M | 49M | 8.347B | 8.091B | 7.522B | — | — | — |
Filed figures
Lines the statements and their notes report beside the headline figures, read from the filings' XBRL as filed (no restatement applied), with figures computed from one filing's own lines. Cash-flow lines carry their cash direction: an outflow is negative. Each period links to its filing; a figure's period, report date and tag are in its tooltip.
| Figure | Dec 2016 | Dec 2017 | Dec 2018 | Dec 2019 | Dec 2020 | Dec 2021 | Dec 2022 | Dec 2023 | Dec 2024 | Dec 2025 |
|---|---|---|---|---|---|---|---|---|---|---|
| Balance sheet detail | ||||||||||
| Trade receivables (JPY) | 30.7B | 32.4B | 33.5B | 30.5B | 23.3B | 34.1B | 73.7B | 71B | 63.1B | 47.3B |
| ↳ YoY growth | -1.7% | +5.4% | +3.3% | -9.0% | -23.4% | +46.2% | +116.1% | -3.6% | -11.2% | -25.1% |
| ↳ 5y CAGR | -5.7% | +2.1% | +17.9% | +16.2% | +15.7% | +15.2% | ||||
| Borrowings, current (JPY) | 43.1B | 34.5B | 35.9B | 37.2B | 34.1B | 38.3B | 58.8B | 63.3B | 64.6B | 51.7B |
| Borrowings, non-current (JPY) | 16.6B | 15.7B | 16.2B | 15.4B | 22B | 19.4B | 18.9B | 19.1B | 15.9B | 13.9B |
| Lease liabilities (JPY) | 365M | 335M | 324M | 387M | 335M | 272M | 522M | 511M | 1.11B | 831M |
| Cash and deposits (JPY) | 8.05B | 6.41B | 7.32B | 5.99B | 13.8B | 6.59B | 4.93B | 7.2B | 13.2B | 13.1B |
| Intangible assets (JPY) | 1.71B | 1.67B | 1.99B | 2.1B | 1.92B | 1.89B | 2.32B | 3.11B | 4.02B | 3.72B |
| Net debt (borrowings + leases - cash) (JPY) | 52.1B | 44.1B | 45.1B | 47B | 42.5B | 51.4B | 73.2B | 75.8B | 68.4B | 53.3B |
| Cash flow detail | ||||||||||
| Operating cash flow (JPY) | 9.82B | 10.5B | 2.68B | 3.05B | 8.51B | -6.59B | -14.6B | 2.25B | 9.37B | 11.7B |
| Purchases of property, plant and equipment (JPY) | -1.73B | -2.14B | -2.63B | -2.26B | -2.59B | -1.03B | -2.22B | -2.58B | -2.74B | -2.03B |
| Change in receivables (cash effect) (JPY) | -581M | -1.52B | -2.15B | 2.58B | 6.33B | -8.67B | -618M | 3.61B | 6.99B | 7.9B |
| Change in inventories (cash effect) (JPY) | 3.07B | 1.16B | -8.04B | 1.36B | 3.76B | -11.8B | -6.3B | 8.92B | 2.49B | 6.94B |
| Change in payables (cash effect) (JPY) | 128M | 3.99B | 2.52B | -6.16B | 162M | 9.02B | -7.29B | -4.73B | 2.88B | -3.79B |
| Dividends paid (cash effect) (JPY) | -743M | -584M | -1.02B | -877M | -730M | -584M | -730M | -585M | -442M | — |
| Share buybacks (cash effect) (JPY) | -539M | 0.00 | 0.00 | 0.00 | 0.00 | 0.00 | 0.00 | 0.00 | 0.00 | 0.00 |
| Interest paid (cash effect) (JPY) | -1.15B | -944M | -805M | -799M | -839M | -655M | -1.1B | -1.48B | -1.66B | -1.87B |
| Income taxes paid (cash effect) (JPY) | -1.61B | -1.13B | -1.27B | -1.74B | -629M | -897M | -1.43B | -963M | -792M | -693M |
| Operating cash flow before change in receivables (JPY) | 10.4B | 12B | 4.84B | 476M | 2.18B | 2.08B | -14B | -1.36B | 2.38B | 3.81B |
| Free cash flow (OCF - PPE - intangibles) (JPY) | 8.09B | 8.35B | 49M | 792M | 5.92B | -7.62B | -16.9B | -325M | 6.63B | 9.68B |
| Income detail | ||||||||||
| Research and development expense (JPY) | 4.41B | 4.78B | 5.68B | 5.4B | 4.61B | 4.57B | 4.84B | 4.95B | 4.25B | 3.99B |
| ↳ 5y CAGR | -1.1% | +0.7% | +0.3% | -2.7% | -4.7% | -2.8% | ||||
| Total comprehensive income (JPY) | 396M | 6.37B | 4.95B | 1.4B | -5.32B | 4.89B | 2.27B | -4.63B | -108M | 1.54B |
| Comprehensive income to owners (JPY) | 671M | 6.31B | 4.83B | 1.39B | -5.23B | 4.8B | 2.18B | -4.66B | -74M | 1.49B |
| Provision for credit losses (JPY) | 178M | 71M | 59M | 50M | 225M | 193M | 148M | 280M | 158M | 6M |
| Credit cost ratio (credit losses / average receivables) (%) | 0.6% | 0.2% | 0.2% | 0.2% | 0.8% | 0.7% | 0.3% | 0.4% | 0.2% | 0.0% |
| Segments | ||||||||||
| Industrial Equipment Business · Segment revenue (JPY) | — | — | — | — | — | — | — | — | 25.1B | 21.9B |
| ↳ YoY growth | -12.7% | |||||||||
| Sewing Machinery Business · Segment revenue (JPY) | — | — | — | — | — | — | — | — | 69.9B | 66.6B |
| ↳ YoY growth | -4.6% | |||||||||
| Reported | Mar 29, 2017 | Mar 27, 2018 | Mar 28, 2019 | Mar 27, 2020 | Mar 26, 2021 | Mar 29, 2022 | Mar 29, 2023 | Mar 26, 2024 | Mar 23, 2026 | Mar 23, 2026 |
Sign up to see institutional holdings
Sign UpPodcast Mentions
Sign up to see podcast mentions and sentiment
Sign UpTimely disclosures published on TDnet, newest first, titles as filed in Japanese. The link opens the disclosure on TDnet. Filings with EDINET (periodic reports, extraordinary reports, offerings, holding and buy-back reports), newest first, titles as filed in Japanese. The link opens the filing on EDINET. Press releases from the company's own website, newest first.
2026年12月期第3四半期決算短信〔日本基準〕(連結)
Bull 3
Bear 0
Results
IR TOPIX構成銘柄における当社株式の移行措置銘柄への選定および今後の取組みについて
Bull 0
Bear 3
Routine
2026 年 10 月9日 各位 会社名 代表者名 問合せ先
JUKI 株式会社 代表取締役社長成川敦 (コード番号 6440 東証プライム市場) エグゼクティブオフィサー 総合企画部長 鴨居田聡 (TEL 042-357-2211)
TOPIX 構成銘柄における当社株式の移行措置銘柄への選定および今後の取組みについて TOPIX(東証株価指数)の構成銘柄見直しに関し、2026 年 10 月 30 日付の定期入替において、当社株式 が移行措置銘柄に選定されましたので、お知らせいたします。 1.概要 東京証券取引所グループでは、TOPIX の市場代表性および投資対象としての機能性向上を目的として、 構成銘柄の見直しを段階的に実施しており、2024 年 10 月に全市場区分を対象とした新たな定期入替ルー ルが公表されました。 このルールでは、各銘柄の浮動株時価総額等に基づく相対順位により TOPIX 構成銘柄の選定・入替が行 われます。2026 年 8 月末を基準とする判定において、当社株式は以下のとおり、TOPIX 構成銘柄として 継続採用されるために必要な基準のうち「浮動株時価総額基準」を満たさなかったことから、2026 年 10 月 7 日付で移行措置銘柄に選定された旨公表されております。
TOPIX構成銘柄基準(浮動株時価総額基準)と当社数値の比較(2026年8月) 浮動株時価総額(億円) (累積比率上位97%) 株価(円)
選定水準
当社値
約420(JPX公表値)
135
2,008
643
2.当社への影響 移行措置銘柄に選定されますと、TOPIX に連動するパッシブ運用資金における当社株式の保有比率は段 階的に低下することが見込まれますので、株価低下要因になり得ます。 尚、本件は当社の上場維持基準適合状況に影響を与えるものではなく、引き続き東京証券取引所プライム 市場の上場会社として事業運営を継続してまいります。 3.今後の取組み 当社は従前より、企業価値向上および市場評価の改善を重要な経営課題として認識しており、引き続き以 下の施策を推進してまいります。 (1)収益力の向上 (2)資本効率の改善 (3)企業価値向上施策の推進 (4)IR 活動の強化 株主・投資家の皆様におかれましては、今後とも変わらぬご支援を賜りますようお願い申し上げます。

Prompts
Click prompts to add them under the company line, click again to take one out, then copy the result into your AI chat. Shared by Asian Century Stocks and Uncovered Thai Stocks. Thank you.
Juki Corporation (ticker 6440), listed in Japan.
Copied
ETFs Holding Juki Corporation
Exchange-traded funds whose newest published daily portfolio holds one of the company's listings, largest weight first.
| ETF | Weight in ETF | Shares | Market value | As of |
|---|---|---|---|---|
| DISV | 0.01% | 156,199 | $ 677.937K | Nov 12, 2026 |
| DFIS | 0.01% | 80,800 | $ 350.689K | Nov 12, 2026 |
| DXIV | 0.00% | 2,300 | $ 9,982.49 | Nov 12, 2026 |
| DFIC | 0.00% | 46,013 | $ 199.706K | Nov 12, 2026 |
| DFSI | 0.00% | 2,600 | $ 11.285K | Nov 12, 2026 |
| DFAX | 0.00% | 20,700 | $ 89.842K | Nov 12, 2026 |
| DFAI | 0.00% | 23,000 | $ 99.825K | Nov 12, 2026 |
| AVDV | 0.00% | 182,000 | $ 675.636K | Nov 16, 2026 |
| AVDS | 0.00% | 3,700 | $ 13.735K | Nov 16, 2026 |