|
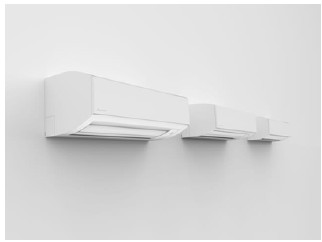
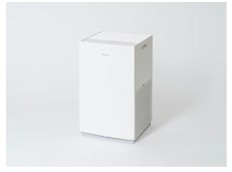
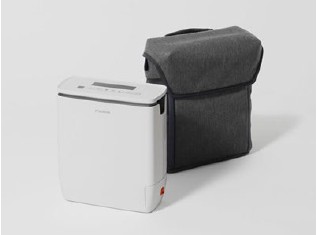
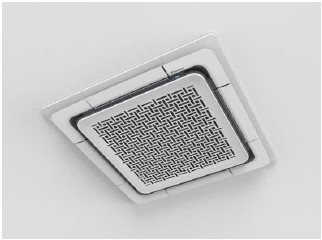
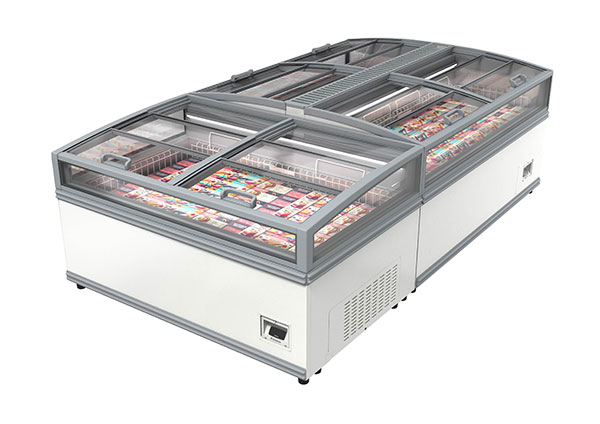
Daikin Industries, Ltd. is a manufacturer and seller of air conditioning, refrigeration, chemical, hydraulic, and special machinery products. The company operates through three main business segments: air conditioning and refrigeration, chemicals, and other businesses. In air conditioning and refrigeration, it produces residential units such as room air conditioners, air purifiers, and heat pump water heaters, alongside commercial equipment including package air conditioners, turbo chillers, screw chillers, and industrial dust collectors. The chemical segment involves the production of fluorocarbon gases, fluoropolymers, and chemical products like semiconductor etching agents and fluorinated oils. The other business segment covers hydraulic machinery for industrial and construction applications, defense components, home oxygen medical devices, and IT solutions for design and development. The company serves customers in residential, commercial, industrial, and maritime sectors across domestic and international markets. Key subsidiaries include Daikin HVAC Solution Tokyo, Daikin Fine Tech, and Daikin Sauer Danfoss, with a global network of consolidated subsidiaries operating in regions such as China, Europe, and the Americas. Summarised from the annual report, fiscal year ended Mar 2026 |
Industry Building Products & Equipment | Homepage daikin.com |
| Sector Industrials | IR page daikin.com | |
|
Tags
air conditioning, refrigeration, fluoropolymers, hydraulic machinery, heat pumps, air purifiers, industrial chillers, defense components, medical devices, chemicals, Daikin HVAC Solution Tokyo, Daikin Air Techno, Daikin Applied Systems, OKK Equipment, Daikin Rexam Electronics, Daikin Trading, Nippon Muki, Moritani Daikin, Daikin (China) Investment, Daikin Air Conditioning (Shanghai), Daikin Air Conditioning (Suzhou), Daikin Electromechanical Equipment (Suzhou), Shenzhen Macwell Air Conditioning, Macwell Air Conditioning Refrigeration (Wuhan), Macwell Central Air Conditioning, Daikin Industries (Thailand), Siam Daikin Sales, Daikin Compressor Industries, Daikin Air Conditioning (Singapore), Daikin Malaysia Sendirian Berhad, Daikin Malaysia Sales and Service, PT Daikin Air Conditioning Indonesia, Daikin Air Conditioning India, Daikin Australia, Daikin Air Conditioning (Vietnam), Daikin Europe, AHT Cooling Systems, Daikin Industries Czech Republic, Daikin Air Conditioning France, Daikin Air Conditioning Italy, Daikin Applied Europe, Daikin Applied Americas, American Air Filter Company, Daikin Comfort Technologies North America, Daikin Fine Tech, Daikin Fluorine Chemical (China), Daikin New Materials (Changshu), Daikin Chemical Europe, Daikin America, Changshu Denshoku Kaidoku Plastic Products, Daikin Sauer Danfoss, Daikin Hydraulic Engineering, Dupromatic
|
Press page daikin.com/press |
Metrics
| Valuation | |
|---|---|
| Market cap | ¥ 6.069T |
| Market cap (USD) | $ 37.931B |
| P/E | 20.65 |
| PEG | 9.34 |
| P/BV | 1.99 |
| P/S | 1.11 |
| P/OCF | 10.77 |
| P/FCF | 18.67 |
| Dividend yield | 1.6% |
| Turnover / mcap | — |
| Returns | |
|---|---|
| ROE | 8.9% |
| ROI | 7.1% |
| ROIC | 7.6% |
| Profit margin | 5.5% |
| Growth | |
|---|---|
| Revenue growing | Yes |
| Profits growing | Yes |
| Revenue up 3y | Yes |
| Revenue up 5y | Yes |
| Earnings growth 3y (net profit CAGR) | 2.2% |
| Quality | |
|---|---|
| Profitable | Yes |
| Margin expanding | No |
| Buying back stock | No |
| Diluting (TTM) | No |
| Debt/Equity | — |
| Podcast bulls (TTM) | Sign up |
| Podcast bears (TTM) | Sign up |
| Podcast sentiment (TTM) | Sign up |
| Podcast sentiment % (TTM) | Sign up |
| News sentiment (TTM) | 39 |
| Quality score | 15.8% |
| Insiders | |
|---|---|
| Buys, 1w | Sign up |
| Buys, 1m | Sign up |
| Buys, 1y | Sign up |
| Sells, 1w | Sign up |
| Sells, 1m | Sign up |
| Sells, 1y | Sign up |
Sign up to see this company's insider trades
| Figure | FY 2026 | FY 2025 | FY 2024 | FY 2023 | FY 2022 | FY 2021 | FY 2020 | FY 2019 | FY 2018 | FY 2017 | FY 2016 | FY 2015 | FY 2014 | FY 2013 |
|---|---|---|---|---|---|---|---|---|---|---|---|---|---|---|
| Revenue | 5.015T | 4.752T | 4.395T | 3.982T | 3.109T | 2.493T | 2.55T | 2.481T | 2.291T | 2.044T | 2.044T | 1.915T | 1.788T | 1.291T |
| Net profit | 275.229B | 264.757B | 260.311B | 257.754B | 217.709B | 156.249B | 170.731B | 189.048B | 189.051B | 153.938B | 136.986B | 119.674B | 92.787B | 43.584B |
| Free cash flow | 256.767B | 268.465B | 156.934B | -16.18B | 130.965B | 269.72B | 204.072B | 164.522B | 138.061B | 179.328B | 129.49B | — | — | — |
| Figure | FY 2026 | FY 2025 | FY 2024 | FY 2023 | FY 2022 | FY 2021 | FY 2020 | FY 2019 | FY 2018 | FY 2017 | FY 2016 | FY 2015 | FY 2014 | FY 2013 |
|---|---|---|---|---|---|---|---|---|---|---|---|---|---|---|
| Share price | 18.683K | 16.117K | 20.613K | 23.672K | 22.389K | 22.326K | 13.171K | 12.976K | 11.757K | 11.172K | 8.405K | 8.039K | 5.856K | 3.685K |
| Price performance 12m | 0.16 | -0.22 | -0.13 | 0.06 | 0 | 0.7 | 0.02 | 0.1 | 0.05 | 0.33 | 0.05 | 0.37 | 0.59 | — |
Filed figures
Lines the statements and their notes report beside the headline figures, read from the filings' XBRL as filed (no restatement applied), with figures computed from one filing's own lines. Cash-flow lines carry their cash direction: an outflow is negative. Each period links to its filing; a figure's period, report date and tag are in its tooltip.
| Figure | Mar 2017 | Mar 2018 | Mar 2019 | Mar 2020 | Mar 2021 | Mar 2022 | Mar 2023 | Mar 2024 | Mar 2025 | Mar 2026 |
|---|---|---|---|---|---|---|---|---|---|---|
| Balance sheet detail | ||||||||||
| Trade receivables (JPY) | 369B | 401B | 448B | 441B | 468B | 1.17T | 1.39T | 1.6T | 1.69T | 1.9T |
| ↳ YoY growth | +3.8% | +8.7% | +11.6% | -1.6% | +6.3% | +150.8% | +18.4% | +15.4% | +5.1% | +12.7% |
| ↳ 5y CAGR | +5.7% | +26.1% | +28.2% | +29.1% | +30.8% | +32.3% | ||||
| Borrowings, current (JPY) | 135B | 123B | 238B | 155B | 117B | 462B | 446B | 487B | 397B | 434B |
| Borrowings, non-current (JPY) | 463B | 421B | 336B | 323B | 549B | 261B | 314B | 325B | 415B | 449B |
| Bonds payable (JPY) | 120B | 110B | 110B | 90B | 140B | 150B | 160B | 140B | 190B | 225B |
| Lease liabilities (JPY) | 11.3B | 10.8B | 11.2B | 75.8B | 85.4B | 102B | 127B | 156B | 175B | 211B |
| Cash and deposits (JPY) | 344B | 357B | 368B | 371B | 736B | 818B | 618B | 738B | 803B | 933B |
| Intangible assets (JPY) | 537B | 516B | 618B | 543B | 543B | 578B | 658B | 684B | 638B | 670B |
| Net debt (borrowings + leases - cash) (JPY) | 265B | 197B | 218B | 183B | 15.1B | 7.2B | 270B | 230B | 184B | 161B |
| Cash flow detail | ||||||||||
| Operating cash flow (JPY) | 268B | 224B | 250B | 302B | 375B | 245B | 159B | 400B | 514B | 466B |
| Purchases of property, plant and equipment (JPY) | -88.3B | -85.7B | -85.5B | -98.1B | -105B | -114B | -175B | -243B | -246B | -209B |
| Change in receivables (cash effect) (JPY) | -15.1B | -23.4B | -37.6B | -950M | -1.03B | -76.7B | -61.8B | -36.1B | -40.1B | -80.3B |
| Change in inventories (cash effect) (JPY) | -23.4B | -26.5B | -38.8B | -14.3B | -7.75B | -151B | -268B | 36.5B | -10.9B | -5.61B |
| Change in payables (cash effect) (JPY) | 14.4B | 4.4B | 8.62B | -6.36B | 25B | 45.5B | 24.2B | -56.8B | 30.6B | 24.6B |
| Dividends paid (cash effect) (JPY) | -36.5B | -39.5B | -42.4B | -49.7B | -46.7B | -49.7B | -61.5B | -76.1B | -92.2B | -90.7B |
| Interest paid (cash effect) (JPY) | -10B | -10.7B | -11.8B | -11.8B | -9.54B | -8.84B | -20.5B | -44.6B | -43.3B | -38.9B |
| Income taxes paid (cash effect) (JPY) | -55.3B | -83.2B | -71.4B | -87.4B | -67.6B | -96.7B | -128B | -139B | -130B | -144B |
| Operating cash flow before change in receivables (JPY) | 283B | 247B | 288B | 303B | 376B | 322B | 221B | 436B | 555B | 546B |
| Free cash flow (OCF - PPE - intangibles) (JPY) | 179B | 138B | 165B | 204B | 270B | 131B | -16.2B | 157B | 268B | 257B |
| Income detail | ||||||||||
| Research and development expense (JPY) | 53.9B | 62.1B | 65.2B | 68B | 71.7B | 81.5B | 102B | 122B | 136B | 151B |
| ↳ 5y CAGR | +9.2% | +8.6% | +10.5% | +13.4% | +14.8% | +16.0% | ||||
| Total comprehensive income (JPY) | 136B | 231B | 170B | 73.3B | 285B | 366B | 354B | 493B | 257B | 573B |
| Comprehensive income to owners (JPY) | 131B | 224B | 163B | 68.1B | 277B | 355B | 345B | 480B | 247B | 558B |
| Provision for credit losses (JPY) | 2.49B | 926M | 1.58B | 2.24B | 2.22B | 2.63B | 3.41B | 3.95B | 893M | -504M |
| Credit cost ratio (credit losses / average receivables) (%) | 0.7% | 0.2% | 0.4% | 0.5% | 0.5% | 0.3% | 0.3% | 0.3% | 0.1% | 0.0% |
| Reported | Jun 29, 2017 | Jun 28, 2018 | Jun 27, 2019 | Jun 26, 2020 | Jun 29, 2021 | Jun 29, 2022 | Jun 29, 2023 | Jun 27, 2024 | Jun 25, 2025 | Jun 24, 2026 |
Sign up to see institutional holdings
Sign UpPodcast Mentions
Sign up to see podcast mentions and sentiment
Sign UpTimely disclosures published on TDnet, newest first, titles as filed in Japanese. The link opens the disclosure on TDnet. Filings with EDINET (periodic reports, extraordinary reports, offerings, holding and buy-back reports), newest first, titles as filed in Japanese. The link opens the filing on EDINET. Press releases from the company's own website, newest first.
Advancing the Development of Diverse PFAS Destruction Technologies with a View Toward Implementation in Real-World Wastewater Treatment Operations
-
[](https://twitter.com/share?url=http://www.daikin.com/press/2026/20261106&text=Daikin Global - Press Releases - PFAS Destruction Technology Advanced Through Collaboration Between Daikin America and Claros Named One of TIME's Best Inventions of 2026)
OSAKA, Japan, November 6 – Daikin Industries, Ltd. announces that ClarosTechUVTM, a PFAS destruction technology of U.S.-based Claros Technologies, has been named one of TIME magazine's "Best Inventions of 2026." Daikin America, Inc. (DAI), Daikin's U.S. subsidiary in the chemicals business, is conducting joint demonstrations of the technology with Claros and advancing its deployment. For more than 25 years, TIME's annual Best Inventions list has recognized innovative technologies and products that have made an impact around the world. In 2026, TIME selected 300 inventions and 100 special mentions from nominations by its editors and correspondents, as well as public submissions, evaluating them on criteria including originality, efficacy, ambition, and impact. Daikin believes that the selection of this technology reflects growing interest in efforts toward the practical application of PFAS destruction technologies.
ClarosTechUVTM is a technology that uses ultraviolet (UV) light to destroy PFAS. It can be integrated into existing wastewater treatment facilities and continuously treat industrial wastewater on-site. During a commercial optimization run at DAI's manufacturing facility in Decatur, Alabama, ClarosTechUV™ treated more than 170,000 gallons (approximately 640,000 liters) of industrial process water and achieved a destruction rate of 99.99% for the targeted PFAS species.
PFAS decomposition and destruction technologies were also included in the World Economic Forum's "Top 10 Emerging Technologies of 2026" as technologies with the potential to impact society and industry in the future. In addition to evaluatingthe practical application of the UV-based technology through its collaboration with Claros, Daikin is also conducting research and development on PFAS destruction technologies using different methods, including ultrasound, plasma, and electron beam. Daikin will continue evaluating these technologies with a view toward establishing solutions suited to different wastewater characteristics and treatment conditions, and applying them in actual wastewater treatment operations.
In addition to research and development of PFAS destruction technologies, Daikin is advancing various initiatives globally, including improving manufacturing processes, recycling, and strengthening emissions management. Daikin will continue pursuing the development and practical application of innovative technologies.
Reference Information
About PFAS
https://www.daikinchemicals.com/sustainability/pfas/pfas.html
About Daikin's PFAS Initiatives
https://www.daikinchemicals.com/sustainability/pfas.html
About TIME's "Best Inventions of 2026"
https://time.com/collection/best-inventions/2026/clarostechuv-pfas-destruction-system/
About the World Economic Forum's "Top 10 Emerging Technologies of 2026"
The World Economic Forum (WEF) publishes an annual report highlighting 10 innovative technologies with the potential to significantly impact society and industry over the next three to five years. https://www.weforum.org/stories/emerging-technologies/the-top-10-emerging-technologies-of-2026/
Contact
Visit the Contacts page for inquiries concerning the information described above.
Find out more in your region.
-
DESIGN & TECHNOLOGY
LATEST NEWS
©DAIKIN INDUSTRIES, Ltd., 2026

S
 Corporate/Financial
 Sustainability


 Others

 Corporate/Financial
 R&D
 Sustainability
Prompts
Click prompts to add them under the company line, click again to take one out, then copy the result into your AI chat. Shared by Asian Century Stocks and Uncovered Thai Stocks. Thank you.
ETFs Holding Daikin Industries, Ltd.
Exchange-traded funds whose newest published daily portfolio holds one of the company's listings, largest weight first.
| ETF | Weight in ETF | Shares | Market value | As of |
|---|---|---|---|---|
| BKCI | 2.18% | 19,600 | $ 2.87M | Jul 31, 2026 |
| DSTX | 1.29% | 4,000 | $ 607.537K | Jun 30, 2026 |
| CGIE | 0.74% | 122,000 | $ 18.054M | Nov 16, 2026 |
| IVSI | 0.60% | 312 | $ 47.368K | Jun 30, 2026 |
| UMMA | 0.37% | 8,183 | $ 1.084M | Aug 31, 2026 |
| DWMF | 0.36% | 800 | $ 121.507K | Jun 30, 2026 |
| AVIV | 0.29% | 40,400 | $ 5.918M | Nov 16, 2026 |
| CGNG | 0.21% | 42,500 | $ 6.289M | Nov 16, 2026 |
| NTSI | 0.15% | 5,000 | $ 759.422K | Jun 30, 2026 |
| DFAI | 0.13% | 166,999 | $ 24.277M | Nov 12, 2026 |
| AVDE | 0.11% | 143,900 | $ 21.078M | Nov 16, 2026 |
| DFIC | 0.09% | 97,300 | $ 14.145M | Nov 12, 2026 |
| AVSD | 0.07% | 1,700 | $ 249.011K | Nov 16, 2026 |
| DFSI | 0.07% | 5,301 | $ 770.618K | Nov 12, 2026 |
| DFAX | 0.06% | 48,000 | $ 6.978M | Nov 12, 2026 |
| DXIV | 0.02% | 300 | $ 43.612K | Nov 12, 2026 |
| DIHP | 0.01% | 5,600 | $ 814.084K | Nov 12, 2026 |