EDINET提出書類 澁谷工業株式会社(E01666) 有価証券報告書 【表紙】 【提出書類】 有価証券報告書 【根拠条文】 金融商品取引法第24条第1項 【提出先】 関東財務局長 【提出日】 2026年9月24日 【事業年度】 第78期(自 【会社名】 澁谷工業株式会社 【英訳名】…
EDINET提出書類
澁谷工業株式会社(E01666)
有価証券報告書
【表紙】
【提出書類】
有価証券報告書
【根拠条文】
金融商品取引法第24条第1項
【提出先】
関東財務局長
【提出日】
2026年9月24日
【事業年度】
第78期(自
【会社名】
澁谷工業株式会社
【英訳名】
SHIBUYA CORPORATION
【代表者の役職氏名】
代表取締役社長
【本店の所在の場所】
石川県金沢市大豆田本町甲58番地
【電話番号】
(076)262−1201(代表)
【事務連絡者氏名】
取締役常務執行役員
【最寄りの連絡場所】
石川県金沢市大豆田本町甲58番地
【電話番号】
(076)262−1201(代表)
【事務連絡者氏名】
取締役常務執行役員
【縦覧に供する場所】
株式会社東京証券取引所
(東京都中央区日本橋兜町2番1号)
株式会社名古屋証券取引所
(愛知県名古屋市中区栄3丁目8番20号)
2025年7月1日
澁谷
1/100
至
2026年6月30日)
英利
財経本部長
財経本部長
宮前
和浩
宮前
和浩
EDINET提出書類
澁谷工業株式会社(E01666)
有価証券報告書
第一部【企業情報】
第1【企業の概況】
1【主要な経営指標等の推移】
(1) 連結経営指標等
回次
第74期
第75期
第76期
第77期
第78期
決算年月
2022年6月
2023年6月
2024年6月
2025年6月
2026年6月
売上高
(百万円)
96,223
97,842
115,434
129,017
135,613
経常利益
(百万円)
13,701
8,171
13,559
13,773
13,560
親会社株主に帰属する
当期純利益
(百万円)
9,262
5,928
9,781
10,052
10,223
包括利益
(百万円)
10,272
6,692
12,786
9,807
13,860
純資産額
(百万円)
85,425
90,180
101,029
107,930
119,091
総資産額
(百万円)
136,981
142,426
161,903
159,426
173,280
1株当たり純資産額
(円)
3,087.39
3,259.24
3,651.38
3,900.84
4,304.28
1株当たり当期純利益
(円)
334.79
214.29
353.54
363.34
369.52
潜在株式調整後1株当たり当期
純利益
(円)
−
−
−
−
−
自己資本比率
(%)
62.4
63.3
62.4
67.7
68.7
自己資本利益率
(%)
11.41
6.75
10.23
9.62
9.01
株価収益率
(倍)
7.00
12.28
10.10
8.88
11.99
営業活動による
キャッシュ・フロー
(百万円)
12,798
4,854
10,432
9,069
5,280
投資活動による
キャッシュ・フロー
(百万円)
△3,565
△5,328
△3,447
△6,619
△10,740
財務活動による
キャッシュ・フロー
(百万円)
△3,099
1,215
△3,044
△3,812
△3,605
現金及び現金同等物の期末残高
(百万円)
41,792
42,660
46,894
45,291
36,700
3,152
3,185
3,248
3,340
3,437
(470)
(489)
(509)
(533)
(528)
従業員数
(外、平均臨時雇用者数)
(人)
(注)1.潜在株式調整後1株当たり当期純利益については、第75期以前は希薄化効果を有している潜在株式が存在しな
いため、第76期以降は潜在株式が存在しないため、記載しておりません。
2.従業員数は就業人員数を記載しており、臨時雇用者数は( )内に外数で記載しております。
2/100
EDINET提出書類
澁谷工業株式会社(E01666)
有価証券報告書
(2) 提出会社の経営指標等
回次
第74期
第75期
第76期
第77期
第78期
決算年月
2022年6月
2023年6月
2024年6月
2025年6月
2026年6月
売上高
(百万円)
63,887
69,898
82,633
94,069
99,726
経常利益
(百万円)
9,587
5,554
10,143
11,452
11,638
当期純利益
(百万円)
9,451
4,056
7,475
8,784
8,672
資本金
(百万円)
11,392
11,392
11,392
11,392
11,392
(千株)
28,149
28,149
28,149
28,149
28,149
純資産額
(百万円)
73,080
75,485
81,324
87,578
94,843
総資産額
(百万円)
111,044
116,586
130,080
127,045
135,611
(円)
2,641.41
2,728.36
2,939.43
3,165.51
3,428.12
発行済株式総数
1株当たり純資産額
1株当たり配当額
(うち1株当たり中間配当額)
(円)
70.00
70.00
90.00
95.00
100.00
(30.00)
(30.00)
(30.00)
(45.00)
(47.50)
1株当たり当期純利益
(円)
341.60
146.63
270.19
317.50
313.48
潜在株式調整後1株当たり当期
純利益
(円)
−
−
−
−
−
自己資本比率
(%)
65.8
64.7
62.5
68.9
69.9
自己資本利益率
(%)
13.69
5.46
9.53
10.40
9.51
株価収益率
(倍)
6.86
17.95
13.21
10.16
14.13
配当性向
(%)
20.49
47.74
33.31
29.92
31.90
2,003
2,011
2,042
2,087
2,146
(308)
(321)
(347)
(373)
(362)
従業員数
(外、平均臨時雇用者数)
(人)
株主総利回り
(%)
77.7
89.3
122.4
114.3
156.4
(比較指標:配当込みTOPIX)
(%)
(98.6)
(123.9)
(155.6)
(162.0)
(232.1)
最高株価
(円)
3,355
2,769
4,120
4,175
4,480
最低株価
(円)
2,147
2,231
2,340
2,620
3,095
(注)1.潜在株式調整後1株当たり当期純利益については、第75期以前は希薄化効果を有している潜在株式が存在しな
いため、第76期以降は潜在株式が存在しないため、記載しておりません。
2.従業員数は就業人員数を記載しており、臨時雇用者数は( )内に外数で記載しております。
3.最高株価および最低株価は、2022年4月4日より東京証券取引所(プライム市場)におけるものであり、それ
以前は東京証券取引所(市場第一部)におけるものであります。
4.第78期の1株当たり配当額100円のうち、52.5円については、2026年9月25日開催予定の定時株主総会の決議
事項となっております。
3/100
EDINET提出書類
澁谷工業株式会社(E01666)
有価証券報告書
2【沿革】
1949年6月
石川県金沢市七宝町15番地(現
武蔵町17番8号)に、澁谷商店を改組して、澁谷工業株式会社を設立
1952年10月
石川県金沢市に大豆田工場(現
本社工場)を設置
1964年8月
澁谷工業販売㈱を吸収合併し、東京都杉並区に東京営業部および兵庫県西宮市に西宮営業部(現
営業部)を設置
1978年6月
本社を金沢市大豆田本町甲58番地に移転
1982年2月
名古屋証券取引所市場第二部に上場
1985年3月
東京証券取引所市場第二部に上場
1985年7月
石川県金沢市に出雲工場(現
メカトロ工場)を設置
1986年7月
群馬県高崎市に高崎工場(現
高崎事業所)を設置
1986年12月
東京証券取引所、名古屋証券取引所市場第一部銘柄に指定
1988年8月
東京営業部を東京都杉並区から新宿区へ移転
1993年3月
シブヤマシナリー㈱を設立
2000年9月
石川県金沢市にRP(Robot and Pharmaceutical)システム森本工場を設置
2003年8月
シブヤマシナリー㈱が石井工業㈱(エスアイ精工㈱に商号変更)を取得
2004年5月
シブヤEDI㈱を設立
2005年7月
米国バージニア州にShibuya Holdings Corporationを設立
Shibuya Holdings Corporationが米国バージニア州のHoppmann Corporation(現
関西
Shibuya Hoppmann
2008年2月
Corporation)を取得
静岡シブヤ精機㈱を設立
2008年4月
2009年9月
2010年11月
静岡シブヤ精機㈱が㈱マキ製作所から事業を譲り受け
㈱ファブリカトヤマ(現 シブヤパッケージングシステム㈱)を取得
石川県金沢市にEB(Electron Beam)システム森本工場を設置
2011年4月
2011年7月
2012年1月
2012年7月
2012年12月
2014年6月
静岡シブヤ精機㈱がエスアイ精工㈱を吸収合併し、商号をシブヤ精機㈱に変更
石川県金沢市に医療機若宮工場を設置
㈱カイジョーを取得
㈱根上工作所(現㈱根上シブヤ)を取得
㈱沖縄先端加工センター(現㈱沖縄シブヤ)を設立
石川県金沢市にRM(Regenerative Medicine)システム森本工場を設置
2017年10月
Shibuya Kaijo(Malaysia)Sdn.Bhd.を設立
2021年7月
2022年4月
シブヤマシナリー㈱を吸収合併
証券取引所の市場区分見直しに伴い、東京証券取引所プライム市場および名古屋証券取引所プレミア市
場へ移行
石川県能美市に能美ハイテクプラントを設置
上海希歩洋医療器械有限公司を設立
綜和機電㈱を取得
PT Shibuya Technologies Indonesiaを設立
2022年7月
2023年7月
2023年10月
2024年9月
4/100
EDINET提出書類
澁谷工業株式会社(E01666)
有価証券報告書
3【事業の内容】
当社グループは、当社および子会社18社で構成され、パッケージングプラント事業、メカトロシステム事業、農業
用設備事業にかかる製品の製造販売を主要な事業としております。
なお、子会社のうちShibuya Holdings Corporationは米国で設立した持株会社であり、シブヤEDI株式会社は人
材派遣および旅行代理業を事業目的としております。
各事業における当社グループ各社の位置付けなどは、次のとおりであります。
事業区分
主要製品
会社名
パッケージングプラント事業 ボトリングシステム(充填システ
ム、キャッピングシステム、ラベ
リングシステムなど)、製函・包
装システム、製薬設備システム
(医薬品製造システム、アイソ
レータなど)、食品加工システ
ム、洗浄設備システム、再生医療
システム(細胞培養アイソレー
タ、ロボット自動細胞培養システ
ムなど)、固液混合・分散システ
ムなど
当社
シブヤパッケージングシステム株式会社
Shibuya Hoppmann Corporation
メカトロシステム事業
当社
株式会社カイジョー
Shibuya Kaijo(Thailand)Co.,Ltd.
半導体製造システム(ハンダボー
ルマウンタ、ワイヤボンダ、LE
D検査装置など)、医療機器(人
工透析装置、レーザ手術および治
療装置など)、切断加工システム
(レーザ加工機、ウォータジェッ
ト切断加工機など)、超音波発生
装置、油圧プレス機など
上海希歩洋工業科技有限公司
株式会社根上シブヤ
株式会社沖縄シブヤ
Shibuya Kaijo(Thailand)Co.,Ltd.
Shibuya Kaijo(Malaysia)Sdn.Bhd.
PT Shibuya Technologies Indonesia
上海楷捷半導体科技有限公司
台湾海上希歩洋股份有限公司
Kaijo Shibuya America Inc.
Kaijo Shibuya Europe GmbH
上海希歩洋工業科技有限公司
株式会社根上シブヤ
株式会社沖縄シブヤ
Shibuya Kaijo(Malaysia)Sdn.Bhd.
上海希歩洋医療器械有限公司
綜和機電株式会社
農業用設備事業
農業用選果・選別システムなど
5/100
シブヤ精機株式会社
EDINET提出書類
澁谷工業株式会社(E01666)
有価証券報告書
(事業系統図)
以上述べた事項を事業系統図によって示すと、次のとおりであります。
6/100
EDINET提出書類
澁谷工業株式会社(E01666)
有価証券報告書
4【関係会社の状況】
名称
住所
議決権の
資本金
主要な事業の内容所有割合役員の
(百万円)
(%)
兼任
関係内容
資金
援助
営業上の取引
設備の
賃貸借
(連結子会社)
静岡県
浜松市
中央区
450
農業用設備
100.0
有
貸付
同社製品の購入
有
シブヤパッケージング
システム㈱
石川県
金沢市
450
パッケージングプ
ラント
100.0
有
貸付
当社製品の販売
および同社製品
の購入
有
Shibuya Holdings
米国
バージ
ニア州
パッケージングプ
ラント
100.0
有
−
−
−
7,495
パッケージングプ
ラント
100.0
(100.0)
有
−
当社製品の販売
−
90
メカトロシステム
100.0
有
貸付
当社製品の製造
委託
−
パッケージングプ
ラントおよびメカ
トロシステム
49.0
有
−
当社製品のメン
テナンス
−
メカトロシステム
100.0
(100.0)
有
−
−
−
メカトロシステム
100.0
(100.0)
有
−
−
−
メカトロシステム
100.0
(100.0)
有
−
−
−
メカトロシステム
100.0
(100.0)
有
−
−
−
−
100.0
有
−
当社グループへ
の人材派遣など
有
パッケージングプ
ラントおよびメカ
トロシステム
100.0
有
−
当社製品のメン
テナンス
−
100.0
有
貸付
当社製品の製造
委託
−
シブヤ精機㈱
Corporation
(注)3.
Shibuya Hoppmann
Corporation
㈱カイジョー
Shibuya Kaijo
(Thailand)Co.,Ltd.
(注)4.
米国
バージ
ニア州
東京都
羽村市
タイ国
バンコク
上海楷捷半導体科技
有限公司
中国
上海市
台湾海上希歩洋股份
有限公司
台湾
台北市
Kaijo Shibuya
America Inc.
Kaijo Shibuya
Europe GmbH
米国
カリフォル
ニア州
ドイツ国
バーデン
ヴュルテン
ベルク州
千米ドル
11,025
千米ドル
万バーツ
300
万元
160
万台湾ドル
600
千米ドル
300
千ユーロ
25
シブヤEDI㈱
石川県
金沢市
上海希歩洋工業科技
有限公司
中国
上海市
㈱根上シブヤ
石川県
能美市
97
パッケージングプ
ラントおよびメカ
トロシステム
㈱沖縄シブヤ
沖縄県
うるま市
50
パッケージングプ
ラントおよびメカ
トロシステム
100.0
有
−
当社製品の部品
加工および当社
製品の組立
−
パッケージングプ
マレーシア 万リンギット
ラントおよびメカ
国ペナン市
100
トロシステム
100.0
有
−
−
−
メカトロシステム
100.0
有
−
−
−
100
メカトロシステム
100.0
有
−
同社製品の製造
−
インド
100万ルピア
ネシア国
20,000
ジャカルタ
パッケージングプ
ラント
100.0
(0.1)
有
−
当社製品のメン
テナンス
−
Shibuya Kaijo
(Malaysia)Sdn.Bhd.
上海希歩洋医療器械
有限公司
中国
上海市
綜和機電㈱
埼玉県
入間市
PT Shibuya
Technologies
Indonesia
30
万元
1,037
万元
2,125
7/100
EDINET提出書類
澁谷工業株式会社(E01666)
有価証券報告書
(注)1.主要な事業の内容にはセグメントの名称を記載しております。
2.議決権の所有割合の(
)内は、間接所有割合で内数であります。
3.特定子会社に該当します。
4.議決権の所有割合が50%以下でありますが、実質的に支配しているため子会社としております。
8/100
EDINET提出書類
澁谷工業株式会社(E01666)
有価証券報告書
第2【事業の状況】
1【経営方針、経営環境及び対処すべき課題等】
当社グループの経営方針、経営環境及び対処すべき課題等は、以下のとおりであります。
なお、文中の将来に関する事項は、当連結会計年度末現在において当社グループが判断したものであります。
(1) 会社の経営の基本方針
当社グループは、創業以来「喜んで働く」ことを経営理念として、「カスタマー・ファースト」を貫き、人々
の生活に必要不可欠な業界の製造システムを開発・販売してきました。培われた技術の応用展開と新たに開発し
た技術との融合によって新しい分野にチャレンジし、会社の発展とともに環境と社会に貢献することを目指して
おります。
(2) 会社の対処すべき課題
当社グループは、創業の原点である「喜んで働く」の企業理念のもと、以下のSHIBUYA未来ビジョン宣言を定め
ております。
・Purpose(存在意義): ダントツ共進化で社会に役立つものをつくる
・Mission(使命)
: ダントツ製品でお客様の繁栄をサポート
・Vision(志)
: 生活に不可欠な業界の製造を支えるリーディングカンパニー
・Value(価値観)
: グローバル市場で持続的に成長
当社グループは、承継すべきものに新しい時代の変化を取り入れる「不易流行」の理念を全社で共有し、2027
年6月期を最終年度とする中期経営計画の達成に向けて、以下の重点施策に取り組みます。
① 社会のニーズに応える製品・サービスを開発・提供し、環境や社会・経済に貢献するサステナビリティ経営を
推進し、全てのステークホルダーと共に進化することを目指します。
② 世界のトップを走るダントツ製品づくりをさらに強化し、お客様との信頼関係に基づく利益創出によるWinWinを目指します。
③ 製品・サービス・海外拠点については、時代の要請を先取りしたグローバル戦略を推進します。
④ 3カイ(改善・改革・開発)の強力推進および予実管理の徹底に取り組み、収益力の向上に努めます。
⑤ 持続的な企業成長を目的として、新製品開発・新市場開拓・新事業創出を推進するため、多様性を尊重する広
い視野での人財育成に取り組み、DX化(デジタル技術の導入による業務およびビジネスモデルの変革)を強力
に推進し、お客様へより高い品質の製品とサービスの提供と社員のWell-beingの実現を目指します。
⑥ 新事業分野への参入やM&Aに戦略的に取り組むとともに、営業、技術、生産、管理の各部門において、グ
ループ一丸(One Shibuya)でグローバルに展開します。
(3) 中長期的な会社の経営戦略および目標とする経営指標
当社グループは、2025年6月期から2027年6月期を対象期間とする3ヵ年の中期経営計画を策定いたしまし
た。最終年度である2027年6月期に、売上高1,500億円、営業利益160億円およびROE10%以上の達成を目標として
おります。長期的には、新製品・新市場・新事業の成長エンジンによって、2030年6月期に売上高2,000億円の達
成に向けて取り組んでおります。
① 新製品開発
顧客ニーズの発掘、技術陣の改善意志、産学官連携などをベースにイノベーションを創出し、チャレンジ精神
と独創的な先端技術を具現化した「ダントツ製品」を開発します。
② 新市場開拓
新興国をはじめ他市場における健康意識の向上と透析患者の増大を背景に、海外市場を拡大し、世界の人々の
健康を支え、増進する社会に貢献します。
③ 新事業創出
お客様のニーズにお応えすることの積み重ねが新事業の創出に繋がり、必要に応じてM&Aを活用し、事業領
域を拡大します。
④ 環境への貢献
エネルギー・水・資源などの消費削減に寄与する製品・サービスの開発・提供を通じて、持続可能な社会に貢
献するとともに、企業価値の向上を図ります。
(4) 経営環境
各セグメントにおける経営環境は以下のとおりであります。
(a) パッケージングプラント事業
パッケージングプラント事業は、顧客が清涼飲料業界を中心に酒類、食品、医薬品、トイレタリーなど多岐
に亘っており、また生活必需品を生産するユーザーが多いことから、景気の影響を受けにくいという特長があ
9/100
EDINET提出書類
澁谷工業株式会社(E01666)
有価証券報告書
ります。その中でも、飲料を無菌環境下でPETボトルに常温で充填する無菌充填システムに関しては、技術的な
優位性が多くのユーザーに支持されており、国内シェアは80〜90%に上ると推定しております。当社グループ
の飲料無菌充填システムは、PETボトルの薄肉化によるプラスチック消費量の削減、ボトル洗浄水の使用量低
減、また取扱いが高難度な再生PET樹脂100%ボトルへの技術的な対応による高速充填などを実現しており、プ
ラスチックごみによる海洋汚染問題への意識が高まる中、PETボトルのリサイクルをはじめ、持続可能な社会の
実現に向けてユーザーが推進しているSDGs活動にも様々なかたちで貢献しております。
国内の飲料市場は、健康志向の高まりから茶系飲料や乳飲料などの低酸性飲料に人気が集中しており、消費
者のニーズや嗜好の多様化も見られ、消費マインドの底堅さを背景に設備需要は堅調に推移してきました。し
かしながら、少子化により国内の人口減少が進んでいることから、市場は長期的には縮小すると見込まれま
す。また、プラスチックごみによる海洋汚染問題をはじめとして、環境に配慮した容器や環境保全への取り組
みがより一層求められることが見込まれます。このような状況のなか、当社グループが開発した環境に配慮し
薬剤や無菌水の使用量を大幅に削減した電子線ボトル滅菌方式による無菌充填システムの市場ニーズは高まる
ものと見ており、今後の拡販戦略により更なる需要喚起は可能と見込んでおります。
また、海外においては、アジア等の新興国では消費者の嗜好の変化や所得水準の向上により衛生環境への意
識が高まっていること、北米市場では健康志向の高まりにより低酸性飲料の需要が増加していることから、飲
料無菌充填システムの需要増加が見込まれ、海外での販売拡大が期待できる環境下にあります。
なお、近年注力しております再生医療システム事業では、主に大学やスタートアップ企業との共同研究開発
ならびに講座等への協力を通じた産学官連携により高度な先端医療技術の研究をサポートするとともに、再生
医療の実用化に向けた量産体制を担うための製品開発を進めております。再生医療システム事業は、将来の中
核を担う事業に発展すると見込んでおります。
(b) メカトロシステム事業
メカトロシステム事業では、医療機器、半導体製造装置、切断加工機およびプレス機の製造販売を行ってお
り、当事業の第1の柱である医療機器は、そのほとんどがOEM契約により製造している人工透析装置であり
ます。国内における透析患者数は減少に転じており、需要が減少していくことが予測されます。一方、海外に
おいては中国、インドを中心に世界的には透析患者数が増加しており、また、北米向けの出荷が本格化したこ
とにより、当社の人工透析装置の海外向け売上高の割合は80%を超えております。このような状況のなか、当
社は生産増に対応するため、医療機若宮工場の増設に着手するとともに、各市場向けの新製品開発を進めてお
ります。
当事業の第2の柱である半導体製造装置は、約50%をアジア諸国へ輸出しており、顧客のニーズにきめ細か
く対応した特殊仕様機を高品質で提供できる点で高い評価を得ております。今後、世界の半導体市場は、自動
運転やロボット用に加えAI用として、高速画像処理と高い演算機能を兼ね備えたGPU(Graphics Processing
Unit)分野の拡大や、データセンターの増加・拡充に伴う光トランシーバ製造に関係する装置の需要拡大、ま
た、EV化や省エネ・省電力化に欠かせないパワー半導体の関係装置の需要拡大が予測されます。半導体・電子
部品業界は非常に市場の動きが早く、短周期での技術革新にも対応できるよう、顧客ニーズに合致した新製品
を高品質かつ短納期で開発・供給できる体制づくりおよび海外サービス体制の強化に注力しております。
(c) 農業用設備事業
農業用設備事業では、主として農協向けに柑橘類用、落葉果樹類用および蔬菜類用の選果・選別プラントを
製造販売しております。日本国内における農業を取り巻く環境は、高齢化による深刻な担い手不足、耕作放棄
地の増加、輸入農産物との競合に加え、肥料・飼料価格の高騰が経営を圧迫し、異常気象による災害リスクも
増大しています。スマート農業や高付加価値化の取り組みが進む一方、持続可能な農業のための政策が急務で
す。これに対し国は、収益強化に計画的に取り組む産地を対象に、その実現に必要な農業機械の導入、集出荷
施設等の整備支援政策をとっており、この政策のもと、集出荷施設の再編や施設の大型化に伴う設備更新需要
の引き合いが高まっております。
このような状況のなか、当社グループは選果・選別システムの国内トップメーカーとして、農業生産力を高
めるための先端技術である「スマート農業」を推進し農業の持続的発展に貢献すべく努めております。
今後においては、高品質で付加価値の高い国際競争力のある農産物の生産の実現に向けて、当社グループの
最新AIを搭載した画像処理システム、選果データをDX化し生産者への営農指導に活用される「KAISEKI
システム」、ならびに生産効率を向上させる搬送・ロボット技術により、自動化と省人化が図られた高品質な
選果・選別プラント市場ニーズの高まりによる需要増加が見込まれております。
10/100
EDINET提出書類
澁谷工業株式会社(E01666)
有価証券報告書
2【サステナビリティに関する考え方及び取組】
当社グループのサステナビリティに関する考え方および取り組みは、次のとおりであります。
なお、文中の将来に関する事項は、当連結会計年度末現在において当社グループが判断したものであります。
(1) ガバナンス
気候変動への対応をはじめとするサステナビリティに関する課題については、担当取締役を委員長とするサステ
ナビリティ委員会にて審議および検討しております。サステナビリティ委員会は、当社グループの内部統制システ
ムのうち、内部統制関連の委員会として設置しており、サステナビリティ委員会で審議および検討された議案につ
いては、取締役会への報告を年1回以上の頻度で実施します。当社は、持続可能な社会の実現のために「シブヤグ
ループにおけるサステナビリティに関する基本方針」を取締役会で決議いたしました。今後は同委員会において気
候変動への対応をはじめとする具体的な取り組み、活動方針の検討も進めております。
<シブヤグループにおけるサステナビリティに関する基本方針>
当社グループは、社会のニーズに合わせた製品・サービスを開発・提供し、企業価値の向上を図るとともに持続
可能な社会に貢献します。
(a) カスタマーファーストの追求
お客さまが事業活動を通じて目指す様々なサステナビリティ(環境、社会、経済)への取り組みに対して、お
客さまと協働し、持続可能な社会に貢献できる製品、サービスを提供します。
(b) 環境に配慮した製品・サービスの開発と提供
エネルギー、水、資源などの消費削減に寄与する製品・サービスの開発、提供を通じて、地球環境の維持、保
全に努めます。
(c) 地球環境保全に配慮した事業活動
すべての事業活動において、省エネルギー、省資源、環境汚染防止、廃棄物の削減に取り組み、環境にやさし
い社会の実現を推進します。
(d) 人財育成と労働環境整備
従業員が共に成長し、個々の能力を最大限に発揮できるよう、公正な処遇や教育研修の充実を図ると共に、そ
の多様性を尊重し、安全かつ健康に当社グループの創業の原点である喜んで働ける労働環境の構築に取り組み
ます。
(e) サプライヤーとのパートナーシップ
サステナビリティを尊重し、当社グループの理念を共有するサプライヤーと公正かつ公平な取引を行い、良好
なパートナーシップと持続可能なサプライチェーンの構築を通じて、共存、共栄を目指します。
(f) 地域社会活動への参画と貢献
地域の学術、文化、スポーツ、経済活動などへの参画と支援を通して、地域との友好な関係を築き、地域社会
の持続的な発展に貢献します。
(2) リスク管理
11/100
EDINET提出書類
澁谷工業株式会社(E01666)
有価証券報告書
当社グループにおける様々なリスクについて、目的および機能別に各種リスク管理委員会を設置しております。
また、大規模な自然災害をはじめとする事業活動遂行上脅威となる予想困難な事態に対応するため、取締役社長を
本部長とする危機管理緊急対策本部を設置しており、当社グループに危機が発生したと判断した時は、機動的に執
行体制を整備できるよう体制を整えております。
(3) 気候変動への取組(TCFD提言への対応)
①戦略
気候変動によるリスクおよび機会の特定にあたり、2050年のカーボンニュートラルと整合する2030年目標が日本
において設定されていることから、2030年時点を想定したシナリオ分析を行いました。分析では、IPCC(気候変動
に関する政府間パネル)やIEA(国際エネルギー機関)が公表するシナリオを用いて、産業革命期頃の世界平均気
温と比較して2100年頃までに気温が4℃上昇するとする4℃シナリオと、カーボンニュートラルへの取り組みにより
気温上昇が2℃以下に抑制される1.5℃シナリオの2つのシナリオで定量的・定性的な分析を行いました。
4℃シナリオにおいては、台風や豪雨、豪雪などの異常気象の激甚化によって当社の生産拠点や物流への直接的
な影響を想定しております。そのうち、国土交通省が公表する治水経済調査マニュアルを参考に、洪水被害と高潮
被害については発災時の被害予測を定量的に評価・把握しています。また、主に国外にて拡大する干ばつ被害によ
る影響から、水の供給需要と節水需要が拡大することを予測しており、自社製品の環境性能向上が世界的な気候変
動への適応および緩和に資するものと認識し、社会貢献の可能性を確認しています。対して1.5℃シナリオにおい
ては、カーボンプライシング制度の導入が当社にも直接的な影響を及ぼすものと想定しています。また、定量的な
分析では比較的軽微な影響として試算したものの、製品の原材料である鉄・銅・アルミニウムをはじめとした資材
価格が高騰する可能性も認識しています。一方で、製品に対する脱炭素化需要が拡大することを想定しており、特
に販売製品の省資源・省エネルギー性能の向上や資材調達段階を含むライフサイクル全体での環境負荷の低減、再
生材の利活用を見据えた技術的対応の推進が、新たな機会獲得および事業拡大に資するものと認識しています。
当社グループでは、「シブヤグループにおけるサステナビリティに関する基本方針」を定め、環境経営の推進に
取り組んでいます。具体的には、お客様における省資源・省エネルギー化や脱炭素化需要に応えるために、以下の
ような製造システムの開発やサプライチェーン全体での環境負荷低減を目的としたグリーン調達基準書の策定な
ど、脱炭素化への貢献を目指した取り組みを行っております。また、目的および機能別に各種リスク管理委員会を
設置することでリスク管理体制の強化に取り組んでおり、レジリエンス性の増強に努めています。
<省資源・省エネルギー化や脱炭素化へ対応した製造システムの事例>
・プラスチック使用量の削減(包材の変更や包材ロスの削減)
・水使用量の削減(新製品の開発や洗浄・殺菌方法の変更)
・電気使用量の削減(新製品の開発や小型化、高速化)
・フードロスの削減(食品の焙煎・表面殺菌や損傷低減)
・CO2の削減(新製品の開発)
12/100
EDINET提出書類
澁谷工業株式会社(E01666)
有価証券報告書
②リスク管理
気候関連リスクについては、サステナビリティ委員会にて識別・評価を行う体制となっており、審議された内容
は取締役会に報告を行うこととしています。今後は、個別の気候関連リスクについて、サステナビリティ委員会で
識別・評価を行う中で、気候変動に関するリスク管理体制を整えてまいります。
③指標及び目標
2050年のカーボンニュートラル達成を掲げる国際的な目標および、国内における2030年を対象年とした2013年度
比での温室効果ガス排出量の削減目標46%に準拠するため、事業活動から排出される温室効果ガス量の継続的なモ
ニタリングを実施してまいります。当社グループでは、温室効果ガス排出量を指標とし、2030年を対象年とする
2020年度(2021年6月期)比30%削減を目標に設定しています。なお、過年度における温室効果ガス排出量実績は
次のように計上しています。
内
GHG
排出量
2021年6月期
2022年6月期
2023年6月期
2024年6月期
2025年6月期
Scope1
1,992
2,561
2,213
2,416
2,576
Scope2
5,669
6,693
6,862
7,170
7,140
合計排出量
7,661
9,254
9,075
9,585
9,716
内
GHG
排出量
訳
訳
2026年6月期
Scope1
2,543
Scope2
6,801
合計排出量
9,344
(注)1.Scope3の算定は検討中であります。
2.2022年6月期は、連結子会社との合併により、Scope1が422t-CO2、Scope2が870t-CO2増加していま
す。
3.2023年6月期は、新工場(能美ハイテクプラント)の操業開始などにより、Scope2が169t-CO2増加し
ています。
4.2024年6月期は、売上高の増大に伴い、新工場(能美ハイテクプラント)を含む各工場の稼働率が上が
り、Scope1・2ともに増加しました。
5.2025年6月期は、2024年8月から津幡工場において太陽光発電を開始しましたが、生産量の増加による
各工場の稼働拡大に伴い、GHG排出量は微増となりました。
6.2026年6月期は、能美ハイテクプラントに太陽光発電設備を導入したことにより、GHG排出量が減少
しました。
(4) 人的資本、多様性に関する開示
①戦略
(人財育成方針)
当社グループは、ダントツ共進化で社会に役立つものをつくるため(Purpose)、生活に不可欠な業界の製造を
支えるリーディングカンパニーとなるべく(Vision)、ダントツ製品でお客様の繁栄をサポートし(Mission)、
グローバル市場での持続的な成長(Value)を目標としております。当社の創業の原点「喜んで働く」を実践し、
承継すべきものに新しい時代の変化を取り入れる「不易流行」の理念を共有し、新たなステージへ挑戦できる人財
を育成してまいります。
(社内環境整備に関する方針)
高齢者は経験を活かし定年後70歳まであるいは職務の特性などに合致した柔軟な個別契約にて心身共に健康に働
ける環境を、若い世代は失敗を恐れず挑戦できる機会を増やしキャリアアップの可能性を広げられる環境を、さら
に性別や国籍を問わず多様な人材が「自分らしく」共に働き、全員のWell-beingを実現する環境を整えてまいりま
す。
②指標及び目標
近年、女性総合職の拡大やインドなど海外の高度人材の採用によるダイバーシティの推進、短期海外研修制度
(GLP:Global Learning Program)の導入などによる人財能力開発、更に社員向け福利厚生の拡充などによる働き
がいある職場づくりなど、各種施策を積極的に実施しております。加えて人材獲得を目的としたブランディング戦
略プロジェクトを設置し、SNSによる情報発信、コーポーレートサイト「採用情報」の刷新などを実施しており
ます。
13/100
EDINET提出書類
澁谷工業株式会社(E01666)
有価証券報告書
指標及び目標について、現時点では具体的な数値を設定していませんが、今後、当社グループにとって最適とな
る指標と目標の検討を進めてまいります。
14/100
EDINET提出書類
澁谷工業株式会社(E01666)
有価証券報告書
3【事業等のリスク】
当社グループの経営成績、財政状態およびキャッシュ・フローの状況等の業績に影響を与える可能性のあるリスク
には、以下のようなものがあります。
なお、文中における将来に関する事項は、当連結会計年度末(2026年6月30日)現在において当社グループが判断
したものでありますが、当社グループに関するすべてのリスクを網羅したものではありません。
(1)経済情勢、市場環境等
当社グループはパッケージングプラント事業、メカトロシステム事業、農業用設備事業の3つの事業で構成され
ており、すべての事業において顧客の設備投資動向の影響を受けます。また、顧客の中には製薬業界や医療機器業
界など法的な規制を受ける業界もあります。3つの事業における業績の変動要因はそれぞれ独立しておりますが、
経済情勢や市場環境の急激な変化、各業界における法的規制の変更など、予期せぬ外部環境の変化が発生した場
合、当社グループの業績に影響を及ぼす可能性があります。各事業における固有のリスクは以下のとおりでありま
す。
①パッケージングプラント事業
当社グループの主力であるパッケージングプラント事業のうち清涼飲料業界向けは、連結売上高の20〜30%程度
を占めております。清涼飲料業界における充填設備の投資は、消費者の嗜好の変化や天候、あるいは容器の変化な
どにより、その設備投資動向が左右されることがあります。
当社グループでは、清涼飲料業界の動向に注視するとともに、技術開発力をさらに強化し、革新的技術開発を行
い、環境の変化にも能動的に対応します。
②メカトロシステム事業
当事業の第1の柱である医療機器は、その大部分をOEM供給しており、OEM供給先の業績や経営方針の転換
などの影響を受けることがあります。
当社グループでは、OEM供給先と共同開発を行うとともに、定期的な技術および販売連絡会議を開催するな
ど、取引関係の維持・強化に努めております。
③農業用設備事業
当社グループの農業用設備事業は、主に農協向けに農業用選果・選別プラントを製造・販売しております。農協
は、設備を導入するにあたり国および地方公共団体の補助金を活用する場合が多く、農協の設備計画は、国等の農
業政策の転換等の影響を受けることがあります。
当社グループでは、市場動向に注視するとともに、グローバルな販売の拡大を推進します。
(2)製造物責任(PL)
当社グループでは、製品の品質・性能に万全を期して各種製品を製造しており、PLリスクの検討を事前に実施
し、製品出荷時や設備引渡し時に当社として品質基準を満たしていることを検査することでPL問題の未然防止を
図っております。また、製造物責任賠償については、関連する必要な保険に加入し、万一の事故に備えておりま
す。但し、上記の対応で十分にカバーできないPL事故が発生した場合、当社グループの業績に影響を及ぼす可能
性があります。
当社グループでは、製品・技術情報関連のリスク管理委員会であるPL委員会を設置しており、万一の事故が発
生した場合は同委員会が中心となり迅速に対応します。
(3)知的財産権
当社グループは、開発した製品および技術を特許権等の知的財産権により保護するとともに、当社製品が第三者
の知的財産権を侵害しないよう努めております。しかしながら、第三者による当社グループ製品への特許侵害や、
当社グループ製品が第三者の知的財産権を侵害した旨の主張による訴訟等が発生した場合、機会損失・訴訟費用・
損害賠償等により、当社グループの業績に影響を及ぼす可能性があります。
当社グループでは、知的財産権を管理する専門部署を設けており、第三者の知的財産権の調査を徹底し、第三者
による当社グループ製品への特許侵害の調査も適宜行っております。
(4)自然災害、感染症
大規模な自然災害や新型感染症の拡大が発生した場合、生産活動や営業活動の縮小または停止を余儀なくされ、
当社グループの業績に影響を及ぼす可能性があります。
当社グループでは、災害等が発生した場合は取締役社長を本部長とする危機管理緊急対策本部が中心となり迅速
に対応します。
15/100
EDINET提出書類
澁谷工業株式会社(E01666)
有価証券報告書
4【経営者による財政状態、経営成績及びキャッシュ・フローの状況の分析】
(1) 経営成績等の状況の概要
当連結会計年度における当社グループの財政状態、経営成績及びキャッシュ・フローの状況の概要は次のとおり
であります。
① 財政状態の状況
当連結会計年度末の資産については、主として売上債権および契約資産が80億56百万円、有形固定資産が46億8
百万円増加したことから、前連結会計年度末に比べ138億54百万円増加し1,732億80百万円となりました。
負債については、主として固定資産の取得に伴う未払金(流動負債の「その他」に含まれる)が39億56百万円増
加したことから、前連結会計年度末に比べ26億92百万円増加し541億88百万円となりました。
純資産については、主として親会社株主に帰属する当期純利益の計上により利益剰余金が75億25百万円増加した
こと、また、その他の包括利益累計額が36億36百万円増加したことから、前連結会計年度末に比べ111億61百万円
増加し1,190億91百万円となりました。
② 経営成績の状況
当連結会計年度におけるわが国経済は、個人消費や設備投資の持ち直しなどにより国内景気は緩やかな回復が見
られるものの、構造的な人手不足による人件費の上昇や原材料価格・エネルギーコストの高騰に加え、中東情勢な
ど国際情勢の不安定化により、景気の先行きは不透明な状況で推移しました。
このような状況のなか、当社グループの連結売上高は1,356億13百万円(前期比5.1%増)となりましたが、メカ
トロシステム事業および農業用設備事業が減益となったことから、営業利益は130億81百万円(前期比4.9%減)、
経常利益は135億60百万円(前期比1.5%減)となり、親会社株主に帰属する当期純利益は102億23百万円(前期比
1.7%増)となりました。なお、売上高は過去最高を更新しました。
セグメントの業績は、次のとおりであります。
(パッケージングプラント事業)
パッケージングプラント事業の売上高は、食品用プラントは調味料充填システムおよび飲料無菌充填システムが
減少したものの、酒類用プラントは清酒充填システムが増加し、薬品・化粧品用プラントは注射薬シリンジ充填シ
ステムや点眼剤充填システム、化粧品充填システムが増加したことから、前連結会計年度に比べ増加しました。
その結果、売上高は840億41百万円(前期比4.9%増)、営業利益は132億39百万円(前期比5.3%増)となりまし
た。
(メカトロシステム事業)
メカトロシステム事業の売上高は、半導体製造システムはデータセンター向け光通信モジュール用ボンダが好調
に推移していることから増加し、医療機器は部品不足の解消に伴い第3四半期より増産を行った結果、北米など海
外向けが増加したことから、前連結会計年度に比べ増加しました。
その結果、売上高は389億97百万円(前期比3.3%増)となりましたが、損益面については、半導体製造システム
において付加価値の高い機種の販売割合が減少したこと、また医療機器において、前連結会計年度に発生した部品
の耐久性問題に関して交換の実施に伴う追加費用が発生したことから、営業利益は17億81百万円(前期比23.9%
減)となりました。
(農業用設備事業)
農業用設備事業の売上高は、落葉果樹類向け選果選別プラントが減少したものの、柑橘類向けおよび蔬菜類向け
選果選別プラントが増加したことにより、前連結会計年度に比べ増加しました。
その結果、売上高は125億74百万円(前期比12.6%増)となり、損益面については、一部の大型プラントで採算
性の低い案件があったことに加えて、新本社工場の完成に伴う償却負担の増加も影響したことから、営業利益は5
億20 百万円(前期比50.1%減)となりました。
③ キャッシュ・フローの状況
当連結会計年度におけるキャッシュ・フローの状況については、次のとおりであります。
(営業活動によるキャッシュ・フロー)
営業活動によるキャッシュ・フローは、52億80百万円の資金増加(前期は90億69百万円の資金増加)となりまし
た。これは主に、税金等調整前当期純利益が143億17百万円となり、売上債権及び契約資産の増加額78億18百万
円、仕入債務の減少額19億55百万円および法人税等の支払額42億53百万円による資金減少があったものの、非資金
項目である減価償却費34億31百万円による資金増加があったことによるものであります。
16/100
EDINET提出書類
澁谷工業株式会社(E01666)
有価証券報告書
(投資活動によるキャッシュ・フロー)
投資活動によるキャッシュ・フローは、107億40百万円の資金減少(前期は66億19百万円の資金減少)となりま
した。これは主に、有形固定資産の取得による支出42億66百万円、定期預金の預入による支出104億41百万円およ
び定期預金の払戻による収入34億40百万円があったことによるものであります。
(財務活動によるキャッシュ・フロー)
財務活動によるキャッシュ・フローは、36億5百万円の資金減少(前期は38億12百万円の資金減少)となりまし
た。これは主に、長期借入金の返済による支出9億7百万円および配当金の支払額26億95百万円によるものであり
ます。
これらの結果、現金及び現金同等物の期末残高は、前連結会計年度末より85億90百万円減少し367億円(前期比
19.0%減)となりました。
④ 生産、受注及び販売の実績
a. 生産実績
当連結会計年度における生産実績をセグメントごとに示すと、次のとおりであります。
セグメントの名称
金額(百万円)
前年同期比(%)
パッケージングプラント事業
84,041
+4.9
メカトロシステム事業
38,984
+3.9
農業用設備事業
12,574
+12.6
135,600
+5.3
合計
(注)金額は販売価額によっており、セグメント間の取引については相殺消去しております。
b. 受注実績
当連結会計年度における受注実績をセグメントごとに示すと、次のとおりであります。
セグメントの名称
受注高(百万円)
前年同期比(%) 受注残高(百万円)
前年同期比(%)
パッケージングプラント事業
77,081
+5.2
65,912
△9.6
メカトロシステム事業
40,767
+12.5
12,718
+16.2
農業用設備事業
15,039
+38.9
11,823
+26.3
132,888
+10.4
90,454
△2.9
合計
17/100
EDINET提出書類
澁谷工業株式会社(E01666)
有価証券報告書
c. 販売実績
当連結会計年度における販売実績をセグメントごとに示すと、次のとおりであります。
セグメントの名称
金額(百万円)
前年同期比(%)
パッケージングプラント事業
84,041
+4.9
メカトロシステム事業
38,997
+3.3
農業用設備事業
12,574
+12.6
135,613
+5.1
合計
(注)1.セグメント間の取引については、相殺消去しております。
2.主な相手先別の販売実績および総販売実績に対する割合は、次のとおりであります。なお、下記のうち総販
売実績に対する割合が10%未満となる前連結会計年度の販売実績および総販売実績に対する割合は、記載を
省略しております。
前連結会計年度
当連結会計年度
相手先
金額(百万円) 割合(%)
ニプロ株式会社
金額(百万円)
割合(%)
21,841
16.9
22,850
16.9
−
−
15,117
11.1
株式会社アセプティック・システム
(2) 経営者の視点による経営成績等の状況に関する分析・検討内容
経営者の視点による当社グループの経営成績等の状況に関する認識及び分析・検討内容は次のとおりでありま
す。
なお、文中における将来に関する事項は、当連結会計年度末(2026年6月30日)現在において当社グループが判
断したものであります。
① 財政状態及び経営成績の状況に関する認識及び分析・検討内容
当社グループは、売上高および収益の長期・持続的な増大を目標としており、具体的な数値としては、連結売上
高2,000億円の達成を目標としております。この目標達成のために「シブヤ成長戦略」を推進しております。
当連結会計年度の経営成績等については、「(1)経営成績等の状況の概要」に記載のとおりであります。
② キャッシュ・フローの状況の分析・検討内容並びに資本の財源及び資金の流動性に係る情報
当連結会計年度のキャッシュ・フローの状況の分析については、「(1)経営成績等の状況の概要」に記載のとお
りであります。
当社グループは、売上債権および棚卸資産の圧縮等資金の効率を高め、財務基盤の健全化に努めており、事業活
動のための適切な資金確保を行うことを財務方針の基本としております。運転資金および設備資金(買収資金を含
む)については、内部資金のほか、主に銀行等の金融機関からの借入により調達しております。
当社グループは、その健全な財政状態、安定した収益力および取引金融機関からの信用により、当社グループの
成長を維持するために将来必要となる運転資金、設備資金、研究開発資金およびM&A資金を創出・調達すること
が可能と考えております。
なお、今後予定している重要な設備の新設およびその資金調達方法については、「第3 設備の状況 3 設備の
新設、除却等の計画」に記載のとおりであります。
③ 重要な会計上の見積り及び当該見積りに用いた仮定
当社グループの連結財務諸表は、わが国において一般に公正妥当と認められている会計基準に基づき作成されて
おります。連結財務諸表の作成において、過去の実績やその時点で入手可能な情報に基づいた合理的と考えられる
さまざまな要因を考慮したうえで見積りおよび判断を行っておりますが、実際の結果は、見積り特有の不確実性が
あるため、これらの見積りと異なる場合があります。
連結財務諸表の作成に当たって用いた会計上の見積りおよび当該見積りに用いた仮定のうち、重要なものについ
ては、「第5 経理の状況 1 連結財務諸表等 (1)連結財務諸表注記事項(重要な会計上の見積り)」に記
載のとおりであります。
18/100
EDINET提出書類
澁谷工業株式会社(E01666)
有価証券報告書
5【重要な契約等】
該当事項はありません。
6【研究開発活動】
当社グループは、顧客ニーズの発掘、技術陣の改善意志、産学官連携などをベースにイノベーションを創出し、
チャレンジ精神と独創的な先端技術を具現化した製品開発を進めております。世界のトップを走るダントツ製品づく
りを推進するとともに、ユーザーが使用するエネルギーや水資源の削減に貢献する製品の開発や、AI、IoTなどを活
用した自動化・省人化製品の開発についても積極的に取り組んでおります。
現在、研究開発は、当社情報・知的財産本部を主管部門とした当社グループ全体の開発委員会を設け、市場情報、
技術情報を一元管理し効率的かつ戦略的に研究開発活動を推進しております。
当連結会計年度における当社グループ全体の研究開発費は2,013百万円であり、セグメント別の研究開発活動の状
況および研究開発費の金額は、次のとおりであります。
(1) パッケージングプラント事業
コンピュータ制御による自動高速パッケージングシステム、製品の高品質化に応える無菌充填技術、包装形態の
多様化に対応するロボット包装ライン、細胞培養の自動化システムなどを中心に、当社およびシブヤパッケージン
グシステム㈱が研究開発を行っております。当事業に係る研究開発費は809百万円であります。
当連結会計年度において、次世代プラットフォーム「SHoPS」を開発しました。人手不足や品質確保など製造現
場の課題解決を目的として、フィジカルAI・デジタルツイン・SDA(Software Defined Automation)をキーワード
に、IT/OT/フィジカル領域の垂直統合によるダウンタイムゼロ・無人型スマートファクトリーの構築を目指してお
ります。
(2) メカトロシステム事業
半導体製造システム、切断加工システム、医療機器関連および超音波応用機器などを中心に、当社および㈱カイ
ジョーが研究開発を行っております。当事業に係る研究開発費は1,093百万円であります。
当連結会計年度において、300mmの大型基板や3Dパッケージに対応したCuピラーを開発しました。また、4
JET社(ドイツ)と提携し、高機能ガラス向けレーザ微細加工システムを開発しました。
(3) 農業用設備事業
農業用選果・選別システムを中心に、シブヤ精機㈱が研究開発を行っております。当事業に係る研究開発費は
109百万円であります。
当連結会計年度において、スマートハイブリッド・ストレージシステムを開発しました。従来のケース自動倉庫
の代替として、低コスト・高密度貯留・高能力を特徴とした選果箱詰め製品の一部貯留システムで、多品種・小
ロット品の効率的な貯蔵・出荷を実現しました。
19/100
EDINET提出書類
澁谷工業株式会社(E01666)
有価証券報告書
第3【設備の状況】
1【設備投資等の概要】
当社グループは、生産性および品質向上ならびに事務の合理化を目的とした設備投資を継続的に行っております。
当連結会計年度の設備投資(有形固定資産のほか無形固定資産を含む)の内訳は、次のとおりであります。
パッケージングプラント事業
5,066 百万円
メカトロシステム事業
2,410
農業用設備事業
250
消去又は全社
274
8,002
合計
主なものとして、当社森本第3機械工場、SX森本工場および能美第2機械工場(パッケージングプラント事業)、医
療機若宮工場B棟(メカトロシステム事業)の建設ほか、工作機械および工具器具備品等の新設ならびに更新投資を実施
しました。
なお、所要資金については、自己資金によっております。
また、当連結会計年度において、重要な設備の除却、売却等はありません。
2【主要な設備の状況】
当社グループにおける主要な設備は、以下のとおりであります。
(1)提出会社
2026年6月30日現在
帳簿価額(百万円)
事業所名
(所在地)
本社工場
(石川県金沢市)
メカトロ工場及び医
療機若宮工場
(石川県金沢市)
森本工場
(石川県金沢市)
津幡工場
(石川県津幡町)
進和工場
(石川県金沢市)
能美ハイテクプラン
ト
(石川県能美市)
高崎事業所
(群馬県高崎市)
本社
(石川県金沢市)
東京営業部
(東京都新宿区)
関西営業部
(兵庫県西宮市)
セグメントの名称
設備の内容
建物及び
構築物
機械装置
土地
及び運搬
(面積㎡)
具
パッケージングプ
ラント生産設備・
研究開発施設
1,375
メカトロシステム事
業
メカトロシステム
生産設備・研究開
発施設
1,884
101
パッケージングプラ
ント事業
パッケージングプ
ラント生産設備・
研究開発施設
4,534
694
パッケージングプラ
ント事業
パッケージングプ
ラント生産設備・
研究開発施設
918
209
パッケージングプラ
ント事業
パッケージングプ
ラント生産設備・
研究開発施設
130
0
パッケージングプラ
ント事業
パッケージングプ
ラント生産設備
3,836
965
パッケージングプラ
ント事業
その他設備
112
0
その他設備
1,167
−
その他設備
143
2
その他設備
22
0
57
トロシステム事業
パッケージングプラ
ントおよびメカトロ
システム事業
合計
(14,463)
−
441
2,504
−
2,367
6,167
−
1,450
11,411
−
156
2,233
−
11
147
−
1,750
7,512
−
0
150
−
161
2,202
−
1
315
−
1
107
[13,598]
的管理業務
パッケージングプラ
ント事業およびメカ
その他
629
パッケージングプラ
ント事業
パッケージングプラ
ント事業および全社
リース
資産
20/100
1,814
(31,090)
4,732
(130,720)
949
(49,105)
4
(3,730)
960
(39,671)
37
(5,708)
873
(8,312)
167
(1,527)
83
(452)
従業員数
(人)
736
(56)
355
(262)
363
(16)
200
(17)
60
(9)
88
(2)
32
(1)
239
(3)
38
(4)
27
(2)
EDINET提出書類
澁谷工業株式会社(E01666)
有価証券報告書
(2)国内子会社
2026年6月30日現在
帳簿価額(百万円)
会社名
シブヤ精機
㈱
シブヤ精機
事業所名
(所在地)
セグメントの
名称
設備の内容
浜松本社
選果・選別システ
(静岡県浜松市農業用設備事業 ム生産設備・研究
開発施設
中央区)
5,446
335
538
34
㈱
シブヤパッ
ケージング
本社
パッケージング
(石川県金沢市) プラント事業
㈱カイ
本社
ジョー
(東京都羽村市) ム事業
メカトロシステ
1,930
163
461
47
237
13
996
28
メカトロシステム
生産設備・研究開
発施設
㈱カイ
松本事業所
ジョー
(長野県松本市) ム事業
㈱根上シブ
本社
ヤ
(石川県能美市) よびメカトロシ メカトロシステム
ステム事業
生産設備
メカトロシステ メカトロシステム
生産設備
パッケージング パッケージングプ
プラント事業お ラント生産設備・
その他
合計
−
124
6,892
(11,597)
−
42
1,270
−
40
3,118
−
239
1,314
−
17
358
−
16
1,399
[916]
パッケージングプ
ラント生産設備・
研究開発施設
986
(40,331)
リース
資産
654
選果・選別システ
松山本社
農業用設備事業 ム生産設備・研究
(愛媛県松山市)
開発施設
システム㈱
機械装置
土地
建物及び
及び運搬
構築物
(面積㎡)
具
983
(31,263)
566
(9,256)
89
(9,972)
359
(20,057)
従業員数
(人)
182
(30)
190
(32)
230
(10)
213
(39)
101
(61)
75
(12)
(3)在外子会社
2026年6月30日現在
帳簿価額(百万円)
会社名
事業所名
(所在地)
セグメントの
名称
設備の内容
機械装置
土地
建物及び
及び運搬
構築物
(面積㎡)
具
Shibuya
本社
パッケージングプ
パッケージング
(米国バージニ
ラント生産設備・
プラント事業
研究開発施設
Corporation ア州)
Hoppmann
479
169
104
(27,059)
リース
資産
その他
合計
−
15
768
従業員数
(人)
114
(注)1.帳簿価額のうち「その他」は、工具、器具及び備品と建設仮勘定の合計額であります。
2.提出会社の本社工場の土地は、一部を賃借(賃借料年額は84百万円)しており、その面積については[
で外書きしております。
3.シブヤ精機㈱松山本社の土地は、一部を賃借(賃借料年額は2百万円)しており、その面積については
[ ]で外書きしております。
4.Shibuya Hoppmann Corporationの帳簿価額は、減損実施後の金額であります。
5.現在休止中の主要な設備はありません。
6.従業員数の( )は、臨時雇用者数を外書しております。
21/100
(0)
]
EDINET提出書類
澁谷工業株式会社(E01666)
有価証券報告書
3【設備の新設、除却等の計画】
当社グループの設備計画については、ユーザー密着型販売体制から収集した個々の客先の設備投資動向や客先業界
の動向あるいは一般経済情勢を考慮のうえ立案することを基本とし、個々の投資案件については重要度や緊急性など
を総合的に勘案のうえ弾力的に実行しております。設備計画は、原則的に連結会社各社が個別に立案しております
が、連結グループ間で重複投資とならないよう提出会社で調整を図っております。
なお、重要な設備の新設計画は、次のとおりであります。
(単位:百万円)
会社名
事業所名
当社
所在地
投資予定額
設備の内容
総額
既支払
額
資金調達
方法
着手および完了予定
着手
完了
完成後の
増加能力
石川県金沢市
パッケージング
プラント事業
パッケージングプ
10,700
ラント生産設備
2,179
自己資金
2025年7月
2026年11月
14,841㎡
石川県能美市
パッケージング
プラント事業
パッケージングプ
ラント生産設備
4,500
1,643
自己資金
2025年7月
2026年9月
5,287㎡
石川県金沢市
メカトロシステ
ム事業
3,500
1,808
自己資金
2025年10月
2026年10月
8,447㎡
SX森本工場
当社
能美第2機械
セグメントの
名称
工場
当社
医療機若宮
工場B棟
メカトロシステム
生産設備・研究開
発施設
(注2)
(注)1.生産能力を推測することは困難であるため、完成後の増加能力には増床面積を記載しております。
2.2階建ての既存棟(延床面積:1,771㎡)を当連結会計年度に取り壊しました。その跡地に4階建ての工場
を新たに建設しております。
22/100
EDINET提出書類
澁谷工業株式会社(E01666)
有価証券報告書
第4【提出会社の状況】
1【株式等の状況】
(1)【株式の総数等】
①【株式の総数】
種類
発行可能株式総数(株)
普通株式
110,000,000
計
110,000,000
②【発行済株式】
種類
事業年度末現在発行数(株)
(2026年6月30日)
提出日現在発行数(株)
(2026年9月24日)
普通株式
28,149,877
28,149,877
計
28,149,877
28,149,877
上場金融商品取引所名又
は登録認可金融商品取引
業協会名
東京証券取引所
(プライム市場)
名古屋証券取引所
(プレミア市場)
内容
単元株式数
100株
−
−
(2)【新株予約権等の状況】
①【ストックオプション制度の内容】
該当事項はありません。
②【ライツ・プランの内容】
該当事項はありません。
③【その他の新株予約権等の状況】
該当事項はありません。
(3)【行使価額修正条項付新株予約権付社債券等の行使状況等】
該当事項はありません。
(4)【発行済株式総数、資本金等の推移】
年月日
発行済株式総発行済株式総
資本金増減額
数増減数
数残高
(百万円)
(千株)
(千株)
2010年8月1日
(注)
(注)㈱ファブリカトヤマ(現
あります。
649
28,149
−
資本金残高
(百万円)
11,392
資本準備金増
資本準備金残
減額
高(百万円)
(百万円)
−
9,842
シブヤパッケージングシステム㈱)との株式交換の実施に伴う新株発行によるもので
23/100
EDINET提出書類
澁谷工業株式会社(E01666)
有価証券報告書
(5)【所有者別状況】
2026年6月30日現在
株式の状況(1単元の株式数 100株)
区分
政府及び
地方公共
団体
金融機関
株主数
(人)
−
所有株式数
(単元)
所有株式数の割合
(%)
外国法人等
金融商品
取引業者
その他の
法人
20
26
164
156
9
2,796
3,171
−
−
149,032
3,348
44,829
28,242
215
55,581
281,247
25,177
−
52.99
1.19
15.94
10.04
0.08
19.76
100.00
−
個人以外
個人
その他
単元未満
株式の状
況
(株)
個人
計
(注)1.自己株式483,606株は、「個人その他」に4,836単元、「単元未満株式の状況」に6株含まれております。
2.「その他の法人」の欄には、証券保管振替機構名義の株式が6単元含まれております。
(6)【大株主の状況】
2026年6月30日現在
氏名又は名称
住所
所有株式数
(千株)
発行済株式
(自己株式を
除く。)の総
数に対する所
有株式数の割
合(%)
日本マスタートラスト信託銀行株式会社(信
託口)
東京都港区赤坂1丁目8番1号
3,004
10.86
公益財団法人澁谷学術文化スポーツ振興財団
石川県金沢市大豆田本町甲58番地
2,324
8.40
明治安田生命保険相互会社
東京都千代田区丸の内2丁目1番1号
1,700
6.15
第一生命保険株式会社
東京都千代田区有楽町1丁目13番1号
1,600
5.78
澁谷工業取引先持株会
石川県金沢市大豆田本町甲58番地
1,321
4.78
株式会社北國銀行
石川県金沢市広岡2丁目12番6号
1,315
4.75
日本生命保険相互会社
東京都千代田区丸の内1丁目6番6号
1,280
4.63
住友生命保険相互会社
東京都中央区八重洲2丁目2番1号
1,120
4.05
株式会社日本カストディ銀行(信託口)
東京都中央区晴海1丁目8番12号
1,016
3.67
農林中央金庫
東京都千代田区大手町1丁目2番1号
1,000
3.61
−
15,682
56.68
計
24/100
EDINET提出書類
澁谷工業株式会社(E01666)
有価証券報告書
(7)【議決権の状況】
①【発行済株式】
2026年6月30日現在
区分
株式数(株)
議決権の数(個)
内容
無議決権株式
−
−
−
議決権制限株式(自己株式等)
−
−
−
議決権制限株式(その他)
−
−
−
完全議決権株式(自己株式等)
普通株式
483,600
−
−
完全議決権株式(その他)
普通株式
27,641,100
276,411
−
単元未満株式
普通株式
25,177
−
−
発行済株式総数
28,149,877
−
−
総株主の議決権
−
276,411
−
(注)1.「単元未満株式」欄の普通株式には、当社所有の自己株式6株が含まれております。
2.「完全議決権株式(その他)」の欄には、証券保管振替機構名義の株式が600株含まれております。また、
「議決権の数」欄には、同機構名義の完全議決権株式に係る議決権の数6個が含まれております。
②【自己株式等】
2026年6月30日現在
所有者の氏名又は
名称
所有者の住所
自己名義所有
株式数(株)
他人名義所有
株式数(株)
所有株式数の
合計(株)
発行済株式総
数に対する所
有株式数の割
合(%)
(自己保有株式)
澁谷工業株式会社
金沢市大豆田本町甲58番地
483,600
−
483,600
1.72
計
−
483,600
−
483,600
1.72
25/100
EDINET提出書類
澁谷工業株式会社(E01666)
有価証券報告書
2【自己株式の取得等の状況】
【株式の種類等】会社法第155条第7号に該当する普通株式の取得
(1)【株主総会決議による取得の状況】
該当事項はありません。
(2)【取締役会決議による取得の状況】
該当事項はありません。
(3)【株主総会決議又は取締役会決議に基づかないものの内容】
区分
株式数(株)
価額の総額(百万円)
当事業年度における取得自己株式
87
0
当期間における取得自己株式
18
0
(注)当期間における取得自己株式には、2026年9月1日から有価証券報告書提出日までの単元未満株式の買取りによ
る株式は含めておりません。
(4)【取得自己株式の処理状況及び保有状況】
当事業年度
区分
株式数
(株)
当期間
処分価額の総額
(百万円)
株式数
(株)
処分価額の総額
(百万円)
引き受けるものの募集を行った取得自己株式
−
−
−
−
消却の処分を行った取得自己株式
−
−
−
−
合併、株式交換、株式交付、会社分割に係る
移転を行った取得自己株式
−
−
−
−
その他
(単元未満株式の売渡請求による売渡)
−
−
−
−
483,606
−
483,624
−
保有自己株式数
(注)当期間における保有自己株式数には、2026年9月1日から有価証券報告書提出日までの単元未満株式の買取りお
よび売渡による株式は含めておりません。
3【配当政策】
利益配当につきましては、当社の基本的な考えは将来の収益向上と成長投資のために健全な財務体質を維持し、ま
た株主へも安定的な配当を実施すること、そして1株当たり利益の長期・持続的な向上をとおして株主還元を行う方
針であります。なお、当社は2027年6月期を最終年度とする中期経営計画を策定しております。2027年6月期に連結
配当性向30%以上を目標とし、安定的かつ継続的な株主還元を実施いたします。
当社は、「取締役会の決議により毎年12月31日を基準日として、中間配当を行うことができる。」旨を定款に定め
ており、中間配当と期末配当の年2回の剰余金の配当を行うことを基本方針としております。これらの剰余金の配当
の決定機関は、期末配当については株主総会、中間配当については取締役会であります。
当事業年度の配当については、上記の方針に基づき、期末配当金は1株当たり52.5円を予定しており、年間配当金
は中間配当金の1株当たり47.5円と合わせて1株当たり100円となる予定です。
当事業年度に係る剰余金の配当は、以下のとおりであります。
決議年月日
配当金の総額(百万円)
1株当たり配当金(円)
2026年2月13日
取締役会決議
1,314
47.5
2026年9月25日
定時株主総会決議(予定)
1,452
52.5
26/100
EDINET提出書類
澁谷工業株式会社(E01666)
有価証券報告書
4【コーポレート・ガバナンスの状況等】
(1)【コーポレート・ガバナンスの概要】
① コーポレート・ガバナンスに関する基本的な考え方
1.当社は、コーポレート・ガバナンスの充実が、お客様や株主をはじめ取引先・社員・地域社会等の立場を踏
まえた上での会社の透明・公正かつ迅速・果断な意思決定を行うため必要不可欠であると考えております。
このため、次の基本的な考え方に沿って、コーポレート・ガバナンスの充実に努めてまいります。
・当社は、株主の権利を尊重し、株主の実質的な平等性の確保に取り組んでまいります。
・当社は、社会的責任の重要性を認識し、お客様、株主、取引先、社員および地域社会等をはじめとしたさ
まざまなステークホルダーの利益を考慮し、それらステークホルダーと適切な協働を行います。
・当社は、非財務情報を含む会社情報の適切な開示と、企業経営の透明性の確保に努めてまいります。
・当社は、社外取締役を加えた取締役会によって業務執行の監督機能の実効性確保に努めてまいります。
・当社は、持続的な成長と中長期的な企業価値の向上に資するよう、ステークホルダーとの間で建設的な対
話を行います。
2.当社は、シブヤグループのすべての役員・社員が共有し、あらゆる活動の拠り所となる基本原則として、行
動規準を別途定め、開示します。
3.当社は、持続的な成長と中長期的な企業価値の向上に必要な当社の「企業価値の源泉」についての考え方
を、別途開示します。
② 企業統治の体制
(a)企業統治の体制の概要
当社は監査役制度を採用しており、提出日現在、監査役は3名(うち2名が社外監査役)であります。監査
役は取締役会や経営会議など社内の重要な会議に出席し必要に応じて意見を述べるなど、取締役の職務執行に
ついて厳正な監査を行っております。
当社の取締役会は提出日現在、取締役7名(うち3名が社外取締役)で構成され、経営方針、法定事項その
他重要事項について審議・決定し、また業務執行状況の監督を行っております。
当社は取締役会の活性化、意思決定の迅速化、監督機能の強化および業務執行の効率化を図るため、従前の
執行役員制度(雇用型)に加えて、2023年9月より委任型執行役員制度を導入しております。提出日現在、取
締役でない委任型執行役員は9名、雇用型の執行役員は28名であります。
当期の取締役会は6回開催し、業務執行取締役および委任型執行役員で構成されている経営会議は原則月1
回開催しております。
当社は、取締役の指名・報酬の決定に関する取締役会の透明性、客観性と説明責任を強化するため、取締役
会の諮問機関として、過半数以上が独立社外取締役で構成される指名委員会および報酬委員会を設置しており
ます。指名委員会および報酬委員会は、取締役専務執行役員西納幸伸、社外取締役玉井政利、社外取締役
近藤徳之の3名により構成され、委員長は取締役専務執行役員西納幸伸が務めております。
(b)企業統治の体制を採用する理由
当社は、当社の企業規模、事業内容等を勘案し、監査役設置会社として、経営監視機能の客観性および中立
性を確保する経営管理体制を整えており、現状の体制で外部からの経営監視機能は十分に果たしていると判断
しております。
27/100
EDINET提出書類
澁谷工業株式会社(E01666)
有価証券報告書
(c)当社の企業統治の体制および内部統制システムの概要は、提出日現在以下のとおりであります。
28/100
EDINET提出書類
澁谷工業株式会社(E01666)
有価証券報告書
(d)内部統制システムおよびリスク管理体制に関する基本的な考え方およびその整備状況
当社は、企業価値を高めるとともに企業の社会的責任を果たすためにコーポレート・ガバナンスの充実、内
部統制システムの整備は不可欠であり、経営の重要事項と捉えております。その実現のため、内部統制、製
品・技術情報、経営情報、安全関連の目的および機能別に、法務委員会、機密情報管理委員会、債権管理委員
会、自然災害対策委員会等の各種リスク管理委員会を設置し、取締役ならびに従業員が各種法令、当社定款お
よび規程類を遵守することの徹底を図るとともに、リスク管理体制の強化にも取り組むなど、内部統制システ
ムの充実に努めております。
コンプライアンスを推進するための体制として、総務担当役員を委員長とするコンプライアンス委員会を設
置し、全社各部門における法令違反の予防措置、法令違反発生時の対処方法・是正方法について定めておりま
す。また、同委員会事務局である総務本部においてコンプライアンス体制の構築および運用を行っており、社
員等に対し研修、マニュアルの作成・配布等をとおしてコンプライアンスの知識習得および意識の向上に努め
ております。
株主その他の利害関係者への情報開示体制として、財経本部担当役員を委員長とする開示委員会を設置して
おります。同委員会は関連部門の所轄役員と連係して、情報開示のための社内体制を整備し、財務報告をはじ
め各種情報の迅速かつ正確な開示を念頭に、経営の透明性を高めております。
なお、事業活動遂行上脅威となる予測困難な事態(国内および海外で発生する戦争、テロおよび大震災など
の大災害)に対応するため、取締役社長を本部長とする危機管理緊急対策本部を設置しております。当社グ
ループに危機が発生したと判断したときは、機動的に執行体制を整備することとしております。
また、サステナビリティ(持続可能性)を巡る環境・社会的な課題の重要性を考え、担当取締役を委員長と
したサステナビリティ委員会を設置するとともに、サステナビリティに関する基本方針(シブヤグループにお
けるサステナビリティ基本方針)を定めております。
(e)子会社の業務の適正を確保するための体制整備の状況
当社は、コンプライアンス体制をグループ各社を含め実施するとともに、関係会社管理規程の制定や役員等
の派遣を通じグループ各社の業務運営の強化・適正化をはかっております。
(f)責任限定契約の内容の概要
当社は、取締役(業務執行取締役等であるものを除く)および監査役が期待される役割を十分に発揮するこ
とが可能となるよう、会社法第427条第1項の規定により、任務を怠ったことによる取締役(業務執行取締役
等であるものを除く)および監査役の損害賠償責任を限定する契約を締結することができる旨を定款に定めて
おります。
当社は、社外取締役および社外監査役全員との間で責任限定契約を締結しております。当該責任限定契約の
内容は、会社法第423条第1項に基づき、当社に対して損害賠償責任を負う場合において、その職務を行うに
つき善意でかつ重大な過失がないときは、会社法第425条第1項各号に定める最低責任限度額を限度として、
当社に対して損害賠償責任を負うものであります。
(g)役員等賠償責任保険契約の内容の概要
当社は、当社および子会社の全ての取締役、監査役および執行役員を被保険者として、会社法第430条の3
第1項に規定する役員等賠償責任保険契約を保険会社との間で締結しており、その保険料は当社が全額負担し
ております。
当該保険契約の内容は、被保険者が株主や第三者から損害賠償請求を提起された場合において、被保険者が
負担することとなる損害賠償金および争訟費用を補填するものであります。
なお、被保険者の職務の執行の適正性が損なわれないようにするための措置として、被保険者における故意
または犯罪行為等に起因して発生した損害賠償は、保険金支払の対象外としております。
(h)その他の当社定款規定について
当社は、取締役の定数を7名以内とする旨定款に定めております。
当社は、取締役の選任決議について、議決権を行使することができる株主の議決権の3分の1以上を有する
株主が出席し、その議決権の過半数をもって行う旨を定款に定めております。また、取締役の選任について
は、累積投票によらない旨を定款に定めております。
当社は、経営環境の変化に対応した機動的な資本政策の遂行を可能とするため、会社法第165条第2項の規
定により、取締役会の決議によって市場取引等により自己株式を取得することができる旨を定款に定めており
ます。
当社は、株主への機動的な利益還元のため、取締役会の決議により、毎年12月31日の株主名簿に記載または
記録された株主もしくは登録株式質権者に対し、会社法第454条第5項に定める金銭による剰余金の配当(中
間配当)を行うことができる旨を定款に定めております。
29/100
EDINET提出書類
澁谷工業株式会社(E01666)
有価証券報告書
当社は、株主総会の円滑な運営のため、会社法第309条第2項に定める株主総会の特別決議要件について、
議決権を行使することができる株主の議決権の3分の1以上を有する株主が出席し、その議決権の3分の2以
上をもって行う旨を定款に定めております。
当社は、取締役および監査役が期待される役割を十分に発揮することが可能となるよう、会社法第426条第
1項の規定により、任務を怠ったことによる取締役および監査役(取締役および監査役であった者を含む)の
損害賠償責任を、法令の限度において、取締役会の決議により免除することができる旨を定款に定めておりま
す。
(ⅰ)取締役会の活動状況
当事業年度における出席状況は以下のとおりであります。
氏
名
出席状況
代表取締役社長
地
位
澁谷
英利
100%(6回/6回)
備考
取締役副社長
毛利
克己
100%(6回/6回)
取締役副社長
本多
宗隆
100%(2回/2回)
※2
取締役副社長
河村
孝志
100%(2回/2回)
※2
取締役専務執行役員
西納
幸伸
100%(4回/4回)
※3
取締役常務執行役員
宮前
和浩
100%(4回/4回)
※3
社外取締役
玉井
政利
100%(6回/6回)
社外取締役
近藤
徳之
100%(6回/6回)
社外取締役
大砂
雅子
100%(6回/6回)
監査役(常勤)
竹橋
剛
100%(6回/6回)
社外監査役
安宅
建樹
100%(6回/6回)
社外監査役
小原
正敏
83%(5回/6回)
※1.地位は、2026年6月30日または退任時点のものを記載しております。
※2.2025年9月25日開催の第77回定時株主総会終結の時をもって退任しております。
※3.2025年9月25日開催の第77回定時株主総会において新たに就任しております。
当事業年度における具体的な検討内容は、経営方針、組織および人事体制、決算承認、内部統制評価、政策
保有株式の検証、新工場建設、海外拠点設置などであります。
30/100
EDINET提出書類
澁谷工業株式会社(E01666)
有価証券報告書
(j)指名委員会の活動状況
当事業年度における出席状況は以下のとおりであります。
氏
名
出席状況
備考
取締役副社長
地
位
本多
宗隆
100%(2回/2回)
※1
取締役専務執行役員
西納
幸伸
100%(2回/2回)
※2
社外取締役
玉井
政利
100%(4回/4回)
社外取締役
近藤
徳之
100%(4回/4回)
※1.2025年9月25日開催の第77回定時株主総会終結の時をもって退任しております。
※2.2025年9月25日開催の取締役会において新たに就任しております。
当事業年度における具体的な検討内容は、関係会社における役員の人事異動であります。
(k)報酬委員会の活動状況
当事業年度における出席状況は以下のとおりであります。
氏
名
出席状況
備考
取締役副社長
地
位
本多
宗隆
100%(1回/1回)
※1
取締役専務執行役員
西納
幸伸
0%(0回/0回)
※2
社外取締役
玉井
政利
100%(1回/1回)
社外取締役
近藤
徳之
100%(1回/1回)
※1.2025年9月25日開催の第77回定時株主総会終結の時をもって退任しております。
※2.2025年9月25日開催の取締役会において新たに就任しております。
当事業年度における具体的な検討内容は、取締役の報酬額改定、退任取締役に対する退職慰労金でありま
す。
③ 当社の財務及び事業の方針の決定を支配する者の在り方に関する基本方針
(a)基本方針の内容の概要
当社は、当社の財務及び事業の方針の決定を支配する者は、当社の企業価値の源泉を理解し、当社が企業価
値・株主共同の利益を中長期的かつ持続的に確保、向上していくことを可能とする者である必要があると思料
しております。
当社は、支配権の移転を伴う買収提案についての判断は、最終的には当社の株主全体の意思に基づき行われ
るべきものと考えております。また、当社は、当社株式について大量買付がなされる場合、当社の企業価値・
株主共同の利益に資するものであれば、これを否定するものではありません。
しかしながら、株式の大量買付の中には、その目的等から見て企業価値・株主共同の利益に対する明白な侵
害をもたらすもの、株主に株式の売却を事実上強要するおそれがあるもの、対象会社の取締役会や株主が株式
の大量買付の内容等について検討し、あるいは対象会社の取締役会が代替案を提案するための十分な時間や情
報を提供しないもの、対象会社が買収者の提示した条件よりも有利な条件をもたらすために買収者との交渉を
必要とするもの等、対象会社の企業価値・株主共同の利益に資さないものも少なくありません。
当社が、企業価値・株主共同の利益を確保・向上させていくためには、①経験やノウハウに基づく高い技
術、②独自の経営管理システム、③優秀な人財の育成と企業風土、④取引先等との信頼関係及び⑤健全な財務
体質を今後も維持し、発展させていくことが必要不可欠であり、これらが当社株式の大量買付を行う者により
中長期的かつ持続的に確保され、向上させられるのでなければ、当社の企業価値・株主共同の利益は毀損され
ることになります。
それ故、当社としては、上述の類型を含む当社の企業価値・株主共同の利益に資さない当社株式の大量買付
を行う者は、当社の財務及び事業の方針の決定を支配する者として不適切であり、このような者による大量買
付に対しては必要かつ相当な対抗措置を講じることにより、当社の企業価値・株主共同の利益を確保する必要
があると思料しております。
31/100
EDINET提出書類
澁谷工業株式会社(E01666)
有価証券報告書
(b)基本方針実現のための取組みの具体的な内容の概要
(ア) 当社の財産の有効な活用、適切な企業集団の形成その他の基本方針の実現に資する特別な取組み
当社グループは、全てのステークホルダーとの企業理念の共有、企業価値・株主共同の利益の確保・向上
を目的として、中期経営計画及びSHIBUYA未来ビジョン宣言を策定し、重点施策に取り組んでまいります。
また、当社は、コーポレート・ガバナンスの充実が、お客様や株主をはじめ取引先・社員・地域社会等の
立場を踏まえたうえでの会社の透明・公正かつ迅速・果断な意思決定を行うため必要不可欠であると考えて
おります。当社は、「コーポレート・ガバナンスに関する基本方針(株主の権利・平等性の確保、株主以外
のステークホルダーとの適切な協働、適切な情報開示と透明性の確保、取締役会の責務、株主との対話)」
に沿って、コーポレート・ガバナンスの充実に努めております。
当社取締役会は、会社の業務執行及び経営全般の監督機能を担い、経営の公正性・透明性を確保するとと
もに、法令上取締役会が決定すべき事項とされている重要な業務執行の決定等を通じて、意思決定を行って
おります。当社は、「社外役員の独立性判断基準」を独自に定め、それに基づき、独立性のある社外取締役
3名を選任しており、これらの社外取締役は、取締役会において、当社の経営の成果及び業務執行を担当す
る取締役の活動状況を評価し、全ての株主共同の利益の観点から、経営の方針や経営改善についての助言及
び会社と支配株主との利益相反等の監督を行っております。こうした経営の公正性・透明性を一層充実させ
るため、社外取締役を主要な構成員とする報酬委員会及び取締役の選任等を所管する指名委員会を設置して
おります。当社取締役会は、サステナビリティ(持続可能性)を巡る環境・社会的な課題の重要性を考え、
担当取締役を委員長としたサステナビリティ委員会を設置するとともに、サステナビリティに関する基本方
針(シブヤグループにおけるサステナビリティ基本方針)を定め、積極的に活動を行っております。また、
シブヤグループが果たすべき社会的責任に関する基本方針(コンプライアンス・ガイド)を定め、役員及び
社員の意識を高めるとともに、ステークホルダーに配慮しながら、社会の持続可能な発展とシブヤグループ
の企業価値の向上を図っております。加えて、経営活動を効率的に行うための協議機関として、業務執行取
締役及び委任型執行役員で構成する経営会議を設置しており、経営会議の運営については事案ごとに十分な
議論を尽くす機会として定期的に行っております。
当社監査役会は、監査役3名のうち、2名を社外監査役としています。監査役は、取締役会等重要な会議
に出席し、豊富な経験・見識から、積極的に経営に係わる助言及び提言を行っております。
なお、すべての取締役及び監査役が、適切にその役割及び機能を果たすために、当社は、必要となる経済
情勢、業界の状況、法令遵守、コーポレート・ガバナンス、事業及び組織、財務会計その他の事項に関する
情報を収集・提供し、その職務執行を支援しております。
(イ) 基本方針に照らして不適切な者によって当社の財務及び事業の方針の決定が支配されることを防止するた
めの取組み
当社は、当社の企業価値・株主共同の利益を確保し、向上させることを目的として、2025年8月13日開
催の当社取締役会決議及び2025年9月25日開催の第77期事業年度に係る当社定時株主総会決議に基づき当
社株券等の大量取得行為に関する対応策(買収への対応方針)(以下、「本対応策」といいます。)を更
新いたしました。本対応策の概要は以下のとおりです。
当社取締役会は、基本方針に定めるとおり、当社の企業価値・株主共同の利益に資さない大量買付を行
う者は、当社の財務及び事業の方針の決定を支配する者として不適切であると考えています。本対応策は
こうした不適切な者によって当社の財務及び事業の方針の決定が支配されることを防止し、当社の企業価
値・株主共同の利益に反する大量買付を抑止するとともに、当社株式に対する大量買付が行われる際に、
当社取締役会が株主の皆様に代替案を提案する、あるいは株主の皆様がかかる大量買付に応じるべきか否
かを判断するために必要な情報や時間を確保すること、株主の皆様のために交渉を行うこと等を可能とす
ることを目的としております。
本対応策は、当社株券等の20%以上を買収しようとする者等が現れた際に、買収者に事前の情報提供を
求める等、上記の目的を実現するために必要な手続を定めております。
買収者は、本対応策に係る手続に従い、当社取締役会において本対応策を発動しない旨が決定された場
合に、当該決定時以降に限り当社株券等の大量取得行為を行うことができるものとされています。
買収者が本対応策に定められた手続に従わない場合や当社株券等の大量取得行為が当社の企業価値ひい
ては株主共同の利益を毀損するおそれがある場合等で、本対応策所定の発動要件を満たす場合等には、当
社は、買収者等による権利行使は原則として認められないとの行使条件及び当社が買収者等以外の者から
当社株式と引換えに新株予約権を取得できる旨の取得条項が付された新株予約権に係る新株予約権無償割
当てその他の法令及び当社定款の下でとりうる合理的な施策を実施します。本対応策に従って新株予約権
の無償割当てがなされ、その行使又は当社による取得に伴って買収者以外の株主の皆様に当社株式が交付
された場合には、買収者の有する当社の議決権割合は、最大約50%まで希釈化される可能性があります。
当社は、本対応策に従った新株予約権の無償割当ての実施、不実施又は取得等の判断については、取締
役の恣意的判断を排するため、当社経営陣から独立した社外取締役及び社外監査役等から構成される特別
32/100
EDINET提出書類
澁谷工業株式会社(E01666)
有価証券報告書
委員会を設置し、その客観的な判断を経るものとしております。また、当社取締役会は、これに加えて、
本対応策所定の場合には、株主総会を開催し、株主の皆様の意思を確認することがあります。
こうした手続の過程については、適宜株主の皆様に対して情報開示を行い、その透明性を確保すること
としております。
なお、本対応策の有効期間は、2025年9月25日開催の第77期事業年度に係る当社定時株主総会終結後3
年以内に終了する事業年度のうち最終のものに関する定時株主総会終結の時までとされております。
(c)具体的取組みに対する当社取締役の判断及びその理由
上記(b)の(ア)に記載した当社の財産の有効な活用、適切な企業集団の形成その他の基本方針の実現に
資する特別な取組みは、当社の企業価値・株主共同の利益を中長期的かつ持続的に向上させるための具体的方
策であり、まさに当社の基本方針に沿うものであります。
また、本対応策は、上記(b)の(イ)に記載のとおり、当社の企業価値・株主共同の利益を確保すること
を目的として導入するものであり、当社の基本方針に沿うものであります。特に、本対応策は、経済産業省及
び法務省が2005年5月27日に発表した「企業価値・株主共同の利益の確保又は向上のための買収防衛策に関す
る指針」の定める三原則(①企業価値・株主共同の利益の確保・向上の原則、②事前開示・株主意思の原則、
③必要性・相当性の原則)を全て充足していること、導入にあたり株主の皆様の承認を得ていること、一定の
場合には本対応策の発動の是非について株主の皆様の意思を確認する仕組みが設けられていること、有効期間
を約3年間とするいわゆるサンセット条項が付されていること、その有効期間の満了前であっても、当社株主
総会で選任された取締役により構成される取締役会において本対応策を廃止できるものとされていること等、
株主意思を重視するものとなっております。
また、本対応策の発動に際しては、独立性のある社外取締役及び社外監査役等のみから構成される特別委員
会による勧告を必ず経ることとされていること、特別委員会は当社の費用において独立した第三者専門家等の
助言を受けることができるものとされていること、本対応策の発動に関する合理的な客観的要件が設定されて
いること等により、その公正性・客観性も担保されております。
従って、当社取締役会は、本対応策について、当社の企業価値・株主共同の利益に資するものであって、当
社の会社役員の地位の維持を目的とするものではありません。
33/100
EDINET提出書類
澁谷工業株式会社(E01666)
有価証券報告書
(2)【役員の状況】
役員一覧
2026年9月24日(有価証券報告書提出日)現在の当社の役員の状況は、次のとおりであります。
①
男性9名
女性1名
(役員のうち女性の比率10%)
役職名
代表取締役社長
社長執行役員
グループ経営企画統轄本部長
取締役副社長
副社長執行役員
グループ経営企画統轄副本部長、
メカトロ統轄本部長兼
生産本部長兼医療機本部長
氏名
澁谷
毛利
英利
克己
生年月日
1966年2月4日生
1953年7月8日生
略歴
1989年4月
丸紅㈱
1992年7月
当社
2004年10月
執行役員
プラント営業統轄本部部長
2006年7月
プラント営業統轄本部製薬設備営業本
部長
2007年7月
常務執行役員
2010年9月
取締役
2011年8月
Shibuya Hoppmann Corporation
2011年9月
常務取締役
2016年7月
再生医療システム副本部長
2020年7月
専務取締役
プラント営業統轄本部長
2021年9月
代表取締役副社長
2021年10月
代表取締役社長(現)
2023年2月
グループ経営企画統轄本部長(現)
2023年9月
社長執行役員(現)
1979年4月
㈱大林組
2004年4月
シブヤマシナリー㈱(2021年7月に
当社が吸収合併) 入社
当社常務執行役員
メカトロ副事業部長
2011年4月
任期
所有株式
数(千株)
注4
24
注4
4
注4
8
入社
入社
CEO
入社
2011年9月
専務取締役
メカトロ事業部長
2012年7月
メカトロ事業部医療機本部長
2016年10月
メカトロ事業部特機本部長
2023年2月
グループ経営企画統轄副本部長(現)
2023年9月
取締役副社長、副社長執行役員(現)
メカトロ統轄本部長兼医療機本部長
(現)
取締役
専務執行役員
グループ経営企画統轄本部開発
本部長兼技術管理本部長、
プラント生産統轄本部長兼プラ
ント技術本部長兼BS第1技術
本部長兼SPM技術本部長兼バ
リデーション・品質本部長兼エ
ンジニアリング本部長
西納
幸伸
1957年2月16日生
2024年4月
メカトロ統轄本部生産本部長(現)
1977年4月
当社
2005年8月
2009年7月
プラント生産統轄本部技術本部ボトリ
ングシステム技術部長
執行役員
プラント生産統轄副本部長
常務執行役員
2011年9月
取締役
2014年7月
常務取締役
プラント生産統轄本部プラント技術本
2008年7月
2018年5月
入社
部長(現)
プラント生産統轄本部BS第1技術本
部長(現)
2021年7月
プラント生産統轄本部SPM技術本部
2023年1月
長(現)
グループ経営企画統轄本部技術管理本
部長(現)
2023年9月
専務執行役員(現)
プラント生産統轄本部長兼バリデー
ション・品質本部長兼エンジニアリン
グ本部長(現)、グループ経営企画統
轄本部開発本部長(現)
2025年9月
34/100
取締役(現)
EDINET提出書類
澁谷工業株式会社(E01666)
有価証券報告書
役職名
取締役
常務執行役員
氏名
宮前
生年月日
和浩
1965年9月27日生
財経本部長、
内部統制・監査室長
略歴
1989年4月
当社
2005年9月
Shibuya Hoppmann Corporation
任期
所有株式
数(千株)
注4
2
注4
−
注4
2
注4
−
注5
1
注5
−
入社
取締役副社長(現)
2013年12月
当社
2016年7月
2019年7月
執行役員
財経副本部長
上席執行役員
2019年9月
取締役
2023年9月
常務執行役員(現)
2025年9月
取締役(現)
財経本部財務部長(現)
財経本部長(現)
内部統制・監査室長(現)
取締役
取締役
玉井
近藤
政利
徳之
1951年5月25日生
1961年2月18日生
1981年6月
税理士開業(現)
2011年9月
当社
監査役
2018年9月
当社
取締役(現)
2021年10月
㈱北國銀行
社外監査役
1983年4月
三井物産㈱
入社
2009年6月
三井物産プラスチックトレード㈱
〔現在三井物産プラスチック㈱〕
常務執行役員機能材料本部長
取締役
大砂
雅子
1956年3月1日生
2010年11月
Plalloy MTD B.V.
2015年10月
三井物産㈱
社長
2022年2月
ルズ本部北陸化学品総括
MEDX㈱取締役
2022年9月
当社
1979年4月
特殊法人日本貿易振興会(現:ジェト
パフォーマンスマテリア
取締役(現)
ロ(独立行政法人日本貿易振興機
構))入会
2000年6月
同シンガポールセンター
2009年4月
ジェトロ・アジア経済研究所
国際交流・研修室長
次長
2011年3月
ジェトロ・ソウル事務所
2014年2月
金沢工業大学
経営情報学科
2015年6月
㈱北國銀行
2017年4月
金沢工業大学
所長
情報フロンティア学部
教授
社外取締役
監査等委員
産学連携室
教授
(現)
2019年6月
日比谷総合設備㈱
2020年6月
タキロンシーアイ㈱
社外監査役
2022年6月
EIZO㈱
監査等委員
社外取締役(現)
社外取締役
(現)
監査役
監査役
竹橋
安宅
剛
建樹
1962年12月6日生
1950年7月13日生
2024年9月
当社
取締役(現)
1986年4月
当社
入社
2011年4月
シブヤ精機㈱浜松本社
2017年5月
当社財経本部資金部長
シブヤマシナリー㈱(2021年7月に
当社が吸収合併)管理本部経理部長
2023年9月
当社
1973年4月
㈱北國銀行
1998年6月
同社
取締役
2002年6月
同社
常務取締役
2004年6月
同社
専務取締役
2006年6月
同社
取締役頭取
2015年9月
当社
監査役(現)
2017年6月
北陸電力㈱
社外取締役(現)
2020年6月
㈱北國銀行
相談役(現)
35/100
経理部長
常勤監査役(現)
入行
EDINET提出書類
澁谷工業株式会社(E01666)
有価証券報告書
役職名
監査役
氏名
小原
正敏
生年月日
略歴
1951年4月25日生
1979年4月
弁護士登録吉川綜合法律事務所
〔現在 きっかわ法律事務所〕入所
1987年2月
米国ニューヨーク州弁護士登録
1988年1月
きっかわ法律事務所パートナー(現)
2017年4月
大阪弁護士会会長
日本弁護士連合会副会長
2019年6月
沢井製薬㈱
2021年4月
サワイグループホールディングス㈱
任期
所有株式
数(千株)
注6
−
取締役
社外取締役(現)
2022年9月
当社
2023年6月
アツギ㈱
監査役(現)
社外取締役(現)
計
44
(注)1.取締役副社長毛利克己は、代表取締役社長澁谷英利の義兄であります。
2.取締役玉井政利、近藤徳之、大砂雅子は、社外取締役であります。
3.監査役安宅建樹および小原正敏は、社外監査役であります。
4.2025年9月25日開催の定時株主総会の終結の時から2年間。
5.2023年9月27日開催の定時株主総会の終結の時から4年間。
6.2022年9月28日開催の定時株主総会の終結の時から4年間。
②
社外役員の状況
2026年9月24日(有価証券報告書提出日)現在の当社の社外取締役は3名、社外監査役は2名であります。社
外取締役および社外監査役は、取締役会などの重要な会議に出席し、豊富な経験・見識に基づき、客観的な視点
から意見・提言を行うことにより、経営の妥当性等を確保する役割と機能を有しております。
社外取締役玉井政利氏は、税理士として財務等に関する知見を有しており、特に企業経営および会計の観点
から当社の経営全般に対して助言および提言を行っております。なお、同氏は当社の顧問税理士であり、同氏と
当社との間には定常的な取引があります。
社外取締役近藤徳之氏は、総合商社において豊富な海外勤務経験および部門を統括する責任者として勤務
し、さらに役員として企業経営に関与した経験を有しており、特に企業経営の観点から当社の経営全般に対して
助言および提言を行っております。同氏と当社との間に特別な利害関係はありません。なお、当社株式2千株を
所有しております。
社外取締役大砂雅子氏は、日本貿易振興機構(ジェトロ)での長年の勤務を経て、大学教授や社外役員を務
めるなど幅広く活躍し、これらの豊富な経験と国際経済を中心とした高度な専門性を有しております。
社外監査役安宅建樹氏は、株式会社北國銀行の相談役であり、財務等に関する豊富な知見を有しておりま
す。なお、同行と当社との間には定常的な銀行取引が、また北陸電力株式会社と当社との間には定常的な電力供
給取引がありますが、同氏個人と当社とは直接の利害関係を有するものではありません。
社外監査役小原正敏氏は、弁護士として法曹界において豊富な知見を有しております。同氏と当社との間に
特別な利害関係はありません。
なお、当社は、社外取締役または社外監査役の選任にあたり、独立性判断基準を以下のとおり定めておりま
す。
<社外役員の独立性判断基準>
当社は、会社法および金融商品取引所が定める独立役員の独立性基準に加え、過去3事業年度のいずれかにお
いて、以下の基準のいずれにも該当しない場合には、独立性があると判断いたします。
1.当社の連結売上の5%を超える取引先の業務執行者
2.当社宛の売上が2%を超える取引先の業務執行者
3.当社の連結総資産の2%を超える借入先の業務執行者
4.株主出資比率10%以上の当社の主要株主および出資先の業務執行者
5.当社から役員報酬以外に年間10百万円を超える金銭その他の財産を得ているコンサルタント、会計専門家ま
たは法律専門家
6.当社から年間10百万円を超える寄付をうけている法人・団体等の業務執行者
7.上記1〜6までのいずれかに該当する者の配偶者または二親等以内の親族
8.その他、一般株主との利益相反が生じるおそれがあり、独立した社外役員として職務を果たせないと合理的
に判断される事情を有している者
36/100
EDINET提出書類
澁谷工業株式会社(E01666)
有価証券報告書
社外取締役玉井政利氏、近藤徳之氏、大砂雅子氏および社外監査役安宅建樹氏、小原正敏氏については、
「社外役員の独立性判断基準」に基づき独立性を有していると判断しており、株式会社東京証券取引所および株
式会社名古屋証券取引所が定める独立役員として届け出を行っております。
③
社外取締役又は社外監査役による監督又は監査と内部監査、監査役監査及び会計監査との相互連携並びに内部
統制部門との関係
社外取締役は、取締役会において、当社の経営の成果および業務執行を担当する取締役の活動状況を評価し、
全ての株主共同の利益の観点から、経営の方針や経営改善についての助言および会社と支配株主との利益相反等
の監督を行っております。
社外監査役は、取締役会や監査役会への出席等を通じ、内部監査、内部統制に関する報告を受け、適宜意見を
述べております。また、会計監査人とは、必要に応じて面談のうえ、意見交換を行っております。
37/100
EDINET提出書類
澁谷工業株式会社(E01666)
有価証券報告書
(3)【監査の状況】
① 監査役監査の状況
当社の監査役会は、常勤監査役1名および非常勤監査役2名(社外監査役)で構成されております。
監査役会においては、常勤監査役からの活動状況報告、監査方針・監査計画・職務分担の決定、会計監査人の
評価および再任の決定、内部統制システムの整備・運用の確認、監査報告書案等の審議のほか、個別の重要な案
件について担当取締役からヒアリングを行っております。
常勤監査役は、子会社を含めて、取締役会や経営会議などの社内の重要な会議に出席するとともに、日常的に
稟議書等の重要な決裁書類等を閲覧し、必要に応じて取締役や担当者に説明を求めております。
会計監査人との連携について、監査役は、会計監査人と必要に応じ意見交換および協議を行い、業務を遂行し
ております。
また、内部監査部門との連携について、監査役は、内部監査部門の内部監査に同行するとともに、必要に応じ
て内部監査部門のスタッフを監査役の業務の補助に当たらせております。
当事業年度における各監査役の監査役会への出席状況は以下のとおりであります。
地
位
氏
名
出席状況
監査役(常勤)
竹橋
剛
100%(7回/7回)
社外監査役
安宅
建樹
100%(7回/7回)
社外監査役
小原
正敏
86%(6回/7回)
備考
②
内部監査の状況
内部監査部門として内部統制・監査室を設置し、室長以下5名の体制で各部門における業務が各種法令、当社
規程類および目標経営管理(経営計画推進のための当社独自の管理手法)マニュアルに準拠して遂行されている
か、また効率的に行われているかなどについて、各部門、工場、グループ会社などの監査を定期的に実施し、
チェック・指導する体制をとっております。内部統制・監査室は、これらの内部監査の結果を代表取締役、取締
役会、常勤監査役および監査役会に報告しております。
③ 会計監査の状況
(a)監査法人の名称
仰星監査法人
(b)継続監査期間
1987年以降
上記は、現任の仰星監査法人と合併して消滅した明澄監査法人が監査法人組織になって以降の期間について
記載しております。それ以前の個人事務所が監査を実施していた期間の調査は困難であり、含めておりませ
ん。
(c)業務を執行した公認会計士
指定社員業務執行社員
指定社員業務執行社員
川﨑
中山
浩
孝一
(d)監査業務に係る補助者の構成
当社の会計監査業務に係る補助者は、公認会計士13名、会計士試験合格者等2名、その他7名であります。
38/100
EDINET提出書類
澁谷工業株式会社(E01666)
有価証券報告書
(e)監査法人の選定方針と理由
監査役会で定めた「会計監査人の選任・評価基準」に基づき、当連結会計年度における会計監査人である仰
星監査法人を評価した結果、会社法第340条第1項各号に定める事項に該当しないことを確認し、会計監査人
を再任いたしました。
(会計監査人の解任または不再任の決定の方針)
監査役会は、会計監査人の職務の執行に支障がある場合等、その必要があると判断した場合に、株主総会に
提出する会計監査人の解任または不再任に関する議案の内容を決定いたします。
また、監査役会は、会計監査人が会社法第340条第1項各号のいずれかに該当すると認められる場合に、監
査役全員の同意に基づき会計監査人を解任いたします。この場合、監査役会が選定した監査役は、解任後最初
に招集される株主総会において、会計監査人を解任した旨と解任の理由を報告いたします。
(f)監査役及び監査役会による監査法人の評価
監査役会が定めた「会計監査人の選任・評価基準」に基づき、会計監査人の品質管理、独立性などを総合的
に評価しております。
④ 監査報酬の内容等
(a)監査公認会計士等に対する報酬
前連結会計年度
区分
当連結会計年度
監査証明業務に基づく
報酬(百万円)
非監査業務に基づく報
酬(百万円)
監査証明業務に基づく
報酬(百万円)
非監査業務に基づく報
酬(百万円)
提出会社
40
−
40
−
連結子会社
−
−
−
−
40
−
40
−
計
(b)監査公認会計士等と同一のネットワークに属する組織に対する報酬((a)を除く)
該当事項はありません。
(c)その他重要な監査証明業務に基づく報酬の内容
該当事項はありません。
(d)監査報酬の決定方針
監査報酬の決定方針は定めておりません。
(e)監査役会が会計監査人の報酬等に同意した理由
監査役会は、会計監査人の監査計画の内容、会計監査の職務遂行状況および報酬見積りの算出根拠等につい
て、その適切性・妥当性を検証した結果、会計監査人の報酬等の額は合理的なものであると判断し同意してお
ります。
39/100
EDINET提出書類
澁谷工業株式会社(E01666)
有価証券報告書
(4)【役員の報酬等】
① 役員の報酬等の額又はその算定方法の決定に関する方針
当社は、2021年4月5日開催の取締役会において、取締役の個人別の報酬等の内容に係る決定方針を決議しま
したが、報酬委員会を新設したことから、2022年2月10日開催の取締役会において当該方針の改定を決議してお
ります。当該決議内容は、次のとおりであります。
(a)基本方針
当社の取締役の報酬は、利益計画の達成と企業価値の持続的な向上への意欲創出につながる充分なインセ
ンティブとして機能する報酬体系とし、個々の取締役の報酬の決定に際しては、各職責に応じた適正な水準
とすることを基本方針とする。
(b)個人別の固定報酬の額またはその算定方法の決定に関する方針(報酬等を与える時期または条件の決定に
関する方針を含む)
当社の取締役の報酬は、月例の固定報酬とし、その役職、委嘱職務、在任期間に応じて、当社の業績、従
業員給与、他社水準などを考慮しながら総合的に勘案して決定することを方針とする。また、退任時に支給
する退職慰労金については、役職、委嘱職務、在任期間を考慮して当社における一定の基準に従い、相当額
の範囲内で支給額を決定することを方針とする。
(c)取締役の個人別の報酬等の内容についての決定に関する事項
当社の取締役の個人別の報酬の額の決定については、取締役会において、代表取締役社長へ一任すること
とする。代表取締役社長は、一任を受けた内容の決定にあたっては、委員の過半数が社外取締役で構成され
る報酬委員会から取締役会への進言を受け、適切に決定することとする。
上記の方針に基づき、代表取締役社長である澁谷英利が、各取締役の月例の固定報酬を決定しております。
その決定権限を委任する理由は、当社全体の業績等を総合的・俯瞰的に見ながら各取締役の担当領域や職責の評
価を行うには、代表取締役社長が最も適していると判断するためであります。
なお、取締役の個人別の報酬額については、代表取締役社長が取締役会への報酬委員会からの進言と整合する
ように決定しており、取締役会としては、その内容が当該決定方針に沿うものであると判断しております。
取締役の報酬等の総額は、2023年9月27日開催の第75回定時株主総会において、月額30百万円以内(うち社外
取締役3百万円以内)と決議しております。当該株主総会終結時点の取締役の員数は6名(うち社外取締役は2
名)であります。
監査役の報酬等の総額は、1995年9月28日開催の第47回定時株主総会において、月額5百万円以内と決議して
おります。当該株主総会終結時点の監査役の員数は4名であります。なお、各監査役の報酬等の額の決定につき
ましては、監査役の協議によることとしております。
②
役員区分ごとの報酬等の総額、報酬等の種類別の総額及び対象となる役員の員数
役員区分
報酬等の総額
(百万円)
対象となる
役員の員数
(人)
報酬等の種類別の総額(百万円)
固定報酬
業績連動報酬
退職慰労金
取締役
(社外取締役を除く)
222
214
−
7
6
監査役
(社外監査役を除く)
12
12
−
−
1
社外役員
25
25
−
−
5
(注)1.退職慰労金は、当事業年度の役員退職慰労引当金繰入額を記載しております。
2.非金銭報酬は該当ありません。
③
役員ごとの連結報酬等の総額等
連結報酬等の総額が1億円以上である者が存在しないため、記載しておりません。
40/100
EDINET提出書類
澁谷工業株式会社(E01666)
有価証券報告書
(5)【株式の保有状況】
① 投資株式の区分の基準及び考え方
当社は、保有目的が純投資目的である投資株式には、専ら株式価値の変動または配当金を目的として保有する
株式を、純投資目的以外の目的である投資株式には、当社の中長期的な企業価値向上に資すると判断し保有する
株式を区分しております。
② 保有目的が純投資目的以外の目的である投資株式
(a)保有方針及び保有の合理性を検証する方法並びに個別銘柄の保有の適否に関する取締役会等における検証の
内容
当社は、発行会社との取引・協業関係の維持・強化などを目的として、長期保有を前提にいわゆる政策保有
株式を保有しております。しかしながら、個別の銘柄につき、経済合理性の観点から、配当の有無や業績が振
るわない銘柄については、今後の業績の推移、回復可能性を検討し資本効率向上の観点からも縮減を含めた保
有の検討を行っております。
なお、当事業年度におきましては、1銘柄の一部売却を行っております。
(b)銘柄数および貸借対照表計上額
銘柄数
(銘柄)
貸借対照表計上額の
合計額(百万円)
非上場株式
11
30
非上場株式以外の株式
10
5,389
(当事業年度において株式数が増加した銘柄)
銘柄数
(銘柄)
株式数の増加に係る取得
価額の合計額(百万円)
非上場株式
−
−
−
非上場株式以外の株式
2
1
取引関係の維持・強化のため
株式数の増加の理由
(当事業年度において株式数が減少した銘柄)
銘柄数
(銘柄)
株式数の減少に係る売却
価額の合計額(百万円)
非上場株式
−
−
非上場株式以外の株式
1
30
(c)特定投資株式及びみなし保有株式の銘柄ごとの株式数、貸借対照表計上額等に関する情報
特定投資株式
銘柄
㈱CCIグループ
(注)2.
㈱三菱UFJフィナ
ンシャル・グループ
当事業年度
前事業年度
株式数(株)
株式数(株)
貸借対照表計上額
(百万円)
貸借対照表計上額
(百万円)
2,176,600
217,660
2,220
1,053
392,840
392,840
1,259
779
保有目的、業務提携等の概要、
定量的な保有効果
及び株式数が増加した理由
当社の株式の
保有の有無
主要金融機関として総合的な金融取引を
行っており、取引関係の維持・強化のた
め保有しております。
有
主要金融機関として総合的な金融取引を
行っており、取引関係の維持・強化のた
め保有しております。
有
41/100
EDINET提出書類
澁谷工業株式会社(E01666)
有価証券報告書
銘柄
㈱みずほフィナン
シャルグループ
当事業年度
前事業年度
株式数(株)
株式数(株)
貸借対照表計上額
(百万円)
貸借対照表計上額
(百万円)
76,155
76,155
589
304
340,000
340,000
ニプロ㈱
536
434
222,400
222,400
Heartseed㈱
宝ホールディングス
㈱
370
593
127,800
142,000
286
170
111,000
111,000
㈱サイフューズ
61
12,417
86
12,025
カゴメ㈱
ノイルイミューン・
バイオテック㈱
32
34
256,870
256,870
31
896
43
552
㈱ピエトロ
1
0
保有目的、業務提携等の概要、
定量的な保有効果
及び株式数が増加した理由
当社の株式の
保有の有無
主要金融機関として総合的な金融取引を
行っており、取引関係の維持・強化のた
め保有しております。
有
メカトロシステム事業における最大の取
引先であり、医療機器の販売取引を行っ
ております。また、パッケージングプラ
ント事業においても製薬設備の販売取引
を行っており、取引関係の維持・強化の
ため保有しております。
有
パッケージングプラント事業において再
生医療等製品の生産設備に関する事業連
携を行っており、関係の維持・強化のた
め保有しております。
無
パッケージングプラント事業において酒
類充填設備などの販売取引を行ってお
り、取引関係の維持・強化のため保有し
ておりますが、当事業年度中に一部売却
を行いました。
有
パッケージングプラント事業において再
生医療等製品の生産設備に関する事業連
携を行っており、関係の維持・強化のた
め保有しております。
無
パッケージングプラント事業において飲
料充填設備の販売取引を行っており、取
引関係の維持・強化のため保有しており
ます。
なお、取引先持株会に加入していること
から、保有株数が増加しております。
無
パッケージングプラント事業において再
生医療等製品の生産設備に関する事業連
携を行っており、関係の維持・強化のた
め保有しております。
無
パッケージングプラント事業において調
味料充填設備の販売取引を行っており、
取引関係の維持・強化のため保有してお
ります。
無
なお、取引先持株会に加入していること
から、保有株数が増加しております。
(注)1.定量的な保有効果については記載が困難であります。保有の合理性の検証については、上記(a)をご参照
ください。
2.㈱北國フィナンシャルホールディングスは、2025年10月1日付で㈱CCIグループに商号変更し、同日付で普通
株式1株につき10株の割合で株式分割しております。
③
保有目的が純投資目的である投資株式
該当事項はありません。
42/100
EDINET提出書類
澁谷工業株式会社(E01666)
有価証券報告書
5【従業員の状況等】
(1)【人材戦略に関する基本方針等】
① 人的資本に関する考え方および企業理念・戦略
当社グループは、「ダントツ共進化で社会に役立つものをつくる」を存在意義として、日々喜んで働き、感謝
し、そしてやり抜くことを徹底し、お客様とともに進化することを通して、お客様の繁栄を支え、持続可能な社会
の実現に貢献することを使命としています。この「ダントツ共進化」を継続的に実現する原動力は人材であり、人
的資本は最も重要な経営資源の一つであると認識しています。
当社グループは、コーポレートサイトに掲げたサステナビリティ経営およびマテリアリティ(重要課題)の中
で、「人権を尊重し、多様な人材が能力を発揮できる職場づくり」「人材育成と働きがい向上」「安全で健康的な
職場環境の整備」等の人的資本に関するテーマを重要な課題として位置付けています。企業理念および中長期的な
事業戦略に即して、事業環境の変化や技術革新への対応、グループ経営の高度化を支える人材の確保・育成に取り
組むことも、これらマテリアリティへの具体的な対応の一つです。
このような目的の実現に向けて、当社グループは、従業員一人ひとりの人格と多様性を尊重し、人権を侵害しな
いことを基本とするとともに、公正な処遇と教育研修の充実を通じて、従業員がともに成長し、個々の能力を最大
限に発揮できる環境づくりを進めています。また、安全かつ健康に働ける労働環境を維持・向上させることを重視
し、創業の原点である「喜んで働ける」職場の実現を目指して、労働安全衛生、ワークライフバランス、エンゲー
ジメント向上などの施策を継続的に推進しています。
人的資本に関するこれらの取り組みは、当社グループのサステナビリティ経営の重要な柱として位置付けられて
おり、取締役会の監督のもと、サステナビリティ推進体制を通じてその進捗を管理し、改善を図っています。
②従業員給与等の決定方針
従業員の給与等については、法令および社内規程に基づき、公正性と透明性を重視して適切に決定しています。
賃金は、職務内容や役割に応じた職能・資格等に基づく基本賃金に、役付手当等の諸手当を加えた体系としてお
り、従業員の職務・役割および勤務の実態に見合った水準となるよう設計しています。
また、成績評価に当たっては、能力・成果等を総合的に勘案し、従業員の貢献度が処遇に適切に反映されるよ
う、人事評価制度を運用しています。
賞与については、当社グループ全体の業績を反映するとともに、個別の支給額においては、基本賃金に基づく部
分と成績等を反映する部分を組み合わせることにより、会社業績と個々の成果の双方を踏まえた支給としていま
す。これにより、従業員の意欲向上と、当社グループの持続的な成長への貢献を促すことを目指しています。
当社グループは、これらの方針に基づき、公正で納得性の高い処遇を通じて、従業員が安心して働き続けられる
環境を整えるとともに、人的資本の価値向上とサステナビリティ経営の推進に取り組んでまいります。
(2)【従業員の状況】
① 連結会社の状況
2026年6月30日現在
セグメントの名称
従業員数(人)
2,066
(121)
メカトロシステム事業
812
(354)
農業用設備事業
434
(48)
3,312
(523)
125
(5)
3,437
(528)
パッケージングプラント事業
報告セグメント計
全社(共通)
合計
(注)1.従業員数は就業人員数を記載しており、臨時雇用者数は年間の平均人員数を( )内に外数で記載しており
ます。
2.全社(共通)として記載されている従業員数は、管理部門に所属しているものであります。
43/100
EDINET提出書類
澁谷工業株式会社(E01666)
有価証券報告書
② 提出会社の状況
2026年6月30日現在
従業員数(人)
平均年齢(歳)
平均勤続年数(年)
平均年間給与(円)
41.2
17.9
6,846,655
2,146 (362)
セグメントの名称
平均年間給与の
対前事業年度増減率
(%)
3.1
従業員数(人)
1,651
(106)
メカトロシステム事業
370
(251)
報告セグメント計
2,021
(357)
125
(5)
2,146
(362)
パッケージングプラント事業
全社(共通)
合計
(注)1.従業員数は就業人員数を記載しており、臨時雇用者数は年間の平均人員数を( )内に外数で記載しており
ます。
2.平均年間給与は、賞与および基準外賃金を含んでおります。
3.全社(共通)として記載されている従業員数は、管理部門に所属しているものであります。
③ 労働組合の状況
労使関係は安定しており、特記すべき事項はありません。
44/100
EDINET提出書類
澁谷工業株式会社(E01666)
有価証券報告書
(4)管理的地位にある労働者に占める女性労働者の割合、男性労働者の育児休業取得率及び労働者の男女の賃金の額
の差異
① 提出会社
当事業年度
管理的地位にある
労働者に占める
女性労働者の割合
(%)(注1)
労働者の男女の賃金の額の差異(%)(注)1.
男性労働者の
育児休業取得率
(%)(注2)
0.3
全労働者
68.8
うち正規雇用労働者
67.6
67.1
うちパート、
有期労働者
58.7
(注)1.「女性の職業生活における活躍の推進に関する法律」(2015年法律第64号)の規定に基づき算出したものであ
ります。
2.「育児休業、介護休業等育児又は家族介護を行う労働者の福祉に関する法律」(1991年法律第76号)の規定に
基づき、「育児休業、介護休業等育児又は家族介護を行う労働者の福祉に関する法律施行規則」(1991年労働
省令第25号)第71条の6第1号における育児休業等の取得割合を算出したものであります。
② 連結子会社
当事業年度
管理的地位にある
労働者に占める
女性労働者の割合
(%)(注1)
男性労働者の
育児休業取得率
(%)(注2)
シブヤ精機㈱
0.0
シブヤパッケージング
システム㈱
名称
労働者の男女の賃金の額の差異(%)(注)1.
全労働者
うち正規雇用
労働者
うちパート、
有期労働者
80.0
62.1
63.0
46.2
2.9
67.0
61.3
61.8
60.3
㈱カイジョー
11.7
100.0
68.2
84.7
42.6
シブヤEDI㈱
0.0
0.0
84.5
76.9
88.1
(注)1.「女性の職業生活における活躍の推進に関する法律」(2015年法律第64号)の規定に基づき算出したものであ
ります。
2.「育児休業、介護休業等育児又は家族介護を行う労働者の福祉に関する法律」(1991年法律第76号)の規定に
基づき、「育児休業、介護休業等育児又は家族介護を行う労働者の福祉に関する法律施行規則」(1991年労働
省令第25号)第71条の6第1号における育児休業等の取得割合を算出したものであります。
45/100
EDINET提出書類
澁谷工業株式会社(E01666)
有価証券報告書
第5【経理の状況】
1.連結財務諸表及び財務諸表の作成方法について
(1) 当社の連結財務諸表は、「連結財務諸表の用語、様式及び作成方法に関する規則」(1976年大蔵省令第28号)に
基づいて作成しております。
(2) 当社の財務諸表は、「財務諸表等の用語、様式及び作成方法に関する規則」(1963年大蔵省令第59号)に基づい
て作成しております。
なお、当社は、特例財務諸表提出会社に該当し、財務諸表等規則第127条の規定により財務諸表を作成しており
ます。
2.監査証明について
当社は金融商品取引法第193条の2第1項の規定に基づき、連結会計年度(2025年7月1日から2026年6月30日ま
で)の連結財務諸表および事業年度(2025年7月1日から2026年6月30日まで)の財務諸表について仰星監査法人に
より監査を受けております。
3.連結財務諸表等の適正性を確保するための特段の取組について
当社は、連結財務諸表等の適正性を確保するための特段の取組を行っております。具体的には、会計基準等の内容
を適切に把握し、または会計基準等の変更等について的確に対応することができる体制を整備するため、公益財団法
人財務会計基準機構へ加入し、同機構が主催するセミナー等に参加しております。
46/100
EDINET提出書類
澁谷工業株式会社(E01666)
有価証券報告書
1【連結財務諸表等】
(1)【連結財務諸表】
①【連結貸借対照表】
(単位:百万円)
前連結会計年度
(2025年6月30日)
資産の部
流動資産
現金及び預金
受取手形
電子記録債権
売掛金
契約資産
製品
仕掛品
原材料及び貯蔵品
その他
貸倒引当金
流動資産合計
固定資産
有形固定資産
建物及び構築物(純額)
機械装置及び運搬具(純額)
土地
建設仮勘定
その他(純額)
有形固定資産合計
無形固定資産
その他
無形固定資産合計
投資その他の資産
投資有価証券
退職給付に係る資産
繰延税金資産
その他
貸倒引当金
投資その他の資産合計
固定資産合計
資産合計
47/100
当連結会計年度
(2026年6月30日)
45,579
1,422
9,846
15,467
11,472
302
10,598
6,491
4,415
△22
105,574
44,008
471
13,384
17,739
14,670
312
10,083
6,739
3,832
△23
111,218
24,343
2,816
14,272
741
1,635
※1,※2 43,810
24,308
2,900
14,273
4,990
1,946
※1,※2 48,418
538
538
496
496
3,639
5,148
230
503
△19
9,502
53,852
159,426
5,543
7,110
10
501
△19
13,146
62,061
173,280
EDINET提出書類
澁谷工業株式会社(E01666)
有価証券報告書
(単位:百万円)
前連結会計年度
(2025年6月30日)
負債の部
流動負債
支払手形及び買掛金
電子記録債務
短期借入金
未払法人税等
未払費用
契約負債
賞与引当金
受注損失引当金
製品保証引当金
その他
流動負債合計
固定負債
長期借入金
退職給付に係る負債
役員退職慰労引当金
繰延税金負債
その他
固定負債合計
負債合計
純資産の部
株主資本
資本金
資本剰余金
利益剰余金
自己株式
株主資本合計
その他の包括利益累計額
その他有価証券評価差額金
為替換算調整勘定
退職給付に係る調整累計額
その他の包括利益累計額合計
非支配株主持分
純資産合計
負債純資産合計
48/100
当連結会計年度
(2026年6月30日)
16,629
2,778
907
2,272
6,784
11,314
508
71
48
1,407
42,723
14,723
2,806
863
1,894
5,786
12,451
536
2
31
6,192
45,289
2,789
5,767
144
9
62
8,773
51,496
1,925
5,296
77
1,545
55
8,899
54,188
11,392
10,350
82,443
△442
103,743
11,392
10,350
89,969
△442
111,268
1,465
825
1,887
4,178
8
107,930
159,426
2,767
1,455
3,591
7,814
8
119,091
173,280
EDINET提出書類
澁谷工業株式会社(E01666)
有価証券報告書
②【連結損益計算書及び連結包括利益計算書】
【連結損益計算書】
(単位:百万円)
前連結会計年度
(自 2024年7月1日
至 2025年6月30日)
※1 129,017
※1 135,613
※2,※3,※5 103,810
※2,※3,※5 110,376
25,206
※4 11,457
25,236
※4 12,155
13,749
13,081
15
76
−
45
103
240
41
111
158
45
191
548
29
23
150
−
12
216
13,773
22
33
−
8
4
70
13,560
※6 1
※6 70
−
362
10
374
20
716
−
808
売上高
売上原価
売上総利益
当連結会計年度
(自 2025年7月1日
至 2026年6月30日)
販売費及び一般管理費
営業利益
営業外収益
受取利息
受取配当金
為替差益
スクラップ売却益
その他
営業外収益合計
営業外費用
支払利息
租税公課
為替差損
保険解約損
その他
営業外費用合計
経常利益
特別利益
固定資産売却益
投資有価証券売却益
補助金収入
その他
特別利益合計
特別損失
固定資産売却損
固定資産処分損
特別損失合計
税金等調整前当期純利益
法人税、住民税及び事業税
法人税等調整額
法人税等合計
当期純利益
非支配株主に帰属する当期純利益
親会社株主に帰属する当期純利益
49/100
※7 0
※7 0
※8 3
※8 50
4
14,144
4,316
△225
4,091
10,053
0
10,052
51
14,317
3,737
355
4,093
10,223
0
10,223
EDINET提出書類
澁谷工業株式会社(E01666)
有価証券報告書
【連結包括利益計算書】
(単位:百万円)
前連結会計年度
(自 2024年7月1日
至 2025年6月30日)
当期純利益
その他の包括利益
その他有価証券評価差額金
為替換算調整勘定
退職給付に係る調整額
その他の包括利益合計
包括利益
(内訳)
親会社株主に係る包括利益
非支配株主に係る包括利益
50/100
当連結会計年度
(自 2025年7月1日
至 2026年6月30日)
10,053
10,223
374
△473
△146
※ △245
1,301
631
1,704
※ 3,636
9,807
13,860
9,806
0
13,859
1
EDINET提出書類
澁谷工業株式会社(E01666)
有価証券報告書
③【連結株主資本等変動計算書】
前連結会計年度(自 2024年7月1日
至
2025年6月30日)
(単位:百万円)
株主資本
資本金
当期首残高
資本剰余金
11,392
利益剰余金
10,350
自己株式
75,296
株主資本合計
△441
96,597
当期変動額
剰余金の配当
△2,904
△2,904
親会社株主に帰属する
当期純利益
10,052
10,052
自己株式の取得
△1
△1
株主資本以外の項目の
当期変動額(純額)
当期変動額合計
当期末残高
−
−
7,147
△1
7,145
11,392
10,350
82,443
△442
103,743
その他の包括利益累計額
その他
有価証券
評価差額金
当期首残高
1,090
為替換算
調整勘定
退職給付に係る
調整累計額
1,299
2,034
その他の
包括利益
累計額合計
4,424
非支配
株主持分
純資産合計
7
101,029
当期変動額
剰余金の配当
△2,904
親会社株主に帰属する
当期純利益
10,052
自己株式の取得
株主資本以外の項目の
当期変動額(純額)
当期変動額合計
当期末残高
△1
374
△473
△146
△245
0
△245
374
△473
△146
△245
0
6,900
1,465
825
1,887
4,178
8
107,930
51/100
EDINET提出書類
澁谷工業株式会社(E01666)
有価証券報告書
当連結会計年度(自
2025年7月1日
至
2026年6月30日)
(単位:百万円)
株主資本
資本金
当期首残高
資本剰余金
11,392
利益剰余金
10,350
自己株式
82,443
株主資本合計
△442
103,743
当期変動額
剰余金の配当
△2,697
△2,697
親会社株主に帰属する
当期純利益
10,223
10,223
自己株式の取得
△0
連結子会社株式の取得に
よる持分の増減
△0
0
0
株主資本以外の項目の
当期変動額(純額)
当期変動額合計
当期末残高
−
0
7,525
△0
7,525
11,392
10,350
89,969
△442
111,268
その他の包括利益累計額
その他
有価証券
評価差額金
当期首残高
1,465
為替換算
調整勘定
退職給付に係る
調整累計額
825
1,887
その他の
包括利益
累計額合計
4,178
非支配
株主持分
純資産合計
8
107,930
当期変動額
剰余金の配当
△2,697
親会社株主に帰属する
当期純利益
10,223
自己株式の取得
△0
連結子会社株式の取得によ
る持分の増減
株主資本以外の項目の
当期変動額(純額)
0
1,301
630
1,704
3,636
0
3,636
当期変動額合計
1,301
630
1,704
3,636
0
11,161
当期末残高
2,767
1,455
3,591
7,814
8
119,091
52/100
EDINET提出書類
澁谷工業株式会社(E01666)
有価証券報告書
④【連結キャッシュ・フロー計算書】
(単位:百万円)
前連結会計年度
(自 2024年7月1日
至 2025年6月30日)
営業活動によるキャッシュ・フロー
税金等調整前当期純利益
減価償却費
退職給付に係る資産の増減額(△は増加)
退職給付に係る負債の増減額(△は減少)
役員退職慰労引当金の増減額(△は減少)
貸倒引当金の増減額(△は減少)
賞与引当金の増減額(△は減少)
受注損失引当金の増減額(△は減少)
災害損失引当金の増減額(△は減少)
受取利息及び受取配当金
支払利息
補助金収入
投資有価証券売却損益(△は益)
売上債権及び契約資産の増減額(△は増加)
契約負債の増減額(△は減少)
棚卸資産の増減額(△は増加)
仕入債務の増減額(△は減少)
前渡金の増減額(△は増加)
未払又は未収消費税等の増減額
その他
小計
利息及び配当金の受取額
利息の支払額
法人税等の支払額
営業活動によるキャッシュ・フロー
投資活動によるキャッシュ・フロー
定期預金の預入による支出
定期預金の払戻による収入
投資有価証券の取得による支出
投資有価証券の売却による収入
有形固定資産の取得による支出
有形固定資産の売却による収入
無形固定資産の取得による支出
補助金の受取額
その他
投資活動によるキャッシュ・フロー
財務活動によるキャッシュ・フロー
長期借入金の返済による支出
配当金の支払額
その他
財務活動によるキャッシュ・フロー
現金及び現金同等物に係る換算差額
現金及び現金同等物の増減額(△は減少)
現金及び現金同等物の期首残高
現金及び現金同等物の期末残高
53/100
当連結会計年度
(自 2025年7月1日
至 2026年6月30日)
14,144
3,028
△174
240
△21
△8
49
10
△116
△91
29
△362
−
7,515
△6,654
△1,650
△1,653
△1,046
362
614
14,214
92
△30
△5,206
9,069
14,317
3,431
△121
179
△67
0
28
△69
−
△152
22
△664
△20
△7,818
845
486
△1,955
1,371
1,219
△1,615
9,418
139
△23
△4,253
5,280
△432
431
△1
−
△6,778
6
△201
362
△6
△6,619
△10,441
3,440
△1
30
△4,266
42
△182
664
△26
△10,740
△907
△2,902
△2
△3,812
△240
△1,603
46,894
※ 45,291
△907
△2,695
△1
△3,605
474
△8,590
45,291
※ 36,700
EDINET提出書類
澁谷工業株式会社(E01666)
有価証券報告書
【注記事項】
(連結財務諸表作成のための基本となる重要な事項)
1.連結の範囲に関する事項
連結子会社の数
18社
主要な連結子会社は、「第1 企業の概況 4.関係会社の状況」に記載しているため省略しております。
2.持分法の適用に関する事項
持分法適用の関連会社
該当なし
3.連結子会社の事業年度等に関する事項
連結子会社の決算日が連結決算日と異なる会社は次のとおりであります。
会社名
決算日
上海希歩洋工業科技有限公司
12月31日 ※
上海楷捷半導体科技有限公司
12月31日 ※
上海希歩洋医療器械有限公司
12月31日 ※
※ 連結決算日現在で本決算に準じた仮決算を行った財務諸表を基礎としております。
4.会計方針に関する事項
(1) 重要な資産の評価基準及び評価方法
① 有価証券
その他有価証券
市場価格のない株式等以外のもの
時価法(評価差額は全部純資産直入法により処理し、売却原価は移動平均法により算定)
市場価格のない株式等
移動平均法による原価法
なお、投資事業有限責任組合およびそれに類する組合への出資(金融商品取引法第2条第2項により有価
証券とみなされるもの)については、組合契約に規定される決算報告日に応じて入手可能な最近の決算書を
基礎とし、持分相当額を純額で取り込む方法によっております。
② デリバティブ
時価法
③ 棚卸資産
原材料、貯蔵品
主として総平均法による原価法(貸借対照表価額は収益性の低下に基づく簿価切下げの方法により算定)
製品、仕掛品
個別法による原価法(貸借対照表価額は収益性の低下に基づく簿価切下げの方法により算定)
(2) 重要な減価償却資産の減価償却の方法
① 有形固定資産(リース資産を除く)
定率法
なお、1998年4月以降に取得した建物、2016年4月以降に取得した建物附属設備および構築物、在外連結子会
社については、定額法によっております。
主な耐用年数は以下のとおりであります。
建物及び構築物
7〜50年
機械装置及び運搬具
② 無形固定資産
4〜12年
定額法
なお、自社利用のソフトウェアについては、社内における利用可能期間(主として5年)に基づく定額法を採
用しております。
③ リース資産
所有権移転外ファイナンス・リース取引に係るリース資産
リース期間を耐用年数とし、残存価額を零とする定額法を採用しております。
(3) 重要な引当金の計上基準
① 貸倒引当金
54/100
EDINET提出書類
澁谷工業株式会社(E01666)
有価証券報告書
債権の貸倒れによる損失に備えるため、一般債権については貸倒実績率により、貸倒懸念債権等特定の債権に
ついては個別に回収可能性を検討し、回収不能見込額を計上しております。
② 賞与引当金
従業員賞与の支給に備えるため、将来の支給見込額のうち当連結会計年度の負担額を計上しております。
③ 受注損失引当金
受注契約に係る将来の損失に備えるため、当連結会計年度末において損失の発生が見込まれ、かつその金額を
合理的に見積ることが可能な受注案件について、その損失見込額を計上しております。
④ 製品保証引当金
販売済製品に対する無償補修費用の支出に備えるため、過去の補修実績率等に基づく将来発生見込額を計上し
ております。
⑤ 災害損失引当金
災害により被害を受けた資産の復旧等に要する支出に備えるため、その補修見込額を計上しております。
⑥ 役員退職慰労引当金
役員退職金の支出に備えるため、内規に基づく期末要支給額を計上しております。なお、一部の連結子会社に
おいては、役員退職金の内規を定めていないため計上しておりません。
(4) 退職給付に係る会計処理の方法
退職給付債務の算定にあたり、退職給付見込額を当連結会計年度末までの期間に帰属させる方法については、給
付算定式基準によっております。
数理計算上の差異については、各連結会計年度の発生時における従業員の平均残存勤務期間以内の一定の年数
(主として12年)による定額法により按分した額をそれぞれ発生の翌連結会計年度から費用処理しております。
過去勤務費用については、その発生時における従業員の平均残存勤務期間以内の一定の年数(主として12年)に
よる定額法により費用処理しております。
なお、一部の連結子会社は、退職給付に係る負債および退職給付費用の計算に、退職給付に係る期末自己都合要
支給額を退職給付債務とする方法を用いた簡便法を適用しております。
(5) 重要な収益及び費用の計上基準
当社グループの顧客との契約から生じる収益に関する主要な履行義務の内容および当該履行義務を充足する通常
の時点(収益を認識する通常の時点)は、以下のとおりであります。
当社グループは、パッケージングプラント事業、メカトロシステム事業、農業用設備事業にかかる製品の製造販
売を主要な事業としており、いずれの事業においても、財又はサービスに対する支配が顧客に一定の期間にわたり
移転する工事契約の場合には、財又はサービスを顧客に移転する履行義務を充足するにつれて、一定の期間にわた
り収益を認識しております。一定の期間にわたり充足される履行義務は、進捗度を合理的に見積ることができる場
合は見積総原価に対する発生原価の割合(インプット法)により収益を認識し、履行義務の充足に係る進捗度を合
理的に見積ることができない場合で、かつ発生する費用を回収することが見込まれる場合は、原価回収基準により
収益を認識しております。なお、期間がごく短い受注契約については代替的な取扱いを適用し、一定の期間にわた
り収益を認識せず、検収完了時に収益を認識しております。また、「収益認識に関する会計基準の適用指針」第98
項に定める代替的な取扱いを適用し、出荷時から製品の支配が顧客に移転される時までの期間が通常の期間である
国内販売の場合は、出荷時に収益を認識しております。これらの履行義務に対する対価は、履行義務の充足から概
ね1年以内に回収しており、重要な金融要素は含んでおりません。
(6) 重要な外貨建の資産又は負債の本邦通貨への換算の基準
外貨建金銭債権債務は、決算日の直物為替相場により円換算し、換算差額は損益として処理しております。な
お、在外子会社等の資産および負債は決算日の直物為替相場により円貨に換算し、収益および費用は期中平均相場
により円貨に換算し、換算差額は純資産の部における「為替換算調整勘定」に含めております。
55/100
EDINET提出書類
澁谷工業株式会社(E01666)
有価証券報告書
(7) 重要なヘッジ会計の方法
① ヘッジ会計の方法
繰延ヘッジ処理を採用しております。なお、振当処理の要件を満たしている為替予約および通貨オプションに
ついては振当処理を採用しております。
② ヘッジ手段およびヘッジ対象
外貨建予定取引、外貨建金銭債権債務の為替変動リスクをヘッジするために為替予約または通貨オプションを
利用しております。
③ ヘッジ方針
実需に基づき、外貨額と受渡時期が確実になった場合に限定し、その為替変動リスクを回避するためにデリバ
ティブ取引を利用することを基本方針としております。
(8) 連結キャッシュ・フロー計算書における資金の範囲
手許現金、要求払預金および容易に換金可能であり、かつ、価値の変動について僅少なリスクしか負わない取得
日から3ヶ月以内に償還期限の到来する短期投資からなります。
(9) その他連結財務諸表作成のための重要な事項
消費税等の会計処理
控除対象外消費税等は、発生連結会計年度の期間費用としております。
(重要な会計上の見積り)
1.一定の期間にわたり充足される履行義務に係る総原価の見積り
(1) 当連結会計年度の連結財務諸表に計上した一定の期間にわたり充足される履行義務に係る売上高
(単位:百万円)
前連結会計年度
売上高
56,672
当連結会計年度
58,579
(2) 識別した項目に係る重要な会計上の見積りの内容に関する情報
一定の期間にわたり充足される履行義務については、期間がごく短い工事を除き、履行義務の充足に係る進捗度
を見積り、当該進捗度に基づき一定の期間にわたり収益を認識しております。なお、履行義務の充足に係る進捗度
の見積り方法は、進捗度を合理的に見積ることができる場合は見積総原価に対する発生原価の割合(インプット
法)により収益を認識し、進捗度を合理的に見積ることができない場合で、かつ発生する費用を回収することが見
込まれる場合は、原価回収基準により収益を認識しております。見積総原価は契約ごとに機種構成や仕様を確認
し、過去の類似の機種や仕様の実績から必要な材料費、工数などを見積り算定しております。見積総原価には、材
料価格や必要工数の変動や仕様変更に伴い事後的に変動するなどの不確実性を伴うため、実績との間に乖離が生じ
た場合は、翌連結会計年度以降の連結財務諸表に重要な影響を与える可能性があります。
2.棚卸資産の評価
(1) 当連結会計年度の連結財務諸表に計上した金額
(単位:百万円)
前連結会計年度
製品
当連結会計年度
302
312
仕掛品
10,598
10,083
原材料及び貯蔵品
6,491
6,739
(注)棚卸資産評価損計上額は、前連結会計年度は279百万円、当連結会計年度は326百万円であります。
(2) 識別した項目に係る重要な会計上の見積りの内容に関する情報
棚卸資産の正味売却価額が帳簿価額を下回った場合は、帳簿価額を正味売却価額まで減額し、当該減少額を棚卸
資産評価損として売上原価に計上しております。なお、正味売却価額の見積りは売価から見積追加製造原価等を控
除して算定しております。また、営業循環過程から外れた長期滞留品については規則的に帳簿価額を切下げ、当該
切下げ額を棚卸資産評価損として売上原価に計上しております。これらの見積りには不確実性を伴うため、実績と
の間に乖離が生じた場合は、翌連結会計年度以降の連結財務諸表に重要な影響を与える可能性があります。
56/100
EDINET提出書類
澁谷工業株式会社(E01666)
有価証券報告書
(未適用の会計基準等)
・「リースに関する会計基準」(企業会計基準第34号 2024年9月13日)
・「リースに関する会計基準の適用指針」(企業会計基準適用指針第33号 2024年9月13日)
ほか、関連する企業会計基準、企業会計基準適用指針、実務対応報告および移管指針の改正
(1) 概要
国際的な会計基準と同様に、借手のすべてのリースについて資産・負債を計上する等の取扱いを定めるもの。
(2) 適用予定日
2028年6月期の期首より適用予定であります。
(3) 当該会計基準等の適用による影響
「リースに関する会計基準」等の適用による連結財務諸表に与える影響額については、現時点で評価中でありま
す。
(表示方法の変更)
(連結損益計算書)
前連結会計年度において、区分掲記しておりました「営業外収益」の「保険配当金」は、「営業外収益」の総額の100
分の10以下となったため、「営業外収益」の「その他」に含めて表示することに変更しました。この表示方法の変更を反
映させるため、前連結会計年度の連結財務諸表の組替えを行っております。
この結果、前連結会計年度の連結損益計算書において、「営業外収益」に表示していた「保険配当金」24百万円、「そ
の他」79百万円は、「その他」103百万円として組み替えております。
(連結貸借対照表関係)
※1.有形固定資産の減価償却累計額
前連結会計年度
(2025年6月30日)
有形固定資産
48,254百万円
当連結会計年度
(2026年6月30日)
50,041百万円
※2.有形固定資産の取得価額から直接控除している圧縮記帳額
前連結会計年度
(2025年6月30日)
有形固定資産
383百万円
57/100
当連結会計年度
(2026年6月30日)
383百万円
EDINET提出書類
澁谷工業株式会社(E01666)
有価証券報告書
(連結損益計算書関係)
※1.顧客との契約から生じる収益
売上高については、顧客との契約から生じる収益およびそれ以外の収益を区分して記載しておりません。顧客との
契約から生じる収益の金額は、連結財務諸表「注記事項(収益認識関係)1.顧客との契約から生じる収益を分解し
た情報」に記載しております。
※2.期末棚卸高は収益性の低下に伴う簿価切下後の金額であり、次の棚卸資産評価損が売上原価に含まれておりま
す。
前連結会計年度
(自 2024年7月1日
至 2025年6月30日)
棚卸資産評価損
279百万円
当連結会計年度
(自 2025年7月1日
至 2026年6月30日)
326百万円
※3.売上原価に含まれている工事契約に係る受注損失引当金繰入額
前連結会計年度
(自 2024年7月1日
至 2025年6月30日)
工事契約に係る受注損失引当金繰入額
45百万円
当連結会計年度
(自 2025年7月1日
至 2026年6月30日)
△68百万円
※4.販売費及び一般管理費のうち主要な費目および金額は、次のとおりであります。
前連結会計年度
(自 2024年7月1日
至 2025年6月30日)
荷造運搬費
1,417百万円
3,443
給料
当連結会計年度
(自 2025年7月1日
至 2026年6月30日)
1,527百万円
3,666
0
貸倒引当金繰入額
△1
賞与引当金繰入額
88
91
退職給付費用
71
123
役員退職慰労引当金繰入額
13
21
※5.当期製造費用に含まれる研究開発費の総額
前連結会計年度
(自 2024年7月1日
至 2025年6月30日)
研究開発費
2,038百万円
当連結会計年度
(自 2025年7月1日
至 2026年6月30日)
2,013百万円
※6.固定資産売却益の資産別内訳
前連結会計年度
(自 2024年7月1日
至 2025年6月30日)
機械装置及び運搬具
土地
その他
当連結会計年度
(自 2025年7月1日
至 2026年6月30日)
1百万円
−
0
39百万円
30
0
1
70
前連結会計年度
(自 2024年7月1日
至 2025年6月30日)
当連結会計年度
(自 2025年7月1日
至 2026年6月30日)
計
※7.固定資産売却損の資産別内訳
機械装置及び運搬具
−
0百万円
土地
その他
0百万円
0
−
−
0
0
計
58/100
EDINET提出書類
澁谷工業株式会社(E01666)
有価証券報告書
※8.固定資産処分損の資産別内訳
前連結会計年度
(自 2024年7月1日
至 2025年6月30日)
当連結会計年度
(自 2025年7月1日
至 2026年6月30日)
建物及び構築物
0百万円
40百万円
機械装置及び運搬具
その他
0
3
10
0
3
50
計
(連結包括利益計算書関係)
その他の包括利益に係る組替調整額ならびに法人税等及び税効果額
※
前連結会計年度
(自 2024年7月1日
至 2025年6月30日)
当連結会計年度
2025年7月1日
2026年6月30日)
(自
至
その他有価証券評価差額金:
当期発生額
組替調整額
557百万円
−
法人税等及び税効果調整前
1,934百万円
△20
557
△182
1,914
△612
374
1,301
△473
631
△46
△166
2,610
△116
法人税等及び税効果額
△212
65
2,494
△790
退職給付に係る調整額
△146
1,704
△245
3,636
法人税等及び税効果額
その他有価証券評価差額金
為替換算調整勘定:
当期発生額
退職給付に係る調整額:
当期発生額
組替調整額
法人税等及び税効果調整前
その他の包括利益合計
59/100
EDINET提出書類
澁谷工業株式会社(E01666)
有価証券報告書
(連結株主資本等変動計算書関係)
前連結会計年度(自 2024年7月1日至 2025年6月30日)
1.発行済株式の種類及び総数並びに自己株式の種類及び株式数に関する事項
株式の種類
当連結会計年度期首
増加
減少
当連結会計年度末
発行済株式
普通株式(株)
28,149,877
−
−
28,149,877
483,078
441
−
483,519
自己株式
普通株式(株)(注)
(注)普通株式の自己株式の株式数の増加441株は、単元未満株式の買取りによるものであります。
2.配当に関する事項
(1)配当金支払額
決議
株式の種類
配当金の総額
(百万円)
2024年9月27日
定時株主総会
普通株式
1,660
2025年2月12日
取締役会
普通株式
1,244
1株当たりの配
当額(円)
基準日
効力発生日
60
2024年6月30日
2024年9月30日
45
2024年12月31日
2025年3月18日
(2)基準日が当連結会計年度に属する配当のうち、配当の効力発生日が翌連結会計年度となるもの
決議
株式の種類
配当の原資
配当金の総額
(百万円)
1株当たりの
配当額(円)
基準日
効力発生日
2025年9月25日
定時株主総会
普通株式
利益剰余金
1,383
50
2025年6月30日
2025年9月26日
当連結会計年度(自 2025年7月1日至 2026年6月30日)
1.発行済株式の種類及び総数並びに自己株式の種類及び株式数に関する事項
株式の種類
当連結会計年度期首
増加
減少
当連結会計年度末
発行済株式
普通株式(株)
28,149,877
−
−
28,149,877
483,519
87
−
483,606
自己株式
普通株式(株)(注)
(注)普通株式の自己株式の株式数の増加87株は、単元未満株式の買取りによるものであります。
2.配当に関する事項
(1)配当金支払額
決議
株式の種類
配当金の総額
(百万円)
2025年9月25日
定時株主総会
普通株式
1,383
2026年2月13日
取締役会
普通株式
1,314
1株当たりの配
当額(円)
基準日
効力発生日
50
2025年6月30日
2025年9月26日
47.5
2025年12月31日
2026年3月17日
(2)基準日が当連結会計年度に属する配当のうち、配当の効力発生日が翌連結会計年度となるもの
2026年9月25日開催の定時株主総会の議案として、次のとおり付議する予定です。
決議
株式の種類
配当の原資
配当金の総額
(百万円)
1株当たりの
配当額(円)
基準日
効力発生日
2026年9月25日
定時株主総会
普通株式
利益剰余金
1,452
52.5
2026年6月30日
2026年9月28日
60/100
EDINET提出書類
澁谷工業株式会社(E01666)
有価証券報告書
(連結キャッシュ・フロー計算書関係)
現金及び現金同等物の期末残高と連結貸借対照表に掲記されている科目の金額との関係
※
前連結会計年度
2024年7月1日
2025年6月30日)
(自
至
当連結会計年度
2025年7月1日
2026年6月30日)
(自
至
現金及び預金勘定
45,579百万円
44,008百万円
預入期間が3ヶ月を超える定期預金
△288
△7,307
現金及び現金同等物
45,291
36,700
(リース取引関係)
(借主側)
1.ファイナンス・リース取引
重要性が乏しいため、注記を省略しております。
2.オペレーティング・リース取引
オペレーティング・リース取引のうち解約不能のものに係る未経過リース料
(単位:百万円)
前連結会計年度
(2025年6月30日)
当連結会計年度
(2026年6月30日)
1年内
29
161
1年超
72
594
合計
102
756
(金融商品関係)
1.金融商品の状況に関する事項
(1)金融商品に対する取組方針
当社グループは、事業遂行上必要な運転資金および設備資金について、主に銀行等の金融機関からの借入により調
達しており、一時的な余資については主に流動性の高い金融資産で運用しております。なお、デリバティブは、後述
するリスクを回避するために利用しており、投機的な取引は行わない方針であります。
(2)金融商品の内容およびそのリスク
営業債権である受取手形及び売掛金、電子記録債権は、顧客の信用リスクに晒されております。また、海外で事業
を行うにあたり生じる外貨建ての営業債権は、為替の変動リスクに晒されております。
投資有価証券は、主に当社グループと業務上の関係を有する企業の株式等であり、市場価格の変動リスク等に晒さ
れております。
営業債務である支払手形及び買掛金、電子記録債務は、そのほとんどが6ヶ月以内の支払期日であり、外貨建債務
は為替の変動リスクに晒されております。
借入金およびファイナンス・リース取引に係るリース債務は、主に運転資金や設備投資に係る資金調達を目的とし
たものであり、償還日は最長で決算日後5年であります。
デリバティブ取引は、主に外貨建債権・債務に係る為替の変動リスクに対するヘッジを目的とした先物為替予約取
引であります。なお、ヘッジ会計に関するヘッジ手段とヘッジ対象、ヘッジ方針等については、連結財務諸表作成の
ための基本となる重要な事項の「4. 会計方針に関する事項(7)重要なヘッジ会計の方法」に記載しております。
(3)金融商品に係るリスク管理体制
① 信用リスク(取引先の契約不履行などに係るリスク)の管理
営業債権については、債権管理規程に基づき、主要な取引先の状況を定期的に調査し、取引相手ごとに期日および
残高を管理するとともに、財務状況等の悪化等による回収懸念の早期把握や軽減を図っております。
デリバティブ取引については、取引相手先を信用度の高い国内の銀行に限定しているため、信用リスクはほとんど
ないと認識しております。
② 市場リスク(為替や金利等の変動リスク)の管理
外貨建ての営業債権・債務については、為替の変動リスクに対し、必要に応じて先物為替予約および通貨オプショ
ンを利用しております。
投資有価証券については、定期的に時価や発行体(取引先企業)の財務状況等を把握し、市況や取引先企業との関
係を勘案して保有状況を継続的に見直しております。
61/100
EDINET提出書類
澁谷工業株式会社(E01666)
有価証券報告書
デリバティブ取引の執行・管理については、実需に基づき、外貨額と受渡時期が確定した場合に限り各所管部門の
依頼により、社内規程に基づく決裁を受けた後財経本部が執行し、その結果を所管部門に報告することにより相互に
確認を行っております。
③ 資金調達に係る流動性リスク(支払期日に支払いを実行できなくなるリスク)の管理
各部署からの報告に基づき資金部が適時に資金繰計画を作成・更新するとともに、手許流動性の維持などにより流
動性リスクを管理しております。
(4)金融商品の時価等に関する事項についての補足説明
金融商品の時価の算定においては変動要因を織り込んでいるため、異なる前提条件等を採用することにより、当該
価額が変動することがあります。
2.金融商品の時価等に関する事項
連結貸借対照表計上額、時価およびこれらの差額については、次のとおりであります。
前連結会計年度(2025年6月30日)
連結貸借対照表計上額
(百万円)
時価(百万円)
差額(百万円)
(1) 投資有価証券(※3)
3,516
3,516
−
(2) 長期借入金
(2,789)
(2,719)
(△69)
当連結会計年度(2026年6月30日)
連結貸借対照表計上額
(百万円)
時価(百万円)
差額(百万円)
(1) 投資有価証券(※3)
5,422
5,422
−
(2) 長期借入金
(1,925)
(1,829)
(△95)
(※1)負債で計上されているものについては、( )で示しております。
(※2)「現金及び預金」「受取手形」「電子記録債権」「売掛金」「支払手形及び買掛金」「電子記録債務」「短期
借入金」は、現金であること、および短期間で決済されるため時価が帳簿価額に近似するものであることから、
注記を省略しております。
(※3)市場価格のない株式および投資事業組合出資金は、「(1)投資有価証券」には含まれておりません。当該金融商
品の連結貸借対照表計上額は以下のとおりであります。なお、投資事業組合出資金については、「時価の算定に
関する会計基準の適用指針」(企業会計基準適用指針第31号)第24-16項に基づき、時価開示の対象とはしており
ません。
区分
前連結会計年度(百万円)
当連結会計年度(百万円)
非上場株式
37
37
投資事業組合出資金
86
84
62/100
EDINET提出書類
澁谷工業株式会社(E01666)
有価証券報告書
(注)1.金銭債権の連結決算日後の償還予定額
前連結会計年度(2025年6月30日)
1年以内
(百万円)
1年超5年以内
(百万円)
5年超10年以内
(百万円)
10年超
(百万円)
現金及び預金
45,579
−
−
−
受取手形
1,422
−
−
−
電子記録債権
9,846
−
−
−
売掛金
15,467
−
−
−
72,315
−
−
−
1年超5年以内
(百万円)
5年超10年以内
(百万円)
44,008
−
−
−
471
−
−
−
電子記録債権
13,384
−
−
−
売掛金
17,739
−
−
−
75,603
−
−
−
合計
当連結会計年度(2026年6月30日)
1年以内
(百万円)
現金及び預金
受取手形
合計
10年超
(百万円)
2.短期借入金および長期借入金の連結決算日後の返済予定額
前連結会計年度(2025年6月30日)
長期借入金
1年以内
(百万円)
1年超
2年以内
(百万円)
2年超
3年以内
(百万円)
3年超
4年以内
(百万円)
4年超
5年以内
(百万円)
5年超
(百万円)
907
863
636
577
577
134
1年以内
(百万円)
1年超
2年以内
(百万円)
2年超
3年以内
(百万円)
3年超
4年以内
(百万円)
4年超
5年以内
(百万円)
5年超
(百万円)
863
636
577
577
134
−
当連結会計年度(2026年6月30日)
長期借入金
3.金融商品の時価のレベルごとの内訳等に関する事項
金融商品の時価を、時価の算定に係るインプットの観察可能性および重要性に応じて、以下の3つのレベルに分類
しております。
レベル1の時価:観察可能な時価の算定に係るインプットのうち、活発な市場において形成される当該時価の算定
の対象となる資産または負債に関する相場価格により算定した時価
レベル2の時価:観察可能な時価の算定に係るインプットのうち、レベル1のインプット以外の時価の算定に係る
インプットを用いて算定した時価
レベル3の時価:観察できない時価の算定に係るインプットを使用して算定した時価
時価の算定に重要な影響を与えるインプットを複数使用している場合には、それらのインプットがそれぞれ属する
レベルのうち、時価の算定における優先順位が最も低いレベルに時価を分類しております。
63/100
EDINET提出書類
澁谷工業株式会社(E01666)
有価証券報告書
(1)時価で連結貸借対照表に計上している金融商品
前連結会計年度(2025年6月30日)
時価(百万円)
区分
レベル1
レベル2
レベル3
合計
投資有価証券
その他有価証券
株式
資産計
3,516
−
−
3,516
3,516
−
−
3,516
当連結会計年度(2026年6月30日)
時価(百万円)
区分
レベル1
レベル2
レベル3
合計
投資有価証券
その他有価証券
株式
資産計
5,422
−
−
5,422
5,422
−
−
5,422
(2)時価で連結貸借対照表に計上している金融商品以外の金融商品
前連結会計年度(2025年6月30日)
時価(百万円)
区分
レベル1
長期借入金
負債計
レベル2
レベル3
合計
−
2,719
−
2,719
−
2,719
−
2,719
当連結会計年度(2026年6月30日)
時価(百万円)
区分
レベル1
長期借入金
負債計
レベル2
レベル3
合計
−
1,829
−
1,829
−
1,829
−
1,829
(注)時価の算定に用いた評価技法及び時価の算定に係るインプットの説明
投資有価証券
上場株式は相場価格を用いて評価しております。上場株式は活発な市場で取引されているため、その時価をレ
ベル1の時価に分類しております。
長期借入金
長期借入金の時価は、元利金の合計額と、当該債務の残存期間および信用リスクを加味した利率を基に、割引
現在価値法により算定しており、レベル2の時価に分類しております。
64/100
EDINET提出書類
澁谷工業株式会社(E01666)
有価証券報告書
(有価証券関係)
1.その他有価証券
前連結会計年度(2025年6月30日)
連結貸借対照表計上額
(百万円)
種類
連結貸借対照表計上
額が取得原価を超え
るもの
連結貸借対照表計上
額が取得原価を超え
ないもの
取得原価
(百万円)
差額
(百万円)
(1)株式
3,081
1,126
1,954
(2)債券
−
−
−
(3)その他
−
−
−
小計
3,081
1,126
1,954
(1)株式
434
499
△64
(2)債券
−
−
−
(3)その他
−
−
−
小計
434
499
△64
3,516
1,626
1,890
合計
(注)非上場株式(連結貸借対照表計上額37百万円)、投資事業組合出資金(連結貸借対照表計上額86百万円)につい
ては、市場価格のない株式等であることから、上表の「その他有価証券」には含めておりません。
当連結会計年度(2026年6月30日)
連結貸借対照表計上額
(百万円)
種類
連結貸借対照表計上
額が取得原価を超え
るもの
連結貸借対照表計上
額が取得原価を超え
ないもの
取得原価
(百万円)
差額
(百万円)
(1)株式
5,420
1,616
3,804
(2)債券
−
−
−
(3)その他
−
−
−
小計
5,420
1,616
3,804
(1)株式
1
1
△0
(2)債券
−
−
−
(3)その他
−
−
−
小計
1
1
△0
5,422
1,617
3,804
合計
(注)非上場株式(連結貸借対照表計上額37百万円)、投資事業組合出資金(連結貸借対照表計上額84百万円)につい
ては、市場価格のない株式等であることから、上表の「その他有価証券」には含めておりません。
2.売却したその他有価証券
前連結会計年度(自 2024年7月1日
該当事項はありません。
当連結会計年度(自
種類
2025年7月1日
至
2025年6月30日)
至
2026年6月30日)
売却額
(百万円)
売却益の合計額
(百万円)
売却損の合計額
(百万円)
(1) 株式
30
20
−
(2) 債券
−
−
−
(3) その他
−
−
−
30
20
−
合計
65/100
EDINET提出書類
澁谷工業株式会社(E01666)
有価証券報告書
3.減損処理を行った有価証券
前連結会計年度(自 2024年7月1日至 2025年6月30日)
該当事項はありません。
なお、減損処理にあたっては、期末における時価が取得原価に比べ50%以上下落した場合には全て減損処理を行
い、30%〜50%程度下落した場合には、回復可能性等を考慮して必要と認められた額について減損処理を行うことと
しております。
当連結会計年度(自 2025年7月1日至 2026年6月30日)
該当事項はありません。
なお、減損処理にあたっては、期末における時価が取得原価に比べ50%以上下落した場合には全て減損処理を行
い、30%〜50%程度下落した場合には、回復可能性等を考慮して必要と認められた額について減損処理を行うことと
しております。
(デリバティブ取引関係)
前連結会計年度(自 2024年7月1日
該当事項はありません。
当連結会計年度(自 2025年7月1日
該当事項はありません。
至
2025年6月30日)
至
2026年6月30日)
(退職給付関係)
1.採用している退職給付制度の概要
当社および一部の連結子会社は、確定給付型の制度として企業年金基金制度および退職一時金制度を設けておりま
す。
一部の連結子会社は、簡便法により退職給付に係る負債および退職給付費用を計算しております。
一部の国内連結子会社は、確定拠出型の制度である中小企業退職金共済制度を設けております。
一部の国内連結子会社は、複数事業主制度の企業年金基金制度に加入しており、このうち、自社の拠出に対応する
年金資産の額を合理的に計算することができない制度については、確定拠出制度と同様に処理しております。
2.確定給付制度
(1)退職給付債務の期首残高と期末残高の調整表(簡便法を適用した制度を除く。)
前連結会計年度
(自 2024年7月1日
至 2025年6月30日)
当連結会計年度
2025年7月1日
2026年6月30日)
(自
至
退職給付債務の期首残高
勤務費用
利息費用
数理計算上の差異の発生額
退職給付の支払額
過去勤務費用の発生額
12,415百万円
686
171
△281
△295
△15
12,681百万円
700
189
△1,602
△409
21
退職給付債務の期末残高
12,681
11,580
(2)年金資産の期首残高と期末残高の調整表(簡便法を適用した制度を除く。)
前連結会計年度
(自 2024年7月1日
至 2025年6月30日)
当連結会計年度
2025年7月1日
2026年6月30日)
(自
至
年金資産の期首残高
期待運用収益
数理計算上の差異の発生額
事業主からの拠出額
退職給付の支払額
12,674百万円
253
△343
309
△180
12,714百万円
254
1,030
297
△249
年金資産の期末残高
12,714
14,047
(3)簡便法を適用した制度の、退職給付に係る負債の期首残高と期末残高の調整表
66/100
EDINET提出書類
澁谷工業株式会社(E01666)
有価証券報告書
前連結会計年度
(自 2024年7月1日
至 2025年6月30日)
当連結会計年度
2025年7月1日
2026年6月30日)
(自
至
退職給付に係る負債の期首残高
退職給付費用
退職給付の支払額
制度への拠出額
為替換算差額
599百万円
113
△38
△22
0
652百万円
57
△37
△21
2
退職給付に係る負債の期末残高
652
651
(4)退職給付債務および年金資産の期末残高と連結貸借対照表に計上された退職給付に係る負債および退職給付に係
る資産の調整表
前連結会計年度
(2025年6月30日)
積立型制度の退職給付債務
年金資産
当連結会計年度
(2026年6月30日)
13,107百万円
△13,026
12,001百万円
△14,362
80
△2,361
非積立型制度の退職給付債務
538
546
連結貸借対照表に計上された負債と資産の純額
619
△1,814
5,767
5,148
5,296
7,110
619
△1,814
退職給付に係る負債
退職給付に係る資産
連結貸借対照表に計上された負債と資産の純額
(注)簡便法を適用した制度を含んでおります。
(5)退職給付費用およびその内訳項目の金額
前連結会計年度
(自 2024年7月1日
至 2025年6月30日)
勤務費用
利息費用
期待運用収益
数理計算上の差異の費用処理額
過去勤務費用の費用処理額
簡便法で計算した退職給付費用
当連結会計年度
2025年7月1日
2026年6月30日)
(自
至
686百万円
171
△253
△96
△70
113
確定給付制度に係る退職給付費用
700百万円
189
△254
△47
△68
57
551
575
(6)退職給付に係る調整額
退職給付に係る調整額に計上した項目(法人税等及び税効果控除前)の内訳は次のとおりであります。
前連結会計年度
(自 2024年7月1日
至 2025年6月30日)
過去勤務費用
数理計算上の差異
合計
67/100
当連結会計年度
2025年7月1日
2026年6月30日)
(自
至
△55百万円
△157
△90百万円
2,584
△212
2,494
EDINET提出書類
澁谷工業株式会社(E01666)
有価証券報告書
(7)退職給付に係る調整累計額
退職給付に係る調整累計額に計上した項目(法人税等及び税効果控除前)の内訳は次のとおりであります。
前連結会計年度
(2025年6月30日)
未認識過去勤務費用
未認識数理計算上の差異
合計
当連結会計年度
(2026年6月30日)
735百万円
1,999
645百万円
4,584
2,735
5,229
(8)年金資産に関する事項
① 年金資産の主な内訳
年金資産合計に対する主な分類ごとの比率は、次のとおりであります。
前連結会計年度
(2025年6月30日)
当連結会計年度
(2026年6月30日)
19%
16
11
19
11
24
18%
18
11
21
10
22
100
100
国内債券
国内株式
外国債券
外国株式
一般勘定
その他
合計
② 長期期待運用収益率の設定方法
年金資産の長期期待運用収益率を決定するため、現在および予想される年金資産の配分と、年金資産を構成す
る多様な資産からの現在および将来期待される長期の収益率を考慮しております。
(9)数理計算上の計算基礎に関する事項
当連結会計年度末における主要な数理計算上の計算基礎
前連結会計年度
(2025年6月30日)
当連結会計年度
(2026年6月30日)
割引率
0.5〜1.8%
0.5〜3.4%
長期期待運用収益率
2.0%
2.0%
予想昇給率は、主として2024年3月31日を基準日として算定した年齢別昇給指数を使用しております。
3.確定拠出制度
連結子会社の確定拠出制度への要拠出額は、前連結会計年度4百万円、当連結会計年度6百万円であります。
4.複数事業主制度
前連結会計年度(自 2024年7月1日至 2025年6月30日)
確定拠出制度と同様に会計処理する複数事業主制度の企業年金基金制度への要拠出額は、16百万円であります。
(1)複数事業主制度の直近の積立状況
電子情報技術産業企業
年金基金
(2025年3月31日現在)
長野県機械工業企業年
金基金
(2024年3月31日現在)
石川県機械工業企業年
金基金
(2024年3月31日現在)
年金資産の額
17,249百万円
6,083百万円
9,847百万円
年金財政計算上の数理債務の額と
最低責任準備金の額との合計額
12,922
4,758
4,688
差引額
4,326
1,325
5,158
68/100
EDINET提出書類
澁谷工業株式会社(E01666)
有価証券報告書
(2)複数事業主制度の掛金に占める当社グループの割合(2025年6月30日現在)
電子情報技術産業企業年金基金
1.09%
長野県機械工業企業年金基金
1.23%
石川県機械工業企業年金基金
0.71%
(3)補足説明
電子情報技術産業企業年金基金
長野県機械工業企業年金基金
石川県機械工業企業年金基金
上記(1)の差引額の主な要因は、
剰余金4,326百万円であります。
上記(1)の差引額の主な要因は、
年金財政計算上の過去勤務債務残高
272百万円および剰余金1,597百万円
であります。本制度における過去勤
務債務の償却方法は、期間5年の元
利均等償却であります(残余償却年
数:3年)。
上記(1)の差引額の主な要因は、
剰余金5,158百万円であります。
当連結会計年度(自 2025年7月1日至 2026年6月30日)
確定拠出制度と同様に会計処理する複数事業主制度の企業年金基金制度への要拠出額は、16百万円であります。
(1)複数事業主制度の直近の積立状況
電子情報技術産業企業
年金基金
(2026年3月31日現在)
長野県機械工業企業年
金基金
(2025年3月31日現在)
石川県機械工業企業年
金基金
(2025年3月31日現在)
年金資産の額
18,736百万円
6,128百万円
10,148百万円
年金財政計算上の数理債務の額と
最低責任準備金の額との合計額
12,494
4,770
4,824
差引額
6,241
1,357
5,323
(2)複数事業主制度の掛金に占める当社グループの割合(2026年6月30日現在)
電子情報技術産業企業年金基金
1.10%
長野県機械工業企業年金基金
1.19%
石川県機械工業企業年金基金
0.71%
(3)補足説明
電子情報技術産業企業年金基金
長野県機械工業企業年金基金
石川県機械工業企業年金基金
上記(1)の差引額の主な要因は、
剰余金6,241百万円であります。
上記(1)の差引額の主な要因は、
年金財政計算上の過去勤務債務残高
175百万円および剰余金1,532百万円
であります。本制度における過去勤
務債務の償却方法は、期間5年の元
利均等償却であります(残余償却年
数:2年)。
上記(1)の差引額の主な要因は、
剰余金5,323百万円であります。
69/100
EDINET提出書類
澁谷工業株式会社(E01666)
有価証券報告書
(税効果会計関係)
1.繰延税金資産及び繰延税金負債の発生の主な原因別の内訳
前連結会計年度
(2025年6月30日)
当連結会計年度
(2026年6月30日)
繰延税金資産
棚卸資産評価損
578百万円
676百万円
投資有価証券評価損
222
222
減損損失
67
61
施設利用権評価損
11
11
未払費用
570
343
未払事業税
149
138
賞与引当金
156
167
受注損失引当金
24
0
退職給付に係る負債
1,686
1,510
役員退職慰労引当金
45
24
資産除去債務
15
15
連結子会社の時価評価差額
180
174
税務上の繰越欠損金(注)
その他
繰延税金資産小計
4
94
296
209
4,010
3,652
税務上の繰越欠損金に係る評価性引当額(注)
△3
△94
将来減算一時差異等の合計に係る評価性引当額
△571
△457
評価性引当額小計
△575
△551
繰延税金資産合計
3,435
3,101
退職給付に係る資産
△1,513
△2,106
固定資産圧縮積立金
△948
△1,102
その他有価証券評価差額金
△424
△1,036
連結子会社の時価評価差額
△159
△159
その他
△168
△230
△3,214
△4,636
221
△1,535
繰延税金負債
繰延税金負債合計
繰延税金資産(△は負債)の純額
(注)税務上の繰越欠損金およびその繰延税金資産の繰越期限別の金額
前連結会計年度(2025年6月30日)
1年超
2年超
3年超
1年以内
2年以内
3年以内
4年以内
(百万円)
(百万円) (百万円) (百万円)
税務上の繰越
1
−
−
−
欠損金(※1)
4年超
5年以内
(百万円)
5年超
(百万円)
合計
(百万円)
−
3
4
評価性引当額
−
−
−
−
−
△3
△3
繰延税金資産
1
−
−
−
−
−
(※2)1
(※1) 税務上の繰越欠損金は、法定実効税率を乗じた額であります。
(※2) 当該繰延税金資産は、利益計画に基づいて将来の課税所得の見積額を算出し、回収可能であると判断した
ものであります。
70/100
EDINET提出書類
澁谷工業株式会社(E01666)
有価証券報告書
当連結会計年度(2026年6月30日)
1年超
2年超
1年以内
2年以内
3年以内
(百万円)
(百万円) (百万円)
税務上の繰越
−
−
−
欠損金(※1)
3年超
4年以内
(百万円)
4年超
5年以内
(百万円)
5年超
(百万円)
合計
(百万円)
−
−
94
94
評価性引当額
−
−
−
−
−
△94
△94
繰延税金資産
−
−
−
−
−
0
(※2)0
(※1) 税務上の繰越欠損金は、法定実効税率を乗じた額であります。
(※2) 当該繰延税金資産は、利益計画に基づいて将来の課税所得の見積額を算出し、回収可能であると判断した
ものであります。
2.法定実効税率と税効果会計適用後の法人税等の負担率との間に重要な差異があるときの、当該差異の原因となった
主要な項目別の内訳
前連結会計年度
(2025年6月30日)
法定実効税率
当連結会計年度
(2026年6月30日)
30.5%
(調整)
法定実効税率
30.5%
(調整)
交際費等永久に損金に算入されない項目
0.2
交際費等永久に損金に算入されない項目
0.2
受取配当金等永久に益金に算入されない
△0.0
受取配当金等永久に益金に算入されない
△0.0
項目
住民税均等割
項目
0.2
住民税均等割
0.2
試験研究費等の税額控除
△2.0
試験研究費等の税額控除
△2.3
評価性引当額の増減
△0.2
評価性引当額の増減
△0.2
その他
税効果会計適用後の法人税等の負担率
0.2
28.9
その他
税効果会計適用後の法人税等の負担率
0.2
28.6
3.法人税および地方法人税の会計処理またはこれらに関する税効果会計の会計処理
当社および一部の国内連結子会社は、グループ通算制度を適用しており、「グループ通算制度を適用する場合の会
計処理及び開示に関する取扱い」(実務対応報告第42号 2021年8月12日)に従って、法人税および地方法人税なら
びに税効果会計の会計処理および開示を行っております。
(資産除去債務関係)
資産除去債務の総額に重要性が乏しいため、注記を省略しております。
(賃貸等不動産関係)
賃貸等不動産の総額に重要性が乏しいため、注記を省略しております。
71/100
EDINET提出書類
澁谷工業株式会社(E01666)
有価証券報告書
(収益認識関係)
1.顧客との契約から生じる収益を分解した情報
前連結会計年度(自 2024年7月1日至 2025年6月30日)
(単位:百万円)
報告セグメント
パッケージング
プラント事業
メカトロ
システム事業
農業用設備事業
合計
収益認識の時期
一時点で移転される
財又はサービス
30,230
37,235
4,877
72,344
一定の期間にわたり移転
される財又はサービス
49,850
529
6,292
56,672
顧客との契約から生じる収益
80,081
37,765
11,170
129,017
日本
52,407
12,111
11,107
75,626
中国
7,284
5,497
35
12,817
アジア
8,354
9,536
4
17,895
北米
10,642
4,764
1
15,408
その他
1,391
5,856
22
7,270
顧客との契約から生じる収益
80,081
37,765
11,170
129,017
主たる地域市場
その他の収益
外部顧客への売上高
当連結会計年度(自
2025年7月1日
至
−
−
−
−
80,081
37,765
11,170
129,017
2026年6月30日)
(単位:百万円)
報告セグメント
パッケージング
プラント事業
メカトロ
システム事業
農業用設備事業
合計
収益認識の時期
一時点で移転される
財又はサービス
33,122
38,997
4,914
77,034
一定の期間にわたり移転
される財又はサービス
50,918
−
7,660
58,579
顧客との契約から生じる収益
84,041
38,997
12,574
135,613
日本
56,599
11,381
12,290
80,271
中国
10,556
4,934
15
15,506
アジア
8,885
9,712
103
18,701
北米
6,971
6,315
0
13,288
その他
1,028
6,653
164
7,846
顧客との契約から生じる収益
84,041
38,997
12,574
135,613
−
−
−
−
84,041
38,997
12,574
135,613
主たる地域市場
その他の収益
外部顧客への売上高
72/100
EDINET提出書類
澁谷工業株式会社(E01666)
有価証券報告書
2.顧客との契約から生じる収益を理解するための基礎となる情報
「注記事項(連結財務諸表作成のための基本となる重要な事項)4.会計方針に関する事項
(5) 重要な収益及
び費用の計上基準」に記載のとおりであります。
3.顧客との契約に基づく履行義務の充足と当該契約から生じるキャッシュ・フローとの関係並びに当連結会計年度末
において存在する顧客との契約から翌連結会計年度以降に認識すると見込まれる収益の金額及び時期に関する情報
(1) 契約資産および契約負債の残高等
(単位:百万円)
前連結会計年度
当連結会計年度
顧客との契約から生じた債権(期首残高)
30,922
26,736
顧客との契約から生じた債権(期末残高)
26,736
31,595
契約資産(期首残高)
14,956
11,472
契約資産(期末残高)
11,472
14,670
契約負債(期首残高)
18,181
11,314
契約負債(期末残高)
11,314
12,451
契約資産は、一定の期間にわたり履行義務が充足される工事契約において、収益として認識することにより
計上した対価に対する権利であり、顧客の検収を受け、対価に対する権利が無条件となった時点で債権に振り
替えられます。
契約負債は、履行義務を充足する前に顧客から受け取った対価であり、収益の認識に伴い取り崩されます。
前連結会計年度に認識した収益の額のうち、期首現在の契約負債残高に含まれていた額は、15,975百万円で
あります。また、契約負債が6,867百万円減少した理由は、主にパッケージングプラント事業における収益の認
識に伴う前受金の取り崩しであります。なお、過去の期間に充足した履行義務から認識した収益の額に重要性
はありません。
当連結会計年度に認識した収益の額のうち、期首現在の契約負債残高に含まれていた額は、10,754百万円で
あります。なお、過去の期間に充足した履行義務から認識した収益の額に重要性はありません。
(2) 残存履行義務に配分した取引価格
残存履行義務に配分した取引価格の総額および収益の認識が見込まれる期間は、以下のとおりであります。
(単位:百万円)
前連結会計年度
当連結会計年度
1年以内
72,246
60,870
1年超3年以内
20,933
27,375
3年超
合計
−
2,208
93,179
90,454
73/100
EDINET提出書類
澁谷工業株式会社(E01666)
有価証券報告書
(セグメント情報等)
【セグメント情報】
1.報告セグメントの概要
当社グループの報告セグメントは、当社グループの構成単位のうち分離された財務情報が入手可能であり、取締役会
が、経営資源の配分の決定および業績を評価するために、定期的に検討を行う対象となっているものであります。
当社グループは、製品の販売、生産体制やサービスの類似性を基準とした事業部門を設置しており、各事業部門は包
括的な戦略を立案し、事業活動を展開しております。
したがって、当社グループは事業部門を基礎としたセグメントから構成されており、「パッケージングプラント事
業」、「メカトロシステム事業」および「農業用設備事業」の3つを報告セグメントとしております。
各報告セグメントの主要な製品は、以下のとおりであります。
セグメントの名称
主要製品
パッケージングプラント事業
ボトリングシステム(充填システム、キャッピングシステム、ラベリングシステムな
ど)、製函・包装システム、製薬設備システム(医薬品製造システム、アイソレータ
など)、食品加工システム、洗浄設備システム、再生医療システム(細胞培養アイソ
レータ、ロボット自動細胞培養システムなど)、固液混合・分散システムなど
メカトロシステム事業
半導体製造システム(ハンダボールマウンタ、ワイヤボンダ、LED検査装置な
ど)、医療機器(人工透析装置、レーザ手術および治療装置など)、切断加工システ
ム(レーザ加工機、ウォータジェット切断加工機など)、超音波発生装置、油圧プレ
ス機など
農業用設備事業
農業用選果・選別システムなど
2.報告セグメントごとの売上高、利益又は損失、資産、負債その他の項目の金額の算定方法
報告されている事業セグメントの会計処理の方法は、「連結財務諸表作成のための基本となる重要な事項」における
記載と同一であります。報告セグメントの利益は営業利益ベースの数値であり、セグメント間の内部売上高および振替
高は市場実勢価格等に基づいております。
3.報告セグメントごとの売上高、利益又は損失、資産、負債その他の項目の金額に関する情報
前連結会計年度(自 2024年7月1日至 2025年6月30日)
(単位:百万円)
報告セグメント
連結財務
諸表計上
額(注)2
調整額
(注)1
パッケージ
ングプラン
ト事業
メカトロ
システム
事業
農業用設備
事業
外部顧客への売上高
80,081
37,765
11,170
129,017
−
129,017
セグメント間の内部売上高
又は振替高
1,055
1,067
1,254
3,377
△3,377
−
計
81,136
38,832
12,425
132,394
△3,377
129,017
セグメント利益
12,574
2,341
1,042
15,958
△2,209
13,749
セグメント資産
67,970
37,472
15,571
121,014
38,412
159,426
減価償却費
1,895
818
199
2,913
108
3,022
有形固定資産及び
無形固定資産の増加額
2,275
762
4,005
7,043
100
7,143
計
売上高
その他の項目
(注)1.調整額の内容は、以下のとおりであります。
(1)セグメント利益の調整額△2,209百万円には、各報告セグメントに配分していない全社費用△2,215百万円お
よび棚卸資産等の調整額5百万円が含まれております。全社費用は、主に報告セグメントに帰属しない一般
管理費であります。
(2)セグメント資産の調整額38,412百万円には、各報告セグメントに配分していない全社資産38,485百万円およ
び棚卸資産等の調整額△73百万円が含まれております。全社資産は、主に報告セグメントに帰属しない余資
運用資金(現金及び預金、投資有価証券)および管理部門に係る資産であります。
(3)減価償却費の調整額は、全社資産に係る減価償却費であります。
(4)有形固定資産及び無形固定資産の増加額の調整額は、全社資産の増加額であります。
74/100
EDINET提出書類
澁谷工業株式会社(E01666)
有価証券報告書
2.セグメント利益は、連結財務諸表の営業損益と調整を行っております。
当連結会計年度(自
2025年7月1日
至
2026年6月30日)
(単位:百万円)
報告セグメント
連結財務
諸表計上
額(注)2
調整額
(注)1
パッケージ
ングプラン
ト事業
メカトロ
システム
事業
農業用設備
事業
84,041
38,997
12,574
135,613
−
135,613
584
965
842
2,391
△2,391
−
計
84,625
39,963
13,416
138,005
△2,391
135,613
セグメント利益
13,239
1,781
520
15,541
△2,460
13,081
セグメント資産
73,510
44,790
16,587
134,888
38,391
173,280
減価償却費
1,909
878
519
3,307
124
3,431
有形固定資産及び
無形固定資産の増加額
5,066
2,410
250
7,728
274
8,002
計
売上高
外部顧客への売上高
セグメント間の内部売上高
又は振替高
その他の項目
(注)1.調整額の内容は、以下のとおりであります。
(1)セグメント利益の調整額△2,460百万円には、各報告セグメントに配分していない全社費用△2,469百万円お
よび棚卸資産等の調整額9百万円が含まれております。全社費用は、主に報告セグメントに帰属しない一般
管理費であります。
(2)セグメント資産の調整額38,391百万円には、各報告セグメントに配分していない全社資産38,458百万円およ
び棚卸資産等の調整額△66百万円が含まれております。全社資産は、主に報告セグメントに帰属しない余資
運用資金(現金及び預金、投資有価証券)および管理部門に係る資産であります。
(3)減価償却費の調整額は、全社資産に係る減価償却費であります。
(4)有形固定資産及び無形固定資産の増加額の調整額は、全社資産の増加額であります。
2.セグメント利益は、連結財務諸表の営業損益と調整を行っております。
75/100
EDINET提出書類
澁谷工業株式会社(E01666)
有価証券報告書
【関連情報】
前連結会計年度(自 2024年7月1日
至
2025年6月30日)
1.製品及びサービスごとの情報
セグメント情報に同様の情報を開示しているため、記載を省略しております。
2.地域ごとの情報
(1)売上高
(単位:百万円)
日本
中国
75,626
アジア
12,817
北米
17,895
その他
15,408
7,270
合計
129,017
(注)売上高は顧客の所在地を基礎とし、国又は地域に分類しております。
(2)有形固定資産
本邦に所在している有形固定資産の金額が連結貸借対照表の有形固定資産の金額の90%を超えるため、記載を省
略しております。
3.主要な顧客ごとの情報
(単位:百万円)
顧客の名称または氏名
売上高
ニプロ株式会社
関連するセグメント名
21,841
当連結会計年度(自 2025年7月1日
至
メカトロシステム事業および
パッケージングプラント事業
2026年6月30日)
1.製品及びサービスごとの情報
セグメント情報に同様の情報を開示しているため、記載を省略しております。
2.地域ごとの情報
(1)売上高
(単位:百万円)
日本
中国
80,271
15,506
アジア
北米
18,701
その他
13,288
7,846
合計
135,613
(注)売上高は顧客の所在地を基礎とし、国又は地域に分類しております。
(2)有形固定資産
本邦に所在している有形固定資産の金額が連結貸借対照表の有形固定資産の金額の90%を超えるため、記載を省
略しております。
3.主要な顧客ごとの情報
(単位:百万円)
顧客の名称または氏名
売上高
関連するセグメント名
ニプロ株式会社
22,850
メカトロシステム事業および
パッケージングプラント事業
株式会社アセプティック・システム
15,117
パッケージングプラント事業
76/100
EDINET提出書類
澁谷工業株式会社(E01666)
有価証券報告書
【報告セグメントごとの固定資産の減損損失に関する情報】
前連結会計年度(自 2024年7月1日至 2025年6月30日)
該当事項はありません。
当連結会計年度(自 2025年7月1日
至
2026年6月30日)
該当事項はありません。
【報告セグメントごとののれんの償却額及び未償却残高に関する情報】
前連結会計年度(自 2024年7月1日至 2025年6月30日)
該当事項はありません。
当連結会計年度(自 2025年7月1日
至
2026年6月30日)
該当事項はありません。
【報告セグメントごとの負ののれん発生益に関する情報】
前連結会計年度(自 2024年7月1日至 2025年6月30日)
該当事項はありません。
当連結会計年度(自 2025年7月1日
至
2026年6月30日)
至
2025年6月30日)
該当事項はありません。
【関連当事者情報】
前連結会計年度(自 2024年7月1日
重要性が乏しいため、注記を省略しております。
当連結会計年度(自 2025年7月1日至 2026年6月30日)
重要性が乏しいため、注記を省略しております。
77/100
EDINET提出書類
澁谷工業株式会社(E01666)
有価証券報告書
(1株当たり情報)
前連結会計年度
2024年7月1日
2025年6月30日)
当連結会計年度
2025年7月1日
2026年6月30日)
(自
至
(自
至
1株当たり純資産額
3,900円84銭
1株当たり純資産額
4,304円28銭
1株当たり当期純利益
363円34銭
1株当たり当期純利益
369円52銭
なお、潜在株式調整後1株当たり当期純利益について
は、潜在株式が存在しないため記載しておりません。
なお、潜在株式調整後1株当たり当期純利益について
は、潜在株式が存在しないため記載しておりません。
(注)1.1株当たり純資産額の算定上の基礎は、以下のとおりであります。
前連結会計年度
(2025年6月30日)
当連結会計年度
(2026年6月30日)
107,930百万円
119,091百万円
純資産の部の合計額
純資産の部の合計額から控除する金額
8百万円
8百万円
(うち非支配株主持分)
(8百万円)
(8百万円)
107,921百万円
119,083百万円
27,666千株
27,666千株
普通株式に係る期末の純資産額
1株当たり純資産額の算定に用いられた
期末の普通株式の数
2.1株当たり当期純利益の算定上の基礎は、以下のとおりであります。
前連結会計年度
2024年7月1日
2025年6月30日)
(自
至
親会社株主に帰属する当期純利益
普通株主に帰属しない金額
普通株式に係る親会社株主に帰属する当期純
利益
普通株式の期中平均株式数
希薄化効果を有しないため、潜在株式調整後
1株当たり当期純利益の算定に含めなかった
潜在株式の概要
(重要な後発事象)
該当事項はありません。
78/100
当連結会計年度
2025年7月1日
2026年6月30日)
(自
至
10,052百万円
10,223百万円
−
−
10,052百万円
10,223百万円
27,666千株
27,666千株
−
−
EDINET提出書類
澁谷工業株式会社(E01666)
有価証券報告書
⑤【連結附属明細表】
【社債明細表】
該当事項はありません。
【借入金等明細表】
当期首残高
(百万円)
当期末残高
(百万円)
平均利率
(%)
短期借入金
−
−
−
−
1年以内に返済予定の長期借入金
907
863
0.66
−
1年以内に返済予定のリース債務
0
0
−
−
長期借入金
(1年以内に返済予定のものを除く)
2,789
1,925
0.72
2027年7月〜
2030年9月
リース債務
(1年以内に返済予定のものを除く)
1
0
−
2027年7月〜
2028年7月
その他有利子負債
−
−
−
−
3,698
2,790
−
−
区分
合計
返済期限
(注)1.平均利率については、当期末の残高および利率を用いた加重平均利率を記載しております。
2.リース債務の平均利率については、リース料総額に含まれる利息相当額を控除する前の金額でリース債務を
連結貸借対照表に計上しているため、記載しておりません。
3.長期借入金およびリース債務(1年以内に返済予定のものを除く)の連結決算日後5年以内における返済予
定額は、次のとおりであります。
1年超2年以内
(百万円)
2年超3年以内
(百万円)
3年超4年以内
(百万円)
4年超5年以内
(百万円)
長期借入金
636
577
577
134
リース債務
0
0
−
−
【資産除去債務明細表】
資産除去債務の総額に重要性が乏しいため、記載を省略しております。
(2)【その他】
当連結会計年度における半期情報等
中間連結会計期間
当連結会計年度
売上高(百万円)
63,063
135,613
税金等調整前中間(当期)純
利益(百万円)
5,748
14,317
親会社株主に帰属する中間
(当期)純利益(百万円)
4,023
10,223
1株当たり中間(当期)
純利益(円)
145.43
369.52
79/100
EDINET提出書類
澁谷工業株式会社(E01666)
有価証券報告書
2【財務諸表等】
(1)【財務諸表】
①【貸借対照表】
(単位:百万円)
前事業年度
(2025年6月30日)
資産の部
流動資産
現金及び預金
受取手形
電子記録債権
売掛金
契約資産
製品
仕掛品
原材料及び貯蔵品
前払費用
短期貸付金
その他
貸倒引当金
流動資産合計
固定資産
有形固定資産
建物
構築物
機械及び装置
車両運搬具
工具、器具及び備品
土地
建設仮勘定
有形固定資産合計
無形固定資産
ソフトウエア
その他
無形固定資産合計
投資その他の資産
投資有価証券
関係会社株式
関係会社出資金
長期貸付金
前払年金費用
繰延税金資産
その他
貸倒引当金
投資その他の資産合計
固定資産合計
資産合計
80/100
当事業年度
(2026年6月30日)
33,862
1,371
8,375
※1 12,151
※1 6,836
270
6,804
4,300
419
※1 4,124
※1 3,070
△14
81,573
31,562
469
12,631
※1 13,918
※1 9,282
207
5,961
4,734
225
※1 3,524
※1 2,019
△14
84,522
13,301
384
2,021
7
1,080
10,256
686
※2 27,738
13,746
379
2,027
3
1,370
10,256
4,974
※2 32,758
313
21
335
265
18
284
3,617
4,307
376
※1 4,601
3,462
676
375
△19
17,397
45,472
127,045
5,504
4,307
535
※1 3,827
3,538
−
352
△19
18,046
51,089
135,611
EDINET提出書類
澁谷工業株式会社(E01666)
有価証券報告書
(単位:百万円)
前事業年度
(2025年6月30日)
負債の部
流動負債
電子記録債務
買掛金
短期借入金
未払金
未払費用
未払法人税等
契約負債
預り金
賞与引当金
受注損失引当金
その他
流動負債合計
固定負債
長期借入金
資産除去債務
退職給付引当金
役員退職慰労引当金
繰延税金負債
固定負債合計
負債合計
純資産の部
株主資本
資本金
資本剰余金
資本準備金
その他資本剰余金
資本剰余金合計
利益剰余金
利益準備金
その他利益剰余金
配当準備積立金
固定資産圧縮積立金
別途積立金
繰越利益剰余金
利益剰余金合計
自己株式
株主資本合計
評価・換算差額等
その他有価証券評価差額金
評価・換算差額等合計
純資産合計
負債純資産合計
当事業年度
(2026年6月30日)
※1 1,730
1,617
※1 11,998
※1 9,688
907
1,941
8,107
※1 145
331
68
262
31,057
863
4,438
※1 4,063
1,540
9,230
164
349
0
1,000
32,958
2,789
21
5,531
67
−
8,409
39,467
1,925
22
5,700
33
129
7,810
40,768
11,392
11,392
9,842
515
10,358
9,842
515
10,358
662
662
1,600
1,471
2,500
58,578
64,811
△442
86,119
1,600
1,540
2,500
64,484
70,787
△442
92,094
1,458
1,458
87,578
127,045
2,748
2,748
94,843
135,611
※1 507
※1 5,056
81/100
EDINET提出書類
澁谷工業株式会社(E01666)
有価証券報告書
②【損益計算書】
(単位:百万円)
(自
至
前事業年度
2024年7月1日
2025年6月30日)
(自
至
当事業年度
2025年7月1日
2026年6月30日)
売上高
※1 94,069
※1 99,726
売上原価
売上総利益
※1 77,750
※1 82,511
16,318
※1,※2 6,434
※1,※2 6,564
9,884
10,650
※1 1,539
※1 786
※1 130
※1 272
1,669
1,058
28
72
101
11,452
22
48
70
11,638
362
10
373
240
60
300
53
53
11,773
3,242
△253
2,989
8,784
51
51
11,887
3,015
198
3,214
8,672
販売費及び一般管理費
営業利益
営業外収益
受取利息及び受取配当金
その他
営業外収益合計
営業外費用
支払利息
その他
営業外費用合計
経常利益
特別利益
補助金収入
その他
特別利益合計
特別損失
その他
特別損失合計
税引前当期純利益
法人税、住民税及び事業税
法人税等調整額
法人税等合計
当期純利益
82/100
17,215
EDINET提出書類
澁谷工業株式会社(E01666)
有価証券報告書
③【株主資本等変動計算書】
前事業年度(自 2024年7月1日
至
2025年6月30日)
(単位:百万円)
株主資本
資本剰余金
利益剰余金
その他利益剰余金
資本金
当期首残高
資本
準備金
その他
資本
剰余金
資本
剰余金
合計
利益
準備金
9,842
515
10,358
662
11,392
利益
剰余金
合計
配当準備
積立金
固定資産
圧縮
積立金
別途
積立金
繰越利益
剰余金
1,600
1,333
2,500
52,836
58,932
当期変動額
固定資産圧縮積立金の
積立
221
△221
−
固定資産圧縮積立金の
取崩
△64
64
−
税率変更による積立金
の調整額
△18
18
−
剰余金の配当
△2,904
△2,904
当期純利益
8,784
8,784
自己株式の取得
株主資本以外の項目の
当期変動額(純額)
当期変動額合計
当期末残高
−
−
−
−
−
−
137
−
5,741
5,879
11,392
9,842
515
10,358
662
1,600
1,471
2,500
58,578
64,811
株主資本
当期首残高
評価・換算差額等
自己株式
株主資本
合計
△441
80,242
その他評価・換算
有価証券
差額等
評価差額金
合計
1,082
1,082
純資産
合計
81,324
当期変動額
固定資産圧縮積立金の
積立
−
−
固定資産圧縮積立金の
取崩
−
−
税率変更による積立金
の調整額
−
−
剰余金の配当
△2,904
△2,904
当期純利益
8,784
8,784
△1
△1
自己株式の取得
△1
株主資本以外の項目の
当期変動額(純額)
当期変動額合計
当期末残高
375
375
375
△1
5,877
375
375
6,253
△442
86,119
1,458
1,458
87,578
83/100
EDINET提出書類
澁谷工業株式会社(E01666)
有価証券報告書
当事業年度(自
2025年7月1日
至
2026年6月30日)
(単位:百万円)
株主資本
資本剰余金
利益剰余金
その他利益剰余金
資本金
当期首残高
資本
準備金
その他
資本
剰余金
資本
剰余金
合計
利益
準備金
9,842
515
10,358
662
11,392
利益
剰余金
合計
配当準備
積立金
固定資産
圧縮
積立金
別途
積立金
繰越利益
剰余金
1,600
1,471
2,500
58,578
64,811
当期変動額
固定資産圧縮積立金の
積立
135
△135
−
固定資産圧縮積立金の
取崩
△66
66
−
剰余金の配当
△2,697
△2,697
当期純利益
8,672
8,672
自己株式の取得
株主資本以外の項目の
当期変動額(純額)
当期変動額合計
当期末残高
−
−
−
−
−
−
69
−
5,906
5,975
11,392
9,842
515
10,358
662
1,600
1,540
2,500
64,484
70,787
株主資本
当期首残高
評価・換算差額等
自己株式
株主資本
合計
△442
86,119
その他評価・換算
有価証券
差額等
評価差額金
合計
1,458
1,458
純資産
合計
87,578
当期変動額
固定資産圧縮積立金の
積立
−
−
固定資産圧縮積立金の
取崩
−
−
剰余金の配当
△2,697
△2,697
当期純利益
8,672
8,672
△0
△0
自己株式の取得
△0
株主資本以外の項目の
当期変動額(純額)
当期変動額合計
当期末残高
1,289
1,289
1,289
△0
5,975
1,289
1,289
7,265
△442
92,094
2,748
2,748
94,843
84/100
EDINET提出書類
澁谷工業株式会社(E01666)
有価証券報告書
【注記事項】
(重要な会計方針)
1.資産の評価基準及び評価方法
(1) 有価証券
① 子会社株式
移動平均法による原価法
② その他有価証券
市場価格のない株式等以外のもの
時価法(評価差額は全部純資産直入法により処理し、売却原価は移動平均法により算定)
市場価格のない株式等
移動平均法による原価法
なお、投資事業有限責任組合およびそれに類する組合への出資(金融商品取引法第2条第2項により有価
証券とみなされるもの)については、組合契約に規定される決算報告日に応じて入手可能な最近の決算書を
基礎とし、持分相当額を純額で取り込む方法によっております。
(2) デリバティブ
時価法
(3) 棚卸資産
① 原材料、貯蔵品
総平均法による原価法(貸借対照表価額は収益性の低下に基づく簿価切下げの方法により算定)
② 製品、仕掛品
個別法による原価法(貸借対照表価額は収益性の低下に基づく簿価切下げの方法により算定)
2.固定資産の減価償却の方法
(1) 有形固定資産
定率法
なお、1998年4月以降に取得した建物、2016年4月以降に取得した建物附属設備および構築物については、定額
法によっており、また取得価額10万円以上20万円未満の減価償却資産については、3年間で均等償却する方法に
よっております。
(2) 無形固定資産
定額法
なお、自社利用のソフトウェアについては、社内における利用可能期間(主として5年)に基づく定額法を採用
しております。
3.引当金の計上基準
(1) 貸倒引当金
債権の貸倒れによる損失に備えるため、一般債権については貸倒実績率により、貸倒懸念債権等特定の債権につ
いては個別に回収可能性を検討し、回収不能見込額を計上しております。
(2) 賞与引当金
従業員賞与の支給に備えるため、将来の支給見込額のうち当事業年度の負担額を計上しております。
(3) 受注損失引当金
受注契約に係る将来の損失に備えるため、当事業年度末において損失の発生が見込まれ、かつその金額を合理的
に見積ることが可能な受注案件について、その損失見込額を計上しております。
(4) 退職給付引当金
従業員の退職給付に備えるため、当事業年度末における退職給付債務および年金資産の見込額に基づき、当事業
年度末において発生していると認められる額を計上しております。
退職給付債務の算定にあたり、退職給付見込額を当事業年度末までの期間に帰属させる方法については、給付算
定式基準によっております。
数理計算上の差異については、その発生時の従業員の平均残存勤務期間以内の一定の年数(12年)による定額法
により按分した額をそれぞれ発生の翌事業年度から費用処理しております。
過去勤務費用については、その発生時の従業員の平均残存勤務期間以内の一定の年数(12年)による定額法によ
り費用処理しております。
(5) 役員退職慰労引当金
役員退職金の支出に備えるため、内規に基づく期末要支給額を計上しております。
85/100
EDINET提出書類
澁谷工業株式会社(E01666)
有価証券報告書
4.収益及び費用の計上基準
当社の顧客との契約から生じる収益に関する主要な履行義務の内容および当該履行義務を充足する通常の時点
(収益を認識する通常の時点)は、以下の通りであります。
当社は、パッケージングプラント事業、メカトロシステム事業にかかる製品の製造販売を主要な事業としてお
り、いずれの事業においても、財又はサービスに対する支配が顧客に一定の期間にわたり移転する工事契約の場合
には、財又はサービスを顧客に移転する履行義務を充足するにつれて、一定の期間にわたり収益を認識しておりま
す。一定の期間にわたり充足される履行義務は、進捗度を合理的に見積ることができる場合は見積総原価に対する
発生原価の割合(インプット法)により収益を認識し、履行義務の充足に係る進捗度を合理的に見積ることができ
ない場合で、かつ発生する費用を回収することが見込まれる場合は、原価回収基準により収益を認識しておりま
す。なお、期間がごく短い受注契約については代替的な取扱いを適用し、一定の期間にわたり収益を認識せず、検
収完了時に収益を認識しております。また、「収益認識に関する会計基準の適用指針」第98項に定める代替的な取
扱いを適用し、出荷時から製品の支配が顧客に移転される時までの期間が通常の期間である国内販売の場合は、出
荷時に収益を認識しております。これらの履行義務に対する対価は、履行義務の充足から概ね1年以内に回収して
おり、重要な金融要素は含んでおりません。
5.その他財務諸表の作成のための基本となる重要な事項
(1) ヘッジ会計の処理
繰延ヘッジ処理によっております。なお、振当処理の要件を満たしている為替予約および通貨オプションについ
ては振当処理によっております。
(2) 退職給付に係る会計処理
退職給付に係る未認識数理計算上の差異および未認識過去勤務費用の未処理額の会計処理の方法は、連結財務諸
表におけるこれらの会計処理の方法と異なっております。
(3) 消費税等の会計処理
控除対象外消費税等は、発生事業年度の期間費用としております。
(重要な会計上の見積り)
1.一定の期間にわたり充足される履行義務に係る総原価の見積り
(1) 当事業年度の財務諸表に計上した一定の期間にわたり充足される履行義務に係る売上高
(単位:百万円)
売上高
前事業年度
当事業年度
38,081
41,168
(2) 識別した項目に係る重要な会計上の見積りの内容に関する情報
(1)の金額の算出方法は、連結財務諸表「注記事項(重要な会計上の見積り)1.一定の期間にわたり充足される
履行義務に係る総原価の見積り(2)」の内容と同一であります。
2.棚卸資産の評価
(1) 当事業年度の財務諸表に計上した金額
(単位:百万円)
前事業年度
当事業年度
製品
270
207
仕掛品
6,804
5,961
原材料及び貯蔵品
4,300
4,734
(注)棚卸資産評価損計上額は、前事業年度は203百万円、当事業年度は142百万円であります。
(2) 識別した項目に係る重要な会計上の見積りの内容に関する情報
(1)の金額の算出方法は、連結財務諸表「注記事項(重要な会計上の見積り)2.棚卸資産の評価(2)」の内容と
同一であります。
86/100
EDINET提出書類
澁谷工業株式会社(E01666)
有価証券報告書
(表示方法の変更)
(税効果会計に関する注記)
前事業年度において、繰延税金負債の「その他」に含めて表示しておりました「その他有価証券評価差額金」は、金額
の重要性が増したため、区分掲記することに変更しました。この表示方法の変更を反映させるため、前事業年度の注記の
組替えを行っております。
この結果、前事業年度の注記において、「繰延税金負債」の「その他」△450百万円は、「その他有価証券評価差額
金」△423百万円、「その他」△27百万円として組み替えております。
(貸借対照表関係)
※1.関係会社項目
関係会社に対する金銭債権及び金銭債務
前事業年度
(2025年6月30日)
短期金銭債権
長期金銭債権
短期金銭債務
4,668百万円
4,601
940
当事業年度
(2026年6月30日)
4,030百万円
3,827
918
※2.有形固定資産の取得価額から直接控除している圧縮記帳額
前事業年度
(2025年6月30日)
有形固定資産
383百万円
87/100
当事業年度
(2026年6月30日)
383百万円
EDINET提出書類
澁谷工業株式会社(E01666)
有価証券報告書
(損益計算書関係)
※1.関係会社との取引に係るものが次のとおり含まれております。
前事業年度
(自 2024年7月1日
至 2025年6月30日)
営業取引による取引高
(自
至
当事業年度
2025年7月1日
2026年6月30日)
売上高
4,766百万円
3,080百万円
仕入高
7,034
7,185
629
2,511
632
691
その他の営業取引高
営業取引以外の取引による取引高
※2.販売費に属する費用のおおよその割合は前事業年度27%、当事業年度28%、一般管理費に属する費用のおおよそ
の割合は前事業年度73%、当事業年度72%であります。
販売費及び一般管理費のうち主要な費目および金額は次のとおりであります。
前事業年度
当事業年度
(自 2024年7月1日
(自 2025年7月1日
至 2025年6月30日)
至 2026年6月30日)
給料
1,670百万円
1,730百万円
1,130
1,124
荷造運搬費
減価償却費
173
187
貸倒引当金繰入額
△1
0
退職給付費用
30
81
役員退職慰労引当金繰入額
8
7
賞与引当金繰入額
51
52
(有価証券関係)
前事業年度(2025年6月30日)
子会社株式は、市場価格のない株式等のため、時価を記載しておりません。
なお、市場価格のない子会社株式の貸借対照表計上額は4,307百万円であります。
当事業年度(2026年6月30日)
子会社株式は、市場価格のない株式等のため、時価を記載しておりません。
なお、市場価格のない子会社株式の貸借対照表計上額は4,307百万円であります。
88/100
EDINET提出書類
澁谷工業株式会社(E01666)
有価証券報告書
(税効果会計関係)
1.繰延税金資産及び繰延税金負債の発生の主な原因別の内訳
前事業年度
(2025年6月30日)
当事業年度
(2026年6月30日)
繰延税金資産
棚卸資産評価損
389百万円
445百万円
投資有価証券評価損
221
221
関係会社株式評価損
347
347
未払費用
450
229
未払事業税
124
110
賞与引当金
100
109
1,731
1,787
21
10
退職給付引当金
役員退職慰労引当金
155
124
繰延税金資産小計
3,541
3,385
将来減算一時差異等の合計に係る評価性引当額
△660
△643
繰延税金資産合計
2,881
2,742
その他
繰延税金負債
前払年金費用
△1,083
△1,109
その他有価証券評価差額金
△423
△1,030
固定資産圧縮積立金
△670
△703
その他
△27
△28
△2,204
△2,871
676
△129
繰延税金負債合計
繰延税金資産(△は負債)の純額
2.法定実効税率と税効果会計適用後の法人税等の負担率との間に重要な差異があるときの、当該差異の原因となった
主要な項目別の内訳
前事業年度
(2025年6月30日)
法定実効税率
当事業年度
(2026年6月30日)
30.5% 法定実効税率
(調整)
30.5%
(調整)
交際費等永久に損金に算入されない項目
0.1
交際費等永久に損金に算入されない項目
0.1
受取配当金等永久に益金に算入されない
項目
△3.6
受取配当金等永久に益金に算入されない
項目
△1.3
住民税均等割
試験研究費等の税額控除
評価性引当額の増減
その他
税効果会計適用後の法人税等の負担率
0.1
△1.7
0.1
△0.1
25.4
住民税均等割
0.1
試験研究費等の税額控除
△2.2
評価性引当額の増減
△0.2
その他
△0.0
税効果会計適用後の法人税等の負担率
27.0
3.法人税および地方法人税の会計処理またはこれらに関する税効果会計の会計処理
当社は、グループ通算制度を適用しており、「グループ通算制度を適用する場合の会計処理及び開示に関する取扱
い」(実務対応報告第42号 2021年8月12日)に従って、法人税および地方法人税ならびに税効果会計の会計処理お
よび開示を行っております。
89/100
EDINET提出書類
澁谷工業株式会社(E01666)
有価証券報告書
(収益認識関係)
1.顧客との契約から生じる収益を分解した情報
「収益認識に関する会計基準」(企業会計基準第29号)第80−26項の定めに従って注記を省略しております。
2.顧客との契約から生じる収益を理解するための基礎となる情報
「注記事項(重要な会計方針)4.収益及び費用の計上基準」に記載のとおりであります。
3.顧客との契約に基づく履行義務の充足と当該契約から生じるキャッシュ・フローとの関係並びに当事業年度末にお
いて存在する顧客との契約から翌事業年度以降に認識すると見込まれる収益の金額及び時期に関する情報
「収益認識に関する会計基準」(企業会計基準第29号)第80−26項の定めに従って注記を省略しております。
(重要な後発事象)
該当事項はありません。
90/100
EDINET提出書類
澁谷工業株式会社(E01666)
有価証券報告書
④【附属明細表】
【有形固定資産等明細表】
(単位:百万円)
区
資産の
種類
分
有形固
定資産
建物
当期
増加額
当期
減少額
当期
償却額
当期末
残高
減価償却
累計額
13,301
1,273
0
828
13,746
19,856
384
45
−
50
379
1,432
2,021
464
10
448
2,027
7,620
7
1
−
5
3
79
工具、器具及び備品
1,080
998
0
708
1,370
7,423
土地
10,256
−
−
−
10,256
−
建設仮勘定
686
4,622
333
−
4,974
−
計
27,738
7,405
345
2,041
32,758
36,411
ソフトウエア
313
74
−
122
265
−
その他
21
−
−
3
18
−
335
74
−
126
284
−
構築物
機械及び装置
車両運搬具
無形固
定資産
当期首
残高
計
(注)「建設仮勘定」の「当期増加額」のうち、1,641百万円は能美第2機械工場、931百万円はSX森本工場、
1,795百万円は医療機若宮B棟に係るものであります。
【引当金明細表】
(単位:百万円)
科目
当期首残高
当期増加額
当期減少額
当期末残高
貸倒引当金
33
0
−
33
賞与引当金
331
349
331
349
受注損失引当金
68
0
68
0
役員退職慰労引当金
67
7
42
33
(2)【主な資産及び負債の内容】
連結財務諸表を作成しているため、記載を省略しております。
(3)【その他】
該当事項はありません。
91/100
EDINET提出書類
澁谷工業株式会社(E01666)
有価証券報告書
第6【提出会社の株式事務の概要】
事業年度
7月1日から6月30日まで
定時株主総会
9月中
基準日
6月30日
剰余金の配当の基準日
12月31日
6月30日
1単元の株式数
100株
単元未満株式の買取り・買増し
取扱場所
株主名簿管理人
(特別口座)
大阪府大阪市中央区北浜四丁目5番33号
三井住友信託銀行株式会社証券代行部
(特別口座)
大阪府大阪市中央区北浜四丁目5番33号
三井住友信託銀行株式会社
取次所
―
買取・買増手数料
株式の売買の委託に係る手数料相当額として別途定める金額
公告掲載方法
当会社の公告方法は、電子公告とする。ただし、事故その他やむを得ない事由に
よって電子公告とすることができない場合は、日本経済新聞に掲載して行う。
なお、電子公告は当会社のホームページに掲載しており、そのアドレスは次のと
おりである。
https://www.shibuya.co.jp/ir/koukoku.html
株主に対する特典
なし
92/100
EDINET提出書類
澁谷工業株式会社(E01666)
有価証券報告書
第7【提出会社の参考情報】
1【提出会社の親会社等の情報】
当社には、親会社等はありません。
2【その他の参考情報】
当事業年度の開始日から有価証券報告書提出日までの間に、次の書類を提出しております。
(1)有価証券報告書およびその添付書類ならびに確認書
事業年度(第77期)(自 2024年7月1日至 2025年6月30日)2025年9月24日関東財務局長に提出
(2)内部統制報告書およびその添付書類
事業年度(第77期)(自 2024年7月1日
(3)半期報告書および確認書
(第78期中)(自 2025年7月1日
至 2025年6月30日)2025年9月24日関東財務局長に提出
至 2025年12月31日)2026年2月13日関東財務局長に提出
(4)臨時報告書
2025年9月29日関東財務局長に提出
企業内容等の開示に関する内閣府令第19条第2項第9号の2(株主総会における議決権行使の結果)に基づ
く臨時報告書であります。
93/100
EDINET提出書類
澁谷工業株式会社(E01666)
有価証券報告書
第二部【提出会社の保証会社等の情報】
該当事項はありません。
94/100
EDINET提出書類
澁谷工業株式会社(E01666)
有価証券報告書
独立監査人の監査報告書及び内部統制監査報告書
2026年9月24日
澁谷工業株式会社
取締役会
御中
仰星監査法人
東京事務所
指定社員
業務執行社員
公認会計士
川
﨑
指定社員
業務執行社員
公認会計士
中
山
浩
孝
一
<連結財務諸表監査>
監査意見
当監査法人は、金融商品取引法第193条の2第1項の規定に基づく監査証明を行うため、「経理の状況」に掲げられて
いる澁谷工業株式会社の2025年7月1日から2026年6月30日までの連結会計年度の連結財務諸表、すなわち、連結貸借対
照表、連結損益計算書、連結包括利益計算書、連結株主資本等変動計算書、連結キャッシュ・フロー計算書、連結財務諸
表作成のための基本となる重要な事項、その他の注記及び連結附属明細表について監査を行った。
当監査法人は、上記の連結財務諸表が、我が国において一般に公正妥当と認められる企業会計の基準に準拠して、澁谷
工業株式会社及び連結子会社の2026年6月30日現在の財政状態並びに同日をもって終了する連結会計年度の経営成績及び
キャッシュ・フローの状況を、全ての重要な点において適正に表示しているものと認める。
監査意見の根拠
当監査法人は、我が国において一般に公正妥当と認められる監査の基準に準拠して監査を行った。監査の基準における
当監査法人の責任は、「連結財務諸表監査における監査人の責任」に記載されている。当監査法人は、我が国における職
業倫理に関する規定(社会的影響度の高い事業体の財務諸表監査に適用される規定を含む。)に従って、会社及び連結子
会社から独立しており、また、監査人としてのその他の倫理上の責任を果たしている。当監査法人は、意見表明の基礎と
なる十分かつ適切な監査証拠を入手したと判断している。
95/100
EDINET提出書類
澁谷工業株式会社(E01666)
有価証券報告書
監査上の主要な検討事項
監査上の主要な検討事項とは、当連結会計年度の連結財務諸表の監査において、監査人が職業的専門家として特に重要
であると判断した事項である。監査上の主要な検討事項は、連結財務諸表全体に対する監査の実施過程及び監査意見の形
成において対応した事項であり、当監査法人は、当該事項に対して個別に意見を表明するものではない。
一定の期間にわたり充足される履行義務に係る総原価の見積り
監査上の主要な検討事項の内容及び決定理由
監査上の対応
「第5【経理の状況】 1【連結財務諸表等】【注記
事項】 (重要な会計上の見積り)1.一定の期間にわた
り充足される履行義務に係る総原価の見積り」に記載のと
おり、会社グループは、一定の期間にわたり充足される履
行義務については、期間がごく短い工事を除き、履行義務
の充足に係る進捗度を見積り、当該進捗度に基づき一定の
期間にわたり収益を認識している。履行義務の充足に係る
進捗度の見積り方法は、進捗度を合理的に見積ることがで
きる場合は見積総原価に対する発生原価の割合(インプッ
ト法)により収益を認識し、進捗度を合理的に見積ること
ができない場合で、かつ発生する費用を回収することが見
込まれる場合は、原価回収基準により収益を認識してい
る。見積総原価は契約ごとに機種構成や仕様を確認し、過
去の類似の機種や仕様の実績から必要な材料費、工数など
を見積り算定している。見積総原価には、材料価格や必要
工数の変動や仕様変更に伴い事後的に変動するなどの不確
実性を伴うため、実績との間に乖離が生じた場合は、翌連
結会計年度以降の連結財務諸表に重要な影響を与える可能
性がある。
当連結会計年度は、一定の期間にわたり充足される履行
義務に係る売上高を58,579百万円計上している。
総原価の見積りは過去の類似の機種や仕様の実績をもと
にした経営者による主観的な判断を伴うものであり、ま
た、金額的に重要であることから、当監査法人は当該事項
を監査上の主要な検討事項に該当するものと判断した。
当監査法人は、一定の期間にわたり充足される履行義務
に係る総原価の見積りを検討するにあたり、主に以下の監
査手続を実施した。
・見積総原価の承認に係る会社グループの内部統制の整備
及び運用状況の有効性を評価した。
・当連結会計年度末までに完成した案件を対象に、前連結
会計年度末時点の見積総原価と実際発生原価の比較分析を
実施した。
・生産部門の責任者によって承認された「総原価見積報告
書」等と見積総原価が一致しているかを検討した。
・事後的に見積総原価の見直しがあった場合、関連資料等
を閲覧し、見直しの合理性を検討した。
その他の記載内容
その他の記載内容は、有価証券報告書に含まれる情報のうち、連結財務諸表及び財務諸表並びにこれらの監査報告書以
外の情報である。経営者の責任は、その他の記載内容を作成し開示することにある。また、監査役及び監査役会の責任
は、その他の記載内容の報告プロセスの整備及び運用における取締役の職務の執行を監視することにある。
当監査法人の連結財務諸表に対する監査意見の対象にはその他の記載内容は含まれておらず、当監査法人はその他の記
載内容に対して意見を表明するものではない。
連結財務諸表監査における当監査法人の責任は、その他の記載内容を通読し、通読の過程において、その他の記載内容
と連結財務諸表又は当監査法人が監査の過程で得た知識との間に重要な相違があるかどうか検討すること、また、そのよ
うな重要な相違以外にその他の記載内容に重要な誤りの兆候があるかどうか注意を払うことにある。
当監査法人は、実施した作業に基づき、その他の記載内容に重要な誤りがあると判断した場合には、その事実を報告す
ることが求められている。
その他の記載内容に関して、当監査法人が報告すべき事項はない。
連結財務諸表に対する経営者並びに監査役及び監査役会の責任
経営者の責任は、我が国において一般に公正妥当と認められる企業会計の基準に準拠して連結財務諸表を作成し適正に
表示することにある。これには、不正又は誤謬による重要な虚偽表示のない連結財務諸表を作成し適正に表示するために
経営者が必要と判断した内部統制を整備及び運用することが含まれる。
連結財務諸表を作成するに当たり、経営者は、継続企業の前提に基づき連結財務諸表を作成することが適切であるかど
うかを評価し、我が国において一般に公正妥当と認められる企業会計の基準に基づいて継続企業に関する事項を開示する
必要がある場合には当該事項を開示する責任がある。
監査役及び監査役会の責任は、財務報告プロセスの整備及び運用における取締役の職務の執行を監視することにある。
96/100
EDINET提出書類
澁谷工業株式会社(E01666)
有価証券報告書
連結財務諸表監査における監査人の責任
監査人の責任は、監査人が実施した監査に基づいて、全体としての連結財務諸表に不正又は誤謬による重要な虚偽表示
がないかどうかについて合理的な保証を得て、監査報告書において独立の立場から連結財務諸表に対する意見を表明する
ことにある。虚偽表示は、不正又は誤謬により発生する可能性があり、個別に又は集計すると、連結財務諸表の利用者の
意思決定に影響を与えると合理的に見込まれる場合に、重要性があると判断される。
監査人は、我が国において一般に公正妥当と認められる監査の基準に従って、監査の過程を通じて、職業的専門家とし
ての判断を行い、職業的懐疑心を保持して以下を実施する。
・不正又は誤謬による重要な虚偽表示リスクを識別し、評価する。また、重要な虚偽表示リスクに対応した監査手続を
立案し、実施する。監査手続の選択及び適用は監査人の判断による。さらに、意見表明の基礎となる十分かつ適切な監
査証拠を入手する。
・連結財務諸表監査の目的は、内部統制の有効性について意見表明するためのものではないが、監査人は、リスク評価
の実施に際して、状況に応じた適切な監査手続を立案するために、監査に関連する内部統制を検討する。
・経営者が採用した会計方針及びその適用方法の適切性、並びに経営者によって行われた会計上の見積りの合理性及び
関連する注記事項の妥当性を評価する。
・経営者が継続企業を前提として連結財務諸表を作成することが適切であるかどうか、また、入手した監査証拠に基づ
き、継続企業の前提に重要な疑義を生じさせるような事象又は状況に関して重要な不確実性が認められるかどうか結論
付ける。継続企業の前提に関する重要な不確実性が認められる場合は、監査報告書において連結財務諸表の注記事項に
注意を喚起すること、又は重要な不確実性に関する連結財務諸表の注記事項が適切でない場合は、連結財務諸表に対し
て除外事項付意見を表明することが求められている。監査人の結論は、監査報告書日までに入手した監査証拠に基づい
ているが、将来の事象や状況により、企業は継続企業として存続できなくなる可能性がある。
・連結財務諸表の表示及び注記事項が、我が国において一般に公正妥当と認められる企業会計の基準に準拠しているか
どうかとともに、関連する注記事項を含めた連結財務諸表の表示、構成及び内容、並びに連結財務諸表が基礎となる取
引や会計事象を適正に表示しているかどうかを評価する。
・
連結財務諸表に対する意見表明の基礎となる、会社及び連結子会社の財務情報に関する十分かつ適切な監査証拠を入
手するために、連結財務諸表の監査を計画し実施する。監査人は、連結財務諸表の監査に関する指揮、監督及び査閲に
関して責任がある。監査人は、単独で監査意見に対して責任を負う。
監査人は、監査役及び監査役会に対して、計画した監査の範囲とその実施時期、監査の実施過程で識別した内部統制の
重要な不備を含む監査上の重要な発見事項、及び監査の基準で求められているその他の事項について報告を行う。
監査人は、監査役及び監査役会に対して、独立性についての我が国における職業倫理に関する規定を遵守したこと、並
びに監査人の独立性に影響を与えると合理的に考えられる事項、及び阻害要因を除去するための対応策を講じている場合
又は阻害要因を許容可能な水準にまで軽減するためのセーフガードを適用している場合はその内容について報告を行う。
監査人は、監査役及び監査役会と協議した事項のうち、当連結会計年度の連結財務諸表の監査で特に重要であると判断
した事項を監査上の主要な検討事項と決定し、監査報告書において記載する。ただし、法令等により当該事項の公表が禁
止されている場合や、極めて限定的ではあるが、監査報告書において報告することにより生じる不利益が公共の利益を上
回ると合理的に見込まれるため、監査人が報告すべきでないと判断した場合は、当該事項を記載しない。
<内部統制監査>
監査意見
当監査法人は、金融商品取引法第193条の2第2項の規定に基づく監査証明を行うため、澁谷工業株式会社の2026年6
月30日現在の内部統制報告書について監査を行った。
当監査法人は、澁谷工業株式会社が2026年6月30日現在の財務報告に係る内部統制は有効であると表示した上記の内部
統制報告書が、我が国において一般に公正妥当と認められる財務報告に係る内部統制の評価の基準に準拠して、財務報告
に係る内部統制の評価結果について、全ての重要な点において適正に表示しているものと認める。
監査意見の根拠
当監査法人は、我が国において一般に公正妥当と認められる財務報告に係る内部統制の監査の基準に準拠して内部統制
監査を行った。財務報告に係る内部統制の監査の基準における当監査法人の責任は、「内部統制監査における監査人の責
任」に記載されている。当監査法人は、我が国における職業倫理に関する規定(社会的影響度の高い事業体の財務諸表監
査に適用される規定を含む。)に従って、会社及び連結子会社から独立しており、また、監査人としてのその他の倫理上
の責任を果たしている。当監査法人は、意見表明の基礎となる十分かつ適切な監査証拠を入手したと判断している。
97/100
EDINET提出書類
澁谷工業株式会社(E01666)
有価証券報告書
内部統制報告書に対する経営者並びに監査役及び監査役会の責任
経営者の責任は、財務報告に係る内部統制を整備及び運用し、我が国において一般に公正妥当と認められる財務報告に
係る内部統制の評価の基準に準拠して内部統制報告書を作成し適正に表示することにある。
監査役及び監査役会の責任は、財務報告に係る内部統制の整備及び運用状況を監視、検証することにある。
なお、財務報告に係る内部統制により財務報告の虚偽の記載を完全には防止又は発見することができない可能性があ
る。
内部統制監査における監査人の責任
監査人の責任は、監査人が実施した内部統制監査に基づいて、内部統制報告書に重要な虚偽表示がないかどうかについ
て合理的な保証を得て、内部統制監査報告書において独立の立場から内部統制報告書に対する意見を表明することにあ
る。
監査人は、我が国において一般に公正妥当と認められる財務報告に係る内部統制の監査の基準に従って、監査の過程を
通じて、職業的専門家としての判断を行い、職業的懐疑心を保持して以下を実施する。
・内部統制報告書における財務報告に係る内部統制の評価結果について監査証拠を入手するための監査手続を実施す
る。内部統制監査の監査手続は、監査人の判断により、財務報告の信頼性に及ぼす影響の重要性に基づいて選択及び適
用される。
・財務報告に係る内部統制の評価範囲、評価手続及び評価結果について経営者が行った記載を含め、全体としての内部
統制報告書の表示を検討する。
・内部統制報告書における財務報告に係る内部統制の評価結果に関する十分かつ適切な監査証拠を入手するために、内
部統制の監査を計画し実施する。監査人は、内部統制報告書の監査に関する指揮、監督及び査閲に関して責任がある。
監査人は、単独で監査意見に対して責任を負う。
監査人は、監査役及び監査役会に対して、計画した内部統制監査の範囲とその実施時期、内部統制監査の実施結果、識
別した内部統制の開示すべき重要な不備、その是正結果、及び内部統制の監査の基準で求められているその他の事項につ
いて報告を行う。
監査人は、監査役及び監査役会に対して、独立性についての我が国における職業倫理に関する規定を遵守したこと、並
びに監査人の独立性に影響を与えると合理的に考えられる事項、及び阻害要因を除去するための対応策を講じている場合
又は阻害要因を許容可能な水準にまで軽減するためのセーフガードを適用している場合はその内容について報告を行う。
<報酬関連情報>
当監査法人及び当監査法人と同一のネットワークに属する者に対する、会社及び子会社の監査証明業務に基づく報酬及
び非監査業務に基づく報酬の額は、「提出会社の状況」に含まれるコーポレート・ガバナンスの状況等(3)【監査の状
況】に記載されている。
利害関係
会社及び連結子会社と当監査法人又は業務執行社員との間には、公認会計士法の規定により記載すべき利害関係はな
い。
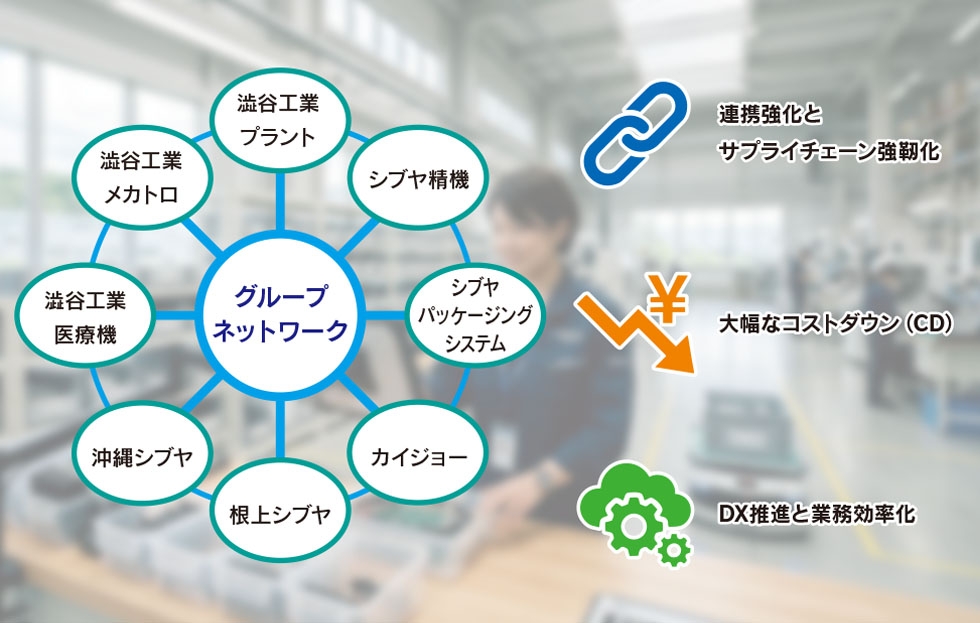
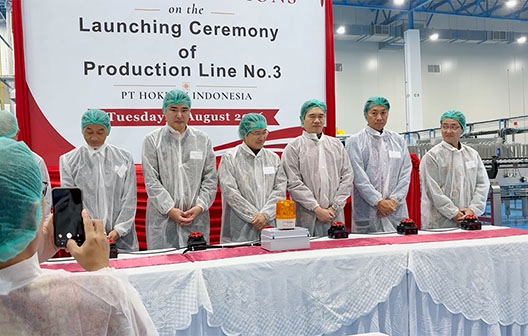


 ](
 ](
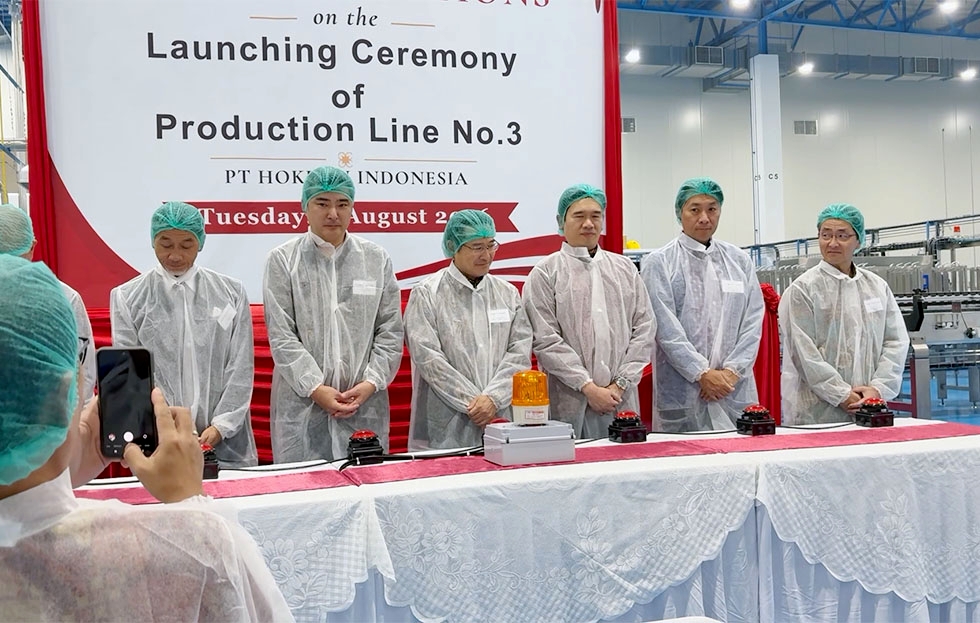


 ](


 循環式固液混合システム
 インライン連続式固液混合システム
 仕上分散システム
 プロセスエンジニアリング








 ](