EDINET提出書類 株式会社TEIKOKU(E01761) 有価証券報告書 【表紙】 【提出書類】 有価証券報告書 【根拠条文】 金融商品取引法第24条第1項 【提出先】 近畿財務局長 【提出日】 2026年6月26日 【事業年度】 第122期(自 【会社名】 株式会社TEIKOKU…
EDINET提出書類
株式会社TEIKOKU(E01761)
有価証券報告書
【表紙】
【提出書類】
有価証券報告書
【根拠条文】
金融商品取引法第24条第1項
【提出先】
近畿財務局長
【提出日】
2026年6月26日
【事業年度】
第122期(自
【会社名】
株式会社TEIKOKU
(旧会社名株式会社帝国電機製作所)
【英訳名】
TEIKOKU CORPORATION
(旧英訳名
2025年4月1日
至
2026年3月31日)
TEIKOKU ELECTRIC MFG.CO.,LTD.)
(注)2025年6月26日開催の第121回定時株主総会の決議により、2026年4
月1日から会社名を上記のとおり変更いたしました。
【代表者の役職氏名】
代表取締役社長執行役員
【本店の所在の場所】
兵庫県たつの市新宮町平野60番地
【電話番号】
0791−75−0411(代表)
【事務連絡者氏名】
取締役執行役員総務本部長
【最寄りの連絡場所】
兵庫県たつの市新宮町平野60番地
【電話番号】
0791−75−0411(代表)
【事務連絡者氏名】
取締役執行役員総務本部長
【縦覧に供する場所】
株式会社東京証券取引所
(東京都中央区日本橋兜町2番1号)
1/117
村田
潔
阿部
阿部
孝司
孝司
EDINET提出書類
株式会社TEIKOKU(E01761)
有価証券報告書
第一部【企業情報】
第1【企業の概況】
1【主要な経営指標等の推移】
(1)連結経営指標等
回次
第118期
第119期
第120期
第121期
第122期
決算年月
2022年3月
2023年3月
2024年3月
2025年3月
2026年3月
売上高
(千円)
22,244,497
28,450,684
29,217,874
30,546,287
29,091,243
経常利益
(千円)
2,953,749
5,472,448
5,442,844
6,296,563
5,444,526
親会社株主に帰属する当期純
利益
(千円)
1,987,699
3,996,655
3,125,199
3,811,499
4,341,599
包括利益
(千円)
2,959,522
4,752,898
4,372,683
5,123,946
4,411,713
純資産額
(千円)
30,291,067
31,506,226
32,466,222
33,504,715
32,237,019
総資産額
(千円)
39,001,124
41,596,930
42,040,322
42,396,568
40,204,658
1株当たり純資産額
(円)
1,579.60
1,716.10
1,809.38
1,971.14
2,045.68
1株当たり当期純利益
(円)
103.29
214.95
173.81
219.27
265.69
潜在株式調整後1株当たり当
期純利益
(円)
−
−
−
−
−
自己資本比率
(%)
77.0
74.7
75.8
77.2
78.0
自己資本利益率
(%)
6.8
13.1
9.9
11.8
13.5
株価収益率
(倍)
15.24
11.41
14.70
13.33
10.49
営業活動によるキャッシュ・
フロー
(千円)
3,766,624
4,853,199
2,395,100
3,944,667
2,697,946
投資活動によるキャッシュ・
フロー
(千円) △1,474,924
281,920
△2,973,355
1,470,431
835,474
財務活動によるキャッシュ・
フロー
(千円) △1,651,878
△3,713,623
△4,076,074
△4,706,674
△5,902,374
現金及び現金同等物の期末残
高
(千円)
13,036,366
14,903,351
10,834,410
11,998,609
9,798,324
1,273
1,269
1,249
1,107
1,145
[110]
[112]
[103]
[57]
[59]
従業員数
[外、平均臨時雇用者数]
(人)
(注)1.潜在株式調整後1株当たり当期純利益については、潜在株式が存在しないため記載しておりません。
2.「法人税、住民税及び事業税等に関する会計基準」(企業会計基準第27号 2022年10月28日。以下「2022年
改正会計基準」という。)等を第121期の期首から適用しており、第120期に係る主要な経営指標等につい
ては、当該会計基準等を遡って適用した後の指標等となっております。なお、2022年改正会計基準につい
ては第20-3項ただし書きに定める経過的な取扱いを適用し、「税効果会計に係る会計基準の適用指針」
(企業会計基準適用指針第28号 2022年10月28日)については第65-2項(2)ただし書きに定める経過的な
取扱いを適用しております。この結果、第121期以降に係る主要な経営指標等については、当該会計基準等
を適用した後の指標等となっております。
2/117
EDINET提出書類
株式会社TEIKOKU(E01761)
有価証券報告書
(2)提出会社の経営指標等
回次
第118期
第119期
第120期
第121期
第122期
決算年月
2022年3月
2023年3月
2024年3月
2025年3月
2026年3月
売上高
(千円)
10,090,806
11,728,975
12,196,147
13,603,882
13,424,093
経常利益
(千円)
1,422,338
2,084,532
4,835,090
5,417,262
4,641,145
当期純利益
(千円)
1,094,666
1,751,462
3,969,865
4,132,078
4,323,334
資本金
(千円)
3,143,675
3,143,675
3,143,675
3,143,675
3,143,675
発行済株式総数
(株)
20,440,038
18,990,038
18,480,038
16,880,038
15,780,038
純資産額
(千円)
21,110,877
19,257,823
20,094,207
20,284,517
18,652,658
総資産額
(千円)
23,774,444
22,123,093
22,997,248
23,352,924
21,368,689
1株当たり純資産額
(円)
1,110.86
1,062.87
1,141.51
1,221.29
1,216.96
50.00
116.00
92.00
110.00
133.00
(18.00)
(58.00)
(46.00)
(41.00)
(55.00)
1株当たり配当額
(うち1株当たり中間配当
額)
(円)
1株当たり当期純利益
(円)
56.88
94.20
220.78
237.71
264.57
潜在株式調整後1株当たり当
期純利益
(円)
−
−
−
−
−
自己資本比率
(%)
88.8
87.0
87.4
86.9
87.3
自己資本利益率
(%)
5.1
8.7
20.2
20.5
22.2
株価収益率
(倍)
27.67
26.03
11.57
12.30
10.53
配当性向
(%)
87.9
123.1
41.7
46.3
50.3
321
314
305
317
328
[17]
[15]
[21]
[22]
[23]
従業員数
[外、平均臨時雇用者数]
(人)
株主総利回り
(%)
122.8
198.0
212.8
248.9
248.6
(比較指標:配当込みTOPIX)
(%)
(102.0)
(107.9)
(152.5)
(150.2)
(202.2)
最高株価
(円)
1,592
2,869
3,170
3,195
3,500
最低株価
(円)
1,194
1,493
2,239
2,148
2,509
(注)1.潜在株式調整後1株当たり当期純利益については、潜在株式が存在しないため記載しておりません。
2.「法人税、住民税及び事業税等に関する会計基準」(企業会計基準第27号 2022年10月28日。以下「2022年
改正会計基準」という。)等を第121期の期首から適用しており、第120期に係る主要な経営指標等について
は、当該会計基準等を遡って適用した後の指標等となっております。なお、2022年改正会計基準については
第20-3項ただし書きに定める経過的な取扱いを適用しております。この結果、第121期以降に係る主要な経
営指標等については、当該会計基準等を適用した後の指標等となっております。
3.2026年3月期の1株当たり配当額133円のうち、期末配当額78円については、2026年6月29日開催予定の定
時株主総会の決議事項になっております。
3/117
EDINET提出書類
株式会社TEIKOKU(E01761)
有価証券報告書
4.株主総利回り及び比較指標の最近5年間の推移は以下のとおりであります。
5.最高株価及び最低株価は、2022年4月4日より東京証券取引所プライム市場におけるものであり、それ以前
については東京証券取引所市場第一部におけるものであります。
4/117
EDINET提出書類
株式会社TEIKOKU(E01761)
有価証券報告書
2【沿革】
年月
事項
1939年9月
1944年2月
「鉄道保安装置の製作販売及び一般電気機械の製作販売」を事業目的として、大阪市北区に株式会
社帝国電機製作所を設立
事業拡大と戦時疎開のため、兵庫県揖保郡新宮町に工場を移転
1960年4月
自社製品キャンドモータポンプの初号機が完成
1961年4月
キャンドモータポンプの発売を開始
1961年7月
兵庫県揖保郡新宮町(現在の本店所在地)に新たに新宮工場を竣工
1962年4月
兵庫県揖保郡新宮町に㈱協和電機製作所(連結子会社)を設立
1963年4月
テイコクかくはん機が完成、国内及び米、英、仏、西独に特許出願
1963年12月
兵庫県佐用郡佐用町に㈱平福電機製作所(連結子会社)を設立
1966年11月
兵庫県佐用郡上月町に上月電装㈱(連結子会社)を設立
1968年12月
兵庫県揖保郡新宮町に㈱帝伸製作所(連結子会社)を設立
1987年3月
新宮工場が「高圧ガス製造設備認定事業所」として認可を受ける
1991年11月
米国デラウェア州ドバー市にTEIKOKU USA INC.(連結子会社)を設立
1994年12月
1996年5月
中国遼寧省大連市に大連キャンドモータポンプ廠との合弁会社大連帝国キャンドモータポンプ有限
公司(連結子会社)を設立
国際品質保証規格「ISO9001」の認証を取得
1999年1月
台湾台北市に台湾帝国ポンプ股份有限公司(連結子会社)を設立
1999年3月
シンガポールにTEIKOKU SOUTH ASIA PTE LTD.(連結子会社)を設立
1999年5月
大阪証券取引所市場第二部に株式を上場
2001年3月
国際環境管理規格「ISO14001」の認証を取得
2001年11月
合弁会社であった大連帝国キャンドモータポンプ有限公司を完全子会社化
2002年8月
ドイツデュッセルドルフ市にTEIKOKU ELECTRIC GmbH(連結子会社)を設立
2003年2月
TEIKOKU USA INC.が米国のCRANE PUMPS & SYSTEMS INC.からケミポンプ事業部を買収
2005年2月
東京証券取引所市場第二部に株式を上場
2005年10月
韓国ソウル特別市にTEIKOKU KOREA CO.,LTD.(連結子会社)を設立
2006年9月
東京証券取引所市場第一部に指定
2007年2月
大阪証券取引所市場第一部に指定
2009年2月
中国江蘇省無錫市に無錫大帝キャンドモータポンプ修理有限公司(連結子会社)を設立
2009年6月
中国山東省済南市に済南大帝キャンドモータポンプ修理有限公司(連結子会社)を設立
2010年5月
TEIKOKU USA INC.が米国のTEXAS PROCESS EQUIPMENT COMPANY社のキャンドモータポンプ修理サー
2013年8月
ビス事業部を買収
兵庫県たつの市に光都工場を竣工
2013年12月
中国四川省成都市に成都大帝キャンドモータポンプ修理有限公司(連結子会社)を設立
2017年4月
インドのHYDRODYNE(INDIA)PVT.LTD.(現:HYDRODYNE TEIKOKU(INDIA)PVT.LTD.)の株式を取得し子
2017年4月
会社化
兵庫県たつの市に本社新工場を竣工
2019年9月
中国遼寧省大連市に大連大帝キャンドモータポンプ修理有限公司(連結子会社)を設立
2020年3月
済南大帝キャンドモータポンプ修理有限公司を清算
2020年7月
成都大帝キャンドモータポンプ修理有限公司を清算
2020年12月
無錫大帝キャンドモータポンプ修理有限公司を清算
2022年4月
東京証券取引所の市場区分の見直しにより、東京証券取引所の市場第一部からプライム市場に移行
2024年12月
電子部品事業を担う、㈱平福電機製作所(連結子会社)の事業を停止
2026年4月
商号を㈱TEIKOKUに変更
5/117
EDINET提出書類
株式会社TEIKOKU(E01761)
有価証券報告書
3【事業の内容】
当社グループ(当社及び当社の関係会社)は、当社及び子会社12社により構成されており、キャンドモータポンプ、
定量ポンプ及びその他ポンプを主な製品とする「ポンプ事業」を中心に、減揺装置用モータ等の製品も取り扱い、事業
活動を展開しております。
当社グループの事業内容と、子会社の当該事業に係る位置づけは、次のとおりであります。
2024年12月31日をもって、当社グループの電子部品分野を担う子会社である株式会社平福電機製作所の事業を停止し
たことに伴い、「ポンプ事業」を単一の報告セグメントとしており、その他については量的重要性が乏しいため、セグ
メント別の記載を省略しております。なお、同社の清算は当連結会計年度末で未了のため、上記子会社12社のうちに含
んでおります。
また、当社には親会社等はありません。
事業区分
主要製品
当該事業に係る各社の位置づけ
ポンプ事業
ケミカル機器キャンドモータポンプ
高圧ガス機器キャンドモータポンプ
キャンドモータ
冷凍機・空調機器キャンドモータポンプ
ポンプ
半導体機器キャンドモータポンプ
電力関連機器キャンドモータポンプ
子会社である株式会社協和電機製作所、株式会社帝
伸製作所及び上月電装株式会社を外注加工先として、
当社が製品を製造し、国内及び一部海外での販売及び
アフターサービスを行っております。
当社製品の海外での販売及びアフターサービスは、
台湾では子会社である台湾帝国ポンプ股份有限公司
が、シンガポールでは子会社であるTEIKOKU SOUTH
ASIA PTE LTD.が、韓国では子会社であるTEIKOKU
KOREA CO.,LTD.が、ヨーロッパでは子会社である
定量ポンプ
その他ポンプ
TEIKOKU ELECTRIC GmbHがそれぞれ行っており、その
ケミカル機器定量ポンプ
高圧ガス機器定量ポンプ
半導体機器定量ポンプ
発泡装置用定量ポンプ
他の地域では当社が直接販売しております。
米国では子会社であるTEIKOKU USA INC.が、中国で
は子会社である大連帝国キャンドモータポンプ有限公
司他1社が、インドでは子会社であるHYDRODYNE
電力関連機器ポンプ
その他ポンプ
TEIKOKU(INDIA)PVT.LTD.がそれぞれ製品の製造、販売
及びアフターサービスを行っておりますが、一部の製
品は当社から仕入れております。
減揺装置用モータ他
子会社である株式会社協和電機製作所及び上月電装
株式会社が製造し、当社が製品の販売を行っておりま
す。
その他
その他製品
6/117
EDINET提出書類
株式会社TEIKOKU(E01761)
有価証券報告書
さらに、当社グループの事業系統図は次のとおりであり、図中では前表のキャンドモータポンプ、定量ポンプ及びそ
の他ポンプを一括し、「モータポンプ」として表示しております。
7/117
EDINET提出書類
株式会社TEIKOKU(E01761)
有価証券報告書
4【関係会社の状況】
(1)連結子会社
名称
住所
㈱協和電機製
作所
兵庫県養父
市
上月電装㈱
資本金
(千円)
主要な事業
の内容
子会社
の議決
権に対
する所
有割合
(%)
関係内容
役員の兼任
当社
役員
(人)
当社従
業員
(人)
資金援助
営業上の取引
当社がモータ
ポンプ及びそ
の他製品を購
入
当社がモータ
ポンプ及びそ
の他製品を購
入
設備の賃
貸借
その他
−
当社が経
営指導
当社が土地
等を賃貸借
当社が経
営指導
10,000
ポンプ事業
その他
100.0
2
3
−
兵庫県たつ
の市
10,000
ポンプ事業
その他
100.0
2
3
−
㈱帝伸製作所
兵庫県たつ
の市
10,000
ポンプ事業
100.0
2
3
−
当社がモータ
ポンプを購入
当社が土
地・設備を
賃貸
当社が経
営指導
TEIKOKU USA
INC.
米国ペンシ
ルバニア州
ウォーミン
スター郡区
千米ドル
5,800
ポンプ事業
100.0
3
−
−
当社のモータ
ポンプを販売
及び当社が原
材料を購入
−
−
中国遼寧省
大連市
千人民元
51,000
(注)2
ポンプ事業
100.0
3
3
−
当社のモータ
ポンプを販売
−
当社が生
産ノウハ
ウを提供
台湾台北市
千台湾ドル
26,500
ポンプ事業
100.0
3
1
−
当社のモータ
ポンプを販売
−
−
シンガポー
ル
千シンガ
ポールドル
142
ポンプ事業
100.0
3
−
−
当社のモータ
ポンプを販売
−
−
ドイツ
デュッセル
ドルフ市
千ユーロ
950
(注)2
ポンプ事業
100.0
3
−
当社が取引
先に対して
契約履行保
証
当社のモータ
ポンプを販売
−
−
韓国ソウル
特別市
千韓国ウォン
400,000
ポンプ事業
100.0
3
1
−
当社のモータ
ポンプを販売
−
−
1
当社が取引
先に対して
契約履行保
証
当社のモータ
ポンプを販売
−
−
大連帝国キャ
ンドモータポ
ンプ有限公司
台湾帝国ポン
プ股份有限公
司
TEIKOKU
SOUTH ASIA
PTE LTD.
TEIKOKU
ELECTRIC GmbH
TEIKOKU KOREA
CO.,LTD.
HYDRODYNE
TEIKOKU
(INDIA)
PVT.LTD.
インドタネ 千インドルピー
ポンプ事業
市
102
51.0
3
その他2社
(注)1.当連結会計年度より、「ポンプ事業」の単一の報告セグメントに変更しております。
2.大連帝国キャンドモータポンプ有限公司及びTEIKOKU ELECTRIC GmbHについては、出資金であります。
3.上月電装㈱、㈱帝伸製作所、TEIKOKU USA INC.及び大連帝国キャンドモータポンプ有限公司は、特定子会社
に該当します。
4.上記子会社には、有価証券届出書又は有価証券報告書を提出している会社はありません。
5.TEIKOKU USA INC.及び大連帝国キャンドモータポンプ有限公司は、売上高(連結会社相互間の内部売上高を
除く。)の連結売上高に占める割合が10%を超えております。
TEIKOKU USA INC.の売上高は6,799,632千円、経常利益は325,393千円、当期純利益は245,752千円、純資産
額は4,201,882千円及び総資産額は5,618,240千円であります。
大連帝国キャンドモータポンプ有限公司の売上高は7,555,767千円、経常利益は913,736千円、当期純利益は
782,645千円、純資産額は7,886,859千円及び総資産額は11,157,137千円であります。
6.その他2社の内の1社である株式会社平福電機製作所は、2024年12月31日をもって事業を停止し、当連結会
計年度末時点では清算は未了でありますが、有価証券報告書提出日時点では清算結了しております。
(2)持分法適用関連会社
該当事項はありません。
(3)その他の関係会社
該当事項はありません。
8/117
EDINET提出書類
株式会社TEIKOKU(E01761)
有価証券報告書
第2【事業の状況】
1【経営方針、経営環境及び対処すべき課題等】
当社グループの経営方針、経営環境及び対処すべき課題等は、以下のとおりであります。
なお、文中の将来に関する事項は、当連結会計年度末現在において当社グループが判断したものであります。
(1)経営方針
当社グループは、創業以来の社是である「みんなで良くなろう」「誠実に事に当たろう」「積極的にやろう」の
下、存在意義や目指していく方向性を示す経営理念、及び経営理念を実現していくための行動指針を策定しておりま
す。
社是・経営理念・行動指針に沿って、人々の暮らしや持続可能な社会の実現に役立つ、安心・安全な製品づくりに
こだわり、顧客、株主、地域の人々、従業員等、当社グループに関わる全ての人々に幸せを感じていただくことを目
指して事業活動を行うことを経営の基本とし、当社グループの持続的な成長と中長期的な企業価値向上を目指してま
いります。
また、10年後のありたい姿を全役職員で共有し、その実現に向けて一人一人が主体的に挑戦することで、社是を体
現した働きがいのある会社となることを目指し、2025年4月にグループビジョンを策定しております。2035年までに
連結売上高700億円の事業規模とキャンドモータポンプ市場での圧倒的No.1を目標として掲げ、達成に向けて全役職
員一丸となって取り組んでまいります。
〔経営理念〕
「私たちは事業活動を通じて人の心を豊かにするとともに、持続可能な社会の実現に貢献します。」
〔行動指針〕
「私たちは一人ひとりの個性と人権を尊重し、公正で明るく働きがいのある職場づくりを追求します。」
「私たちはコンプライアンスを徹底し、合理的判断に基づき行動します。」
「私たちは自ら考え、何事にも前向きに挑戦します。」
「私たちは未来の地球に役立つ安全・安心な製品づくりを極めていきます。」
〔グループビジョンステートメント〕
変わるぞTEIKOKU
『圧倒的No.1への挑戦〜世界の隅々に、唯一無二を、最速で』
①2035年までに連結売上高700億円の事業規模を目指す
・グローバルで生産規模を拡大する
・設計・生産効率化によるリードタイム短縮で顧客価値を高める
②人と地球環境にやさしいキャンドモータポンプで圧倒的No.1になる
・脱炭素市場向けの製品開発を強化し、脱炭素社会への移行をサポートする
・地域特性に応じた営業戦略を構築し、人と地球環境にやさしいキャンドモータポンプを世界中に普及させ
る
(2)経営戦略等
当社グループは、経済のボーダレス化・企業活動のグローバル化が進行する中、持てる経営資源(人・物・金・情
報)を積極活用し、スピードある技術・営業・生産・管理・サービス・物流のイノベーションを断行してまいりま
す。また、連結経営強化の観点から子会社を含めた事業の効率向上と一層の連携強化に努めてまいります。さらに、
完全無漏洩構造の「キャンドモータポンプ技術」をコアとし、技術集約型企業グループとして、「未来の地球に役立
つ安全・安心な製品づくり」をベースに事業領域を拡大しながら、激変する事業環境に対処するため、景気変動に強
い企業体質づくりを目指し、成長を図る施策を展開してまいります。
なお、当社グループは、2024年度を初年度とする3ヶ年の中期経営計画(2025年3月期〜2027年3月期)を策定
し、基本テーマとして「環境貢献に軸を置いた成長戦略とサステナブル経営の両立」を掲げ、最終年度である2027年
3月期の業績目標を売上高320億円、営業利益57億円、ROE14.0%を計画しておりましたが、中国市場の低迷と競
争激化・米国での脱炭素政策の転換や関税政策による設備投資の意思決定遅れといった外部要因に加え、米国規格準
拠製品の販売開始の遅れといった内部要因等により、2027年3月期の業績目標を売上高310億円、営業利益50億円、
ROE11.8%へと計画を修正いたしました。詳細は2026年5月28日公開の決算説明資料をご参照ください。
(2024年当初の中期経営計画の詳細については、2024年5月29日公開の決算説明資料をご参照ください。)
9/117
EDINET提出書類
株式会社TEIKOKU(E01761)
有価証券報告書
(3)経営環境
当社は、1960年に独自技術でキャンドモータポンプを開発し、その後、長年に亘り顧客ニーズに応えながら実績を
積み上げ、設計・生産技術等を蓄積してまいりました。
キャンドモータポンプは、完全無漏洩という特性から、石油化学プラント等の安全性が最優先される現場で使用さ
れることが多く、そのような現場で採用されるためには、過去の実績に裏付けられた信頼が重要であります。キャン
ドモータポンプ市場においては、世界に複数の競合が存在し、近年では新興企業も出現しておりますが、当社には長
年に亘るリーディングカンパニーとしての信頼・実績と豊富な経験から培われた技術・ノウハウがあることに加え、
きめ細かい迅速な対応やサービス体制を構築していること等により、顧客が安心して当社ポンプを使用していただけ
るところに当社の競争優位性があります。
また、石油化学業界においては、世界的な脱炭素の流れを受け、化石燃料からのエネルギー転換等、CO₂排出ゼロ
に向けた取り組みが加速しております。そのような中で、当社のキャンドモータポンプは脱炭素に関連する設備にも
対応することが可能であり、市場の裾野を広げる新たなチャンスと捉えております。
今後も「キャンドモータポンプ技術」をコアとしつつ、収益基盤の拡大も図りながら事業を展開してまいります。
(4)経営上の目標の達成状況を判断するための客観的な指標等
当社グループは、成長を続けるために、世界各地においてキャンドモータポンプの市場開拓・拡大を図り、積極的
な海外戦略を展開しております。また一方、景気動向により売上高が変動する中でも、適正利益を生み出せる強靭な
経営体質の構築を実現したいと考えております。
重要な経営指標(連結)として、収益体質の強化、資本効率向上を目指し、まずは2024年当初目標のROE14.0%
の早期達成を目指してまいります。
(5)優先的に対処すべき事業上及び財務上の課題
①当社を取り巻く課題の認識
中東情勢の緊迫化により中東産原油の輸入が滞る等、当社を取り巻く外部環境に大きな変化が訪れております。
当社においては、安定したサプライチェーンを構築するとともに、エネルギー転換による需要や脱炭素市場の取り
込み等の新市場開拓を進め、従来の市場のみに依存しない強靭な収益構造の構築に取り組んでいく必要があります。
当社は、2024年度を初年度とする3ヶ年の中期経営計画(2025年3月期〜2027年3月期)において、引き続き更な
る成長に向けて次の事項を課題と認識し取り組みを進めております。
イ.環境負荷軽減に直結するポンプ事業の推進と基盤整備
・キャンドモータポンプの需要開拓・促進
新市場である脱炭素市場獲得に向けたマーケティング戦略や製品開発を強化するとともに、既存市場において
は地域特性に応じた営業戦略で更なる市場深耕を図ってまいります。
・キャンドモータポンプの安定供給を支える調達力強化と技術対応力向上
需要と社会的役割が増加する当社キャンドモータポンプへの供給責任を果たすため、生産体制の整備やサプラ
イチェーンの強化に取り組みます。また、設計効率化による納期短縮や高難度案件への対応力強化で他社との差
別化を図ってまいります。
ロ.人的資本尊重・強化による成長組織基盤強化
・人財投資増強による育成強化とモチベーションアップ
会社が存続し持続的に発展していくために、人財育成は最重要課題の一つであります。教育訓練の充実や職務
設計の工夫により成長機会を創出し、仕事のやりがいを実感できる会社を目指してまいります。また、成長や挑
戦を促すような人事・評価制度への見直しを進めてまいります。
・働きやすい職場環境の整備
社是「みんなで良くなろう 誠実に事に当たろう 積極的にやろう」を体現した働きがいのある会社を目指す
ため、仕事のやりがいに加えて、更に働きやすい職場環境を目指してまいります。ハラスメントのない心理的安
全性の高い職場づくりや従業員エンゲージメントを高めるため、企業風土改革に取り組みます。また、先進IT技
術導入による効率化、労働環境の改善による快適化等にも努めてまいります。
10/117
EDINET提出書類
株式会社TEIKOKU(E01761)
有価証券報告書
②課題の解決に向けた主な取り組み
イ.環境負荷軽減に直結するポンプ事業の推進と基盤整備
・キャンドモータポンプの需要開拓・促進
当社は脱炭素市場獲得に向けて、船舶市場やCCS/CCUS等の新市場において、製品開発を進めるとともに、展
示会等のイベントへの積極的な出展で業界での知名度向上を図る等、市場開拓を進めております。一方、既存市
場につきましても、米国で米国規格ASME B73.3準拠製品の現地ノックダウン生産を開始するなど競争力を高める
取組みを進めております。
・キャンドモータポンプの安定供給を支える調達力強化と技術対応力向上
LNG等の液化ガスの需要増加を見込み、本社工場内に極低温試験設備の建設を進めております。新試験設備の
導入により、LNG用途向け大型ポンプの試験に対応できるほか、自動制御システムの導入による、生産効率及び
品質の向上を図ります。また、成長が続くインド市場の需要増加に対応するため、子会社であるHYDRODYNE
TEIKOKU(INDIA) PVT. LTD.の工場を増設し、2026年7月の本稼働を予定しております。
ロ.人的資本尊重・強化による成長組織基盤強化
・人財投資増強による育成強化とモチベーションアップ
当社では、人事戦略の策定において「経営戦略と連動していること(経営目標を達成するための人事戦略であ
ること)」と「人的資本価値を最大化すること」を最重要視点と位置づけ、現在、全面的な人事制度改革を進め
ております。新人事制度の下で、一人一人が高いモチベーションで挑戦と成長を続け、個人・部署・部門同士が
強く連帯した強靭な組織を構築することで「目指すべき企業風土(連帯・誇り・成長)」の実現とその先の連結
売上高700億円をはじめとした「グループビジョン」の達成を目指してまいります。
また、女性従業員を対象とする学びなおし講座「ポンプの学校」の開講やキャリアデザイン研修、管理職向け
の女性人財活用セミナー等、女性活躍推進にも取り組んでおります。
・働きやすい職場環境の整備
ビジョン浸透のために経営者と従業員が車座で話し合うタウンホールミーティングの開催や、リラックスした
環境で本音の議論やチームビルディングを行うことを目的としたオフサイトミーティングの開催、インナーブラ
ンディングに主眼を置いた社内プロジェクト立ち上げ等、組織風土改革に取り組んでおります。
社内の課題を発信・共有しやすい場を設けることで各部門のコミュニケーションの活性化や心理的安全性が確
保された環境づくり等、働きやすい職場環境の整備を進めております。
11/117
EDINET提出書類
株式会社TEIKOKU(E01761)
有価証券報告書
2【サステナビリティに関する考え方及び取組】
当社グループのサステナビリティに関する考え方及び取組は、次のとおりであります。
なお、文中の将来に関する事項は、当連結会計年度末現在において、当社グループが判断したものであります。
当社グループは、「私たちは事業活動を通じて人の心を豊かにするとともに、持続可能な社会の実現に貢献します。」
を経営理念としており、サステナビリティ課題を重要な経営課題の1つであると認識しております。
2024年度を初年度とする3ヶ年の中期経営計画(2025年3月期〜2027年3月期)の最終年度として、引き続き「環境貢
献に軸を置いた成長戦略とサステナブル経営の両立」を基本テーマとし、引き続きESGを積極的に推進してまいります。
これまでに、自家消費型太陽光発電設備の設置や高効率型キャンドモータポンプの開発等の環境対応、そして教育訓練
の充実や女性活躍推進プロジェクトの発足など、当社のサステナビリティ課題に対応した様々な取り組みを行ってまいり
ました。
今後も業績向上に努めていくことは勿論のこと、サステナビリティ課題への取り組みも着実に進めながら企業価値の向
上に努めてまいります。
(1)サステナビリティ全般に関するガバナンス及びリスク管理
①ガバナンス
当社グループでは、サステナビリティに関連する事項については、リスク管理委員会にて、検討を行っております。
代表取締役社長を委員長とし、執行役員を常任委員とした同委員会は、原則年3回開催し、サステナビリティに関連す
る事項を含む各種リスク・機会の抽出、分析、評価、及びこれらの対応方針について、審議・決定することとしており
ます。
リスク管理委員会で審議・決定したサステナビリティ関連の重要リスク及び機会、対応方針並びに主要な指標及び目
標(KPI)及びその進捗状況は、取締役会に年2回以上報告しております。取締役会は、当該報告を受け、(i)重要リ
スクの優先順位及び対応方針、(ii)重要な投資・資源配分を伴う施策、(iii)重要な指標及び目標の設定又は変
更、(iv)進捗管理の方針等について審議し、必要な指示又は承認を行うことにより監督しております。
<サステナビリティ関連事項を含む各種リスクに関するガバナンス体制図>
12/117
EDINET提出書類
株式会社TEIKOKU(E01761)
有価証券報告書
②リスク管理
サステナビリティに係るリスクについてはリスク管理委員会が抽出、分析、評価、及びこれらの対応方針を決定し、
全社的リスクと併せて対応しております。
リスク管理委員会で検討した内容及びその結果は取締役会に報告しており、報告を受けた取締役会は、必要に応じ、
リスク管理委員会に対して指示を行う等の監督を行っております。
具体的には、2月にリスク管理委員会事務局が委員長を除く常任委員に対してリスクに関するアンケート調査を実施
し、リスクの抽出を行います。そして、抽出されたリスクを発生可能性・頻度及び財務・レピュテーションへの影響を
評価軸にマトリックスを作成し、対応優先度をリスク管理委員会で議論の上決定します。その結果、対応優先度が高い
リスクについては、対応部門を委員会で決定し、対応部門の各本部長(常任委員)から、該当部門長(非常任委員)に
対して、自部門の経営計画(BSC)に当該リスク対応を組み込むよう指示します。経営計画(BSC)に組み込まれたリス
ク対応については、年2回開催されるBSC会議において、進捗状況を確認します。その結果がリスク管理委員会事務局
を通じて取締役会に報告されます。報告を受けた取締役会は、必要に応じ、リスク管理委員会に対して指示を行う等の
監督を行っております。
(リスク管理体制図)
(リスク評価マテリアリティ)
上記リスク管理委員会において、現状における重要性の高い当社のサステナビリティ課題として気候変動リスク・機会
への対応と人財育成が挙げられており、重点課題として取り組みを進めております。
13/117
EDINET提出書類
株式会社TEIKOKU(E01761)
有価証券報告書
(2)気候変動リスク・機会に対する戦略及び指標と目標
当社の主力製品であるキャンドモータポンプは、完全無漏洩構造であることから、環境負荷の高い液体を漏らすこと
なく移送することが可能であります。このポンプを世界中に拡販していくことが当社グループのミッションであり、事
業を通じて地球環境や世界の人々の安全に貢献できると考えております。また、社内においても温室効果ガス(GHG)排
出量の削減に努めております。
この度、TCFDの提言に基づき気候変動関連リスク及び機会が当社グループの事業に及ぼす影響の分析を進めることに
より、気候関連の適切な情報開示を行ってまいります。なお、当社グループにおける重要な気候関連リスク及び機会、
当該リスク及び機会に対処するための取り組み並びに当社グループの進捗を測る指標及び目標については、本項に記載
のとおりであります。
なお、当社は2023年6月に「気候関連財務情報開示タスクフォース(TCFD)」提言への賛同を表明いたしました。
①戦略
<前提>
TCFD提言では、気候変動に起因する事業への影響を考察するため、複数の気候関連シナリオに基づき検討を行う「シ
ナリオ分析」を行うことが推奨されており、当社グループでも不確実な将来に対応した事業戦略の立案・検討を行うた
め、下記のようにシナリオ分析を実施いたしました。
今回のシナリオ分析においては、SDGsの目標である2030年時点を想定し、現状を上回る気候変動対策が施されず、異
常気象の激甚化が想定される「4℃シナリオ」と、脱炭素に向けてより野心的な気候変動対策の実施が想定される
「1.5℃シナリオ(一部2℃シナリオも併用)」を参考に、定性・定量の両側面から考察を行いました。
14/117
EDINET提出書類
株式会社TEIKOKU(E01761)
有価証券報告書
<当社グループ事業における気候変動関連リスク・機会の概要>
・顕在化時期の定義
「短期」:〜3年
「中期」:4〜10年
「長期」:11年〜30年
・影響度の定義
「大」:営業利益に5億円以上の影響が見込まれる
「中」:営業利益に5千万円以上5億円未満の影響が見込まれる
「小」:営業利益に5千万円未満の影響が見込まれる
当社グループの主力事業であるポンプ事業は、製品の製造段階において多くの燃料や電力を使用することや、原材料と
して多種多様な金属を使用することから、カーボンプライシングに関する政策規制や、脱炭素への移行に伴う金属価格の
上昇、再生可能エネルギーの市場普及に伴う電力価格の上昇を移行リスクとして特定しています。また、気候変動に伴う
異常気象の激甚化が、当社グループのサプライチェーンに係る物流の寸断や、当社グループ各拠点の被災による影響を物
理リスクとして特定しています。
一方で、脱炭素社会の進展により、再生可能エネルギーの普及や再生可能燃料の生産量の増加といった、脱炭素分野に
おける当社グループの製品・サービスの需要増加を機会として特定しています。
<環境負荷低減に関する取り組み>
当社グループは、事業を通じて地球環境や人々の安全に貢献していくため、完全無漏洩構造であり、環境負荷の高い液
体を漏らすことなく移送することが可能であるキャンドモータポンプを世界中に拡販していくことが、ミッションである
と考えております。
15/117
EDINET提出書類
株式会社TEIKOKU(E01761)
有価証券報告書
◆
脱炭素ビジネスで活用されるキャンドモータポンプ
世界的な脱炭素社会の進展により、化石燃料からのエネルギー転換等、CO₂排出ゼロに向けた取り組みが加速しており
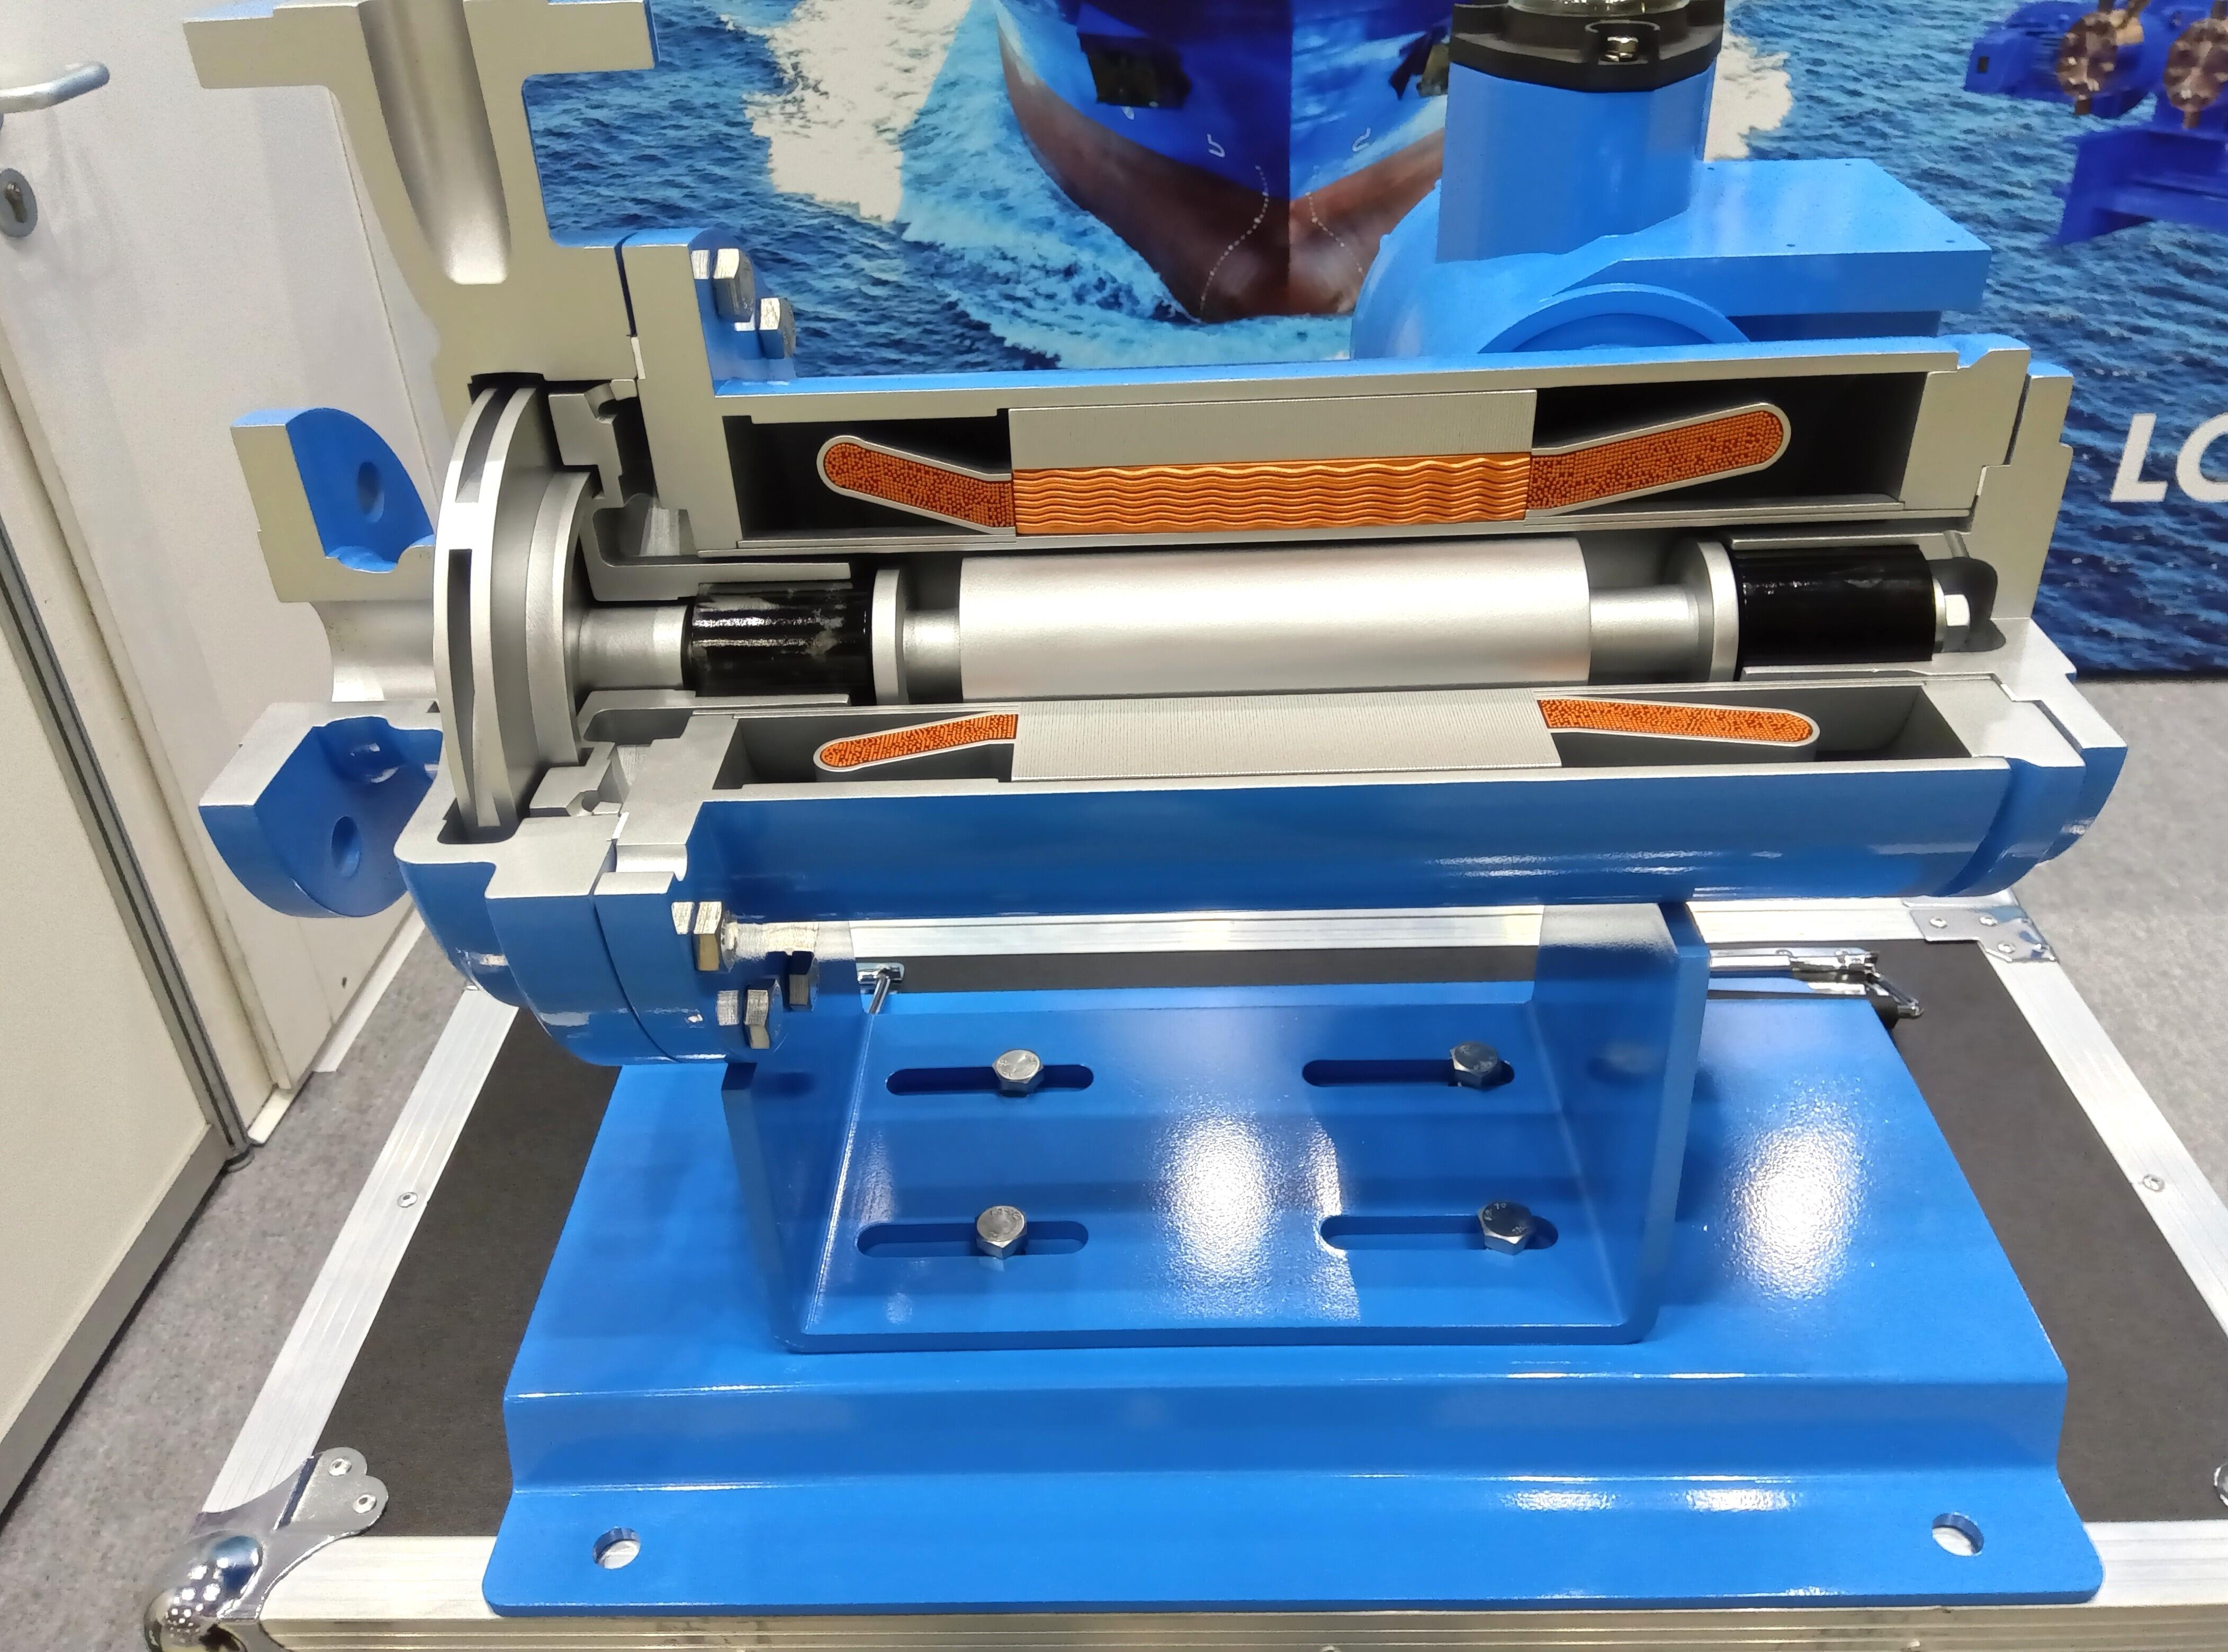
ます。そのような中で、当社のキャンドモータポンプは脱炭素に関連する設備にも対応することが可能であり、市場の裾
野を広げる新たなチャンスと捉えております。
◆
当社設備での環境に配慮した取り組み
当社グループでは、事業活動におけるGHG排出量の継続的な削減に向けて、工場やオフィスで使用するエネルギー効
率の向上や、自然エネルギーの有効利用などに取り組んでいます。
・本社屋及び本社工場の全面LED化
2017年4月に建設した新本社工場へのLED照明の導入以降、旧工場設備、本社事務所においても、LED照明への換装が
完了しております。エネルギー効率の良い設備の導入を始め、今後とも事業所全体としてのエネルギー効率向上に務
努めてまいります。
・自然エネルギーの有効利用
当社では、2017年4月に建設した新本社工場への太陽光パネル設置以降、本社工場内の技術開発センター、サービス
工場棟にも太陽光パネルを設置し、合計871kWの太陽光パネルが稼働しております。また、子会社である大連帝国
キャンドモータポンプ有限公司では、新工場建設に合わせ、新工場、既存工場の両方に合計1,421kWの太陽光パネル
を導入いたしました。これらの取り組みにより、自然エネルギーの有効利用と環境負荷の低減に努めております。
・冷暖房等の効率向上
新本社工場の外壁には、断熱効果の高い建材・工法を採用し、合わせてエアー搬送ファンによる空調効率の向上、工
場等各所にて適切な温度設定の維持管理により、空調エネルギーを抑制し、CO2の削減と作業環境の改善にも取り組
んでおります。
また、超高効率変圧器の導入等により、工場全体としてのエネルギー効率向上に努めております。
・本社工場全体でのエネルギー管理システムの導入
本社工場内のエリアごとのエネルギー使用量を可視化するデマンドモニタの設置により、全体のエネルギー使用量を
集中管理し、効果的な節電対策を実施しております。
・社用車のハイブリッド化
当社は、2021年度よりハイブリッド車の導入を本格的に開始いたしました。当社の社用車34台のうち、新たに更新す
る車両から順次ハイブリッド車への切り替えを行っており、2026年3月末現在で約50%がハイブリッド車に切り替
わっております。
・CO2フリー電力の導入
当社東京営業所は、2024年7月より電力メニュー切り替えによりCO2フリー電力を使用しております。これにより、
東京営業所における電力使用に伴うCO2排出量については、約10.6t/年の削減効果があります。
16/117
EDINET提出書類
株式会社TEIKOKU(E01761)
有価証券報告書
②指標と目標
気候変動に対する当社グループの環境経営の進捗を測る評価指標としては、温室効果ガス(GHG)排出量を選定してお
ります。
当社グループは、世界の平均気温の上昇を産業革命以前に比べて2℃以下に、可能な限り1.5℃未満に抑える努力を
するというパリ協定で示された世界共通の長期目標と、日本政府が掲げる2050年までに温室効果ガスの排出を全体とし
てゼロにする、カーボンニュートラルを達成するという目標に準拠すべく、対応してまいります。
今後、サプライチェーン全体の排出量を把握するため、Scope3の排出量算定を検討してまいります。
(3)人財育成に対する戦略及び指標と目標
当社グループは全役職員がビジョンを共有し、その実現に向けてチャレンジすることを通じて社是を体現した働きが
いのある会社になることを目指して、2025年4月に10年後のありたい姿を描いたグループビジョンを策定いたしまし
た。これを踏まえ、当期には、グループビジョンの達成に必要な「求める人財像」を明確にするべく、人事戦略を策定
いたしました。
当社グループでは、人事戦略の策定において「経営戦略と連動していること(経営目標を達成するための人事戦略で
あること)」と「人的資本価値を最大化すること」を最重要視点と位置づけ、現在、全面的な人事制度改革を進めてお
ります。これらの最重要視点のもと、①人財投資増強による育成強化とモチベーションアップを通じて人的資本価値の
最大化を図るとともに②働きやすい職場環境整備を通じて経営戦略の着実な実行を支える基盤強化を両輪として推進し
てまいります。新人事制度の下で、一人一人が高いモチベーションで挑戦と成長を続け、個人・部署・部門同士が強く
連帯した強靭な組織を構築することで「目指すべき企業風土(連帯・誇り・成長)」の実現とその先の連結売上高700
億円をはじめとした「グループビジョン」の達成を目指してまいります。
①人財投資増強による育成強化とモチベーションアップ
・教育訓練の更なる充実による成長実感とモチベーションアップ
・女性活躍推進による組織風土改革
・事業拡大・組織強化に呼応した積極的な人財確保(全国規模及び国内外人財確保の積極化)
・人事・評価制度の見直し
<具体的取り組み>
当期につきましては、教育訓練として各種技能習得のための資格取得支援を行った他、企業風土改革の一環とし
て役員や部長職を対象としたオフサイトミーティング、管理職以下全社員を対象としたタウンホールミーティング
を実施いたしました。
女性活躍推進につきましては、前期に引き続きモチベーションアップセミナーやキャリアデザイン研修等を実施
した他、新たな取り組みとして、女性従業員の希望者を対象としたポンプについての学びなおし講座である「ポン
プの学校」を開校いたしました。また、女性従業員を対象とした取り組みだけでなく、役員や管理職を対象とした
セミナーを開催することで、女性活躍に対する理解促進と職場環境整備に向けた意識醸成を推進いたしました。
「ポンプの学校」は女性従業員から好評を得たことから、2027年3月期も継続して開催いたします。
また、採用者に占める女性社員の比率については、当社の一般事業主行動計画に基づき管理しており、女性活躍
推進法に基づき同計画を策定のうえ、女性活躍推進施策に積極的に取り組んでおります。
人財確保につきましては、当期より高等専門学校生向けインターンシップ導入実施に加え、高等専門学校生を対
象とする企業研究会への参加を通じて、知名度向上を図ってまいりました。
人事・評価制度の見直しについては、当期より取り組みを始めており、2027年4月からの運用開始を予定してお
ります。当社は、評価・報酬制度の改革を人事制度改革の主要項目の一つと位置づけており、評価・報酬制度面か
ら人的資本価値の最大化を実現してまいります。具体的には、2027年度より、評価・報酬双方にメリハリをつける
ことで「実力主義の徹底」を目指すとともに管理職の報酬体系も見直し、管理職のモチベーション向上、管理職の
魅力化を通じた昇進意欲醸成を図ってまいります。これらの改革により、組織全体が挑戦意欲を持てる報酬体系を
構築してまいります。
17/117
EDINET提出書類
株式会社TEIKOKU(E01761)
有価証券報告書
②働きやすい職場環境整備
・先進IT技術導入で、職場環境の効率化・快適化を進める
・国内子会社の労働環境改善
<具体的取り組み>
先進IT技術導入につきましては、設計効率化に向けてIT技術を導入する前段階として、前期に引き続きコンサル
の支援を受けながら各施策に取り組んでまいりました。来期以降も、引き続き、必要な業務の見直しを進めつつ、
これまでの取り組みの一部(手配に関する運用ルールの見直し等)を部門BSCに落とし込み、実務への反映を進め
てまいります。
国内子会社の労働環境改善につきましては、当期は工場内への空調設備導入等を行いました。また、将来的な就
業環境の改善のため、新工場を建設し、国内子会社2社の移転を計画しております。
新工場建設用地の取得について、合意の締結は完了しており、工場建設用地の引き渡しは2029年5月を予定して
おります。
③指標と目標
上記人財戦略の指標としては、「人財育成及び社内環境整備に係る費用」及び「採用者に占める女性社員の比率」を
用いております。当期の取り組み内容及び今後の取り組み計画については、上記「①人財投資増強による育成強化とモ
チベーションアップ」の具体的取り組みに記載のとおりです。
指標
2025年3月期実績
2026年3月期実績
人財育成及び社内環境整備に
係る費用(単体)
52,520千円
76,585千円
採用者に占める女性社員の比
率(単体)
12.5%
20.0%
目標
2027年3月期
67,444千円
2030年3月期までに30.0%
(注)人財育成、社内環境整備は連結子会社各社でも行っておりますが、規模・人事制度及びデータ管理方法が連結
子会社ごとに異なり、現時点では連結会社ベースで統一的に集計する体制が整備途上であるため、提出会社
(単体)の実績及び目標を記載しております。
18/117
EDINET提出書類
株式会社TEIKOKU(E01761)
有価証券報告書
3【事業等のリスク】
有価証券報告書に記載した事業の状況、経理の状況等に関する事項のうち、経営者が連結会社の財政状態、経営成
績及びキャッシュ・フローの状況に重要な影響を与える可能性があると認識している主要なリスクは、以下のとおり
であります。
なお、文中の将来に関する事項は、有価証券報告書提出日現在において当社グループが判断したものであります。
(1) リスク管理体制
当社グループは、「リスク管理委員会」を設置しており、当該委員会でリスクの抽出、分析、評価、対応が行わ
れ、取締役会に定期的に報告されております。具体的には、代表取締役社長を委員長、執行役員を常任委員としたリ
スク管理委員会がリスクを抽出し、発生頻度、業績等への影響度に基づいてリスクの重要性を測定し、対応すべき重
要項目を定め、その目標の達成度・進捗状況を点検しリスク軽減に努めています。取締役会は報告事項に対して必要
に応じて適宜指示を行う等の監督を行っており、リスク管理の精度を高めております。
(2) 個別のリスク
リスク項目
(特に重要なリスク)
リスクの説明
リスク対策
事業環境
・当社グループの連結売上高の大部分はポンプ ・当社グループは、景気の動向に左右され難い
事業が占めておりますが、当該事業の主要な
強固な企業体質の構築に努めており、顧客志
取引先である石油化学・化学業界の設備投資
向の研究開発や用途開発、品質向上、生産性
動向が当社グループの財政状態及び業績に影
向上、ブランド力強化等に取り組んでおりま
響を及ぼす可能性があります。特に脱炭素社
す。また、製品の販売とともにメンテナンス
会の進展に伴い、石油化学向けの設備投資が
にも注力し、顧客の信頼性向上に努めており
大幅に減少した場合、当社グループの財政状
ます。
態及び業績に影響を及ぼす可能性がありま
当社グループの主要顧客である石油化学・化
す。
学業界は、脱炭素社会の進展に対応して製造
また、キャンドモータポンプの代替品や模造
工程の合理化や温室効果ガス削減に貢献する
品の出現、価格競争の激化等があった場合も
製品の開発等を進めており、これらに関連し
当社グループの財政状態及び業績に影響を及
た設備投資は当社グループにとっての機会で
ぼす可能性があります。
あると捉えております。当社グループは、こ
の機会を積極的に取り込んでまいります。
法的規制等
・当社グループの事業は、通商、独占禁止、知・当社グループは、グローバルにビジネスを展
的財産、製造物責任、貿易及び外国為替管
開していることから、各国の法的規制等につ
理、環境・リサイクル関連等の法的規制を受
いて現地法人や外部団体等を通じて常に最新
けております。また、事業を展開する各国に
情報を入手するように努めております。ま
おいても各種許認可、関税、輸出入規制等の
た、特別な対応が必要な場合は、社内にプロ
様々な規制を受けております。これらの規制
ジェクトチームを立ち上げる等、迅速な対応
の変更や新規の規制により、当社グループの
に努めております。これらの対応により規制
事業活動が制限される可能性があります。さ
変更等によるリスクの最小化を図っておりま
らに、これらの規制に違反した場合、当社グ
す。
ループの業績及び財務状況、社会的信用等に
影響を及ぼす可能性があります。
19/117
EDINET提出書類
株式会社TEIKOKU(E01761)
有価証券報告書
リスク項目
(特に重要なリスク)
リスクの説明
リスク対策
人財確保・育成
・技術集約型企業である当社グループの中長期・顧客ニーズの高度化、事業のグローバル化が
的な成長は、各従業員の力量に大きく依存し
進んでいる中、当社グループは優秀な人財の
ております。従って優秀な人財を計画通りに
確保・育成を重点課題と位置付けておりま
確保できなかったり、優秀な人財が社外に流
す。広報・IR活動等による知名度の向上や
出してしまったり、人財育成が思い通りにい
働き方改革の推進による働きやすい職場づく
かなかった場合は、当社の競争力が減退し、
り、総務部内に配置した教育専任者による若
当社グループの財政状態や業績に影響を及ぼ
手及び中堅社員の技能育成強化、各人のキャ
す可能性があります。
リアデザインを実現するためのキャリアチャ
レンジ制度の充実、語学習得を目的とする海
外への留学制度設計等、優秀な人財を確保・
育成していくための取り組みを推進しており
ます。また、2025年3月期からは、女性活躍
推進の取り組みの一環として、女性活躍推進
プロジェクトを発足いたしました。
加えて、働きがいのある会社となるよう、従
業員のエンゲージメントスコアの計測を継続
しつつ、社内コミュニケーションの活性化や
インナーブランディングに主眼を置いた社内
プロジェクトの立ち上げ等を通じて、企業風
土改革に取り組んでまいります。
調達
・当社グループが製造するモータポンプは、主・当社グループでは、部品調達や外注加工等に
にステンレス鋳物・棒材、銅線、鉄板、ベア
リング等の部材で構成されており、これら部
材の価格変動や供給体制が当社グループの財
政状態や業績に影響を及ぼす可能性がありま
す。
おいて複数社購買やグローバル調達を推進し
ており、リスクの低減を図っております。
品質
・当社グループが製造するモータポンプは顧客・当社グループは、品質基本方針に基づき、法
設備の中核をなす製品であり、品質の維持、
令・規制要求事項を遵守することはもとよ
向上は最も重要と考えております。製品の品
り、顧客要求事項を達成して顧客の信頼を得
質クレーム・トラブルが発生した場合、顧客
るとともに、品質マネジメントシステムの有
からの信用が失墜し、当社グループの財政状
効性を改善することによって、社会に認めら
態及び業績に影響を及ぼす可能性がありま
れる製品づくりを行う責務があると認識して
す。
おります。近年、若手作業者の比率が上昇し
ていることから、総務部内に教育専任者を配
置し、技能継承を推進するとともに、公的資
格の取得を積極的に推進する等、技能向上・
早期育成に努めております。
納期
・当社グループは、ポンプ事業において、顧客・当社グループでは、これら問題を回避するた
の個別ニーズに応じた受注生産をメインに
めに多面的にボトルネックの解消に取り組ん
行っております。顧客ニーズの高度化、短納
でおります。取り組みの一環として、2024年
期ニーズの増加等様々な要因により案件難易
4月1日付で、手配業務のシステム化を推進
度は高まっており、個別対応が必要な案件も
する業務に人員を配置し、作業効率の向上を
増加しております。このような状況下で、設
図っております。また、若手作業者が増加し
計や手配のミス、それらに起因する納期遅延
ていることから、総務部内に教育専任者を配
が発生した場合、顧客からの信用が失墜し、
置し、技能の継承や向上を図るとともに、生
当社グループの財政状態及び業績に影響を及
産管理方法の改善、調達先拡充による部材調
ぼす可能性があります。
達、外注加工のスピードアップ、検査設備の
増強等改善に努めております。
20/117
EDINET提出書類
株式会社TEIKOKU(E01761)
有価証券報告書
リスク項目
(特に重要なリスク)
気候変動
リスクの説明
リスク対策
・当社グループの事業活動において、気候変動・気候変動に関する「移行リスク」と「物理的
に伴い温室効果ガス排出に関する規制等、脱
リスク」の抽出・分析・評価を適切に行い、
炭素経済への「移行に関するリスク」や洪水
対応方針を決定しております。
等の気候変動による「物理的変化に関するリ
一方、脱炭素経済への移行は、当社にとって
スク」が考えられ、それらが当社グループの
リスクだけではなく、新たな市場を獲得する
財政状態及び業績に影響を及ぼす可能性があ
機会と認識していることから、この機会を確
ります。
実に捉えるべく、マーケティングや製品開発
の強化等を推進してまいります。
21/117
EDINET提出書類
株式会社TEIKOKU(E01761)
有価証券報告書
4【経営者による財政状態、経営成績及びキャッシュ・フローの状況の分析】
(1)経営成績等の状況の概要
当連結会計年度における当社グループ(当社及び連結子会社)の財政状態、経営成績及びキャッシュ・フロー(以下
「経営成績等」という。)の状況の概要は次のとおりであります。
①財政状態及び経営成績の状況
当連結会計年度における世界経済は、米国の関税政策の影響や中東情勢の地政学リスク、長期化する中国経済の低
迷等により、総じて不透明感が高まる状況となりました。当社グループを取り巻く環境は、主要顧客である化学業界
において、米国では関税政策や金融環境の影響により設備投資は鈍化傾向となり、また中国においても経済低迷によ
り大型プロジェクトの抑制が見られる等、減速感が強まりました。
一方で半導体市場については、生成AIの普及等を背景にデータセンター向け等の成長分野における設備投資需要が
堅調に推移しました。
このような状況下、当連結会計年度においては、東南アジアやインド、欧州等が堅調に推移したものの、主要市場
である米国と中国において、ケミカル機器キャンドモータポンプやアフターサービスが減少したことや、子会社であ
る株式会社平福電機製作所の事業停止等により、売上高は減少しました。
これらの結果、当連結会計年度の財政状態及び経営成績は以下のとおりとなりました。
a.財政状態
(資産)
当連結会計年度末における流動資産は30,729百万円となり、前連結会計年度末に比べ894百万円減少いたしまし
た。これは主に棚卸資産が1,016百万円増加したものの、現金及び預金が2,165百万円減少したことによるものであり
ます。固定資産は9,475百万円となり、前連結会計年度末に比べ1,297百万円減少いたしました。これは主に有形固定
資産が801百万円、投資有価証券が781百万円減少したことによるものであります。
この結果、総資産は40,204百万円となり、前連結会計年度末に比べ2,191百万円減少いたしました。
(負債)
当連結会計年度末における流動負債は7,086百万円となり、前連結会計年度末に比べ547百万円減少いたしました。
固定負債は880百万円となり、前連結会計年度末に比べ376百万円減少いたしました。
この結果、負債合計は7,967百万円となり、前連結会計年度末に比べ924百万円減少いたしました。
(純資産)
当連結会計年度末における純資産合計は32,237百万円となり、前連結会計年度末に比べ1,267百万円減少いたしま
した。これは主に利益剰余金が605百万円減少及び自己株式が555百万円増加(純資産は減少)したことによるもので
あります。
この結果、自己資本比率は78.0%(前連結会計年度末は77.2%)となりました。
b.経営成績
当社グループの当連結会計年度の売上高は29,091百万円(前期比4.8%減)となりました。利益面につきまして
は、主に粗利率の低下等により、営業利益は4,983百万円(同17.7%減)、経常利益は5,444百万円(同13.5%減)と
なったものの、投資有価証券売却益868百万円及び株式会社平福電機製作所の事業停止等による固定資産売却益140百
万円の計上により、親会社株主に帰属する当期純利益は4,341百万円(同13.9%増)となりました。
なお、当連結会計年度より、当社グループは「ポンプ事業」を単一の報告セグメントとしており、その他の事業に
ついては量的重要性が乏しいため、セグメント別の記載を省略しております。
詳細は、「第5 経理の状況 1連結財務諸表等注記事項(セグメント情報等)」に記載のとおりであります。
22/117
EDINET提出書類
株式会社TEIKOKU(E01761)
有価証券報告書
②キャッシュ・フローの状況
当連結会計年度末における現金及び現金同等物(以下「資金」という。)は、営業活動によるキャッシュ・フロー
2,697百万円及び投資活動によるキャッシュ・フロー835百万円の資金獲得があったものの、財務活動によるキャッ
シュ・フロー5,902百万円の資金支出により、前連結会計年度末に比べ2,200百万円減少し、9,798百万円となりまし
た。
当連結会計年度における各キャッシュ・フローの状況とそれらの要因は、次のとおりであります。
(営業活動によるキャッシュ・フロー)
営業活動により獲得した資金は、2,697百万円(前連結会計年度は3,944百万円の獲得)となりました。これは、
主として税金等調整前当期純利益6,426百万円の計上によるものであります。
(投資活動によるキャッシュ・フロー)
投資活動により獲得した資金は、835百万円(前連結会計年度は1,470百万円の獲得)となりました。これは、主
として投資有価証券の売却による収入990百万円及び有形固定資産の売却による収入824百万円の計上によるもので
あります。
(財務活動によるキャッシュ・フロー)
財務活動により使用した資金は、5,902百万円(前連結会計年度は4,706百万円の使用)となりました。これは、
主として自己株式の取得による支出3,459百万円及び配当金の支払による支出2,059百万円によるものであります。
③生産、受注及び販売の実績
当社グループは、「ポンプ事業」を単一の報告セグメントとしており、その他の事業については量的重要性が乏しい
ため、「ポンプ事業」に含めて記載しております。
a.生産実績
当連結会計年度における生産実績は、次のとおりであります。
セグメントの名称
金額(千円)
ポンプ事業
前期比(%)
29,709,323
△3.6
(注)金額は、販売価格によっております。
b.受注実績
当連結会計年度における受注実績は、次のとおりであります。
セグメントの名称
ポンプ事業
受注高(千円)
前期比(%)
受注残高(千円)
前期比(%)
28,019,258
△11.4
14,437,441
△6.9
(注)金額は、販売価格によっております。
c.販売実績
当連結会計年度における販売実績は、次のとおりであります。
セグメントの名称
ポンプ事業
金額(千円)
29,091,243
前期比(%)
△1.5
(注)主な相手先別の販売実績は、当該販売実績の総販売実績に対する割合が100分の10未満であるため記載を省略し
ております。
23/117
EDINET提出書類
株式会社TEIKOKU(E01761)
有価証券報告書
(2)経営者の視点による経営成績等の状況に関する分析・検討内容
経営者の視点による当社グループの経営成績等の状況に関する認識及び分析・検討内容は次のとおりであります。
なお、文中の将来に関する事項は、有価証券報告書提出日現在において判断したものであります。
①財政状態及び経営成績の状況に関する認識及び分析・検討内容
当連結会計年度における経営成績等の分析につきましては、「第2 事業の状況 4〔経営者による財政状態、経営
成績及びキャッシュ・フローの状況の分析〕 (1)経営成績等の状況の概要 ①財政状態及び経営成績の状況」に記載
のとおりであります。
②キャッシュ・フローの状況の分析・検討並びに資本の財源及び資金の流動性に係る情報
当社グループの運転資金需要のうち主なものは、製造費、販売費及び一般管理費等の営業費用であります。投資を目
的とした資金需要は、設備投資等によるものであります。
当社グループは、事業運営上必要な流動性と資金の源泉を安定的に確保することを基本方針としております。
運転資金及び設備投資資金につきましては、自己資金及び金融機関からの借入を基本としております。
なお、当連結会計年度末における借入金及びリース債務を含む有利子負債の残高は391百万円となっております。ま
た、当連結会計年度末における現金及び現金同等物の残高は9,798百万円となっております。
③重要な会計上の見積り及び当該見積りに用いた仮定
当社グループの連結財務諸表及び財務諸表は、我が国において一般に公正妥当と認められる企業会計の基準に準拠し
て作成しております。その作成には、経営者による会計方針の選択・適用、資産・負債及び収益・費用の報告金額及び
開示に影響を与える見積りを必要とします。経営者は、これらの見積りについて過去の実績等を勘案し合理的に判断し
ておりますが、実際の結果は、見積り特有の不確実性があるため、これらの見積りと異なる場合があります。
24/117
EDINET提出書類
株式会社TEIKOKU(E01761)
有価証券報告書
5【重要な契約等】
該当事項はありません。
6【研究開発活動】
当社グループは、技術開発本部を中核として、企業価値の持続的向上を目的とした研究開発活動を推進しておりま
す。主力のポンプ事業では、脱炭素社会の実現に向けたエネルギー構造の転換を成長機会と捉え、クリーンエネル
ギー分野への対応を軸とした製品開発に取り組んでおります。特に発電用途・船舶用途においては、低炭素化ニーズ
の拡大を背景に、LNGポンプの更なるラインナップ拡充による用途拡大及び顧客対応力の強化を図るとともに、燃料転
換に伴い需要拡大が見込まれる燃料供給用ポンプの開発にも注力しております。加えて、次世代発電分野であるSMR
(小型モジュール炉)への対応を見据えた技術開発にも取り組み、省エネルギー性の向上及び環境負荷低減に資する
高付加価値製品の開発を推進しております。
また、メンテナンスの強化に向け、ポンプ運転状態の遠隔監視技術の高度化に取り組んでおり、具体的には保守効
率及び設備信頼性の向上を目的として、ワイヤレス通信機能を活用した監視装置の開発を進め、設置性向上と設備情
報の可視化により、各種設備における保全サービスの高度化及び顧客付加価値の向上に貢献してまいります。
さらに、オープンイノベーションの推進により外部研究機関との連携を強化し、ポンプ効率向上に関する基礎研究
成果の早期事業化を図ることで、エネルギー効率向上と環境負荷低減の両立及び技術的優位性の確立に取り組んでお
ります。
当連結会計年度における研究開発費の総額は568百万円であります。
25/117
EDINET提出書類
株式会社TEIKOKU(E01761)
有価証券報告書
第3【設備の状況】
1【設備投資等の概要】
当社グループ(当社及び連結子会社)は、生産性の向上、品質の向上及びコスト削減を目的に総額839百万円の設備
投資を行いました。
主に当社において基幹システムのハードウェア更新に60百万円を、子会社のTEIKOKU USA INC.において工場の一部改
修や生産性向上のための機械設備に155百万円を、上月電装株式会社において生産性向上のための機械設備に58百万円
を、それぞれ投資いたしました。
また、上記の投資金額には、建設仮勘定を含めて記載しております。
なお、当社グループは「ポンプ事業」を単一の報告セグメントとしているため、セグメント情報の記載を省略してお
ります。
2【主要な設備の状況】
当社グループ(当社及び連結子会社)における主要な設備は、次のとおりであります。
(1)提出会社
(2026年3月31日現在)
帳簿価額(千円)
事業所名
(所在地)
本社及び新宮工場、
光都工場
(兵庫県たつの市)
技術開発センター
(兵庫県たつの市)
東京サービス工場
(埼玉県草加市)
設備の内容
建物及び
構築物
機械装置
及び運搬具
2,226,206
591,972
ポンプの
研究・開発
299,912
45,934
ポンプの
保守・修理
143,523
5,596
会社統括業務
ポンプ及び特殊
機器の製造
土地
(面積㎡)
838,143
(55,152.07)
リース資産
その他
合計
従業員数
(人)
256
5,396
189,844
3,851,565
−
5,642
351,489
12
−
1,076
160,346
5
−
10,150
(355.00)
(19)
(2)国内子会社
(2026年3月31日現在)
帳簿価額(千円)
会社名
(所在地)
㈱協和電機製作所
(兵庫県養父市)
上月電装㈱
(兵庫県たつの市)
㈱帝伸製作所
(兵庫県たつの市)
設備の内容
建物及び
構築物
機械装置
及び運搬具
ポンプ及び特殊
機器の製造
103,067
36,642
ポンプ及び特殊
機器の製造
154,691
196,983
ポンプの製造
76,503
92,475
土地
(面積㎡)
25,866
(7,507.30)
265,717
(22,299.07)
33,646
(5,431.20)
26/117
リース資産
その他
合計
−
275
165,851
−
2,245
619,637
−
22,901
225,527
従業員数
(人)
28
(3)
46
(9)
47
(3)
EDINET提出書類
株式会社TEIKOKU(E01761)
有価証券報告書
(3)在外子会社
(2026年3月31日現在)
会社名
(所在地)
帳簿価額(千円)
設備の内容
建物及び
構築物
機械装置
及び運搬具
196,371
263,733
642,952
703,458
ポンプの
販売
−
ポンプの
販売
土地
(面積㎡)
リース資産
その他
合計
従業員数
(人)
TEIKOKU USA INC.
(米国ペンシルバニア州
ウォーミンスター郡区・
ポンプの製造
及び販売
27,392
291,593
16,006
795,097
−
−
69,159
1,415,570
15,630
−
14,893
1,303
31,827
10
−
−
−
20,564
2,573
23,138
6
91
0
−
13,947
1,257
15,297
6
60,307
57,448
−
−
19,055
136,811
(9,840.00)
116
他)
大連帝国キャンドモータ
ポンプ有限公司
(中国遼寧省大連市・
ポンプの製造
及び販売
382
(9)
他)
TEIKOKU SOUTH
ASIA PTE LTD.
(シンガポール)
TEIKOKU ELECTRIC
GmbH
(ドイツデュッセルドル
フ市)
TEIKOKU KOREA
CO.,LTD.
ポンプの
販売
(韓国ソウル特別市)
HYDRODYNE TEIKOKU
(INDIA) PVT.LTD.
(インドタネ市)
ポンプの製造
及び販売
164
(12)
(注)1.帳簿価額のうち「その他」は、工具、器具及び備品と建設仮勘定の合計であります。
2.提出会社の設備には貸与中のものが327,005千円含まれており、その内訳は、建物及び構築物116,488千円、
機械装置及び運搬具75,097千円、土地120,331千円、その他(工具、器具及び備品)15,087千円でありま
す。
3.従業員数は就業人員であり、各事業所外又は各会社外からの出向者を含み、各事業所外又は各会社外への出
向者は含んでおりません。
なお、嘱託及びパートタイマーは、臨時雇用者として( )内に外書で記載しております。
3【設備の新設、除却等の計画】
当社グループ(当社及び連結子会社)の設備計画は、原則として各社が独自に策定しますが、グループ全体としての
重複投資を避けるために最終的に当社が調整を行っております。
当社グループの翌連結会計年度(自 2026年4月1日至 2027年3月31日)における設備の新設、改修等に係る投
資予定金額の総額は、1,711百万円であり、その所要資金は自己資金で賄う予定であります。
重要な設備の新設、除却等の計画の主なものは、以下のとおりであります。
(1)重要な設備の新設等
会社名
事業所名
㈱TEIKOKU
㈱TEIKOKU
投資予定金額
所在地
兵庫県
たつの市
設備の内容
新工場建設用土地
兵庫県
ポンプ製品等の
たつの市
試験設備
総額
既支払額
(百万円) (百万円)
資金調達方
法
2,000
−
自己資金
700
42
自己資金
着手及び完了予定
着手
完了
2025年
2029年
12月
5月
2026年
2027年
2月
3月
(注)1.工場用地を先行して取得するものであり、完成後の増加能力は未定であります。
2.ポンプ事業の生産の効率化及び将来の増産に備えるものであります。
(2)重要な設備の除却等
該当事項はありません。
27/117
完成後の
増加能力
(注)1
(注)2
EDINET提出書類
株式会社TEIKOKU(E01761)
有価証券報告書
第4【提出会社の状況】
1【株式等の状況】
(1)【株式の総数等】
①【株式の総数】
種類
発行可能株式総数(株)
普通株式
69,200,000
計
69,200,000
②【発行済株式】
種類
事業年度末現在発行数(株) 提出日現在発行数(株)
(2026年3月31日)
(2026年6月26日)
上場金融商品取引所名又は登
録認可金融商品取引業協会名
普通株式
15,780,038
15,780,038
東京証券取引所
プライム市場
計
15,780,038
15,780,038
−
(2)【新株予約権等の状況】
①【ストックオプション制度の内容】
該当事項はありません。
②【ライツプランの内容】
該当事項はありません。
③【その他の新株予約権等の状況】
該当事項はありません。
(3)【行使価額修正条項付新株予約権付社債券等の行使状況等】
該当事項はありません。
28/117
内容
単元株式数100株
−
EDINET提出書類
株式会社TEIKOKU(E01761)
有価証券報告書
(4)【発行済株式総数、資本金等の推移】
発行済株式総
数増減数
(株)
発行済株式総
数残高(株)
資本金増減額
(千円)
資本金残高
(千円)
資本準備金増
減額(千円)
資本準備金残
高(千円)
2021年7月28日
(注)1
16,600
20,440,038
10,698
3,143,675
10,698
2,931,466
2022年11月25日
(注)2
△900,000
19,540,038
−
3,143,675
−
2,931,466
2023年2月28日
(注)2
△550,000
18,990,038
−
3,143,675
−
2,931,466
2024年2月29日
(注)2
△510,000
18,480,038
−
3,143,675
−
2,931,466
2025年2月28日
(注)2
△1,600,000
16,880,038
−
3,143,675
−
2,931,466
2026年2月27日
(注)2
△1,100,000
15,780,038
−
3,143,675
−
2,931,466
年月日
(注)1.譲渡制限付株式報酬としての新株式発行
発行価格
1,289円
資本組入額
644円50銭
割当先
取締役(監査等委員である取締役及び社外取締役を除く。)5名
2.自己株式の消却による減少であります。
(5)【所有者別状況】
2026年3月31日現在
株式の状況(1単元の株式数100株)
区分
株主数(人)
所有株式数
(単元)
所有株式数の
割合(%)
政府及び地
方公共団体
金融機関
−
外国法人等
単元未満株
式の状況
(株)
金融商品取
引業者
その他の法
人
13
22
92
111
20
6,479
6,737
−
−
32,310
1,876
7,613
58,368
26
57,485
157,678
12,238
−
20.49
1.19
4.83
37.02
0.01
36.46
100.00
−
個人その他
個人以外
計
個人
(注)自己株式452,745株は、「個人その他」に4,527単元及び「単元未満株式の状況」に45株を含めて記載しておりま
す。
29/117
EDINET提出書類
株式会社TEIKOKU(E01761)
有価証券報告書
(6)【大株主の状況】
2026年3月31日現在
氏名又は名称
住所
所有株式数
(千株)
発行済株式(自己
株式を除く。)の
総数に対する所有
株式数の割合
(%)
GOLDMAN,SACHS&CO.REG
200 WEST STREET NEW YORK,NY,USA
(常任代理人 ゴールドマン・サック
(東京都港区虎ノ門2丁目6番1号)
ス証券株式会社)
1,589
10.37
日本マスタートラスト信託銀行株式会
東京都港区赤坂1丁目8番1号
社(信託口)
1,516
9.90
1,007
6.57
604
3.94
493
3.22
GOLDMAN SACHS INTERNATIONAL
PLUMTREE COURT,25 SHOE LANE,LONDON EC4A
(常任代理人 ゴールドマン・サック 4AU,U.K.
ス証券株式会社)
(東京都港区虎ノ門2丁目6番1号)
NORTHERN TRUST CO.(AVFC) RE NON
TREATY CLIENTS ACCOUNT
(常任代理人
店)
香港上海銀行東京支
50 BANK STREET CANARY WHARF LONDON E14
5NT,UK
(東京都中央区日本橋3丁目11番1号)
BBH FOR FIDELITY LOW-PRICED STOCK
FUND
(常任代理人
行)
245 SUMMER STREET BOSTON,MA 02210 USA
株式会社三菱UFJ銀
(東京都千代田区丸の内1丁目4番5号)
株式会社日本カストディ銀行
東京都中央区晴海1丁目8番12号
454
2.96
帝国電機取引先持株会
兵庫県たつの市新宮町平野60番地
422
2.75
刈田耕太郎
兵庫県たつの市
412
2.69
株式会社三井住友銀行
東京都千代田区丸の内1丁目1番2号
410
2.67
野村信託銀行株式会社(投信口)
東京都千代田区大手町2丁目2番2号
356
2.32
7,265
47.40
計
−
(注)1.上記日本マスタートラスト信託銀行株式会社の所有株式数のうち信託業務に係る株式数は485千株でありま
す。
なお、それらの内訳は、年金信託設定分4千株、投資信託設定分480千株となっております。
2.上記株式会社日本カストディ銀行の所有株式数のうち信託業務に係る株式数は363千株であります。
なお、それらの内訳は、年金信託設定分53千株、投資信託設定分310千株となっております。
3.株式会社日本カストディ銀行の所有株式数には、(信託口)、(信託A口)、(年金信託口)、(年金特金
口)、(信託口4)の所有株式数を含めて表示しております。
4.帝国電機取引先持株会は、2026年4月1日付の商号変更に伴い、TEIKOKU取引先持株会に名称変更し
ております。
5.上記野村信託銀行株式会社の所有株式数のうち信託業務に係る株式数は356千株であります。
なお、その内訳は投資信託設定分356千株であります(年金信託設定分はありません)。
30/117
EDINET提出書類
株式会社TEIKOKU(E01761)
有価証券報告書
6.2025年5月9日付で公衆の縦覧に供されている大量保有報告書(変更報告書No.2)において、SMBC日興証
券株式会社及び他2社の共同保有者が2025年4月30日現在で以下の株式を所有している旨が記載されている
ものの、株式会社三井住友銀行を除き、当社として2026年3月31日現在における実質所有株式数の確認がで
きませんので、上記大株主の状況には含めておりません。
なお、その大量保有報告書の内容は次のとおりであります。
氏名又は名称
住所
保有株券等の数株券等保有割合
(千株)
(%)
SMBC日興証券株式会社
東京都千代田区丸の内3丁目3番
1号
8
0.05
株式会社三井住友銀行
東京都千代田区丸の内1丁目1番
2号
410
2.43
三井住友DSアセットマネジメント株
式会社
東京都港区虎ノ門1丁目17番1
号虎ノ門ヒルズビジネスタワー
26階
459
2.72
7.2025年8月25日付で公衆の縦覧に供されている大量保有報告書(変更報告書No.7)において、株式会社
ヴァレックス・パートナーズが2025年8月18日現在で以下の株式を所有している旨が記載されているもの
の、当社として2026年3月31日現在における実質所有株式数の確認ができませんので、上記大株主の状況に
は含めておりません。
なお、その大量保有報告書の内容は次のとおりであります。
氏名又は名称
住所
株式会社ヴァレックス・パートナー
ズ
東京都中央区日本橋茅場町1丁目
6番17号
保有株券等の数株券等保有割合
(千株)
(%)
2,946
17.45
8.2025年9月5日付で公衆の縦覧に供されている大量保有報告書(変更報告書No.2)において、エフエム
アール エルエルシー(FMR LLC)が2025年8月29日現在で以下の株式を所有している旨が記載されている
ものの、当社として2026年3月31日現在における実質所有株式数の確認ができませんので、上記大株主の状
況には含めておりません。
なお、その大量保有報告書の内容は次のとおりであります。
氏名又は名称
エフエムアール
(FMR LLC)
エルエルシー
住所
245 Summer Street, Boston,
Massachusetts 02210, USA
31/117
保有株券等の数株券等保有割合
(千株)
(%)
1,245
7.38
EDINET提出書類
株式会社TEIKOKU(E01761)
有価証券報告書
(7)【議決権の状況】
①【発行済株式】
2026年3月31日現在
区分
株式数(株)
議決権の数(個)
内容
無議決権株式
−
−
−
議決権制限株式(自己株式等)
−
−
−
議決権制限株式(その他)
−
−
−
−
−
完全議決権株式(自己株式等)
普通株式
452,700
完全議決権株式(その他)
普通株式
15,315,100
単元未満株式
普通株式
12,238
−
−
発行済株式総数
15,780,038
−
−
総株主の議決権
−
153,151
153,151
−
−
②【自己株式等】
所有者の氏名又
は名称
所有者の住所
㈱帝国電機製作所
計
2026年3月31日現在
発行済株式総数に
対する所有株式数
の割合(%)
自己名義所有株
式数(株)
他人名義所有株
式数(株)
所有株式数の合
計(株)
兵庫県たつの市新
宮町平野60番地
452,700
−
452,700
2.87
−
452,700
−
452,700
2.87
(注)当社は、2026年4月1日をもって商号を「株式会社TEIKOKU」に変更いたしました。
32/117
EDINET提出書類
株式会社TEIKOKU(E01761)
有価証券報告書
2【自己株式の取得等の状況】
【株式の種類等】
会社法第155条第3号に該当する普通株式の取得、会社法第155条第7号に該当する普通株式の取
得及び会社法第155条第13号に該当する普通株式の取得
(1)【株主総会決議による取得の状況】
該当事項はありません。
(2)【取締役会決議による取得の状況】
区分
株式数(株)
取締役会(2025年11月18日)での決議状況
(取得期間2025年11月19日〜2026年1月30日)
価額の総額(千円)
1,300,100
3,495,968
−
−
1,286,400
3,459,129
13,700
36,839
当事業年度の末日現在の未行使割合(%)
1.1
1.1
当期間における取得自己株式
−
−
提出日現在の未行使割合(%)
1.1
1.1
当事業年度前における取得自己株式
当事業年度における取得自己株式
残存決議株式の総数及び価額の総額
(3)【株主総会決議又は取締役会決議に基づかないものの内容】
区分
株式数(株)
価額の総額(千円)
当事業年度における取得自己株式
265
134
当期間における取得自己株式
75
−
(注)1.当事業年度における取得自己株式は、従業員持株会向け譲渡制限付株式インセンティブの無償取得225株及
び単元未満株式の買取り40株であります。
2.当期間における取得自己株式は、従業員持株会向け譲渡制限付株式インセンティブの無償取得75株でありま
す。
3.当期間における取得自己株式数には、2026年6月1日から有価証券報告書提出日までの単元未満株式の買取
り及び売渡による株式は含まれておりません。
(4)【取得自己株式の処理状況及び保有状況】
当事業年度
区分
株式数(株)
引き受ける者の募集を行った取得自己株式
消却の処分を行った取得自己株式
保有自己株式数
処分価額の総額
処分価額の総額
株式数(株)
(千円)
(千円)
−
−
−
−
1,100,000
2,892,022
−
−
−
−
−
−
4,900
15,925
−
−
452,745
−
452,820
−
合併、株式交換、株式交付、会社分割に係る移転を
行った取得自己株式
その他
(譲渡制限付株式報酬としての自己株式の処分)
当期間
(注)1.保有自己株式数は受渡ベースで記載しております。
2.当期間における保有自己株式数には、2026年6月1日から有価証券報告書提出日までの単元未満株式の買取
り及び売渡による株式は含まれておりません。
33/117
EDINET提出書類
株式会社TEIKOKU(E01761)
有価証券報告書
3【配当政策】
当社は、2025年3月期から2027年3月期までの中期経営計画期間について、設備投資計画や資本効率改善等を勘案
し、3ヶ年累計の総還元性向100%(うち配当性向50%を目安)を目標としております。なお、剰余金の配当は中間配
当と期末配当の年2回行っており、それぞれの決定機関は、期末配当については株主総会、中間配当については取締役
会であります。
当事業年度の期末配当につきましては、上記方針に基づき、1株当たり78円とすることを2026年6月29日開催予定の
定時株主総会で決議する予定であります。当該議案が承認可決された場合、当期の年間配当は1株当たり133円(うち中
間配当55円)となる予定であります。
また、内部留保の資金につきましては、設備投資等に充当してまいりたいと考えております。
当社は、「取締役会の決議により、毎年9月30日を基準日として、中間配当を行うことができる。」旨を定款に定め
ております。
なお、当事業年度に係る剰余金の配当は以下のとおりであります。
決議年月日
2025年11月10日
取締役会決議
2026年6月29日
定時株主総会決議(予定)
配当金の総額(百万円)
1株当たり配当額(円)
913
55.0
1,195
78.0
34/117
EDINET提出書類
株式会社TEIKOKU(E01761)
有価証券報告書
4【コーポレート・ガバナンスの状況等】
(1)【コーポレート・ガバナンスの概要】
① コーポレート・ガバナンスに関する基本的な考え方
当社は、2021年12月20日開催の取締役会において、創業以来の社是である「みんなで良くなろう」「誠実に事に当た
ろう」「積極的にやろう」の下に、当社の存在意義、目指していく方向性を示した経営理念と、それを実現するための
行動指針を策定しております。
また、2025年4月14日開催の取締役会において、10年後のありたい姿を全役職員で共有し、その実現に向けて一人一
人が主体的に挑戦することで、社是を体現した働きがいのある会社となることを目指し、グループビジョンを策定いた
しました。
当社は、この社是・経営理念・グループビジョン・行動指針に則って事業活動を行うことにより、当社の全ての従業
員に幸せを感じてもらえる会社であり続けることを目標とするとともに、顧客、株主等を含む全てのステークホルダー
との良好な関係を維持・発展させ、社会的要請や期待に応えていくことで、長期的・継続的な企業価値の向上を目指し
てまいります。
これに加え、公正な意思決定のもと、健全かつ効率的な業務執行ができるよう、経営環境の変化に応じた最適なコー
ポレート・ガバナンス体制の構築に取組んでおります。
また、当社では経営企画部が中心となり、コーポレート・ガバナンスの強化を図るとともに、ステークホルダーに対
する積極的な情報発信とコミュニケーションを行っております。
②
企業統治の体制の概要及び当該体制を採用する理由
イ.当社の企業統治の体制の概要
当社は、会社法上の機関設計として監査等委員会設置会社を選択しております。2026年6月26日現在の経営体制
は、取締役(監査等委員である取締役を除く。)4名(うち社外取締役1名)、監査等委員である取締役4名(うち
社外取締役3名)であります。加えて、経営の意思決定及び監督機能と業務執行機能を分離することにより、意思決
定の効率化と迅速化を図ることを目的として執行役員制度を採用しております。2026年6月26日現在の執行役員は6
名(取締役を兼務する執行役員を含む。)であります。また、指名委員会等設置会社における指名委員会及び報酬委
員会と同様の機能を果たす機関として、任意の「指名委員会」、「報酬委員会」を設けております。
「取締役会」は、取締役8名(うち監査等委員である取締役4名)で構成されており、法令、定款及び取締役会規
則に定められた事項、その他経営に関する重要事項の決議を行い、また職務の執行の監督を行っております。
取締役会は原則として毎月1回定例の取締役会を開催するほか、経営環境の変化に的確かつ迅速に対応するため、
必要に応じ臨時に取締役会を開催しております。なお、当事業年度において開催された取締役会は13回であります。
「経営会議」は、取締役会により選任された執行役員6名(取締役を兼務する執行役員を含む。)で構成されてお
り、代表取締役社長が議長を務めております。代表取締役社長は取締役会より委任された事項に関して、経営会議の
場で機動的に協議・意思決定を行い、業務執行部門の指揮を執ります。なお、当事業年度において開催された経営会
議は14回であります。経営会議には常勤監査等委員もオブザーバーとして参加しており、監査等委員会の監査機能強
化を図っております。
「指名委員会」は、役員の指名等に係る公正性・透明性・客観性を確保するため任意に設置しております。委員
は、総務・人事担当取締役、社外取締役、監査等委員である取締役で構成されております。委員の過半数が社外取締
役であり、かつ社外取締役が委員長を務めており、役員の選解任に関する取締役会の諮問に対して答申を行っており
ます。なお、当事業年度において開催された指名委員会は2回であります。
「報酬委員会」は、取締役(監査等委員を除く。)の報酬決定に係る公正性・透明性・客観性を確保するため任意
に設置しております。委員は、代表取締役社長、監査等委員である取締役及び社外取締役で構成されております。委
員の過半数が社外取締役であり、かつ社外取締役が委員長を務めており、個別の取締役報酬に関する取締役会の諮問
に対して答申を行っております。なお、当事業年度において開催された報酬委員会は2回であります。
※当社は、2026年6月29日開催予定の定時株主総会の議案として「取締役(監査等委員である取締役を除く。)3名
選任の件」及び「監査等委員である取締役4名選任の件」を提案しており、当該議案が承認可決されると、当社は
取締役(監査等委員である取締役を除く。)3名(うち社外取締役0名)、監査等委員である取締役4名(うち社
外取締役3名)となります。また、同定時株主総会の直後に開催が予定されている取締役会の決議事項として「代
表取締役執行役員および役付取締役執行役員選任の件」及び「取締役執行役員および執行役員選任の件」が付議さ
れる予定であります。これらが承認可決された場合の取締役会の構成員及び執行役員については、後記「(2)
〔役員の状況〕 ①b.」のとおりであります。
35/117
EDINET提出書類
株式会社TEIKOKU(E01761)
有価証券報告書
また、当社は、「リスク管理委員会」を設置し、気候変動リスクを含む各種リスクの抽出や対策の検討及び財務報
告に係る内部統制の整備・運用・評価等を行っております。リスク管理委員会の常任委員は執行役員で構成され、代
表取締役社長が委員長を務めております。事務局は経営企画部が担当しております。常勤監査等委員もリスク管理委
員会に参加し、各部門から抽出されるリスクや財務報告に係る内部統制の状況等を監視することにより監査等委員会
の機能強化を図っております。また、リスク管理委員会の活動状況については、取締役会に報告されております。
ロ.当該体制を採用する理由
当社は、構成員の過半数を社外取締役とする監査等委員会を置き、監査等委員が取締役会で議決権を行使すること
を通じて取締役会の監督機能を強化し、コーポレート・ガバナンスを一層強化するとともに、執行役員制度を導入
し、経営上の意思決定と業務執行を分離し、意思決定の効率化と迅速化を図るため、当該体制を採用しております。
36/117
EDINET提出書類
株式会社TEIKOKU(E01761)
有価証券報告書
ハ.会社の機関・内部統制の関係
有価証券報告書提出日現在の取締役会、経営会議、指名委員会、報酬委員会の構成員及び議長は以下のとおりでありま
す。
地位
氏名
取締役会
経営会議
指名委員会
報酬委員会
代表取締役社長執行役員
村田
潔
◎
◎
○
取締役常務執行役員
佐藤哲造
○
○
取締役執行役員
阿部孝司
○
○
○
社外取締役
渡真利千恵
○
○
○
取締役常勤監査等委員
加減孝司
○
○
○
社外取締役監査等委員
林
晃史
○
○
〇
社外取締役監査等委員
川島一郎
○
◎
○
社外取締役監査等委員
沖
剛誠
○
○
◎
執行役員
杉本洋一郎
○
執行役員
森澤友和
○
執行役員
横山
淳
○
(注)◎は議長・委員長、○は構成員を表しております。
※当社は2026年6月29日開催予定の第122期定時株主総会の議案として「取締役(監査等委員である取締役を除く。)
3名選任の件」及び「監査等委員である取締役4名選任の件」を提案しております。また、当該定時株主総会の直後
に開催が予定されている取締役会の決議事項として代表取締役及び役付取締役並びに執行役員選任に関する事項が付
議される予定であり、これらが承認可決された場合の当社のコーポレート・ガバナンス体制を支える主な機関及び機
関ごとの構成員等の概要は、以下のとおりとなる予定であります。
地位
氏名
取締役会
経営会議
指名委員会
報酬委員会
代表取締役社長執行役員
村田
潔
◎
◎
○
取締役常務執行役員
佐藤哲造
○
○
取締役執行役員
阿部孝司
○
○
○
取締役常勤監査等委員
加減孝司
○
○
○
社外取締役監査等委員
沖
剛誠
○
○
○
社外取締役監査等委員
渡真利千恵
○
○
◎
社外取締役監査等委員
細田祥子
○
◎
○
執行役員
杉本洋一郎
○
執行役員
森澤友和
○
執行役員
横山
淳
○
(注)◎は議長・委員長、○は構成員を表しております。
37/117
EDINET提出書類
株式会社TEIKOKU(E01761)
有価証券報告書
③
企業統治に関するその他の事項
イ.内部統制システムの整備の状況
当社は、法令に基づき、取締役会において次のとおり「内部統制システム構築の基本方針」を決議し、内部統制シ
ステムの整備を行っております。
1.取締役の職務の執行に係る情報の保存及び管理に関する体制
当社は、保有する情報関連資産の管理に関わる基本原則である「情報管理に係る基本方針」及びそれに付随する
諸規定に基づき情報の保存・管理を行う。各部署に情報の保存・管理に関わる責任者を設置し、その総括窓口を経
営企画部とする。
2.当社企業グループの損失の危険の管理に関する規程その他の体制
当社は、業務執行に係るリスク管理を統括する組織として、代表取締役社長を委員長とし、執行役員を常任委員
とするリスク管理委員会を設置し、リスクの抽出・評価・管理を行う。個々のリスクについての管理責任者は、当
該業務を担当する部門の執行役員を務める常任委員とする。委員会が必要と認めるときは、各部門から任命された
非常任委員や委員以外の者を会議に出席させ、意見を聴取することができる。リスク管理委員会の委員長は、活動
状況を取締役会に報告する。
リスク管理委員会は、金融商品取引法が求める財務報告に係る内部統制についても、財務報告の適正性を確保す
るための整備状況及び運用状況について審議を行う。
当社では、大震災等の災害や感染症が発生した場合のBCP(事業継続計画)の一環として「危機管理規定」を
制定しており、不測の事態が発生した場合には、必要に応じ代表取締役社長を本部長とする対策本部を設置、全役
職員が一体となって危機に対応し、被害の発生を防止し、又は損害の拡大を最小限にとどめる体制をとる。グルー
プ各社は当社の「危機管理規定」を準用する。
3.当社企業グループの取締役の職務執行の効率的な実施を確保する体制
当社は、「取締役会規則」に基づき、定例の取締役会を原則として1か月に1回開催するほか、必要に応じて適
宜臨時に開催するものとする。
取締役会は、重要な業務執行のうち、取締役会の決議が必要である事項以外について、代表取締役社長に対する
権限委譲を行い、事業運営に関する迅速な意思決定及び機動的な職務執行を推進する。
代表取締役社長は自らが議長を務める経営会議での決定に基づき効率的な業務執行を行う。経営会議は、執行役
員で構成され、各執行役員の業務執行については、「組織規定」、「職務分掌規定」等において、それぞれの責任
者及びその責任、執行手続について定めることとする。
グループ各社は、「関係会社管理規定」及び「海外子会社管理規定」に基づき、事業状況、財務状況その他の重
要事項については、当社に対し定期的な報告を行うとともに、定期的に開催する取締役会において経営管理情報の
共有を図りながら、業務執行の適正を確保する体制を確保する。また、グループ各社は、当社の監査室による定期
的な内部監査の対象とし、監査の結果は当社の代表取締役社長及び取締役会に報告を行う。
4.当社企業グループの取締役及び使用人の職務の執行が法令及び定款に適合することを確保するための体制
当社は、グループ企業全てに適用するコンプライアンス体制の基礎として、「TEIKOKUグループ行動規
範」を定める。また、各部署及びグループ各社にコンプライアンス責任者を設置し、経営企画部がそれを統括す
る。経営企画部は、コンプライアンス体制の整備・維持・向上を推進するため、各部署及びグループ各社の責任者
を通じ、全社員に対し指導・徹底を行い、必要に応じ研修・勉強会を実施する。
当社は、内部通報制度を設け、役職員が、社内においてコンプライアンス違反行為が行われ、又は行われようと
していることに気がついたときは、常勤監査等委員又は社外弁護士に通報しなければならないと定める。グループ
各社は当社の内部通報制度を準用する。当社及びグループ各社には、通報内容の守秘義務があり、通報者に対して
不利益な扱いを行わない。
反社会的勢力排除に向けた基本的な考え方とその整備状況については、当社企業グループは反社会的勢力や団体
に対しては、毅然とした態度・行動で臨み、一切の関係を遮断する。「TEIKOKUグループ行動規範」にその
旨を明文化し、役職員全員に周知徹底するとともに、平素より関係行政機関等からの情報収集に努め、事案の発生
時には関係行政機関や法律の専門家と緊密に連絡を取り、組織全体として速やかに対処できる体制を構築してい
る。
38/117
EDINET提出書類
株式会社TEIKOKU(E01761)
有価証券報告書
5.当社企業グループにおける業務の適正を確保するための体制
当社は、グループ企業全てに適用する行動規範として「TEIKOKUグループ行動規範」を定め、これを基礎
としてグループ各社で諸規定を定めるものとする。各部署及びグループ各社に、情報管理責任者・コンプライアン
ス責任者を置くとともに、経営企画部がグループ全体の情報管理及びコンプライアンス体制を統括・推進する体制
とする。
また、内部監査部門である監査室は、当社及びグループ各社に対し財務報告に係る内部統制評価を含む内部監査
を実施し、当社グループの内部統制の有効性を評価する。内部監査計画及び内部監査結果については、監査室が代
表取締役社長及び取締役会へ直接報告を行う。取締役会は、監査室の報告内容を踏まえ、必要に応じ監査室に調
査、監査等の指示を行う。
なお、グループ各社の経営については、その自主性を尊重しつつ、業務内容の定期的な報告と重要案件について
の事前協議を行う。
6.監査等委員会の職務を補助すべき取締役及び使用人に関する体制と当該取締役及び使用人の取締役(当該取締役
及び監査等委員である取締役を除く。)からの独立性に関する事項、及び当該使用人に関する指示の実効性に関す
る事項
当社は、監査等委員会がその職務を補助すべき取締役及び使用人を置くことを求めた場合、代表取締役社長は内
部監査部門を中心に人選を行い、その任(兼任)に充てるものとする。また、監査等委員でない取締役の中から、
取締役会の決議によって、監査等委員の監査等を補助する職責を担う「監査等特命取締役」を選任することができ
る。当社監査等委員会の職務の補助を担当する取締役及び使用人は、監査等委員会からの要請、指示された事項を
最優先に行うものとするとともに、当該取締役及び使用人の異動等人事については監査等委員会の同意を要するも
のとし、独立性を確保する。
7.当社企業グループの取締役(監査等委員である取締役を除く。)及び使用人等が当社の監査等委員会に報告をす
るための体制その他の監査等委員会への報告に関する体制及び監査等委員会の監査が実効的に行われることを確保
するための体制
当社企業グループの取締役及び使用人等(以下「役職員」という)は、当社企業グループに著しい損害を及ぼす
おそれのある事実又は取締役による重大な法令・定款違反行為があることを発見したとき、また、これらの者から
これらの事実について報告を受けたときは、直ちに当社の監査等委員会に報告する。また、「監査等委員会規則」
で、監査等委員は必要に応じ、又は定例の監査等委員会において役職員から報告を受ける旨を規定する。
監査等委員は、取締役会に出席するほか、監査等委員会が選定した監査等委員は、重要な意思決定の過程及び業
務の執行状況を把握するため、社内の重要な会議に出席するとともに、主要な稟議書その他業務執行に関する重要
な文書を閲覧し、必要に応じて当社企業グループの役職員にその説明を求めることができるものとする。当社企業
グループの役職員は、当社監査等委員会が選定した監査等委員から業務執行に関する事項について報告を求められ
たときは、速やかに報告を行うものとする。
8.監査等委員会へ報告をした者が当該報告をしたことを理由として不利な扱いを受けないことを確保する体制
当社は、監査等委員会へ報告を行った当社企業グループの役職員に対し、当該報告をしたことを理由として不利
益な取り扱いを行うことを禁止し、その旨を当社企業グループの役職員に周知徹底する。
9.監査等委員の職務の執行について生ずる費用又は債務の処理、費用の前払い又は償還の手続きに係る方針
監査等委員がその職務の執行(監査等委員会の職務の執行に関するものに限る。)について費用の前払い等を請
求した場合は、会社は監査等委員の当該職務の執行に必要でないと認められるときを除きこれを拒むことができな
い。
39/117
EDINET提出書類
株式会社TEIKOKU(E01761)
有価証券報告書
ロ.責任限定契約の内容の概要
当社と社外取締役及び監査等委員である取締役は、会社法第427条第1項の規定に基づき、同法第423条第1項の損
害賠償責任を限定する契約を締結しております。当該契約に基づく損害賠償責任の限度額は、法令の定める最低責任
限度額としております。なお、当該責任限定が認められるのは、当該社外取締役が責任の原因となった職務の遂行に
ついて善意でかつ重大な過失がないときに限られます。
ハ.役員等との間で締結している補償契約の内容の概要
当社は、当社全ての取締役との間で、会社法第430条の2第1項に規定する補償契約を締結しており、同項第1号
の費用及び同項第2号の損失を法令の定める範囲内において当社が補償することとしています。ただし、当該補償契
約によって会社役員の職務の執行の適正性が損なわれないようにするため、当社が取締役に対して責任追及を行った
場合や取締役が職務を行うにつき悪意又は重大な過失があったことにより損害を賠償する責任を負う場合等における
防御費用等については補償の対象外とすること等、一定の制限を設けております。
ニ.役員等を被保険者として締結している役員等賠償責任保険契約の内容の概要
当社は、当社及び当社子会社全ての取締役、監査役、執行役員及び管理職の全員を被保険者とする会社法第430条
の3第1項に規定する役員等賠償責任保険契約を保険会社との間で締結しております。当該保険契約では、被保険者
が会社の役員等の地位に基づき行った行為(不作為を含む。)に起因して損害賠償請求がなされたことにより、被保
険者が被る損害賠償金や訴訟費用が填補されることとなります。ただし、贈収賄等の犯罪行為や意図的に違法行為を
行った役員自身の損害等は補償対象外とすることにより、役員等の職務執行の適正性が損なわれないように措置を講
じております。保険料は全額当社及び当社子会社が負担しております。
ホ.取締役の定数
当社の取締役(監査等委員である取締役を除く。)は9名以内とする旨定款に定めております。
また、当社の監査等委員である取締役は4名以内とする旨定款に定めております。
へ.取締役の選任の決議要件
当社は、取締役の選任決議について、議決権を行使することができる株主の議決権の3分の1以上を有する株主が
出席し、その議決権の過半数をもって行う旨及び累積投票によらないものとする旨を定款に定めております。
ト.自己株式取得の決定機関
当社は、会社法第165条第2項の規定により、取締役会の決議によって市場取引等により自己の株式を取得できる
旨定款に定めております。これは、機動的に自己株式の取得を行うことを目的とするものであります。
チ.剰余金の配当等の決定機関
当社は、会社法第454条第5項の規定により、取締役会の決議によって毎年9月30日を基準日として中間配当を行
うことができる旨定款に定めております。これは、資本政策の機動性を確保するためのものであります。
リ.株主総会の特別決議要件
当社は、会社法第309条第2項に定める株主総会の特別決議要件について、議決権を行使することができる株主の
議決権の3分の1以上を有する株主が出席し、その議決権の3分の2以上をもって行う旨定款に定めております。こ
れは、株主総会における特別決議の定足数を緩和することにより、株主総会の円滑な運営を行うことを目的とするも
のであります。
ヌ.子会社の業務の適正を確保するための体制整備の状況
子会社の業務の適正を確保するための体制整備の状況につきましては、「イ.内部統制システムの整備の状況」に
記載のとおりであります。
40/117
EDINET提出書類
株式会社TEIKOKU(E01761)
有価証券報告書
ル.取締役会、経営会議、指名委員会、報酬委員会の活動状況
a.取締役会の活動状況
2025年度における活動状況は次のとおりであります。
地
位
氏
出席日数 / 開催日数
名
(議長)
13日 / 13日
代表取締役社長執行役員
村田
潔
取締役常務執行役員
佐藤
哲造
13日 / 13日
取締役執行役員
阿部
孝司
12日 / 13日
社外取締役
渡真利
取締役常勤監査等委員
加減
孝司
13日 / 13日
社外取締役監査等委員
林
晃史
13日 / 13日
社外取締役監査等委員
川島
一郎
13日 / 13日
社外取締役監査等委員
沖
剛誠
13日 / 13日
13日 / 13日
千恵
<取締役会の主な審議内容>
・2026年度経営計画
・資本政策
・グループビジョンの策定
・国内及び海外子会社の設備投資計画
・国内子会社(㈱平福電機製作所)解散
・役員報酬制度改定
・人財育成
・政策保有株式の検証を含む資本政策
b.経営会議の活動状況
2025年度における活動状況は次のとおりであります。
地
位
氏
出席日数 / 開催日数
名
(議長)
14日 / 14日
代表取締役社長執行役員
村田
潔
取締役常務執行役員
佐藤
哲造
14日 / 14日
取締役執行役員
阿部
孝司
14日 / 14日
執行役員
杉本
洋一郎
14日 / 14日
執行役員
森澤
友和
14日 / 14日
執行役員
横山
淳
14日 / 14日
<経営会議の主な審議内容>
・人事関連施策
・情報システムに関する中期戦略
・脱炭素ビジネスの見通しと営業方針
41/117
EDINET提出書類
株式会社TEIKOKU(E01761)
有価証券報告書
c.指名委員会の活動状況
2025年度における活動状況は次のとおりであります。
氏
名
出席日数 / 開催日数
取締役執行役員
阿部
孝司
2日 / 2日
社外取締役
渡真利
取締役常勤監査等委員
加減
孝司
2日 / 2日
社外取締役監査等委員
林
晃史
2日 / 2日
社外取締役監査等委員
川島
一郎
社外取締役監査等委員
沖
剛誠
地
位
2日 / 2日
千恵
(委員長)
2日 / 2日
2日 / 2日
<指名委員会の主な審議内容>
・監査等委員である取締役を除く次期役員候補
・監査等委員である取締役を除く社外取締役候補
・次期執行役員候補
d.報酬委員会の活動状況
2025年度における活動状況は次のとおりであります。
地
位
氏
出席日数 / 開催日数
名
代表取締役社長執行役員
村田
潔
2日 / 2日
社外取締役
渡真利
千恵
2日 / 2日
取締役常勤監査等委員
加減
孝司
2日 / 2日
社外取締役監査等委員
林
晃史
2日 / 2日
社外取締役監査等委員
川島
一郎
2日 / 2日
社外取締役監査等委員
沖
剛誠
(委員長)
<報酬委員会の主な審議内容>
・役員報酬案
・当事業年度の各業務執行取締役の目標設定
42/117
2日 / 2日
EDINET提出書類
株式会社TEIKOKU(E01761)
有価証券報告書
ヲ.株式会社の支配に関する基本方針について
当社は、2008年4月24日開催の取締役会において、当社の財務及び事業の方針の決定を支配する者の在り方に関す
る基本方針を決議しており、その内容等(会社法施行規則第118条第3号に掲げる事項)は、次のとおりでありま
す。
当社は、「みんなで良くなろう」「誠実に事に当たろう」「積極的にやろう」という社是のもと、1939年の創業以
来、鉄道信号機の製造・販売や電気自動車の開発等、常に研究開発型企業として成長を続けてまいりました。この永
年にわたって培われた技術の積重ねによって、1960年に独自技術で当社の現在の主力製品である完全無漏洩の「テイ
コクキャンドモータポンプ」の開発に成功し、それが現在まで続く当社発展の原動力となっております。キャンド
モータポンプは、有害な液体や危険な液体を絶対に外部へ漏らさないという構造的特徴を持っており、人や地球環境
に最も優しいポンプとして地球環境問題に大きく貢献しております。そして、当社はその製造や製品検査に関する装
置の開発等、製造にかかわる技術も自社開発に徹しており、その結果としてこれらについての特許も数多く取得して
おります。また、当社のキャンドモータポンプは、顧客の多様な要求を満足させるために個別受注生産をしておりま
す。その構造的特徴から危険な現場で使用されることも多く、高い信頼性や長期に渡る過酷な使用環境に耐え得るだ
けの耐久性も要求されるため、その営業・設計には製品に対する深い知識のみならず、顧客の使用条件に対応できる
豊富な知識と経験・ノウハウが必要となり、製造には高度な熟練技術を要します。そのため当社では、研究開発から
製造、販売、メンテナンスまで一貫したサポート体制を構築しており、顧客との長期的な信頼関係を築くことによ
り、これらの経験やノウハウを蓄積しております。
このように、当社事業は地道な研究開発や数多くの納入実績に裏打ちされた経験やノウハウ、長期的な視点に基づ
く設備投資や人財育成、取引先や地域社会との信頼関係等、永年にわたる努力の積重ねの上に成立しております。
当社の企業価値の源泉は、社是のもとこれらを支える豊富な知識と経験を持つ人財であること、及び脈々と受け継
がれてきた経営資源や社風、そして株主を始めとしたステークホルダーとの信頼関係が企業価値や株主共同の利益を
支える基盤であるということが、当社の現状に対する基本認識であります。
当社を支配する者の在り方については、当社は株式公開会社であり、当社株式の大量取得を目的とする買付であっ
ても、それが当社の企業価値・株主共同の利益に資するものであれば一概に否定するものではありません。また、株
式会社の支配権の移転を伴う買収提案についての判断は、最終的には株主の判断に委ねられるべきものであると考え
ております。
しかしながら、その目的、方法等において、企業価値・株主共同の利益を著しく毀損するおそれのある買付を行う
者は、当社の財務及び事業の方針の決定を支配する者として不適切であると考えております。その判断にあたって
は、当該買付者の事業内容及び将来の事業計画並びに過去の投資行動等から、慎重に当該買付行為又は買収提案の当
社企業価値・株主共同の利益への影響等を検討し、判断する必要があると認識しております。
現在のところ、当社の株式を大量に取得しようとする者の存在によって、具体的な脅威が生じているわけではな
く、また、当社としても、そのような買付者が出現した場合の具体的な取組み(いわゆる「買収防衛策」)をあらか
じめ定めるものではありませんが、当社株式の取引や異動の状況を常に注視するとともに、危機対応マニュアルに基
づいて社内体制を整え、役割分担・対応方法等を明確にして、当社株式を大量に取得し、当社の企業価値・株主共同
の利益を毀損する者が出現した場合に備えております。
具体的には、社外の専門家を含めて当該買収提案の評価や取得者との交渉を行い、当社の企業価値・株主共同の利
益に資さない場合には、具体的な対抗措置の要否及び内容等を速やかに決定し、実行する体制を整えております。
43/117
EDINET提出書類
株式会社TEIKOKU(E01761)
有価証券報告書
(2)【役員の状況】
① 役員一覧
a. 2026年6月26日(有価証券報告書提出日)現在の当社の役員の状況は、以下のとおりであります。
男性7名女性1名 (役員のうち女性の比率12.5%)
役職名
氏名
生年月日
略歴
1985年4月
2015年2月
2015年9月
2018年4月
2018年6月
2019年1月
2019年6月
代表取締役
社長執行役員
2019年9月
村田
潔
1962年7月18日生
2019年11月
2020年5月
2021年6月
2023年4月
2023年6月
2024年1月
2024年6月
2025年4月
1986年4月
2007年10月
2009年4月
2012年1月
2013年10月
2018年4月
2019年1月
2019年6月
2019年9月
2020年4月
2020年6月
取締役
常務執行役員
営業本部長
兼生産本部長
佐藤
哲造
1964年2月28日生
2021年2月
2024年1月
2024年6月
2025年4月
2025年6月
44/117
株式会社太陽神戸銀行(現株式会社三井住
友銀行)入行
当社入社
当社総務本部総務部長
当社総務本部経営企画部長
当社経営企画本部長兼経営企画部長
当社執行役員経営企画本部長兼経営企画部
長
TEIKOKU USA INC.取締役(現任)
TEIKOKU SOUTH ASIA PTE LTD.取締役(現
任)
TEIKOKU ELECTRIC GmbH取締役(現任)
TEIKOKU KOREA CO.,LTD.取締役(現任)
当社取締役執行役員経営企画本部長兼経営
企画部長
当社取締役執行役員総務本部長兼経営企画
部長
株式会社協和電機製作所取締役(現任)
上月電装株式会社取締役(現任)
株式会社帝伸製作所取締役(現任)
株式会社平福電機製作所取締役
HYDRODYNE TEIKOKU(INDIA) PVT.LTD.取締
役(現任)
大連帝国キャンドモータポンプ有限公司董
事
当社取締役常務執行役員総務本部長兼経営
企画部長
当社取締役常務執行役員総務本部長
当社取締役専務執行役員総務本部長
台湾帝国ポンプ股份有限公司董事
当社代表取締役社長執行役員(現任)
大連帝国キャンドモータポンプ有限公司董
事(現任)
台湾帝国ポンプ股份有限公司董事(現任)
当社入社
当社国内営業本部東日本営業部長
当社生産本部調達部長
当社国内営業本部西日本営業部長
当社生産本部生産管理部長
当社生産管理副本部長兼調達部長
当社調達本部長兼調達部長
当社執行役員調達本部長兼調達部長
当社執行役員生産副本部長兼開発部長
当社執行役員技術開発本部長兼開発部長
当社取締役執行役員営業本部長
大連帝国キャンドモータポンプ有限公司董
事長(現任)
TEIKOKU USA INC.取締役(現任)
TEIKOKU SOUTH ASIA PTE LTD.取締役(現
任)
TEIKOKU ELECTRIC GmbH取締役(現任)
TEIKOKU KOREA CO.,LTD.取締役(現任)
HYDRODYNE TEIKOKU(INDIA) PVT.LTD.取締
役(現任)
台湾帝国ポンプ股份有限公司董事長(現
任)
当社取締役常務執行役員営業本部長兼国際
事業部長
当社取締役常務執行役員営業本部長
当社取締役常務執行役員営業本部長兼生産
本部長(現任)
任期
所有株式
数(千
株)
(注)2
21
(注)2
104
EDINET提出書類
株式会社TEIKOKU(E01761)
有価証券報告書
役職名
氏名
生年月日
略歴
1987年4月
2020年4月
2020年9月
2021年6月
2024年6月
取締役
執行役員
阿部
孝司
1964年10月18日生
総務本部長
1984年4月
1999年8月
2014年1月
2016年1月
2017年4月
社外取締役
渡真利
千恵
1961年5月29日生
2019年5月
2023年4月
2023年6月
2024年6月
1986年4月
2007年10月
2009年4月
2012年4月
2012年10月
2014年1月
2015年9月
取締役
(常勤監査等委員)
加減
孝司
1963年8月7日生
2017年4月
2017年6月
2017年10月
2018年4月
2019年1月
2019年9月
2020年6月
2021年6月
2022年2月
2024年4月
2024年6月
1990年4月
取締役
(監査等委員)
林
晃史
1959年9月18日生
2009年5月
2012年4月
2015年6月
2015年9月
2016年4月
2016年6月
2017年1月
2022年4月
45/117
任期
株式会社太陽神戸銀行(現株式会社三井住
友銀行)入行
当社入社
当社総務本部長付部長
TEIKOKU USA INC.取締役
当社取締役(常勤監査等委員)
当社取締役執行役員総務本部長(現任)
株式会社協和電機製作所取締役(現任)
上月電装株式会社取締役(現任)
株式会社帝伸製作所取締役(現任)
株式会社平福電機製作所取締役
(注)2
TEIKOKU USA INC.取締役(現任)
大連帝国キャンドモータポンプ有限公司董
事(現任)
台湾帝国ポンプ股份有限公司董事(現任)
TEIKOKU SOUTH ASIA PTE LTD.取締役(現
任)
TEIKOKU ELECTRIC GmbH取締役(現任)
TEIKOKU KOREA CO.,LTD.取締役(現任)
HYDRODYNE TEIKOKU(INDIA) PVT.LTD.取締
役(現任)
株式会社東急ハンズ(現株式会社ハンズ)
入社
株式会社千趣会入社
同社執行役員総務本部長
同社執行役員商品開発副本部長
株式会社プラネットワーク出向取締役管
理部長兼株式会社ディアーズ・ブレイン取 (注)2
締役
アサヒ軽金属工業株式会社入社事業企画
室長
株式会社トーホー社外取締役(現任)
当社社外取締役(現任)
株式会社チノー社外取締役(現任)
当社入社
当社国内営業本部営業企画部長
当社国内営業本部東日本営業部長
当社国際営業本部国際事業部長
当社国際営業本部国際事業部長
TEIKOKU USA INC. Vice President
当社国際営業本部プロジェクト部長
当社プロジェクト本部長兼プロジェクト部
長
当社調達本部長兼調達部長
当社執行役員調達本部長兼調達部長
(注)3
当社執行役員調達本部長兼調達部長兼原価
管理部長
当社執行役員製造本部長
当社執行役員営業本部長
当社監査室長
当社取締役(常勤監査等委員)
当社取締役執行役員技術開発本部長
当社取締役執行役員技術開発本部長兼プロ
ジェクト部長
当社取締役執行役員技術開発本部長
当社取締役(常勤監査等委員)(現任)
神戸弁護士会(現兵庫県弁護士会)登録
北山法律事務所(現弁護士法人神戸京橋法
律事務所)入所
弁護士法人神戸京橋法律事務所副所長
兵庫県弁護士会会長
当社社外取締役
株式会社F・O・ホールディングス社外取
(注)3
締役(現任)
日本司法支援センター兵庫地方事務所所長
当社社外取締役(監査等委員)(現任)
三輪運輸工業株式会社社外監査役(現任)
弁護士法人神戸京橋法律事務所代表社員所
長(現任)
日本弁護士連合会副会長
所有株式
数(千
株)
2
0
19
2
EDINET提出書類
株式会社TEIKOKU(E01761)
有価証券報告書
役職名
氏名
生年月日
略歴
1973年4月
2001年4月
2004年10月
取締役
(監査等委員)
2005年4月
川島
一郎
1950年7月24日生
2007年7月
2011年6月
2018年6月
1989年7月
取締役
(監査等委員)
沖
剛誠
1967年2月13日生
1992年3月
1996年7月
1998年7月
2010年6月
2011年4月
2011年6月
2018年6月
2022年7月
2025年11月
任期
伊藤忠商事株式会社入社
伊藤忠商事株式会社繊維原料副事業部長
伊藤忠商事株式会社金融保険物流カンパ
ニープレジデント補佐
伊藤忠商事株式会社オリコ関連事業統括部
長
株式会社オリエントコーポレーション執行
役員
株式会社オリファサービス債権回収常勤監
査役
当社社外取締役(監査等委員)(現任)
センチュリー監査法人(現EY新日本有限責
任監査法人)入所
公認会計士登録
川上公認会計士事務所入所
沖公認会計士事務所を開設(現任)
日本公認会計士協会兵庫会幹事
姫路市包括外部監査人
岡野食品ホールディングス株式会社社外監
査役
当社社外取締役(監査等委員)(現任)
株式会社ノバック社外監査役
株式会社ノバック常勤監査役(現任)
計
所有株式
数(千
株)
(注)3
3
(注)3
19
174
(注)1.渡真利千恵氏、林晃史氏、川島一郎氏及び沖剛誠氏は、社外取締役であります。
2.2025年6月26日開催の定時株主総会終結の時から1年間
3.2024年6月26日開催の定時株主総会終結の時から2年間
4.所有株式数の千株未満は、切り捨てて表示しております。
5.当社は、経営上の意思決定と業務執行を分離することで、意思決定の効率化と迅速化を図るため、執行役員
制度を導入しております。
なお、執行役員は以下のとおりであります。
役職名
氏名
代表取締役社長執行役員
村
取締役常務執行役員営業本部長兼生産本部長
佐
藤
哲
造
取締役執行役員総務本部長
阿
部
孝
司
執行役員兼大連帝国キャンドモータポンプ有限公司総経理
杉本
執行役員技術開発本部長
森
執行役員生産副本部長
横
46/117
田
潔
洋一郎
澤
友
山
和
淳
EDINET提出書類
株式会社TEIKOKU(E01761)
有価証券報告書
b.
2026年6月29日開催予定の定時株主総会の議案(決議事項)として「取締役(監査等委員である取締役を除く。)
3名選任の件」及び「監査等委員である取締役4名選任の件」を提案しており、当該議案が承認可決されると、当社
の役員の状況は、以下のとおりとなる予定であります。
なお、当該定時株主総会の直後に開催が予定されている取締役会の決議事項の内容(役職等)も含めて記載してお
ります。
男性5名女性2名 (役員のうち女性の比率28.6%)
役職名
氏名
生年月日
略歴
1985年4月
2015年2月
2015年9月
2018年4月
2018年6月
2019年1月
2019年6月
代表取締役
社長執行役員
2019年9月
村田
潔
1962年7月18日生
2019年11月
2020年5月
2021年6月
2023年4月
2023年6月
2024年1月
2024年6月
2025年4月
1986年4月
2007年10月
2009年4月
2012年1月
2013年10月
2018年4月
2019年1月
2019年6月
2019年9月
2020年4月
2020年6月
取締役
常務執行役員
営業本部長
兼生産本部長
佐藤
哲造
1964年2月28日生
2021年2月
2024年1月
2024年6月
2025年4月
2025年6月
47/117
株式会社太陽神戸銀行(現株式会社三井住
友銀行)入行
当社入社
当社総務本部総務部長
当社総務本部経営企画部長
当社経営企画本部長兼経営企画部長
当社執行役員経営企画本部長兼経営企画部
長
TEIKOKU USA INC.取締役(現任)
TEIKOKU SOUTH ASIA PTE LTD.取締役(現
任)
TEIKOKU ELECTRIC GmbH取締役(現任)
TEIKOKU KOREA CO.,LTD.取締役(現任)
当社取締役執行役員経営企画本部長兼経営
企画部長
当社取締役執行役員総務本部長兼経営企画
部長
株式会社協和電機製作所取締役(現任)
上月電装株式会社取締役(現任)
株式会社帝伸製作所取締役(現任)
株式会社平福電機製作所取締役
HYDRODYNE TEIKOKU(INDIA) PVT.LTD.取締
役(現任)
大連帝国キャンドモータポンプ有限公司董
事
当社取締役常務執行役員総務本部長兼経営
企画部長
当社取締役常務執行役員総務本部長
当社取締役専務執行役員総務本部長
台湾帝国ポンプ股份有限公司董事
当社代表取締役社長執行役員(現任)
大連帝国キャンドモータポンプ有限公司董
事(現任)
台湾帝国ポンプ股份有限公司董事(現任)
当社入社
当社国内営業本部東日本営業部長
当社生産本部調達部長
当社国内営業本部西日本営業部長
当社生産本部生産管理部長
当社生産管理副本部長兼調達部長
当社調達本部長兼調達部長
当社執行役員調達本部長兼調達部長
当社執行役員生産副本部長兼開発部長
当社執行役員技術開発本部長兼開発部長
当社取締役執行役員営業本部長
大連帝国キャンドモータポンプ有限公司董
事長(現任)
TEIKOKU USA INC.取締役(現任)
TEIKOKU SOUTH ASIA PTE LTD.取締役(現
任)
TEIKOKU ELECTRIC GmbH取締役(現任)
TEIKOKU KOREA CO.,LTD.取締役(現任)
HYDRODYNE TEIKOKU(INDIA) PVT.LTD.取締
役(現任)
台湾帝国ポンプ股份有限公司董事長(現
任)
当社取締役常務執行役員営業本部長兼国際
事業部長
当社取締役常務執行役員営業本部長
当社取締役常務執行役員営業本部長兼生産
本部長(現任)
任期
所有株式
数(千
株)
(注)2
21
(注)2
104
EDINET提出書類
株式会社TEIKOKU(E01761)
有価証券報告書
役職名
氏名
生年月日
略歴
1987年4月
2020年4月
2020年9月
2021年6月
2024年6月
取締役
執行役員
阿部
孝司
1964年10月18日生
総務本部長
1986年4月
2007年10月
2009年4月
2012年4月
2012年10月
2014年1月
2015年9月
取締役
(常勤監査等委員)
加減
孝司
1963年8月7日生
2017年4月
2017年6月
2017年10月
2018年4月
2019年1月
2019年9月
2020年6月
2021年6月
2022年2月
2024年4月
2024年6月
1989年7月
取締役
(監査等委員)
沖
剛誠
1967年2月13日生
1992年3月
1996年7月
1998年7月
2010年6月
2011年4月
2011年6月
2018年6月
2022年7月
2025年11月
1984年4月
1999年8月
2014年1月
2016年1月
2017年4月
取締役
(監査等委員)
渡真利
千恵
1961年5月29日生
2019年5月
2023年4月
2023年6月
2024年6月
2026年6月
48/117
任期
株式会社太陽神戸銀行(現株式会社三井住
友銀行)入行
当社入社
当社総務本部長付部長
TEIKOKU USA INC.取締役
当社取締役(常勤監査等委員)
当社取締役執行役員総務本部長(現任)
株式会社協和電機製作所取締役(現任)
上月電装株式会社取締役(現任)
株式会社帝伸製作所取締役(現任)
株式会社平福電機製作所取締役
(注)2
TEIKOKU USA INC.取締役(現任)
大連帝国キャンドモータポンプ有限公司董
事(現任)
台湾帝国ポンプ股份有限公司董事(現任)
TEIKOKU SOUTH ASIA PTE LTD.取締役(現
任)
TEIKOKU ELECTRIC GmbH取締役(現任)
TEIKOKU KOREA CO.,LTD.取締役(現任)
HYDRODYNE TEIKOKU(INDIA) PVT.LTD.取締
役(現任)
当社入社
当社国内営業本部営業企画部長
当社国内営業本部東日本営業部長
当社国際営業本部国際事業部長
当社国際営業本部国際事業部長
TEIKOKU USA INC. Vice President
当社国際営業本部プロジェクト部長
当社プロジェクト本部長兼プロジェクト部
長
当社調達本部長兼調達部長
当社執行役員調達本部長兼調達部長
(注)3
当社執行役員調達本部長兼調達部長兼原価
管理部長
当社執行役員製造本部長
当社執行役員営業本部長
当社監査室長
当社取締役(常勤監査等委員)
当社取締役執行役員技術開発本部長
当社取締役執行役員技術開発本部長兼プロ
ジェクト部長
当社取締役執行役員技術開発本部長
当社取締役(常勤監査等委員)(現任)
センチュリー監査法人(現EY新日本有限責
任監査法人)入所
公認会計士登録
川上公認会計士事務所入所
沖公認会計士事務所を開設(現任)
日本公認会計士協会兵庫会幹事
(注)3
姫路市包括外部監査人
岡野食品ホールディングス株式会社社外監
査役
当社社外取締役(監査等委員)(現任)
株式会社ノバック社外監査役
株式会社ノバック常勤監査役(現任)
株式会社東急ハンズ(現株式会社ハンズ)
入社
株式会社千趣会入社
同社執行役員総務本部長
同社執行役員商品開発副本部長
株式会社プラネットワーク出向取締役管
理部長兼株式会社ディアーズ・ブレイン取
(注)3
締役
アサヒ軽金属工業株式会社入社事業企画
室長
株式会社トーホー社外取締役(現任)
当社社外取締役
株式会社チノー社外取締役(現任)
当社社外取締役(監査等委員)(現任)
所有株式
数(千
株)
2
19
19
0
EDINET提出書類
株式会社TEIKOKU(E01761)
有価証券報告書
役職名
氏名
生年月日
略歴
2000年4月
取締役
(監査等委員)
細田
祥子
1973年8月14日生
2006年4月
2017年4月
2021年11月
2022年6月
2023年4月
2026年6月
計
大阪弁護士会弁護士登録
淺田法律事務所(現弁護士法人淺田法律事
務所)入所
淺田法律事務所パートナー(現任)
大阪家庭裁判所調停委員
株式会社三宝化学研究所社外取締役(現
任)
シキボウ株式会社社外取締役(監査等委
員)(現任)
日本弁護士連合会理事
当社社外取締役(監査等委員)(現任)
任期
所有株式
数(千
株)
(注)3
−
168
(注)1.沖剛誠氏、渡真利千恵氏及び細田祥子氏は、社外取締役であります。
2.2026年6月29日開催の定時株主総会終結の時から1年間
3.2026年6月29日開催の定時株主総会終結の時から2年間
4.所有株式数の千株未満は、切り捨てて表示しております。
5.当社は、経営上の意思決定と業務執行を分離することで、意思決定の効率化と迅速化を図るため、執行役員
制度を導入しております。
なお、執行役員は以下のとおりであります。
役職名
氏名
代表取締役社長執行役員
村
取締役常務執行役員営業本部長兼生産本部長
佐
藤
哲
造
取締役執行役員総務本部長
阿
部
孝
司
執行役員兼大連帝国キャンドモータポンプ有限公司総経理
杉本
執行役員技術開発本部長
森
執行役員生産副本部長
横
49/117
田
潔
洋一郎
澤
友
山
和
淳
EDINET提出書類
株式会社TEIKOKU(E01761)
有価証券報告書
②
社外役員の状況
当社の定める独立社外取締役の独立性判断基準は、以下のとおりであります。
・独立性基準
下記に該当しない場合に、独立性があるものと判断しております。
(1)当社グループ(当社及び連結子会社)の役員及び監査役経験者
(2)当社の上位10位以内の大株主
(3)次のいずれかに該当する企業等の業務執行者
a.当社グループの連結売上高の2%以上ある主要な取引先
b.当社グループの連結売上高の2%以上ある主要な借入先
c.当社グループが議決権ベースで10%以上の株式を保有する企業等
(4)当社グループの会計監査人である監査法人に所属する公認会計士
(5)当社グループから10百万円以上の金銭その他の財産を得ているコンサルタント、会計士、税理士、弁護士、司
法書士、弁理士等の専門家
(6)当社グループから10百万円以上の寄付を受けている者
(7)社外役員の相互就任関係となる会社の業務執行者
(8)2親等以内の近親者が上記(1)から(7)までのいずれかに該当する者
(9)過去10年間において、上記(2)から(8)までのいずれかに該当していた者
(10)前各項に定める場合の他、当社と利益相反関係が生じ得る特段の事由が存在すると認められる者
当社は上記の独立性に関する基準に沿って、有価証券報告書提出日現在、社外取締役を4名選任しており、選任状況
に関する当社の考え方は以下のとおりであります。なお、2026年6月29日開催予定の定時株主総会の議案(決議事項)
として提案されている議案「監査等委員である取締役4名選任の件」が承認可決されると、新たに細田祥子氏が社外取
締役に就任することとなり、社外取締役林晃史氏及び川島一郎氏の任期満了に伴う退任により、当社の社外取締役は3
名(うち監査等委員3名)となります。なお、細田祥子氏は、弁護士としての豊富な経験と専門的知見を有しており、
法務・コンプライアンスを中心に、当社取締役会機能の強化と業務執行の監督等の役割を果たしていただくことを期待
し、社外取締役として招請する予定であります。
・社外取締役渡真利千恵氏は、事業会社で要職を歴任し、マーケティングや管理業務等での豊富な経験を有しておりま
す。加えて、事業会社においては、女性活躍推進委員会の委員長を務め、多数の女性管理職の育成に携わった経験も有
しております。こうした経験や知見を活かした、当社取締役会機能の強化と業務執行の監督等の役割を期待し、社外取
締役に招請しております。
同氏は、現在、株式会社トーホー社外取締役、株式会社チノー社外取締役を兼任しておりますが、当社と各兼職先と
の間に人的関係、資本的関係、又は取引関係、その他特別な利害関係はありません。
なお、上記の理由から一般株主と利益相反の生じるおそれがないと判断し、同氏を独立役員として株式会社東京証券
取引所に届け出ております。
・社外取締役林晃史氏は、弁護士としての豊富な経験と専門的知見を有し、独立した立場から法務・コンプライアンス
を中心に当社の経営に対する監督や経営全般に関して助言を行っております。当該視点に基づき、当社取締役会機能の
強化と業務執行の監督等の役割を果たすことができると判断し、社外取締役に招請しております。
同氏は、現在、弁護士(弁護士法人神戸京橋法律事務所代表社員所長)、株式会社F・O・ホールディングス社外取
締役、三輪運輸工業株式会社社外監査役を兼任しておりますが、当社と各兼職先との間に人的関係、資本的関係、又は
取引関係、その他特別な利害関係はありません。
また同氏には、過去に社外役員となること以外の方法で会社の経営に関与したことはありませんが、上記の理由によ
り監査等委員である取締役としての職務を適切に遂行することができるものと判断しております。
なお、上記の理由から一般株主と利益相反の生じるおそれがないと判断し、同氏を独立役員として株式会社東京証券
取引所に届け出ております。
・社外取締役川島一郎氏は、海外業務を含む豊富な実務経験と幅広い知見を有し、独立した立場から事業戦略等を中心
に当社の経営に対する監督や経営全般に関して助言を行っております。当該視点に基づき、当社取締役会機能の強化と
業務執行の監督等の役割を果たすことができると判断し、社外取締役に招請しております。なお、同氏と当社の間に
は、社外役員としての関係以外に特別な利害関係はなく、一般株主と利益相反の生じるおそれがないと判断し、同氏を
独立役員として株式会社東京証券取引所に届け出ております。
・社外取締役沖剛誠氏は、公認会計士としての豊富な経験と幅広い見識を有し、独立した立場から財務・会計等を中心
に当社の経営に対する監督や経営全般に関して助言を行っております。当該視点に基づき、当社取締役会機能の強化と
業務執行の監督等の役割を果たすことができると判断し、社外取締役に招請しております。
同氏は、公認会計士(沖公認会計士事務所所長)、株式会社ノバック常勤監査役を兼任しておりますが、当社と各兼
職先との間に人的関係、資本的関係、又は取引関係、その他特別な利害関係はありません。
50/117
EDINET提出書類
株式会社TEIKOKU(E01761)
有価証券報告書
また同氏には、過去に社外役員となること以外の方法で会社の経営に関与したことはありませんが、上記の理由によ
り監査等委員である取締役としての職務を適切に遂行することができるものと判断しております。
なお、上記の理由から一般株主と利益相反の生じるおそれがないと判断し、同氏を独立役員として株式会社東京証券
取引所に届け出ております。
③
監査等委員である社外取締役による監督又は監査と内部監査及び会計監査との相互連携並びに内部統制部門との関係
監査等委員である社外取締役による監督又は監査と内部監査及び会計監査との相互連携並びに内部統制部門との関係
につきましては、当社の監査等委員である社外取締役は取締役の職務の執行を監査するほか、取締役会に対して議決権
を持つことで取締役会を監督しており、また社外取締役が過半数を占める監査等委員会は、当社の監査部門である監査
室から監査計画と監査結果について定期的に報告を受け、必要に応じて調査を求め、又は指示を出すなど、緊密な連携
をとることができる体制を整備しております。
また、常勤監査等委員は、リスク管理委員会に出席し、当社のリスク管理状況について報告を受け、又は必要に応じ
て調査を求めることができる体制となっており、常勤監査等委員は監査等委員会でリスク管理委員会に関する報告を
行っております。
さらに監査等委員会は、会計監査人と定期的に会合をもち、必要に応じて監査等委員会への出席を求めるほか、会計
監査人から監査に関する報告を適時かつ随時に受領し、積極的に意見及び情報の交換を行うなど、実効的かつ効率的な
監査を実施することができる体制を整備しております。
51/117
EDINET提出書類
株式会社TEIKOKU(E01761)
有価証券報告書
(3)【監査の状況】
① 監査等委員監査の状況
当社は監査等委員会設置会社であります。「監査等委員会」は、監査等委員である取締役4名(うち社外取締役3
名)で構成されており、下記の監査等を行います。
なお、監査等委員沖剛誠氏は、公認会計士として財務・会計に関する豊富な知見を有しております。
ⅰ.取締役の職務の執行の監査
ⅱ.取締役会の決議に基づき構築・運用されている内部統制システムの状況の監査
ⅲ.当社子会社の取締役の職務の執行及び内部統制システムに係る監査
ⅳ.競業取引及び利益相反取引等の監査
ⅴ.法定開示情報等に関する監査
ⅵ.事業報告等の監査
監査等委員会は、原則として毎月1回開催するほか、必要があるときは随時開催します。監査等委員である取締役
は、取締役会に出席し議決権を行使するほか、適法性に限らず、妥当性の監査も行うことで、経営監督機能の強化を
図ります。また、監査等委員会が選定した監査等委員については、社内の重要な会議に出席するとともに、主要な稟
議書その他業務執行に関する重要な文書を閲覧し、必要に応じて当社企業グループの取締役又は使用人(以下「役職
員」という。)にその説明を求め、当社企業グループの役職員は、速やかに報告を行います。
また、監査等委員会は、監査室に協力要請し、監査室は当社企業グループの諸活動について、業務の適正性や効率
の向上を図るべく、内部監査規定に基づき内部監査を行います。必要に応じて、監査等委員会が選定する監査等委員
は、監査室と連携して調査を行います。結果については監査等委員会で報告が行われます。
なお、当事業年度において、当社は監査等委員会を17回開催しており、個々の監査等委員の出席状況は次のとおり
であります。
監査等委員会構成員及び当事業年度出席状況
氏
名
出席日数 / 開催日数
加減
孝司
17日 / 17日
林
晃史
16日 / 17日
川島
一郎
17日 / 17日
沖
剛誠
17日 / 17日
監査等委員会の主な審議内容
・会計監査人の監査計画及び監査報酬の適正性
・会計監査人の監査の方法及び結果の相当性
・監査等委員会の監査の方針、監査計画及び職務の分担等の決定
・内部統制システムに関する取締役会決議の内容の相当性
・常勤監査等委員の職務執行状況報告
・取締役及び執行役員等の職務執行状況
常勤監査等委員の具体的な活動状況
・重要会議への出席(経営会議、リスク管理委員会等)
・取締役・各部管理職者との個別面談
・重要な決裁書類等の閲覧(稟議書等)
・当社及び国内外子会社への往査
・監査等委員である社外取締役との連携、情報共有
・内部通報への対応
52/117
EDINET提出書類
株式会社TEIKOKU(E01761)
有価証券報告書
②
内部監査の状況
内部監査につきましては、代表取締役社長直属の「監査室」が、内部監査規定に基づき、業務の適正性や効率の向
上を図るべく、当社グループの諸活動に対し内部監査を行います。また、金融商品取引法が求める財務報告に係る内
部統制についても財務報告の適正性を確保するための整備状況及び運用状況について監査を行います。内部統制計画
及び内部統制結果については、監査室が代表取締役社長及び取締役会へ直接報告しております。なお、監査室に所属
し内部監査に従事する使用人は、2名であり、監査等委員会から要請、指示された事項を最優先に行うものとすると
ともに、当該使用人の異動等人事については監査等委員会の同意を要するものとし、独立性を確保しております。こ
れらにより、重要な意思決定の過程及び業務の執行状況等を把握し、監査等委員会の監査の実効性を高めておりま
す。
監査等委員会は、年度毎に策定する監査方針、監査計画及び監査室からの報告に基づき、当社グループの業務の管
理と執行状況を監査しております。
監査室及び監査等委員会は必要に応じ、会計監査人との協議・調整等、相互連携を行います。
③
会計監査の状況
a.監査法人の名称
有限責任監査法人トーマツ
b.継続監査期間
30年間
c.業務を執行した公認会計士
指定有限責任社員業務執行社員三浦宏和
指定有限責任社員業務執行社員川合直樹
d.会計監査業務に係る補助者の構成
公認会計士7名、その他19名
e.監査法人の選定方針と理由
当社の監査法人の選定方針は、会計監査人に必要とされる専門性、独立性及び監査品質管理と当社グループのグ
ローバルな事業活動を一元的に監査する体制を有していることであります。
当社は上記方針に基づき、有限責任監査法人トーマツを当社の監査法人として選定しております。同社は日本有
数の監査法人として高度な専門性や独立性を持ち、当社グループのグローバルな事業活動を一元的に監査する体制
を有していることが選定理由であります。
また、会計監査人の解任又は不再任の決定の方針については、当社都合の場合の他、当該会計監査人が会社法・
公認会計士法等の法令に違反・抵触した場合及び公序良俗に反する行為があったと判断した場合、監査等委員会
は、その事実に基づき当該会計監査人の解任又は不再任の検討を行い、解任又は不再任が妥当と判断した場合は、
監査等委員会規則に則り株主総会に提出する「会計監査人の解任又は不再任」に関する議案の内容を決定いたしま
す。
また、会計監査人が会社法第340条第1項各号に定める項目に該当すると認められる場合は、監査等委員会は、
監査等委員全員の同意により、会計監査人を解任いたします。この場合、選定監査等委員は、解任後最初に招集さ
れる株主総会において、会計監査人を解任した旨及びその理由を報告いたします。
f.監査等委員及び監査等委員会による監査法人の評価
当社の監査等委員会は、監査法人に対して定期的な評価を行っております。会計監査人が独立の立場を保持し、
かつ、適正な監査を実施しているかを監視及び検証するとともに、会計監査人からその職務の執行状況について報
告を受け、必要に応じて説明を求めました。また、会計監査人から「職務の遂行が適正に行われることを確保する
ための体制」(会社計算規則第131条各号に掲げる事項)を「監査に関する品質管理基準」(2021年11月16日企業
会計審議会)等に従って整備している旨の通知を受け、必要に応じて説明を求めました。
その結果、会計監査人の職務の遂行状況、監査体制、独立性及び専門性等に問題はなく適切であることを確認い
たしました。
53/117
EDINET提出書類
株式会社TEIKOKU(E01761)
有価証券報告書
④
監査報酬の内容等
a.監査公認会計士等に対する報酬
前連結会計年度
区分
提出会社
連結子会社
計
当連結会計年度
監査証明業務に基づく
報酬(千円)
非監査業務に基づく報
酬(千円)
監査証明業務に基づく
報酬(千円)
非監査業務に基づく報
酬(千円)
39,700
9,200
39,700
−
−
−
−
−
39,700
9,200
39,700
−
(注)1.当社と会計監査人との間の監査契約において、会社法に基づく監査と金融商品取引法に基づく監査の監査報酬
の額を明確に区分しておらず、実質的にも区分できませんので、監査証明業務に基づく報酬にはこれらの合計
額を記載しております。
2.前連結会計年度の当社における非監査業務の内容は、内部統制等に関するアドバイザリー業務であります。
b.監査公認会計士等と同一のネットワーク(デロイト
除く)
トウシュ
前連結会計年度
区分
提出会社
連結子会社
計
トーマツ
リミテッド)に対する報酬(a.を
当連結会計年度
監査証明業務に基づく
報酬(千円)
非監査業務に基づく報
酬(千円)
監査証明業務に基づく
報酬(千円)
非監査業務に基づく報
酬(千円)
−
14,065
−
158
3,721
4,622
3,666
9,857
3,721
18,688
3,666
10,015
(注)1.前連結会計年度の当社における非監査業務の内容は、事業再編等に関するコンサルティング業務であります。
2.前連結会計年度の連結子会社における非監査業務の内容は、税務等に関するアドバイザリー業務であります。
3.当連結会計年度の当社及び連結子会社における非監査業務の内容は、税務等に関するアドバイザリー業務であ
ります。
c.その他の重要な監査証明業務に基づく報酬の内容
該当事項はありません。
d.監査報酬の決定方針
当社の監査公認会計士等に対する監査報酬の決定方針は、監査日数、連結財務諸表における連結子会社の数等を
総合的に勘案し決定することとしております。
e.監査等委員会が会計監査人の報酬等に同意した理由
監査等委員会は、会計監査人の監査計画の内容、会計監査の職務遂行状況及び報酬見積りの算出根拠等が適切で
あるかどうかについて必要な検証を行ったうえで、会計監査人の報酬等の額について同意の判断をいたしました。
54/117
EDINET提出書類
株式会社TEIKOKU(E01761)
有価証券報告書
(4)【役員の報酬等】
① 役員区分ごとの報酬等の総額、報酬等の種類別の総額及び対象となる役員の員数
a.2026年3月期の役員の報酬等の総額
役員区分
報酬等の総額
(千円)
報酬等の種類別の総額(千円)
役位別報酬
業績連動報酬
譲渡制限付
株式報酬
対象となる
役員の員数
(人)
取締役(監査等委員及び社外
取締役を除く。)
112,343
45,500
42,457
24,385
3
取締役(監査等委員)(社外
取締役を除く。)
15,200
15,200
−
−
1
社外役員
28,800
28,800
−
−
4
(注)1.取締役の支給額には、使用人兼務取締役の使用人分給与は含まれておりません。
2.上記報酬は2025年4月14日開催の取締役会において改訂を決議される前の役員報酬規則に基づいて算定
し、支払われたものであります。
b.2026年3月期における役員の報酬等の算定方法
2026年3月期における役員報酬は「役位別報酬」、「業績連動報酬」、「譲渡制限付株式報酬」にて構成されて
おります。
「役位別報酬」は、取締役の役位に応じて支給額を決定する固定報酬であります。
一方、「業績連動報酬」は、前事業年度の共通重要業績指標(売上、営業利益)と取締役ごとに設定する関係重
要業績指標(人財育成、品質、リスク管理、効率、その他重点施策)を基に報酬委員会にて審議のうえ、設定した
それらの評価基準及び評価ウェイトを、役位に応じて設定されている業績連動報酬基準額に、共通重要業績指標・
関係重要業績指標の達成度に基づく支給係数と共に乗じて算定いたしました。当事業年度に支払われた業績連動報
酬に係る指標の実績は、売上高30,546百万円、営業利益6,055百万円であります。
また、「譲渡制限付株式報酬」として、取締役(監査等委員を除く。)の役位に応じて支給額を決定しており、
対象となる取締役は、本株式の払込期日から当社又は当社子会社の取締役その他役職員の地位のうち当社の取締役
会が予め定める地位を退任又は退職した時点までの間、本株式について、譲渡、担保権の設定その他の処分をして
はならない譲渡制限期間を設けております。
②
役員の報酬等の額又はその算定方法の決定に関する方針に係る事項
当社は、役員の報酬等の額又はその算定方法の決定に関して、決定根拠及び業績や株価に対する責任や連動性を明
確にすること等を目的とした役員報酬制度を導入しており、役員報酬は「基本報酬」、「業績連動報酬」、「譲渡制
限付株式報酬」にて構成しております。役員報酬の内容及び決定方針については、取締役会にて決定しており、2025
年4月14日開催の取締役会において役員報酬改定の決議を行いました。なお、「① 役員区分ごとの報酬等の総額、
報酬等の種類別の総額及び対象となる役員の員数」において開示している金額は、当該改定前の報酬規則に基づき算
定・支給されたものであります。
a.基本報酬(業績に連動しない金銭報酬)の額又はその算定方法の決定方針
取締役(社外取締役及び監査等委員である取締役を除く。)に対する基本報酬は、監督報酬と業務執行報酬の2
種類で構成しております。監督報酬は役位に関わらず同額とし、業務執行報酬は役位に応じた額としております。
なお、社外取締役及び監査等委員である取締役は、業務執行から独立した立場であるため、監督報酬のみで構成し
た基本報酬を支給いたします。
b.業績連動報酬の業績指標の内容及び業績連動報酬の額又は数の算定方法の決定方針
各事業年度の共通重要業績指標(売上、営業利益等)と取締役ごとに設定する関係重要業績指標(各事業年度の
経営計画をもとに決定した項目)、それらの評価基準及び評価ウェイトは、報酬委員会に諮問され、取締役会で決
定されます。役位に応じて設定されている業績連動報酬基準額に、設定した評価ウェイト、及び共通重要業績指
標・関係重要業績指標の達成度に基づく支給係数を乗じた額を業績連動報酬としております。
55/117
EDINET提出書類
株式会社TEIKOKU(E01761)
有価証券報告書
c.非金銭報酬等の内容及び非金銭報酬等の額もしくは数又はその算定方法の決定方針
取締役(監査等委員を除く。)に対し、当社の企業価値の持続的な向上を図るインセンティブを与えるととも
に、株主の皆様との一層の価値共有を進めることを目的として、譲渡制限付株式報酬制度を導入しております。本
制度による譲渡制限付株式の付与のための報酬額は年額50,000千円以内、発行又は処分される当社普通株式の総数
は年50千株以内(ただし、当社の普通株式の株式分割又は株式併合が行われた場合、当該総数を必要に応じて合理
的な範囲で調整する。)としております。また対象となる取締役は、本株式の払込期日から当社又は当社子会社の
取締役その他役職員の地位のうち当社の取締役会が予め定める地位を退任又は退職した時点までの間、本株式につ
いて、譲渡、担保権の設定その他の処分をしてはならない譲渡制限期間を設けております。
d.報酬等の種類ごとの割合の決定方針
報酬ごとに各役職位の実績に基づく報酬を算出し、割合が決定されるため、報酬等の種類ごとの割合については
事前に決定しておりませんが、業績連動報酬に関する共通重要業績指標と関係重要業績指標の達成度を100%とし
た場合の報酬ごとの構成比は以下のとおりで、業績連動報酬及び譲渡制限付株式報酬については、役位上位ほど割
合が大きくなります。なお、当該改定により、改定前と比べて構成比に占める基本報酬の割合が大きくなっており
ますが、これは、改定前の役員報酬規則において、業績連動報酬支給額の下限が、基準額の50%となっており、実
質的に固定報酬となっていたため、その部分を基本報酬に移動させたことによるものであります。
役員報酬の構成比(%)
役位
基本報酬
業績連動報酬
譲渡制限付
株式報酬
社長執行役員
60.0
20.0
20.0
常務執行役員
70.0
15.0
15.0
取締役執行役員
75.0
12.5
12.5
合計(%)
100.0
e.報酬等の決定方法及び報酬限度額
各取締役(監査等委員を除く。)の具体的な報酬額については、株主総会において承認を得た報酬等の上限額の
範囲内において、委員の過半数が社外取締役で構成される報酬委員会の答申を踏まえ、取締役会で決定しておりま
す。また取締役(監査等委員)の具体的な報酬額については、株主総会において承認を得た報酬等の上限額の範囲
内において、取締役(監査等委員)の協議により決定しております。
なお、取締役(監査等委員を除く。)の報酬限度額は、2023年6月28日開催の第119期定時株主総会において年
額204,500千円以内(うち社外取締役分年額10,000千円以内とし、使用人分給与は含まない。)と決議されてお
り、またこれとは別枠で、取締役(監査等委員及び社外取締役を除く。)に対して退任時解除型譲渡制限付株式の
付与のための報酬額を年額50,000千円以内とすることが2025年6月26日開催の第121期定時株主総会において決議
されております。
また、取締役(監査等委員)の報酬限度額は、2020年6月26日開催の第116期定時株主総会において年額44,000
千円以内と決議されております。
f.報酬等を与える時期又は条件の決定方針
基本報酬及び業績連動報酬の支払い時期は、定時株主総会の翌日から次期定時株主総会の日までの期間とし、月
例報酬として支払っております。
また譲渡制限付株式報酬の支払い時期については、定時株主総会の翌日から次期定時株主総会の日までの期間と
し、取締役会で決定しております。
56/117
EDINET提出書類
株式会社TEIKOKU(E01761)
有価証券報告書
(5)【株式の保有状況】
① 投資株式の区分の基準及び考え方
専ら株式の価値の変動又は株式に係る配当によって利益を受けることを目的としている投資株式を純投資目的である
投資株式とし、取引関係の強化等、当社の事業戦略上重要な目的を有している投資株式を純投資目的以外の目的である
投資株式と区分しております。
純投資目的以外の目的である投資株式については、毎年、取締役会で保有の意義といった定性面に加え、取引採算が
当社資本コストに見合っているかどうか等を定量的に検証し、当社の持続的な成長と企業価値向上に資すると判断した
場合にのみ保有しております。
②
保有目的が純投資目的以外の目的である投資株式
a.保有方針及び保有の合理性を検証する方法並びに個別銘柄の保有の適否に関する取締役会等における検証の内容
保有目的が純投資目的以外の目的である投資株式については、当社の持続的な成長と企業価値向上に資すると判断
した場合にのみ保有する方針としております。保有の合理性については、取締役会において以下の検証項目を踏ま
え、保有目的が適切か、保有に伴う便益やリスクが資本コストに見合っているか等を検証しております。(2025年9
月18日開催の取締役会にて実施)
《検証項目》
・株式評価損益
・取引の有無
・直近の取引額、利益
・配当状況
・投資利回り
・保有の意義、ビジネス拡大見込みの有無
・保有継続によるメリットの有無
検証の結果、当事業年度において一部の株式を売却いたしました。
b.銘柄数及び貸借対照表計上額
銘柄数
(銘柄)
貸借対照表計上額の
合計額(千円)
非上場株式
2
3,727
非上場株式以外の株式
1
362,699
(当事業年度において株式数が増加した銘柄)
銘柄数
(銘柄)
株式数の増加に係る取得
価額の合計額(千円)
非上場株式
−
−
−
非上場株式以外の株式
−
−
−
(当事業年度において株式数が減少した銘柄)
銘柄数
(銘柄)
株式数の減少に係る売却
価額の合計額(千円)
非上場株式
−
−
非上場株式以外の株式
1
990,350
57/117
株式数の増加の理由
EDINET提出書類
株式会社TEIKOKU(E01761)
有価証券報告書
c.特定投資株式及びみなし保有株式の銘柄ごとの株式数、貸借対照表計上額等に関する情報
特定投資株式
銘柄
当事業年度
前事業年度
株式数(株)
株式数(株)
貸借対照表計上額
(千円)
貸借対照表計上額
(千円)
72,453
72,453
㈱三井住友フィナン
シャルグループ
362,699
−
274,959
当社の株式の
保有の有無
当社は三井住友銀行をメインバンクとし
ており、決済や外国為替、輸出における
銀行保証等の取引があることから、メイ
ンバンクとの関係強化のために、株式を
保有しております。
定量的な保有効果については、保有先企
業との取引の守秘性等から開示しており
ませんが、取締役会において検証項目を
踏まえ、保有目的が適切か、保有に伴う
便益やリスクが資本コストに見合ってい
るか等を検証しております。
無(注)1
319,500
三菱電機㈱は当社グループの電子部品事
業における主要取引先であり、また、当
社ポンプ事業においても取引があること
から、取引関係強化のため、株式を保有
しておりましたが、2024年12月末に電子
869,040
部品事業を停止したことから、取締役会
において検証項目を踏まえ、保有目的が
適切か、保有に伴う便益やリスクが資本
コストに見合っているか等を検証した結
果、当事業年度において株式を売却いた
しました。
三菱電機㈱
−
保有目的、業務提携等の概要、
定量的な保有効果
及び株式数が増加した理由
無
(注)1.㈱三井住友フィナンシャルグループは当社の株式を保有しておりませんが、同社子会社が当社の株式を保有し
ております。
2.「−」は当該銘柄を保有していないことを示しております。
③
保有目的が純投資目的である投資株式
該当事項はありません。
④
当事業年度に投資株式の保有目的を純投資目的から純投資目的以外の目的に変更したもの
該当事項はありません。
⑤
当事業年度の前4事業年度及び当事業年度に投資株式の保有目的を純投資目的以外の目的から純投資目的に変更した
もの
該当事項はありません。
58/117
EDINET提出書類
株式会社TEIKOKU(E01761)
有価証券報告書
5【従業員の状況等】
(1)【人材戦略に関する基本方針等】
人材戦略に関する方針
当社グループでは、人事戦略の策定において「経営戦略と連動していること(経営目標を達成するための人事戦略で
あること)」と「人的資本価値を最大化すること」を最重要視点と位置づけ、現在、全面的な人事制度改革を進めてお
ります。新人事制度の下で、一人一人が高いモチベーションで挑戦と成長を続け、個人・部署・部門同士が強く連帯し
た強靭な組織を構築することで「目指すべき企業風土(連帯・誇り・成長)」の実現とその先の連結売上高700億円を
はじめとした「グループビジョン」の達成を目指してまいります。
また当社では、評価・報酬制度の改革を人事制度改革の主要項目の一つと位置づけており、評価・報酬制度面から人
的資本価値の最大化を実現してまいります。2027年度より、評価・報酬双方にメリハリをつけることで「実力主義の徹
底」を目指すとともに管理職の報酬体系も見直し、管理職のモチベーション向上、管理職の魅力化を通じた昇進意欲醸
成を図ってまいります。これらの改革により、組織全体が挑戦意欲を持てる報酬体系を構築してまいります。
(2)【従業員の状況】
①連結会社の状況
2026年3月31日現在
従業員数(人)
1,145
(59)
(注)1.従業員数は就業人員(当社グループ外から当社グループへの出向者を含む。)であり、臨時雇用者数(パー
トタイマー、嘱託等を含む)は( )内に外数で記載しております。
2.当連結会計年度より、当社グループは「ポンプ事業」を単一の報告セグメントとしており、その他の事業に
ついては量的重要性が乏しいため、セグメント別の記載を省略しております。
②提出会社の状況
2026年3月31日現在
従業員数(人)
328
(23)
平均年齢(歳)
平均勤続年数
(年)
平均年間給与
(円)
40.7
17.2
7,436,185
平均年間給与の
対前事業年度増減率
(%)
4.5
(注)1.従業員数は就業人員(当社から社外への出向者を除き、社外から当社への出向者を含む。)であり、臨時雇
用者数(パートタイマー、嘱託等を含む)は( )内に外数で記載しております。
2.平均年齢、平均勤続年数及び平均年間給与には、社外への出向者12名を含み、嘱託23名は含んでおりませ
ん。
3.平均年間給与は、税込支払給与額であり、諸手当及び賞与を含んでおります。
4.当事業年度より、当社は「ポンプ事業」を単一の報告セグメントとしており、その他の事業については量的
重要性が乏しいため、セグメント別の記載を省略しております。
③労働組合の状況
当社及び一部の連結子会社において労働組合が組織されております。
当社の労働組合は、帝国電機労働組合と称し、1947年11月に結成され、2026年3月31日現在の組合員数は、265名
であります。労使関係は安定し、円満に推移しております。
なお、当組合は2026年4月1日をもって「TEIKOKU労働組合」に改称しております。
59/117
EDINET提出書類
株式会社TEIKOKU(E01761)
有価証券報告書
④管理的地位にある労働者に占める女性労働者の割合、男性労働者の育児休業取得率及び労働者の男女の賃金の額の
差異
a.提出会社
当事業年度
管理的地位にある労
働者に占める女性労
働者の割合(%)
(注)1
男性労働者の育児休
業取得率(%)
(注)2
5.3
77.7
労働者の男女の賃金の額の差異(%)
(注)1
全労働者
正規雇用労働者
78.0
77.7
パート・有期労働者
73.6
(注)1.「女性の職業生活における活躍の推進に関する法律」(平成27年法律第64号)の規定に基づき算出したもの
であります。
2.「育児休業、介護休業等育児又は家族介護を行う労働者の福祉に関する法律」(平成3年法律第76号)の規
定に基づき、「育児休業、介護休業等育児又は家族介護を行う労働者の福祉に関する法律施行規則」(平成
3年労働省令第25号)第71条の6第1号における育児休業等の取得割合を算出したものであります。
b.連結子会社
連結子会社は、「女性の職業生活における活躍の推進に関する法律」(平成27年法律第64号)及び「育児休業、
介護休業等育児又は家族介護を行う労働者の福祉に関する法律」(平成3年法律第76号)の規定による公表義務の
対象ではないため、記載を省略しております。
60/117
EDINET提出書類
株式会社TEIKOKU(E01761)
有価証券報告書
第5【経理の状況】
1.連結財務諸表及び財務諸表の作成方法について
(1)当社の連結財務諸表は、「連結財務諸表の用語、様式及び作成方法に関する規則」(昭和51年大蔵省令第28号)に
基づいて作成しております。
(2)当社の財務諸表は、「財務諸表等の用語、様式及び作成方法に関する規則」(昭和38年大蔵省令第59号。以下「財
務諸表等規則」という。)に基づいて作成しております。
また、当社は、特例財務諸表提出会社に該当し、財務諸表等規則第127条の規定により財務諸表を作成しておりま
す。
2.監査証明について
当社は、金融商品取引法第193条の2第1項の規定に基づき、連結会計年度(2025年4月1日から2026年3月31日ま
で)の連結財務諸表及び事業年度(2025年4月1日から2026年3月31日まで)の財務諸表について、有限責任監査法人
トーマツにより監査を受けております。
3.連結財務諸表等の適正性を確保するための特段の取組について
当社は、連結財務諸表等の適正性を確保するための特段の取組を行っております。具体的には、会計基準等の内容を
適切に把握し、又は会計基準等の変更等について的確に対応することができる体制を整備するため、公益財団法人財務
会計基準機構へ加入しております。
61/117
EDINET提出書類
株式会社TEIKOKU(E01761)
有価証券報告書
1【連結財務諸表等】
(1)【連結財務諸表】
①【連結貸借対照表】
(単位:千円)
前連結会計年度
(2025年3月31日)
資産の部
流動資産
現金及び預金
受取手形、売掛金及び契約資産
電子記録債権
製品
仕掛品
原材料及び貯蔵品
その他
貸倒引当金
流動資産合計
固定資産
有形固定資産
建物及び構築物
減価償却累計額
建物及び構築物(純額)
機械装置及び運搬具
減価償却累計額
機械装置及び運搬具(純額)
土地
リース資産
減価償却累計額
リース資産(純額)
建設仮勘定
その他
減価償却累計額
その他(純額)
有形固定資産合計
無形固定資産
投資その他の資産
投資有価証券
長期貸付金
繰延税金資産
退職給付に係る資産
その他
貸倒引当金
投資その他の資産合計
固定資産合計
資産合計
13,886,562
11,721,391
※1 9,359,199
※1 9,135,764
1,324,581
2,856,378
2,339,497
2,163,258
483,577
△789,343
31,623,710
1,697,802
3,177,160
2,743,424
2,454,688
627,108
△828,295
30,729,045
9,286,358
4,280,578
6,991,679
△5,210,750
1,780,929
1,663,107
1,046,428
△522,775
523,653
342,634
1,819,406
△1,655,927
163,478
8,754,381
104,434
8,320,326
△4,293,069
4,027,257
7,474,882
△5,464,400
2,010,481
1,229,580
1,042,190
△695,793
346,396
90,979
1,929,172
△1,681,113
248,058
7,952,754
140,952
1,147,726
9,195
355,341
236,332
172,245
△6,800
1,914,041
10,772,857
42,396,568
366,427
5,790
258,659
310,832
446,996
△6,800
1,381,906
9,475,613
40,204,658
※4 △5,005,779
62/117
当連結会計年度
(2026年3月31日)
EDINET提出書類
株式会社TEIKOKU(E01761)
有価証券報告書
(単位:千円)
前連結会計年度
(2025年3月31日)
負債の部
流動負債
支払手形及び買掛金
電子記録債務
リース債務
未払法人税等
製品保証引当金
賞与引当金
その他
流動負債合計
固定負債
リース債務
繰延税金負債
退職給付に係る負債
その他
固定負債合計
負債合計
純資産の部
株主資本
資本金
資本剰余金
利益剰余金
自己株式
株主資本合計
その他の包括利益累計額
その他有価証券評価差額金
為替換算調整勘定
退職給付に係る調整累計額
その他の包括利益累計額合計
非支配株主持分
純資産合計
負債純資産合計
63/117
当連結会計年度
(2026年3月31日)
2,047,529
453,169
211,477
1,108,838
59,658
504,362
※3 3,249,197
1,763,943
336,755
159,673
936,793
39,549
507,726
※3 3,342,381
7,634,232
7,086,822
374,590
499,772
364,298
18,958
1,257,620
8,891,852
231,572
266,766
358,693
23,784
880,816
7,967,639
3,143,675
2,931,466
23,041,643
△634,148
28,482,636
3,143,675
2,931,466
22,435,887
△1,189,922
27,321,105
666,846
3,534,294
55,021
4,256,163
765,916
33,504,715
42,396,568
214,782
3,677,183
141,664
4,033,630
882,282
32,237,019
40,204,658
EDINET提出書類
株式会社TEIKOKU(E01761)
有価証券報告書
②【連結損益計算書及び連結包括利益計算書】
【連結損益計算書】
(単位:千円)
前連結会計年度
(自 2024年4月1日
至 2025年3月31日)
売上高
売上原価
売上総利益
販売費及び一般管理費
販売費
一般管理費
販売費及び一般管理費合計
営業利益
営業外収益
受取利息
受取配当金
受取賃貸料
為替差益
スクラップ売却益
増値税還付金
太陽光売電収入
その他
営業外収益合計
営業外費用
支払利息
為替差損
太陽光売電原価
その他
営業外費用合計
経常利益
特別利益
固定資産売却益
投資有価証券売却益
特別利益合計
特別損失
固定資産売却損
関係会社整理損
特別損失合計
税金等調整前当期純利益
法人税、住民税及び事業税
法人税等調整額
法人税等合計
当期純利益
非支配株主に帰属する当期純利益
親会社株主に帰属する当期純利益
30,546,287
29,091,243
※2,※3 16,660,641
※2,※3 16,683,352
13,885,646
12,407,891
3,745,098
3,470,558
※2 4,084,812
※2 3,954,291
※1 7,829,910
※1 7,424,850
6,055,735
4,983,041
136,124
28,383
28,129
−
58,398
34,589
11,515
33,752
330,893
107,878
20,115
26,833
177,621
65,996
27,494
11,938
40,585
478,464
18,703
56,143
5,142
10,075
90,066
6,296,563
7,347
−
4,715
4,917
16,979
5,444,526
−
108,652
108,652
※4 140,392
※5 14,238
※5 27,665
※6 472,968
−
27,665
6,426,252
1,730,636
31,335
1,761,971
4,664,280
322,681
4,341,599
487,207
5,918,008
1,933,049
△98,481
1,834,568
4,083,439
271,940
3,811,499
64/117
当連結会計年度
(自 2025年4月1日
至 2026年3月31日)
868,999
1,009,392
EDINET提出書類
株式会社TEIKOKU(E01761)
有価証券報告書
【連結包括利益計算書】
(単位:千円)
前連結会計年度
(自 2024年4月1日
至 2025年3月31日)
当期純利益
その他の包括利益
その他有価証券評価差額金
為替換算調整勘定
退職給付に係る調整額
その他の包括利益合計
包括利益
(内訳)
親会社株主に係る包括利益
非支配株主に係る包括利益
65/117
当連結会計年度
(自 2025年4月1日
至 2026年3月31日)
4,083,439
4,664,280
5,870
1,016,877
17,757
※1 1,040,506
△452,064
112,854
86,642
※1 △252,566
5,123,946
4,411,713
4,881,386
242,559
4,118,995
292,718
EDINET提出書類
株式会社TEIKOKU(E01761)
有価証券報告書
③【連結株主資本等変動計算書】
前連結会計年度(自2024年4月1日
至2025年3月31日)
(単位:千円)
株主資本
資本金
当期首残高
資本剰余金
3,143,675
利益剰余金
2,931,466
自己株式
24,504,193
株主資本合計
△1,914,845
28,664,488
当期変動額
剰余金の配当
△1,531,720
△1,531,720
3,811,499
3,811,499
親会社株主に帰属する当期純利益
自己株式の取得
△2,477,168
△2,477,168
自己株式の処分
2,000
13,536
15,537
自己株式の消却
△3,744,328
3,744,328
−
利益剰余金から資本剰余金への振
替
3,742,328
△3,742,328
−
−
−
△1,462,549
1,280,696
△181,852
3,143,675
2,931,466
23,041,643
△634,148
28,482,636
株主資本以外の項目の当期変動額
(純額)
当期変動額合計
当期末残高
その他の包括利益累計額
その他有価証
券評価差額金
当期首残高
660,975
為替換算調整
勘定
退職給付に係
る調整累計額
2,487,999
37,264
その他の包括利
益累計額合計
3,186,239
非支配株主持分
純資産合計
615,494
32,466,222
△92,137
△1,623,857
当期変動額
剰余金の配当
親会社株主に帰属する当期純利益
3,811,499
自己株式の取得
△2,477,168
自己株式の処分
15,537
自己株式の消却
−
利益剰余金から資本剰余金への振
替
−
株主資本以外の項目の当期変動額
(純額)
当期変動額合計
当期末残高
5,870
1,046,295
17,757
1,069,923
242,559
1,312,483
5,870
1,046,295
17,757
1,069,923
150,422
1,038,493
666,846
3,534,294
55,021
4,256,163
765,916
33,504,715
66/117
EDINET提出書類
株式会社TEIKOKU(E01761)
有価証券報告書
当連結会計年度(自2025年4月1日
至2026年3月31日)
(単位:千円)
株主資本
資本金
当期首残高
資本剰余金
3,143,675
利益剰余金
2,931,466
自己株式
23,041,643
株主資本合計
△634,148
28,482,636
当期変動額
剰余金の配当
△2,059,790
△2,059,790
4,341,599
4,341,599
親会社株主に帰属する当期純利益
自己株式の取得
△3,459,264
△3,459,264
自己株式の処分
4,457
11,467
15,925
自己株式の消却
△2,892,022
2,892,022
−
利益剰余金から資本剰余金への振
替
2,887,564
△2,887,564
−
−
−
△605,756
△555,774
△1,161,530
3,143,675
2,931,466
22,435,887
△1,189,922
27,321,105
株主資本以外の項目の当期変動額
(純額)
当期変動額合計
当期末残高
その他の包括利益累計額
その他有価証
券評価差額金
当期首残高
666,846
為替換算調整
勘定
退職給付に係
る調整累計額
3,534,294
55,021
その他の包括利
益累計額合計
4,256,163
非支配株主持分
純資産合計
765,916
33,504,715
△176,351
△2,236,141
当期変動額
剰余金の配当
親会社株主に帰属する当期純利益
4,341,599
自己株式の取得
△3,459,264
自己株式の処分
15,925
自己株式の消却
−
利益剰余金から資本剰余金への振
替
−
株主資本以外の項目の当期変動額
(純額)
当期変動額合計
当期末残高
△452,064
142,888
86,642
△222,532
292,718
70,185
△452,064
142,888
86,642
△222,532
116,366
△1,267,696
214,782
3,677,183
141,664
4,033,630
882,282
32,237,019
67/117
EDINET提出書類
株式会社TEIKOKU(E01761)
有価証券報告書
④【連結キャッシュ・フロー計算書】
(単位:千円)
前連結会計年度
(自 2024年4月1日
至 2025年3月31日)
営業活動によるキャッシュ・フロー
税金等調整前当期純利益
関係会社整理損
減価償却費
貸倒引当金の増減額(△は減少)
退職給付に係る資産又は負債の増減額
受取利息及び受取配当金
支払利息
為替差損益(△は益)
投資有価証券売却損益(△は益)
有形固定資産売却損益(△は益)
売上債権の増減額(△は増加)
棚卸資産の増減額(△は増加)
その他の流動資産の増減額(△は増加)
仕入債務の増減額(△は減少)
未払消費税等の増減額(△は減少)
その他の流動負債の増減額(△は減少)
その他
小計
利息及び配当金の受取額
利息の支払額
法人税等の支払額
営業活動によるキャッシュ・フロー
投資活動によるキャッシュ・フロー
定期預金の預入による支出
定期預金の払戻による収入
有形固定資産の取得による支出
有形固定資産の売却による収入
無形固定資産の取得による支出
投資有価証券の取得による支出
投資有価証券の売却による収入
貸付けによる支出
貸付金の回収による収入
投資活動によるキャッシュ・フロー
財務活動によるキャッシュ・フロー
長期借入金の返済による支出
リース債務の返済による支出
自己株式の取得による支出
配当金の支払額
非支配株主への配当金の支払額
財務活動によるキャッシュ・フロー
現金及び現金同等物に係る換算差額
現金及び現金同等物の増減額(△は減少)
現金及び現金同等物の期首残高
現金及び現金同等物の期末残高
68/117
当連結会計年度
(自 2025年4月1日
至 2026年3月31日)
5,918,008
472,968
961,829
△43,977
△160,853
△164,508
18,703
12,297
△108,652
14,238
112,277
△473,174
△16,066
△127,192
△7,761
△373,577
△734,113
5,300,444
166,463
△18,703
△1,503,537
3,944,667
6,426,252
−
947,552
15,345
45,747
△127,994
7,347
△74,260
△868,999
△112,726
△41,825
△961,381
△138,874
△425,899
△89,321
52,795
△181,502
4,472,255
127,994
△7,347
△1,894,956
2,697,946
△1,758,677
3,877,513
△998,127
204,933
△41,099
△1,617
189,231
△5,725
4,001
1,470,431
△2,072,469
1,883,397
△723,685
824,577
△70,100
−
990,350
△337
3,742
835,474
△88,690
△516,957
△2,477,168
△1,531,720
△92,137
△4,706,674
455,773
1,164,198
10,834,410
※1 11,998,609
−
△206,968
△3,459,264
△2,059,790
△176,351
△5,902,374
168,669
△2,200,284
11,998,609
※1 9,798,324
EDINET提出書類
株式会社TEIKOKU(E01761)
有価証券報告書
【注記事項】
(連結財務諸表作成のための基本となる重要な事項)
1.連結の範囲に関する事項
連結子会社の数 12社
① 国内子会社 4社
・株式会社協和電機製作所
・上月電装株式会社
・株式会社帝伸製作所
・株式会社平福電機製作所
② 在外子会社 8社
・TEIKOKU USA INC.
・大連帝国キャンドモータポンプ有限公司
・大連大帝キャンドモータポンプ修理有限公司
・台湾帝国ポンプ股份有限公司
・TEIKOKU SOUTH ASIA PTE LTD.
・TEIKOKU ELECTRIC GmbH
・TEIKOKU KOREA CO.,LTD.
・HYDRODYNE TEIKOKU(INDIA)PVT.LTD.
2.持分法の適用に関する事項
持分法適用対象会社はありません。
3.連結子会社の事業年度等に関する事項
連結子会社のうち、HYDRODYNE TEIKOKU(INDIA)PVT.LTD.を除く在外子会社7社の決算日は12月31日でありますが、
連結決算日との差異が3か月を超えていないため、連結に際しては当該決算日の財務諸表を使用し、かつ連結決算日
との間に発生した重要な取引については連結上必要な調整を行っております。
4.会計方針に関する事項
(1)重要な資産の評価基準及び評価方法
① 有価証券
その他有価証券
市場価格のない株式等以外のもの
……時価法(評価差額は全部純資産直入法により処理し、売却原価は移動平均法により算定)を採用してお
ります。
市場価格のない株式等
……主として移動平均法による原価法を採用しております。
② 棚卸資産
当社及び国内子会社
……主として総平均法による原価法(貸借対照表価額は収益性の低下に基づく簿価切下げの方法により算
定)
在外子会社
……主として先入先出法による低価法
69/117
EDINET提出書類
株式会社TEIKOKU(E01761)
有価証券報告書
(2)重要な減価償却資産の減価償却の方法
① 有形固定資産(リース資産を除く)
当社及び国内子会社
……定率法
ただし、1998年4月1日以降に取得した建物(建物附属設備を除く。)並びに2016年4月1日以降に取
得した建物附属設備及び構築物については、定額法を採用しております。
在外子会社
……定額法
なお、主な耐用年数は次のとおりであります。
建物及び構築物
15〜50年
機械装置及び運搬具 10〜12年
②
③
④
無形固定資産(リース資産を除く)
ソフトウエア
……社内における利用可能期間(5年)に基づく定額法を採用しております。
リース資産
……リース期間を耐用年数とし、残存価額を零とする定額法を採用しております。
長期前払費用
……定額法
(3)重要な引当金の計上基準
① 貸倒引当金
債権の貸倒れによる損失に備えるため、一般債権については貸倒実績率により、貸倒懸念債権等特定の債権に
ついては個別に回収可能性を勘案し、回収不能見込額を計上しております。
② 製品保証引当金
製品のアフターサービス費用の支出に備えるため、過年度実績率に基づいて算定した金額を計上しておりま
す。
③ 賞与引当金
従業員に対して支給する賞与の支出に充てるため、支給見込額を計上しております。
(4) 退職給付に係る会計処理の方法
①
退職給付見込額の期間帰属方法
退職給付債務の算定にあたり、退職給付見込額を当連結会計年度末までの期間に帰属させる方法については、
給付算定式基準によっております。
② 数理計算上の差異及び過去勤務費用の費用処理方法
過去勤務費用については、その発生時における従業員の平均残存勤務期間以内の一定の年数(10年)による定
額法により費用処理しております。
数理計算上の差異については、各連結会計年度の発生時における従業員の平均残存勤務期間以内の一定の年数
(10年)による定額法により按分した額をそれぞれ発生の翌連結会計年度から費用処理しております。
70/117
EDINET提出書類
株式会社TEIKOKU(E01761)
有価証券報告書
(5) 重要な収益及び費用の計上基準
当社グループは、約束した財又はサービスの支配が顧客に移転した時点で、当該財又はサービスと交換に受け取
ると見込まれる金額で収益を認識するため、下記の5ステップを適用して、収益を認識しております。
ステップ1:顧客との契約を識別する。
ステップ2:契約における履行義務を識別する。
ステップ3:取引価格を算定する。
ステップ4:取引価格を契約における履行義務に配分する。
ステップ5:企業が履行義務の充足時に(又は充足するにつれて)収益を認識する。
ポンプ事業においては、主にキャンドモータポンプの製造、販売を行っており、顧客との販売契約に基づいて製
品を引き渡す義務を負っております。これらの製品の販売については、主として顧客が当該製品に対する支配を獲
得したと認められる時点が契約の履行義務の充足時期であり、当該製品の出荷、検収や貿易上の諸条件に基づき売
上収益を認識しております。また、ポンプ事業の一部の製品は顧客から指定される特殊な仕様に基づき生産してい
るため、一定の期間にわたり履行される義務であると判断し、履行義務の充足に係る進捗度を見積り、当該進捗度
に基づき収益を認識しております。
電子部品事業においては、主に自動車用電装品の製造、販売を行っており、顧客との販売契約に基づいて製品を
引き渡す義務を負っております。これらの製品の販売については、主として顧客が当該製品に対する支配を獲得し
たと認められる時点が契約の履行義務の充足時期であり、当該製品の出荷に基づき売上収益を認識しております。
なお、取引の対価は履行義務を充足してから1年以内に受領しており、重要な金融要素は含まれておりません。
(6) 重要な外貨建の資産又は負債の本邦通貨への換算基準
外貨建金銭債権債務は、連結決算日の直物為替相場により円貨に換算し、換算差額は損益として処理しておりま
す。なお、在外子会社の資産及び負債は、当該子会社の決算日の直物為替相場により円貨に換算し、収益及び費用
は期中平均相場により円貨に換算し、換算差額は純資産の部における為替換算調整勘定に含めて計上しておりま
す。
(7) 連結キャッシュ・フロー計算書における資金の範囲
手許現金、随時引出し可能な預金及び容易に換金可能であり、かつ、価格の変動について僅少なリスクしか負わ
ない取得日から3か月以内に償還期限の到来する短期投資からなっております。
71/117
EDINET提出書類
株式会社TEIKOKU(E01761)
有価証券報告書
(未適用の会計基準等)
・「リースに関する会計基準」(企業会計基準第34号 2024年9月13日企業会計基準委員会)
・「リースに関する会計基準の適用指針」(企業会計基準適用指針第33号 2024年9月13日企業会計基準委員
会) 等
(1)概要
企業会計基準委員会において、日本基準を国際的に整合性のあるものとする取組みの一環として、借手の全ての
リースについて資産及び負債を認識するリースに関する会計基準の開発に向けて、国際的な会計基準を踏まえた検
討が行われ、基本的な方針として、IFRS第16号の単一の会計処理モデルを基礎とするものの、IFRS第16号の全ての
定めを採り入れるのではなく、主要な定めのみを採り入れることにより、簡素で利便性が高く、かつ、IFRS第16号
の定めを個別財務諸表に用いても、基本的に修正が不要となることを目指したリース会計基準等が公表されまし
た。
借手の会計処理として、借手のリースの費用配分の方法については、IFRS第16号と同様に、リースがファイナン
ス・リースであるかオペレーティング・リースであるかにかかわらず、全てのリースについて使用権資産に係る減
価償却費及びリース負債に係る利息相当額を計上する単一の会計処理モデルが適用されます。
(2)適用予定日
2028年3月期の期首から適用します。
(3)当該会計基準等の適用による影響
「リースに関する会計基準」等の適用による連結財務諸表に与える影響額については、現時点で評価中でありま
す。
72/117
EDINET提出書類
株式会社TEIKOKU(E01761)
有価証券報告書
(連結貸借対照表関係)
※1 受取手形、売掛金及び契約資産のうち、顧客との契約から生じた債権及び契約資産の金額は、それぞれ以下のと
おりであります。
前連結会計年度
(2025年3月31日)
受取手形
売掛金
契約資産
2
82,039千円
8,823,802千円
453,356千円
当連結会計年度
(2026年3月31日)
11,278千円
8,708,591千円
415,895千円
電子記録債権譲渡高
前連結会計年度
(2025年3月31日)
電子記録債権譲渡高
※3
1,073,609千円
当連結会計年度
(2026年3月31日)
1,059,839千円
その他のうち、契約負債の金額は、以下のとおりであります。
前連結会計年度
(2025年3月31日)
契約負債
※4
1,800,835千円
当連結会計年度
(2026年3月31日)
1,705,638千円
有形固定資産の減価償却累計額には、減損損失累計額が含まれております。
(連結損益計算書関係)
※1 販売費及び一般管理費のうち主要な費目及び金額は次のとおりであります。
前連結会計年度
(自 2024年4月1日
至 2025年3月31日)
荷造運搬費
広告宣伝費
378,333千円
85,490
製品保証引当金繰入額
11,349
当連結会計年度
(自 2025年4月1日
至 2026年3月31日)
353,963千円
120,794
9,897
110,238
26,403
3,101,107
3,018,160
賞与引当金繰入額
172,472
160,587
退職給付費用
78,803
52,074
法定福利費
376,459
369,889
賃借料
185,155
188,959
減価償却費
175,841
163,700
旅費及び交通費
296,256
303,341
研究開発費
504,003
548,536
前連結会計年度
(自 2024年4月1日
至 2025年3月31日)
当連結会計年度
(自 2025年4月1日
至 2026年3月31日)
貸倒引当金繰入額
役員報酬及び従業員給与賞与
※2
一般管理費及び当期製造費用に含まれる研究開発費の総額
一般管理費及び当期製造費用に含まれる
研究開発費の総額
524,162千円
568,026千円
※3
期末棚卸高は収益性の低下に伴う簿価切下後の金額であり、次の棚卸資産評価損が売上原価に含まれておりま
す。
前連結会計年度
(自 2024年4月1日
至 2025年3月31日)
売上原価に含まれる棚卸評価損
84,138千円
73/117
当連結会計年度
(自 2025年4月1日
至 2026年3月31日)
57,821千円
EDINET提出書類
株式会社TEIKOKU(E01761)
有価証券報告書
※4
固定資産売却益の内容は次のとおりであります。
前連結会計年度
(自 2024年4月1日
至 2025年3月31日)
当連結会計年度
(自 2025年4月1日
至 2026年3月31日)
建物及び構築物
−千円
機械装置及び運搬具
−
3,215
工具、器具及び備品
−
−
71
△40,673
−
140,392
土地
計
177,778千円
当連結会計年度において、土地と建物等が一体となった固定資産を売却した際、各資産種類毎では売却益、売却損が
発生しているため、売却損益を通算して固定資産売却益を計上しております。
※5
固定資産売却損の内容は次のとおりであります。
前連結会計年度
(自 2024年4月1日
至 2025年3月31日)
建物及び構築物
当連結会計年度
(自 2025年4月1日
至 2026年3月31日)
−千円
11,597千円
機械装置及び運搬具
11,393
9,610
工具、器具及び備品
3
2,842
748
5,710
14,238
27,665
土地
計
※6
関係会社整理損
関係会社整理損は、連結子会社である株式会社平福電機製作所の事業停止に伴い発生した損失であり、その内訳
は、同社の従業員に対する転進支援制度の中で同社が要求する期日(2024年12月31日)までの継続勤務を条件とし
た割増退職金460,231千円及び転進支援サービス費用89,500千円並びにその他費用60,929千円です。
なお、事業停止に伴う固定資産の売却益(機械装置及び運搬具等)137,692千円を控除して表示しております。
(連結包括利益計算書関係)
※1 その他の包括利益に係る組替調整額並びに法人税等及び税効果額
前連結会計年度
2024年4月1日
2025年3月31日)
(自
至
当連結会計年度
2025年4月1日
2026年3月31日)
(自
至
その他有価証券評価差額金:
当期発生額
組替調整額
法人税等及び税効果調整前
法人税等及び税効果額
その他有価証券評価差額金
126,238千円
△108,652
209,051千円
△868,999
17,585
△11,714
△659,948
207,883
5,870
△452,064
1,016,877
112,854
25,479
1,150
120,655
5,830
26,629
△8,871
126,486
△39,843
為替換算調整勘定:
当期発生額
退職給付に係る調整額:
当期発生額
組替調整額
法人税等及び税効果調整前
法人税等及び税効果額
退職給付に係る調整額
その他の包括利益合計
74/117
17,757
86,642
1,040,506
△252,566
EDINET提出書類
株式会社TEIKOKU(E01761)
有価証券報告書
(連結株主資本等変動計算書関係)
前連結会計年度(自2024年4月1日至2025年3月31日)
1.発行済株式の種類及び総数並びに自己株式の種類及び株式数に関する事項
当連結会計年度期首
株式数(株)
当連結会計年度
増加株式数(株)
当連結会計年度
減少株式数(株)
当連結会計年度末
株式数(株)
(注)1
18,480,038
−
1,600,000
16,880,038
合計
18,480,038
−
1,600,000
16,880,038
(注)2、3
876,889
1,000,291
1,606,200
270,980
合計
876,889
1,000,291
1,606,200
270,980
発行済株式
普通株式
自己株式
普通株式
(注)1.普通株式の発行済株式の株式数の減少1,600,000株は、自己株式の消却によるものであります。
2.普通株式の自己株式の株式数の増加1,000,291株は、取締役会決議による自己株式の取得による増加
1,000,000株、従業員持株会向け譲渡制限付株式インセンティブの無償取得による増加225株、単元未満株式
の買取りによる増加66株であります。
3.普通株式の自己株式の株式数の減少1,606,200株は、自己株式の消却による減少1,600,000株、譲渡制限付株
式報酬としての自己株式の処分による減少6,200株であります。
2.新株予約権及び自己新株予約権に関する事項
該当事項はありません。
3.配当に関する事項
(1)配当金支払額
(決議)
株式の種類
配当金の総額
(千円)
1株当たり
配当額(円)
2024年6月26日
定時株主総会
普通株式
809,744
2024年11月11日
取締役会
普通株式
721,975
基準日
効力発生日
46.0
2024年3月31日
2024年6月27日
41.0
2024年9月30日
2024年12月3日
(2)基準日が当連結会計年度に属する配当のうち、配当の効力発生日が翌連結会計年度となるもの
(決議)
株式の種類
配当金の総額
(千円)
配当の原資
2025年6月26日
定時株主総会
普通株式
1,146,025
利益剰余金
75/117
1株当たり
配当額(円)
69.0
基準日
効力発生日
2025年3月31日
2025年6月27日
EDINET提出書類
株式会社TEIKOKU(E01761)
有価証券報告書
当連結会計年度(自2025年4月1日至2026年3月31日)
1.発行済株式の種類及び総数並びに自己株式の種類及び株式数に関する事項
当連結会計年度期首
株式数(株)
当連結会計年度
増加株式数(株)
当連結会計年度
減少株式数(株)
当連結会計年度末
株式数(株)
(注)1
16,880,038
−
1,100,000
15,780,038
合計
16,880,038
−
1,100,000
15,780,038
(注)2、3
270,980
1,286,665
1,104,900
452,745
合計
270,980
1,286,665
1,104,900
452,745
発行済株式
普通株式
自己株式
普通株式
(注)1.普通株式の発行済株式の株式数の減少1,100,000株は、自己株式の消却によるものであります。
2.普通株式の自己株式の株式数の増加1,286,665株は、取締役会決議による自己株式の取得による増加
1,286,400株、従業員持株会向け譲渡制限付株式インセンティブの無償取得による増加225株、単元未満株式
の買取りによる増加40株であります。
3.普通株式の自己株式の株式数の減少1,104,900株は、自己株式の消却による減少1,100,000株、譲渡制限付株
式報酬としての自己株式の処分による減少4,900株であります。
2.新株予約権及び自己新株予約権に関する事項
該当事項はありません。
3.配当に関する事項
(1)配当金支払額
(決議)
株式の種類
配当金の総額
(千円)
1株当たり
配当額(円)
2025年6月26日
定時株主総会
普通株式
1,146,025
2025年11月10日
取締役会
普通株式
913,765
基準日
効力発生日
69.0
2025年3月31日
2025年6月27日
55.0
2025年9月30日
2025年12月2日
(2)基準日が当連結会計年度に属する配当のうち、配当の効力発生日が翌連結会計年度となるもの
2026年6月29日開催予定の定時株主総会の議案として、株式の配当に関する事項を次のとおり提案しておりま
す。
(決議)
株式の種類
配当金の総額
(千円)
配当の原資
2026年6月29日
定時株主総会
普通株式
1,195,528
利益剰余金
76/117
1株当たり
配当額(円)
78.0
基準日
効力発生日
2026年3月31日
2026年6月30日
EDINET提出書類
株式会社TEIKOKU(E01761)
有価証券報告書
(連結キャッシュ・フロー計算書関係)
※1 現金及び現金同等物の期末残高と連結貸借対照表に掲記されている科目の金額との関係
前連結会計年度
(自 2024年4月1日
至 2025年3月31日)
当連結会計年度
(自 2025年4月1日
至 2026年3月31日)
現金及び預金勘定
13,886,562千円
11,721,391千円
預入期間が3か月を超える定期預金
△1,469,346
△1,631,698
引出制限預金
△418,606
△291,368
現金及び現金同等物
11,998,609
9,798,324
(リース取引関係)
ファイナンス・リース取引
所有権移転外ファイナンス・リース取引
① リース資産の内容
有形固定資産
建物及び構築物、機械装置及び運搬具であります。
② リース資産の減価償却の方法
連結財務諸表作成のための基本となる重要な事項「4.会計方針に関する事項 (2)重要な減価償却資産の減
価償却の方法」に記載のとおりであります。
77/117
EDINET提出書類
株式会社TEIKOKU(E01761)
有価証券報告書
(金融商品関係)
1.金融商品の状況に関する事項
(1) 金融商品に対する取組方針
当社グループは、必要な資金については、主に自己資金を充当しておりますが、一部短期的な運転資金を銀行借
入等により調達しております。また、一時的な余資は安全性の高い金融資産で運用しております。
(2) 金融商品の内容及びそのリスク並びにリスク管理体制
営業債権である受取手形及び売掛金、電子記録債権は、顧客の信用リスクに晒されておりますが、売掛債権管理
規定に沿ってリスク低減を図っております。グローバルに事業を展開していることから生じている外貨建ての営業
債権は、為替の変動リスクに晒されておりますが、同じ外貨建ての営業債務と相殺することや、外貨建て資産が過
度に増え過ぎないよう保有する外貨建て資産を市場動向に注視しながら適宜円に転換していくことによりリスクの
低減を図っております。
また、投資有価証券は、主に業務上の関係を有する企業の株式であり、市場価格の変動リスクに晒されておりま
すが、上場株式については定期的に時価や発行体(取引先企業)の財務状況を把握し、取引先企業との関係を勘案
して保有状況を継続的に見直しております。
営業債務である支払手形及び買掛金、電子記録債務は、ほとんどが1年以内の支払期日であります。また、その
一部には外貨建てのものがあり、為替の変動リスクに晒されておりますが、恒常的に同じ外貨建ての売掛金残高の
範囲内にあります。
2.金融商品の時価等に関する事項
連結貸借対照表計上額、時価及びこれらの差額については、次のとおりであります。
前連結会計年度(2025年3月31日)
連結貸借対照表計上額
(千円)
投資有価証券(※2)
資産計
時価(千円)
差額(千円)
1,143,999
1,143,999
−
1,143,999
1,143,999
−
当連結会計年度(2026年3月31日)
連結貸借対照表計上額
(千円)
投資有価証券(※2)
資産計
時価(千円)
差額(千円)
362,699
362,699
−
362,699
362,699
−
(※1)「現金及び預金」、「受取手形、売掛金及び契約資産」、「電子記録債権」、「支払手形及び買掛金」、
「電子記録債務」、「未払法人税等」については、短期間で決済されるため時価が帳簿価額に近似するもの
であることから、記載を省略しております。
(※2)以下の金融商品は、市場価格のない株式等であることから、上表の「投資有価証券」には含めておりません。
当該金融商品の連結貸借対照表計上額は以下のとおりであります。
区分
前連結会計年度(千円)
当連結会計年度(千円)
非上場株式
3,727
78/117
3,727
EDINET提出書類
株式会社TEIKOKU(E01761)
有価証券報告書
(注)1.金銭債権の連結決算日後の償還予定額
前連結会計年度(2025年3月31日)
1年超
5年以内
(千円)
1年以内
(千円)
5年超
10年以内
(千円)
10年超
(千円)
現金及び預金
13,886,562
−
−
−
受取手形、売掛金及び契約資産
9,359,199
−
−
−
電子記録債権
1,324,581
−
−
−
24,570,343
−
−
−
合計
当連結会計年度(2026年3月31日)
1年超
5年以内
(千円)
1年以内
(千円)
5年超
10年以内
(千円)
10年超
(千円)
現金及び預金
11,721,391
−
−
−
受取手形、売掛金及び契約資産
9,135,764
−
−
−
電子記録債権
1,697,802
−
−
−
22,554,958
−
−
−
合計
(注)2. リース債務の連結決算日後の返済予定額
前連結会計年度(2025年3月31日)
1年以内
(千円)
1年超
2年以内
(千円)
2年超
3年以内
(千円)
3年超
4年以内
(千円)
4年超
5年以内
(千円)
5年超
(千円)
リース債務
211,477
149,701
128,911
95,730
247
−
合計
211,477
149,701
128,911
95,730
247
−
当連結会計年度(2026年3月31日)
1年以内
(千円)
1年超
2年以内
(千円)
2年超
3年以内
(千円)
3年超
4年以内
(千円)
4年超
5年以内
(千円)
5年超
(千円)
リース債務
159,673
135,392
95,932
247
−
−
合計
159,673
135,392
95,932
247
−
−
79/117
EDINET提出書類
株式会社TEIKOKU(E01761)
有価証券報告書
3.金融商品の時価のレベルごとの内訳等に関する事項
金融商品の時価を、時価の算定に係るインプットの観察可能性及び重要性に応じて、以下の3つのレベルに分類
しております。
レベル1の時価:観察可能な時価の算定に係るインプットのうち、活発な市場において形成される当該時価の算
定の対象となる資産又は負債に関する相場価格により算定した時価
レベル2の時価:観察可能な時価の算定に係るインプットのうち、レベル1のインプット以外の時価の算定に係
るインプットを用いて算定した時価
レベル3の時価:観察できない時価の算定に係るインプットを使用して算定した時価
時価の算定に重要な影響を与えるインプットを複数使用している場合には、それらのインプットがそれぞれ属す
るレベルのうち、時価の算定における優先順位が最も低いレベルに時価を分類しております。
時価で連結貸借対照表に計上している金融商品
前連結会計年度(2025年3月31日)
時価(千円)
区分
レベル1
レベル2
レベル3
合計
投資有価証券
株式
資産計
1,143,999
−
−
1,143,999
1,143,999
−
−
1,143,999
当連結会計年度(2026年3月31日)
時価(千円)
区分
レベル1
レベル2
レベル3
合計
投資有価証券
株式
資産計
362,699
−
−
362,699
362,699
−
−
362,699
(注)時価の算定に用いた評価技法及び時価の算定に係るインプットの説明
投資有価証券
上場株式は相場価格を用いて評価しております。上場株式は活発な市場で取引されているため、その時
価をレベル1の時価に分類しております。
80/117
EDINET提出書類
株式会社TEIKOKU(E01761)
有価証券報告書
(有価証券関係)
1.その他有価証券
前連結会計年度(2025年3月31日)
種類
(1) 株式
連結貸借対照表
計上額(千円)
取得原価(千円)
差額(千円)
1,143,999
170,500
973,498
① 国債・地方債等
−
−
−
② 社債
−
−
−
③ その他
−
−
−
−
−
−
1,143,999
170,500
973,498
−
−
−
① 国債・地方債等
−
−
−
② 社債
−
−
−
③ その他
−
−
−
−
−
−
−
−
−
1,143,999
170,500
973,498
(2) 債券
連結貸借対照表計上額が
取得原価を超えるもの
(3) その他
小計
(1) 株式
(2) 債券
連結貸借対照表計上額が
取得原価を超えないもの
(3) その他
小計
合計
(注)非上場株式等(連結貸借対照表計上額3,727千円)については、市場価格のない株式等であることから、上表の
「その他有価証券」には含めておりません。
当連結会計年度(2026年3月31日)
種類
連結貸借対照表
計上額(千円)
(1) 株式
取得原価(千円)
差額(千円)
362,699
49,149
313,550
① 国債・地方債等
−
−
−
② 社債
−
−
−
③ その他
−
−
−
−
−
−
362,699
49,149
313,550
−
−
−
① 国債・地方債等
−
−
−
② 社債
−
−
−
③ その他
−
−
−
−
−
−
−
−
−
362,699
49,149
313,550
(2) 債券
連結貸借対照表計上額が
取得原価を超えるもの
(3) その他
小計
(1) 株式
(2) 債券
連結貸借対照表計上額が
取得原価を超えないもの
(3) その他
小計
合計
(注)非上場株式等(連結貸借対照表計上額3,727千円)については、市場価格のない株式等であることから、上表の
「その他有価証券」には含めておりません。
81/117
EDINET提出書類
株式会社TEIKOKU(E01761)
有価証券報告書
2.売却したその他有価証券
前連結会計年度(自 2024年4月1日
種類
至
2025年3月31日)
売却益の合計額
(千円)
売却額(千円)
(1)株式
売却損の合計額
(千円)
189,231
108,652
−
(2)債券
①
国債・地方債等
−
−
−
②
社債
−
−
−
③
その他
−
−
−
−
−
−
189,231
108,652
−
(3)その他
合計
当連結会計年度(自
種類
(1)株式
2025年4月1日
至
2026年3月31日)
売却益の合計額
(千円)
売却額(千円)
売却損の合計額
(千円)
990,350
868,999
−
(2)債券
①
国債・地方債等
−
−
−
②
社債
−
−
−
③
その他
−
−
−
−
−
−
990,350
868,999
−
(3)その他
合計
(デリバティブ取引関係)
当社グループは、デリバティブ取引を全く利用しておりませんので、該当事項はありません。
82/117
EDINET提出書類
株式会社TEIKOKU(E01761)
有価証券報告書
(退職給付関係)
1.採用している退職給付制度の概要
当社は、確定給付型の制度として、企業年金制度及び退職一時金制度を設けているほか、確定拠出型の制度とし
て、確定拠出年金制度を設けており、国内連結子会社及び一部の海外連結子会社は、退職一時金制度を設けておりま
す。
また、当社の退職一時金制度には、退職給付信託が設定されております。
なお、一部の連結子会社は、退職給付債務の算定にあたり、簡便法を採用しております。
2.確定給付制度
(1)退職給付債務の期首残高と期末残高の調整表((3)に掲げられた簡便法を適用した制度を除く)
前連結会計年度
(自 2024年4月1日
至 2025年3月31日)
当連結会計年度
2025年4月1日
2026年3月31日)
(自
至
退職給付債務の期首残高
勤務費用
利息費用
数理計算上の差異の発生額
退職給付の支払額
その他
1,409,476千円
85,854
24,672
△90,768
△33,348
△1,899
1,393,986千円
79,877
37,006
△102,263
△47,340
810
退職給付債務の期末残高
1,393,986
1,362,077
(2)年金資産の期首残高と期末残高の調整表((3)に掲げられた簡便法を適用した制度を除く)
前連結会計年度
(自 2024年4月1日
至 2025年3月31日)
当連結会計年度
2025年4月1日
2026年3月31日)
(自
至
年金資産の期首残高
期待運用収益
数理計算上の差異の発生額
事業主からの拠出額
退職給付の支払額
1,406,185千円
28,123
△65,289
20,543
△11,840
1,377,722千円
27,554
18,391
21,099
△11,542
年金資産の期末残高
1,377,722
1,433,226
(3)簡便法を採用した制度の、退職給付に係る負債の期首残高と期末残高の調整表
前連結会計年度
(自 2024年4月1日
至 2025年3月31日)
退職給付に係る負債の期首残高
退職給付費用
事業主からの拠出額
退職給付の支払額
その他
312,143千円
62,504
△225
△263,514
793
退職給付に係る負債の期末残高
111,702
83/117
当連結会計年度
2025年4月1日
2026年3月31日)
(自
至
111,702千円
15,370
△1,415
△8,007
1,359
119,008
EDINET提出書類
株式会社TEIKOKU(E01761)
有価証券報告書
(4)退職給付債務及び年金資産の期末残高と連結貸借対照表に計上された退職給付に係る負債及び退職給付に係る資
産の調整表
前連結会計年度
(2025年3月31日)
積立型制度の退職給付債務
年金資産
当連結会計年度
(2026年3月31日)
1,410,530千円
△1,381,198
1,374,049千円
△1,438,347
29,331
△64,298
非積立型制度の退職給付債務
98,634
112,158
連結貸借対照表に計上された負債と資産の純額
127,966
47,860
364,298
△236,332
358,693
△310,832
127,966
47,860
退職給付に係る負債
退職給付に係る資産
連結貸借対照表に計上された負債と資産の純額
(注)
簡便法を適用した制度を含みます。
(5)退職給付費用及びその内訳項目の金額
前連結会計年度
(自 2024年4月1日
至 2025年3月31日)
当連結会計年度
(自 2025年4月1日
至 2026年3月31日)
勤務費用
利息費用
期待運用収益
数理計算上の差異の費用処理額
簡便法で計算した退職給付費用
85,854千円
24,672
△28,123
1,150
62,504
79,877千円
37,006
△27,554
5,830
15,370
確定給付制度に係る退職給付費用
146,057
110,531
(6)退職給付に係る調整額
退職給付に係る調整額に計上した項目(法人税等及び税効果控除前)の内訳は次のとおりであります。
前連結会計年度
当連結会計年度
(自 2024年4月1日
(自 2025年4月1日
至 2025年3月31日)
至 2026年3月31日)
数理計算上の差異
合
計
26,629千円
126,486千円
26,629
126,486
(7)退職給付に係る調整累計額
退職給付に係る調整累計額に計上した項目(法人税等及び税効果控除前)の内訳は次のとおりであります。
前連結会計年度
(2025年3月31日)
未認識数理計算上の差異
合
計
84/117
当連結会計年度
(2026年3月31日)
80,324千円
206,810千円
80,324
206,810
EDINET提出書類
株式会社TEIKOKU(E01761)
有価証券報告書
(8)年金資産に関する事項
① 年金資産の主な内訳
年金資産合計に対する主な分類ごとの比率は、次のとおりであります。
前連結会計年度
(2025年3月31日)
当連結会計年度
(2026年3月31日)
16%
11
18
15
7
32
1
43%
15
17
14
7
3
1
国内債券
国内株式
外国債券
外国株式
保険資産(一般勘定)
現金及び預金
その他
合計
100
100
(注)年金資産の合計には、退職一時金制度に対して設定した退職給付信託が前連結会計年度51%、当連結会計
年度48%含まれております。
②
長期期待運用収益率の設定方法
年金資産の長期期待運用収益率を決定するため、現在及び予想される年金資産の配分と、年金資産を構成する
多様な資産からの現在及び将来期待される長期の収益率を考慮しております。
(9)数理計算上の計算基礎に関する事項
主要な数理計算上の計算基礎(加重平均で表わしております。)
割引率
長期期待運用収益率
前連結会計年度
(2025年3月31日)
2.32〜2.41%
2.0%
当連結会計年度
(2026年3月31日)
3.29〜3.39%
2.0%
3.確定拠出制度
当社の確定拠出制度への要拠出額は、前連結会計年度20,131千円、当連結会計年度20,530千円であります。
(ストック・オプション等関係)
該当事項はありません。
85/117
EDINET提出書類
株式会社TEIKOKU(E01761)
有価証券報告書
(税効果会計関係)
1.繰延税金資産及び繰延税金負債の発生の主な原因別の内訳
前連結会計年度
(2025年3月31日)
当連結会計年度
(2026年3月31日)
賞与引当金
147,566千円
152,134千円
棚卸資産
101,791
121,477
繰延税金資産
未払事業税
40,282
39,769
連結会社間内部利益消去
237,826
281,605
退職給付に係る負債
334,046
329,142
5,389
5,389
ゴルフ会員権
減損損失
107,783
41,174
税務上の繰越欠損金(注)
400,837
430,342
353,438
266,630
1,728,964
1,667,666
税務上の繰越欠損金に係る評価性引当額(注)
△398,225
△428,802
将来減算一時差異等の合計に係る評価性引当額
△132,933
△60,197
評価性引当額小計
△531,159
△488,999
繰延税金資産合計
1,197,804
1,178,666
固定資産圧縮積立金
△62,905
△60,344
その他有価証券評価差額金
△306,652
△98,768
子会社の未分配利益
△850,171
△867,510
その他
繰延税金資産小計
繰延税金負債
△122,508
△160,150
△1,342,236
△1,186,773
△144,431
△8,107
その他
繰延税金負債合計
繰延税金資産(負債)の純額
(注)税務上の繰越欠損金及びその繰延税金資産の繰越期限別の金額
前連結会計年度(2025年3月31日)
1年超
2年超
3年超
1年以内
2年以内
3年以内
4年以内
(千円)
(千円)
(千円)
(千円)
税務上の繰越欠損金
−
−
−
−
(※)
4年超
5年以内
(千円)
5年超
(千円)
−
400,837
400,837
合計
(千円)
評価性引当額
−
−
−
−
−
△398,225
△398,225
繰延税金資産
−
−
−
−
−
2,611
2,611
2年超
3年以内
(千円)
3年超
4年以内
(千円)
4年超
5年以内
(千円)
5年超
(千円)
−
−
−
430,342
430,342
(※)税務上の繰越欠損金は、法定実効税率を乗じた額であります。
当連結会計年度(2026年3月31日)
1年超
1年以内
2年以内
(千円)
(千円)
税務上の繰越欠損金
−
−
(※)
合計
(千円)
評価性引当額
−
−
−
−
−
△428,802
△428,802
繰延税金資産
−
−
−
−
−
1,540
1,540
(※)税務上の繰越欠損金は、法定実効税率を乗じた額であります。
86/117
EDINET提出書類
株式会社TEIKOKU(E01761)
有価証券報告書
2.法定実効税率と税効果会計適用後の法人税等の負担率との間に重要な差異があるときの、当該差異の原因となった主
要な項目別の内訳
前連結会計年度
(2025年3月31日)
法定実効税率
(調整)
交際費等永久に損金に算入されない項目
住民税均等割
外国源泉税
海外子会社の税率差異
評価性引当額の増減
法人税額の特別控除額
法定実効税率と税効
果会計適用後の法人税
等の負担率との間の差
異が法定実効税率の
100分の5以下である
ため注記を省略してお
ります。
その他
税効果会計適用後の法人税等の負担率
87/117
当連結会計年度
(2026年3月31日)
30.6%
0.5
0.2
2.0
△4.8
△0.7
△1.0
0.6
27.4
EDINET提出書類
株式会社TEIKOKU(E01761)
有価証券報告書
(収益認識関係)
1.顧客との契約から生じる収益を分解した情報
当連結会計年度より、報告セグメントを「ポンプ事業」の単一セグメントに変更しております。
詳細は、「第5 経理の状況 1 連結財務諸表等注記事項(セグメント情報等)」に記載のとおりでありま
す。
(単位:千円)
前連結会計年度
2024年4月1日
2025年3月31日)
(自
至
当連結会計年度
2025年4月1日
2026年3月31日)
(自
至
日本
10,221,788
8,974,689
欧米
8,049,082
7,557,644
アジア
12,275,416
12,558,909
顧客との契約から生じる収益
30,546,287
29,091,243
外部顧客への売上高
30,546,287
29,091,243
(注)当社及び連結子会社の所在する国又は地域に分類しております。
2.顧客との契約から生じる収益を理解するための基礎となる情報
顧客との契約から生じる収益を理解するための基礎となる情報は、連結財務諸表作成のための基本となる重要な事
項「4.会計方針に関する事項(5)重要な収益及び費用の計上基準」に記載のとおりであります。
3.顧客との契約に基づく履行義務の充足と当該契約から生じるキャッシュ・フローとの関係並びに当連結会計年度末
において存在する顧客との契約から翌連結会計年度以降に認識すると見込まれる収益の金額及び時期に関する情報
(1) 契約資産及び契約負債の残高等
(単位:千円)
前連結会計年度
当連結会計年度
顧客との契約から生じた債権(期首残高)
9,860,774
10,230,423
顧客との契約から生じた債権(期末残高)
10,230,423
10,417,671
契約資産(期首残高)
495,796
453,356
契約資産(期末残高)
453,356
415,895
契約負債(期首残高)
1,460,423
1,800,835
契約負債(期末残高)
1,800,835
1,705,638
当連結会計年度に認識された収益のうち期首時点の契約負債残高に含まれていた額は、1,357,705千円でありま
す。
契約資産は、顧客との販売契約について、一定期間にわたり充足した履行義務に対する当社の権利であり、対価
に対する当社の権利が無条件になった時点で顧客との契約に生じた債権に振り替えております。
契約負債は、顧客との販売契約について、契約に基づき顧客から受け取った前受金に関するものであります。
なお、当連結会計年度において、過去の期間に充足した履行義務から認識した収益の額に重要性はありません。
(2) 残存履行義務に配分した取引価格
当連結会計年度末における残存履行義務に配分した取引価格の総額は14,437,441千円であり、期末日後1年以内
に概ね90%が収益として認識されると見込んでおります。
また、顧客から受け取る対価の中に、取引価格に含まれない重要な変動対価の額等はありません。
88/117
EDINET提出書類
株式会社TEIKOKU(E01761)
有価証券報告書
(セグメント情報等)
【セグメント情報】
Ⅰ 前連結会計年度(自 2024年4月1日至 2025年3月31日)
「Ⅱ 当連結会計年度(報告セグメントの変更等に関する事項)」に記載のとおりであります。
Ⅱ
当連結会計年度(自 2025年4月1日至 2026年3月31日)
当社グループは「ポンプ事業」を単一の報告セグメントとしており、その他の事業については量的重要性が乏しい
ため、セグメント情報の記載を省略しております。
(報告セグメントの変更等に関する事項)
当社グループは従来、報告セグメントを「ポンプ事業」及び「電子部品事業」、報告セグメントに含まない「その
他」の3つにセグメントを区分しておりましたが、当連結会計年度より「ポンプ事業」の単一セグメントに変更して
おります。
この変更は、2024年12月31日をもって、当社グループの「電子部品事業」を担う子会社である株式会社平福電機製
作所の事業を停止したこと及び、「その他」の量的な重要性が乏しいことから、報告セグメントを「ポンプ事業」の
単一セグメントとして一体開示することが、当社グループの経営実態をより適切に反映するものと判断したためであ
ります。
この変更により、前連結会計年度及び当連結会計年度におけるセグメント情報の記載を省略しております。
89/117
EDINET提出書類
株式会社TEIKOKU(E01761)
有価証券報告書
【関連情報】
前連結会計年度(自2024年4月1日
1.製品及びサービスごとの情報
至2025年3月31日)
(単位:千円)
ポンプ事業
外部顧客への売上高
電子部品事業
29,289,194
その他
1,004,191
合計
252,901
30,546,287
2.地域ごとの情報
(1)売上高
(単位:千円)
日本
8,326,173
アジア・オセアニア
米州
中国
その他
米国
その他
8,941,783
4,744,721
6,508,855
940,841
その他
合計
1,083,912
30,546,287
(注)売上高は顧客の所在地を基礎とし、国又は地域に分類しております。
(2)有形固定資産
(単位:千円)
アジア・オセアニア
日本
中国
6,249,467
米州
その他
1,485,499
215,049
その他
779,584
24,781
合計
8,754,381
3.主要な顧客ごとの情報
(単位:千円)
顧客の名称又は氏名
売上高
関連するセグメント名
三菱電機株式会社
1,097,943
ポンプ事業、電子部品事業
当連結会計年度(自2025年4月1日至2026年3月31日)
1.製品及びサービスごとの情報
単一の製品・サービスの区分の外部顧客への売上高が連結損益計算書の売上高の90%を超えるため、記載を省略
しております。
2.地域ごとの情報
(1)売上高
(単位:千円)
日本
7,180,900
アジア・オセアニア
米州
中国
その他
米国
その他
7,955,423
5,761,327
5,821,875
617,505
その他
合計
1,754,211
29,091,243
(注)売上高は顧客の所在地を基礎とし、国又は地域に分類しております。
(2)有形固定資産
(単位:千円)
日本
5,534,403
アジア・オセアニア
中国
1,415,570
その他
184,543
米州
795,097
3.主要な顧客ごとの情報
該当事項はありません。
90/117
その他
23,138
合計
7,952,754
EDINET提出書類
株式会社TEIKOKU(E01761)
有価証券報告書
【報告セグメントごとの固定資産の減損損失に関する情報】
該当事項はありません。
【報告セグメントごとののれんの償却額及び未償却残高に関する情報】
該当事項はありません。
【報告セグメントごとの負ののれん発生益に関する情報】
該当事項はありません。
【関連当事者情報】
1.関連当事者との取引
(1)連結財務諸表提出会社と関連当事者との取引
重要性がないため記載を省略しております。
(2)連結財務諸表提出会社の連結子会社と関連当事者との取引
(ア)連結財務諸表提出会社の親会社及び主要株主(会社等の場合に限る。)等
重要性がないため記載を省略しております。
(イ)連結財務諸表提出会社の非連結子会社及び関連会社等
該当事項はありません。
(ウ)連結財務諸表提出会社と同一の親会社をもつ会社等及び連結財務諸表提出会社のその他の関係会社の子会社等
該当事項はありません。
(エ)連結財務諸表提出会社の役員及び主要株主(個人の場合に限る。)等
該当事項はありません。
91/117
EDINET提出書類
株式会社TEIKOKU(E01761)
有価証券報告書
(1株当たり情報)
前連結会計年度
(自 2024年4月1日
至 2025年3月31日)
当連結会計年度
2025年4月1日
2026年3月31日)
(自
至
1株当たり純資産額
1,971.14円
2,045.68円
1株当たり当期純利益
219.27円
265.69円
(注)1.潜在株式調整後1株当たり当期純利益については、潜在株式が存在しないため記載しておりません。
2.1株当たり当期純利益の算定上の基礎は、以下のとおりであります。
前連結会計年度
2024年4月1日
2025年3月31日)
(自
至
親会社株主に帰属する当期純利益(千円)
当連結会計年度
2025年4月1日
2026年3月31日)
(自
至
3,811,499
4,341,599
−
−
普通株式に係る親会社株主に帰属する当期純利
益(千円)
3,811,499
4,341,599
普通株式の期中平均株式数(株)
17,382,551
16,341,007
普通株主に帰属しない金額(千円)
(重要な後発事象)
該当事項はありません。
92/117
EDINET提出書類
株式会社TEIKOKU(E01761)
有価証券報告書
⑤【連結附属明細表】
【社債明細表】
該当事項はありません。
【借入金等明細表】
当期首残高
(千円)
当期末残高
(千円)
1年以内に返済予定のリース債務
211,477
リース債務(1年以内に返済予定のものを除く。)
合計
区分
平均利率
(%)
返済期限
159,673
4.5
−
374,590
231,572
4.1
2027年〜2029年
586,067
391,245
−
−
(注)1.平均利率は、期末残高における加重平均利率を記載しております。
2.リース債務(1年以内に返済予定のものを除く。)の連結決算日後5年間の返済予定額は、次のとおりであ
ります。
リース債務
1年超2年以内
(千円)
2年超3年以内
(千円)
3年超4年以内
(千円)
4年超5年以内
(千円)
135,392
95,932
247
−
【資産除去債務明細表】
該当事項はありません。
(2)【その他】
当連結会計年度における四半期情報等
(累計期間)
第1四半期
中間連結会計期間
第3四半期
当連結会計年度
売上高(千円)
6,232,872
13,637,007
21,286,567
29,091,243
税金等調整前中間(当期)
(四半期)純利益(千円)
1,604,456
3,542,242
4,957,463
6,426,252
親会社株主に帰属する中間
(当期)(四半期)純利益
(千円)
964,321
2,349,325
3,337,253
4,341,599
1株当たり中間(当期)(四
半期)純利益(円)
58.06
141.43
200.90
265.69
(会計期間)
1株当たり四半期純利益
(円)
第1四半期
第2四半期
58.06
83.37
第3四半期
59.46
第4四半期
64.74
(注)当社は、第1四半期及び第3四半期について金融商品取引所の定める規則により四半期に係る財務情報を作成して
おりますが、当該四半期に係る財務情報に対する期中レビューは受けておりません。
93/117
EDINET提出書類
株式会社TEIKOKU(E01761)
有価証券報告書
2【財務諸表等】
(1)【財務諸表】
①【貸借対照表】
(単位:千円)
前事業年度
(2025年3月31日)
資産の部
流動資産
現金及び預金
受取手形
電子記録債権
売掛金及び契約資産
製品
仕掛品
原材料及び貯蔵品
前払費用
関係会社短期貸付金
未収入金
その他
貸倒引当金
流動資産合計
固定資産
有形固定資産
建物
構築物
機械及び装置
車両運搬具
工具、器具及び備品
土地
リース資産
建設仮勘定
有形固定資産合計
無形固定資産
ソフトウエア
ソフトウエア仮勘定
電話加入権
無形固定資産合計
投資その他の資産
投資有価証券
関係会社株式
出資金
関係会社出資金
従業員に対する長期貸付金
長期前払費用
会員権
前払年金費用
繰延税金資産
その他
貸倒引当金
投資その他の資産合計
固定資産合計
資産合計
94/117
当事業年度
(2026年3月31日)
3,959,947
80,809
983,445
※1 5,454,054
312,819
752,852
1,381,387
65,540
1,000,000
321,358
114,964
△121,000
14,306,180
3,393,582
10,335
1,043,814
※1 5,549,245
314,021
755,812
1,606,438
70,754
19,000
258,293
58,680
△1,000
13,078,980
2,708,663
201,337
773,797
4,593
78,090
886,336
8,421
9,596
4,670,837
2,621,498
171,772
641,029
2,474
124,002
876,956
5,396
80,256
4,523,387
72,045
16,000
4,232
92,277
74,981
−
4,232
79,213
1,147,726
1,907,797
30
815,405
9,195
26,390
11,200
154,643
174,680
43,360
△6,800
4,283,628
9,046,744
23,352,924
366,427
1,907,797
30
815,405
5,790
6,702
11,200
152,966
384,355
43,232
△6,800
3,687,108
8,289,709
21,368,689
EDINET提出書類
株式会社TEIKOKU(E01761)
有価証券報告書
(単位:千円)
前事業年度
(2025年3月31日)
負債の部
流動負債
支払手形
電子記録債務
買掛金
リース債務
未払金
未払法人税等
未払消費税等
契約負債
預り金
製品保証引当金
賞与引当金
その他
流動負債合計
固定負債
リース債務
退職給付引当金
その他
固定負債合計
負債合計
純資産の部
株主資本
資本金
資本剰余金
資本準備金
資本剰余金合計
利益剰余金
利益準備金
その他利益剰余金
固定資産圧縮積立金
別途積立金
繰越利益剰余金
利益剰余金合計
自己株式
株主資本合計
評価・換算差額等
その他有価証券評価差額金
評価・換算差額等合計
純資産合計
負債純資産合計
95/117
当事業年度
(2026年3月31日)
52,203
453,169
※1 390,106
3,327
272,516
678,736
80,049
73,523
376,148
18,656
408,728
26,956
2,834,123
61,115
336,755
※1 359,377
2,339
310,719
639,535
−
33,818
263,847
16,709
404,588
25,732
2,454,538
5,936
226,046
2,300
234,283
3,068,406
3,597
255,595
2,300
261,493
2,716,031
3,143,675
3,143,675
2,931,466
2,931,466
2,931,466
2,931,466
145,275
145,275
137,033
6,211,000
7,683,369
14,176,678
△634,148
19,617,671
131,224
6,211,000
7,065,157
13,552,658
△1,189,922
18,437,876
666,846
666,846
20,284,517
23,352,924
214,782
214,782
18,652,658
21,368,689
EDINET提出書類
株式会社TEIKOKU(E01761)
有価証券報告書
②【損益計算書】
(単位:千円)
(自
至
前事業年度
2024年4月1日
2025年3月31日)
売上高
売上原価
売上総利益
販売費及び一般管理費
営業利益
営業外収益
受取利息及び受取配当金
為替差益
受取賃貸料
経営指導料
太陽光売電収入
その他
営業外収益合計
営業外費用
支払利息
為替差損
賃貸費用
太陽光売電原価
その他
営業外費用合計
経常利益
特別利益
投資有価証券売却益
特別利益合計
特別損失
固定資産売却損
関係会社株式評価損
関係会社整理損
特別損失合計
税引前当期純利益
法人税、住民税及び事業税
法人税等調整額
法人税等合計
当期純利益
(自
至
※1 13,603,882
※1 13,424,093
※1 8,079,323
※1 8,233,300
5,524,558
※1,※2 2,754,970
※1,※2 2,899,512
2,769,587
2,291,280
※1 2,678,858
※1 2,131,573
5,190,793
−
170,839
※1 40,562
※1 41,967
※1,※3 5,866
※1,※3 4,818
11,515
※1 11,430
11,938
※1 11,152
2,748,232
2,372,289
※1 1,457
※1 3,623
79,574
14,082
5,142
300
100,557
5,417,262
−
14,085
4,715
0
22,424
4,641,145
29,311
29,311
868,999
868,999
7,567
10,090
※4 209,500
6,243
−
−
6,243
5,503,901
1,182,358
△1,791
1,180,566
4,323,334
227,157
5,219,416
1,174,622
△87,284
1,087,337
4,132,078
96/117
当事業年度
2025年4月1日
2026年3月31日)
EDINET提出書類
株式会社TEIKOKU(E01761)
有価証券報告書
【製造原価明細書】
(単位:千円)
前事業年度
2024年4月1日
2025年3月31日)
(自
至
区分
注記
番号
構成比
(%)
金額
当事業年度
2025年4月1日
2026年3月31日)
(自
至
構成比
(%)
金額
Ⅰ
材料費
4,379,268
52.7
4,005,286
48.6
Ⅱ
労務費
1,684,533
20.3
1,858,957
22.6
Ⅲ
経費
2,240,771
27.0
2,378,169
28.8
当期総製造費用
8,304,573
100.0
8,242,413
100.0
期首仕掛品棚卸高
608,406
752,852
8,912,979
8,995,265
7,498
4,950
期末仕掛品棚卸高
752,852
755,812
当期製品製造原価
8,152,628
8,234,502
※1
合計
他勘定振替高
当事業年度より「ポンプ事業」の単一セグメントに変更したことにより、財務諸表等規則第75条(売上原価の表
示方法)第2項に定められた連結財務諸表規則第15条の2第1項に規定するセグメント情報を省略しているため、
製造原価明細書を記載しております。また、この表示方法の変更を反映させるため、前事業年度を記載しておりま
す。
(原価計算の方法)
原価計算の方法は、個別原価計算であり、期中は予定原価を用い、原価差額は期末において製品、仕掛品、原材
料、売上原価等に配賦しております。
(注)※1.主な内訳は次のとおりであります。
(単位:千円)
項目
前事業年度
(自 2024年4月1日
至 2025年3月31日)
(自
至
当事業年度
2025年4月1日
2026年3月31日)
外注加工費
1,433,061
1,538,644
減価償却費
351,672
346,048
97/117
EDINET提出書類
株式会社TEIKOKU(E01761)
有価証券報告書
③【株主資本等変動計算書】
前事業年度(自2024年4月1日
至2025年3月31日)
(単位:千円)
株主資本
資本剰余金
利益剰余金
その他利益剰余金
資本金
資本準備金
当期首残高
3,143,675
2,931,466
その他資本
剰余金
資本剰余金
合計
利益準備金
−
2,931,466
145,275
固定資産圧
縮積立金
別途積立金
繰越利益剰
余金
144,566
6,211,000
8,817,806
当期変動額
固定資産圧縮積立金の取崩
△7,533
7,533
剰余金の配当
△1,531,720
当期純利益
4,132,078
自己株式の取得
自己株式の処分
2,000
自己株式の消却
2,000
△3,744,328 △3,744,328
利益剰余金から資本剰余金
への振替
3,742,328
3,742,328
△3,742,328
株主資本以外の項目の当期
変動額(純額)
当期変動額合計
当期末残高
−
−
−
−
−
△7,533
3,143,675
2,931,466
−
2,931,466
145,275
137,033
98/117
− △1,134,436
6,211,000
7,683,369
EDINET提出書類
株式会社TEIKOKU(E01761)
有価証券報告書
(単位:千円)
評価・換算
差額等
株主資本
利益剰余金
利益剰余金
合計
当期首残高
自己株式
15,318,648 △1,914,845
株主資本合
計
その他有価
証券評価差
額金
19,478,944
615,262
純資産合計
20,094,207
当期変動額
固定資産圧縮積立金の取崩
−
−
−
剰余金の配当
△1,531,720
△1,531,720
△1,531,720
当期純利益
4,132,078
4,132,078
4,132,078
自己株式の取得
− △2,477,168 △2,477,168
△2,477,168
自己株式の処分
−
13,536
15,537
15,537
自己株式の消却
−
3,744,328
−
−
−
利益剰余金から資本剰余金
への振替
△3,742,328
−
株主資本以外の項目の当期
変動額(純額)
−
−
51,583
51,583
当期変動額合計
△1,141,969
1,280,696
138,726
51,583
190,310
当期末残高
14,176,678
△634,148
19,617,671
666,846
20,284,517
99/117
EDINET提出書類
株式会社TEIKOKU(E01761)
有価証券報告書
当事業年度(自2025年4月1日
至2026年3月31日)
(単位:千円)
株主資本
資本剰余金
利益剰余金
その他利益剰余金
資本金
資本準備金
当期首残高
3,143,675
2,931,466
その他資本
剰余金
資本剰余金
合計
利益準備金
−
2,931,466
145,275
固定資産圧
縮積立金
別途積立金
繰越利益剰
余金
137,033
6,211,000
7,683,369
当期変動額
固定資産圧縮積立金の取崩
△5,808
5,808
剰余金の配当
△2,059,790
当期純利益
4,323,334
自己株式の取得
自己株式の処分
4,457
自己株式の消却
4,457
△2,892,022 △2,892,022
利益剰余金から資本剰余金
への振替
2,887,564
2,887,564
△2,887,564
株主資本以外の項目の当期
変動額(純額)
当期変動額合計
当期末残高
−
−
−
−
−
△5,808
−
△618,211
3,143,675
2,931,466
−
2,931,466
145,275
131,224
6,211,000
7,065,157
100/117
EDINET提出書類
株式会社TEIKOKU(E01761)
有価証券報告書
(単位:千円)
評価・換算
差額等
株主資本
利益剰余金
利益剰余金
合計
当期首残高
14,176,678
自己株式
株主資本合
計
その他有価
証券評価差
額金
△634,148
19,617,671
666,846
純資産合計
20,284,517
当期変動額
固定資産圧縮積立金の取崩
−
−
−
剰余金の配当
△2,059,790
△2,059,790
△2,059,790
当期純利益
4,323,334
4,323,334
4,323,334
自己株式の取得
− △3,459,264 △3,459,264
△3,459,264
自己株式の処分
−
11,467
15,925
15,925
自己株式の消却
−
2,892,022
−
−
−
利益剰余金から資本剰余金
への振替
△2,887,564
−
株主資本以外の項目の当期
変動額(純額)
−
−
当期変動額合計
△624,020
△555,774 △1,179,794
当期末残高
13,552,658 △1,189,922
△452,064
△452,064
△452,064 △1,631,859
18,437,876
101/117
214,782
18,652,658
EDINET提出書類
株式会社TEIKOKU(E01761)
有価証券報告書
【注記事項】
(重要な会計方針)
1.有価証券の評価基準及び評価方法
(1) 子会社株式
……移動平均法による原価法
(2) その他有価証券
市場価格のない株式等以外のもの
……時価法(評価差額は全部純資産直入法により処理し、売却原価は移動平均法により算定)
市場価格のない株式等
……主として移動平均法による原価法
2.棚卸資産の評価基準及び評価方法
主として総平均法による原価法(貸借対照表価額は収益性の低下に基づく簿価切下げの方法により算定)を採用し
ております。
3.固定資産の減価償却の方法
(1) 有形固定資産(リース資産を除く)
……定率法
ただし、1998年4月1日以降に取得した建物(建物附属設備を除く。)並びに2016年4月1日以降に取得し
た建物附属設備及び構築物については、定額法を採用しております。
なお、主な耐用年数は次のとおりであります。
建物
15〜50年
機械及び装置
12年
(2) 無形固定資産(リース資産を除く)
……自社利用のソフトウエアについては、社内における利用可能期間(5年)に基づく定額法
(3) リース資産
……リース期間を耐用年数とし、残存価額を零とする定額法を採用しております。
(4) 長期前払費用
……定額法
4.外貨建の資産及び負債の本邦通貨への換算基準
外貨建金銭債権債務は、決算期末日の直物為替相場により円貨に換算し、換算差額は損益として処理しておりま
す。
5.引当金の計上基準
(1)貸倒引当金
債権の貸倒れによる損失に備えるため、一般債権については貸倒実績率により、貸倒懸念債権等特定の債権につ
いては個別に回収可能性を勘案し、回収不能見込額を計上しております。
(2)製品保証引当金
製品のアフターサービス費用の支出に備えるため、過年度実績率に基づいて算定した金額を計上しております。
(3)賞与引当金
従業員に対して支給する賞与の支出に充てるため、支給見込額を計上しております。
102/117
EDINET提出書類
株式会社TEIKOKU(E01761)
有価証券報告書
(4)退職給付引当金
従業員の退職給付に備えるため、当事業年度末における退職給付債務及び年金資産の見込額に基づき計上してお
ります。
①退職給付見込額の期間帰属方法
退職給付債務の算定にあたり、退職給付見込額を当事業年度末までの期間に帰属させる方法については、給付算
定式基準によっております。
②数理計算上の差異、過去勤務費用及び会計基準変更時差異の費用処理方法
過去勤務費用については、その発生時における従業員の平均残存勤務期間以内の一定の年数(10年)による定額
法により費用処理しております。
数理計算上の差異については、各事業年度の発生時における従業員の平均残存勤務期間以内の一定の年数(10
年)による定額法により按分した額を、それぞれ発生の翌事業年度から費用処理しております。
6.収益及び費用の計上基準
当社は、約束した財又はサービスの支配が顧客に移転した時点で、当該財又はサービスと交換に受け取ると見込ま
れる金額で収益を認識するため、下記の5ステップを適用して、収益を認識しております。
ステップ1:顧客との契約を識別する。
ステップ2:契約における履行義務を識別する。
ステップ3:取引価格を算定する。
ステップ4:取引価格を契約における履行義務に配分する。
ステップ5:企業が履行義務の充足時に(又は充足するにつれて)収益を認識する。
ポンプ事業においては、主にキャンドモータポンプの製造、販売を行っており、顧客との販売契約に基づいて製品
を引き渡す義務を負っております。これらの製品の販売については、主として顧客が当該製品に対する支配を獲得し
たと認められる時点が契約の履行義務の充足時期であり、当該製品の出荷や貿易上の諸条件に基づき売上収益を認識
しております。また、ポンプ事業の一部の製品は顧客から指定される特殊な仕様に基づき生産しているため、一定の
期間にわたり履行される義務であると判断し、履行義務の充足に係る進捗度を見積り、当該進捗度に基づき収益を認
識しております。
なお、取引の対価は履行義務を充足してから1年以内に受領しており、重要な金融要素は含まれておりません。
7.その他財務諸表作成のための基本となる重要な事項
退職給付に係る会計処理
退職給付に係る未認識数理計算上の差異及び未認識過去勤務費用の未処理額の会計処理の方法は、連結財務諸表に
おけるこれらの会計処理の方法と異なっております。
103/117
EDINET提出書類
株式会社TEIKOKU(E01761)
有価証券報告書
(貸借対照表関係)
※1 関係会社に対する金銭債権及び金銭債務(区分表示したものを除く)
前事業年度
(2025年3月31日)
短期金銭債権
短期金銭債務
2
当事業年度
(2026年3月31日)
2,256,880千円
352,069
1,774,793千円
241,149
保証債務
次の関係会社について、取引先への契約履行保証等を行っております。
TEIKOKU ELECTRIC GmbH
HYDRODYNE TEIKOKU(INDIA)PVT.LTD.
前事業年度
(2025年3月31日)
当事業年度
(2026年3月31日)
(465千ユーロ)75,506千円
(522千ユーロ)95,832千円
(99,874千インドルピー)174,780
(135,403千インドルピー)228,832
−
(8千米ドル)1,422
(損益計算書関係)
※1 関係会社との取引高
(自
至
前事業年度
2024年4月1日
2025年3月31日)
売上高
仕入高
(自
至
4,212,118千円
2,247,583
当事業年度
2025年4月1日
2026年3月31日)
3,869,648千円
2,294,953
販売費及び一般管理費
34,365
44,682
営業取引以外の取引高
2,671,529
2,132,036
※2
販売費に属する費用のおおよその割合は前事業年度48.3%、当事業年度45.7%、一般管理費に属する費用のおお
よその割合は前事業年度51.7%、当事業年度54.3%であります。
販売費及び一般管理費のうち主要な費目及び金額は次のとおりであります。
(自
至
前事業年度
2024年4月1日
2025年3月31日)
荷造運搬費
(自
至
当事業年度
2025年4月1日
2026年3月31日)
製品保証引当金繰入額
306,799千円
11,349
284,067千円
9,897
給料及び手当
658,255
665,703
賞与引当金繰入額
148,121
153,536
退職給付費用
37,184
39,243
減価償却費
87,103
80,962
研究開発費
260,441
308,396
※3
経営指導料とは、関係会社の管理業務等の指導料収入であります。
※4
関係会社整理損
関係会社整理損は、連結子会社である株式会社平福電機製作所の事業停止に伴う転進支援サービス費用89,500千
円及び当該連結子会社への債権に対する貸倒引当金の繰入120,000千円であります。
104/117
EDINET提出書類
株式会社TEIKOKU(E01761)
有価証券報告書
(有価証券関係)
子会社株式
市場価格のない株式等の貸借対照表計上額
区分
前事業年度
(千円)
子会社株式
当事業年度
(千円)
1,907,797
1,907,797
(税効果会計関係)
1.繰延税金資産及び繰延税金負債の発生の主な原因別の内訳
前事業年度
(2025年3月31日)
当事業年度
(2026年3月31日)
55,451千円
39,168
125,070
37,638
291,545
5,389
76,683
41,174
46,217
62,480千円
2,457
127,445
39,371
301,012
5,389
111,648
41,174
61,027
繰延税金資産
棚卸資産
貸倒引当金
賞与引当金
未払事業税
退職給付引当金
ゴルフ会員権
関係会社株式
減損損失
その他
繰延税金資産小計
評価性引当額
718,339
△125,389
752,006
△160,354
繰延税金資産合計
592,950
591,652
△62,905
△306,652
△48,712
△60,344
△98,768
△48,184
△418,269
174,680
△207,296
384,355
繰延税金負債
固定資産圧縮積立金
その他有価証券評価差額金
その他
繰延税金負債合計
繰延税金資産(負債)の純額
2.法定実効税率と税効果会計適用後の法人税等の負担率との間に重要な差異があるときの、当該差異の原因となった主
要な項目別の内訳
前事業年度
(2025年3月31日)
法定実効税率
(調整)
交際費等永久に損金に算入されない項目
受取配当金等永久に益金に算入されない項目
税率変更による期末繰延税金資産の増額修正
海外配当源泉税
税額控除
その他
税効果会計適用後の法人税等の負担率
30.6%
0.1
△14.7
△0.1
4.3
△0.1
0.7
20.8
当事業年度
(2026年3月31日)
30.6%
0.1
△11.1
−
2.3
△1.2
0.7
21.4
(収益認識関係)
顧客との契約から生じる収益を理解するための基礎となる情報は、連結財務諸表「注記事項(収益認識関係)」に同
一の内容を記載しているため、注記を省略しております。
(重要な後発事象)
該当事項はありません。
105/117
EDINET提出書類
株式会社TEIKOKU(E01761)
有価証券報告書
④【附属明細表】
【有形固定資産等明細表】
(単位:千円)
区分
有形
固定資産
無形
固定資産
資産の種類
当期首残高
当期増加額当期減少額
当期償却額
当期末残高
減価償却
累計額
建物
2,708,663
70,060
−
157,225
2,621,498
2,148,909
構築物
201,337
270
−
29,835
171,772
414,077
機械及び装置
773,797
32,369
194
164,943
641,029
3,080,770
車両運搬具
4,593
718
−
2,838
2,474
58,988
工具、器具及び備品
78,090
131,612
1,009
84,690
124,002
1,225,970
土地
886,336
−
9,380
−
876,956
−
リース資産
8,421
−
−
3,024
5,396
9,129
建設仮勘定
9,596
305,691
235,031
−
80,256
−
計
4,670,837
540,723
245,615
442,556
4,523,387
6,937,846
ソフトウエア
72,045
31,416
−
28,481
74,981
−
ソフトウエア仮勘定
16,000
15,416
31,416
−
−
−
電話加入権
4,232
−
−
−
4,232
−
計
92,277
46,833
31,416
28,481
79,213
−
【引当金明細表】
(単位:千円)
科目
当期首残高
当期増加額
当期減少額
当期末残高
貸倒引当金
127,800
−
120,000
7,800
製品保証引当金
18,656
9,897
11,844
16,709
賞与引当金
408,728
404,588
408,728
404,588
(2)【主な資産及び負債の内容】
連結財務諸表を作成しているため、記載を省略しております。
(3)【その他】
該当事項はありません。
106/117
EDINET提出書類
株式会社TEIKOKU(E01761)
有価証券報告書
第6【提出会社の株式事務の概要】
事業年度
毎年4月1日から翌年3月31日まで
定時株主総会
毎年6月
基準日
毎年3月31日
剰余金の配当の基準日
1単元の株式数
(注)
毎年9月30日
毎年3月31日
100株
単元未満株式の買取り
取扱場所
大阪市中央区北浜四丁目5番33号
三井住友信託銀行株式会社証券代行部
株主名簿管理人
東京都千代田区丸の内一丁目4番1号
三井住友信託銀行株式会社
取次所
買取手数料
公告掲載方法
株主に対する特典
──────
無料
当会社の公告方法は、電子公告とする。ただし、事故その他やむを得ない
事由によって電子公告による公告をすることができない場合は、日本経済
新聞に掲載して行う。
なお、当社の公告については、下記のホームページアドレスにてご覧いた
だけます。
https://www.teikokucp.co.jp/
100株以上1,000株未満所有の株主
1,000円分QUOカード
1,000株以上2,000株未満所有の株主
3,000円相当のカタログギフト
2,000株以上所有の株主
5,000円相当のカタログギフト
(注)当会社の株主は、その有する単元未満株式について、次に掲げる権利以外の権利を行使することができません。
(1)会社法第189条第2項各号に掲げる権利
(2)会社法第166条第1項の規定による請求をする権利
(3)株主の有する株式数に応じて募集株式の割当て及び募集新株予約権の割当てを受ける権利
107/117
EDINET提出書類
株式会社TEIKOKU(E01761)
有価証券報告書
第7【提出会社の参考情報】
1【提出会社の親会社等の情報】
当社は、金融商品取引法第24条の7第1項に規定する親会社等はありません。
2【その他の参考情報】
当事業年度の開始日から有価証券報告書提出日までの間に、次の書類を提出しております。
(1)有価証券報告書及びその添付書類並びに確認書
事業年度(第121期)(自 2024年4月1日至 2025年3月31日)2025年6月25日近畿財務局長に提出
(2)内部統制報告書及びその添付書類
2025年6月25日近畿財務局長に提出
(3)半期報告書及び確認書
(第122期中)(自 2025年4月1日至 2025年9月30日)2025年11月11日近畿財務局長に提出
(4)臨時報告書
2025年6月27日近畿財務局長に提出
企業内容等の開示に関する内閣府令第19条第2項第9号の2(株主総会における議決権行使の結果)に基づく臨時
報告書であります。
(5)自己株券買付状況報告書
報告期間(自2025年11月1日至2025年11月30日)2025年12月3日近畿財務局長に提出
報告期間(自2025年12月1日至2025年12月31日)2026年1月9日近畿財務局長に提出
報告期間(自2026年1月1日至2026年1月31日)2026年2月6日近畿財務局長に提出
108/117
EDINET提出書類
株式会社TEIKOKU(E01761)
有価証券報告書
第二部【提出会社の保証会社等の情報】
該当事項はありません。
109/117
EDINET提出書類
株式会社TEIKOKU(E01761)
有価証券報告書
独立監査人の監査報告書及び内部統制監査報告書
2026年6月23日
株式会社TEIKOKU
取締役会
御中
有限責任監査法人トーマツ
神戸事務所
指定有限責任社員
業務執行社員
公認会計士
三浦
宏和
指定有限責任社員
業務執行社員
公認会計士
川合
直樹
<連結財務諸表監査>
監査意見
当監査法人は、金融商品取引法第193条の2第1項の規定に基づく監査証明を行うため、「経理の状況」に掲げられてい
る株式会社TEIKOKU(旧社名株式会社帝国電機製作所)の2025年4月1日から2026年3月31日までの連結会計年度の
連結財務諸表、すなわち、連結貸借対照表、連結損益計算書、連結包括利益計算書、連結株主資本等変動計算書、連結
キャッシュ・フロー計算書、連結財務諸表作成のための基本となる重要な事項、その他の注記及び連結附属明細表につい
て監査を行った。
当監査法人は、上記の連結財務諸表が、我が国において一般に公正妥当と認められる企業会計の基準に準拠して、株式
会社TEIKOKU(旧社名株式会社帝国電機製作所)及び連結子会社の2026年3月31日現在の財政状態並びに同日を
もって終了する連結会計年度の経営成績及びキャッシュ・フローの状況を、全ての重要な点において適正に表示している
ものと認める。
監査意見の根拠
当監査法人は、我が国において一般に公正妥当と認められる監査の基準に準拠して監査を行った。監査の基準における
当監査法人の責任は、「連結財務諸表監査における監査人の責任」に記載されている。当監査法人は、我が国における職
業倫理に関する規定(社会的影響度の高い事業体の財務諸表監査に適用される規定を含む。)に従って、会社及び連結子
会社から独立しており、また、監査人としてのその他の倫理上の責任を果たしている。当監査法人は、意見表明の基礎と
なる十分かつ適切な監査証拠を入手したと判断している。
110/117
EDINET提出書類
株式会社TEIKOKU(E01761)
有価証券報告書
監査上の主要な検討事項
監査上の主要な検討事項とは、当連結会計年度の連結財務諸表の監査において、監査人が職業的専門家として特に重要
であると判断した事項である。監査上の主要な検討事項は、連結財務諸表全体に対する監査の実施過程及び監査意見の形
成において対応した事項であり、当監査法人は、当該事項に対して個別に意見を表明するものではない。
ポンプ事業の製品売上高の適切性
監査上の主要な検討事項の内容及び決定理由
監査上の対応
当社及び連結子会社(以下「会社グループ」という)の
当連結会計年度の売上高は29,091,243千円であり、そのほ
とんどは主力事業であるポンプ事業に係る製品販売取引に
よるものである。
【注記事項】(連結財務諸表作成のための基本となる重
要な事項)4.会計方針に関する事項(5) 重要な収益及び
当監査法人は、ポンプ事業の製品売上高の適切性を検討
するため、主として以下の監査手続を実施した。
(1) 内部統制の評価
費用の計上基準に記載のとおり、これらの製品の販売は、
当該製品の出荷、検収や船積時点等の貿易上の諸条件に基
づき、収益を認識している。また、ポンプ事業の一部の製
品は、顧客から指定される特殊な仕様に基づき生産してい
るため、一定の期間にわたり履行される義務であると判断
し、履行義務の充足に係る進捗度を見積り、当該進捗度に
基づき収益を認識している。
会社グループは、様々な用途・サイズ・型式のポンプを
製造しており、多数の販売取引を適切に処理し、売上高を
計上するため、受注処理、製品の製造、出荷、売上計上、
代金の回収に至る内部統制を整備・運用している。また、
販売取引はITシステムにより処理されており、受注・製
造・出荷処理の結果として生成される売上データに基づい
て売上が計上されることから、内部統制及びITシステムに
よる処理の信頼性が重要である。
売上高は社外に対する連結業績予想の達成のための重要
な構成要素であるうえ、財務諸表利用者が最も重視すると
考えられる項目であり、その大部分が会社グループの主た
る事業であるポンプ事業の製品販売取引によるものである
ことから、ポンプ事業の製品売上高の適切性は監査上の主
要な検討事項に該当すると判断した。
ポンプ事業の製品販売に関する収益認識のプロセスを理
解するとともに、受注処理から販売代金の回収までの一連
の内部統制について、整備・運用状況の有効性を検証し
た。また、以下のIT統制については、IT専門家と連携して
整備・運用状況の有効性を検証した。
・売上データの生成プロセス、会計システムへの連携に関
するIT業務処理統制
・上述のIT業務処理統制の信頼性を担保するIT全般統制
(2)リスク評価手続及び実証手続
・営業に関する概括的理解のため、営業部門の責任者に対
して売上及び受注の状況等に関するヒアリングを実施し
た。
・リスク評価手続として顧客別及び地域別の売上分析、期
末日後の売上訂正額推移分析を実施した。
・統計的手法に基づきサンプル抽出した売上取引につい
て、顧客からの注文書と突合するとともに、国内での販売
は運送会社の送り状等、海外への販売は船荷証券等の売上
の事実を示す証憑との突合を実施した。履行義務の充足に
係る進捗度に基づき、一定の期間にわたり収益を認識する
取引については、実際発生原価及び見積総原価の根拠証憑
との突合を実施した。
・ポンプ事業を行っている重要な連結子会社である
TEIKOKU USA INC.、大連帝国キャンドモータポンプ有限公
司については当該子会社監査人に対して監査の実施を指示
した。子会社監査人に対する指示の内容には、ポンプ事業
の製品販売に関する収益認識の内部統制の評価手続、売上
取引のリスク評価及び実証手続を実施することが含まれ
る。その上で、子会社監査人から監査手続の実施結果につ
いて報告を受け、十分かつ適切な監査証拠が入手されてい
るかどうかについて評価した。当該検討には子会社監査人
との協議や子会社監査人により作成された監査調書の査閲
が含まれる。
111/117
EDINET提出書類
株式会社TEIKOKU(E01761)
有価証券報告書
その他の記載内容
その他の記載内容は、有価証券報告書に含まれる情報のうち、連結財務諸表及び財務諸表並びにこれらの監査報告書以
外の情報である。経営者の責任は、その他の記載内容を作成し開示することにある。また、監査等委員会の責任は、その
他の記載内容の報告プロセスの整備及び運用における取締役の職務の執行を監視することにある。
当監査法人の連結財務諸表に対する監査意見の対象にはその他の記載内容は含まれておらず、当監査法人はその他の記
載内容に対して意見を表明するものではない。
連結財務諸表監査における当監査法人の責任は、その他の記載内容を通読し、通読の過程において、その他の記載内容
と連結財務諸表又は当監査法人が監査の過程で得た知識との間に重要な相違があるかどうか検討すること、また、そのよ
うな重要な相違以外にその他の記載内容に重要な誤りの兆候があるかどうか注意を払うことにある。
当監査法人は、実施した作業に基づき、その他の記載内容に重要な誤りがあると判断した場合には、その事実を報告す
ることが求められている。
その他の記載内容に関して、当監査法人が報告すべき事項はない。
連結財務諸表に対する経営者及び監査等委員会の責任
経営者の責任は、我が国において一般に公正妥当と認められる企業会計の基準に準拠して連結財務諸表を作成し適正に
表示することにある。これには、不正又は誤謬による重要な虚偽表示のない連結財務諸表を作成し適正に表示するために
経営者が必要と判断した内部統制を整備及び運用することが含まれる。
連結財務諸表を作成するに当たり、経営者は、継続企業の前提に基づき連結財務諸表を作成することが適切であるかど
うかを評価し、我が国において一般に公正妥当と認められる企業会計の基準に基づいて継続企業に関する事項を開示する
必要がある場合には当該事項を開示する責任がある。
監査等委員会の責任は、財務報告プロセスの整備及び運用における取締役の職務の執行を監視することにある。
連結財務諸表監査における監査人の責任
監査人の責任は、監査人が実施した監査に基づいて、全体としての連結財務諸表に不正又は誤謬による重要な虚偽表示
がないかどうかについて合理的な保証を得て、監査報告書において独立の立場から連結財務諸表に対する意見を表明する
ことにある。虚偽表示は、不正又は誤謬により発生する可能性があり、個別に又は集計すると、連結財務諸表の利用者の
意思決定に影響を与えると合理的に見込まれる場合に、重要性があると判断される。
監査人は、我が国において一般に公正妥当と認められる監査の基準に従って、監査の過程を通じて、職業的専門家とし
ての判断を行い、職業的懐疑心を保持して以下を実施する。
・不正又は誤謬による重要な虚偽表示リスクを識別し、評価する。また、重要な虚偽表示リスクに対応した監査手続
を立案し、実施する。監査手続の選択及び適用は監査人の判断による。さらに、意見表明の基礎となる十分かつ適切
な監査証拠を入手する。
・連結財務諸表監査の目的は、内部統制の有効性について意見表明するためのものではないが、監査人は、リスク評
価の実施に際して、状況に応じた適切な監査手続を立案するために、監査に関連する内部統制を検討する。
・経営者が採用した会計方針及びその適用方法の適切性、並びに経営者によって行われた会計上の見積りの合理性及
び関連する注記事項の妥当性を評価する。
・経営者が継続企業を前提として連結財務諸表を作成することが適切であるかどうか、また、入手した監査証拠に基
づき、継続企業の前提に重要な疑義を生じさせるような事象又は状況に関して重要な不確実性が認められるかどうか
結論付ける。継続企業の前提に関する重要な不確実性が認められる場合は、監査報告書において連結財務諸表の注記
事項に注意を喚起すること、又は重要な不確実性に関する連結財務諸表の注記事項が適切でない場合は、連結財務諸
表に対して除外事項付意見を表明することが求められている。監査人の結論は、監査報告書日までに入手した監査証
拠に基づいているが、将来の事象や状況により、企業は継続企業として存続できなくなる可能性がある。
・連結財務諸表の表示及び注記事項が、我が国において一般に公正妥当と認められる企業会計の基準に準拠している
かどうかとともに、関連する注記事項を含めた連結財務諸表の表示、構成及び内容、並びに連結財務諸表が基礎とな
る取引や会計事象を適正に表示しているかどうかを評価する。
・連結財務諸表に対する意見表明の基礎となる、会社及び連結子会社の財務情報に関する十分かつ適切な監査証拠を
入手するために、連結財務諸表の監査を計画し実施する。監査人は、連結財務諸表の監査に関する指揮、監督及び査
閲に関して責任がある。監査人は、単独で監査意見に対して責任を負う。
112/117
EDINET提出書類
株式会社TEIKOKU(E01761)
有価証券報告書
監査人は、監査等委員会に対して、計画した監査の範囲とその実施時期、監査の実施過程で識別した内部統制の重要な
不備を含む監査上の重要な発見事項、及び監査の基準で求められているその他の事項について報告を行う。
監査人は、監査等委員会に対して、独立性についての我が国における職業倫理に関する規定を遵守したこと、並びに監
査人の独立性に影響を与えると合理的に考えられる事項、及び阻害要因を除去するための対応策を講じている場合又は阻
害要因を許容可能な水準にまで軽減するためのセーフガードを適用している場合はその内容について報告を行う。
監査人は、監査等委員会と協議した事項のうち、当連結会計年度の連結財務諸表の監査で特に重要であると判断した事
項を監査上の主要な検討事項と決定し、監査報告書において記載する。ただし、法令等により当該事項の公表が禁止され
ている場合や、極めて限定的ではあるが、監査報告書において報告することにより生じる不利益が公共の利益を上回ると
合理的に見込まれるため、監査人が報告すべきでないと判断した場合は、当該事項を記載しない。
<内部統制監査>
監査意見
当監査法人は、金融商品取引法第193条の2第2項の規定に基づく監査証明を行うため、株式会社TEIKOKU(旧社
名株式会社帝国電機製作所)の2026年3月31日現在の内部統制報告書について監査を行った。
当監査法人は、株式会社TEIKOKU(旧社名株式会社帝国電機製作所)が2026年3月31日現在の財務報告に係る内
部統制は有効であると表示した上記の内部統制報告書が、我が国において一般に公正妥当と認められる財務報告に係る内
部統制の評価の基準に準拠して、財務報告に係る内部統制の評価結果について、全ての重要な点において適正に表示して
いるものと認める。
監査意見の根拠
当監査法人は、我が国において一般に公正妥当と認められる財務報告に係る内部統制の監査の基準に準拠して内部統制
監査を行った。財務報告に係る内部統制の監査の基準における当監査法人の責任は、「内部統制監査における監査人の責
任」に記載されている。当監査法人は、我が国における職業倫理に関する規定(社会的影響度の高い事業体の財務諸表監
査に適用される規定を含む。)に従って、会社及び連結子会社から独立しており、また、監査人としてのその他の倫理上
の責任を果たしている。当監査法人は、意見表明の基礎となる十分かつ適切な監査証拠を入手したと判断している。
内部統制報告書に対する経営者及び監査等委員会の責任
経営者の責任は、財務報告に係る内部統制を整備及び運用し、我が国において一般に公正妥当と認められる財務報告に
係る内部統制の評価の基準に準拠して内部統制報告書を作成し適正に表示することにある。
監査等委員会の責任は、財務報告に係る内部統制の整備及び運用状況を監視、検証することにある。
なお、財務報告に係る内部統制により財務報告の虚偽の記載を完全には防止又は発見することができない可能性があ
る。
113/117
EDINET提出書類
株式会社TEIKOKU(E01761)
有価証券報告書
内部統制監査における監査人の責任
監査人の責任は、監査人が実施した内部統制監査に基づいて、内部統制報告書に重要な虚偽表示がないかどうかについ
て合理的な保証を得て、内部統制監査報告書において独立の立場から内部統制報告書に対する意見を表明することにあ
る。
監査人は、我が国において一般に公正妥当と認められる財務報告に係る内部統制の監査の基準に従って、監査の過程を
通じて、職業的専門家としての判断を行い、職業的懐疑心を保持して以下を実施する。
・内部統制報告書における財務報告に係る内部統制の評価結果について監査証拠を入手するための監査手続を実施す
る。内部統制監査の監査手続は、監査人の判断により、財務報告の信頼性に及ぼす影響の重要性に基づいて選択及び
適用される。
・財務報告に係る内部統制の評価範囲、評価手続及び評価結果について経営者が行った記載を含め、全体としての内
部統制報告書の表示を検討する。
・内部統制報告書における財務報告に係る内部統制の評価結果に関する十分かつ適切な監査証拠を入手するために、
内部統制の監査を計画し実施する。監査人は、内部統制報告書の監査に関する指揮、監督及び査閲に関して責任があ
る。監査人は、単独で監査意見に対して責任を負う。
監査人は、監査等委員会に対して、計画した内部統制監査の範囲とその実施時期、内部統制監査の実施結果、識別した
内部統制の開示すべき重要な不備、その是正結果、及び内部統制の監査の基準で求められているその他の事項について報
告を行う。
監査人は、監査等委員会に対して、独立性についての我が国における職業倫理に関する規定を遵守したこと、並びに監
査人の独立性に影響を与えると合理的に考えられる事項、及び阻害要因を除去するための対応策を講じている場合又は阻
害要因を許容可能な水準にまで軽減するためのセーフガードを適用している場合はその内容について報告を行う。
<報酬関連情報>
当監査法人及び当監査法人と同一のネットワークに属する者に対する、会社及び子会社の監査証明業務に基づく報酬及
び非監査業務に基づく報酬の額は、「提出会社の状況」に含まれるコーポレート・ガバナンスの状況等(3)【監査の状
況】に記載されている。
利害関係
会社及び連結子会社と当監査法人又は業務執行社員との間には、公認会計士法の規定により記載すべき利害関係はな
い。