|
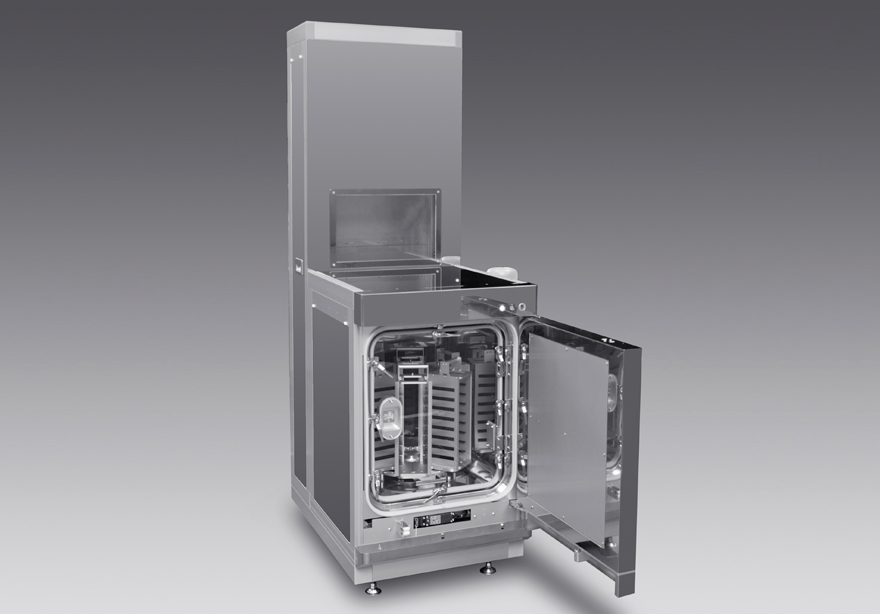
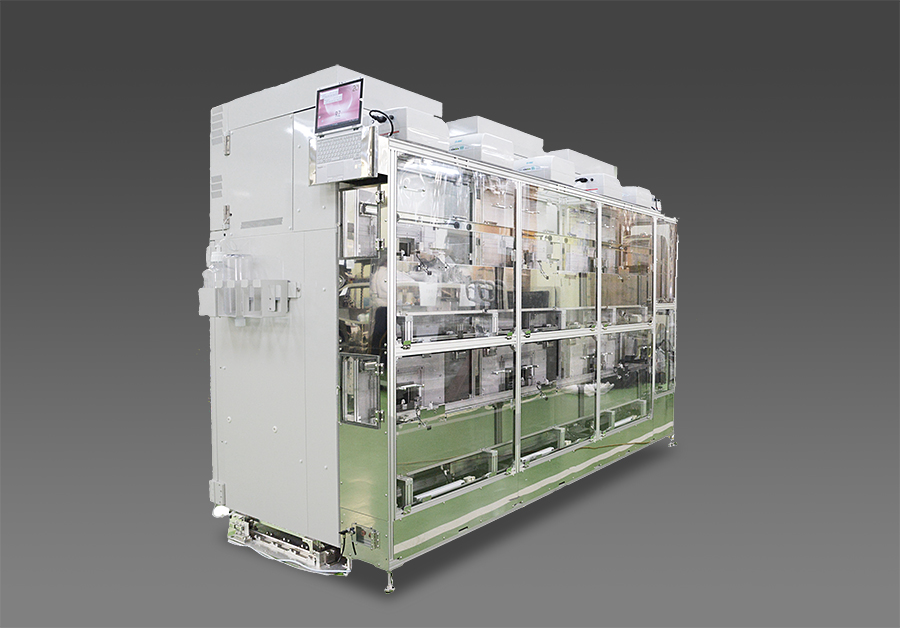
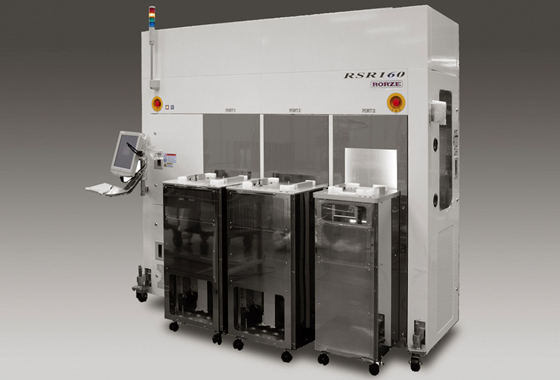
Rorze Corporation is a manufacturer of cleanroom handling equipment for the semiconductor and flat panel display (FPD) industries, as well as life science devices. The company operates through two main segments: the Semiconductor & FPD-related Equipment business and the Life Science business. In the semiconductor sector, it develops and sells atmospheric and vacuum wafer handling systems, including Equipment Front End Modules (EFEM), wafer sorters, and nitrogen purge wafer stockers. It also provides wafer handling units such as robots, aligners, and load ports, as well as automated gas phase decomposition (VPD) analysis devices for metal contamination control. For the FPD industry, the company manufactures large glass substrate handling systems and glass cutting machines. In the life science segment, it produces incubators for automated cell culture and associated software packages. Key subsidiaries include Rorze Ias, Rorze Life Science, Rorze Technology, Rorze Systems, Rorze Automation, and Rorze Robotech. Summarised from the annual report, fiscal year ended Feb 2026 |
Industry Specialty Industrial Machinery | Homepage rorze.com |
| Sector Industrials | IR page rorze.com | |
|
Tags
wafer handling, cleanroom robotics, semiconductor equipment, flat panel display, glass substrate handling, cell culture automation, load ports, wafer sorters, efem, vacuum handling, Wafer Sorter, N2 Purge Wafer Stocker, Wafer Handling Unit, Load Port, Aligner, VPD Device, Glass Cutting Machine, Incubator, Rorze Ias, Rorze Life Science, Rorze Technology, Rorze Systems, Rorze Automation, Rorze Robotech
|
Press page rorze.com/news |
Metrics
| Valuation | |
|---|---|
| Market cap | ¥ 684.432B |
| Market cap (USD) | $ 4.278B |
| P/E | 28.01 |
| PEG | — |
| P/BV | 4.39 |
| P/S | 4.79 |
| P/OCF | 25.30 |
| P/FCF | 31.80 |
| Dividend yield | 0.44% |
| Turnover / mcap | — |
| Returns | |
|---|---|
| ROE | 14.2% |
| ROI | 11.6% |
| ROIC | 13.3% |
| Profit margin | 14.8% |
| Growth | |
|---|---|
| Revenue growing | Yes |
| Profits growing | No |
| Revenue up 3y | No |
| Revenue up 5y | No |
| Earnings growth 3y (net profit CAGR) | -3.8% |
| Quality | |
|---|---|
| Profitable | Yes |
| Margin expanding | No |
| Buying back stock | No |
| Diluting (TTM) | No |
| Debt/Equity | — |
| Podcast bulls (TTM) | Sign up |
| Podcast bears (TTM) | Sign up |
| Podcast sentiment (TTM) | Sign up |
| Podcast sentiment % (TTM) | Sign up |
| News sentiment (TTM) | 0 |
| Quality score | -11.1% |
| Insiders | |
|---|---|
| Buys, 1w | Sign up |
| Buys, 1m | Sign up |
| Buys, 1y | Sign up |
| Sells, 1w | Sign up |
| Sells, 1m | Sign up |
| Sells, 1y | Sign up |
Sign up to see this company's insider trades
| Figure | FY 2026 | FY 2025 | FY 2024 | FY 2023 | FY 2022 | FY 2021 | FY 2020 | FY 2019 | FY 2018 | FY 2017 | FY 2016 | FY 2015 | FY 2014 | FY 2013 |
|---|---|---|---|---|---|---|---|---|---|---|---|---|---|---|
| Revenue | 128.794B | 124.406B | 93.247B | 94.518B | 67.004B | 50.803B | 37.103B | 31.368B | 52.249B | 24.739B | 19.943B | 12.751B | 14.167B | 9.359B |
| Net profit | 19.048B | 23.634B | 19.576B | 21.384B | 12.824B | 6.47B | 5.471B | 4.398B | 2.743B | 3.055B | 2.162B | 865.929M | 403.651M | -141.563M |
| Free cash flow | 26.722B | 34.593B | 14.326B | -6.492B | 899.163M | 5.711B | 576.593M | -6.007B | -1.93B | 2.567B | — | — | — | — |
| Figure | FY 2026 | FY 2025 | FY 2024 | FY 2023 | FY 2022 | FY 2021 | FY 2020 | FY 2019 | FY 2018 | FY 2017 | FY 2016 | FY 2015 | FY 2014 | FY 2013 |
|---|---|---|---|---|---|---|---|---|---|---|---|---|---|---|
| Share price | 3.326K | 1.632K | 21.006K | 10.618K | 10.706K | 7.348K | 3.323K | 1.623K | 2.476K | 2.565K | 601.03 | 416.53 | 428.27 | — |
| Price performance 12m | 1.04 | -0.22 | 0.98 | -0.01 | 0.46 | 1.21 | 1.05 | -0.34 | -0.03 | 3.27 | 0.44 | -0.03 | — | — |
Filed figures
Lines the statements and their notes report beside the headline figures, read from the filings' XBRL as filed (no restatement applied), with figures computed from one filing's own lines. Cash-flow lines carry their cash direction: an outflow is negative. Each period links to its filing; a figure's period, report date and tag are in its tooltip.
| Figure | Feb 2019 | Mar 2019 | Feb 2020 | Feb 2021 | Feb 2022 | Feb 2023 | Mar 2023 | Feb 2024 | Feb 2025 | Feb 2026 |
|---|---|---|---|---|---|---|---|---|---|---|
| Balance sheet detail | ||||||||||
| Trade receivables (JPY) | 7.83B | 7.83B | 11.4B | 11.3B | 18.9B | 26.7B | 26.7B | 26.5B | 30.7B | 32.4B |
| ↳ YoY growth | +1.2% | +1.2% | +45.7% | -0.6% | +66.8% | +41.3% | +41.3% | -1.0% | +16.0% | +5.6% |
| ↳ 5y CAGR | +14.0% | +20.9% | +28.1% | +28.1% | +27.6% | +21.9% | +23.4% | |||
| Borrowings, current (JPY) | 8.9B | 8.9B | 9.88B | 11.5B | 11.9B | 14.9B | 14.9B | 16.3B | 14.9B | 15.6B |
| Borrowings, non-current (JPY) | 7.94B | 7.94B | 7.81B | 5.3B | 8.96B | 17.9B | 17.9B | 18.2B | 16.6B | 8.21B |
| Lease liabilities (JPY) | 8.02M | 8.02M | 5.81M | 3.46M | 1.1M | — | — | 10M | 19M | 13M |
| Cash and deposits (JPY) | 11.5B | 11.5B | 12.8B | 16.8B | 23.6B | 28.3B | 28.3B | 38B | 63B | 74.3B |
| Intangible assets (JPY) | 241M | 241M | 570M | 544M | 615M | 643M | 643M | 5.22B | 12.6B | 9.22B |
| Net debt (borrowings + leases - cash) (JPY) | 5.31B | 5.31B | 4.85B | -55.9M | -2.75B | 4.53B | 4.53B | -3.44B | -31.4B | -50.5B |
| Cash flow detail | ||||||||||
| Operating cash flow (JPY) | -1.49B | -1.49B | 6.66B | 8.16B | 3.02B | -1.92B | -1.92B | 15.5B | 36.8B | 31.2B |
| Purchases of property, plant and equipment (JPY) | -4.46B | -4.46B | -5.71B | -2.32B | -2.04B | -4.51B | -4.51B | -1.22B | -1.95B | -4.09B |
| Purchases of intangible assets (JPY) | -48.3M | -48.3M | -373M | -126M | -76.8M | -62M | -62M | -84M | -252M | -380M |
| Change in receivables (cash effect) (JPY) | -381M | -381M | -3.62B | 111M | -7.11B | -8.6B | -8.6B | 1.23B | -3.64B | -1.12B |
| Change in inventories (cash effect) (JPY) | -6.97B | -6.97B | 2.08B | -4.36M | -10.5B | -16.8B | -16.8B | -6.1B | 9.33B | 4.12B |
| Change in payables (cash effect) (JPY) | -79.5M | -79.5M | 513M | -402M | 4.04B | -186M | -186M | -1.6B | 567M | -556M |
| Dividends paid (cash effect) (JPY) | -346M | -346M | -432M | -518M | -518M | -1.12B | -1.12B | -2.33B | -2.38B | -3B |
| Share buybacks (cash effect) (JPY) | -281,000 | -281,000 | -116,000 | -298,000 | -825,000 | 0.00 | 0.00 | 0.00 | -441M | -5B |
| Interest paid (cash effect) (JPY) | -26.7M | -26.7M | -31.8M | -45.1M | -40.3M | -50M | -50M | -70M | -79M | -136M |
| Income taxes paid (cash effect) (JPY) | -1.13B | -1.13B | -2.21B | -2.04B | -2.37B | -6.99B | -6.99B | -7.92B | -8.21B | -10.3B |
| Operating cash flow before change in receivables (JPY) | -1.11B | -1.11B | 10.3B | 8.05B | 10.1B | 6.68B | 6.68B | 14.3B | 40.4B | 32.3B |
| Free cash flow (OCF - PPE - intangibles) (JPY) | -6.01B | -6.01B | 577M | 5.71B | 899M | -6.49B | -6.49B | 14.2B | 34.6B | 26.7B |
| Income detail | ||||||||||
| Research and development expense (JPY) | 339M | 339M | 437M | 418M | 871M | 911M | 911M | 1.02B | 1.24B | 1.93B |
| ↳ 5y CAGR | +3.7% | +18.0% | +15.6% | +15.6% | +24.6% | +23.2% | +35.8% | |||
| Total comprehensive income (JPY) | 3.67B | 3.67B | 5.05B | 6.54B | 16.1B | 26.3B | 26.3B | 23.3B | 27.6B | 19B |
| Comprehensive income to owners (JPY) | 3.96B | 3.96B | 5.16B | 6.07B | 15B | 24.5B | 24.5B | 22.5B | 28.4B | 20.4B |
| Provision for credit losses (JPY) | 18.8M | 18.8M | 87.2M | -61.5M | -4.09M | -42M | -42M | -1M | 122M | 36M |
| Credit cost ratio (credit losses / average receivables) (%) | 0.2% | 0.2% | 0.9% | 0.5% | 0.0% | 0.2% | 0.2% | 0.0% | 0.4% | 0.1% |
| Segments | ||||||||||
| Life Science · Segment revenue (JPY) | — | — | — | — | — | — | — | 1.22B | 1.07B | 1.2B |
| ↳ YoY growth | -12.0% | +11.8% | ||||||||
| Life Science · Segment operating income (JPY) | — | — | — | — | — | — | — | 126M | 122M | 13M |
| Semiconductor And Flat Panel Display · Segment revenue (JPY) | — | — | — | — | — | — | — | 92B | 123B | 128B |
| ↳ YoY growth | +34.1% | +3.4% | ||||||||
| Semiconductor And Flat Panel Display · Segment operating income (JPY) | — | — | — | — | — | — | — | 24.6B | 33B | 32B |
| Reported | May 31, 2019 | May 29, 2020 | May 31, 2021 | May 31, 2021 | May 31, 2022 | May 31, 2023 | May 31, 2024 | May 30, 2025 | May 30, 2025 | May 22, 2026 |
Sign up to see institutional holdings
Sign UpPodcast Mentions
Sign up to see podcast mentions and sentiment
Sign UpFilings with EDINET (periodic reports, extraordinary reports, offerings, holding and buy-back reports), newest first, titles as filed in Japanese. The link opens the filing on EDINET. Press releases from the company's own website, newest first.
RORZE CORPORATION (the “Company”) hereby announces that it has revised the financial forecast and dividend per share forecast announced on April 9, 2026, as described below.
- Revision to Full-Year Consolidated Financial Forecast Revision to the full-year consolidated financial forecast for the fiscal year ending February 28, 2027 (March 1, 2026 to February 28, 2027) (Millions of yen, except per-share amounts) Basic Profit attributable to owners Net sales
Operating profit
Ordinary profit
earnings per of parent share
Previous forecast (A)
159,021
38,112
38,241
27,809
¥159.62
Revised forecast (B)
180,007
53,078
54,889
37,779
¥217.84
Change (B - A)
20,985
14,965
16,647
9,970
13.2
39.3
43.5
35.9
128,794
31,154
32,621
19,048
¥109.33
Percentage change (%) (Reference) Results for the previous fiscal year (Fiscal year ended February 28, 2026)
Reason for the revision Consolidated net sales are expected to exceed the previous forecast, reflecting strong semiconductor demand. In addition, due to the increase in profit accompanying higher sales, operating profit, ordinary profit, and profit attributable to owners of parent are all expected to exceed the previous forecasts. Note: The above forecasts have been prepared based on information available as of the date of this announcement. Actual results may differ from the forecast figures due to various factors that may arise in the future.
- Revision to Dividend Forecast Revision to the dividend forecast for the fiscal year ending February 28, 2027 Annual dividends per share End of second quarter Previous forecast (announced April 9, 2026)
Revised forecast
Year-end
Total
¥0.00
¥20.00
¥20.00
¥0.00
¥28.00
¥28.00
¥0.00
¥17.00
¥17.00
Actual dividends for the current fiscal year
Actual dividends for the previous fiscal year(fiscal year ended February 28, 2026)
Reason for the revision The Company had planned a year-end dividend of ¥20 per share for the fiscal year ending February 28, 2027, as announced on April 9, 2026. However, as the Company now expects its financial results to exceed the previous forecast as described in “1. Revision to Full-Year Consolidated Financial Forecast” above, the Company has decided to increase the dividend by ¥8 and revise the year-end dividend to ¥28 per share. The matter is scheduled to be submitted for approval at the 42nd Ordinary General Meeting of Shareholders to be held in May 2027. End
Notice of Revisions to Full-Year Consolidated Financial Forecast and Dividend Forecast
Notice of Revisions to Full-Year Consolidated Financial Forecast and Dividend Forecast

© RORZE CORPORATION All rights reserved.
Consolidated Financial Results for the Six Months Ended August 31, 2026(PDF)
© RORZE CORPORATION All rights reserved.












Prompts
Click prompts to add them under the company line, click again to take one out, then copy the result into your AI chat. Shared by Asian Century Stocks and Uncovered Thai Stocks. Thank you.
ETFs Holding Rorze Corporation
Exchange-traded funds whose newest published daily portfolio holds one of the company's listings, largest weight first.
| ETF | Weight in ETF | Shares | Market value | As of |
|---|---|---|---|---|
| JAPN | 1.29% | 10,000 | $ 297.8K | Jun 30, 2026 |
| GGTL | 0.67% | 3,000 | $ 89.302K | Jun 30, 2026 |
| AVDS | 0.07% | 14,100 | $ 268.715K | Nov 16, 2026 |
| DFIS | 0.05% | 153,100 | $ 3.137M | Nov 12, 2026 |
| DIHP | 0.03% | 103,000 | $ 2.11M | Nov 12, 2026 |
| DFIC | 0.03% | 218,200 | $ 4.47M | Nov 12, 2026 |
| DFAX | 0.02% | 95,000 | $ 1.946M | Nov 12, 2026 |
| DFSI | 0.01% | 6,500 | $ 133.171K | Nov 12, 2026 |
| AVDE | 0.01% | 109,100 | $ 2.079M | Nov 16, 2026 |
| DFAI | 0.01% | 80,897 | $ 1.657M | Nov 12, 2026 |
| DXIV | 0.01% | 800 | $ 16.39K | Nov 12, 2026 |