自己株券買付状況報告書(法24条の6第1項に基づくもの)
Bull 0
Bear 0
Routine
Fiscal year ends March
Quarters are offset from the calendar — Q1 is Apr–Jun
|
Hitachi Construction Machinery Co., Ltd. is a manufacturer of construction machinery and mining equipment. The company operates through two main business segments: the Construction Machinery Business, which develops, manufactures, and sells hydraulic excavators, ultra-large hydraulic excavators, wheel loaders, and related parts services; and the Specialized Parts Service Business, which provides after-sales parts development, manufacturing, sales, and service solutions for mining equipment and machinery. The company serves global markets through a network of offices, dealers, and partners, with specific regional presence in Europe, Russia, the CIS, the Middle East, and Japan. Notable subsidiaries include Hitachi Construction Machinery Tierra Co., Ltd., Hitachi Construction Machinery Camino Co., Ltd., Tadakiko Co., Ltd., and SHINTOHOKU METAL CO., LTD. The company traces its roots to 1949 with the completion of the U05 cable-operated shovel and is scheduled to change its corporate name to LANDCROS in April 2027. Summarised from the annual report, fiscal year ended Mar 2026 |
Industry Farm & Heavy Construction Machinery | Homepage hitachicm.com |
| Sector Industrials | IR page hitachicm.com/global/en/ir | |
|
Tags
hydraulic excavators, mining equipment, wheel loaders, crawler cranes, after-sales service, parts manufacturing, construction machinery, heavy machinery, Hitachi Construction Machinery Tierra Co. Ltd., Hitachi Construction Machinery Camino Co. Ltd., Tadakiko Co. Ltd., SHINTOHOKU METAL CO. LTD., Hitachi Construction Machinery Japan Co. Ltd., Hitachi Construction Machinery (Europe) N.V., Hitachi Construction Machinery Canada Ltd., Hitachi Construction Machinery Asia and Pacific Pte.Ltd., Hitachi Construction Machinery (America) Corp., Hitachi Construction Machinery (Malaysia) Sdn.Bhd., Hitachi Construction Machinery Trading Co. Ltd., Deere-Hitachi Construction Machinery, LANDCROS
|
Press page hitachicm.com/global/ja/news/topics |
Metrics
| Valuation | |
|---|---|
| Market cap | ¥ 1.191T |
| Market cap (USD) | $ 7.443B |
| P/E | 13.78 |
| PEG | 9.75 |
| P/BV | 1.25 |
| P/S | 0.82 |
| P/OCF | 7.94 |
| P/FCF | 12.06 |
| Dividend yield | 3.2% |
| Turnover / mcap | — |
| Returns | |
|---|---|
| ROE | 8.1% |
| ROI | 5.0% |
| ROIC | 6.0% |
| Profit margin | 5.2% |
| Growth | |
|---|---|
| Revenue growing | No |
| Profits growing | No |
| Revenue up 3y | No |
| Revenue up 5y | No |
| Earnings growth 3y (net profit CAGR) | 1.4% |
| Quality | |
|---|---|
| Profitable | Yes |
| Margin expanding | No |
| Buying back stock | No |
| Diluting (TTM) | No |
| Debt/Equity | — |
| Podcast bulls (TTM) | Sign up |
| Podcast bears (TTM) | Sign up |
| Podcast sentiment (TTM) | Sign up |
| Podcast sentiment % (TTM) | Sign up |
| News sentiment (TTM) | 0 |
| Quality score | -22.2% |
| Insiders | |
|---|---|
| Buys, 1w | Sign up |
| Buys, 1m | Sign up |
| Buys, 1y | Sign up |
| Sells, 1w | Sign up |
| Sells, 1m | Sign up |
| Sells, 1y | Sign up |
Sign up to see this company's insider trades
| Figure | FY 2026 | FY 2025 | FY 2024 | FY 2023 | FY 2022 | FY 2021 | FY 2020 | FY 2019 | FY 2018 | FY 2017 | FY 2016 | FY 2015 | FY 2014 | FY 2013 |
|---|---|---|---|---|---|---|---|---|---|---|---|---|---|---|
| Revenue | 1.405T | 1.371T | 1.406T | 1.279T | 1.025T | 813.331B | 931.347B | 1.034T | 959.153B | 753.947B | 758.331B | 815.792B | 802.988B | 772.355B |
| Net profit | 73.193B | 81.428B | 93.294B | 70.175B | 75.826B | 10.34B | 41.171B | 68.542B | 60.004B | 8.022B | 8.804B | 22.945B | 28.939B | 23.464B |
| Free cash flow | 115.19B | 111.584B | 17.432B | -85.275B | 11.393B | 58.135B | -16.673B | -51.924B | — | — | — | — | — | — |
| Figure | FY 2026 | FY 2025 | FY 2024 | FY 2023 | FY 2022 | FY 2021 | FY 2020 | FY 2019 | FY 2018 | FY 2017 | FY 2016 | FY 2015 | FY 2014 | FY 2013 |
|---|---|---|---|---|---|---|---|---|---|---|---|---|---|---|
| Share price | 5.271K | 3.946K | 4.519K | 3.075K | 3.195K | 3.545K | 2.189K | 2.937K | 4.105K | 2.775K | 1.788K | 2.102K | 1.988K | 2.028K |
| Price performance 12m | 0.34 | -0.13 | 0.47 | -0.04 | -0.1 | 0.62 | -0.25 | -0.28 | 0.48 | 0.55 | -0.15 | 0.06 | -0.02 | — |
Filed figures
Lines the statements and their notes report beside the headline figures, read from the filings' XBRL as filed (no restatement applied), with figures computed from one filing's own lines. Cash-flow lines carry their cash direction: an outflow is negative. Each period links to its filing; a figure's period, report date and tag are in its tooltip.
| Figure | Mar 2017 | Mar 2018 | Mar 2019 | Mar 2020 | Mar 2021 | Mar 2022 | Mar 2023 | Mar 2024 | Mar 2025 | Mar 2026 |
|---|---|---|---|---|---|---|---|---|---|---|
| Balance sheet detail | ||||||||||
| Trade receivables (JPY) | — | 220B | 236B | 208B | 206B | 261B | 301B | 305B | 270B | 296B |
| ↳ YoY growth | +7.5% | -12.0% | -0.7% | +26.7% | +15.2% | +1.4% | -11.4% | +9.7% | ||
| ↳ 5y CAGR | +6.5% | +5.3% | +5.4% | +7.5% | ||||||
| Borrowings, current (JPY) | — | 69.9B | 186B | 160B | 150B | 174B | 311B | 396B | 327B | 316B |
| Borrowings, non-current (JPY) | — | 161B | 119B | 178B | 179B | 179B | 197B | 179B | 211B | 181B |
| Lease liabilities (JPY) | — | — | — | 60.8B | 59.4B | 61.4B | 71.8B | 74.2B | 72.6B | 71B |
| Cash and deposits (JPY) | 65.5B | 81.9B | 67.3B | 62.2B | 80.3B | 94.3B | 112B | 144B | 147B | 141B |
| Intangible assets (JPY) | — | 37.7B | 42.1B | 37.9B | 41.6B | 42B | 39.7B | 43.6B | 46.7B | 49.1B |
| Right-of-use assets (JPY) | — | — | — | 57.9B | 59.4B | 58.7B | 65.3B | 67B | 67.3B | 67.2B |
| Net debt (borrowings + leases - cash) (JPY) | — | 149B | 237B | 338B | 309B | 320B | 467B | 506B | 463B | 427B |
| Cash flow detail | ||||||||||
| Operating cash flow (JPY) | 88B | 84.5B | -25.7B | 22.7B | 91.3B | 39.3B | -26.1B | 73B | 144B | 164B |
| Purchases of property, plant and equipment (JPY) | — | -16.9B | -26.2B | -32B | -28.3B | -27.9B | -52.8B | -45.7B | -32.3B | -41B |
| Purchases of intangible assets (JPY) | — | -4.46B | -8.54B | -7.31B | -4.89B | -6.62B | -6.3B | -9.88B | -12.7B | -8.07B |
| Change in inventories (cash effect) (JPY) | — | -24.7B | -76.5B | 107M | 25.5B | -48.2B | -75.4B | -63.7B | 29.4B | 51.8B |
| Dividends paid (cash effect) (JPY) | — | -9.36B | -19.6B | -19.8B | -7.27B | -11.7B | -24.5B | -30.8B | -27.6B | -39.3B |
| Interest paid (cash effect) (JPY) | — | -5.09B | -5.36B | -6.92B | -5.29B | -4.73B | -8.86B | -15B | -18.3B | -16B |
| Free cash flow (OCF - PPE - intangibles) (JPY) | — | 63.2B | -60.5B | -16.7B | 58.1B | 4.78B | -85.3B | 17.4B | 98.9B | 115B |
| Income detail | ||||||||||
| Research and development expense (JPY) | — | — | 24.8B | 23.7B | 24.8B | 25.5B | 24.4B | — | — | — |
| Total comprehensive income (JPY) | — | 67.7B | 61.9B | 9.09B | 57.5B | 122B | 82B | 150B | 82.8B | 144B |
| Comprehensive income to owners (JPY) | 7.88B | 58.4B | 57.4B | 9.87B | 47.8B | 112B | 75.5B | 134B | 73.8B | 130B |
| Segments | ||||||||||
| Construction Machinery Business · Segment revenue (JPY) | — | 867B | 938B | 841B | 734B | 934B | 1.15T | 1.28T | 1.24T | 1.27T |
| ↳ YoY growth | +8.2% | -10.3% | -12.7% | +27.2% | +23.6% | +11.1% | -3.0% | +2.0% | ||
| Construction Machinery Business · Segment operating income (JPY) | — | 93.5B | 102B | 72.1B | 23.6B | 98.7B | 123B | 148B | 141B | 119B |
| Solution Business · Segment revenue (JPY) | — | 92.6B | 96.8B | 92B | 82.4B | 94.8B | 131B | — | — | — |
| ↳ YoY growth | +4.5% | -5.0% | -10.4% | +15.0% | +38.3% | |||||
| Solution Business · Segment operating income (JPY) | — | 2.23B | 594M | 717M | 4.6B | 7.93B | 10.4B | — | — | — |
| Specialized Parts And Service Business · Segment revenue (JPY) | — | — | — | — | — | — | 117B | 130B | 136B | 145B |
| ↳ YoY growth | +11.4% | +4.4% | +7.1% | |||||||
| Specialized Parts And Service Business · Segment operating income (JPY) | — | — | — | — | — | — | 12.7B | 14.3B | 14.1B | 10.9B |
| Reported | Jun 27, 2017 | Jun 25, 2019 | Jun 25, 2019 | Jul 21, 2020 | Jun 29, 2021 | Jun 28, 2022 | Jun 25, 2024 | Jun 25, 2024 | Jun 24, 2025 | Jun 23, 2026 |
Sign up to see institutional holdings
Sign UpPodcast Mentions
Sign up to see podcast mentions and sentiment
Sign UpTimely disclosures published on TDnet, newest first, titles as filed in Japanese. The link opens the disclosure on TDnet. Filings with EDINET (periodic reports, extraordinary reports, offerings, holding and buy-back reports), newest first, titles as filed in Japanese. The link opens the filing on EDINET. Press releases from the company's own website, newest first.
2027年4月の「ランドクロス(LANDCROS)」への社名・ブランド変更に向け、新グローバルブランドキャンペーンを開始
Bull 0
Bear 0
Not a release
75年以上の信頼を礎に、「Solutions Beyond Machinery」を全世界へ発信
2026年10月30日
企業情報
製品
ソリューション
イノベーション
投資家情報
サステナビリティ
採用
グローバルネットワーク
電子公告
サイトの利用条件
Cookieに関する通知
サイトマップ
お問い合わせ


© 2026 Hitachi Construction Machinery Co., Ltd. All rights reserved.

Privacy Preference Center
When you visit any website, it may store or retrieve information on your browser, mostly in the form of cookies. This information might be about you, your preferences or your device and is mostly used to make the site work as you expect it to. The information does not usually directly identify you, but it can give you a more personalized web experience. Because we respect your right to privacy, you can choose not to allow some types of cookies. Click on the different category headings to find out more and change our default settings. However, blocking some types of cookies may impact your experience of the site and the services we are able to offer. Privacy Policy Cookie Notice
Allow All
Manage Consent Preferences
Strictly Necessary Cookies
Always Active
These cookies are necessary for the website to function and cannot be switched off in our systems. They are usually only set in response to actions made by you which amount to a request for services, such as setting your privacy preferences, logging in or filling in forms. You can set your browser to block or alert you about these cookies, but some parts of the site will not then work. These cookies do not store any personally identifiable information. Such cookies can be active for a maximum of 2 years.
Cookies Details
Functional Cookies
Functional Cookies
These cookies enable the website to provide enhanced functionality and personalisation. They may be set by us or by third party providers whose services we have added to our pages. If you do not allow these cookies then some or all of these services may not function properly. Such cookies can be active for a maximum of 2 years.
Cookies Details
Performance Cookies
Performance Cookies
These cookies allow us to count visits and traffic sources so we can measure and improve the performance of our site. They help us to know which pages are the most and least popular and see how visitors move around the site. All information these cookies collect is aggregated and therefore anonymous. If you do not allow these cookies we will not know when you have visited our site, and will not be able to monitor its performance. Such cookies can be active for a maximum of 2 years.
Cookies Details
Targeting Cookies
Targeting Cookies
These cookies may be set through our site by our advertising partners. They may be used by those companies to build a profile of your interests and show you relevant adverts on other sites. They do not store directly personal information, but are based on uniquely identifying your browser and internet device. If you do not allow these cookies, you will experience less targeted advertising. Such cookies can be active for a maximum of 2 years.
Cookies Details
Cookie List
Clear
- checkbox label label
Apply Cancel
Leg.Interest
checkbox label label
checkbox label label
checkbox label label


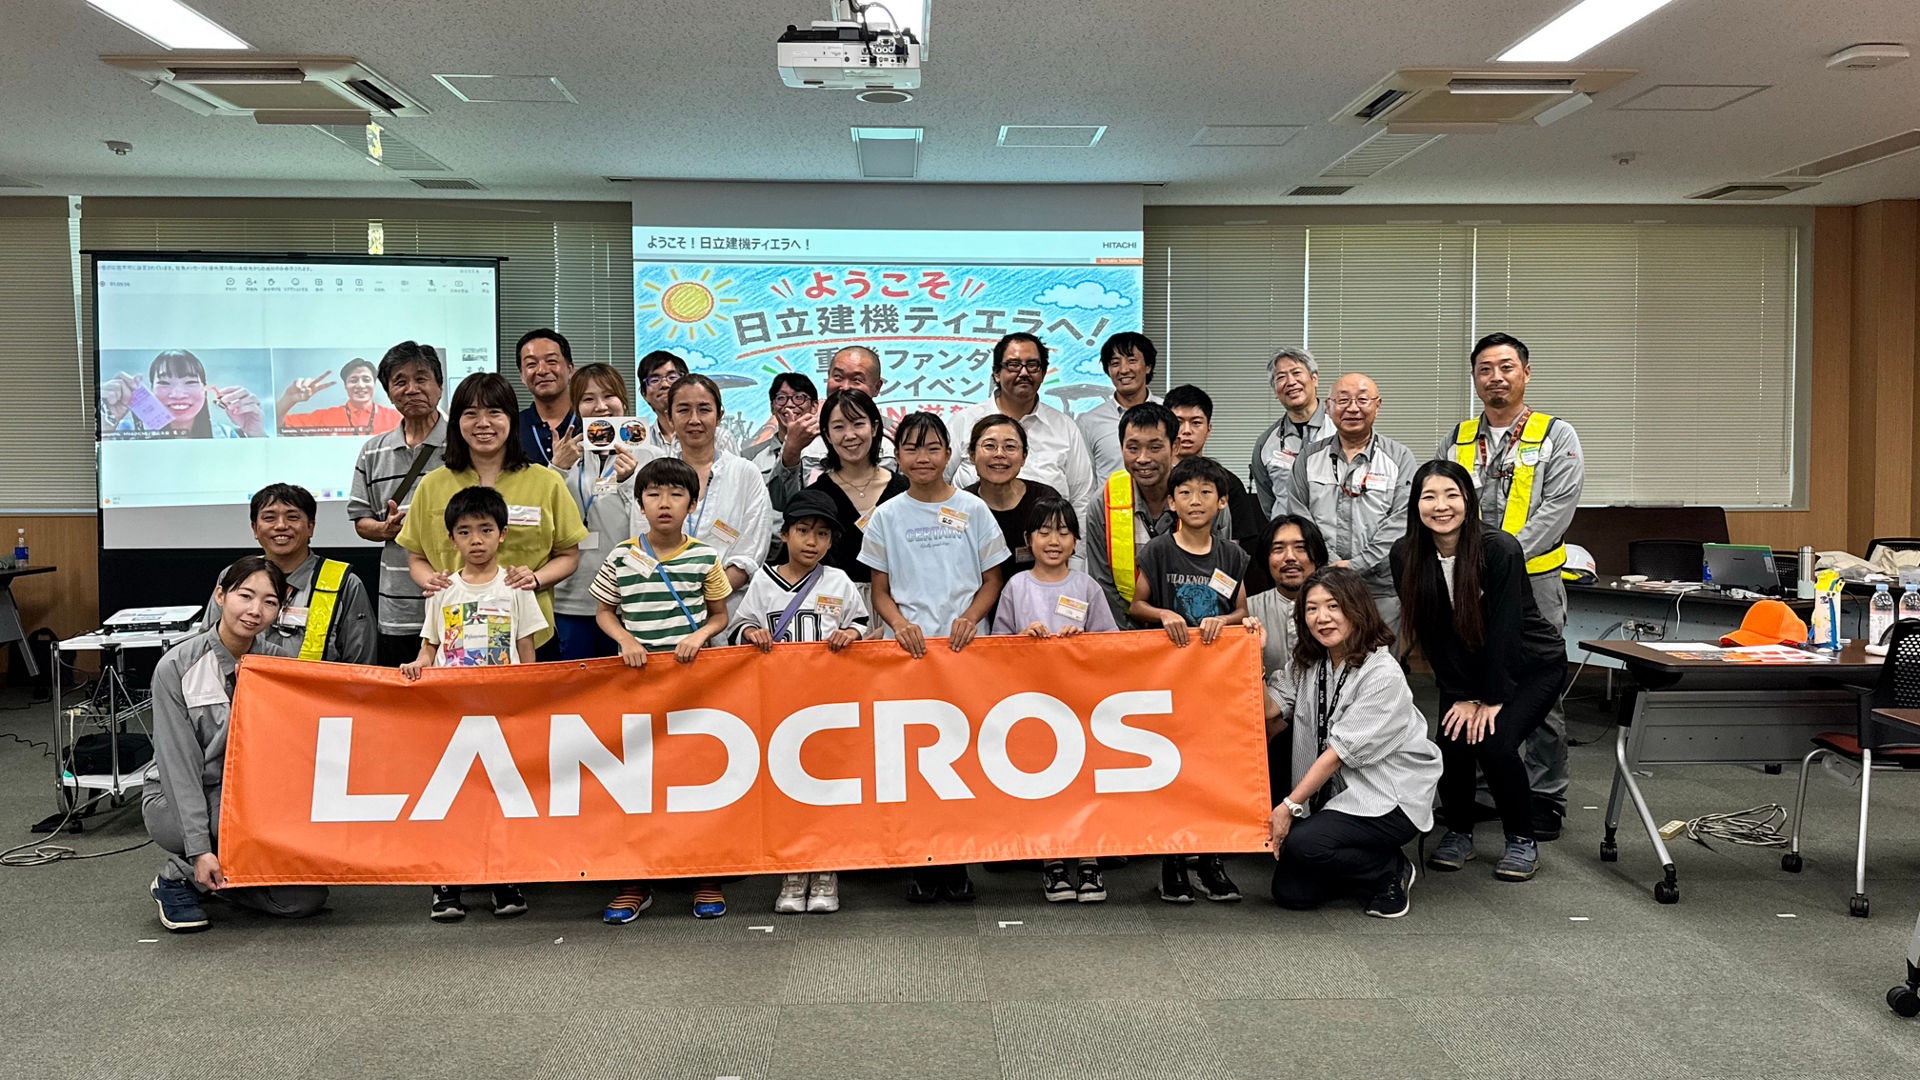
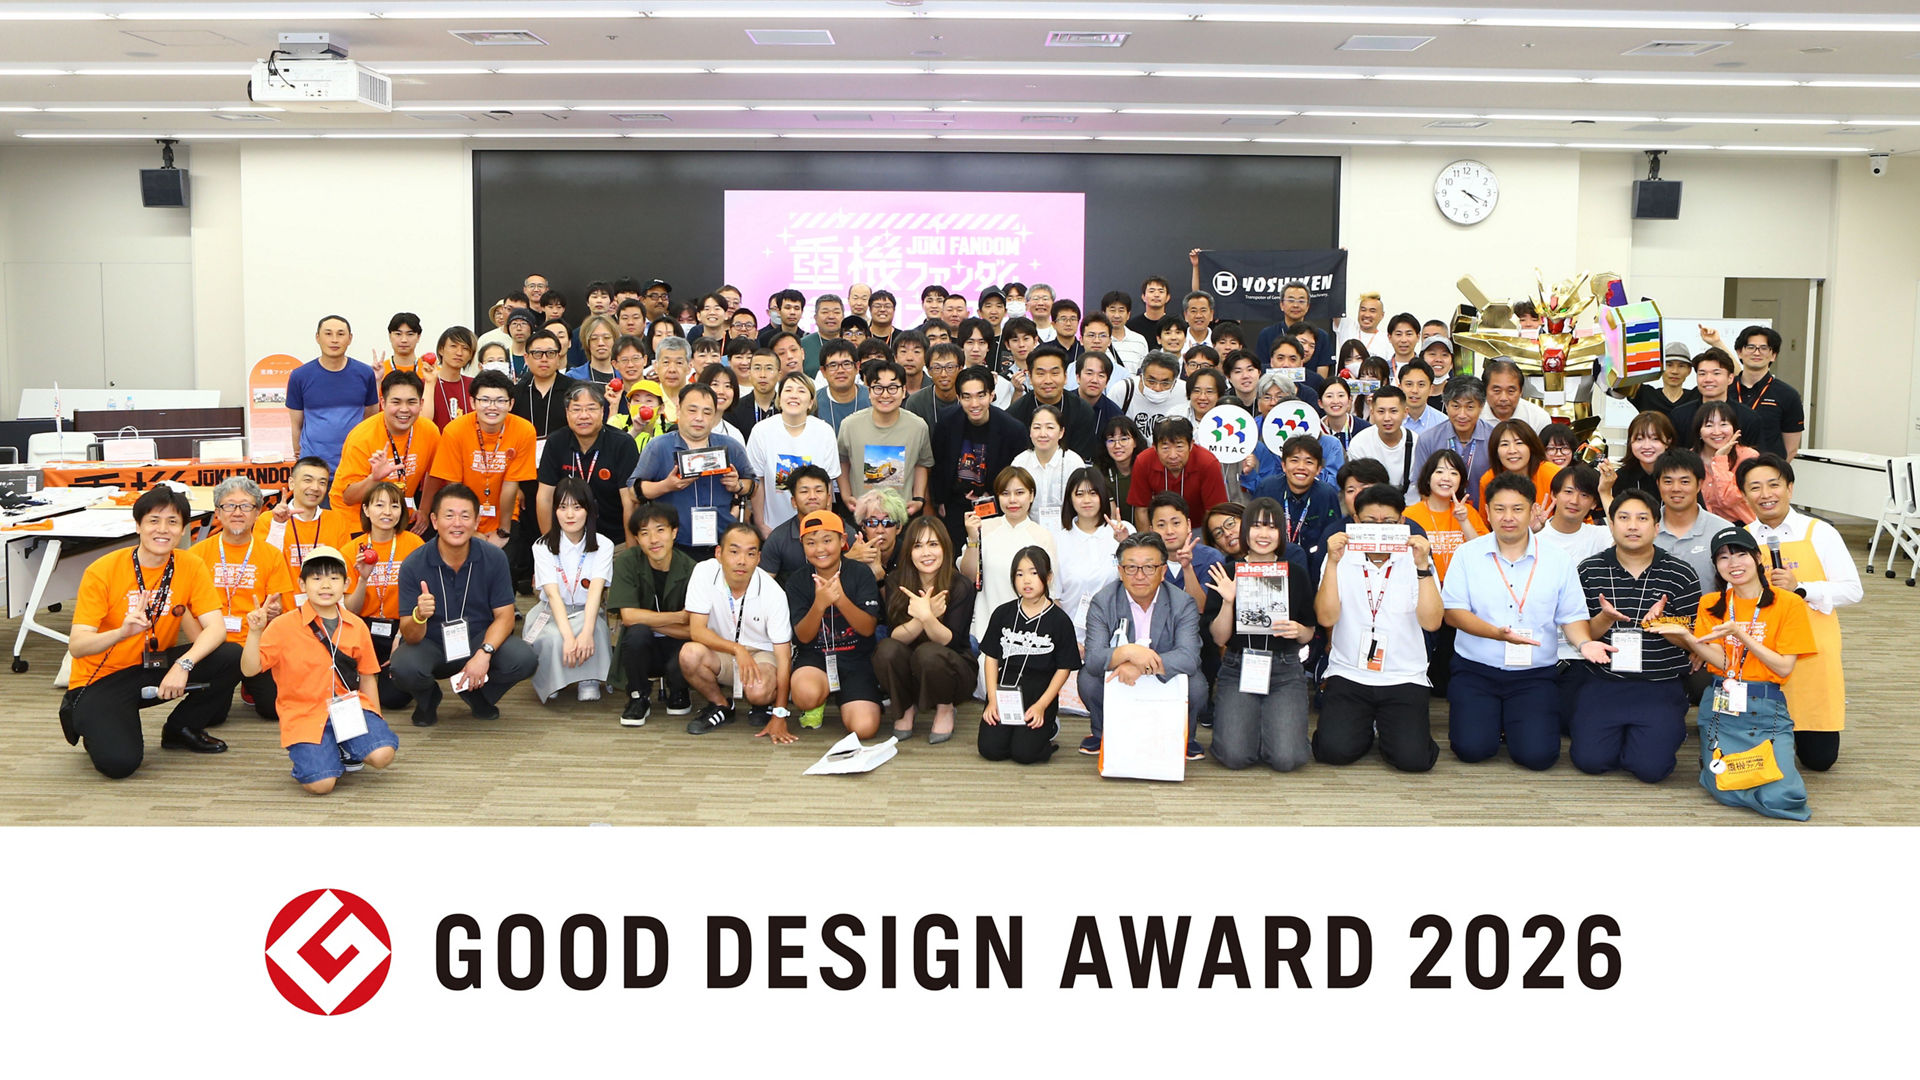 「重機ファンダム」第3回オフ会 集合写真
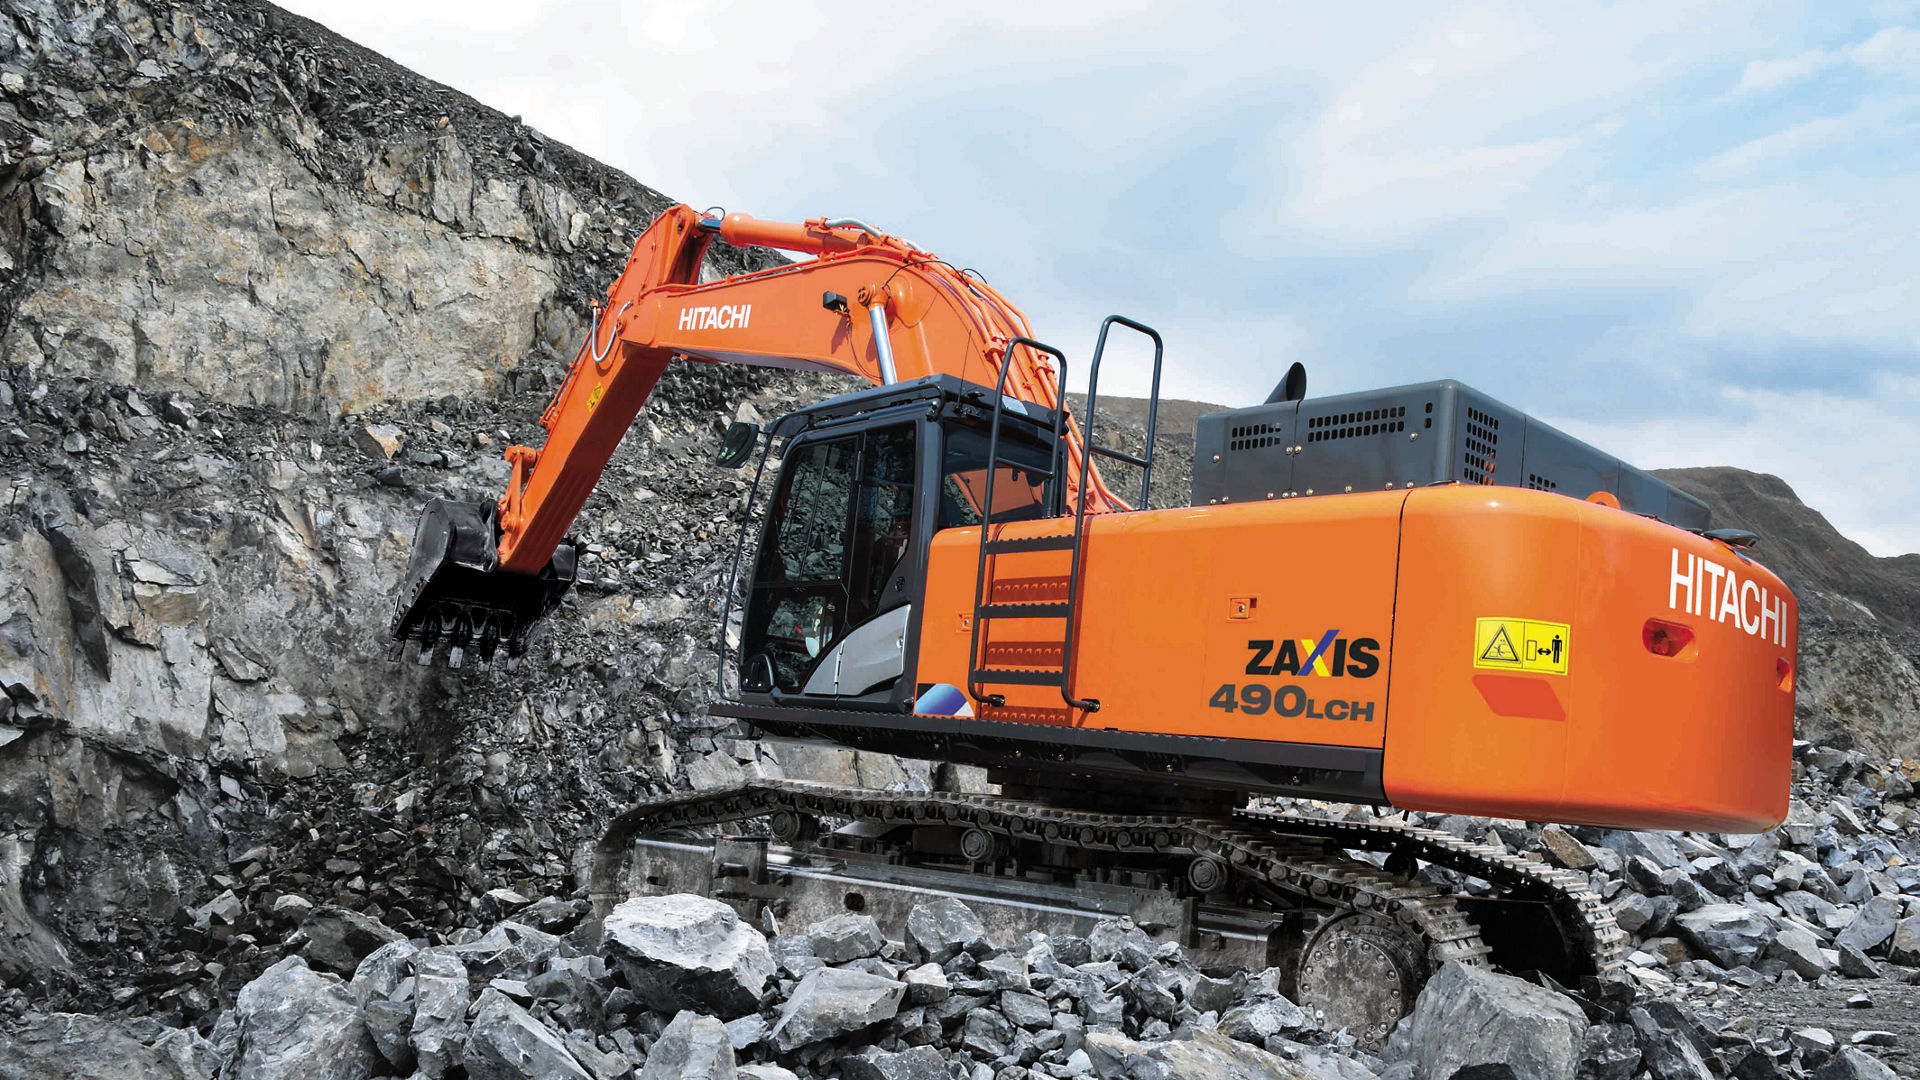 当日展示・乗車できる大型油圧ショベルZX490
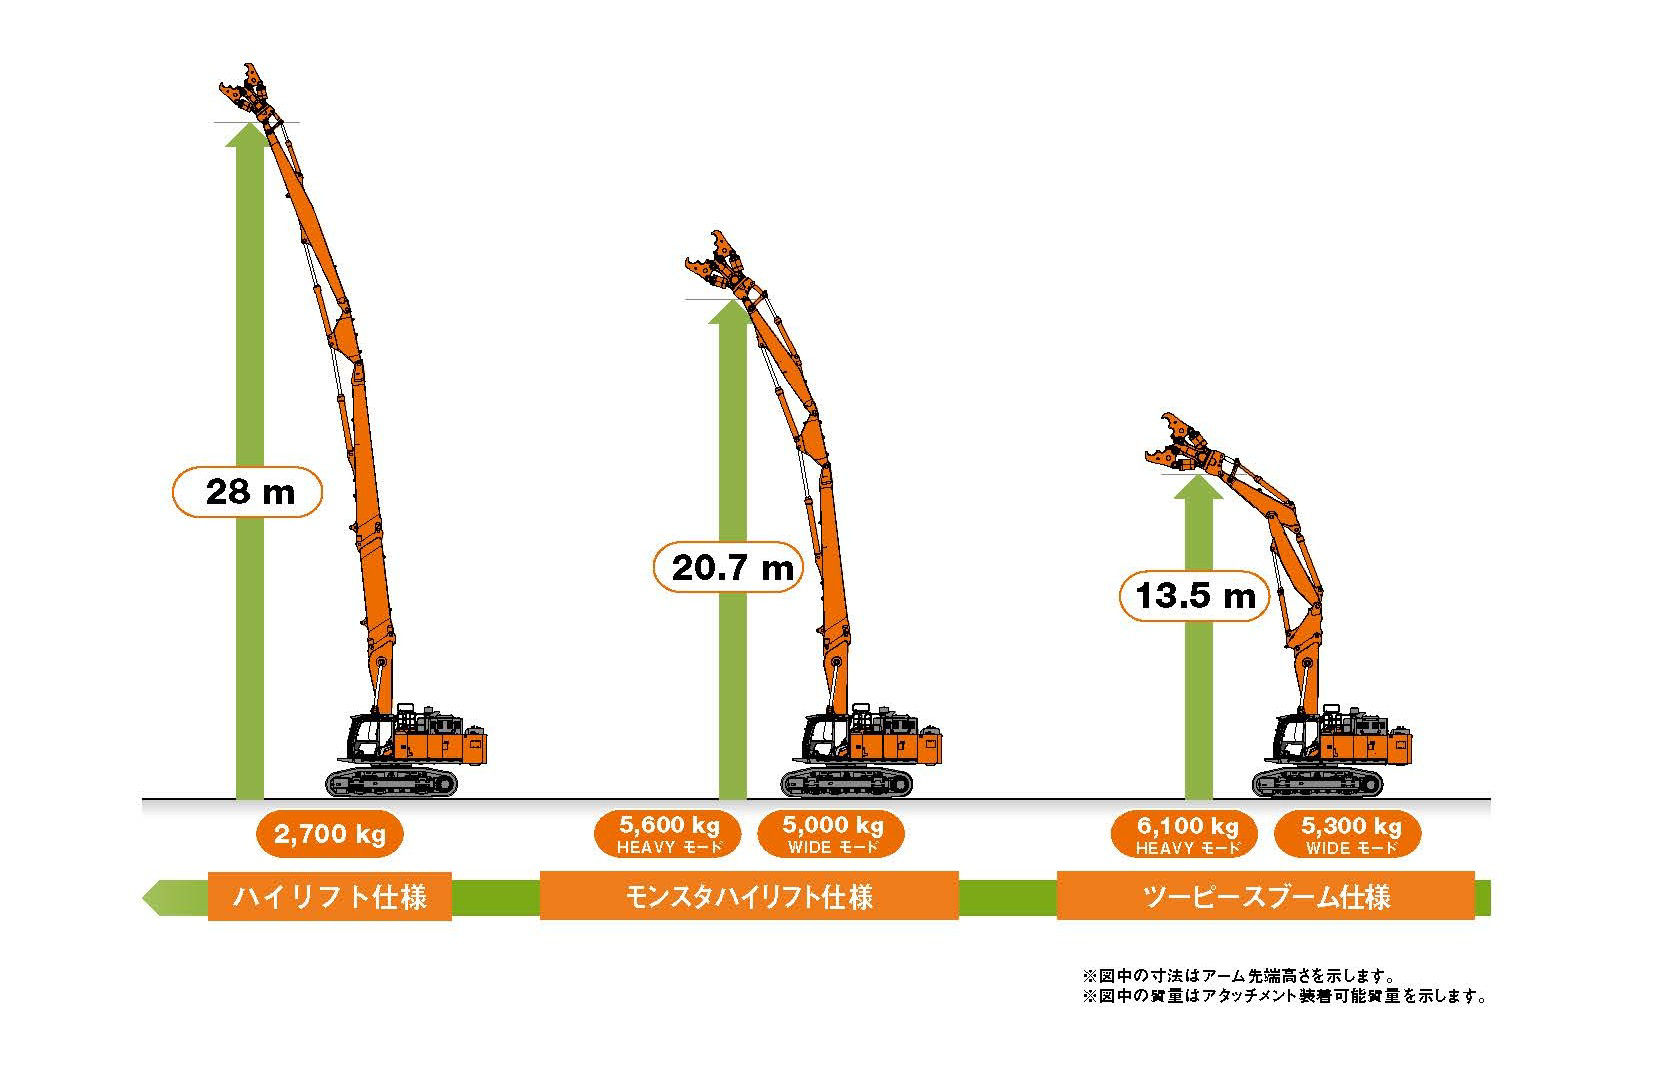 3種類のフロントの作業高さ
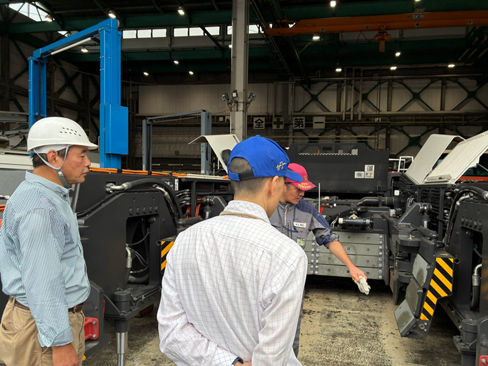
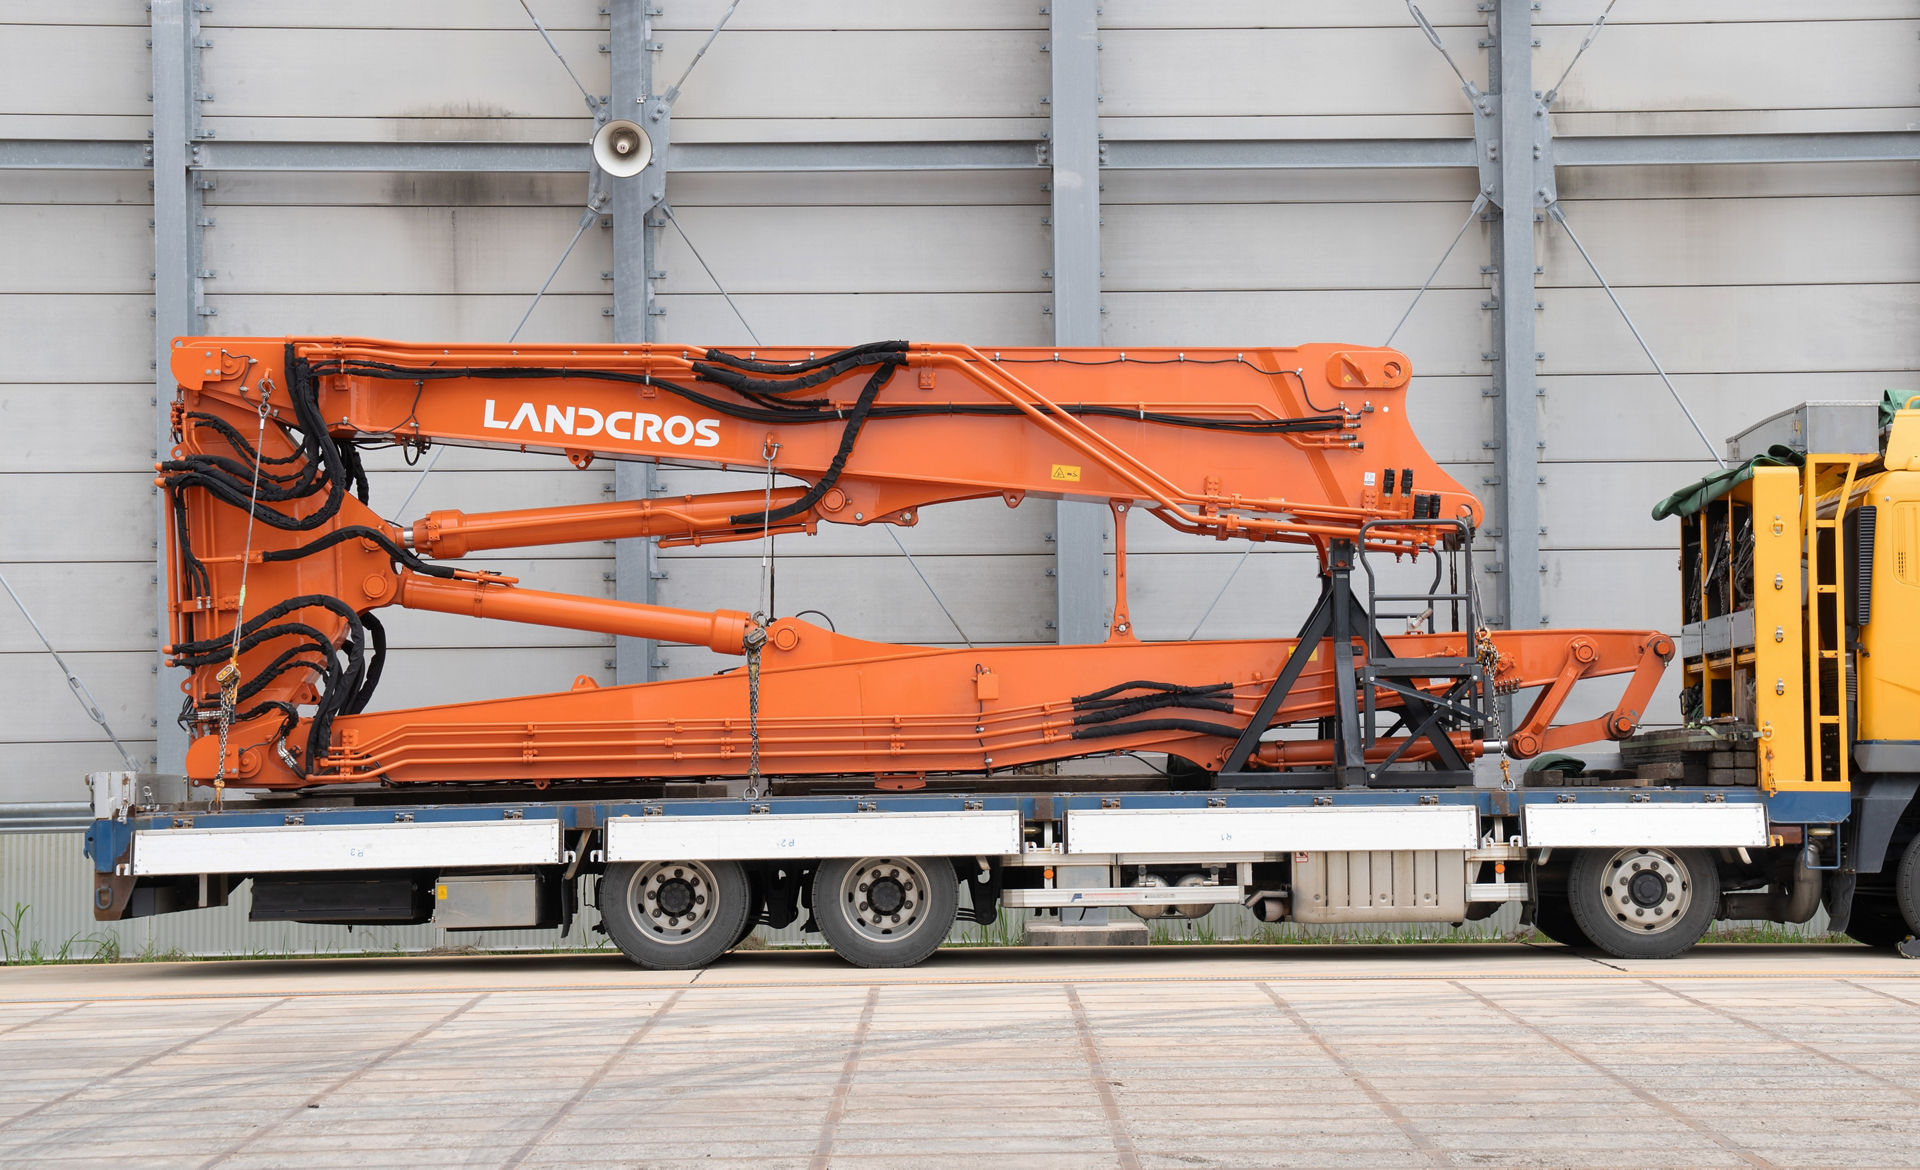 ハイリフト仕様のフロント輸送
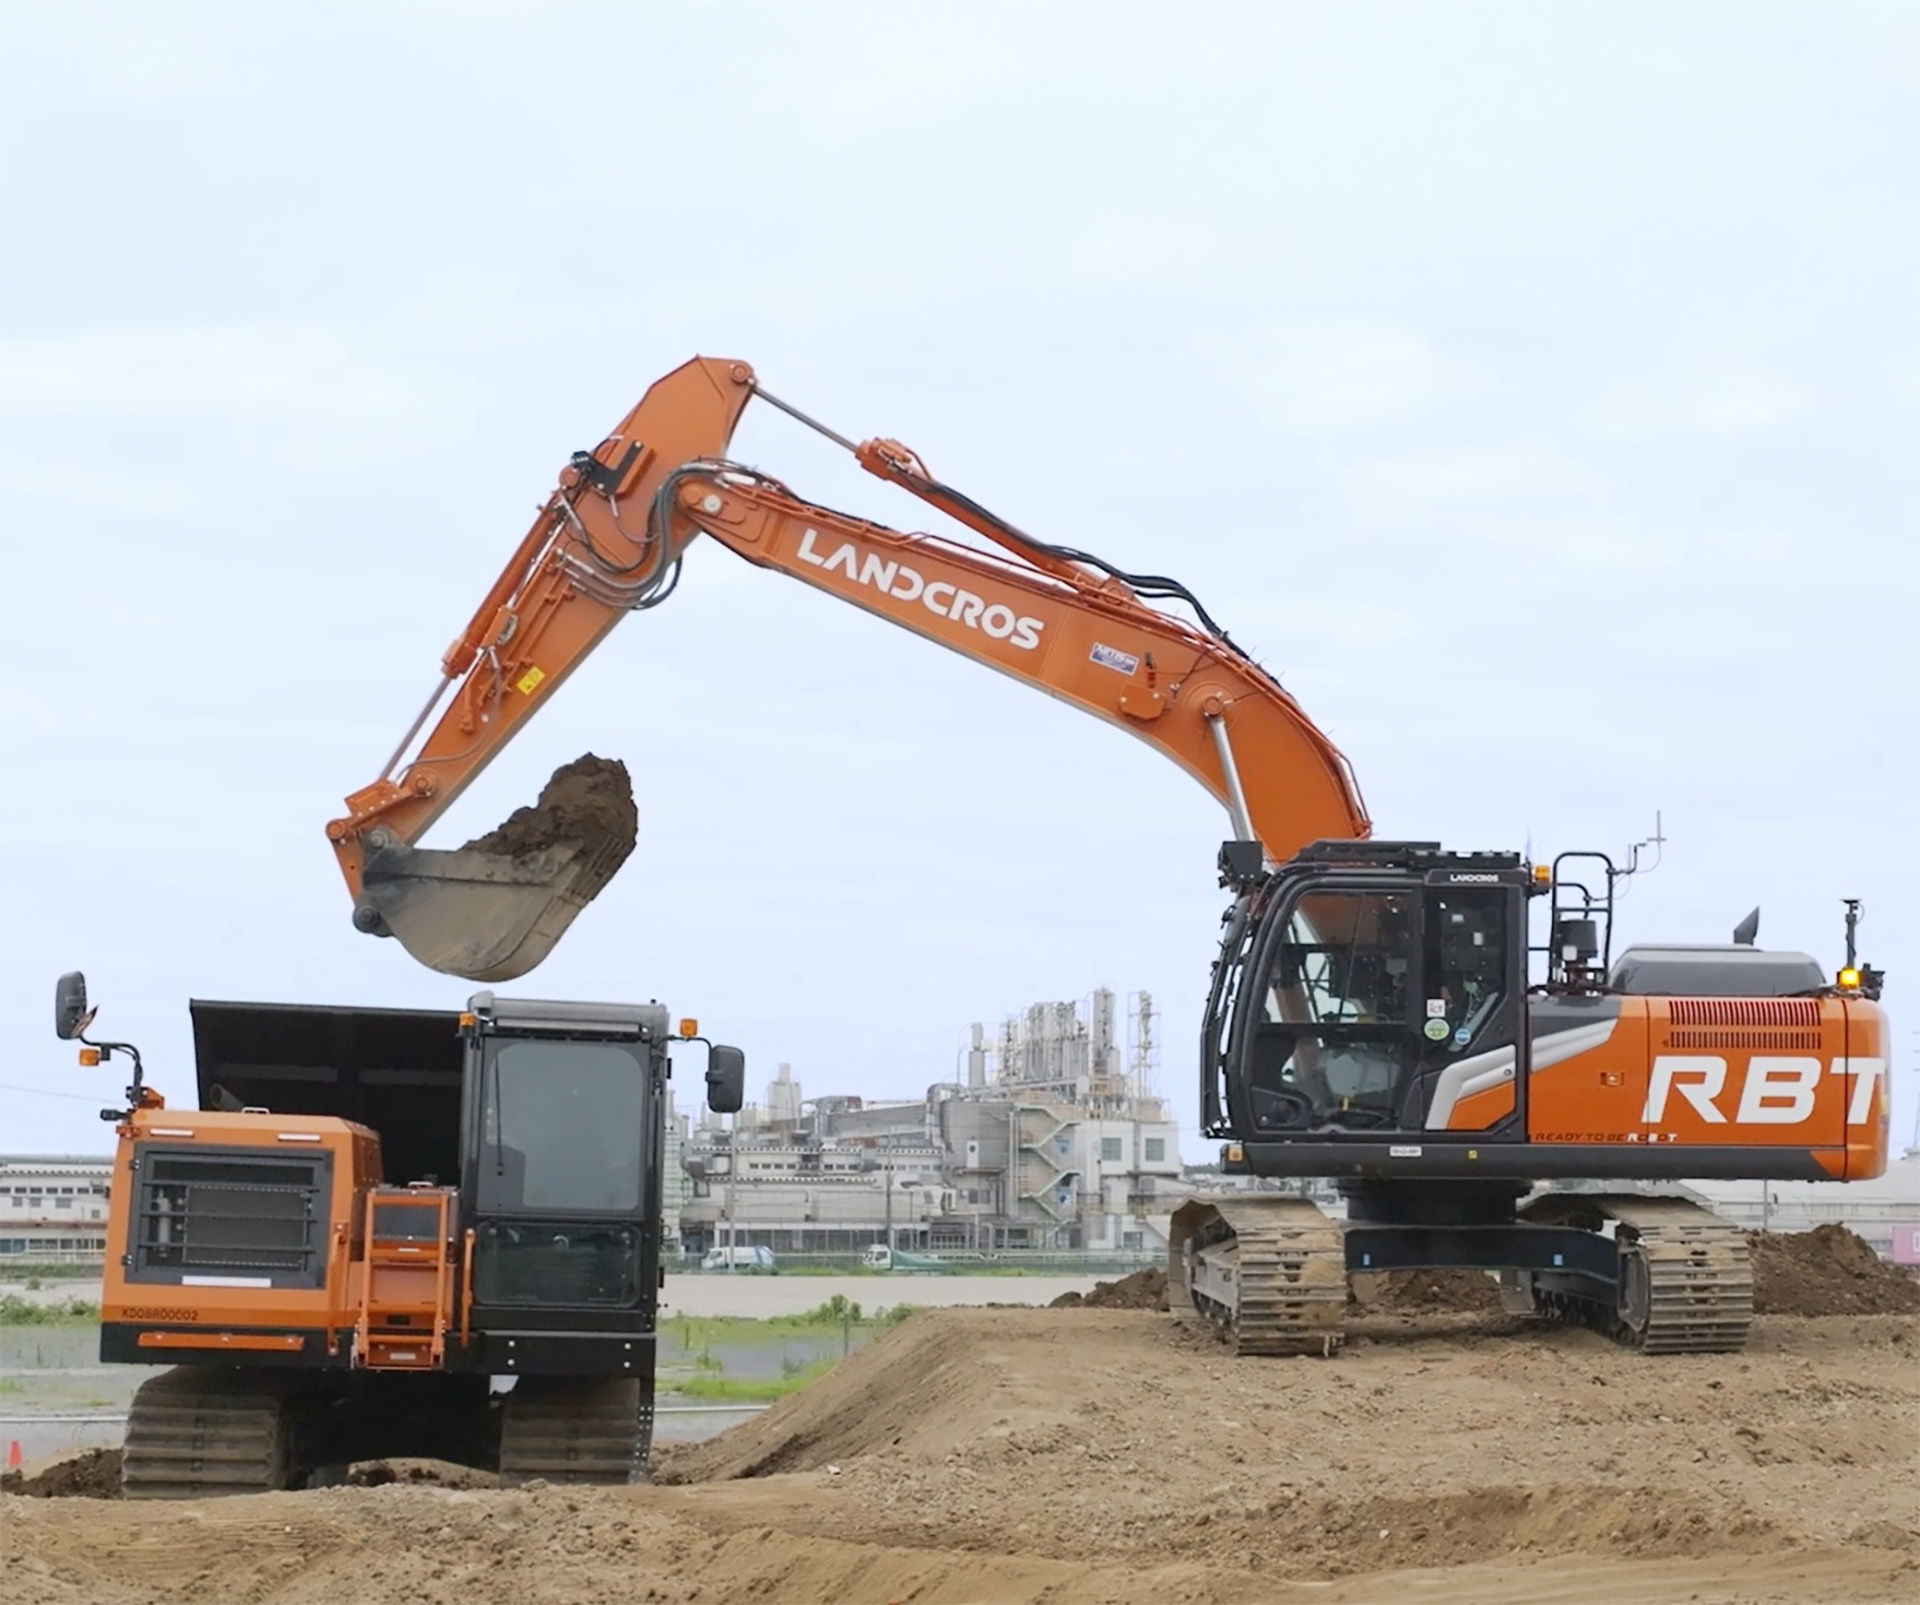 中型油圧ショベルの掘削作業
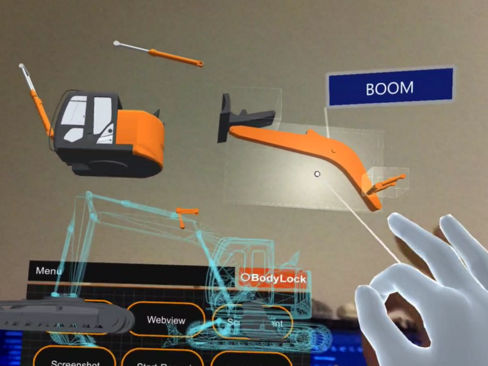
Prompts
Click prompts to add them under the company line, click again to take one out, then copy the result into your AI chat. Shared by Asian Century Stocks and Uncovered Thai Stocks. Thank you.
Hitachi Construction Machinery Co., Ltd. (ticker 6305), listed in Japan.
Copied
ETFs Holding Hitachi Construction Machinery Co., Ltd.
Exchange-traded funds whose newest published daily portfolio holds one of the company's listings, largest weight first.
| ETF | Weight in ETF | Shares | Market value | As of |
|---|---|---|---|---|
| DFIV | 0.11% | 746,600 | $ 24.13M | Nov 12, 2026 |
| AVIV | 0.08% | 54,300 | $ 1.703M | Nov 16, 2026 |
| DIHP | 0.06% | 122,501 | $ 3.959M | Nov 12, 2026 |
| AVSD | 0.05% | 5,600 | $ 175.618K | Nov 16, 2026 |
| DFSI | 0.03% | 11,200 | $ 361.986K | Nov 12, 2026 |
| AVDE | 0.03% | 156,100 | $ 4.895M | Nov 16, 2026 |
| DFIC | 0.03% | 139,200 | $ 4.499M | Nov 12, 2026 |
| DFAI | 0.02% | 130,600 | $ 4.221M | Nov 12, 2026 |
| DXIV | 0.02% | 1,400 | $ 45.248K | Nov 12, 2026 |
| DFAX | 0.02% | 67,500 | $ 2.182M | Nov 12, 2026 |