自己株券買付状況報告書(法24条の6第1項に基づくもの)
Bull 2
Bear 0
Routine
|
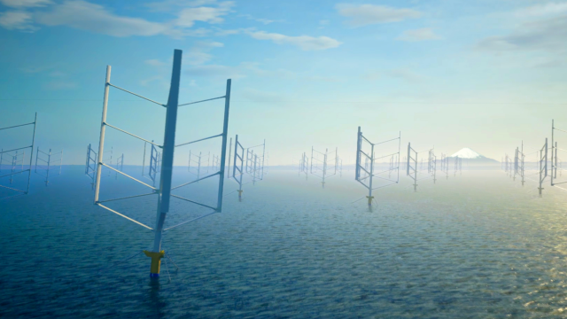
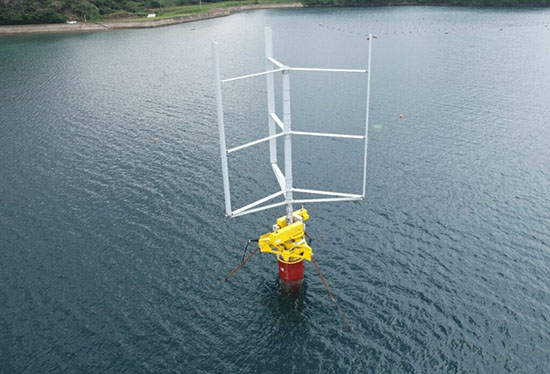
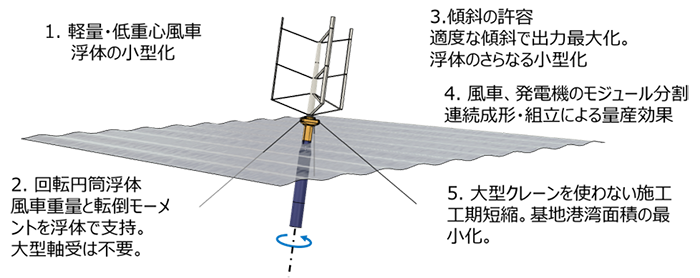
Sumitomo Heavy Industries, Ltd. is a diversified heavy machinery manufacturer operating through four main business segments: Mechatronics, Industrial Machinery, Logistics & Construction, and Energy & Lifelines. In Mechatronics, the company produces cycloidal reducers, motors, and inverters, with key subsidiaries including Sumitomo Heavy Industries Gearbox Co., Ltd., Lafert S.p.A., and Invertek Drives Ltd. The Industrial Machinery segment covers plastic processing machines, accelerators, medical equipment, forging presses, defense equipment, and semiconductor manufacturing devices, involving subsidiaries such as Sumitomo Heavy Industries Ion Technology Co., Ltd. and Leifeld Metal Spinning GmbH. Logistics & Construction includes hydraulic excavators, road machinery, construction cranes, material handling systems, and forklifts, supported by Sumitomo Construction Machinery Co., Ltd., Link-Belt Cranes, L.P., and Sumitomo Nakao Forklift Co., Ltd. The Energy & Lifelines segment provides boilers, air pollution control devices, water treatment plants, industrial turbines, pumps, mixing tanks, food machinery, and marine vessels, with operations through Sumitomo SHI FW Energie B.V., Sumitomo Heavy Industries Environment Co., Ltd., Shin Nihon Zoki Co., Ltd., and Sumitomo Heavy Industries Marine Engineering Co., Ltd. The group serves global markets in North America, Europe, Asia, and other regions, with manufacturing and sales networks established in China, Vietnam, Indonesia, and Germany. Notable partnerships include a capital and business alliance with Albatross Technology for floating offshore wind power implementation. Summarised from the annual report, fiscal year ended Dec 2025 |
Industry Farm & Heavy Construction Machinery | Homepage shi.co.jp |
| Sector Industrials | IR page shi.co.jp/ir | |
|
Tags
cycloidal reducers, plastic processing machines, construction cranes, hydraulic excavators, semiconductor equipment, industrial turbines, water treatment, marine engineering, defense equipment, medical devices, forklifts, boilers, Sumitomo Heavy Industries Gearbox Co. Ltd., Sumitomo Machinery Corporation of America, Sumitomo(SHI)Cyclo Drive Germany GmbH, Sumitomo(SHI)Cyclo Drive Asia Pacific Pte.Ltd., Sumitomo Heavy Industries (Tangshan) Co. Ltd., Sumitomo Heavy Industries Reducer (China) Co. Ltd., Sumitomo Heavy Industries (Vietnam) Co. Ltd., Lafert S.p.A., Invertek Drives Ltd., Ningbo Sumitomo Heavy Machinery Co. Ltd., Sumitomo(SHI) Demag Plastics Machinery North America Inc., Sumitomo(SHI) Demag Plastics Machinery GmbH, Sumitomo Heavy Industries Ion Technology Co. Ltd., Japan Spindle Manufacturing Co. Ltd., Leifeld Metal Spinning GmbH, Sumitomo Construction Machinery Co. Ltd., Sumitomo Construction Machinery (Tangshan) Co. Ltd., Sumitomo Construction Machinery (Shanghai) Co. Ltd., PT Sumitomo Construction Machinery Indonesia, Sumitomo Construction Machinery Sales Co. Ltd., LBX Company LLC, Sumitomo Heavy Industries Construction Machinery Crane Co. Ltd., Link-Belt Cranes L.P. LLLP, Sumitomo Heavy Industries Conveying Systems Co. Ltd., Sumitomo Nakao Forklift Co. Ltd., Sumitomo SHI FW Energie B.V., Sumitomo Heavy Industries Environment Co. Ltd., Shin Nihon Zoki Co. Ltd., Sumitomo Heavy Industries Process Machinery Co. Ltd., Izumi Food Machinery Co. Ltd., Sumitomo Heavy Industries Marine Engineering Co. Ltd., Sumitomo Heavy Industries Material Solutions Co. Ltd., Albatross Technology
|
Press page — |
Metrics
| Valuation | |
|---|---|
| Market cap | ¥ 727.969B |
| Market cap (USD) | $ 4.55B |
| P/E | 17.88 |
| PEG | — |
| P/BV | 1.05 |
| P/S | 0.63 |
| P/OCF | 11.43 |
| P/FCF | 64.26 |
| Dividend yield | 2.1% |
| Turnover / mcap | — |
| Returns | |
|---|---|
| ROE | 4.6% |
| ROI | 3.7% |
| ROIC | 4.2% |
| Profit margin | 2.9% |
| Growth | |
|---|---|
| Revenue growing | No |
| Profits growing | No |
| Revenue up 3y | No |
| Revenue up 5y | No |
| Earnings growth 3y (net profit CAGR) | — |
| Quality | |
|---|---|
| Profitable | Yes |
| Margin expanding | No |
| Buying back stock | No |
| Diluting (TTM) | No |
| Debt/Equity | — |
| Podcast bulls (TTM) | Sign up |
| Podcast bears (TTM) | Sign up |
| Podcast sentiment (TTM) | Sign up |
| Podcast sentiment % (TTM) | Sign up |
| News sentiment (TTM) | 0 |
| Quality score | -50.0% |
| Insiders | |
|---|---|
| Buys, 1w | Sign up |
| Buys, 1m | Sign up |
| Buys, 1y | Sign up |
| Sells, 1w | Sign up |
| Sells, 1m | Sign up |
| Sells, 1y | Sign up |
Sign up to see this company's insider trades
| Figure | FY 2025 | FY 2024 | FY 2023 | FY 2022 | FY 2021 | FY 2020 | FY 2019 | FY 2018 | FY 2017 | FY 2016 | FY 2015 | FY 2014 | FY 2013 |
|---|---|---|---|---|---|---|---|---|---|---|---|---|---|
| Revenue | 1.067T | 1.071T | 1.082T | 854.093B | 849.065B | 864.49B | 903.051B | 791.025B | 674.328B | 700.838B | 667.099B | 615.271B | 585.871B |
| Net profit | 30.937B | 7.721B | 32.742B | 5.782B | 26.764B | 32.807B | 45.65B | 34.66B | 33.613B | 33.133B | 24.348B | 17.891B | 5.865B |
| Free cash flow | 11.329B | -34.924B | 25.911B | -15.178B | 24.29B | -5.053B | 21.321B | 41.197B | 13.566B | -865M | — | — | — |
Filed figures
Lines the statements and their notes report beside the headline figures, read from the filings' XBRL as filed (no restatement applied), with figures computed from one filing's own lines. Cash-flow lines carry their cash direction: an outflow is negative. Each period links to its filing; a figure's period, report date and tag are in its tooltip.
| Figure | Dec 2019 | Mar 2020 | Dec 2020 | Mar 2021 | Dec 2021 | Mar 2022 | Dec 2022 | Dec 2023 | Dec 2024 | Dec 2025 |
|---|---|---|---|---|---|---|---|---|---|---|
| Balance sheet detail | ||||||||||
| Trade receivables (JPY) | 263B | 271B | 267B | 283B | 281B | 295B | 300B | 290B | 307B | 314B |
| ↳ YoY growth | -6.9% | +1.2% | +4.2% | +5.3% | +4.2% | +7.0% | -3.5% | +6.1% | +2.0% | |
| ↳ 5y CAGR | +5.2% | +4.0% | +3.1% | +3.3% | ||||||
| Borrowings, current (JPY) | 83.9B | 67.6B | 51.9B | 35B | 41.6B | 42.9B | 88.4B | 83B | 126B | 120B |
| Borrowings, non-current (JPY) | 40B | 57B | 84.9B | 89.5B | 78.4B | 68.3B | 72.3B | 79.2B | 112B | 132B |
| Bonds payable (JPY) | 20B | 30B | 50B | 50B | 50B | 50B | 50B | 50B | 60B | 60B |
| Cash and deposits (JPY) | 76.6B | 87.1B | 70.8B | 99.5B | 89.3B | 88.8B | 97.5B | 104B | 111B | 111B |
| Intangible assets (JPY) | 69.8B | 73.2B | 76B | 76.8B | 79.4B | 77.6B | 56.6B | 45.6B | 28.3B | 33.1B |
| Net debt (borrowings + leases - cash) (JPY) | 47.3B | 37.6B | 66B | 24.9B | 30.7B | 22.5B | 63.3B | 57.8B | 127B | 142B |
| Cash flow detail | ||||||||||
| Operating cash flow (JPY) | — | 36.3B | — | 64.1B | — | 61.7B | 21.4B | 65.4B | 12.8B | 63.7B |
| Purchases of property, plant and equipment (JPY) | — | -41.3B | — | -39.8B | — | -45.6B | -36.5B | -39.5B | -47.7B | -52.3B |
| Change in receivables (cash effect) (JPY) | — | 21.2B | — | -10.9B | — | — | — | 6.7B | -20.8B | -7.07B |
| Change in inventories (cash effect) (JPY) | — | -17.8B | — | -4.09B | — | -26.4B | -33B | -37.7B | 3.4B | 10.9B |
| Change in payables (cash effect) (JPY) | — | -27.9B | — | 966M | — | 4.17B | 4.27B | -14.4B | -36.3B | -9.87B |
| Dividends paid (cash effect) (JPY) | — | -14.5B | — | -5.4B | — | -11.1B | -15.3B | -12.9B | -14.5B | -15B |
| Share buybacks (cash effect) (JPY) | — | — | — | — | — | — | — | -29M | -10B | -14M |
| Interest paid (cash effect) (JPY) | — | -1.19B | — | -969M | — | -754M | -1.07B | -2.42B | -3.73B | -3.79B |
| Income taxes paid (cash effect) (JPY) | — | -22.1B | — | -15.5B | — | -17.5B | -20.6B | -9.8B | -21.2B | -16.6B |
| Operating cash flow before change in receivables (JPY) | — | 15B | — | 75.1B | — | — | — | 58.7B | 33.6B | 70.7B |
| Free cash flow (OCF - PPE - intangibles) (JPY) | — | -5.05B | — | 24.3B | — | 16B | -15.2B | 25.9B | -34.9B | 11.3B |
| Income detail | ||||||||||
| Research and development expense (JPY) | — | 18.8B | — | 19.5B | — | 20.2B | 17.4B | 24.8B | 33.7B | 31.1B |
| ↳ 5y CAGR | +9.6% | +12.2% | ||||||||
| Total comprehensive income (JPY) | — | 27.4B | — | 32.2B | — | 74B | 33.4B | 63.9B | 44.7B | 58B |
| Comprehensive income to owners (JPY) | — | 25.7B | — | 30.2B | — | 71.9B | 34.1B | 63.4B | 43.5B | 57.5B |
| Segments | ||||||||||
| Energy And Lifeline · Segment revenue (JPY) | — | — | — | 204B | — | 206B | 144B | 183B | 183B | 181B |
| ↳ YoY growth | +0.7% | +27.0% | +0.2% | -1.4% | ||||||
| Energy And Lifeline · Segment operating income (JPY) | — | — | — | 16.7B | — | 18.2B | -475M | 6.34B | 3.77B | 12.1B |
| Environmental Facilities And Plants · Segment revenue (JPY) | — | 150B | — | 169B | — | — | — | — | — | — |
| ↳ YoY growth | -1.0% | +12.4% | ||||||||
| Environmental Facilities And Plants · Segment operating income (JPY) | — | 11.9B | — | 18.1B | — | — | — | — | — | — |
| Industrial Machinery · Segment revenue (JPY) | — | — | — | 205B | — | 232B | 226B | 282B | 286B | 224B |
| ↳ YoY growth | +13.0% | +24.5% | +1.5% | -21.6% | ||||||
| Industrial Machinery · Segment operating income (JPY) | — | — | — | 15.9B | — | 19.3B | 21.3B | 25.6B | 20.3B | 4.24B |
| Logistics And Construction · Segment revenue (JPY) | — | — | — | 303B | — | 342B | 301B | 394B | 393B | 389B |
| ↳ YoY growth | +12.9% | +30.9% | -0.2% | -1.0% | ||||||
| Logistics And Construction · Segment operating income (JPY) | — | — | — | 13.6B | — | 19.3B | 13B | 28.1B | 25.3B | 14B |
| Machinery Components · Segment revenue (JPY) | — | 133B | — | 124B | — | — | — | — | — | — |
| ↳ YoY growth | -2.3% | -6.3% | ||||||||
| Machinery Components · Segment operating income (JPY) | — | 5.52B | — | 2.23B | — | — | — | — | — | — |
| Mechatronics · Segment revenue (JPY) | — | — | — | 136B | — | 163B | 183B | 222B | 208B | 273B |
| ↳ YoY growth | +20.1% | +21.4% | -6.5% | +31.5% | ||||||
| Mechatronics · Segment operating income (JPY) | — | — | — | 3.11B | — | 6.39B | 9.48B | 12.4B | 3.79B | 19B |
| Ships · Segment revenue (JPY) | — | 33B | — | 34.1B | — | — | — | — | — | — |
| ↳ YoY growth | -20.5% | +3.4% | ||||||||
| Ships · Segment operating income (JPY) | — | -2.1B | — | -2.74B | — | — | — | — | — | — |
| Reported | Feb 7, 2020 | Jul 31, 2020 | Feb 8, 2021 | Jun 29, 2022 | Feb 8, 2022 | Jun 29, 2022 | Mar 30, 2023 | Mar 28, 2025 | Mar 28, 2025 | Mar 26, 2026 |
Sign up to see institutional holdings
Sign UpPodcast Mentions
Sign up to see podcast mentions and sentiment
Sign UpTimely disclosures published on TDnet, newest first, titles as filed in Japanese. The link opens the disclosure on TDnet. Filings with EDINET (periodic reports, extraordinary reports, offerings, holding and buy-back reports), newest first, titles as filed in Japanese. The link opens the filing on EDINET. Press releases from the company's own website, newest first.
自己株式取得の取得状況および取得終了に関するお知らせ(会社法第165条第2項の規定による定款の定めに基づく自己株式の取得)
Bull 2
Bear 0
Capital return
気候変動イニシアティブの再エネ転換の加速を求める政策提言に賛同
Bull 0
Bear 0
Routine
2026年11月05日
住友重機械グループは、気候変動イニシアティブ(JCI ※)による政策提言「輸入化石燃料への過度な依存から早期脱却し、再生可能エネルギーへの転換を柱に、エネルギー安全保障・脱炭素経済の実現を」(以下、「本提言」)に賛同しました。本提言には、全国の企業・自治体・団体など252の団体が賛同しています。
国際情勢の不安定化やエネルギー価格の変動が続く中、日本は輸入化石燃料への過度な依存に伴うエネルギー安全保障上のリスクに直面しています。同時に、気候危機の影響も深刻化しており、脱炭素化に向けた取組の加速が求められています。
本提言は、日本のエネルギー安全保障の強化と脱炭素経済の実現に向けて、「エネルギー自立を実現する」、「電化による脱炭素化を加速する」、「分散型エネルギーシステムで強靭な社会をつくる」、「再生可能エネルギー転換への投資を促進し、競争力を高める」の4つを柱としています。
当社グループは、気候変動を解決に貢献すべき社会課題の一つと位置付け、「事業活動における環境負荷の低減」と「製品の環境性能向上」の両面から、2050年までのカーボンニュートラルの実現を目指しています。製造拠点での太陽光発電設備の導入や再生可能エネルギーの購入を通じて、事業活動に伴うCO2排出量の削減を進めています。
また、高効率なモータ・インバータなどによる省エネルギー化や、物流・建設機械などの電動化に加え、バイオマスの活用や蓄エネルギー技術の開発など、製品・サービスを通じた脱炭素化への貢献を進めています。
当社グループは、本提言への賛同を通じて、再生可能エネルギーへの転換と脱炭素社会の実現に向けた取り組みを引き続き推進してまいります。
→詳細はこちら
https://japanclimate.org/news-topics/jci-statement-nov-2026/
※気候変動イニシアティブ(Japan Climate Initiative:JCI)とは
パリ協定の実現に向け、気候変動対策に自ら積極的に取り組む企業や自治体、NPO/NGOなど非政府アクターのネットワークです。メンバー自身の行動を1.5度目標の水準に引き上げ、その取り組みを国内外に発信するとともに、メンバーの声を集めて日本政府に届けることで、脱炭素社会の実現を後押ししています。2018年7月に105団体の参加で発足し、現在は874団体が参加しています(2026年10月26日現在)。設立宣言に賛同し、脱炭素社会の実現に向けた真剣な取り組みを進める全ての企業、自治体、NPO/NGO、大学・研究機関などに、参加を呼びかけています。
-
-
イオンビーム照射技術サービス
-
メディカル&カンタムソリューションズSBU
-
BNCT
-
電子線照射サービス
-
検査診断技術サービス
-
メタルプロセッシングソリューションズSBU
-
プラスチックソリューションズSBU
-
混練機
-
クーリングタワー
-
-
エネルギー環境SBU
-
プロセスプラントSBU
-
プラントエンジニアリング
-
鋼構造物
-
用水・純水処理設備
-
海洋・鉄構SBU
-
風力推進コンポーネント
-
取扱SBU・関係会社
メカトロニクス
-
住友重機械(唐山)有限公司
インダストリアル
マシナリー
ロジスティックス&コンストラクション
-
搬送システムSBU
-
HSCクレーンSBU
-
リンクベルトクレーンSBU
-
建機SBU
-
PT.Sumitomo Construction Machinery Indonesia
エネルギー&
ライフライン
-
エネルギー環境SBU
-
プロセスプラントSBU
-
海洋・鉄構SBU
その他
公式SNS


Copyright© Sumitomo Heavy Industries, Ltd.
All Rights Reserved.


Prompts
Click prompts to add them under the company line, click again to take one out, then copy the result into your AI chat. Shared by Asian Century Stocks and Uncovered Thai Stocks. Thank you.
Sumitomo Heavy Industries, Ltd. (ticker 6302), listed in Japan.
Copied
ETFs Holding Sumitomo Heavy Industries, Ltd.
Exchange-traded funds whose newest published daily portfolio holds one of the company's listings, largest weight first.
| ETF | Weight in ETF | Shares | Market value | As of |
|---|---|---|---|---|
| DISV | 0.31% | 487,867 | $ 15.869M | Nov 12, 2026 |
| AVDV | 0.14% | 854,700 | $ 26.429M | Nov 16, 2026 |
| AVDS | 0.12% | 14,800 | $ 457.638K | Nov 16, 2026 |
| DFIS | 0.11% | 194,194 | $ 6.316M | Nov 12, 2026 |
| DFIV | 0.06% | 437,923 | $ 14.244M | Nov 12, 2026 |
| DXIV | 0.05% | 3,900 | $ 126.854K | Nov 12, 2026 |
| AVIV | 0.05% | 34,800 | $ 1.076M | Nov 16, 2026 |
| DFSI | 0.05% | 16,800 | $ 546.447K | Nov 12, 2026 |
| DFIC | 0.05% | 217,000 | $ 7.058M | Nov 12, 2026 |
| DFAX | 0.03% | 114,500 | $ 3.724M | Nov 12, 2026 |
| AVDE | 0.02% | 126,000 | $ 3.896M | Nov 16, 2026 |
| DFAI | 0.02% | 111,752 | $ 3.635M | Nov 12, 2026 |