EDINET提出書類 日本エアーテック株式会社(E02421) 有価証券報告書 【表紙】 【提出書類】 有価証券報告書 【根拠条文】 金融商品取引法第24条第1項 【提出先】 関東財務局長 【提出日】 2026年3月27日 【事業年度】 第53期(自 【会社名】 日本エアーテック株式会社…
EDINET提出書類
日本エアーテック株式会社(E02421)
有価証券報告書
【表紙】
【提出書類】
有価証券報告書
【根拠条文】
金融商品取引法第24条第1項
【提出先】
関東財務局長
【提出日】
2026年3月27日
【事業年度】
第53期(自
【会社名】
日本エアーテック株式会社
【英訳名】
AIRTECH JAPAN,LTD.
【代表者の役職氏名】
代表取締役社長
【本店の所在の場所】
東京都台東区入谷一丁目14番9号
【電話番号】
03(3872)6611(代表)
【事務連絡者氏名】
管理本部長
【最寄りの連絡場所】
東京都台東区入谷一丁目14番9号
【電話番号】
03(3872)9192
【事務連絡者氏名】
管理本部長
【縦覧に供する場所】
株式会社東京証券取引所
2025年1月1日
渡辺
渡辺
平沢
至
2025年12月31日)
真也
直樹
直樹
(東京都中央区日本橋兜町2番1号)
1/100
EDINET提出書類
日本エアーテック株式会社(E02421)
有価証券報告書
第一部【企業情報】
第1【企業の概況】
1【主要な経営指標等の推移】
提出会社の経営指標等
回次
第49期
第50期
第51期
第52期
第53期
決算年月
2021年12月
2022年12月
2023年12月
2024年12月
2025年12月
売上高
(千円)
14,289,116
13,172,532
13,646,648
13,517,774
14,151,101
経常利益
(千円)
2,195,888
1,396,661
1,010,309
1,529,572
1,606,841
当期純利益
(千円)
1,584,376
1,017,053
731,841
1,137,376
1,131,475
持分法を適用した場合の投資
(千円)
利益
76,655
247,401
137,430
121,639
88,024
資本金
(千円)
2,084,215
2,099,181
2,116,233
2,133,951
2,133,951
発行済株式総数
(株)
10,450,200
10,478,710
10,508,450
10,538,420
10,538,420
純資産額
(千円)
13,456,338
13,926,598
14,107,697
14,301,852
14,771,504
総資産額
(千円)
19,968,110
19,976,404
19,589,389
18,512,949
19,875,831
1株当たり純資産額
(円)
1,293.71
1,350.02
1,360.01
1,414.01
1,478.97
50.00
60.00
60.00
50.00
55.00
(−)
(−)
(−)
(−)
(−)
1株当たり配当額
(うち1株当たり中間配当
額)
(円)
1株当たり当期純利益
(円)
153.03
99.08
70.85
109.75
111.96
潜在株式調整後1株当たり当
期純利益
(円)
152.39
98.92
70.76
−
−
自己資本比率
(%)
67.2
69.6
72.0
77.3
74.3
自己資本利益率
(%)
12.4
7.4
5.2
8.0
7.8
株価収益率
(倍)
7.70
10.75
17.28
10.19
10.35
配当性向
(%)
32.67
60.56
84.69
45.56
49.12
営業活動による
キャッシュ・フロー
(千円)
1,799,781
228,020
454,237
△667,587
1,625,885
投資活動による
キャッシュ・フロー
(千円)
△458,945
△915,244
△774,762
△884,179
△900,662
財務活動による
キャッシュ・フロー
(千円)
△71,514
△866,810
△675,833
△964,327
324,418
現金及び現金同等物の期末残
(千円)
高
7,189,917
5,673,486
4,692,616
2,192,106
3,249,699
398
408
420
455
473
[13]
[12]
[11]
[8]
[7]
従業員数
[外、平均臨時雇用者数]
(人)
株主総利回り
(%)
77.5
74.1
87.9
84.4
90.4
(比較指標:配当込み
TOPIX)
(%)
(112.7)
(110.0)
(141.1)
(169.9)
(213.2)
最高株価
(円)
1,734
1,268
1,437
1,280
1,315
最低株価
(円)
1,063
947
1,010
960
921
(注)1.当社は連結財務諸表を作成しておりませんので、連結会計年度に係る主要な経営指標等の推移については記
載しておりません。
2.第50期の1株当たり配当額には、赤城スマートファクトリー竣工記念配当20円が含まれております。
3.第51期の1株当たり配当額には、創立50周年記念配当20円が含まれております。
2/100
EDINET提出書類
日本エアーテック株式会社(E02421)
有価証券報告書
4.第52期、第53期の潜在株式調整後1株当たり当期純利益については、潜在株式が存在しないため記載してお
りません。
5.最高株価及び最低株価は、2023年10月20日以降は東京証券取引所スタンダード市場におけるものであり、そ
れ以前については2022年4月4日より東京証券取引所プライム市場におけるものであり、さらにそれ以前に
ついては東京証券取引所市場第一部におけるものであります。
6.「収益認識に関する会計基準」(企業会計基準第29号 2020年3月31日)等を第50期の期首から適用してお
り、第50期以降に係る主要な経営指標等については、当該会計基準等を適用した後の指標等となっておりま
す。
3/100
EDINET提出書類
日本エアーテック株式会社(E02421)
有価証券報告書
2【沿革】
当社は、1973年3月に平沢紘介(2023年8月相談役退任)が、㈱日立製作所亀戸工場の移転を機会に同社を退社
し、クリーンエアーシステムの企画、製造、サービス等の総合技術の販売を目的として、当社を設立したことに始ま
ります。
年月
事項
1973年3月
空気清浄機器の製造及び販売を目的として東京都港区六本木に日本エアーテック株式会社を設立。
1974年3月
標準型クリーンベンチを完成。同時に低騒音ファン(LNF-1)を開発。
1975年2月
エアーシャワー装置をはじめ、多くのクリーンエアーシステム製品の製造を開始。
1976年12月
埼玉県草加市に草加工場を新設。
1978年3月
大阪市大淀区(現北区)に大阪営業所(現関西営業所)を設置。
1983年6月
無塵衣のクリーンクリーニング、各種ワイパーの販売を目的としてクリーンサプライ部を新設。
1984年2月
クリーニング用の無塵ランドリー設備を設置、無塵衣のクリーンクリーニングを開発。
1984年5月
東京都台東区東上野に本社を移転。
1984年9月
シンガポールにUTOPIA-AIRE PTE.,LTD.(シンガポール)と合弁にてAIRTECH EQUIPMENT PTE.,LTD.を
設立。
1985年1月
AIRTECH EQUIPMENT PTE.,LTD.とクリーンエアーシステム技術の供与契約を締結。
1986年1月
クリーンサプライ部を分離独立し、クリーンサプライ㈱を設立。
1987年2月
福岡市南区に福岡出張所(現九州営業所)を設置。
1987年6月
仙台市青葉区に仙台営業所(現東北営業所)を設置。
1987年9月
SS-MACシリーズ、ガーメントストッカー、LC型HEPAユニット及びクリーンダストボックス等を開発。
1989年7月
クリーンサプライ㈱を吸収合併。
1990年4月
台湾に永傑空調機械公司(台湾)と合弁にて富泰空調科技股份有限公司を設立。
1990年5月
富泰空調科技股份有限公司とクリーンエアーシステム技術の供与契約を締結。
1991年11月
(社)日本証券業協会店頭売買銘柄に新規登録。
1992年2月
岡部工業㈱と合弁にてオカベテック㈱を設立。
1992年9月
群馬県赤堀町(現伊勢崎市)に群馬工場(現伊勢崎工場)を新設し、オカベテック㈱に貸与。
1994年3月
中国江蘇省蘇州市に中国蘇州浄化設備有限公司ほか3社と合弁にて蘇州安泰空気技術有限公司を設
立。同社とクリーンエアーシステム技術の供与契約を締結。
1994年11月
名古屋市中村区に名古屋営業所(現中部営業所)を設置。
1995年7月
米国オレゴン州ヒルズボロ市にクリーンエアーシステム製品の製作子会社AIRTECH INTERNATIONAL
MANUFACTURING,INC.を設立。
1995年9月
高性能フィルター(HEPA)の内製化開始。
1996年5月
AIRTECH INTERNATIONAL MANUFACTURING,INC.とクリーンエアーシステム技術の供与契約を締結。
1997年7月
東京証券取引所市場第2部に株式を上場。
1997年8月
東京都台東区入谷に本社ビルを建設し移転。
1998年3月
オカベテック㈱を吸収合併、当社群馬工場(現伊勢崎工場)として発足。
1998年9月
中国江蘇省呉懸市に中国呉浄浄化設備公司並びに蘇州浄化設備有限公司と合弁にて蘇州華泰空気過濾
器有限公司を設立し、エアーフィルター技術の供与契約を締結。
2000年9月
子会社AIRTECH INTERNATIONAL MANUFACTURING,INC.を整理清算。
2001年3月
草加工場内に研究所を建設。
2002年3月
中国江蘇省蘇州市蘇州工業圏区に蘇州工業圏区安泰空調浄化科技有限公司並びに富泰空調科技股份有
限公司と合弁にて蘇州富泰潔浄系統有限公司を設立。
2003年10月
群馬工場(現伊勢崎工場)内に製缶工場建設。
2004年3月
WOOLEE AIRTECH KOREA CO.,LTD.とクリーンエアーシステム技術の供与契約を締結。
2004年3月
広島市南区に広島営業所(現中国営業所)を設置。
2004年12月
鹿児島県国分市(現霧島市)に南九州営業所(現南九州出張所)を設置。
2005年6月
㈱東京証券取引所市場第1部に指定。
2006年6月
埼玉県加須市に加須工場を設置。
2007年4月
PYRAMID AIRTECH PVT.LTD.(インド)とクリーンエアーシステム技術の供与契約を締結。
2008年3月
中国合弁会社蘇州富泰潔浄系統有限公司の出資持分を他の法人に譲渡し合弁契約を解消。
2008年10月
草加工場に隣接する土地・建物を購入しサービスセンターを設置。
2011年6月
中国合弁会社蘇州華泰空気過濾器有限公司の出資持分を他の法人に譲渡し合弁契約を解消。
2011年12月
富山県富山市に北陸営業所を設置。
2014年3月
群馬工場(現伊勢崎工場)内に粉体塗装設備を新設し、塗装の内製化開始。
2015年11月
PEA GMBH(ドイツ)と相互製品の販売提携契約を締結。
2016年1月
THELONG INTERNATIONAL TECHNOLOGY CO.,LTD.(ベトナム)とクリーンエアーシステム技術の供与契
約を締結後、THELONG AIRTECH JOINT STOCK COMPANYに社名変更。
2018年8月
HEMAIR SYSTEMS INDIA LIMITED(インド)とクリーンエアーシステム技術の供与契約を締結。
2021年1月
埼玉県越谷市に越谷工場を設置。
2022年4月
㈱東京証券取引所プライム市場に指定。
2022年8月
群馬県桐生市に赤城スマートファクトリー(フィルター製造棟)を設置。
2023年1月
熊本市東区に熊本出張所(営業及び物流倉庫)を設置。
2023年4月
静岡県富士市に静岡出張所及び静岡サービスセンターを設置。
2023年10月
㈱東京証券取引所スタンダード市場に移行。
2024年12月
埼玉県草加市に草加多目的センター(事務・セミナースペース及び物流倉庫)を設置。
2025年3月
札幌市厚別区に北海道出張所及び北海道サービスセンターを設置。
2025年7月
名古屋市中村区に中部サービスセンターを設置。
4/100
EDINET提出書類
日本エアーテック株式会社(E02421)
有価証券報告書
3【事業の内容】
当社グループは、当社及び関連会社1社で構成され、半導体・電子工業分野及びバイオロジカル分野を主な需要先
とした、クリーンエアーシステムの企画、製造、サービス等の総合技術の販売という単一セグメントに属する事業を
営んでおります。
事業内容及び当社と関連会社との関係は次のとおりであります。
会社名
蘇州安泰空気技術有限公司
(中国)
事業内容
当社よりクリーンエアーシステムの技術供与をうけ、クリーンエアー機器の
製造販売を行っております。
事業の系統図は次のとおりであります。
当社グループにおける主要製品は次のとおりであります。
なお、事業の内容を系統的に分かりやすく説明するための事業部門等の区分が困難なため、事業部門等による区分
は明示しておりません。
品目区分
主要製品
クリーンルーム
パネル式クリーンルーム
内装材
クリーンルーム機器
エアーシャワー クリーンエアーオーブン パスボックス クリーン保管庫
エアーカーテン フィルターユニット SS-エアーシャワー
食品用エアーシャワー パッケージ式クリーンユニット
保冷庫用エアーカーテン クリーンハンドドライヤー クリーン手洗乾燥機
クリーンブース
アルミ製クリーンブース 鋼板製クリーンブース
SS-MAC EC-MAC サーマルクリーンチャンバー
SS-クリーンブース
クリーンベンチ
標準クリーンベンチ
SS-クリーンベンチ
バイオロジカリー機器
バイオクリーンベンチ 無菌手術ユニット 安全キャビネット 無菌治療室
アイソレーター 動物飼育キャビネット 吸引捕虫器(バグキーパー)
クリーンパーティション
据付・保守サービス
機器搬入据付
その他の製品
ドラフトチャンバー
クリーンサプライ商品
無塵衣
簡易クリーンベンチ
保守サービス
ワイパー
卓上クリーンベンチ
空気清浄機器部品
HEPAフィルター
クリーンクリーニング(注)
クリーンペーパー
防護服
(注)クリーンクリーニングは2025年12月19日をもって事業を終了しました。
5/100
アスベスト対策機器
マスク
EDINET提出書類
日本エアーテック株式会社(E02421)
有価証券報告書
4【関係会社の状況】
名称
資本金また
は出資金
(千米ドル)
住所
主要な事業の内容
議決権の所有割
合または被所有
割合(%)
(関連会社)
蘇州安泰空気技術
有限公司(中国)
中国江蘇省蘇州市
5,000
クリーンエアー
機器の製造・販売
関係内容
クリーンエアー機
器製造における技
術供与及び一部機
器の製造委託
25.0
5【従業員の状況】
(1)提出会社の状況
2025年12月31日現在
従業員数(人)
473
平均年齢(歳)
平均勤続年数(年)
平均年間給与(円)
15.05
6,558,984
42.06
(7)
(注)1.当社は単一セグメントに属する事業を営んでいるため、セグメント別の従業員数は省略しております。
2.従業員数は就業人員であり、臨時雇用者数は、年間の平均人員を( )外数で記載しております。
3.平均年間給与は、賞与及び基準外賃金を含んでおります。
(2)労働組合の状況
労働組合は結成されておりませんが、労使関係は円満に推移しております。
(3)管理職に占める女性労働者の割合、男性労働者の育児休業取得率及び労働者の男女の賃金の差異
当事業年度
管理職に占める
男性労働者の
女性労働者の割合(%)
育児休業取得率(%)
(注)1
(注)2
2.4
87.5
労働者の男女の賃金の差異(%)
(注)1(注)3
全労働者
68.3
補足説明
正規雇用労働者
臨時雇用者
72.2
−
−
(注)1.「女性の職業生活における活躍の推進に関する法律」(平成27年法律第64号)の規定に基づき算出したもの
であります。
2.「育児休業、介護休業等育児又は家族介護を行う労働者の福祉に関する法律」(平成3年法律第76号)の規
定に基づき、「育児休業、介護休業等育児又は家族介護を行う労働者の福祉に関する法律施行規則」(平
成3年労働省令第25号)第71条の6第1号における育児休業等の取得割合を算出したものであります。
3.「労働者の男女の賃金の差異」について、賃金制度・体系において性別による差異はありません。男女の賃
金の差異は主に男女間の管理職比率及び雇用形態の差異によるものであります。
なお、当事業年度において臨時雇用者の区分に男性の労働者はおりません。
6/100
EDINET提出書類
日本エアーテック株式会社(E02421)
有価証券報告書
第2【事業の状況】
1【経営方針、経営環境及び対処すべき課題等】
当社の経営方針、経営環境及び対処すべき課題等は以下のとおりであります。
なお、文中の将来に関する事項は、当事業年度末現在において当社が判断したものであります。
(1)経営方針
当社は、2022年12月に制定した「きれいな空気で、未来を支える。」とのパーパスのもと、当社のクリーンエ
アーシステム技術は自らの研究・実験に基づくことを主とし、創業以来蓄積された技術力により顧客ニーズに合致
した製品を連続的に創造する専業メーカーとして、収益性を維持しつつ企業規模の拡大を図ります。従業員の創造
性を第一とし自主性を重んじております。また、ESG・SDGs関連施策に取組み環境側面・社会側面の双方から持続
可能な社会と当社の持続的成長の実現を目指し、情報開示を充実させ企業価値を継続的に向上させてまいります。
(2)経営戦略等
当社は、クリーンエアーシステムの専業メーカーとして、半導体・電子工業分野及びバイオロジカル分野の双方
に多数の製品及び設計・施工技術を有しております。現在、微粒子・菌・ウイルス等を必要とされるレベルまで除
去又は制御する設備機器は、分野を問わず幅広く導入されており今後益々その需要と必要分野は拡大しておりま
す。
そのような状況において当社では2024年度から2028年度における中期経営方針を以下のように定めております。
方針1は、標準・準標準品の売上比率の向上であります。2028年までの目標を60%から80%に引き上げました。
従来は45%前後でありましたが、2025年度は43%であり目標とは開きが有ります。省エネルギー性能を特徴とし
て、標準的な製品の売上拡大に取組んでまいります。
方針2は、差別化であります。単なる価格競争に陥らないよう競合他社との差別化をハード面、ソフト面共に創
造性を追求することにより脱価格競争に取組み、ブランド価値の向上も図っております。
方針3は、グローバル化であります。東南アジアの各提携会社との連携強化を図り、その後欧米への展開を目標
としております。
方針4は、新市場進出への積極的な取組みであります。クリーンエアーシステム(空気清浄化)を必要とする市
場が電子分野・バイオロジカル分野共に年々拡大中ですので、B to Bを原則とし各方面の代理店と関係を深め、拡
販してまいります。
方針5は、株主還元及び配当に関する基本方針の変更であります。従来は配当性向30%を基本としておりました
が、株主還元を重要課題と捉え、PBRの向上を視野に本計画期間中の総還元性向を65%以上といたしました。2025年
度は配当を1株当たり55円とし自己株式取得を188,400株実施した結果、総還元性向は68.9%となりました。
方針6は、サステナビリティ経営への取組みであります。「きれいな空気で、未来を支える。」とのパーパスの
もと、各種産業及び技術開発に必要なクリーンエアーシステム技術やノウハウを生かした事業活動によって、環
境、従業員、取引先、社会、株主・投資家に関する社会課題の解決に貢献し、持続可能な社会と当社の持続的成長
の実現を目指すものです。さらに、2024年12月には「ありたい姿」を策定し、人的資本向上への注力及び人材育成
と環境整備を実施すると共に、SDGs の各目標への具体的な貢献及び温室効果ガス削減に取組んでおります。
7/100
EDINET提出書類
日本エアーテック株式会社(E02421)
有価証券報告書
(3)経営環境
当事業年度における我が国の経済は、堅調な企業業績を背景とした積極的な設備投資及び雇用・所得環境の改善
やインバウンド需要の拡大により景気は緩やかな回復基調を維持しております。一方で、中東及びウクライナ情勢
や米国の通商政策、対中関係の悪化等による地政学的リスクの高まり、物価や人件費高騰に伴う影響等が懸念さ
れ、先行き不透明な状況が継続しております。
当社における事業環境は、世界的にAIに使用される半導体の需要増加に対応し半導体分野への国内外投資が継続
しており、全体として半導体関連の製造装置及び材料・電子部品産業におけるクリーンエアーシステムの設備投資
が継続しております。また、自動車産業においても継続して車載用蓄電池関連の設備投資が継続しました。一方、
バイオロジカル分野においては、超高齢化が進む国内にて健康寿命を高めるための製薬・再生医療関連の投資は堅
調に推移しており、研究用及び再生医療用クリーンルームの他、医薬品製造工場における設備投資が堅調でした。
(4)優先的に対処すべき事業上及び財務上の課題
当社は2024年11月13日に開示しました「資本コストや株価を意識した経営の実現に向けた当社の対応について」
に記載のとおり、事業成長と収益性の向上を図る各種方策に取組み、ROE、PER双方の改善によりPBR向上を目指して
おります。中期経営計画(最終年度 2028年12月期)を推進し、その結果としてROE7%以上とすることを目標とし
ております。その施策の一環として、2024年11月13日開催の取締役会決議に基づき、2025年1月1日から同年3月
31日までに当社普通株式を33,100株、取得金額35百万円にて自己株式の取得を実施し、2025年11月14日開催の取締
役会決議に基づき、同年11月17日から同年12月30日までに、同155,300株、同194百万円にて自己株式を取得しまし
た。また、2025年3月27日の発行決議による取締役(監査等委員である取締役及び社外取締役を除く。)に対する
譲渡制限付株式報酬及び従業員持株会向け譲渡制限付株式インセンティブとして、各々同年4月25日に7,000株及び
同年6月20日に14,820株の自己株式を処分しました。総還元性向は、2025年度の配当金総額5億49百万円(1株当
たり55円)を加え、68.9%となりました。今後とも中期経営計画期間(最終年度 2028年12月期)中は、総還元性向
目標値の65%以上を維持する方針です。
(5)経営上の目標の達成状況を判断するための客観的な指標等
当社の継続的な成長への戦略は、以下の3点です。① 継続成長が見込まれる半導体を主とした電子工業分野需要
の取込み。② CO2削減を目指すEV等への投資及び省エネルギー化推進需要の取込み。③ 顧客ニーズを捉えた潜在的
需要の開拓(フィルター交換、定期検査等)。具体的には、市場に必要とされる新製品の開発に注力するととも
に、生産性の向上やサービス業務の拡大に取組んでおります。客観的な指標として、「営業利益」及び「経常利
益」を重要な経営指標として位置付けており、2028年12月期の「売上高」の目標180億円に対する「営業利益」につ
いては14億円(売上高比7.8%)以上を目標とし、「経常利益」については18億円(売上高比10.0%)以上を目標とし
ております。さらに、2024年11月に「資本コストや株価を意識した経営の実現に向けた当社の対応について」初版
を公表し、2025年8月14日にアップデート版を公表しました。ROE、PER双方を改善することによりPBRの向上を目指
し、中期経営計画(最終年度 2028年12月期)を推進し、その結果としてROE7%以上とすることを目標としており
ます。
8/100
EDINET提出書類
日本エアーテック株式会社(E02421)
有価証券報告書
2【サステナビリティに関する考え方及び取組】
(1)サステナビリティ共通
当社のサステナビリティに関する考え方及び取組みに関しては、以下のとおりです。なお、文中の将来に関する事
項は、当事業年度末現在において当社が判断したものです。
当社は、「きれいな空気で、未来を支える。」とのパーパスのもと、「サステナビリティ基本方針」を2022年に制
定しました。この方針に従って中期経営計画における目標及び方針を設定し、戦略的なサステナビリティの推進を図
ります。また、進捗のモニタリングを行い、PDCAサイクルを回していくことで、持続可能な社会の実現と企業価値の
向上を目指します。
「サステナビリティ基本方針」
当社は、「きれいな空気で、未来を支える。」とのパーパスのもと、各種産業及び技術開発に必要なクリーンエ
アーシステム技術やノウハウを生かした事業活動によって社会課題の解決に貢献し、持続可能な社会と当社の持続
的成長の実現を目指します。
環境
・地球温暖化防止に向けた技術開発、製品の省エネルギー化、省資源化を進めると共に、サプライチェーン全体を
通じた環境負荷の低減を図ります。
従業員
・従業員の健康と安全を企業成長の基盤と考え、従業員の多様性を尊重し、労働環境の整備に努め、創造と飛躍の
実現が可能な働き甲斐のある職場環境を実現します。
取引先
・顧客と協力会社(サプライヤー)などを尊重した適正な取引を通じて、当社の技術力を活用した良質な製品生産
と安定的な供給を継続し、取引先との信頼関係を構築します。
社会
・個人の人権と多様性を尊重し、人権侵害の加担への回避に取組みます。
・法令、社会規範、企業倫理を遵守します。
・顧客ニーズに合致する良い製品を継続的に開発し、顧客事業に貢献すると共に得られた利益により雇用も守りつ
つ納税義務を果たし、永続的な会社を目指し社会へ貢献します。
株主、投資家
・対話と情報開示を通じて公正かつ透明性の高い企業経営を実践し、企業価値の継続的な向上を目指します。
(ガバナンス)
当社では、代表取締役社長を委員長とし、外部有識者及び社内・社外取締役から構成されるサステナビリティ委
員会を設置し、サステナビリティ課題への取組み方針や重要課題の策定、目標の設定や達成に向けた活動の実施、
活動状況の確認及び結果等を審議し、取締役会へ報告する体制としております。サステナビリティ委員会を含む
コーポレート・ガバナンス体制の概要については、「第4 提出会社の状況」の「4.コーポレート・ガバナンス
の状況等 (1)コーポレート・ガバナンスの概要」を参照ください。
(リスク管理)
当社のリスク管理体制は、「リスク管理規程」を基本とし、取締役・従業員の行動指針として「企業行動基準」
及び「コンプライアンス基準」を設け、さらに「内部通報制度」を制定し、企業のリスク発生時に的確かつ迅速に
対処することを可能にし、違法行為や不法行為等発生の未然防止を図っており、各拠点、事業部門単位で事業リス
クの把握と管理を実施し、これを取締役会が監督する体制としております。
(戦略)
当社では、サステナビリティに関する全社的に重要な事項(課題)を、経営における重要な課題の一つと位置付
けております。サステナビリティ経営への取組みは当社の成長と同期させることが重要であると考えており、中期
経営計画の中でも、特に重点的に取組む領域として、「気候変動対策」及び「人的資本の強化」を設定しておりま
す。
(2)気候変動対策
(ガバナンス)
サステナビリティ委員会では、気候変動を含む、サステナビリティに関する基本方針や重要課題の策定、目標の
設定や達成に向けた活動の実施、活動状況の確認を行い、適宜取締役会への報告等を行っております。
当社では2023年2月に気候関連財務情報開示タスクフォース(TCFD:Task Force on Climate-related
Financial Disclosures)による提言(TCFD提言)への賛同を表明し、TCFD提言に準拠した気候関連財務情報開示
を行っており、当事業年度においてサステナビリティ委員会を計7回開催しております。
(戦略)
9/100
EDINET提出書類
日本エアーテック株式会社(E02421)
有価証券報告書
当社ではサステナビリティに関する全社的に重要な経営課題の中から、特に重点的に取組む領域として「気候変
動対策」を設定し、重要な「リスク」と「機会」を特定しました。
・当社における気候関連のリスクと機会
(リスク)
期
間
炭素税等、GHG排出抑制のための
価格制度導入
調達価格が上昇し、また、顧客からは当社が脱炭
素にさらに積極的に取組むことを要求される
短
期
GHG排出量測定及び削減の規制導入
あるいは顧客等からの要求の拡大
Scope3も含めたGHG排出量報告の対応コスト、及
び削減のための設備投資費用がかさむ
長
期
その他、政府方針等に起因した原材料
の価格上昇や供給逼迫
調達価格上昇及び安定供給が困難となるため、原
価上昇及び納品遅れの原因となる
中
期
技
術
脱炭素社会実現に向けた技術開発競争
の激化
他社の破壊的イノベーション技術により、当社製
品へのニーズが激減する
中
期
●
既製品の改良コスト、新製品の開発費が増加する
また、製品ごとの炭素排出量算定コストがかさむ
短
期
●
市
場
顧客の求める低炭素・省エネ性能基準
の拡大
脱炭素社会実現に向けた市場の変化の
中で、顧客が求める取引条件やニーズ
(取引形態、保証等)の変化
脱炭素社会への移行に必要な原材料や
部品等の需給逼迫
変化に追従できず、商機を喪失するだけでなく、
新規参入者に市場を奪われる
中
期
低炭素、省エネ製品製造のための部品等の安定調
達が困難となり、また、原価が上昇する
短
期
顧客/最終ユーザーの取引先選定基準
の変化
脱炭素化に向けた取組みが投融資判断
基準に含められることによる、証券市
場、投資家及び銀行からの関連するエ
ンゲージメントの強化
脱炭素化に向けた取組みと開示に消極的であると
顧客を喪失するおそれがある
短
期
対応できないと資本コストが増加し、対応に要す
る管理コストが増加する
短
期
要因
政
策
移行
リス
ク
評
判
会社と社員との関係の変化
極端な気温の上昇または低下
物理
的リ
スク
重
要
度
事業活動、戦略、財務への潜在的影響
項目
急
性
慢
性
極端な大雨や強風等、浸水、河川の氾
濫等
平均気温の上昇など気候の変化
脱炭素社会実現に向けた取組みが消極的である
と、社員が会社の将来性に不安を持ち、離職率が
増える
酷暑時には、屋外据え付け作業が停止する
空調設備が未整備の取引先の工場の操業停止のお
それがある
製品の運送中に樹脂材料が変形するおそれがある
大雨等異常気象による、主力工場の浸水による製
造停止、停電による生産停止、落雷によるサージ
による当社製品の故障、及び雹による輸送中の当
社製品の損傷のおそれがある
熱中症対策費用が増加し、また、工場や倉庫の冷
房費が増加する
気温や湿度上昇等により当社が納入した設備の性
能が出なくなるおそれがある
10/100
●
中
期
短
期
短
期
短
期
●
EDINET提出書類
日本エアーテック株式会社(E02421)
有価証券報告書
(機会)
項目
気候
関連
機会
期
間
要因
事業活動、戦略、財務への潜在的影響
資
源
より効率的な在庫管理と輸送手段の使
用
製
品
省エネ性能製品開発と拡販
GHG削減効果とともに、製品の輸送コストが削減
され、BCPの観点からの安定供給が実現できる
Scope3の削減に寄与し、顧客・当社ともにGHG削
減、これによる差別化によって業績向上や売上増
加が実現できる
製品差別化による業績向上や売上増加が実現でき
る
様々な産業が脱炭素化の取組みを進めることによ
る、当社製品のニーズ及び市場が拡大する
感染症リスクの拡大に対応した製品開
発と拡販
重
要
度
短
期
短
期
短
期
中
期
●
●
市
新たな市場への参入機会
場
レ
ジ
リ 事業継続マネジメントへの取組と重要 サプライチェーン全体のマネジメント整備によ
短
る、製品供給の安定化と他社との差別化が実現で
●
期
エ な部品の代替/多様化
きる
ン
ス
(注)「期間」については、短期:目標とする2025年を延期し2026年/中期:2030年/長期:2050年をそれぞれ想定
しております。
(リスク管理)
気候変動は当社経営に重大な影響(リスクと機会)を及ぼすものであることに加え、現在のみならず将来のリス
クであり、不確実性を伴い、また、外部環境の変化にも影響を受けます。従って、気候変動に係るリスクと機会は
サステナビリティ委員会において適宜見直しを行うこととしております。なお、サステナビリティ委員会の委員に
は、気候変動対策を専門とする外部有識者と社外取締役が含まれることから、気候変動の現状及び関連する外部環
境の変化に関する最新の情報と知見に基づくリスク管理が可能と考えております。
(指標及び目標)
当社では、移行リスクの評価指標としてGHG排出量(t-CO2)を設定し、評価を進めております。具体的には、
グローバルな温室効果ガス(GHG)排出量の算定基準であるGHGプロトコルに従い、2021年分からGHG排出量(Scope
1・2・3)の算定を開始しております。GHG排出量の算定をより精緻なものとするための取組みを進めており、
2024年には排出量算出方法の見直しを行いました。今後、自社工場への太陽光発電・蓄電設備の設置拡充を進める
とともに、GHG排出量削減に関する指標と目標を設定する予定です。
自社における活動においては 、GHG排出量削減を目指し再生可能エネルギーの導入等を推進しております。新設
工場には太陽光発電システム及び蓄電設備を導入しており、当期は草加多目的センターにも導入し2025年1月に稼
働を開始いたしました。今後、既存の工場にも随時同様の対応を行う計画です。また、販売する自社製品の省エネ
ルギー化の目標値や売上高に占めるGHG排出量の目標などを策定するとともに、省エネ効果の可視化を主目的とし
た製造におけるカーボンフットプリント(CFP)に関して、当業界で初めてエアーシャワーのカーボンフットプリン
トを算定し、2024年4月に対外発表を行いました。その後、2025年度にはフィルターユニット2機種のカーボン
フットプリントを算定し対外発表しております。売上高当り排出量につきましては、2021年度は売上高が過去最高
となったため、売上高当りのGHG排出量は低い値となっており、2022年度及び2023年度はほぼ同程度となっており
ます。2024年度は太陽光発電設備への投資効果によりGHG排出量が2023年度より減少したため、売上高当りの排出
量も減少しました。
2021年度
実績(t-CO2)
2022年度
実績(t-CO2)
2023年度
実績(t-CO2)
2024年度
実績(t-CO2)
Scope1排出量
287
297
293
280
Scope2排出量
736
784
873
793
Scope3排出量(注)2
179,277
279,086
231,879
215,153
合計排出量
180,300
280,167
233,045
216,226
売上高当り排出量(注)3
0.072
0.082
0.085
0.079
(注)1.上記排出量の算定に当たっては、2022年より株式会社日本能率協会コンサルティングの助言を受けており
ます。
2.Scope3 Category1の算出方法については、2021年度及び2022年度は金額ベースとしており、2023年度よ
り金額ベースと重量ベースの積算によるものに変更しております。
11/100
EDINET提出書類
日本エアーテック株式会社(E02421)
有価証券報告書
3.売上高当り排出量の算出方法については、売上高(百万円)に対して対象をScope1及びScope2として
GHG排出量を算出しております。
(3)人的資本の強化
(戦略)
当社では、「きれいな空気で、未来を支える。」とのパーパスのもと、各種産業及び技術開発に必要なクリー
ンエアーシステム技術やノウハウを生かした事業活動によって、環境、従業員、取引先、社会、株主・投資家に
関する社会課題の解決に貢献し、持続可能な社会と当社の持続的成長の実現を目指しております。本パーパスの
持続的な達成に向け、人材育成に関する方針及び社内環境整備に関する方針を定めております。
人材育成に関する方針(一部抜粋)
・「きれいな空気で、未来を支える。」というパーパスのもと、社員一人ひとりの創造性に重点をおいた人材育
成を目指し、能力発揮と成長の機会を提供します。
・自ら学び、考え、行動する人材の育成と、社員の一人ひとりのありたい姿を実現するため、成長の機会を提供
します。
・社員の経営参画意識を高め、社員と会社が成長する『成長と還元』への取組みを推進します。
社内環境整備に関する方針(一部抜粋)
・多様な人材の多様な働き方と、新しい発想をもつ人材の挑戦を支援します。
・人材の健康管理や健康増進に取組み、安全かつ安心して働くことができる職場環境を整備し推進します。
(取組み)
当社における当事業年度の取組みは以下のとおりです。
人材育成に関する施策
(A)人材育成及びスキルアップ
・マネジメントスキル研修、コンプライアンス研修等社内研修(継続実施)
e-learning等を活用し、個々の経験・知識に応じた学習機会を設定
・ビジネススキル研修等の外部講習会への参加(継続実施)
(B)従業員待遇向上
・昇給率を上場企業平均値と同等に設定(継続実施)
・決算賞与制度の導入(2023年度より)
(C)働き方改革
・夏季休暇として年間休日を2日増加(2023年度より)
・有給休暇計画的付与の導入による連続した休日の設定(2023年度より)
(D)福利厚生拡充
・従業員持株会向け譲渡制限付株式インセンティブ付与(2021年度より導入。累計発行総額 104百万円)
・福利厚生アウトソーシングサービス加入(2023年度より)
・団体3大疾病保障保険加入(2023年度より)
社内環境整備に関する施策
・事務所拡張及び移転(2025年度中部営業所移転)
・フリーワークエリアの設置(2024年度より)
・工場暑熱対策及び安全対策(継続実施)
・草加多目的センターの設置(2024年11月)
12/100
EDINET提出書類
日本エアーテック株式会社(E02421)
有価証券報告書
(指標及び目標)
当社は、サステナビリティを巡る課題への対応を行うことは持続的な成長と中長期的な企業価値の向上に資す
るものであると認識しております。人的資本に関する「指標と実績」は以下のとおりですが、「目標」について
は現時点では設定しておりません。今後は目標を設定の上、達成に向けて取組みを行ってまいります。
指標
2025年度実績
2024年度実績
管理職に占める女性
労働者の割合
2.4%
2.4%
男性労働者の育児休
業取得率
50.0%
87.5%
労働者の男女の賃金
差異
66.6%
68.3%
13/100
EDINET提出書類
日本エアーテック株式会社(E02421)
有価証券報告書
3【事業等のリスク】
有価証券報告書に記載した事業の状況、経理の状況等に関する事項のうち、経営者が提出会社の財政状態、経営成
績及びキャッシュ・フローの状況に重要な影響を与える可能性があると認識している主要なリスクは、以下のとおり
であります。
なお、文中の将来に関する事項は、当事業年度末現在において当社が判断したものであります。
(1)事業内容及び特定の業界への依存度が高いことについて
当社は、半導体、液晶等の電子工業分野及び医薬品工業、医療機関、食品工業等のバイオロジカル分野を対象に、
空気中の汚染制御に関する機器の製造、設置、販売並びにシステムのエンジニアリングを単一セグメントに属する事
業として行っております。それぞれの分野に占める割合は下表に記載のとおりであります。当社の業績は電子工業分
野及びバイオロジカル分野の国内外の設備投資動向に影響を受ける場合があります。
2023年12月期
販売分野
2024年12月期
2025年12月期
売上金額
構成比
売上金額
構成比
売上金額
構成比
(百万円)
(%)
(百万円)
(%)
(百万円)
(%)
電子工業分野
6,516
47.7
6,605
48.9
7,416
52.4
バイオロジカル分野
そ
合
の
5,890
43.2
4,912
36.3
5,224
36.9
他
1,239
9.1
2,000
14.8
1,510
10.7
計
13,646
100.0
13,517
100.0
14,151
100.0
(注)「その他」は最終顧客の分野が捕捉不能な物件の売上金額及び構成比を記載しております。
(2)競合について
当社製品については、他社との競合が発生します。当社としては基幹部品の内製化、代理店との関係強化、効率的
な資材調達や生産性の向上を図ること等で利益を確保する方針ですが、競合による当社製品の販売価格の下落等が当
社の業績に影響を与える可能性があります。
(3)品質管理・製造責任について
当社は、クリーンエアーシステムに関してはクリーンルームからクリーンルーム機器及びクリーンサプライ商品に
至るまで、幅広い製品を取扱っております。製造部門ではISO-9001による厳格な品質管理を実行し、顧客に納得して
頂ける製品作りを継続しております。
しかし、装置の不具合や使用部品の不良等が原因で、顧客の生産や実験に支障をきたす等、顧客に損害が発生する
可能性があります。現時点までに製造物責任及び瑕疵担保責任に関する訴訟は生じておりませんが、そのような事態
が発生した場合、製品への信頼性低下や損害賠償請求等により業績に影響を及ぼす可能性があります。
(4)災害等について
地震等の自然災害や新興感染症の流行、事故、テロ等により、当社の生産拠点や設備等が損害を受ける可能性及び
営業及び生産活動が中断する可能性があります。さらに原材料等の供給不足が生じた場合、電力・物流・人の移動を
はじめとする社会機能が低下した場合等には、当社の操業が中断し売上高が減少する可能性、生産拠点等の修復又は
代替のために多額な費用と時間を要する可能性があります。
(5)大口案件について
電子工業や医薬品工業の生産施設等に係る大口案件については、仕様の複雑さ、頻繁な仕様変更及び強い値下げ圧
力等が予想されることから、受注に際しての可否判断から受注後の採算管理に至るまで、慎重に対応しております。
受注に際しては、過去の類似案件を調査の上、取締役が会議において、想定される仕様、受注の可否及び提出する
見積り等について検討を行います。
また、受注した大口案件については、リストアップの上、取締役会において原価、工事の進捗、売上計上時期等を
適宜共有しています。しかしながら、当社の想定を超えて費用が発生し、それに見合う値上げが困難な場合には、当
社の業績に影響を与える可能性があります。
14/100
EDINET提出書類
日本エアーテック株式会社(E02421)
有価証券報告書
(6)標準品と特殊品について
当社は創業以来、特殊品の製造に注力してまいりました。様々な顧客からの要望に応える中で、新製品を開発し、
技術力を高めてきた一方で、生産効率の低さや、不良の発生のしやすさ等が問題点として認識されてきました。
当社では、顧客要望に基づき頻繁に改良を実施することで標準品比率の向上を目指すと同時に、特殊品に関して
は、技術向上等の観点から選別受注を行うことにより利益率の確保を目指していますが、当社の計画どおりに標準品
の比率が高まらない場合や、特殊品の受注に際して想定どおりに選別できない場合には、当社の業績に影響を与える
可能性があります。
(7)協力会社について
当社製品の製造においては、受注量の変動への柔軟な対応や効率的な人員体制の維持の観点から、適宜協力会社を
活用しております。特に板金と塗装の工程については、大部分を協力会社に依頼していますが、当該工程の約1割を
社内で製作することにより、原価・工数・技術を把握すると同時に、品質の維持・向上を図っております。また、協
力会社に対しては、定期的に品質の確認を行い、情報の共有に努めています。さらには、内製化の増強や新規の協力
会社の開拓に絶えず注力することにより、不測の事態による製造への影響の抑制を図っております。
しかしながら、資材コストの急騰や労務費の上昇、また協力工場の人手不足による生産減少等の発生により外注費
が増加し、これらを製品販売価格に転嫁することが困難な場合には、当社の業績に影響を与える可能性があります。
(8)人員体制について
当社では、小規模な組織による効率的かつ柔軟な運営を基本として、要員計画を策定・実施しています。現在のと
ころ、特殊品への対応のため、技術部及びサービスセンター(搬入据付、保守サービス等)では、生産量に見合った
人員を確保していますが、特殊品の選択受注、標準品の販売促進、新製品の開発による市場占有率の向上及び生産性
の向上等により、人員増加を抑制していく方針です。
今後、当社の要員計画の想定を超えて特殊品の受注量が変動し、人員数に過不足が生じた場合には、当社の業績に
影響を与える可能性があります。
(9)取引先の信用リスクについて
当社の販売は、ルートセールスを基本とし、建築設備会社、装置メーカー等への直接販売する場合があります。当
社では、与信管理を徹底することにより、不良債権の発生を極力減らしていますが、これらの販売先で急激な収益状
況や財政状況の悪化等が発生し、売掛債権等の回収が困難となった場合には、当社の業績に影響を与える可能性があ
ります。
(10) 保有資産について
保有する有価証券、不動産等について、時価の下落により減損処理が必要になった場合には、当社の業績に影響を
与える可能性があります。
(11) 退職給付制度について
当社の退職給付費用及び債務は、割引率等数理計算上で設定される前提条件や年金資産の期待収益率に基づいて算
出されておりますが、国内外の株式市場や債券市場が低迷した場合、年金資産の価値が減少し、年金に関する費用の
増加や追加的な年金資産の積み増し等が必要となります。このような状況となった場合には、当社の業績に影響を与
える可能性があります。
(12) 施工中における人的災害及び工事災害について
工事の安全衛生や品質管理には万全を期しておりますが、施工中の災害又は事故により損害賠償等が発生する可能
性があります。不測の事故に備えて保険に加入しておりますが、多額の損害賠償金が発生した場合には、当社の業績
に影響を与える可能性があります。
(13) 情報セキュリティについて
自社にて利用する社内システム等においては、個人情報、顧客情報等を取り扱いますが、コンピュータウイルスの
侵入や技術的、人為的な要因により情報の漏洩、破壊等を引き起こす可能性があり、これらの事象が発生した場合に
は、当社の業績に影響を与える可能性があります。
(14) コンプライアンス、内部統制について
当社では、法令遵守の徹底を図り内部統制システムの強化に努めております。しかしながら、法令違反が発生した
り、構築した内部統制システムが十分でなかった場合には、当社の社会的な信用の著しい低下、法令に基づく処罰な
いし、法令遵守のための追加的な費用の発生等により、当社の業績に影響を与える可能性があります。
15/100
EDINET提出書類
日本エアーテック株式会社(E02421)
有価証券報告書
(15) 知的財産権について
当社は、研究開発に力を入れており、知的財産権の申請取得に注力しております。しかし、申請は日本国内が主で
あり海外への申請は多くはありません。従って、海外において当社の知的財産を用いて類似した製品を製造すること
を効果的に阻止できない可能性があります。一方、当社が認識し得ない知的財産が存在し、当社が当該知的財産を無
断で使用した場合には、当社が訴訟において当事者となりうる可能性があります。
これらの状況が生じた場合には、権利を侵害されたことによる損害や逸失利益、訴訟に係る費用等を通じて、当社
の業績に影響を与える可能性があります。
(16) 使用部品の調達について
当社は、製品を構成する鋼板材・送風機・フィルター類・半導体制御基板等の電気部品及び樹脂製部品等すべての
部品及び原材料を外部供給者から調達しており、採用する部品の選定や仕入先の決定は、安定供給能力や事業継続計
画の有無等の総合的な評価により行っております。また、仕入先との長期的な信頼関係の構築、顧客への安定的な製
品供給を実現するための戦略的な在庫の積み増し、部品選定において仕入先を複数にすることにより置換え可能とす
る等、部品の調達問題に起因する影響を最小限に抑える管理体制を構築しております。しかしながら、部品の市場需
給の逼迫、仕入先の事業の統合や売却等による業界再編や生産撤退、又は事故や自然災害等の影響により供給が逼迫
した場合、一定期間において当社における生産の停止、販売の遅延等が生じ、当社の業績に影響を及ぼす可能性があ
ります。
(17) 気候変動について
気候変動は、国・地域を超えてグローバルに影響を与える問題であり、政策・技術・市場及びステークホルダーか
らの要請・評判等の「移行リスク」及び極端な気温変化や大雨等の異常気象に伴う「物理的リスク」が想定されま
す。このようなリスクに対して、迅速な事業再開及び被害の最小化を図るため事業継続マネジメント(BCP)の構築
に取組んでおりますが、それらのリスクの顕在化により当社の業績に影響を及ぼす可能性があります。
16/100
EDINET提出書類
日本エアーテック株式会社(E02421)
有価証券報告書
4【経営者による財政状態、経営成績及びキャッシュ・フローの状況の分析】
(1)経営成績等の状況の概要
当事業年度における当社の財政状態、経営成績及びキャッシュ・フローの状況の概要は次のとおりであります。
① 財政状態及び経営成績の状況
当社における事業環境は、世界的にAIに使用される半導体の需要増加に対応し半導体分野への国内外投資が継続
しており、全体として半導体関連の製造装置及び材料・電子部品産業におけるクリーンエアーシステムの設備投資
が継続しております。また、自動車産業においても継続して車載用蓄電池関連の設備投資が継続しました。一方、
バイオロジカル分野においては、超高齢化が進む国内にて健康寿命を高めるための製薬・再生医療関連の投資は堅
調に推移しており、研究用及び再生医療用クリーンルームの他、医薬品製造工場における設備投資が堅調でした。
営業面におきましては、販売代理店向けの製品説明会をウェビナー方式にて6月17日に実施し、全国の電子・バ
イオ分野の代理店へ配信し多くの方々に視聴していただきました。展示会についても積極的に取組み、「第11回イ
ンターフェックスWeek 大阪(2月)」、「FOOMA Japan2025(6月)」及び「インターフェックスジャパン2025
(7月)」に出展し、バイオロジカル分野への拡販を行っております。さらに半導体・電子分野では、「[九州]半
導体産業展(10月)」及び「SEMICON JAPAN 2025(12月)」に出展し、新製品として同年11月に「クリーンルーム
対応ロボット掃除機」を発表しました。なお、2025年12月19日をもってクリーンクリーニング事業から撤退しまし
た。事業の選択と集中により、クリーンエアーシステム関連装置の製造販売を軸として各種施策を進めて参りま
す。
生産面におきましては、生産効率向上を最優先課題として取組んでおります。2024年12月竣工の草加多目的セン
ターは、主力工場である草加工場の物流効率向上等に寄与しております。2025年8月に草加工場の隣地(駐車場、
土地面積1,628㎡) を自己資金にて取得しました。カーボンニュートラルへの追加対応としては、太陽光発電・蓄
電池設備(取得金額31百万円)を2025年1月に草加多目的センターへ設置しました。また、2025年3月には赤城ス
マートファクトリー第2工場(仮称)の建設工事契約を締結しました。赤城スマートファクトリー(群馬県桐生
市)敷地内に組立工場兼倉庫(床面積 8,680㎡)を建設するもので、総工費16億円(2026年9月竣工予定)を見込
み、機器生産能力増強及び倉庫賃借料削減を目標としております。
製品別の販売状況は、「クリーンルーム」の案件数が増加し工事が想定より順調に進捗しました。また、「エ
アーシャワー」、「安全キャビネット」等の販売が堅調であったため「据付・保守サービス」も増加しました。一
方で、「パスボックス」が減少しましたが、全体では増収となりました。
収益面におきましては、生産効率の向上及び原価低減に加え販売価格の改定により全般的なコスト増加分の回収
に努めた結果、「クリーンルーム機器」等の利益率が向上し、営業利益、海外からの配当金等を加えた経常利益は
いずれも前期比増加となりました。
以上の結果、当事業年度における業績は、売上高141億51百万円(前期比4.7%増)、営業利益11億63百万円(同
6.0%増)、経常利益16億6百万円(同5.1%増)、当期純利益は11億31百万円(同0.5%減)となりました。
17/100
EDINET提出書類
日本エアーテック株式会社(E02421)
有価証券報告書
② キャッシュ・フローの状況
当事業年度末における現金及び現金同等物(以下「資金」という。)の残高は、前事業年度末に比べ10億57百万
円増加し、32億49百万円となりました。
各キャッシュ・フローの状況は次のとおりであります。
(営業活動によるキャッシュ・フロー)
当事業年度の営業活動において得られた資金は、16億25百万円(前年同期は6億67百万円の支出)となりまし
た。主な内訳は、税引前当期純利益15億95百万円となります。
(投資活動によるキャッシュ・フロー)
当事業年度の投資活動において使用した資金は、9億円(前年同期比16百万円の支出増)となりました。主な内
訳は、有形固定資産の取得による支出9億67百万円となります。
(財務活動によるキャッシュ・フロー)
当事業年度の財務活動において得られた資金は、3億24百万円(前年同期は9億64百万円の支出)となりまし
た。主な内訳は、長期借入れによる収入10億円、配当金の支払額5億5百万円及び自己株式の取得による支出2億
30百万円となります。
③ 生産、受注及び販売の実績
a.生産実績
区分
金額(千円)
前年同期比(%)
クリーンルーム
1,977,601
152.1
クリーンルーム機器
4,582,197
98.8
クリーンブース
2,139,433
83.9
クリーンベンチ
193,624
73.4
バイオロジカリー機器
1,206,310
111.4
据付・保守サービス
3,267,337
99.4
513,546
103.6
13,880,051
101.9
その他の製品
計
(注)金額は販売価格で表示しております。
b.商品仕入実績
区分
クリーンサプライ商品
計
金額(千円)
前年同期比(%)
264,031
96.2
264,031
96.2
18/100
EDINET提出書類
日本エアーテック株式会社(E02421)
有価証券報告書
c.受注実績
区分
受注高(千円)
前年同期比(%)
受注残高(千円)
前年同期比(%)
クリーンルーム
1,365,598
76.0
389,955
38.9
クリーンルーム機器
4,112,857
90.1
1,582,348
91.7
クリーンブース
2,447,406
115.0
802,156
110.5
クリーンベンチ
196,168
78.0
57,256
78.5
バイオロジカリー機器
1,187,699
89.8
488,189
93.7
据付・保守サービス
3,357,408
101.8
1,066,487
106.8
406,605
91.1
206,557
75.5
13,073,743
94.7
4,592,951
86.3
299,554
82.1
31,143
38.1
小計
299,554
82.1
31,143
38.1
合計
13,373,297
94.3
4,624,094
85.6
製品
その他の製品
小計
商品
クリーンサプライ商品
(注)金額は販売価格で表示しております。
d.販売実績
区分
金額(千円)
前年同期比(%)
製品
クリーンルーム
1,977,651
153.0
クリーンルーム機器
4,256,027
95.8
クリーンブース
2,371,013
97.2
クリーンベンチ
211,830
91.1
バイオロジカリー機器
1,220,720
114.2
据付・保守サービス
3,289,906
102.4
473,810
94.9
13,800,958
104.6
350,142
106.6
小計
350,142
106.6
合計
14,151,101
104.7
その他の製品
小計
商品
クリーンサプライ商品
(注)上記の金額には、輸出販売額121,459千円を含んでおります。
19/100
EDINET提出書類
日本エアーテック株式会社(E02421)
有価証券報告書
(2)経営者の視点による経営成績等の状況に関する分析・検討内容
経営者の視点による当社経営成績等の状況に関する認識及び分析・検討内容は次のとおりであります。なお、
文中の将来に関する事項は、当事業年度末現在において判断したものであります。
① 重要な会計方針及び見積り
当社の財務諸表は、我が国において一般に公正妥当と認められている会計基準に基づき作成されております。こ
の財務諸表の作成に当たりましては、決算日における資産・負債の報告数値及び報告期間における収益・費用の報
告数値に影響を与える見積り及び判断を行っております。過去の実績や状況に応じて合理的と考えられる様々な要
因に基づき見積り及び判断を行っておりますが、実際の結果は、見積り特有の不確実性により、これらと異なる場
合があります。
なお、財務諸表の作成に当たって用いた会計上の見積り及び仮定のうち、重要なものは、第5[経理の状況]1
[財務諸表等](1)財務諸表[注記事項](重要な会計上の見積り)に記載のとおりであります。
② 当事業年度の経営成績等の状況に関する認識及び分析・検討内容
売上高
(百万円)
営業利益
(百万円)
経常利益
(百万円)
1株当たり
当期純利益
(円)
当期純利益
(百万円)
自己資本
当期純利益率
(%)
2025年12月期
2024年12月期
14,151
13,517
1,163
1,098
1,606
1,529
1,131
1,137
111.96
109.75
7.8
8.0
増減率(%)
4.7
6.0
5.1
△0.5
2.0
△0.2pt
a.当事業年度の業績全般の概況
当期の概況は、第2[事業の状況]4[経営者による財政状態、経営成績及びキャッシュ・フローの状況の分
析](1)経営成績等の状況の概要 ① 財政状態及び経営成績の状況に記載のとおりであります。当期は、再生医
療分野・電子工業関連分野向け「クリーンルーム」及び半導体、電子工業分野向けの「クリーンルーム機器」の販
売が増加し、売上高は前期比4.7%増となりました。収益面では、原価低減、各種経費節減及び販売価格改定による
全般的なコスト増加分の回収に努めた結果、「クリーンルーム」、「エアーシャワー」等の売上総利益率が向上
し、営業利益は、前期比6.0%増となりました。経常利益は、海外関係会社等からの受取配当金等が4億37百万円と
想定を上回った結果、前期比5.1%増となりました。当期純利益は、賃上げ促進税制による税額控除額が前期と比較
し減少したことにより法人税等が増加した為、わずかに減益となりました。
b.当事業年度の品目別の概況
区分
クリーンルーム
売
上
高(百万円)
2024年12月期
2025年12月期
増
1,292
1,977
減
685
売上総利益(百万円)
2024年12月期
2025年12月期
増
145
222
減
76
クリーンルーム機器
4,444
4,256
△188
1,044
1,085
40
クリーンブース
2,438
2,371
△67
674
662
△11
クリーンベンチ
232
211
△20
60
60
0
バイオロジカリー機器
1,068
1,220
151
281
259
△21
据付・保守サービス
3,212
3,289
76
1,153
1,185
32
その他の製品
製品小計
クリーンサプライ商品
合計
499
473
△25
88
59
△28
13,189
13,800
611
3,449
3,536
87
328
350
21
48
64
15
13,517
14,151
633
3,497
3,600
103
20/100
EDINET提出書類
日本エアーテック株式会社(E02421)
有価証券報告書
クリーンルーム
「クリーンルーム」は、再生医療分野、感染症研究関連及び電子分野の設備投資が活発であり、全体での売上高は
前期比53.0%の増加となりました。
クリーンルーム機器
半導体・電子分野の設備投資が活発であり「フィルターユニット」が増加し、「エアーシャワー」は堅調に推移し
ましたが「パスボックス」が減少したことにより、全体での売上高は前期比4.2%の減少となりました。
クリーンブース
各種「クリーンブース」が増加しましたが「サーマルチャンバー」が減少し、全体での売上高は前期比2.8%の減
少となりました。
クリーンベンチ
標準的な「クリーンベンチ」の売上が増加しましたが簡易的なものは減少し、全体での売上高は前期比8.9%の減
少となりました。
バイオロジカリー機器
製薬分野向け「安全キャビネット」、「薬塵除去装置」が増加し、全体での売上高は前期比14.2%の増加となりま
した。
据付・保守サービス
搬入・据付作業を伴う「エアーシャワー」、「クリーンブース」の売上が堅調であり、全体での売上高は前期比
2.4%の増加となりました。
その他の製品
「クリーンクリーニング」の事業撤退により、全体の売上高は前期比5.1%の減少となりました。
クリーンサプライ商品
クリーンルーム内で使用される「滅菌済み消耗品」、「棚及び作業台」等の売上が増加し、全体の売上高は前期比
6.6%の増加となりました。
③ 目標とする経営指標の達成状況等
当期業績は、2025年11月14日発表の業績予想値である売上高135億円に対し141億51百万円(予想値増減比4.8%
増)となりました。主な要因は、2026年度売上予想の工事案件が2025年度に取込まれ、「クリーンルーム」、「エ
アーシャワー」等の売上高が増加したことによるものです。その結果営業利益は、予想値10億50百万円に対し11億63
百万円(予想値増減比10.9%増)となりました。主な要因は、原価低減、各種経費節減及び販売価格改定による全般
的なコスト増加分の回収に努めたことによるものです。その結果、「クリーンルーム」、「エアーシャワー」等の売
上総利益率が向上いたしました。経常利益は同業績予想値の14億50百万円に対し、16億6百万円(予想値増減比
10.8%増)となりました。主な要因は、当第3四半期累計期間の実績において、海外関係会社等からの受取配当金が
4億37百万円と予想を上回ったことによるものです。当期純利益は同業績予想値の10億50百万円に対し、11億31百万
円(予想値増減比7.8%増)となりました。当期純利益の増加率が経常利益の増加率を下回った主な要因は、賃上げ
促進税制による税額控除額が前期と比較し減少したことによるものです。その結果、当期のROEは目標値の7%以上を
上回る7.8%となりました。今後とも本水準を維持してまいります。
21/100
EDINET提出書類
日本エアーテック株式会社(E02421)
有価証券報告書
④ 次期の見通し
2026年度における経営環境は、雇用・所得環境の改善と共に成長投資のための企業の設備投資が増加し緩やかな成
長が続くと予想しております。一方で、海外情勢の不確実性や為替・金利動向による影響については注視が必要と考
えております。また、気候変動及び環境問題の深刻化により、地球環境への配慮と持続的な企業成長を両立させるべ
くサステナビリティへの積極的な取組みが必要とされています。国内においては、少子高齢化に伴う労働需給バラン
スの変化と人件費の増加に加え、人的資本経営への対応が重要な課題となっております。
営業面においては、2025年3月に開所した北海道出張所及び北海道サービスセンターを活用し、同地区の顧客サー
ビスと売上増加をより一層図ります。
製造部門においては、本年9月稼働予定の赤城スマートファクトリー第2工場(仮称)を活用し、機器生産性の向
上及び売上の増加と賃借倉庫縮小・集約による輸送効率向上と輸送コストの削減を行います。また、脱炭素化への取
組みとして同工場及び伊勢崎工場へ太陽光発電・蓄電池設備を設置してまいります。
研究・新製品開発においては、省人化・省エネルギー化の推進及び特徴付けを継続し、オープンイノベーション等
の手法を用いて新規事業に挑戦する製品開発に取組みます。
サービスセンターにおいては、技術力継承の強化を図り、各拠点における協力会社増強と2025年に開所した北海道
及び中部サービスセンターに加え、本年は熊本出張所にもサ−ビスセンターを設置する計画であり、より一層顧客満
足度を高めてまいります。
2026年度に予定していた工事案件が想定より早く進行し2025年度の売上に取込まれたこと等により、通期の売上高
は140億円(当期比1.1%減)、営業利益は11億50百万円(当期比1.2%減)、経常利益15億円(当期比6.6%減)、当
期純利益は10億80百万円(当期比4.5%減)を見込んでおります。
(注)本業績見通しは、現在入手可能な情報から得られた当社経営者の判断に基づき作成しております。実際の業績
は今後様々な要因により本業績見通しと異なる可能性があります。
22/100
EDINET提出書類
日本エアーテック株式会社(E02421)
有価証券報告書
(3)当事業年度の財政状態
a. 資産、負債及び純資産の状況
(資産)
当事業年度末における総資産は198億75百万円であり、前事業年度末に比べ13億62百万円(前期比7.4%)の増加と
なりました。
流動資産は124億58百万円であり、前事業年度末に比べ5億92百万円(同5.0%)の増加となりました。主な内訳
は、現金及び預金9億58百万円の増加及び売上債権3億87百万円の減少となります。
固定資産は74億17百万円であり、前事業年度末に比べ7億70百万円(同11.6%)の増加となりました。主な内訳
は、草加工場隣接地の取得による土地2億96百万円の増加、赤城スマートファクトリー第2工場(仮称)建設等に対
する建設仮勘定6億15百万円の増加及び減価償却による減少となります。
(負債)
当事業年度末における負債は51億4百万円であり、前事業年度末に比べ8億93百万円(同21.2%)の増加となりま
した。
流動負債は39億55百万円であり、前事業年度末に比べ3億57百万円(同10.0%)の増加となりました。主な内訳
は、短期借入金2億円の増加及び1年内返済予定の長期借入金1億27百万円の増加となります。
固定負債は11億48百万円であり、前事業年度末に比べ5億35百万円(同87.2%)の増加となりました。主な内訳
は、長期借入金6億90百万円の増加及び退職給付引当金1億52百万円の減少となります。
(純資産)
純資産は147億71百万円であり、前事業年度末に比べ4億69百万円(同3.3%)の増加となりました。主な内訳は、
配当金5億7百万円の計上による減少、当期純利益11億31百万円の計上による増加及び自己株式2億30百万円の取得
による減少となります。
b. キャッシュ・フローの状況
2024年12月期
2025年12月期
増
減
営業活動によるキャッシュ・フロー
△667百万円
1,625百万円
2,293百万円
投資活動によるキャッシュ・フロー
△884百万円
△900百万円
△16百万円
財務活動によるキャッシュ・フロー
△964百万円
324百万円
1,288百万円
現金及び現金同等物に係る換算差額
現金及び現金同等物の増減額
現金及び現金同等物期末残高
15百万円
△2,500百万円
2,192百万円
7百万円
1,057百万円
3,249百万円
△7百万円
3,558百万円
1,057百万円
535百万円
1,554百万円
1,018百万円
借入金期末残高
当事業年度における各キャッシュ・フローの状況及び要因につきましては、第2[事業の状況] 4[経営者による財政
状態、経営成績及びキャッシュ・フローの状況の分析] (1)経営成績等の状況の概要 ② キャッシュ・フローの状況
の分析・検討並びに資本の財源及び資金の流動性に係る情報をご参照ください。
なお、キャッシュ・フロー関連指標の推移は以下のとおりです。
2022年12月期
2023年12月期
2024年12月期
2025年12月期
自己資本比率(%)
69.6
72.0
77.3
74.3
時価ベースの自己資本比率(%)
55.9
64.8
61.1
58.2
キャッシュ・フロー対有利子負債比率(年)
2.9
1.2
△0.8
1.0
インタレスト・カバレッジ・レシオ(倍)
111.5
284.2
△366.8
130.3
(注)自己資本比率:自己資本/総資産
時価ベースの自己資本比率:株式時価総額/総資産
キャッシュ・フロー対有利子負債比率:有利子負債/営業キャッシュ・フロー
インタレスト・カバレッジ・レシオ:営業キャッシュ・フロー/利払い
※ 各指標は、いずれも財務数値により算出しております。
※ 株式時価総額は、期末株価終値×期末発行済株式数(自己株式控除後)により算出しております。
※ 有利子負債は、貸借対照表に計上されている負債のうち、利子を払っている全ての負債(リース債務を除く)を対
象としております。
※ 利払いについては、キャッシュ・フロー計算書の利息の支払額を使用しております。
23/100
EDINET提出書類
日本エアーテック株式会社(E02421)
有価証券報告書
(4)資本の財源及び資金の流動性
当社の手元資金活用方法の基本的な考え方は、生産性向上を目的とした設備投資及び顧客ニーズに合致した製品開
発投資に備えることであり、事業運営上必要な流動性と資金の源泉を安定的に確保することを基本方針としておりま
す。短期運転資金は自己資金及び金融機関からの短期借入を基本としており、設備投資や長期運転資金の調達につき
ましては、金融機関からの長期借入を基本としております。
なお、当事業年度末における借入金及びリース債務を含む有利子負債の残高は15億66百万円となっております。ま
た、当事業年度末における現金及び現金同等物の残高は32億49百万円となっております。
24/100
EDINET提出書類
日本エアーテック株式会社(E02421)
有価証券報告書
5【重要な契約等】
(1)技術供与契約
契約締結先
内容
契約発効日
有効期間
クリーンエアーシステム技術供与
1985年1月10日
1986年1月9日以
後自動延長
富泰空調科技股份有限公司(台湾)
クリーンエアーシステム技術供与
1990年5月1日
1993年4月30日以
後自動延長
蘇州安泰空気技術有限公司(中国)
クリーンエアーシステム技術供与
2008年12月15日
2033年12月14日以
後自動延長
クリーンエアーシステム技術供与
2004年3月3日
2006年12月31日以
後自動延長
クリーンエアーシステム技術供与
2007年4月10日
2007年12月31日以
後自動延長
クリーンエアーシステム技術供与
2016年1月29日
2018年1月31日以
後自動延長
クリーンエアーシステム技術供与
2018年8月10日
2028年8月11日以
後自動延長
AIRTECH EQUIPMENT PTE.,LTD.
(シンガポール)
WOOLEE AIRTECH KOREA CO.,LTD.
(韓国)
PYRAMID AIRTECH PVT.LTD.(インド)
THELONG AIRTECH JOINT STOCK COMPANY
(ベトナム)
HEMAIR SYSTEMS INDIA LIMITED
(インド)
(注)1.上記については、個別の契約に基づきロイヤリティー及び利益配当金として受取っております。
ただし、AIRTECH EQUIPMENT PTE.,LTD.、WOOLEE AIRTECH KOREA CO.,LTD.、PYRAMID AIRTECH PVT.LTD.、
THELONG AIRTECH JOINT STOCK COMPANY、及びHEMAIR SYSTEMS INDIA LIMITEDにつきましては、ロイヤリ
ティーのみの一定額としております。
2.蘇州安泰空気技術有限公司は関連会社であります。
(2)販売提携契約
契約締結先
PEA GMBH(ドイツ)
内容
契約発効日
有効期間
製品の相互販売提携
2015年11月23日
2016年11月30日以
後自動延長
25/100
EDINET提出書類
日本エアーテック株式会社(E02421)
有価証券報告書
6【研究開発活動】
当事業年度の研究開発活動は、研究開発活動促進のため研究所員を7名体制としております。主な研究・開発とし
ては、送風機用各種DCモーター駆動ファンの開発を継続し、クリーンエアー機器のさらなる省エネルギー化を目標と
しております。更に、気流シミュレーションの研究については実用化レベルとなり、製品開発に活用しております。
新製品の開発・改良においては、標準的製品である「エアーシャワー」「エコノミークリーンユニット」及び「パッ
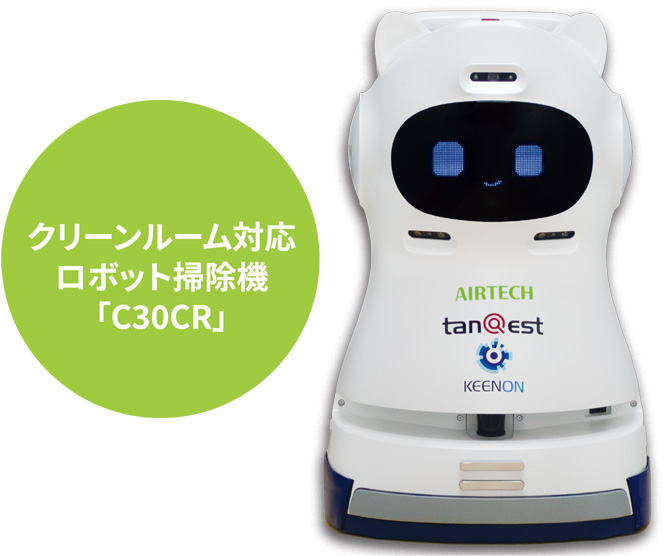
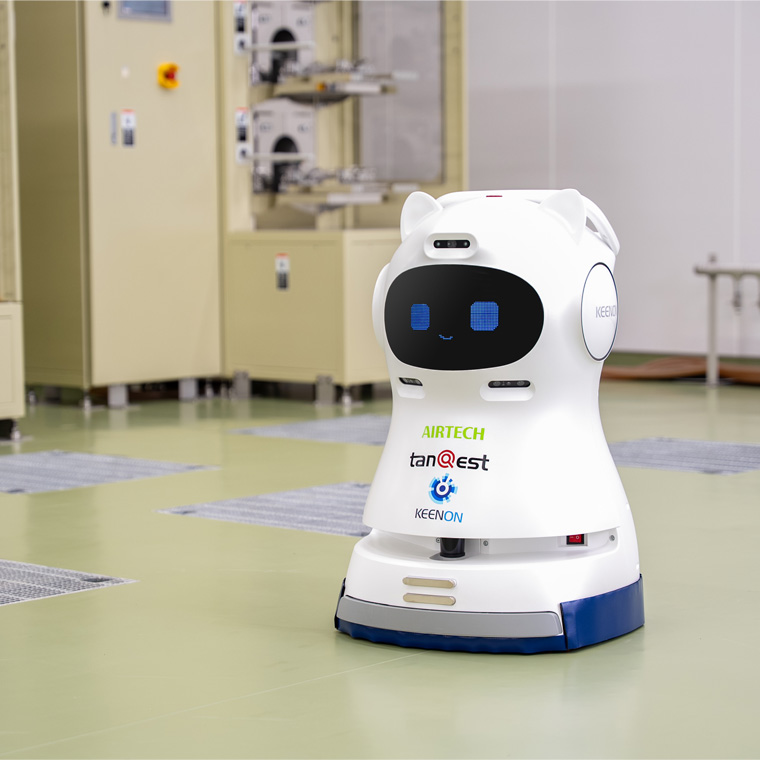
ケージ式クリーンユニット」等を上市するとともに、クリーンルーム清掃の効率化と省人化に寄与する「クリーン
ルーム対応ロボット掃除機(C30CR型)」を開発し、2025年11月に販売を開始しました。また、オープンイノベー
ションによる開発にも取組んでおり、新分野を開拓する方針です。今後とも、温室効果ガス(GHG)排出量削減に寄
与する省エネルギー機器への幅広い要望に対応し、より安全、より高精度、より高品質化された製品を提供してまい
ります。
1.研究・開発
A.各種DCモーター駆動ファンの開発(継続)
B.気流シミュレーションの研究(継続)
C.オープンイノベーションによるテーマ検討
D. HEPAフィルターの基礎研究(新JIS規格への対応)
2.研究論文発表
JACA(公益社団法人日本空気清浄協会)
・クリーン機器(エアーシャワー、ファンフィルターユニット)におけるカーボンフットプリントの算定と分析
・垂直方向式及び水平方向式クリーンブースにおける清浄度特性に関する研究
Asian Symposium on Contamination Control (ASCC)
・FFU自動制御システムを用いたクリーンルームに対する省エネ効果の検証
3.新製品
A.新型エアーシャワー(FAS18型)
B.エコノミークリーンユニット(MAC-ⅡA-153DC改良型)
C.パッケージ式クリーンユニット(PAU-80DC型、省エネタイプ)
D.両面操作型バイオクリーンベンチ(BCM-1305及び1915型)
E. コンパクトエアーシャワー(改良型)
F. クリーンルーム対応ロボット掃除機(C30CR型)
4.特許
・新規申請(7件)、取得(1件)
なお、当事業年度における研究開発費の総額は、132百万円となっております。
(注)当社は単一セグメントに属する事業を営んでいるため、セグメント別の研究開発活動については記載を省略し
ております。
26/100
EDINET提出書類
日本エアーテック株式会社(E02421)
有価証券報告書
第3【設備の状況】
1【設備投資等の概要】
当事業年度の設備投資の総額は987百万円であり、その主なものは赤城スマートファクトリー第2工場(仮称)
の建設(6億32百万円)及び草加工場隣接地の土地取得(2億96百万円)であります。
なお、当事業年度において重要な設備の除却、売却等はありません。
2【主要な設備の状況】
提出会社
帳簿価額(注)2
事業所名
(所在地)
設備の内容
建物及び構築
物(千円)
機械装置及び
車両運搬具
(千円)
土地(千円)
(面積㎡)
その他
(千円)
合計(千円)
従業員数
(人)
(注)3
本社
(東京都台東区)
会社管理
販売業務
286,994
943
269,169
(325.76)
2,961
560,068
63
(0)
草加工場
(埼玉県草加市)
クリーンエアー
システム機器
設計・製造
132,678
9,240
1,277,067
(8,080.29)
30,174
1,449,160
196
(2)
伊勢崎工場
(群馬県伊勢崎市)
クリーンエアー
システム機器
製造
195,986
171,373
375,810
(13,002.82)
9,541
752,711
66
(0)
加須工場
(埼玉県加須市)
クリーンエアー
システム機器
製造
217,157
51,132
249,300
(6,441.87)
6,062
523,652
46
(0)
越谷工場
(埼玉県越谷市)
クリーンエアー
システム機器
製造
399,086
22,881
182,756
(2,295.44)
1,346
606,071
18
(1)
赤城スマートファク
トリー
(群馬県桐生市)
エアーフィル
ター製造
418,277
81,334
168,770
(12,883.22)
4,667
673,048
17
(2)
草加多目的センター
(埼玉県草加市)
研修施設
倉庫
822,299
25,823
282,275
(1,749.99)
1,877
1,132,274
−
(注)1.当社は単一セグメントに属する事業を営んでいるため、セグメントの名称別の記載は省略しております。
2.帳簿価額のうち「その他」は、工具、器具及び備品であり、建設仮勘定は含まれておりません。
3.従業員数の(
)は臨時従業員数の年間の平均人員を外書で記載しております。
3【設備の新設、除却等の計画】
重要な設備の新設、除却等の計画は、以下のとおりであります。
(1) 重要な設備の新設等
事業所名
(所在地)
設備の
内容
赤城スマートファクト
リー第2工場(仮称)
(群馬県桐生市、赤城
スマートファクトリー
敷地内)
クリーンエア
ーシステム機
器製造工場、
倉庫
投資予定金額
(注)2
総額
(千円)
既支払額
(千円)
1,600,000
632,280
資金調達
方法
自己資金
及び
借入金
着手及び完了予定年月
着手
完了
2025年9月
2026年9月
完成後の
増加能力
−
(注)3
(注)1.当社は単一セグメントに属する事業を営んでいるため、セグメントの名称別の記載は省略しております。
2.上記金額には消費税等を含めておりません。
3.完成後の増加能力は合理的に算出することが困難なため、記載を省略しております。
(2) 重要な設備の除却等
該当事項はありません。
27/100
EDINET提出書類
日本エアーテック株式会社(E02421)
有価証券報告書
第4【提出会社の状況】
1【株式等の状況】
(1)【株式の総数等】
①【株式の総数】
種類
発行可能株式総数(株)
普通株式
16,000,000
計
16,000,000
②【発行済株式】
種類
事業年度末
現在発行数(株)
(2025年12月31日)
提出日現在発行数(株)
(2026年3月27日)
上場金融商品取引所名
または登録認可金融商
品取引業協会名
内容
普通株式
10,538,420
10,538,420
東京証券取引所
スタンダード市場
権利内容に何ら限
定のない当社にお
ける標準となる株
式であり、単元株
式数は100株であ
ります。
計
10,538,420
10,538,420
−
−
(注)発行済株式のうち86,920株は、譲渡制限付株式報酬として、金銭報酬債権合計100,628千円を出資の目的とする現
物出資により発行したものです。
28/100
EDINET提出書類
日本エアーテック株式会社(E02421)
有価証券報告書
(2)【新株予約権等の状況】
①【ストックオプション制度の内容】
該当事項はありません。
②【ライツプランの内容】
該当事項はありません。
③【その他の新株予約権等の状況】
該当事項はありません。
(3)【行使価額修正条項付新株予約権付社債券等の行使状況等】
該当事項はありません。
(4)【発行済株式総数、資本金等の推移】
年月日
2021年1月1日〜
2021年12月31日
(注)1
2022年1月1日〜
2022年12月31日
(注)1
2023年1月1日〜
2023年12月31日
発行済株式総
数増減数
(株)
発行済株式総
数残高(株)
資本金増減額
(千円)
資本金残高
(千円)
資本準備金
増減額
(千円)
資本準備金
残高(千円)
46,700
10,450,200
27,296
2,084,215
27,289
2,091,567
28,510
10,478,710
14,966
2,099,181
14,962
2,106,530
29,740
10,508,450
17,052
2,116,233
17,042
2,123,572
29,970
10,538,420
17,718
2,133,951
17,710
2,141,283
(注)2
2024年1月1日〜
2024年6月21日
(注)1
(注)1.発行済株式総数の増加、資本金の増加額及び資本準備金の増加額は、取締役(監査等委員である取締役及び社
外取締役を除く。)に対する譲渡制限付株式報酬としての新株式の発行、従業員持株会向け譲渡制限付株式イ
ンセンティブとしての新株式の発行及びストック・オプションの行使によるものであります。
2.発行済株式総数の増加、資本金の増加額及び資本準備金の増加額は、従業員持株会向け譲渡制限付株式インセ
ンティブとしての新株式の発行及びストック・オプションの行使によるものであります。
3.2024年6月21日以降、増減はありません。
29/100
EDINET提出書類
日本エアーテック株式会社(E02421)
有価証券報告書
(5)【所有者別状況】
2025年12月31日現在
株式の状況(1単元株式数100株)
区分
政府及び地
方公共団体
金融機関
金融商品取
引業者
その他の法
人
単元未満株
式の状況
(株)
外国法人等
個人その他
個人以外
計
個人
株主数(人)
−
8
29
83
31
27
9,704
9,882
−
所有株式数
(単元)
−
10,001
3,004
21,845
855
119
69,155
104,979
40,520
所有株式数の
割合(%)
−
9.53
2.86
20.81
0.81
0.11
65.88
100
−
(注)1.自己株式550,734株は、「個人その他」に5,507単元、「単元未満株式の状況」に34株、それぞれ含めて記載
しております。
2.「その他の法人」の欄には、証券保管振替機構名義の株式を、2単元含めて記載しております。
(6)【大株主の状況】
2025年12月31日現在
氏名又は名称
所有株式数
(千株)
住所
発行済株式(自己
株式を除く。)の
総数に対する所有
株式数の割合
(%)
エアーテックアシスト株式会社
埼玉県草加市吉町5-6-47
1,592
15.94
日本マスタートラスト信託銀行
株式会社(信託口)
東京都港区赤坂1-8-1
822
8.23
平和株式会社
兵庫県神戸市灘区新在家北町1-1-30
350
3.50
倉
東京都渋谷区
267
2.68
東京都港区
250
2.50
日本エアーテック従業員持株会
東京都台東区入谷1-14-9
242
2.43
岩崎
泰次
静岡県静岡市
148
1.48
平澤
知佳子
埼玉県草加市
122
1.22
平沢
真也
東京都荒川区
110
1.10
東京都中央区晴海1-8-12
108
1.08
4,015
40.20
近藤
剛進
芳世
株式会社日本カストディ銀行
(信託口)
計
−
(注)1.持株比率は自己株式(550,734株)を控除して計算しております。
2.日本マスタートラスト信託銀行株式会社の所有株式数には信託業務に係るものが188千株含まれております。
3.株式会社日本カストディ銀行の所有株式数には信託業務に係るものが89千株含まれております。
30/100
EDINET提出書類
日本エアーテック株式会社(E02421)
有価証券報告書
(7)【議決権の状況】
①【発行済株式】
2025年12月31日現在
区分
株式数(株)
議決権の数(個)
内容
無議決権株式
−
−
−
議決権制限株式(自己株式等)
−
−
−
議決権制限株式(その他)
−
−
−
完全議決権株式(自己株式等)
(自己保有株式)
普通株式
550,700
−
権利内容に何ら限定の
ない当社における標準
となる株式
完全議決権株式(その他)
普通株式
9,947,200
99,472
単元未満株式
普通株式
40,520
−
発行済株式総数
10,538,420
−
−
総株主の議決権
−
99,472
−
同上
1単元(100株)未満
の株式
(注)「完全議決権株式(その他)」の株式数の欄には、証券保管振替機構名義の株式が200株(議決権の数2個)含ま
れております。
②【自己株式等】
2025年12月31日現在
自己名義所有
株式数(株)
他人名義所有
株式数(株)
所有者の住所
日本エアーテック
株式会社
東京都台東区入谷
1-14-9
550,700
−
550,700
5.23
計
−
550,700
−
550,700
5.23
31/100
所有株式数の
合計(株)
発行済株式総数に
対する所有株式数
の割合(%)
所有者の氏名又は
名称
EDINET提出書類
日本エアーテック株式会社(E02421)
有価証券報告書
(8)【役員・従業員株式所有制度の内容】
① 当社取締役(監査等委員及び社外取締役を除く。)に対する譲渡制限付株式報酬制度の導入
当社は、2021年2月12日開催の当社取締役会において、取締役報酬制度の見直しを行い、譲渡制限付株式報酬制
度の導入を決議し、2021年3月29日開催の第48期定時株主総会において本制度に関する議案を決議いたしました。
当制度の詳細につきましては、第4[提出会社の状況] 4 [コーポレート・ガバナンスの状況等] (4)役員の
報酬等をご参照ください。
② 役員・従業員持株会制度の内容
イ.役員・従業員持株会制度の概要
当社は、役員及び従業員が自社株式を定期的に取得・保有し、財産形成の一助とすることを目的として、役員持
株会及び従業員持株会制度を導入しております。当該制度では、会員となった役員及び従業員から拠出金及び拠出
金に対する一定の奨励金を原資とし、定期的に株式の買付けを行っております。
ロ.役員・従業員持株会に取得させる予定の株式の総数
特段の定めは設けておりません。
ハ.当該役員・従業員株式所有制度による受益権その他の権利を受けることができる者の範囲
当社の役員及び従業員に限定しております。
③ 当社従業員持株会に対する譲渡制限付株式インセンティブ制度の導入
イ.当社従業員持株会に対する譲渡制限付株式インセンティブ制度の概要
当社は、当社従業員への福利厚生の増進策として譲渡制限付株式インセンティブ制度を導入しております。本制
度は、当社従業員に対し、日本エアーテック従業員持株会(以下、「本持株会」という。)を通じて当社が発行又
は処分する譲渡制限付株式の取得機会を提供することで、当社従業員の財産形成の一助とすることに加え、当社の
企業価値の持続的な向上を図るインセンティブを当社従業員に与えるとともに、当社従業員が株主の皆様との一層
の価値共有を進めることを目的としています。
ロ.本制度の概要
本持株会に加入資格のある当社従業員(以下、「対象従業員」という。)に対し、本制度に同意することを条件
として、当社から譲渡制限付株式付与のための特別奨励金として、金銭債権(以下、「本特別奨励金」という。)
が支給されます。対象従業員が本特別奨励金を本持株会に対して拠出し、本持株会が対象従業員から拠出された本
特別奨励金を当社に対して現物出資することにより、対象従業員は本持株会を通じて譲渡制限付株式としての当社
の普通株式の発行又は処分を受けることとなります。
32/100
EDINET提出書類
日本エアーテック株式会社(E02421)
有価証券報告書
2【自己株式の取得等の状況】
【株式の種類等】
会社法第155条第3号、第7号及び第13号に該当する普通株式の取得
(1)【株主総会決議による取得の状況】
該当事項はありません。
(2)【取締役会決議による取得の状況】
会社法第165条第3項の規定により読み替えて適用される同法第156条の規定に基づく取得
区分
株式数(株)
取締役会(2024年11月13日)での決議状況
価額の総額(千円)
450,000
600,000
当事業年度前における取得自己株式
318,200
394,154
当事業年度における取得自己株式
33,100
35,618
残存決議株式の総数及び価額の総額
98,700
170,226
当事業年度の末日現在の未行使割合(%)
21.93
28.37
−
−
(取得期間
2024年11月14日〜2025年3月31日)
当期間における取得自己株式
提出日現在の未行使割合(%)
21.93
28.37
(注)当事業年度前における取得自己株式のうち300,000株(価額の総額372,000千円)は、2024年11月14日に実施し
た東京証券取引所の自己株式立会外買付(ToSTNeT-3)による取得であります。
区分
株式数(株)
取締役会(2025年11月14日)での決議状況
価額の総額(千円)
180,000
200,000
当事業年度における取得自己株式
155,300
194,892
残存決議株式の総数及び価額の総額
24,700
5,107
当事業年度の末日現在の未行使割合(%)
13.72
2.55
当期間における取得自己株式
−
−
提出日現在の未行使割合(%)
13.72
2.55
(取得期間
2025年11月17日〜2025年12月30日)
(3)【株主総会決議又は取締役会決議に基づかないものの内容】
区分
当事業年度における取得自己株式
(注)
株式数(株)
価額の総額(千円)
1,527
149
当期間における取得自己株式
−
−
(注)従業員RSの無償取得(株式数1,407株)及び単元未満株式の買取り(株式数120株、取得価額の総額149千円)に
よるものであります。
33/100
EDINET提出書類
日本エアーテック株式会社(E02421)
有価証券報告書
(4)【取得自己株式の処理状況及び保有状況】
当事業年度
区分
当期間
株式数
(株)
処分価額の総額
(千円)
株式数
(株)
処分価額の総額
(千円)
引き受ける者の募集を行った
取得自己株式
−
−
−
−
消却の処分を行った取得自己株式
−
−
−
−
合併、株式交換、株式交付、会社分割に係る
移転を行った取得自己株式
−
−
−
−
その他(譲渡制限付株式報酬)
21,820
24,612
−
−
保有自己株式数
550,734
−
550,734
−
(注)当期間における保有自己株式数には、2026年3月1日からこの有価証券報告書提出日までの従業員RSの無
償取得及び単元未満株式の買取りによる株式は含まれておりません。
34/100
EDINET提出書類
日本エアーテック株式会社(E02421)
有価証券報告書
3【配当政策】
従来当社では、配当性向30%以上を基本としておりましたが、2023年12月22日に公表いたしました中期経営計画
(2024年〜2028年)の期間方針として、株主還元を重要課題と捉え配当性向を見直し、PBRの向上を視野に総還元性向
を65%以上とするよう変更いたしました。配当性向の比率により、配当と合わせて自社株式の購入により総還元性向
65%以上とする場合があります。
また、内部留保金につきましては適時に市場ニーズを踏まえた製品を提供する観点から研究開発と設備投資に資金
を振り向ける方針です。
当社は、中間配当と期末配当の年2回の剰余金の配当を行うことを基本方針としており、現状では期末配当に重点
をおいております。
これらの剰余金配当の決定機関は、期末配当については株主総会、中間配当については取締役会であります。
当社は、「取締役会の決議によって、毎年6月30日を基準日として中間配当をすることができる。」旨を定款に定
めております。
なお、当事業年度につきましては期末配当金として、年間1株当たり55円の配当を実施することを決定しました。
当事業年度に係る剰余金の配当は以下のとおりであります。
決議年月日
2026年3月27日
配当金の総額(千円)
549,322
定時株主総会
35/100
1株当たり配当額(円)
55
EDINET提出書類
日本エアーテック株式会社(E02421)
有価証券報告書
4【コーポレート・ガバナンスの状況等】
(1)【コーポレート・ガバナンスの概要】
① コーポレート・ガバナンスに関する基本的な考え方
当社は、世界に通用するクリーンエアーシステムの技術を確立し、株主、従業員、関連会社に利益を還元し社
会に貢献するという経営の基本方針の実現を目的としております。そのために適切な利益の安定確保に努め、収
益の向上を図り、会社を発展させてまいります。また、業績、技術力のみならず事業活動を行う上での株主の皆
様やお客様をはじめ、お取引先様、地域社会の皆様等あらゆるステークホルダーの皆様に対する社会的責任への
姿勢を含む取組みが企業価値の向上につながると考えております。これを実現するために企業統治に関し、企業
経営上の法令・倫理の厳守と透明性・公正性の向上、監視体制の強化及び仕組み作りを行い、組織・諸制度の改
善・改革に取組んでまいります。
<コーポレート・ガバナンスに関する基本方針>
1.当社は、全ての株主に対して、実質的な平等性を確保するとともに、株主の権利の確保と適切な権利行使に
資するため、速やかな情報開示を行ってまいります。また、少数株主にも認められている権利については、株式
取扱規程により、手続きを定め、その権利行使の確保に努めております。
2.当社は、持続的な成長と中長期的な企業価値向上のため、株主をはじめとする全てのステークホルダーとの
協働を実現するために、その行動規範となる倫理コードを定め、各ステークホルダーに対する基本姿勢を明確に
してまいります。
3.当社は、情報開示は重要な経営課題の一つであり、株主をはじめとするステークホルダーから理解を得るた
めに、適切な情報開示を行うことが不可欠であると認識しております。その認識を実践させるために、法令に基
づく開示以外にも重要と判断される情報についても、当社ウェブサイト等様々な手段により開示を行ってまいり
ます。
4.当社は、取締役会にて、企業戦略・中期計画等の方向性を決定しております。また、取締役会規程、業務分
掌規程及び職務権限規程等を定めており、取締役と各部署の職務と責任を明確にすることで経営幹部による適切
なリスクテイクを支える環境整備を行ってまいります。
5.当社は、持続的な成長と中長期的な企業価値向上を目的とし、株主及び投資家と積極的かつ建設的な対話を
行い、その意見や要望を経営に反映させ、当社を成長させていくことが重要と認識しています。そのため、IR担
当取締役を中心とするIR体制を整備し、当社の経営戦略や経営計画に対する理解を得るための株主及び投資家と
の対話の場を設けることに努めてまいります。
② 企業統治の体制の概要及び当該体制を採用する理由
企業統治の体制は、当社の事業規模と形態を踏まえ、健全性及び慎重かつ迅速な意思決定を目指すなかで、株
主をはじめとするステークホルダーへの説明責任を意識して、整備、運用するものと考えております。このよう
な考え方に基づき、当社は、2020年3月27日開催の第47回定時株主総会の決議に基づき、監査等委員会設置会社
に移行しました。これにより、取締役の職務執行の監査等を担う監査等委員を取締役会の構成員とすることで、
取締役会の監督機能を強化し、さらなる監視体制の強化を通じてコーポレート・ガバナンスの一層の充実を図っ
ております。
36/100
EDINET提出書類
日本エアーテック株式会社(E02421)
有価証券報告書
当社における会社の機関・内部統制等の関係は以下のとおりであります。
機関の名称
目的及び権限
構成員の氏名
議
取締役会
会社法第362条第2項で定める職務を行うこと
長
代表取締役社長平沢真也
構成員
取締役高木顕二
取締役東海林泰三
取締役北野雅之
社外取締役前川統一郎
取締役(監査等委員) 関根賢二
社外取締役(監査等委員) 山﨑淳司
社外取締役(監査等委員) 髙橋貢子
議
監査等委員会
会社法第399条の2第3項で定める職務を行うこ
と
長
取締役(監査等委員) 関根賢二
構成員
社外取締役(監査等委員) 山﨑淳司
社外取締役(監査等委員) 髙橋貢子
指名諮問委員会
取締役候補者の指名及び代表取締役等の選定・
解職に関する手続き等について、取締役会の諮
問に応じて審議を行い、取締役会へ答申するこ
と
委員長
社外取締役前川統一郎
委員
代表取締役社長平沢真也
社外取締役(監査等委員) 山﨑
37/100
淳司
EDINET提出書類
日本エアーテック株式会社(E02421)
有価証券報告書
報酬諮問委員会
サステナビリティ
委員会
取締役(監査等委員である取締役を除く。)の
報酬の決定に関する手続き等について、取締役
会の諮問に応じて審議を行い、取締役会へ答申
すること
委員長
代表取締役社長平沢真也
委員
社外取締役前川統一郎
社外取締役(監査等委員) 髙橋
クリーンエアーシステム技術を通じたサステナ
ビリティ経営の実現に向けた活動の統括及び推
進を行っており、基本方針や重要課題の策定、
目標の設定や達成に向けた活動の実施、活動状
況の確認及び結果等を、取締役会へ報告するこ
と
委員長
代表取締役社長平沢真也
委員
取締役高木顕二
取締役東海林泰三
取締役北野雅之
社外取締役前川統一郎
他 サステナビリティ委員長が任命するサ
ステナビリティ委員
貢子
(2025年12月期における取締役会、指名諮問委員会及び報酬諮問委員会の開催回数及び各構成員の出席状況)
開催回数及び出席状況
氏名
取締役会
指名諮問委員会
報酬諮問委員会
平沢
真也
100%(14/14回)
100%(5/5回)
100%(2/2回)
渡辺
直樹
100%(14/14回)
−
−
高木
顕二
100%(14/14回)
−
−
東海林
泰三
100%(14/14回)
−
−
雅之(注)1
100%(11/11回)
北野
前川
統一郎
100%(14/14回)
100%(5/5回)
100%(2/2回)
関根
賢二
100%(14/14回)
−
−
山﨑
淳司
92.9%(13/14回)
100%(5/5回)
−
髙橋貢子
100%(14/14回)
−
100%(2/2回)
(注)1.取締役北野雅之氏は、2025年3月27日開催の第52期定時株主総会において取締役に選任されており、出席状
況は就任後の回数を記載しております。
2.監査等委員会の開催回数及び各構成員の出席状況については、(3)監査の状況をご参照ください。
(2025年12月期における取締役会、指名諮問委員会及び報酬諮問委員会の具体的な検討内容)
ⅰ)取締役会
取締役会は、取締役の業務執行を監督するとともに、経営方針の策定、重要な業務の意思決定、サステナビリ
ティに関する事項につき決議しました。取締役(監査等委員である取締役を除く。)6名(うち社外取締役1
名)と監査等委員である取締役3名(うち社外取締役2名)で構成しております。
ⅱ)指名諮問委員会
指名諮問委員会は、取締役候補者の指名及び代表取締役等の選定・解職に関する手続き等について、取締役会
の諮問に応じて審議を行い、取締役会へ答申しました。取締役会が選定する取締役3名以上で構成し、その過半
数は独立社外取締役としています。
ⅲ)報酬諮問委員会
報酬諮問委員会は、取締役(監査等委員である取締役を除く。)の報酬の決定に関する手続き等について、取
締役会の諮問に応じて審議を行い、取締役会へ答申しました。取締役会が選定する取締役3名以上で構成し、そ
の過半数は独立社外取締役としています。
38/100
EDINET提出書類
日本エアーテック株式会社(E02421)
有価証券報告書
③ 企業統治に関するその他の事項
a.内部統制システムの整備の状況
当社は業務の適正さの確保に必要な体制を整備し、また、継続して改善を図るよう努めております。このよう
な体制整備の基本方針の概要は次のとおりであります。
(1) 取締役及び使用人の職務の執行が法令及び定款に適合することを確保するための体制
①
②
法令、会社の社会的責任、企業倫理等を踏まえた会社全体を考慮した職務の執行が求められる。
取締役及び使用人の職務の執行についての監督、監査は相互の監視・監督、監査等委員会の監査の範疇で行
われて来た所ではあるが、さらに善管注意義務等促進に向けては、いわゆる内部統制システムを構築し、シス
テムを通じて業務の適正を確保する。
③ コンプライアンス体制の基礎として、企業行動基準及びコンプライアンス基準を定める。それらを取締役及
び使用人が法令・定款及び会社規範を遵守した行動をとるための行動規範とする。
④ 内部統制システム構築の徹底を図るため、統括部署を設置し、コンプライアンスの取組みを横断的に統括す
ることとし、同部署を中心に使用人教育等を行う。
⑤ 内部監査部門は、統括部署と連携の上、コンプライアンスの状況を監査する。これらの活動は定期的に取締
役会及び監査等委員会に報告されるものとする。
⑥ 法令上疑義のある行為等について使用人が直接情報提供を行う手段として内部通報制度を整備する。
(2) 取締役の職務の執行に係る情報の保存及び管理に関する体制
①
文書管理規程に従い、取締役の職務の執行に係る情報を文書又は電磁的媒体(以下、文書等という。)に記
録し、保存する。
② 取締役は、文書管理規程により、常時これらの文書等を閲覧できる。
③ 情報セキュリティ管理規程に従い、情報システムを安全に管理・維持する。
(3) 損失の危険の管理に関する規程その他の体制
①
当社は、当社の業務執行に係るリスクとして、以下の項目等をリスクと認識し、その把握と管理、個々のリ
スクについての管理責任者の体制を整えることとする。
イ 災害
ニ コンプライアンス
ロ 品質
ホ 情報セキュリティ
ハ 環境
ヘ 輸出管理
② リスク管理体制の基礎として、リスク管理規程を定め、個々のリスクについての管理責任者を決定し、同規
程に従ったリスク管理体制を構築する。不測の事態が発生した場合には、代表取締役社長を本部長とする対策
本部を組織し迅速な対応を行い、損害の拡大を防止し、これを最小限に止める体制を整える。
39/100
EDINET提出書類
日本エアーテック株式会社(E02421)
有価証券報告書
(4) 取締役の職務の執行が効率的に行われることを確保するための体制
① 取締役の職務の執行が効率的に行われることを確保するための体制の基礎として、取締役会を毎月1回開催
するほか、当社の経営方針及び経営戦略に係る重要項目については必要に応じて適宜臨時に開催するものと
し、その審議を経て執行決定を行うものとする。
② 取締役会の決定に基づく業務執行については、組織規程、業務分掌規程において、それぞれの責任者及びそ
の責任、執行手続の詳細について定めることとする。
(5) 企業集団における業務の適正を確保するための体制
当社グループは当社及び関連会社1社で構成されているが、その管理は各々の事業に関して責任を負う取締
役を任命し、関係会社管理規程により推進し管理する。
(6) 監査等委員がその職務を補助すべき使用人に関する事項、当該使用人の取締役(監査等委員である取締役を除
く。)からの独立性に関する事項並びに当該使用人に対する指示の実効性の確保に関する事項
監査等委員は内部監査室所属の職員に監査業務に必要な事項を命令することができるものとし、監査等委員
より監査業務に必要な命令を受けた職員はその命令に関し、取締役及び内部監査室等の指揮命令を受けず、全
面的に監査等委員の指揮命令に従わなければならない。
(7) 取締役(監査等委員である取締役を除く。)及び使用人が監査等委員会に報告するための体制及びその他の監
査等委員会の監査が実効的に行われることを確保するための体制
① 取締役(監査等委員である取締役を除く。)及び使用人が、監査等委員会に対して、決定の事項に加え、当
社及び当社グループに重大な影響を及ぼす事項、内部監査の実施状況、コンプライアンスに係る内部通報制度
(社内通報・相談窓口及び社外通報・相談窓口設置)による通報状況及びその内容を速やかに報告する体制を
整備する。
② 内部通報制度は、社内窓口である常勤の監査等委員である取締役及び内部監査室長、又は社外窓口である当
社が委託する通報窓口に対して直接通報できるように運用する。内部通報制度は匿名での通報を認めること及
び通報をした者が、通報を理由に不利益な取扱いを受けることがないことをその内容に含む。
③ 報告の方法(報告者、報告受領者、報告時期等)については、取締役(監査等委員である取締役を除く。)
と監査等委員会との協議により決定する方法による。その他監査等委員会の監査が実効的に行われることを確
保するための体制として、監査等委員会と代表取締役社長との間の定期的な意見交換会を設定する。
(8) 監査等委員の職務の執行(監査等委員会の職務の執行に関するものに限る。)について生ずる費用の前払又は
償還の手続その他の当該職務の執行について生ずる費用又は債務の処理に係る方針に関する事項
監査等委員の職務の執行について生ずる費用の前払又は償還の手続その他の当該執行について生じる費用又
は債務の処理については、予算化するとともに、いわゆる有事の際の費用は監査等委員の職務執行に必要でな
いと認められる場合を除き拒むことができない。監査等委員が職務の執行にあたり必要と認める時は、弁護
士、公認会計士、専門機関等の外部専門家を自らの判断で起用することができる。
b.リスク管理体制の整備の状況
当社のリスク管理体制は、「リスク管理規程」を基本としております。
一方では取締役・従業員の行動指針として「企業行動基準」及び「コンプライアンス基準」を設け、さらに
「内部通報制度」を制定し、企業のリスク発生時に的確かつ迅速に対処することを可能にし、違法行為や不法行
為等発生の未然防止を図っております。
c.責任限定契約の内容の概要
当社と社外取締役とは、会社法第427条第1項の規定に基づき、同法第423条第1項の損害賠償責任を限定する
契約を締結しております。当該契約に基づく損害賠償責任の限度額は法令が定める額としております。
d.補償契約の内容の概要
当社は、取締役平沢真也氏、渡辺直樹氏、高木顕二氏、東海林泰三氏、北野雅之氏、前川統一郎氏、関根賢二
氏、山﨑淳司氏、髙橋貢子氏と会社法第430条の2第1項に規定する補償契約を締結しており、同項第1号の費用
及び同項第2号の損失を法令の定める範囲内において当社が補填することとしております。なお、当該補償契約
によって会社役員の職務の執行の適正性が損なわれないようにするため、会社役員がその職務を行うにつき悪意
又は重大な過失があった場合には補償の対象としないこととするなどの措置を講じております。
e.役員等賠償責任保険契約の内容の概要
当社は、保険会社との間で、当社取締役等を被保険者として、会社法第430条の3第1項に規定する役員等賠償
責任保険(以下「D&O保険」という。)契約を保険会社との間で締結しております。これにより、被保険者が負担
することになる株主代表訴訟、第三者訴訟、会社訴訟の訴訟費用及び損害賠償金を補填することとしており、保
険料は全額当社が負担し、特約の一部を取締役等の負担としております。ただし、被保険者の犯罪行為に起因す
る損害や、法令に違反することを認識しながら実施した行為に起因する損害等については補償されない等、一定
の免責事由があります。
40/100
EDINET提出書類
日本エアーテック株式会社(E02421)
有価証券報告書
f.取締役の定数
当社の取締役(監査等委員である取締役を除く。)は10名以内、監査等委員である取締役は4名以内とする旨
定款に定めております。
g.取締役の選任の決議要件
当社は、取締役の選任決議について、議決権を行使することができる株主の議決権の3分の1以上を有する株
主が出席し、その議決権の過半数をもって行う旨定款に定めております。また、取締役の選任決議は、累積投票
によらないものと定めております。
h.株主総会決議事項を取締役会で決議できる事項
(イ)自己株式の取得
当社は、会社法第165条第2項の規定により、取締役会の決議をもって、自己の株式を取得することができる
旨を定款に定めております。これは、経営環境に対応した機動的な資本政策の遂行を可能とするため、市場取引
等により自己の株式を取得することを目的とするものであります。
(ロ)取締役の責任免除
当社は、取締役(取締役であったものを含む)の会社法第423条第1項の責任につき、善意でかつ重大な過失
が無い場合は取締役会の決議によって、法令に定める限度額の範囲内で、その責任を免除することができる旨定
款に定めております。なお、社外取締役に対しては法令が定める額を限度として責任を負担する契約を締結する
ことができる旨を定めております。
これらは、取締役が職務の遂行にあたり、その能力を十分に発揮して、期待される役割を果たしうる環境を整
備することを目的とするものであります。
(ハ)中間配当
当社は、株主への機動的な利益還元を行うため、会社法第454条第5項の規定により、取締役会の決議によっ
て毎年6月30日を基準日として中間配当を行うことができる旨定款に定めております。
i.株主総会の特別決議要件
当社は、会社法第309条第2項に定める株主総会の特別決議要件について、議決権を行使することができる株主
の議決権の3分の1以上を有する株主が出席し、その議決権の3分の2以上をもって行う旨定款に定めておりま
す。これは、株主総会における特別決議の定足数を緩和することにより、株主総会の円滑な運営を行うことを目
的とするものであります。
41/100
EDINET提出書類
日本エアーテック株式会社(E02421)
有価証券報告書
(2)【役員の状況】
① 役員一覧
男性7名
女性1名
(役員のうち女性の比率12.5%)
役職名
代表取締役社長
取締役
経営企画本部長
氏名
平沢
高木
真也
顕二
生年月日
1972年3月29日生
兼草加工場長
1994年4月
1999年1月
2001年1月
2003年3月
2007年3月
2008年3月
当社入社
当社設計部長
当社設計本部長
当社取締役
当社取締役社長
当社代表取締役社長(現任)
2003年4月
当社入社
2012年1月
当社設計第4部長
2013年9月
当社アイソレーター部長
2014年1月
当社東日本営業本部長
2021年1月
2021年11月
2023年4月
当社営業統括副本部長
兼東日本営業本部長
兼営業企画部長
当社取締役(現任)
兼営業統括本部長
兼東日本営業本部長
兼営業企画部長
当社営業統括本部長
当社経営企画本部長(現任)
1996年4月
当社入社
2011年7月
当社設計第1部長
2020年1月
当社第1設計副本部長
2021年1月
当社第1設計本部長
2022年1月
当社生産統括副本部長
2022年3月
当社取締役(現任)
1975年2月15日生
2021年3月
取締役
生産統括本部長
略歴
東海林
泰三
1972年10月24日生
兼越谷工場長
任期
所有株式数
(千株)
(注)3
110
(注)3
6
(注)3
6
(注)3
5
(注)3
−
兼生産統括本部長(現任)
兼草加工場長(現任)
取締役
設計統括本部長
北野
雅之
1971年5月6日生
兼設計本部長
2025年1月
当社越谷工場長(現任)
1996年4月
当社入社
2009年1月
当社設計第2部長
2020年1月
当社第2設計本部長
兼研究開発部長
2023年4月
当社設計統括本部長
2024年1月
当社設計本部長(現任)
2025年3月
当社取締役(現任)
2026年1月
当社設計統括本部長(現任)
1981年4月
国際航業㈱入社
2007年10月
同社代表取締役社長
2008年3月
国際環境ソリューションズ㈱
代表取締役社長
2009年6月
宮崎ソーラーウェイ㈱
代表取締役社長
取締役
(注)1
2009年7月
前川
統一郎
GEOSOL
Beteiligungsgesellschaft mbH
1956年11月23日生
取締役
2015年4月
国際航業㈱顧問(現任)
2017年5月
特定非営利活動法人環境経営学
会理事(現任)
2022年3月
当社監査等委員である社外取締
役
2023年3月
42/100
当社社外取締役(現任)
EDINET提出書類
日本エアーテック株式会社(E02421)
有価証券報告書
役職名
氏名
生年月日
略歴
1983年4月
当社入社
1998年1月
当社群馬工場長
1999年1月
当社群馬副工場長
2001年1月
当社群馬工場長
2015年1月
当社生産統括副本部長
所有株式数
(千株)
(注)4
14
(注)4
−
(注)4
−
兼群馬工場長
取締役
(監査等委員)
任期
関根
賢二
1960年1月8日生
2017年3月
当社取締役
2018年6月
当社生産統括本部長
(注)2
兼草加工場長
兼群馬工場長
2019年1月
当社生産統括本部長
2022年3月
当社生産統括本部副本部長
2023年3月
当社監査等委員である取締役
(現任)
1987年4月
1991年4月
1993年4月
取締役
(監査等委員)
山﨑
淳司
1958年3月18日生
1998年4月
(注)1,2
2015年3月
2020年3月
1989年10月
早稲田大学理工学部資源工学
科助手
同大学同学部同学科
専任講師
同大学同学部同学科
助教授
早稲田大学理工学術院
創造理工学部環境資源工学科
教授(現任)
当社社外監査役
当社監査等委員である社外取締
役(現任)
サンワ・等松青木監査法人(現
有限責任監査法人トーマツ)入
所
1998年3月
髙橋貢子公認会計士事務所開設
2001年11月
髙橋貢子公認会計士税理士事務
取締役
(監査等委員)
髙橋
貢子
1967年3月29日
(注)1,2
所開設(現任)
2023年3月
当社監査等委員である社外取締
役(現任)
2024年6月
㈱クレオ
2025年6月
アフラック生命保険㈱
社外監査役(現任)
社外監
査役(現任)
計
144
(注)1.前川統一郎、山﨑淳司、髙橋貢子の3氏は、社外取締役であります。
2.当社の監査等委員会の体制は次のとおりであります。
監査等委員会は、監査等委員である常勤取締役関根賢二、監査等委員である社外取締役山﨑淳司、髙橋貢子
の合計3名で構成されています。
3.2026年3月27日開催の定時株主総会の終結の時から1年間。
4.2026年3月27日開催の定時株主総会の終結の時から2年間。
43/100
EDINET提出書類
日本エアーテック株式会社(E02421)
有価証券報告書
② 社外役員の状況
当社の社外取締役は、取締役(監査等委員である取締役を除く。)1名、監査等委員である社外取締役2名
の合計3名であります。
社外取締役を選任するにあたり、独立性に関する基準又は方針は特に設けておりませんが、選任にあたって
は、会社法に定める社外性の要件を満たすというだけでなく、株式会社東京証券取引所の独立役員基準等を参
考にしております。
当社と当社の社外取締役の人的関係、資本的関係、取引関係及びその他の利害関係において、特筆すべき関
係等はありません。
社外取締役(監査等委員である取締役を除く。)前川統一郎氏は会社経営者を歴任し、環境分析及び国際的
な企業経営の分野における経験を通じて培った事業や経営に関する広範な見識を有しています。また、学会・
団体活動を通じたサステナブル社会に関する専門性も兼ね備えています。その経験と幅広い見識をもって独立
した立場から、当社発展のための助言及び提言を行っていただけるものと判断し選任しております。
監査等委員である社外取締役山﨑淳司氏は、社外役員となること以外の方法で会社の経営に直接関与した経
験は有しておりませんが、大学教授として長い経験と幅広く、かつ専門的な知識を有し、それらを活かして適
切な監査を行っていただけると判断し選任しております。
監査等委員である社外取締役髙橋貢子氏は、社外役員となること以外の方法で会社の経営に関与した経験は
ありませんが、サンワ・等松青木監査法人(現有限責任監査法人トーマツ)にて監査を務め、企業会計及び内
部統制等に豊富な経験と専門知識を有するとともに、公認会計士及び税理士資格を保有し事務所経営にも従事
しております。それらをもとに、独立した立場から意見や提言をいただくことにより、取締役会の監督機能の
強化が期待されると判断し選任しております。
なお、上記の社外取締役3名は、いずれも株式会社東京証券取引所の独立役員に関する独立性を満たしてい
るため、独立役員に指定し、同所へその旨、届け出ております。
当社は、経営の意思決定及び取締役による業務執行を管理監督する機能を持つ取締役会に対し、取締役8名
中の3名を社外取締役とすることで経営への監視機能を強化しております。
③ 社外取締役又は監査等委員である社外取締役による監督又は監査と内部監査、監査等委員会監査及び会計監査
との相互連携並びに内部統制部門との関係
当社は、監査等委員会設置会社であり、監査等委員である常勤取締役1名、監査等委員である社外取締役2
名の3名で構成されております。監査等委員会は、取締役(監査等委員である取締役を除く。)の職務執行に
関する業務監査及び会計監査人の独立性監視等の監査を実施し、その監査状況を社長及び内部監査室の責任者
へ報告しております。会計監査人とは、定例の連絡会を開催し、業務執行及び決算内容等の情報交換を行って
おります。また、コーポレート・ガバナンス責任者との情報交換を行っております。
44/100
EDINET提出書類
日本エアーテック株式会社(E02421)
有価証券報告書
(3)【監査の状況】
① 監査等委員会監査の状況
監査等委員会は、常勤監査等委員1名と非常勤の社外取締役2名で構成されております。原則として毎月1回
行われる取締役会及び監査等委員会、臨時に行われる取締役会等に出席し必要に応じて意見を述べ、公正・客観
的な立場から厳正な取締役の職務執行を監査しております。なお、監査等委員髙橋貢子は公認会計士及び税理士
の資格を有しており、財務及び会計に関する相当程度の知見を有するものであります。
当事業年度開催の監査等委員会への各監査等委員の出席状況については次のとおりであります。
氏名
開催回数及び出席状況
関根
賢二
100%(13/13回)
山﨑
淳司
84.6%(11/13回)
髙橋
貢子
100%(13/13回)
監査等委員会における具体的な検討内容として、監査方針や監査計画の策定、内部統制システムの整備・運用
状況、サステナビリティ課題への取り組み状況の確認、会計監査人の選定・評価、会計監査の相当性等になりま
す。
また、常勤の監査等委員の活動として、年間の監査計画に基づき監査を実施するともに、取締役会や重要な会
議への出席、各種報告書等の閲覧を行い監査等委員会において報告しています。
② 内部監査の状況
内部監査室の専任者は2名でありますが、必要に応じて管理本部より動員し、全部署の内部監査及び調査を計
画的に実施し、改善事項の指摘・指導を行っており、その内容は代表取締役社長、取締役会及び監査等委員会に
報告されております。また、監査等委員は必要に応じてこの内部監査に同行し、内部監査状況を監視できる実効
性の高い体制としております。
必要に応じて会計監査人と監査等委員会は意見交換を行います。また、税務については税理士法人平川会計
パートナーズと顧問契約を結び指導を受ける等、外部の専門家の目を通して経営の透明性及び法令遵守に努めて
おります。
③ 会計監査の状況
a.監査法人の名称
監査法人アンビシャス
b.継続監査期間
6年間
c.業務を執行した公認会計士
所属監査法人
氏名
監査法人アンビシャス
代表社員
業務執行社員
今津邦博
監査法人アンビシャス
代表社員
業務執行社員
田中昭仁
d.監査業務に係る補助者の構成
上記の公認会計士及び補助者6人で監査業務を実施しております。
45/100
EDINET提出書類
日本エアーテック株式会社(E02421)
有価証券報告書
e.監査法人の選定方針と理由
監査等委員会は、当社の「会計監査人評価基準」に照らし、監査法人アンビシャスが、会計監査人に必要な専門
性、独立性、監査活動の適切性、効率性並びに品質管理体制等を総合的に勘案した結果、適任であると判断してお
ります。
監査等委員会は、会計監査人の職務の執行に支障がある場合等、その必要があると判断した場合は、株主総会
に提出する会計監査人の解任又は不再任に関する議案の内容を決定いたします。また、会計監査人が会社法第
340条第1項各号に定める項目に該当すると認められる場合は、監査等委員全員の同意に基づき、会計監査人を
解任いたします。この場合、監査等委員会が選定した監査等委員が、解任後最初に招集される株主総会におきま
して、会計監査人を解任した旨と解任の理由を報告いたします。
f.監査等委員会による監査法人の評価
監査等委員会は、監査法人に対して評価を行っております。この評価については、日本監査役協会が公表する
「会計監査人の評価及び選定基準策定に関する監査役等の実務指針」に基づき総合的に評価しており、監査法人
アンビシャスによる監査は、適正に行われていることを確認しております。
④ 監査報酬の内容等
a.監査公認会計士等に対する報酬
前事業年度
区分
監査証明業務に基づく
報酬
(百万円)
当事業年度
非監査業務に基づく
報酬
(百万円)
監査証明業務に基づく
報酬
(百万円)
非監査業務に基づく
報酬
(百万円)
監査法人
アンビシャス
20
−
21
−
計
20
−
21
−
b.監査公認会計士等と同一のネットワークに対する報酬(a.を除く)
該当事項はありません。
c.監査報酬の決定方針
会社規模、事業特性、監査日数等を勘案した上で決定しております。
d.監査等委員会が会計監査人の報酬等に同意した理由
監査等委員会は、会計監査人の監査計画の内容、職務遂行状況及び報酬の見積の算出根拠等を確認し、検討し
た結果、会計監査人の報酬等につき、同意の判断を行っております。
46/100
EDINET提出書類
日本エアーテック株式会社(E02421)
有価証券報告書
(4)【役員の報酬等】
① 役員の報酬等の額又はその算定方法の決定に関する方針に係る事項
当社の取締役の報酬に関する基本方針は、企業理念を実践する優秀な人材を確保・維持し、企業価値の持続的
な向上を図る役割を十分に果たす意欲を引き出すものとして機能させることを目的としております。
a.報酬決定方針の決定方法
当社は取締役(監査等委員である取締役を除く。以下同じ。)の個人別の報酬等の取扱い(取締役の個人
別の報酬等の内容についての決定に関する方針)については、取締役会決議により「取締役の個人別の報酬
等の内容に係る方針等決定に関する内規」及び「社外取締役報酬の内規」(以下、「本内規」という)に定
めております。
b.報酬決定方針の内容の概要
当社の取締役に対する報酬等は、金銭報酬である「基本報酬」及び当該事業年度終了後の一定の時期に支
給される「業績連動報酬」、並びに中長期的業績が反映できる非金銭報酬である「株式報酬」により構成さ
れており、その支給割合の目安は概ね「基本報酬」を70%、「業績連動報酬」を30%とし、「株式報酬」に
ついてはその総額の割合を「基本報酬」及び「業績連動報酬」の合計の概ね10%としております。
「基本報酬」「業績連動報酬」及び「株式報酬」については、本内規に従い、報酬諮問委員会による審議
及び決議を受け、取締役会において取締役個人別の報酬等の内容を決定するものとしております。報酬諮問
委員会は、「基本報酬」については取締役の職責に応じて、「業績連動報酬」については当該事業年度にお
ける取締役の業績目標の達成度合いに応じて、「株式報酬」については当社の業績、各取締役の役割等及び
株価等を踏まえて諮問案を策定するものとしています。
c.業績連動報酬に関する事項
(1) 当該業績連動報酬の額の算定の基礎として選定した業績指標の内容及び当該業績指標を選定した理由
業績連動報酬は、事業年度ごとの業績向上に対する貢献意欲を引き出すため、当該取締役に対し、経営計
画で定めた各事業年度の「売上高」「営業利益」「経常利益」「当期純利益」を業績指標とし、金銭報酬と
して毎年一定の時期に支給しております。
(2) 当該業績連動報酬の額の算定方法
業績連動報酬の額は、当該取締役に対し、上記業績指標の目標値に対する達成度合い及び当社従業員への
賞与を勘案して算定し、報酬諮問委員会で定めた報酬の内容に基づき取締役会の決議により決定するものと
しております。
(3) 当該業績連動報酬の額の算定に用いた業績指標の実績
当事業年度における業績連動報酬の額の算定に用いた業績指標の実績は、「損益計算書」に記載のとおり
です。
d.株式報酬に関する事項
(1) 当該株式報酬の数の算定の基礎として選定した業績指標の内容及び当該業績指標を選定した理由
株式報酬は、株主との価値の共有を図り、中長期的な企業価値及び株主価値の向上に対する貢献意欲を引
き出すため、取締役(監査等委員である取締役及び社外取締役を除く。)に対し、当社と当該取締役との間
で締結する契約に基づき、金銭債権を報酬として支給し、当該金銭債権の全部を現物出資財産として払い込
ませることにより、譲渡制限期間を退任時までとする当社普通株式(譲渡制限付株式)を、毎年一定の時期
に付与しております。また、「監査等委員である取締役」及び「社外取締役」については、業務執行から独
立した立場であることに鑑み、株式報酬は支給しません。
(2) 当該株式報酬の数の算定方法
付与する株式の個数は、当社の業績、各役割等及び株価等を踏まえて決定しております。
(3) 当該株式報酬の数の算定に用いた業績指標の実績
当事業年度における株式報酬の数の算定に用いた業績指標である当社の業績、各役割等及び株価等は、
第4[提出会社の状況] に記載のとおりです。
e.報酬等に関する取締役会の委任事項
報酬等について客観性・透明性を高める観点から、取締役の個人別の報酬等(業績連動報酬及び譲渡制限
付株式報酬を含む。)に関して、本内規に定めた報酬決定方針に基づき決定することにつき、取締役会の委
任を受けた報酬諮問委員会において審議し取締役会にて決定していることから、上記報酬決定方針に沿うも
のであると判断しております。
47/100
EDINET提出書類
日本エアーテック株式会社(E02421)
有価証券報告書
f.当事業年度に係る報酬決定について
当事業年度に係る各取締役の報酬については、2025年1月及び3月に報酬諮問委員会を各1回開催し、役
位別・種類別等の金額及び算定方法を定めた内規に従い、2025年3月27日開催の取締役会にて決定しており
ます。また、譲渡制限付株式報酬の総額には、2025年3月27日開催の取締役会にて決議された譲渡制限付株
式報酬のうち、当事業年度における費用計上額を記載しております。さらに、2026年1月に報酬諮問委員会
を1回開催し、当事業年度の取締役の業績連動報酬の額を審議し、2026年1月16日開催の取締役会にて決定
しております。
②
役員区分ごとの報酬等の総額、報酬等の種類別の総額及び対象となる役員の員数
報酬等の種類別の総額(千円)
報酬等の総額
(千円)
固定報酬
業績連動
報酬
譲渡制限付
株式報酬
左記のうち、
非金銭報酬等
対象となる
役員の員数
(人)
取締役(監査等委員及び社外
取締役を除く)
104,100
73,470
23,000
7,630
7,630
5
監査等委員(社外取締役を除
く)
12,980
9,980
3,000
−
−
1
社外取締役
7,088
7,088
−
−
−
3
役員区分
(注)1.役員ごとの報酬等の総額につきましては、1億円以上を支給している役員はおりませんので記載を省略し
ております。
2.使用人兼務役員の使用人給与のうち重要なものはございません。
3.上記の報酬等の額には、当事業年度に係る業績連動報酬として未払金に計上した金額26,000千円(取締役
(監査等委員である取締役を除く。)5名に対し23,000千円、監査等委員である取締役1名に対し3,000
千円が含まれております。取締役業績連動報酬は当社規定により、事業年度ごとの業績向上に対する貢献
意欲を引き出すため、取締役に対し、経営計画で定めた各事業年度の「売上高」、「営業利益」、「経常
利益」、「当期純利益」 を業績指標とし、目標値に対する達成度合い、当社従業員への賞与を勘案して
算出された額の金銭を、毎年、当該事業年度終了後の一定の時期に支給しております。
48/100
EDINET提出書類
日本エアーテック株式会社(E02421)
有価証券報告書
(5)【株式の保有状況】
① 投資株式の区分の基準及び考え方
当社は、保有目的が純投資目的である投資株式と純投資目的以外の目的である投資株式の区分について、株式
の価値の変動や配当金の受領により利益を得ることを目的として保有する株式を純投資目的である投資株式、そ
れ以外の株式を純投資目的以外の目的である投資株式に区分しております。
② 保有目的が純投資目的以外の目的である投資株式
a.保有方針及び保有の合理性を検証する方法並びに個別銘柄の保有の適否に関する取締役会等における検証の内容
当社は、取引先企業との安定的な取引及び関係強化を目的に、当社の持続的な成長及び事業推進に必要と判断
された企業の株式を保有しています。
株式保有については、保有の合理性、減損リスク、株式の価格変動に対するリスク等を踏まえて、取締役会で
検討し、取引の安定や関係強化等に必要であると判断する株式については保有し、保有意義が希薄化してきたと
判断する株式について見直しを進めてまいります。
b.銘柄数及び貸借対照表計上額
銘柄数
(銘柄)
貸借対照表計上額の
合計額(千円)
非上場株式
7
113,704
非上場株式以外の株式
−
−
(当事業年度において株式数が増加した銘柄)
銘柄数
(銘柄)
株式数の増加に係る取得
価額の合計額(千円)
非上場株式
−
−
−
非上場株式以外の株式
−
−
−
株式数の増加の理由
(当事業年度において株式数が減少した銘柄)
銘柄数
(銘柄)
株式数の減少に係る売却
価額の合計額(千円)
非上場株式
−
−
非上場株式以外の株式
−
−
c.特定投資株式及びみなし保有株式の銘柄ごとの株式数、貸借対照表計上額に関する情報
特定投資株式
該当事項はありません。
みなし保有株式
該当事項はありせん。
③ 保有目的が純投資目的である投資株式
該当事項はありません。
49/100
EDINET提出書類
日本エアーテック株式会社(E02421)
有価証券報告書
第5【経理の状況】
1.財務諸表の作成方法について
当社の財務諸表は、「財務諸表等の用語、様式及び作成方法に関する規則」(昭和38年大蔵省令第59号。以下「財
務諸表等規則」という。)に基づいて作成しております。
2.監査証明について
当社は、金融商品取引法第193条の2第1項の規定に基づき、事業年度(2025年1月1日から2025年12月31日ま
で)の財務諸表について、監査法人アンビシャスにより監査を受けております。
3.連結財務諸表について
当社は、子会社がありませんので、連結財務諸表は作成しておりません。
4.財務諸表等の適正性を確保するための特段の取組について
当社は、財務諸表等の適正性を確保するための特段の取組を行っております。具体的には、会計基準等の内容を適
切に把握し、また、会計基準の変更等について的確に対応することができる体制を整備するため、公益財団法人財務
会計基準機構へ加入し情報の収集に努めております。
50/100
EDINET提出書類
日本エアーテック株式会社(E02421)
有価証券報告書
1【財務諸表等】
(1)【財務諸表】
①【貸借対照表】
(単位:千円)
前事業年度
(2024年12月31日)
資産の部
流動資産
現金及び預金
受取手形
電子記録債権
売掛金
契約資産
有価証券
商品及び製品
仕掛品
原材料及び貯蔵品
前払費用
その他
貸倒引当金
流動資産合計
固定資産
有形固定資産
建物
減価償却累計額
建物(純額)
構築物
減価償却累計額
構築物(純額)
機械及び装置
減価償却累計額
機械及び装置(純額)
車両運搬具
減価償却累計額
車両運搬具(純額)
工具、器具及び備品
減価償却累計額
工具、器具及び備品(純額)
土地
建設仮勘定
有形固定資産合計
無形固定資産
ソフトウエア
その他
無形固定資産合計
51/100
当事業年度
(2025年12月31日)
2,748,627
3,707,142
※2 444,276
※2 202,928
※2 1,682,441
※2 1,622,463
2,473,271
1,368,839
728
1,692,423
489,528
928,286
27,078
12,320
△1,973
11,865,846
2,296,838
1,458,654
−
1,814,949
474,897
832,661
33,034
14,935
△72
12,458,436
※1 4,182,146
※1 4,191,692
△1,690,198
2,491,948
230,984
△99,394
131,590
740,406
△339,307
401,099
12,724
△10,683
2,041
426,537
△365,296
61,241
※1 2,508,960
24,420
5,621,300
△1,790,207
2,401,484
231,188
△114,353
116,834
771,476
△409,949
361,526
12,724
△11,522
1,201
452,869
△379,219
73,649
※1 2,805,149
639,766
6,399,614
35,186
3,719
38,905
35,429
3,699
39,128
EDINET提出書類
日本エアーテック株式会社(E02421)
有価証券報告書
(単位:千円)
前事業年度
(2024年12月31日)
投資その他の資産
投資有価証券
関係会社出資金
長期貸付金
破産更生債権等
長期前払費用
繰延税金資産
その他
貸倒引当金
投資その他の資産合計
固定資産合計
資産合計
負債の部
流動負債
支払手形
電子記録債務
買掛金
短期借入金
1年内返済予定の長期借入金
リース債務
未払金
未払費用
未払法人税等
前受金
預り金
賞与引当金
受注損失引当金
製品保証引当金
その他
流動負債合計
固定負債
長期借入金
リース債務
退職給付引当金
債務保証損失引当金
資産除去債務
その他
固定負債合計
負債合計
52/100
当事業年度
(2025年12月31日)
516,895
134,741
15,300
75
13,445
269,865
36,648
△75
986,896
6,647,103
18,512,949
517,767
134,741
46,216
120
11,712
245,726
22,486
△120
978,651
7,417,394
19,875,831
131,996
1,127,828
389,177
※1 380,000
※1 54,264
2,189
436,428
300,776
277,163
224,897
114,221
119,162
17,107
13,948
8,342
3,597,502
28,909
1,129,208
360,990
※1 580,000
※1 182,178
3,137
600,362
341,337
284,335
179,128
113,186
129,575
5,873
12,175
5,062
3,955,460
※1 101,367
※1 791,865
5,650
482,040
3,014
17,542
3,980
613,594
4,211,097
9,186
330,002
−
17,812
−
1,148,865
5,104,326
EDINET提出書類
日本エアーテック株式会社(E02421)
有価証券報告書
(単位:千円)
前事業年度
(2024年12月31日)
純資産の部
株主資本
資本金
資本剰余金
資本準備金
その他資本剰余金
資本剰余金合計
利益剰余金
利益準備金
その他利益剰余金
別途積立金
繰越利益剰余金
利益剰余金合計
自己株式
株主資本合計
評価・換算差額等
その他有価証券評価差額金
評価・換算差額等合計
純資産合計
負債純資産合計
53/100
当事業年度
(2025年12月31日)
2,133,951
2,133,951
2,141,283
40,854
2,182,138
2,141,283
40,025
2,181,309
132,600
132,600
303,000
10,017,574
10,453,174
△485,408
14,283,856
303,000
10,641,260
11,076,860
△639,582
14,752,539
17,996
17,996
14,301,852
18,512,949
18,965
18,965
14,771,504
19,875,831
EDINET提出書類
日本エアーテック株式会社(E02421)
有価証券報告書
②【損益計算書】
(単位:千円)
(自
至
前事業年度
2024年1月1日
2024年12月31日)
売上高
製品売上高
商品売上高
売上高合計
売上原価
製品期首棚卸高
商品期首棚卸高
当期製品製造原価
当期商品仕入高
合計
製品期末棚卸高
商品期末棚卸高
売上原価合計
受注損失引当金戻入益
受注損失引当金繰入額
売上総利益
販売費及び一般管理費
荷造運賃
旅費及び交通費
役員報酬
給料及び手当
賞与
賞与引当金繰入額
退職給付費用
製品保証引当金繰入額
貸倒引当金繰入額
法定福利費
減価償却費
賃借料
研究開発費
その他
販売費及び一般管理費合計
営業利益
営業外収益
受取利息
受取配当金
為替差益
その他
営業外収益合計
54/100
(自
至
当事業年度
2025年1月1日
2025年12月31日)
13,189,291
328,482
※1 13,517,774
13,800,958
350,142
※1 14,151,101
1,308,614
15,611
10,118,476
274,374
11,717,075
1,667,035
25,387
10,024,652
21,508
17,107
3,497,522
1,667,035
25,387
10,419,956
264,031
12,376,411
1,794,953
19,996
10,561,461
17,107
5,873
3,600,873
448,942
84,726
96,444
623,526
174,007
33,485
23,504
△3,126
139
135,919
29,711
49,376
※3 158,463
544,169
2,399,290
1,098,232
432,493
82,936
115,544
662,150
186,004
36,347
16,169
△1,773
△1,857
145,538
32,034
50,886
※3 132,466
547,978
2,436,920
1,163,952
4,328
5,235
※2 397,562
※2 437,130
23,597
41,778
467,268
6,423
46,336
495,126
EDINET提出書類
日本エアーテック株式会社(E02421)
有価証券報告書
(単位:千円)
(自
至
前事業年度
2024年1月1日
2024年12月31日)
営業外費用
支払利息
債務保証損失引当金繰入額
債務保証損失
外国源泉税
その他
営業外費用合計
経常利益
特別利益
新株予約権戻入益
特別利益合計
特別損失
事業撤退損
特別損失合計
税引前当期純利益
法人税、住民税及び事業税
法人税等調整額
法人税等合計
当期純利益
55/100
(自
至
当事業年度
2025年1月1日
2025年12月31日)
1,862
3,014
−
26,112
4,938
35,927
1,529,572
11,585
−
2,548
34,225
3,878
52,237
1,606,841
6,393
6,393
−
−
−
※4 10,962
−
1,535,965
382,403
16,185
398,589
1,137,376
10,962
1,595,879
441,051
23,352
464,403
1,131,475
EDINET提出書類
日本エアーテック株式会社(E02421)
有価証券報告書
[製造原価明細書]
(自
至
区分
注記
番号
金
前事業年度
2024年1月1日
2024年12月31日)
額(千円)
(自
至
構成比
(%)
金
当事業年度
2025年1月1日
2025年12月31日)
額(千円)
構成比
(%)
Ⅰ
材料費
4,561,626
45.5
4,287,205
41.2
Ⅱ
労務費
2,593,473
25.8
2,709,612
26.0
Ⅲ
経費
2,884,156
28.7
3,408,508
32.8
(うち外注加工費)
(2,272,630)
(22.6)
(2,692,487)
(25.9)
当期総製造費用
10,039,257
100.0
10,405,326
100.0
568,747
489,528
10,608,004
10,894,854
期末仕掛品棚卸高
489,528
474,897
当期製品製造原価
10,118,476
10,419,956
期首仕掛品棚卸高
合
(注)
計
原価計算の方法は個別原価計算によっております。
56/100
EDINET提出書類
日本エアーテック株式会社(E02421)
有価証券報告書
③【株主資本等変動計算書】
前事業年度(自 2024年1月1日
至
2024年12月31日)
(単位:千円)
株主資本
資本剰余金
資本金
資本準備金
当期首残高
利益剰余金
その他利益剰余金
その他
資本剰余金
資本剰余金
合計
利益準備金
40,854
2,164,427
132,600
2,116,233
2,123,572
7,008
7,000
7,000
10,710
10,710
10,710
別途積立金
繰越利益
剰余金
303,000
9,506,895
当期変動額
新株の発行(新株予約権の行
使)
新株の発行(譲渡制限付株式報
酬)
剰余金の配当
△626,697
当期純利益
1,137,376
自己株式の取得
自己株式の処分
株主資本以外の項目の
当期変動額(純額)
当期変動額合計
当期末残高
17,718
17,710
−
17,710
−
−
510,679
2,133,951
2,141,283
40,854
2,182,138
132,600
303,000
10,017,574
新株予約権
純資産合計
9,589
14,107,697
株主資本
評価・換算差額等
利益剰余金
利益剰余金
合計
当期首残高
9,942,495
自己株式
株主資本合計
その他
有価証券評価
差額金
評価・換算
差額等合計
△138,116
14,085,040
13,067
13,067
当期変動額
新株の発行(新株予約権の行
使)
新株の発行(譲渡制限付株式報
酬)
14,008
14,008
21,420
21,420
剰余金の配当
△626,697
△626,697
△626,697
当期純利益
1,137,376
1,137,376
1,137,376
自己株式の取得
△394,154
△394,154
△394,154
自己株式の処分
46,862
46,862
46,862
株主資本以外の項目の
当期変動額(純額)
当期変動額合計
当期末残高
4,929
4,929
△9,589
△4,660
510,679
△347,292
198,815
4,929
4,929
△9,589
194,155
10,453,174
△485,408
14,283,856
17,996
17,996
−
14,301,852
57/100
EDINET提出書類
日本エアーテック株式会社(E02421)
有価証券報告書
当事業年度(自
2025年1月1日
至
2025年12月31日)
(単位:千円)
株主資本
資本剰余金
資本金
資本準備金
当期首残高
2,133,951
2,141,283
利益剰余金
その他利益剰余金
その他
資本剰余金
資本剰余金
合計
利益準備金
40,854
2,182,138
132,600
別途積立金
繰越利益
剰余金
303,000
10,017,574
当期変動額
剰余金の配当
△507,789
当期純利益
1,131,475
自己株式の取得
自己株式の処分
△829
△829
株主資本以外の項目の
当期変動額(純額)
当期変動額合計
当期末残高
−
−
△829
△829
−
−
623,685
2,133,951
2,141,283
40,025
2,181,309
132,600
303,000
10,641,260
株主資本
評価・換算差額等
利益剰余金
利益剰余金
合計
当期首残高
10,453,174
自己株式
株主資本合計
その他
有価証券評価
差額金
評価・換算
差額等合計
△485,408
14,283,856
17,996
17,996
純資産合計
14,301,852
当期変動額
剰余金の配当
△507,789
△507,789
△507,789
当期純利益
1,131,475
1,131,475
1,131,475
自己株式の取得
△230,660
△230,660
△230,660
自己株式の処分
76,487
75,658
75,658
株主資本以外の項目の
当期変動額(純額)
当期変動額合計
当期末残高
968
968
968
623,685
△154,173
468,683
968
968
469,651
11,076,860
△639,582
14,752,539
18,965
18,965
14,771,504
58/100
EDINET提出書類
日本エアーテック株式会社(E02421)
有価証券報告書
④【キャッシュ・フロー計算書】
(単位:千円)
(自
至
前事業年度
2024年1月1日
2024年12月31日)
営業活動によるキャッシュ・フロー
税引前当期純利益
減価償却費
貸倒引当金の増減額(△は減少)
賞与引当金の増減額(△は減少)
退職給付引当金の増減額(△は減少)
受注損失引当金の増減額(△は減少)
製品保証引当金の増減額(△は減少)
債務保証損失引当金の増減額(△は減少)
受取利息及び受取配当金
支払利息
為替差損益(△は益)
売上債権及び契約資産の増減額(△は増加)
棚卸資産の増減額(△は増加)
仕入債務の増減額(△は減少)
未払金の増減額(△は減少)
未払費用の増減額(△は減少)
前受金の増減額(△は減少)
その他
小計
利息及び配当金の受取額
利息の支払額
法人税等の支払額
営業活動によるキャッシュ・フロー
投資活動によるキャッシュ・フロー
定期預金の預入による支出
定期預金の払戻による収入
有形固定資産の取得による支出
無形固定資産の取得による支出
貸付けによる支出
貸付金の回収による収入
その他
投資活動によるキャッシュ・フロー
財務活動によるキャッシュ・フロー
短期借入れによる収入
短期借入金の返済による支出
長期借入れによる収入
長期借入金の返済による支出
配当金の支払額
株式の発行による収入
自己株式の取得による支出
自己株式の処分による収入
その他
財務活動によるキャッシュ・フロー
現金及び現金同等物に係る換算差額
現金及び現金同等物の増減額(△は減少)
現金及び現金同等物の期首残高
現金及び現金同等物の期末残高
59/100
(自
至
当事業年度
2025年1月1日
2025年12月31日)
1,535,965
210,622
93
13,791
△79,369
△4,400
△3,236
3,014
△401,891
1,862
△23,759
△386,390
△365,903
△1,616,735
6,315
29,837
185,128
36,599
△858,455
401,724
△1,819
△209,037
△667,587
1,595,879
264,496
△1,857
10,413
△152,037
△11,234
△1,773
△3,014
△442,366
11,585
△7,142
387,942
△12,271
△129,892
108,896
40,423
△45,768
17,564
1,629,842
442,150
△12,473
△433,633
1,625,885
△671,313
818,933
△1,002,239
△15,916
△17,000
100
3,255
△884,179
△424,709
523,705
△967,131
△15,915
△38,000
3,383
18,004
△900,662
470,000
△370,000
−
△102,184
△620,880
10,812
△394,154
44,331
△2,251
△964,327
15,584
△2,500,509
4,692,616
※1 2,192,106
770,000
△570,000
1,000,000
△181,588
△505,140
−
△230,660
45,861
△4,054
324,418
7,952
1,057,592
2,192,106
※1 3,249,699
EDINET提出書類
日本エアーテック株式会社(E02421)
有価証券報告書
【注記事項】
(重要な会計方針)
1.有価証券の評価基準及び評価方法
(1) 満期保有目的の債券
償却原価法(定額法)
(2) その他有価証券
市場価格のない株式等以外のもの
時価法(評価差額は全部純資産直入法により処理し、売却原価は移動平均法により算定)
市場価格のない株式等
移動平均法による原価法
2.棚卸資産の評価基準及び評価方法
(1) 商品及び原材料
月次総平均法による原価法(貸借対照表価額については収益性の低下に基づく簿価切下げの方法)
(2) 製品及び仕掛品
個別法による原価法(貸借対照表価額については収益性の低下に基づく簿価切下げの方法)
(3) 貯蔵品
最終仕入原価法(貸借対照表価額については収益性の低下に基づく簿価切下げの方法)
3.固定資産の減価償却の方法
(1) 有形固定資産(リース資産を除く)
定率法を採用しております。ただし、1998年4月1日以降に取得した建物(建物附属設備を除く)並び
に2016年4月1日以降に取得した建物附属設備及び構築物については、定額法を採用しております。
主な耐用年数
建物
8〜50年
構築物
7〜30年
機械及び装置
12〜13年
車両運搬具
4〜6年
工具、器具及び備品
3〜6年
(2) 無形固定資産(リース資産を除く)
定額法を採用しております。
なお、自社利用のソフトウエアについては、社内における利用可能期間(5年)に基づいております。
(3) リース資産
リース期間を耐用年数として、残存価額を零とする定額法を採用しております。
4.外貨建の資産及び負債の本邦通貨への換算基準
外貨建金銭債権債務は、決算日の直物為替相場により円貨に換算し、換算差額は損益として処理しており
ます。
5.引当金の計上基準
(1) 貸倒引当金
売上債権等の貸倒損失に備えるため、一般債権については貸倒実績率により、貸倒懸念債権等特定の債
権については個別の回収可能性を勘案し、回収不能見込額を計上しております。
(2) 賞与引当金
従業員に対する賞与の支給に備えるため、将来の支給見込額のうち当事業年度の負担額を計上しており
ます。
(3) 受注損失引当金
受注契約に係る将来の損失に備えるため、当事業年度末における受注契約に係る損失見込額を計上して
おります。
(4) 製品保証引当金
製品の無償補修費用の支出に備えるため、無償補修費用を過去の実績に基づいて今後必要と見込まれる
額を計上しているほか、個別に見積り算出した額を計上しております。
(5) 退職給付引当金
従業員の退職給付に備えるため、当事業年度末における退職給付債務及び年金資産の見込額に基づき計
上しております。
退職給付債務の算定にあたり、退職給付見込額を当事業年度末までの期間に帰属させる方法について
は、給付算定式基準によっております。
数理計算上の差異については、その発生時の従業員の平均残存勤務期間内の一定の年数(10年)による
按分額を定額法により翌事業年度より費用処理することとしております。
(6) 債務保証損失引当金
債務保証に係る損失に備えるため、被保証者の財政状態等を勘案し、損失負担見込額を計上しておりま
す。
60/100
EDINET提出書類
日本エアーテック株式会社(E02421)
有価証券報告書
6.収益及び費用の計上基準
当社は、主にクリーンエアーシステムに関する機器・装置の企画、製造及び販売を行っております。
標準的な機器及び商品の販売(簡易な据付工事を含む)等については、一時点で充足される履行義務とし
て、引渡し又は据付工事が完了した時点で収益を認識しております。
特殊な仕様の機器・装置で現地での据付工事を伴うものについては、一定の期間にわたり充足される履行
義務として、進捗率を見積り、一定の期間にわたり収益を認識しております。進捗度の見積り方法は、見積
総原価に対する発生原価の割合(インプット法)によっております。なお、進捗率を合理的に見積もること
ができないが発生した費用を回収することが見込まれる場合は、原価回収基準により収益を認識しておりま
す。
また、収益は、顧客との契約による取引価格に基づき認識しており、取引の対価は履行義務の充足から1
年以内に受取るため、重要な金融要素は含んでおりません。
7.キャッシュ・フロー計算書における資金の範囲
手許現金、随時引き出し可能な預金及び容易に換金可能であり、かつ、価値の変動について僅少なリスク
しか負わない取得日から3ヶ月以内に償還期限の到来する短期投資からなっております。
8.その他財務諸表作成のための基礎となる事項
関連する会計基準等の定めが明らかでない場合に採用した会計処理の原則及び手続
以下の報酬等については、対象勤務期間にわたって費用処理しております。
① 当社の譲渡制限付株式報酬制度に基づき、当社の取締役(監査等委員である取締役及び社外取締役
を除く。)に支給した譲渡制限付株式報酬
② 当社の従業員持株会向け譲渡制限付株式インセンティブ制度に基づき、当社従業員に対し日本エ
アーテック従業員持株会を通じて支給した譲渡制限付株式報酬
(重要な会計上の見積り)
一定の期間にわたり履行義務を充足する契約における収益認識
(1) 当事業年度の財務諸表に計上した金額
単位(千円)
前事業年度
一定の期間にわたり収益を認識する方法
により計上した売上高
1,911,393
(2)
当事業年度
2,058,940
識別した項目に係る重要な会計上の見積りの内容に関する情報
当社は、特殊な仕様の機器・装置で現地での据付工事を伴うものについては、一定の期間にわたり充足さ
れる履行義務として、進捗率を見積り、一定の期間にわたり収益を認識しております。
進捗度の見積り方法は、見積総原価に対する発生原価の割合(インプット法)によっております。見積総
原価は、仕様、過去の類似案件における実績、難易度等を勘案しております。当該見積総原価は、仕様の変
更、原材料価格の変動、予定外の費用発生、工期の変更等によって変更が生じる可能性があり、発生原価が
見積総原価と異なった場合には、翌事業年度の進捗率の計算と当該進捗率に基づく収益認識額に影響を及ぼ
す可能性があります。
(会計方針の変更)
該当事項はありません。
61/100
EDINET提出書類
日本エアーテック株式会社(E02421)
有価証券報告書
(未適用の会計基準等)
・「リースに関する会計基準」(企業会計基準第34号 2024年9月13日企業会計基準委員会)
・「リースに関する会計基準の適用指針」(企業会計基準適用指針第33号 2024年9月13日企業会計基準委
員会) 等
(1)概要
企業会計基準委員会において、日本基準を国際的に整合性のあるものとする取組みの一環として、借手の
全てのリースについて資産及び負債を認識するリースに関する会計基準の開発に向けて、国際的な会計基準
を踏まえた検討が行われ、基本的な方針として、IFRS第16号の単一の会計処理モデルを基礎とするものの、
IFRS第16号の全ての定めを採り入れるのではなく、主要な定めのみを採り入れることにより、簡素で利便性
が高く、かつ、IFRS第16号の定めを個別財務諸表に用いても、基本的に修正が不要となることを目指した
リース会計基準等が公表されました。
借手の会計処理として、借手のリースの費用配分の方法については、IFRS第16号と同様に、リースがファ
イナンス・リースであるかオペレーティング・リースであるかにかかわらず、全てのリースについて使用権
資産に係る減価償却費及びリース負債に係る利息相当額を計上する単一の会計処理モデルが適用されます。
(2)適用予定日
2028年12月期の期首から適用します。
(3)当該会計基準等の適用による影響
「リースに関する会計基準」等の適用による財務諸表に与える影響額については、現時点で評価中であり
ます。
62/100
EDINET提出書類
日本エアーテック株式会社(E02421)
有価証券報告書
(表示方法の変更)
(貸借対照表)
前事業年度において、「投資その他の資産」の「その他」に含めていた「長期貸付金」については、金額的重
要性が増したため、当事業年度より独立掲記することとしました。この表示方法の変更を反映させるため、前事
業年度の財務諸表の組替えを行っております。
この結果、前事業年度の貸借対照表において、「投資その他の資産」の「その他」に表示していた51,948千円
は、「長期貸付金」15,300千円、「その他」36,648千円として組み替えております。
(キャッシュ・フロー計算書)
前事業年度において、「投資活動によるキャッシュ・フロー」の「その他」に含めていた「貸付けによる支
出」及び「貸付金の回収による収入」については、金額的重要性が増したため、当事業年度より独立掲記するこ
ととしました。この表示方法の変更を反映させるため、前事業年度の財務諸表の組替えを行っております。
この結果、前事業年度のキャッシュ・フロー計算書において、「投資活動によるキャッシュ・フロー」の「そ
の他」に表示していた△13,644千円は、「貸付けによる支出」△17,000千円、「貸付金の回収による収入」100
千円、「その他」3,255千円として組み替えております。
(追加情報)
(従業員等に信託を通じて自社の株式を交付する取引)
当社は、2021年12月24日開催の取締役会において、当社従業員に対する当社の中長期的な企業価値向上への
インセンティブの付与を目的として、「信託型従業員持株インセンティブ・プラン(E-Ship®)」(以下、
「本プラン」という。)を導入しておりましたが、当事業年度をもって終了しております。
(1) 取引の概要
本プランは、「日本エアーテック従業員持株会」(以下、「持株会」という。)に加入するすべての従業員
を対象とするインセンティブ・プランです。本プランでは、当社が信託銀行に「日本エアーテック従業員持株
会専用信託」(以下、「従持信託」という。)を設定し、従持信託は、設定後5年間にわたり持株会が取得す
ると見込まれる数の当社株式を予め取得します。その後は、従持信託から持株会に対して継続的に当社株式の
売却が行われるとともに、信託終了時点で従持信託内に株式売却益相当額が累積した場合には、当該株式売却
益相当額が残余財産として受益者適格要件を満たす者に分配されます。なお、当社は、従持信託が当社株式を
取得するための借入に対し保証することになるため、当社株価の下落により従持信託内に株式売却損相当額が
累積し、信託終了時点において従持信託内に当該株式売却損相当の借入金残債がある場合は、当社が当該残債
を弁済することになります。
なお、信託の終了は2026年12月29日を予定しておりましたが、従持信託が保有する当社株式の売却がすべて
完了したため、2025年12月29日をもって本プランは終了しております。
(2) 信託に残存する自社の株式
信託に残存する当社株式を、信託における帳簿価額(付随費用の金額を除く。)により、純資産の部に自己株
式として計上していましたが、本プランは終了したため、当該自己株式はありません。なお、前事業年度末の
帳簿価額は51,874千円、株式数は41,400株であります。
(3) 総額法の適用により計上された借入金の帳簿価額
本プランは終了したため、借入金の計上はありません。なお、前事業年度末の帳簿価額は55,900千円であり
ます。
63/100
EDINET提出書類
日本エアーテック株式会社(E02421)
有価証券報告書
(貸借対照表関係)
※1 担保に供している資産及びこれに対応する債務は次のとおりであります。
①
担保に供している資産
前事業年度
(2024年12月31日)
建物
土地
計
②
当事業年度
(2025年12月31日)
581,347千円
1,480,493
561,186千円
1,480,493
2,061,841
2,041,679
上記に対応する債務
前事業年度
(2024年12月31日)
当事業年度
(2025年12月31日)
短期借入金
1年内返済予定の長期借入金
265,000千円
44,268
465,000千円
148,600
長期借入金
38,279
456,137
347,547
1,069,737
計
※2 事業年度末日満期手形等
事業年度末日満期手形等の会計処理については、手形交換日等をもって決済処理をしております。なお、
当事業年度末日が金融機関の休業日であったため、次の事業年度末日満期手形等が期末残高に含まれており
ます。
前事業年度
(2024年12月31日)
当事業年度
(2025年12月31日)
受取手形
20,639千円
15,896千円
電子記録債権
59,076
68,502
(損益計算書関係)
※1 顧客との契約から生じる収益
売上高については、顧客との契約から生じる収益及びそれ以外の収益を区分して記載しておりません。
顧客との契約から生じる収益の金額は、財務諸表「注記事項(収益認識関係)1.顧客との契約から生じ
る収益を分解した情報」に記載しております。
※2 関係会社に係るものは次のとおりであります。
(自
至
前事業年度
2024年1月1日
2024年12月31日)
受取配当金
(自
至
136,309千円
当事業年度
2025年1月1日
2025年12月31日)
104,729千円
※3 一般管理費に含まれる研究開発費
(自
至
前事業年度
2024年1月1日
2024年12月31日)
158,463千円
(自
至
当事業年度
2025年1月1日
2025年12月31日)
132,466千円
なお、当期の製造費用に含まれている研究開発費はありません。
※4 事業撤退損
クリーンクリーニング事業からの撤退に伴い発生した固定資産の処分費用等を計上しております。
64/100
EDINET提出書類
日本エアーテック株式会社(E02421)
有価証券報告書
(株主資本等変動計算書関係)
前事業年度(自2024年1月1日至2024年12月31日)
1.発行済株式の種類及び総数並びに自己株式の種類及び株式数に関する事項
当事業年度期首株
式数(株)
当事業年度増加株
式数(株)
当事業年度減少株
式数(株)
当事業年度末株式
数(株)
10,508,450
29,970
−
10,538,420
10,508,450
29,970
−
10,538,420
普通株式(注)2.3.4.
142,295
319,132
37,400
424,027
合計
142,295
319,132
37,400
424,027
発行済株式
普通株式(注)1.
合計
自己株式
(注)1.普通株式の発行済株式の増加29,970株は、譲渡制限付株式報酬としての新株式発行による増加17,970株及びス
トック・オプションの行使による増加12,000株によるものであります。
2.普通株式の自己株式の増加319,132株は、2024年11月13日開催の取締役会決議による自己株式の取得による増
加318,200株、譲渡制限付株式の無償取得932株によるものであります。
3.普通株式の自己株式の減少37,400株は、「日本エアーテック従業員持株会専用信託」が従業員持株会へ株式を
売却したことによるものであります。
4.当事業年度末の自己株式数のうち、「信託型従業員持株インセンティブ・プラン(E-Ship®)」により野村信
託銀行株式会社(日本エアーテック従業員持株会専用口)が所有する株式数は、41,400株であります。
2.新株予約権及び自己新株予約権に関する事項
該当事項はありません。
3.配当に関する事項
(1) 配当金支払額
決議
株式の種類
配当金の総額
(千円)
1株当たり配当
額(円)
基準日
効力発生日
2024年3月28日
普通株式
626,697
60.0
2023年12月31日
2024年3月29日
定時株主総会
(注)2024年3月28日定時株主総会の決議による配当金の総額には、従業員持株会信託口が保有する当社株式に対する配
当金4,728千円が含まれております。
(2) 基準日が当期に属する配当のうち、配当の効力発生日が翌期となるもの
決議
2025年3月27日
定時株主総会
株式の種類
普通株式
配当金の総額
(千円)
配当の原資
507,789
利益剰余金
1株当たり配
当額(円)
50.0
基準日
効力発生日
2024年12月31日
2025年3月28日
(注)2025年3月27日定時株主総会の決議による配当金の総額には、従業員持株会信託口が保有する当社株式に対する配
当金2,070千円が含まれております。
65/100
EDINET提出書類
日本エアーテック株式会社(E02421)
有価証券報告書
当事業年度(自2025年1月1日至2025年12月31日)
1.発行済株式の種類及び総数並びに自己株式の種類及び株式数に関する事項
当事業年度期首株
式数(株)
当事業年度増加株
式数(株)
当事業年度減少株
式数(株)
当事業年度末株式
数(株)
10,538,420
−
−
10,538,420
10,538,420
−
−
10,538,420
424,027
189,927
63,220
550,734
424,027
189,927
63,220
550,734
発行済株式
普通株式
合計
自己株式
普通株式(注)1.2.
合計
(注)1.普通株式の自己株式の増加189,927株は、取締役会決議に基づく取得188,400株、単元未満株式の買取請求によ
る増加120株及び従業員持株会向け譲渡制限付株式インセンティブの無償取得による増加1,407株によるもので
あります。
2.普通株式の自己株式の減少63,220株は、「日本エアーテック従業員持株会専用信託」が従業員持株会へ株式を
売却したことによる減少41,400株、譲渡制限付株式報酬としての自己株式の処分による減少7,000株及び従業
員持株会向け譲渡制限付株式インセンティブとしての自己株式の処分による減少14,820株によるものでありま
す。
2.新株予約権及び自己新株予約権に関する事項
該当事項はありません。
3.配当に関する事項
(1) 配当金支払額
決議
株式の種類
配当金の総額
(千円)
1株当たり配当
額(円)
基準日
効力発生日
2025年3月27日
普通株式
507,789
50.0
2024年12月31日
2025年3月28日
定時株主総会
(注)2025年3月27日定時株主総会の決議による配当金の総額には、従業員持株会信託口が保有する当社株式に対する配
当金2,070千円が含まれております。
(2) 基準日が当期に属する配当のうち、配当の効力発生日が翌期となるもの
決議
2026年3月27日
定時株主総会
株式の種類
普通株式
配当金の総額
(千円)
配当の原資
549,322
利益剰余金
66/100
1株当たり配
当額(円)
55.0
基準日
効力発生日
2025年12月31日
2026年3月30日
EDINET提出書類
日本エアーテック株式会社(E02421)
有価証券報告書
(キャッシュ・フロー計算書関係)
※1 現金及び現金同等物の期末残高と貸借対照表に記載されている科目の金額との関係
前事業年度
(自 2024年1月1日
至 2024年12月31日)
(自
至
当事業年度
2025年1月1日
2025年12月31日)
現金及び預金勘定
預入期間が3ヶ月を超える定期預金
有価証券勘定
2,748,627千円
△557,249
728
3,707,142千円
△457,443
−
現金及び現金同等物
2,192,106
3,249,699
2 重要な非資金取引の内容
(1) 譲渡制限付株式報酬としての新株発行
前事業年度
(自 2024年1月1日
至 2024年12月31日)
譲渡制限付株式報酬としての新株の発行による
資本金増加額
譲渡制限付株式報酬としての新株の発行による
資本準備金増加額
(自
至
当事業年度
2025年1月1日
2025年12月31日)
10,710千円
−千円
10,710
−
(2) 譲渡制限付株式報酬における自己株式の処分
前事業年度
(自 2024年1月1日
至 2024年12月31日)
自己株式の処分差損
自己株式の減少額
(自
至
当事業年度
2025年1月1日
2025年12月31日)
−千円
−
829千円
24,612
(リース取引関係)
(借主側)
1.ファイナンス・リース取引
所有権移転外ファイナンス・リース取引
① リース資産の内容
(ア)有形固定資産
事業における生産設備(主に工具、器具及び備品)であります。
(イ)無形固定資産
ソフトウエアであります。
② リース資産の減価償却の方法
重要な会計方針「3.固定資産の減価償却の方法」に記載のとおりであります。
(金融商品関係)
1.金融商品の状況に関する事項
(1) 金融商品に対する取組方針
当社は、資金運用については、短期的で低リスクの金融商品に限定し、また、資金調達については、金融
機関からの借入、又は、社債等の資金市場からの調達による方針であります。
(2) 金融商品の内容及びそのリスク並びにリスク管理体制
営業債権である受取手形、売掛金、電子記録債権及び長期貸付金は、顧客の信用リスクに晒されておりま
す。当該リスクに関しては、新規取引発生時に顧客の信用状況について社内での審議・承認のプロセスを踏
むことを徹底しております。また、取引先ごとの期日管理及び残高管理を行うとともに、定期的に主な取引
先の信用状況を確認しております。
有価証券は、マネー・マネジメント・ファンド等の公社債投資信託等、安全性と流動性の高い金融商品で
あります。
投資有価証券は、市場価格の変動リスクに晒されておりますが、主に業務上の関係を有する企業の株式で
あり、定期的に市況や取引先企業との関係を勘案して保有の妥当性を検討しております。また、満期保有目
的の債券は、格付けの高い債券のみを対象とする方針としているため、信用リスクは僅少であります。
67/100
EDINET提出書類
日本エアーテック株式会社(E02421)
有価証券報告書
営業債務である支払手形、買掛金、電子記録債務、未払金及び預り金は、1年以内の支払期日でありま
す。
借入金及びリース債務は、主に営業取引に係る資金調達であります。
営業債務、借入金、未払金及びリース債務は流動性リスクに晒されておりますが、月次で資金繰り計画を
作成する等の方法により、リスクを管理しております。
68/100
EDINET提出書類
日本エアーテック株式会社(E02421)
有価証券報告書
(3) 金融商品の時価等に関する事項についての補足説明
金融商品の時価の算定においては変動要因を織り込んでいるため、異なる前提条件等を採用することによ
り、当該価格が変動することがあります。
2.金融商品の時価等に関する事項
貸借対照表計上額、時価及びこれらの差額については、次のとおりであります。
前事業年度(2024年12月31日)
貸借対照表計上額
(千円)
時価
(千円)
差額
(千円)
(1)投資有価証券
満期保有目的の債券
404,946
383,905
△21,041
資産計
404,946
383,905
△21,041
(1)長期借入金(※2)
155,631
154,476
△1,154
(2)リース債務(※3)
7,839
7,648
△190
163,470
162,124
△1,345
負債計
(※1)現金及び預金、受取手形、電子記録債権、売掛金、有価証券(マネー・マネジメント・ファンド)、支払手形、電
子記録債務、買掛金、短期借入金、未払金、未払法人税等並びに預り金は、現金・現金同等物であること又は短
期間で決済または返済されるため、時価が帳簿価額に近似することから記載を省略しております。また、「破産
更生債権等」については、回収見込額等に基づいて貸倒見積額を算定しているため、時価は決算日における貸借
対照表価額から現在の貸倒見積高を控除した金額に近似していることから、注記を省略しております。
(※2)1年内返済予定の長期借入金を含めております。
(※3)1年内返済予定のリース債務を含めております。
当事業年度(2025年12月31日)
貸借対照表計上額
(千円)
時価
(千円)
差額
(千円)
(1)投資有価証券
満期保有目的の債券
404,062
376,787
△27,275
51,716
51,828
112
455,779
428,615
△27,163
(1)長期借入金(※3)
974,043
959,975
△14,067
(2)リース債務(※4)
12,323
11,936
△387
986,366
971,911
△14,454
(2)長期貸付金(※2)
資産計
負債計
(※1)現金及び預金、受取手形、電子記録債権、売掛金、有価証券、支払手形、電子記録債務、買掛金、短期借入金、
未払金、未払法人税等並びに預り金は、現金・現金同等物であること又は短期間で決済または返済されるため、
時価が帳簿価額に近似することから記載を省略しております。また、「破産更生債権等」については、回収見込
額等に基づいて貸倒見積額を算定しているため、時価は決算日における貸借対照表価額から現在の貸倒見積高を
控除した金額に近似していることから、注記を省略しております。
(※2)1年内回収予定の長期貸付金を含めております。
(※3)1年内返済予定の長期借入金を含めております。
(※4)1年内返済予定のリース債務を含めております。
(注)1.市場価格のない株式等は、上表には含まれておりません。当該金融商品の貸借対照表計上額は以下のとおりで
あります。
区分
前事業年度
(2024年12月31日)
(千円)
当事業年度
(2025年12月31日)
(千円)
投資有価証券(非上場株式)
111,949
113,704
関係会社出資金
134,741
134,741
69/100
EDINET提出書類
日本エアーテック株式会社(E02421)
有価証券報告書
(注)2.金銭債権及び満期のある有価証券の決算日後の償還予定額
前事業年度(2024年12月31日)
1年超
5年以内
(千円)
1年以内
(千円)
預金
5年超
10年以内
(千円)
10年超
(千円)
2,747,590
−
−
−
受取手形
444,276
−
−
−
売掛金
2,473,271
−
−
−
電子記録債権
1,682,441
−
−
−
国債、地方債等
−
100,000
−
−
社債
−
100,000
200,000
−
7,347,580
200,000
200,000
−
有価証券及び投資有価証券
満期保有目的の債券
合計
破産更生債権等は、償還予定額が見込めないため記載しておりません。
当事業年度(2025年12月31日)
1年超
5年以内
(千円)
1年以内
(千円)
預金
5年超
10年以内
(千円)
10年超
(千円)
3,705,997
−
−
−
受取手形
202,928
−
−
−
売掛金
2,296,838
−
−
−
電子記録債権
1,622,463
−
−
−
国債、地方債等
−
100,000
−
−
社債
−
100,000
200,000
−
5,958
22,000
23,758
−
7,834,187
222,000
223,758
−
有価証券及び投資有価証券
満期保有目的の債券
長期貸付金
合計
破産更生債権等は、償還予定額が見込めないため記載しておりません。
(注)3.長期借入金及びリース債務の決算日後の返済予定額
前事業年度(2024年12月31日)
1年以内
(千円)
1年超
2年以内
(千円)
2年超
3年以内
(千円)
3年超
4年以内
(千円)
4年超
5年以内
(千円)
5年超
(千円)
長期借入金(※)
54,264
95,230
6,137
−
−
−
リース債務
2,189
1,407
1,339
1,339
1,339
223
合計
56,453
96,637
7,476
1,339
1,339
223
(※)
長期借入金のうち55,900千円は「信託型従業員持株インセンティブ・プラン(E-Ship®)」の導入に伴い、「日
本エアーテック従業員持株会専用信託」が借り入れたものです。当該信託が保有する株式の売却代金相当額を
返済することになっており、個々の分割返済について金額による定めはないため、当該借入金の事業年度末残
高を最終返済日に一括返済した場合を想定して記載しております。
70/100
EDINET提出書類
日本エアーテック株式会社(E02421)
有価証券報告書
当事業年度(2025年12月31日)
1年以内
(千円)
1年超
2年以内
(千円)
2年超
3年以内
(千円)
3年超
4年以内
(千円)
4年超
5年以内
(千円)
5年超
(千円)
長期借入金
182,178
148,985
142,848
142,848
142,848
214,336
リース債務
3,137
3,137
3,137
2,688
223
−
合計
185,315
152,122
145,985
145,536
143,071
214,336
3.金融商品の時価のレベルごとの内訳等に関する事項
金融商品の時価を、時価の算定に係るインプットの観察可能性及び重要性に応じて、以下の3つのレベル
に分類しております。
レベル1の時価:観察可能な時価の算定に係るインプットのうち、活発な市場において形成される当該時
価の算定の対象となる資産又は負債に関する相場価格により算定した時価
レベル2の時価:観察可能な時価の算定に係るインプットのうち、レベル1のインプット以外の時価の算
定に係るインプットを使用して算定した時価
レベル3の時価:観察できない時価の算定に係るインプットを使用して算定した時価
時価の算定に重要な影響を与えるインプットを複数使用している場合には、それらのインプットがそれぞ
れ属するレベルのうち、時価の算定における優先順位が最も低いレベルに時価を分類しております。
71/100
EDINET提出書類
日本エアーテック株式会社(E02421)
有価証券報告書
時価をもって貸借対照表に計上している金融商品以外の金融商品
前事業年度(2024年12月31日)
時価(千円)
区分
レベル1
レベル2
レベル3
合計
有価証券及び投資有価証券
満期保有目的の債券
国債、地方債等
−
98,181
−
98,181
社債
−
285,724
−
285,724
長期借入金(1年内含む)
−
154,476
−
154,476
リース債務(1年内含む)
−
7,648
−
7,648
当事業年度(2025年12月31日)
時価(千円)
区分
レベル1
レベル2
レベル3
合計
有価証券及び投資有価証券
満期保有目的の債券
国債、地方債等
−
97,278
−
97,278
社債
−
279,509
−
279,509
長期貸付金(1年内含む)
−
51,828
−
51,828
長期借入金(1年内含む)
−
959,975
−
959,975
リース債務(1年内含む)
−
11,936
−
11,936
(注)時価の算定に用いた評価技法及び時価の算定に係るインプットの説明
有価証券及び投資有価証券
満期保有目的の債券の時価は取引金融機関等から提示された価格によっております。市場での取引頻度が低く、
活発な市場における相場価格とは認められないため、その時価をレベル2の時価に分類しております。
長期貸付金(1年内含む)
長期貸付金の時価は将来キャッシュ・フローを国債の利回り等適切な指標に信用スプレッドを上乗せした利率で
割り引いた現在価値により算定しており、レベル2の時価に分類しております。
長期借入金(1年内含む)
長期借入金の時価は元利金の合計額を、同様の新規借入を行った場合に想定される利率で割り引いた現在価値に
より算定しており、レベル2の時価に分類しております。
リース債務(1年内含む)
リース債務の時価は元利金の合計額を、同様のリース取引を行った場合に想定される利率で割り引いた現在価値
により算定しており、レベル2の時価に分類しております。
72/100
EDINET提出書類
日本エアーテック株式会社(E02421)
有価証券報告書
(有価証券関係)
1.関係会社出資金
市場価格のない株式等の貸借対照表計上額
区分
関係会社出資金
前事業年度
(2024年12月31日)
(千円)
当事業年度
(2025年12月31日)
(千円)
134,741
134,741
2.満期保有目的の債券
前事業年度(2024年12月31日)
種類
時価が貸借
対照表計上
額を超える
もの
時価が貸借
対照表計上
額を超えな
いもの
貸借対照表計上額
(千円)
時価
(千円)
差額
(千円)
(1)国債・地方債等
−
−
−
(2)社債
−
−
−
(3)その他
−
−
−
小計
−
−
−
(1)国債・地方債等
100,000
98,181
△1,819
(2)社債
304,946
285,724
△19,222
(3)その他
−
−
−
小計
404,946
383,905
△21,041
404,946
383,905
△21,041
合計
当事業年度(2025年12月31日)
種類
時価が貸借
対照表計上
額を超える
もの
時価が貸借
対照表計上
額を超えな
いもの
貸借対照表計上額
(千円)
時価
(千円)
差額
(千円)
(1)国債・地方債等
−
−
−
(2)社債
−
−
−
(3)その他
−
−
−
小計
−
−
−
(1)国債・地方債等
100,000
97,278
△2,722
(2)社債
304,062
279,509
△24,553
(3)その他
−
−
−
小計
404,062
376,787
△27,275
404,062
376,787
△27,275
合計
73/100
EDINET提出書類
日本エアーテック株式会社(E02421)
有価証券報告書
3.その他有価証券
前事業年度(2024年12月31日)
種類
貸借対照表計上額
(千円)
(1)株式
貸借対照表計上
額が取得原価を (2)その他
超えるもの
小計
(1)株式
貸借対照表計上
額が取得原価を (2)その他
超えないもの
小計
合計
取得原価
(千円)
差額
(千円)
−
−
−
728
553
175
728
553
175
−
−
−
−
−
−
−
−
−
728
553
175
(注)市場価格のない株式等は上表の「その他有価証券」には含めておりません。当該金融商品は非上場株式であり、
その貸借対照表計上額は111,949千円であります。
当事業年度(2025年12月31日)
当事業年度末において、その他有価証券の残高はありません。また、市場価格のない株式等は「その他有
価証券」には含めておりません。当該金融商品は非上場株式であり、その貸借対照表計上額は113,704千円
であります。
(デリバティブ取引関係)
当社は、デリバティブ取引を全く行っておりませんので該当事項はありません。
74/100
EDINET提出書類
日本エアーテック株式会社(E02421)
有価証券報告書
(退職給付関係)
1.採用している退職給付制度の概要
当社は、従業員の退職給付に充てるため、退職金規程に基づく社内積立の退職一時金制度の他、積立型の
確定給付制度及び確定拠出年金制度を採用しております。
確定給付企業年金制度(積立型制度であります)では、給与と勤務期間に基づいた一時金又は年金を支給
しております。
退職一時金制度では、退職給付として、給与と勤務期間に基づいた一時金を支給しております。
2.確定給付制度
(1) 退職給付債務の期首残高と期末残高の調整表
(自
至
前事業年度
2024年1月1日
2024年12月31日)
退職給付債務の期首残高
(自
至
当事業年度
2025年1月1日
2025年12月31日)
1,414,387千円
1,444,297千円
勤務費用
78,796
78,448
利息費用
15,462
22,712
数理計算上の差異の発生額
27,011
△10,095
退職給付の支払額
△91,359
△86,717
退職給付債務の期末残高
1,444,297
1,448,644
(2) 年金資産の期首残高と期末残高の調整表
(自
至
前事業年度
2024年1月1日
2024年12月31日)
(自
至
当事業年度
2025年1月1日
2025年12月31日)
年金資産の期首残高
1,123,074千円
期待運用収益
28,077
1,319,543千円
65,977
数理計算上の差異の発生額
130,244
101,678
事業主からの拠出額
128,222
158,753
退職給付の支払額
△90,075
△78,899
年金資産の期末残高
1,319,543
1,567,052
(3) 退職給付債務及び年金資産の期末残高と貸借対照表に計上された退職給付引当金の調整表
前事業年度
(2024年12月31日)
積立型制度の退職給付債務
年金資産
1,366,005千円
当事業年度
(2025年12月31日)
1,374,047千円
△1,319,543
△1,567,052
46,461
△193,005
非積立型制度の退職給付債務
78,292
74,597
未積立退職給付債務
124,753
△118,408
未認識数理計算上の差異
357,286
448,410
貸借対照表に計上された負債と資産の純額
482,040
330,002
退職給付引当金
482,040
330,002
貸借対照表に計上された負債と資産の純額
482,040
330,002
75/100
EDINET提出書類
日本エアーテック株式会社(E02421)
有価証券報告書
(4) 退職給付費用及びその内訳項目の金額
(自
至
前事業年度
2024年1月1日
2024年12月31日)
勤務費用
利息費用
78,796千円
15,462
(自
至
当事業年度
2025年1月1日
2025年12月31日)
78,448千円
22,712
期待運用収益
△28,077
△65,977
数理計算上の差異の費用処理額
割増退職金
△16,043
22,837
△20,650
19,580
確定給付制度に係る退職給付費用
72,975
34,113
(5) 年金資産に関する事項
① 年金資産の主な内訳
年金資産合計に対する主な分類ごとの比率は、次のとおりであります。
前事業年度
(2024年12月31日)
当事業年度
(2025年12月31日)
40.2%
56.5
3.3
40.4%
56.0
3.6
100.0
100.0
債券
株式
その他
合
計
② 長期期待運用収益率の設定方法
年金資産の長期期待運用収益率を決定するため、現在及び予想される年金資産の配分と、年金資産を構
成する多様な資産からの現在及び将来期待される長期の収益率を考慮しております。
(6) 数理計算上の計算基礎に関する事項
当事業年度末における主要な数理計算上の計算基礎
割引率
前事業年度
(2024年12月31日)
当事業年度
(2025年12月31日)
0.736〜1.114%
1.250〜1.591%
長期期待運用収益率
2.5
5.0
3.確定拠出制度
前事業年度
(2024年12月31日)
確定拠出制度への要拠出額
32,297千円
76/100
当事業年度
(2025年12月31日)
33,140千円
EDINET提出書類
日本エアーテック株式会社(E02421)
有価証券報告書
(ストック・オプション等関係)
1.ストック・オプションに係る費用計上額及び科目名
該当事項はありません。
2.権利不行使による失効により利益として計上した金額
(単位:千円)
前事業年度
(自 2024年1月1日
至 2024年12月31日)
新株予約権戻入益
6,393
3.ストック・オプションの内容、規模及びその変動状況
該当事項はありません。
4.ストック・オプションの権利確定数の見積方法
該当事項はありません。
77/100
当事業年度
(自 2025年1月1日
至 2025年12月31日)
−
EDINET提出書類
日本エアーテック株式会社(E02421)
有価証券報告書
(税効果会計関係)
1.繰延税金資産及び繰延税金負債の発生の主な原因別の内訳
前事業年度
(2024年12月31日)
当事業年度
(2025年12月31日)
繰延税金資産
未払事業税
21,778千円
19,631千円
賞与引当金
36,487
39,675
退職給付引当金
147,600
104,016
棚卸資産評価損
30,422
38,339
投資有価証券評価損
4,208
4,332
貸倒引当金
627
59
減価償却費
5,774
7,829
受注損失引当金
5,238
1,798
製品保証引当金
4,270
3,727
922
−
債務保証損失引当金
資産除去債務
5,371
5,614
譲渡制限付株式報酬
9,550
11,653
17,470
29,852
繰延税金資産小計
その他
289,724
266,532
評価性引当額
△9,375
△9,553
繰延税金資産合計
280,349
256,978
資産除去債務に対応する除去費用
△2,541
△2,522
その他有価証券評価差額金
△7,942
△8,729
繰延税金負債合計
△10,483
△11,252
繰延税金資産の純額
269,865
245,726
繰延税金負債
2.法定実効税率と税効果会計適用後の法人税等の負担率との間に重要な差異がある時の、当該差異の原因と
なった主要な項目別の内訳
前事業年度
(2024年12月31日)
法定実効税率
30.6%
(調整)
法人税額の特別控除
△3.7
受取配当金等永久に益金に算入されない項目
△2.5
住民税均等割
1.2
その他
0.4
税効果会計適用後の法人税等の負担率
26.0
当事業年度
(2025年12月31日)
法定実効税率と税効果
会計適用後の法人税等の
負担率との間の差異が法
定実効税率の100分の5
以下であるため注記を省
略しております。
3.法人税等の税率の変更による繰延税金資産及び繰延税金負債の金額の修正
「所得税法等の一部を改正する法律」(令和7年法律第13号)が2025年3月31日に国会で成立したことに
伴い、2026年4月1日以後開始する事業年度より、「防衛特別法人税」の課税が行われることになりまし
た。
これに伴い、2027年1月1日に開始する事業年度以降に解消が見込まれる一時差異に係る繰延税金資産及
び繰延税金負債については、法定実効税率を30.6%から31.5%に変更し計算しております。
この税率変更により、財務諸表に与える影響は軽微であります。
78/100
EDINET提出書類
日本エアーテック株式会社(E02421)
有価証券報告書
(持分法損益等)
関連会社に対する投資に関する事項
(自
至
前事業年度
2024年1月1日
2024年12月31日)
関連会社に対する投資の金額
持分法を適用した場合の投資の金額
持分法を適用した場合の投資利益の金額
(自
至
当事業年度
2025年1月1日
2025年12月31日)
134,741千円
400,895
121,639
134,741千円
392,408
88,024
(収益認識関係)
1.顧客との契約から生じる収益を分解した情報
前事業年度(自 2024年1月1日至 2024年12月31日)
財又はサービスの収益認識の時期別
(単位:千円)
報告セグメント
クリーンエアーシステム事業
一時点で移転される財又はサービス
10,299,170
一定の期間にわたり移転される財又はサービス
3,218,603
顧客との契約から生じる収益
13,517,774
その他の収益
−
外部顧客への売上高
13,517,774
当事業年度(自 2025年1月1日至 2025年12月31日)
財又はサービスの収益認識の時期別
(単位:千円)
報告セグメント
クリーンエアーシステム事業
一時点で移転される財又はサービス
10,439,566
一定の期間にわたり移転される財又はサービス
3,711,534
顧客との契約から生じる収益
14,151,101
その他の収益
−
外部顧客への売上高
14,151,101
2.顧客との契約から生じる収益を理解するための基礎となる情報
財務諸表「注記事項(重要な会計方針)6.収益及び費用の計上基準」に記載のとおりであります。
79/100
EDINET提出書類
日本エアーテック株式会社(E02421)
有価証券報告書
3.顧客との契約に基づく履行義務の充足と当該契約から生じるキャッシュ・フローとの関係並びに当事業年
度末において存在する顧客との契約から翌事業年度以降に認識すると見込まれる収益の金額及び時期に関す
る情報
(1) 契約資産及び契約負債の残高等
(単位:千円)
前事業年度
当事業年度
顧客との契約から生じた債権(期首残高)
4,336,238
4,599,989
顧客との契約から生じた債権(期末残高)
4,599,989
4,122,231
契約資産(期首残高)
1,246,200
1,368,839
契約資産(期末残高)
1,368,839
1,458,654
契約負債(期首残高)
39,768
224,897
契約負債(期末残高)
224,897
179,128
契約資産は、主として一定の期間にわたり履行義務が充足される契約において、収益を認識したが、未
請求の履行義務に係る対価に対する権利に関するものであります。契約資産は、対価に対する権利が無条
件になった時点で顧客との契約から生じた債権に振り替えられます。
契約負債は、主として契約の支払条件に基づき顧客から受取った前受金に関するものであり、貸借対照
表上、流動負債の前受金に計上しております。
前事業年度に認識された収益の額のうち期首現在の契約負債残高に含まれていた額は22,976千円であり
ます。
当事業年度に認識された収益の額のうち期首現在の契約負債残高に含まれていた額は223,133千円であ
ります。
(2) 残存履行義務に配分した取引価格
当社では、残存履行義務に配分した取引価格については、当初に予想される契約期間が1年を超える重
要な契約がないため、実務上の便法を適用し、記載を省略しております。また、顧客との契約から生じる
対価の中に、取引価格に含まれていない重要な金額はありません。
80/100
EDINET提出書類
日本エアーテック株式会社(E02421)
有価証券報告書
(セグメント情報等)
【セグメント情報】
報告セグメントの概要
前事業年度(自 2024年1月1日至 2024年12月31日)及び
当事業年度(自 2025年1月1日至 2025年12月31日)
当社はクリーンエアーシステム事業の単一セグメントであるため、記載を省略しております。
【関連情報】
前事業年度(自
2024年1月1日
至
2024年12月31日)
1.製品及びサービスごとの情報
単一の製品・サービスの区分の外部顧客への売上高が損益計算書の売上高の90%を超えるため、記載を
省略しております。
2.地域ごとの情報
(1)売上高
本邦の外部顧客への売上高が損益計算書の売上高の90%を超えるため、記載を省略しております。
(2)有形固定資産
本邦以外に所在している有形固定資産がないため、記載を省略しております。
3.主要な顧客ごとの情報
損益計算書の売上高の10%を超える特定の顧客への売上高がないため、記載を省略しております。
当事業年度(自
2025年1月1日
至
2025年12月31日)
1.製品及びサービスごとの情報
単一の製品・サービスの区分の外部顧客への売上高が損益計算書の売上高の90%を超えるため、記載を
省略しております。
2.地域ごとの情報
(1)売上高
本邦の外部顧客への売上高が損益計算書の売上高の90%を超えるため、記載を省略しております。
(2)有形固定資産
本邦以外に所在している有形固定資産がないため、記載を省略しております。
3.主要な顧客ごとの情報
損益計算書の売上高の10%を超える特定の顧客への売上高がないため、記載を省略しております。
81/100
EDINET提出書類
日本エアーテック株式会社(E02421)
有価証券報告書
【報告セグメントごとの固定資産の減損損失に関する情報】
前事業年度(自 2024年1月1日至 2024年12月31日)
該当事項はありません。
当事業年度(自
2025年1月1日
至
2025年12月31日)
該当事項はありません。
【報告セグメントごとののれんの償却額及び未償却残高に関する情報】
前事業年度(自 2024年1月1日至 2024年12月31日)
該当事項はありません。
当事業年度(自
2025年1月1日
至
2025年12月31日)
該当事項はありません。
【報告セグメントごとの負ののれん発生益に関する情報】
前事業年度(自 2024年1月1日至 2024年12月31日)
該当事項はありません。
当事業年度(自
2025年1月1日
至
2025年12月31日)
該当事項はありません。
82/100
EDINET提出書類
日本エアーテック株式会社(E02421)
有価証券報告書
【関連当事者情報】
前事業年度(自 2024年1月1日
関連当事者との取引
(1) 法人主要株主等
種類
会社等の
名称又は
氏名
所在地
資本金又
は出資金
(千円)
エアー
主要株主
テック
埼玉県
アシス
草加市
至
2024年12月31日)
事業の内
容又は職
業
不動産の
10,000
管理・賃
貸借
ト㈱
議決権等の
所有(被所
有)割合
(%)
(被所有)
直接
15.68
関連当事
者との関
係
役員の兼任
取引の
内容
自己株式
の取得(注)
取引金
額
(千円)
科目
期末残
高
(千円)
372,000
−
−
(注)
2024年11月13日開催の取締役会決議に基づき、東京証券取引所の自己株式立会外買付取引(ToSTNeT3)により、2024年11月14日にエアーテックアシスト株式会社から当社自己株式を取得した取引で
す。その総数は、当社株式300,000株(発行済株式総数(自己株式を除く)に対する取得時点におけ
る割合は2.88%)であります。
(2) 関連会社等
種類
会社等の
名称又は
氏名
所在地
蘇州安泰空
中国江蘇省
関連会社気技術有限
蘇州市
公司
(注)
資本金又
は出資金
(千米ド
ル)
事業の内
容又は職
業
議決権等の
所有(被所
有)割合
(%)
関連当事
者との関
係
取引金
額
(千円)
科目
期末残
高
(千円)
クリーンエ
技術供与及
(所有)
受取配当金
5,000 アー機器の
び一部機器
136,309
直接 25.0
(注)
製造・販売
の製造委託
−
−
取引金
額
(千円)
科目
期末残
高
(千円)
クリーンエ
技術供与及
(所有)
受取配当金
5,000 アー機器の
び一部機器
104,729
直接 25.0
(注)
製造・販売
の製造委託
−
−
取引の
内容
受取配当金については、グループ配当方針に基づき決定しております。
当事業年度(自 2025年1月1日
関連当事者との取引
(1) 法人主要株主等
至
2025年12月31日)
該当事項はありません。
(2) 関連会社等
種類
会社等の
名称又は
氏名
所在地
蘇州安泰空
中国江蘇省
関連会社気技術有限
蘇州市
公司
(注)
資本金又
は出資金
(千米ド
ル)
事業の内
容又は職
業
議決権等の
所有(被所
有)割合
(%)
関連当事
者との関
係
取引の
内容
受取配当金については、グループ配当方針に基づき決定しております。
83/100
EDINET提出書類
日本エアーテック株式会社(E02421)
有価証券報告書
(1株当たり情報)
(自
至
前事業年度
2024年1月1日
2024年12月31日)
1株当たり純資産額
1株当たり当期純利益
(自
至
1,414.01円
109.75円
当事業年度
2025年1月1日
2025年12月31日)
1株当たり純資産額
1株当たり当期純利益
1,478.97円
111.96円
(注)1. 潜在株式調整後1株当たり当期純利益については、潜在株式が存在しないため記載しておりません。
2. 1株当たり純資産額の算定上の基礎は、以下のとおりであります。
前事業年度
(2024年12月31日)
純資産の部の合計額(千円)
当事業年度
(2025年12月31日)
14,301,852
純資産の合計額から控除する金額(千円)
14,771,504
−
−
普通株式に係る期末の純資産額(千円)
14,301,852
14,771,504
1株当たり純資産額の算定に用いられた
期末の普通株式の数(株)
10,114,393
9,987,686
(注)3. 1株当たり当期純利益の算定上の基礎は、以下のとおりであります。
(自
至
前事業年度
2024年1月1日
2024年12月31日)
(自
至
当事業年度
2025年1月1日
2025年12月31日)
1株当たり当期純利益
当期純利益(千円)
1,137,376
1,131,475
普通株主に帰属しない金額(千円)
−
−
普通株式に係る当期純利益(千円)
1,137,376
1,131,475
普通株式の期中平均株式数(株)
10,363,250
10,105,853
(注)4. 当社は、「信託型従業員持株インセンティブ・プラン(E-Ship®)」を導入しております。「日本エアー
テック従業員持株会専用信託」が保有する当社株式については、財務諸表において自己株式として計上
しており、1株当たり当期純利益の算定上、期中平均株式数の計算において控除する自己株式に含めて
おります。また、1株当たり純資産額の算定上、期末発行済株式総数から控除する自己株式数に含めて
おります。
1株当たり当期純利益の算定上、控除した当該自己株式の期中平均株式数は、前事業年度60,800株、当
事業年度20,916株であり、1株当たり純資産額の算定上、控除した当該自己株式の期末株式数は、前事
業年度末 41,400株、当事業年度末はありません。なお、当該「信託型従業員持株インセンティブ・プラ
ン(E-Ship®)」は2025年12月29日をもって終了しております。
(重要な後発事象)
該当事項はありません。
84/100
EDINET提出書類
日本エアーテック株式会社(E02421)
有価証券報告書
⑤【附属明細表】
【有形固定資産等明細表】
当期首残高
(千円)
当期増加額
(千円)
当期減少額
(千円)
当期末残高
(千円)
当期末減価
償却累計額
または償却
累計額
(千円)
建物
4,182,146
29,806
20,260
4,191,692
1,790,207
119,559
2,401,484
構築物
230,984
203
−
231,188
114,353
14,959
116,834
機械及び装置
740,406
38,275
7,205
771,476
409,949
76,762
361,526
車両運搬具
12,724
−
−
12,724
11,522
839
1,201
工具、器具及び備品
426,537
45,066
18,734
452,869
379,219
32,217
73,649
2,508,960
296,189
−
2,805,149
−
−
2,805,149
24,420
639,766
24,420
639,766
−
−
639,766
8,126,180
1,049,307
70,619
9,104,867
2,705,253
244,339
6,399,614
ソフトウエア
175,497
20,379
−
195,877
160,447
20,136
35,429
リース資産
42,382
−
−
42,382
42,382
−
−
電話加入権
3,471
−
−
3,471
−
−
3,471
305
−
−
305
77
20
227
221,657
20,379
−
242,037
202,908
20,156
39,128
13,445
7,962
9,695
11,712
−
−
11,712
資産の種類
当期償却額
(千円)
差引当期末
残高
(千円)
有形固定資産
土地
建設仮勘定
有形固定資産計
無形固定資産
水道施設利用権
無形固定資産計
長期前払費用
(注)土地の増加額は草加工場隣接地の取得によるものであります。
建設仮勘定の増加額は主に赤城スマートファクトリー第2工場(仮称)の建設によるものであります。
【社債明細表】
該当事項はありません。
85/100
EDINET提出書類
日本エアーテック株式会社(E02421)
有価証券報告書
【借入金等明細表】
当期首残高
(千円)
当期末残高
(千円)
平均利率
(%)
短期借入金
380,000
580,000
1.02
−
1年以内に返済予定の長期借入金
54,264
182,178
1.17
−
1年以内に返済予定のリース債務
2,189
3,137
−
−
1.37
2027年1.31〜
2032年
区分
長期借入金(1年以内に返済予定のものを除く。)
101,367
791,865
返済期限
6.30
リース債務(1年以内に返済予定のものを除く。)
5,650
9,186
−
2027年1.4〜
2030年
2.4
その他有利子負債
合計
−
−
−
−
543,470
1,566,366
−
−
(注)1.「平均利率」については、期末借入金残高に対する加重平均利率を記載しております。
2.リース債務の平均利率については、リース料総額に含まれる利息相当額を控除する前の金額でリース債務を
貸借対照表に計上しているため、記載しておりません。
3.長期借入金及びリース債務(1年以内に返済予定のものを除く。)の貸借対照表日後5年内における1年ご
との返済予定額は次のとおりであります。
1年超2年以内
(千円)
2年超3年以内
(千円)
3年超4年以内
(千円)
4年超5年以内
(千円)
長期借入金
148,985
142,848
142,848
142,848
リース債務
3,137
3,137
2,688
223
86/100
EDINET提出書類
日本エアーテック株式会社(E02421)
有価証券報告書
【引当金明細表】
区分
当期首残高
(千円)
当期増加額
(千円)
当期減少額
(目的使用)
(千円)
当期減少額
(その他)
(千円)
当期末残高
(千円)
貸倒引当金
2,049
116
−
1,973
192
賞与引当金
119,162
129,575
119,162
−
129,575
製品保証引当金
13,948
10,094
−
11,867
12,175
受注損失引当金
17,107
5,873
−
17,107
5,873
債務保証損失引当金
3,014
−
3,014
−
−
(注)1. 貸倒引当金の「当期減少額」の「その他」は、一般債権の貸倒実績率による洗替額であります。
2. 製品保証引当金の「当期減少額(その他)」は、洗替による取崩額であります。
3. 受注損失引当金の「当期減少額(その他)」は、洗替による取崩額であります。
4. 退職給付引当金については、退職給付会計に関する注記に記載しているため、記載を省略しております。
【資産除去債務明細表】
当事業年度期首及び当事業年度末における資産除去債務の金額が当事業年度期首及び当事業年度末における負
債及び純資産の合計額の100分の1以下であるため、財務諸表等規則第125条の2の規定により記載を省略してお
ります。
87/100
EDINET提出書類
日本エアーテック株式会社(E02421)
有価証券報告書
(2)【主な資産及び負債の内容】
①
資産の部
a.現金及び預金
区分
金額(千円)
現金
1,145
預金の種類
当座預金
2,744,539
普通預金
214,344
外貨普通預金
212,077
定期預金
453,970
外貨定期預金
78,280
別段預金
2,785
小計
3,705,997
合計
3,707,142
b.受取手形
イ.相手先別内訳
相手先
金額(千円)
日本電子㈱
24,987
アクトロニクス㈱
13,666
㈱カーク
12,214
日の本研磨材㈱
11,847
㈱アオバサイエンス
10,701
その他
129,511
合計
202,928
ロ.期日別内訳
期日別
金額(千円)
2026年1月
84,120
2月
64,574
3月
34,209
4月
11,401
5月
8,622
合計
202,928
(注)期末日満期手形の会計処理については、手形交換日をもって決済処理をしております。なお、当期の末日が金融
機関の休日であったため、1月期日の金額には期末日満期手形15,896千円が含まれております。
88/100
EDINET提出書類
日本エアーテック株式会社(E02421)
有価証券報告書
c.電子記録債権
イ.相手先別内訳
相手先
金額(千円)
㈱山善
330,493
ユアサ商事㈱
105,709
㈱トキワ
102,461
㈱ダルトン
67,436
正晃㈱
47,280
その他
969,082
合計
1,622,463
d.売掛金
イ.相手先別内訳
相手先
金額(千円)
㈱きんでん
175,074
㈱ニューフレアテクノロジー
151,171
㈱ニコン・セル・イノベーション
103,037
東京エレクトロン九州㈱
101,137
富士フイルムヘルスケアマニュファクチャリング㈱
76,513
その他
1,689,903
合計
2,296,838
ロ.売掛金の発生及び回収並びに滞留状況
当期首残高
(千円)
(A)
2,473,271
当期発生高
(千円)
当期回収高
(千円)
(B)
(C)
15,397,174
15,573,606
当期末残高
(千円)
回収率(%)
滞留期間(日)
(D)
(C)
× 100
(A) + (B)
(A) + (D)
2
(B)
365
2,296,838
89/100
87.15
57
EDINET提出書類
日本エアーテック株式会社(E02421)
有価証券報告書
e.契約資産
イ.相手先別内訳
相手先
金額(千円)
㈱大林組
432,011
大成建設㈱
134,578
㈱ケーテー製作所
134,569
鹿島建設㈱
108,900
キユーピー㈱
104,536
その他
544,059
合計
1,458,654
f.商品及び製品
区分
金額(千円)
製品
クリーンルーム
10,001
クリーンルーム機器
732,523
クリーンブース
321,689
クリーンベンチ
63,580
バイオロジカリー機器
523,246
その他の製品
55,439
小計
1,706,481
半製品
HEPAフィルター
88,471
小計
88,471
商品
クリーンサプライ商品
19,996
小計
19,996
合計
1,814,949
90/100
EDINET提出書類
日本エアーテック株式会社(E02421)
有価証券報告書
g.仕掛品
区分
金額(千円)
クリーンルーム
31,667
クリーンルーム機器
107,216
クリーンブース
72,482
クリーンベンチ
14,841
バイオロジカリー機器
99,949
据付・保守サービス
115,401
その他の製品
33,338
合計
474,897
h.原材料及び貯蔵品
区分
金額(千円)
原材料
モーター
409,995
HEPAフィルター材料
4,909
ファン関係部品
21,124
HEPAフィルター
47,971
その他の製品
347,160
小計
831,162
貯蔵品
広告宣伝用貯蔵品
1,499
小計
1,499
合計
832,661
91/100
EDINET提出書類
日本エアーテック株式会社(E02421)
有価証券報告書
②
負債の部
a.支払手形
イ.相手先別内訳
相手先
金額(千円)
㈲テクノ
25,049
㈲二光
1,154
㈲羽黒製作所
1,132
㈲清村梱包
778
㈲ギルドエヌワン
660
その他
134
合計
28,909
ロ.期日別内訳
期日別
金額(千円)
2026年1月
11,675
2月
17,233
合計
28,909
b.電子記録債務
イ.相手先別内訳
相手先
金額(千円)
三菱電機冷熱プラント㈱
98,203
東京冷機工業㈱
48,191
㈱サトルネス工機
42,777
日本運輸㈱
42,673
テック㈱
40,488
その他
856,875
合計
1,129,208
92/100
EDINET提出書類
日本エアーテック株式会社(E02421)
有価証券報告書
c.買掛金
イ.相手先別内訳
相手先
金額(千円)
㈱サトルネス工機
24,470
㈱関東日立
20,014
㈱クラフトワーク
14,171
㈱片桐エンジニアリング
13,800
扶桑電機工業㈱
13,634
その他
274,901
合計
360,990
(3)【その他】
当事業年度における半期情報等
中間会計期間
当事業年度
売上高(百万円)
7,476
14,151
税引前中間(当期)純利益
(百万円)
1,126
1,595
793
1,131
78.50
111.96
中間(当期)純利益
(百万円)
1株当たり中間(当期)純利益
(円)
93/100
EDINET提出書類
日本エアーテック株式会社(E02421)
有価証券報告書
第6【提出会社の株式事務の概要】
事業年度
1月1日から12月31日まで
定時株主総会
3月中
基準日
12月31日
剰余金の配当の基準日
1単元の株式数
6月30日
12月31日
100株
単元未満株式の買取り・買増し
取扱場所
株主名簿管理人
取次所
買取・買増手数料
(特別口座)
東京都千代田区丸の内一丁目4番1号
三井住友信託銀行株式会社証券代行部
(特別口座)
東京都千代田区丸の内一丁目4番1号
三井住友信託銀行株式会社
───────
株式の売買委託に係る手数料相当額として別途定める金額
公告掲載方法
電子公告とする。ただし、事故その他やむを得ない事由によって電子公告
による公告をすることができない場合の公告方法は、日本経済新聞に掲載
する方法とする。
株主に対する特典
該当事項はありません。
(注)当社定款の定めにより、単元未満株主は、会社法第189条第2項各号に掲げる権利、会社法第166条第1項の
規定による請求をする権利、株主の有する株式数に応じて募集株式の割当て及び募集新株予約権の割当てを受
ける権利並びに単元未満株式の売渡請求をする権利以外の権利を有しておりません。
94/100
EDINET提出書類
日本エアーテック株式会社(E02421)
有価証券報告書
第7【提出会社の参考情報】
1【提出会社の親会社等の情報】
当社は、親会社等はありません。
2【その他の参考情報】
当事業年度の開始日から有価証券報告書提出日までの間に、次の書類を提出しております。
(1)有価証券報告書及びその添付書類並びに確認書
事業年度(第52期)(自
2024年1月1日
至
2024年12月31日)
2025年3月27日関東財務局長に提出
(2)訂正有価証券報告書及び確認書
訂正有価証券報告書(第52期有価証券報告書の訂正報告書)及び確認書
2025年4月3日に関東財務局長に提出
(3)内部統制報告書及びその添付書類
2025年3月27日関東財務局長に提出
(4)半期報告書及び確認書
(第53期中)(自
2025年1月1日
至
2025年6月30日)
2025年8月14日関東財務局長に提出
(5)臨時報告書
企業内容等の開示に関する内閣府令第19条第2項第9号の2(2025年3月27日開催の当社第52回定時株主総会に
おける議決権行使の結果)に基づく臨時報告書
2025年4月4日関東財務局長に提出
(6)自己株券買付状況報告書
金融商品取引法第24条の6第1項に基づく自己株式の取得における自己株券買付状況報告書
2025年4月3日関東財務局長に提出
金融商品取引法第24条の6第1項に基づく自己株式の取得における自己株券買付状況報告書
2025年12月10日関東財務局長に提出
金融商品取引法第24条の6第1項に基づく自己株式の取得における自己株券買付状況報告書
2026年1月8日関東財務局長に提出
95/100
EDINET提出書類
日本エアーテック株式会社(E02421)
有価証券報告書
第二部【提出会社の保証会社等の情報】
該当事項はありません。
96/100
EDINET提出書類
日本エアーテック株式会社(E02421)
有価証券報告書
独立監査人の監査報告書及び内部統制監査報告書
2026年3月27日
日本エアーテック株式会社
取締役会
御中
監査法人アンビシャス
東京都台東区
代
表
社
員
業務執行社員
公認会計士
今津
邦博
代
表
社
員
業務執行社員
公認会計士
田中
昭仁
<財務諸表監査>
監査意見
当監査法人は、金融商品取引法第193条の2第1項の規定に基づく監査証明を行うため、「経理の状況」に掲げられて
いる日本エアーテック株式会社の2025年1月1日から2025年12月31日までの第53期事業年度の財務諸表、すなわち、貸借
対照表、損益計算書、株主資本等変動計算書、キャッシュ・フロー計算書、重要な会計方針、その他の注記及び附属明細
表について監査を行った。
当監査法人は、上記の財務諸表が、我が国において一般に公正妥当と認められる企業会計の基準に準拠して、日本エ
アーテック株式会社の2025年12月31日現在の財政状態並びに同日をもって終了する事業年度の経営成績及びキャッシュ・
フローの状況を、全ての重要な点において適正に表示しているものと認める。
監査意見の根拠
当監査法人は、我が国において一般に公正妥当と認められる監査の基準に準拠して監査を行った。監査の基準における
当監査法人の責任は、「財務諸表監査における監査人の責任」に記載されている。当監査法人は、我が国における職業倫
理に関する規定に従って、会社から独立しており、また、監査人としてのその他の倫理上の責任を果たしている。当監査
法人は、意見表明の基礎となる十分かつ適切な監査証拠を入手したと判断している。
監査上の主要な検討事項
監査上の主要な検討事項とは、当事業年度の財務諸表の監査において、監査人が職業的専門家として特に重要であると
判断した事項である。監査上の主要な検討事項は、財務諸表全体に対する監査の実施過程及び監査意見の形成において対
応した事項であり、当監査法人は、当該事項に対して個別に意見を表明するものではない。
97/100
EDINET提出書類
日本エアーテック株式会社(E02421)
有価証券報告書
一定の期間にわたり履行義務が充足される契約に係る総原価の見積りの妥当性
監査上の主要な検討事項の内容及び決定理由
監査上の対応
会社は、注記事項(重要な会計上の見積り)に記載のと
おり、特殊な仕様の機器・装置で現地の工事を伴うものに
ついては、一定の期間にわたり充足される履行義務とし
て、進捗率を見積り、一定の期間にわたり収益を認識して
いる。当事業年度の損益計算書に計上されている売上高
14,151,101千円のうち、当事業年度末に履行義務の充足に
係る進捗度に基づき認識した売上高の金額は2,058,940千
円であり、売上高に占める割合は14.5%である。
履行義務の充足に係る進捗度の見積方法は、見積総原価
に対する発生原価の割合(インプット法)によっている。
なお、進捗率を合理的に見積もることができないが、発生
した費用を回収することが見込まれる場合は、原価回収基
準を適用している。
総原価は、仕様、過去の類似案件における実績、難易度
等を勘案して見積もっているが、その見積りには不確実性
を伴う。また、仕様の変更、原材料価格の変動、予定外の
費用発生、工期の変更等によって変更が生じる可能性があ
り、総原価の適時かつ適切な見直しには複雑性を伴う。こ
れらにより、発生原価が見積総原価と大きく異なった場合
は、収益認識額に影響を及ぼす可能性がある。
以上から、当監査法人は一定の期間にわたり履行義務が
充足される契約に係る総原価の見積りの妥当性が監査上の
主要な検討事項に該当すると判断した。
当監査法人は、一定の期間にわたり履行義務が充足され
る契約に係る総原価の見積りの妥当性を検証するため、主
に以下の監査手続を実施した。
(1)内部統制の評価
一定の期間にわたり履行義務が充足される契約に係る総
原価の見積りに関連する内部統制の整備、運用状況の有効
性について、特に以下に焦点を当てて評価した。
・総原価の見積りの基礎となる見積実行予算の算定及び承
認に関する統制
・仕様や工期の変更等、見積総原価が変動する要因が発生
した場合に見積実行予算の見直しを行う統制
(2)総原価の見積りの妥当性の評価
一定の期間にわたり履行義務が充足される契約について
の総原価の見積りの合理性を評価するため、主に以下の監
査手続を実施した。
・見積総原価について、その計算の基礎となった見積実行
予算と照合し、見積総原価が注文内容や過去の実績と照ら
して合理的であるかを検討した。
・関連する資料の閲覧、営業担当者に対する質問及び議事
録のレビュー等を実施し、仕様又は納期の変更や追加費用
の発生等による見積総原価の変更の要否を検討した。
・当事業年度において完了した契約について、当初の見積
総原価とその確定額を比較し、その差異内容を検討するこ
とにより、総原価の見積りの信頼性を評価した。
その他の記載内容
その他の記載内容は、有価証券報告書に含まれる情報のうち、財務諸表及びその監査報告書以外の情報である。経営
者の責任は、その他の記載内容を作成し開示することにある。また、監査等委員会の責任は、その他の記載内容の報告
プロセスの整備及び運用における取締役の職務の執行を監視することにある。
当監査法人の財務諸表に対する監査意見の対象にはその他の記載内容は含まれておらず、当監査法人はその他の記載
内容に対して意見を表明するものではない。
財務諸表監査における当監査法人の責任は、その他の記載内容を通読し、通読の過程において、その他の記載内容と
財務諸表又は当監査法人が監査の過程で得た知識との間に重要な相違があるかどうか検討すること、また、そのような
重要な相違以外にその他の記載内容に重要な誤りの兆候があるかどうか注意を払うことにある。
当監査法人は、実施した作業に基づき、その他の記載内容に重要な誤りがあると判断した場合には、その事実を報告
することが求められている。
その他の記載内容に関して、当監査法人が報告すべき事項はない。
財務諸表に対する経営者及び監査等委員会の責任
経営者の責任は、我が国において一般に公正妥当と認められる企業会計の基準に準拠して財務諸表を作成し適正に表示
することにある。これには、不正又は誤謬による重要な虚偽表示のない財務諸表を作成し適正に表示するために経営者が
必要と判断した内部統制を整備及び運用することが含まれる。
財務諸表を作成するに当たり、経営者は、継続企業の前提に基づき財務諸表を作成することが適切であるかどうかを評
価し、我が国において一般に公正妥当と認められる企業会計の基準に基づいて継続企業に関する事項を開示する必要があ
る場合には当該事項を開示する責任がある。
監査等委員会の責任は、財務報告プロセスの整備及び運用における取締役の職務の執行を監視することにある。
98/100
EDINET提出書類
日本エアーテック株式会社(E02421)
有価証券報告書
財務諸表監査における監査人の責任
監査人の責任は、監査人が実施した監査に基づいて、全体としての財務諸表に不正又は誤謬による重要な虚偽表示がな
いかどうかについて合理的な保証を得て、監査報告書において独立の立場から財務諸表に対する意見を表明することにあ
る。虚偽表示は、不正又は誤謬により発生する可能性があり、個別に又は集計すると、財務諸表の利用者の意思決定に影
響を与えると合理的に見込まれる場合に、重要性があると判断される。
監査人は、我が国において一般に公正妥当と認められる監査の基準に従って、監査の過程を通じて、職業的専門家とし
ての判断を行い、職業的懐疑心を保持して以下を実施する。
・不正又は誤謬による重要な虚偽表示リスクを識別し、評価する。また、重要な虚偽表示リスクに対応した監査手続を
・
立案し、実施する。監査手続の選択及び適用は監査人の判断による。さらに、意見表明の基礎となる十分かつ適切な
監査証拠を入手する。
財務諸表監査の目的は、内部統制の有効性について意見表明するためのものではないが、監査人は、リスク評価の実
・
施に際して、状況に応じた適切な監査手続を立案するために、監査に関連する内部統制を検討する。
経営者が採用した会計方針及びその適用方法の適切性、並びに経営者によって行われた会計上の見積りの合理性及び
・
関連する注記事項の妥当性を評価する。
経営者が継続企業を前提として財務諸表を作成することが適切であるかどうか、また、入手した監査証拠に基づき、
・
継続企業の前提に重要な疑義を生じさせるような事象又は状況に関して重要な不確実性が認められるかどうか結論付
ける。継続企業の前提に関する重要な不確実性が認められる場合は、監査報告書において財務諸表の注記事項に注意
を喚起すること、又は重要な不確実性に関する財務諸表の注記事項が適切でない場合は、財務諸表に対して除外事項
付意見を表明することが求められている。監査人の結論は、監査報告書日までに入手した監査証拠に基づいている
が、将来の事象や状況により、企業は継続企業として存続できなくなる可能性がある。
財務諸表の表示及び注記事項が、我が国において一般に公正妥当と認められる企業会計の基準に準拠しているかどう
かとともに、関連する注記事項を含めた財務諸表の表示、構成及び内容、並びに財務諸表が基礎となる取引や会計事
象を適正に表示しているかどうかを評価する。
監査人は、監査等委員会に対して、計画した監査の範囲とその実施時期、監査の実施過程で識別した内部統制の重要な
不備を含む監査上の重要な発見事項、及び監査の基準で求められているその他の事項について報告を行う。
監査人は、監査等委員会に対して、独立性についての我が国における職業倫理に関する規定を遵守したこと、並びに監
査人の独立性に影響を与えると合理的に考えられる事項、及び阻害要因を除去するための対応策を講じている場合又は阻
害要因を許容可能な水準にまで軽減するためのセーフガードを適用している場合はその内容について報告を行う。
監査人は、監査等委員会と協議した事項のうち、当事業年度の財務諸表の監査で特に重要であると判断した事項を監査
上の主要な検討事項と決定し、監査報告書において記載する。ただし、法令等により当該事項の公表が禁止されている場
合や、極めて限定的ではあるが、監査報告書において報告することにより生じる不利益が公共の利益を上回ると合理的に
見込まれるため、監査人が報告すべきでないと判断した場合は、当該事項を記載しない。
<内部統制監査>
監査意見
当監査法人は、金融商品取引法第193条の2第2項の規定に基づく監査証明を行うため、日本エアーテック株式会社の
2025年12月31日現在の内部統制報告書について監査を行った。
当監査法人は、日本エアーテック株式会社が2025年12月31日現在の財務報告に係る内部統制は有効であると表示した上
記の内部統制報告書が、我が国において一般に公正妥当と認められる財務報告に係る内部統制の評価の基準に準拠して、
財務報告に係る内部統制の評価結果について、全ての重要な点において適正に表示しているものと認める。
監査意見の根拠
当監査法人は、我が国において一般に公正妥当と認められる財務報告に係る内部統制の監査の基準に準拠して内部統制
監査を行った。財務報告に係る内部統制の監査の基準における当監査法人の責任は、「内部統制監査における監査人の責
任」に記載されている。当監査法人は、我が国における職業倫理に関する規定に従って、会社から独立しており、また、
監査人としてのその他の倫理上の責任を果たしている。当監査法人は、意見表明の基礎となる十分かつ適切な監査証拠を
入手したと判断している。
内部統制報告書に対する経営者及び監査等委員会の責任
経営者の責任は、財務報告に係る内部統制を整備及び運用し、我が国において一般に公正妥当と認められる財務報告に
係る内部統制の評価の基準に準拠して内部統制報告書を作成し適正に表示することにある。
監査等委員会の責任は、財務報告に係る内部統制の整備及び運用状況を監視、検証することにある。
なお、財務報告に係る内部統制により財務報告の虚偽の記載を完全には防止又は発見することができない可能性があ
る。
99/100
EDINET提出書類
日本エアーテック株式会社(E02421)
有価証券報告書
内部統制監査における監査人の責任
監査人の責任は、監査人が実施した内部統制監査に基づいて、内部統制報告書に重要な虚偽表示がないかどうかについ
て合理的な保証を得て、内部統制監査報告書において独立の立場から内部統制報告書に対する意見を表明することにあ
る。
監査人は、我が国において一般に公正妥当と認められる財務報告に係る内部統制の監査の基準に従って、監査の過程を
通じて、職業的専門家としての判断を行い、職業的懐疑心を保持して以下を実施する。
・内部統制報告書における財務報告に係る内部統制の評価結果について監査証拠を入手するための監査手続を実施す
る。内部統制監査の監査手続は、監査人の判断により、財務報告の信頼性に及ぼす影響の重要性に基づいて選択及び適
用される。
・財務報告に係る内部統制の評価範囲、評価手続及び評価結果について経営者が行った記載を含め、全体としての内部
統制報告書の表示を検討する。
・内部統制報告書における財務報告に係る内部統制の評価結果に関する十分かつ適切な監査証拠を入手する。監査人
は、内部統制報告書の監査に関する指示、監督及び実施に関して責任がある。
監査人は、監査等委員会に対して、計画した内部統制監査の範囲とその実施時期、内部統制監査の実施結果、識別した
内部統制の開示すべき重要な不備、その是正結果、及び内部統制の監査の基準で求められているその他の事項について報
告を行う。
監査人は、監査等委員会に対して、独立性についての我が国における職業倫理に関する規定を遵守したこと、並びに監
査人の独立性に影響を与えると合理的に考えられる事項、及び阻害要因を除去するための対応策を講じている場合又は阻
害要因を許容可能な水準にまで軽減するためのセーフガードを適用している場合はその内容について報告を行う。
<報酬関連情報>
当監査法人及び当監査法人と同一のネットワークに属する者に対する、会社の監査証明業務に基づく報酬及び非監査業
務に基づく報酬の額は、「提出会社の状況」に含まれるコーポレート・ガバナンスの状況等(3)【監査の状況】に記載
されている。
利害関係
会社と当監査法人又は業務執行社員との間には、公認会計士法の規定により記載すべき利害関係はない。