変更報告書(特例対象株券等)(JPモルガン・アセット・マネジメント株式会社)
Bull 0
Bear 0
Routine
6269
|
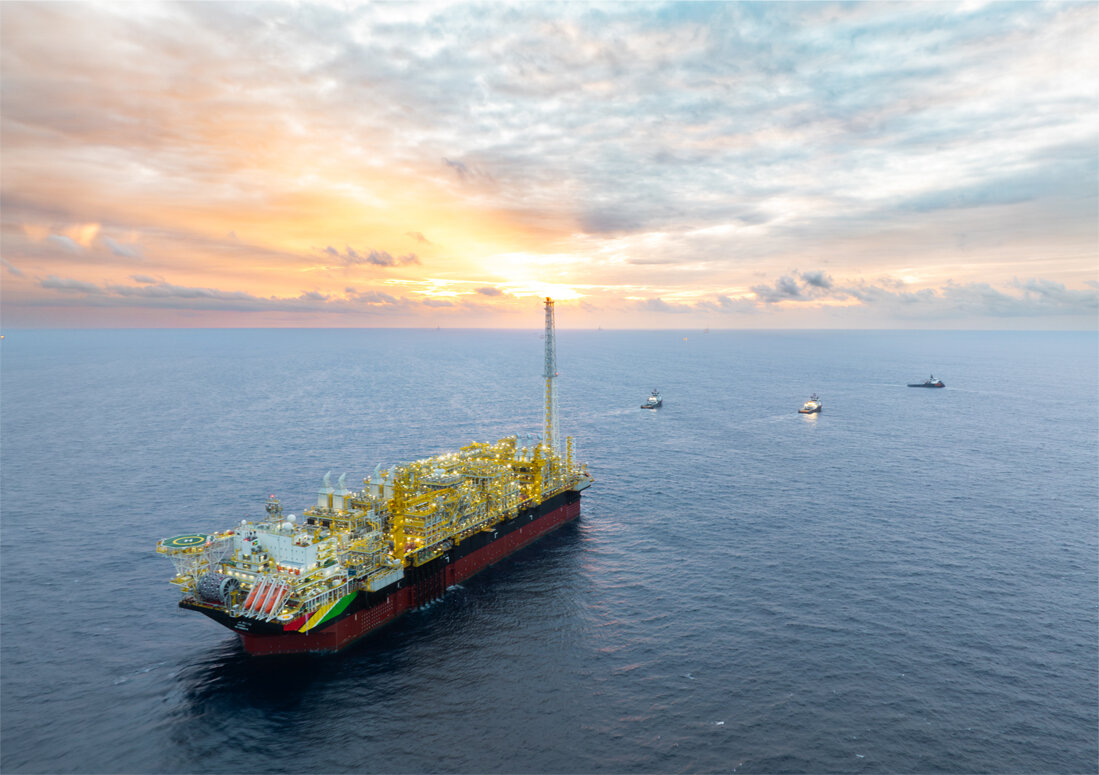
Modec, Inc. provides engineering, procurement, construction, and installation (EPCI) services, as well as charter and operation services, for floating offshore oil and gas production equipment. The company specializes in Floating Production, Storage and Offloading (FPSO) vessels, Floating Storage and Offloading (FSO) vessels, Floating LNG (FLNG) units, Tension Leg Platforms (TLPs), and Production Semi-submersibles. Modec operates as a fabless company, managing project execution by outsourcing hull construction and equipment manufacturing to selected shipyards and specialized contractors globally. Its business model includes leasing and operating these vessels for clients, often through joint ventures with shipping companies and trading partners to manage long-term financial commitments. The company serves government-owned and private oil and gas development companies worldwide, with significant project activity in Brazil, Guyana, Senegal, and other international markets. Notable clients include Petrobras, ExxonMobil, Shell, Equinor, and Woodside Energy. Modec also provides after-sales services such as parts supply and engineering support for previously delivered equipment. Summarised from the annual report, fiscal year ended Dec 2025 |
Industry Oil & Gas Equipment & Services | Homepage modec.com |
| Sector Energy | IR page modec.com | |
|
Tags
fpso, fso, flng, tlp, epci, offshore oil and gas, vessel charter, offshore operations, project management, floating production, Production Semi-submersibles, CNR Baobab FPSO, PETROBRAS PRA-1 FSO, JVPC Rang Dong FSO, PETROBRAS Opportunity Oil FPSO, BHPB Pyrenees FPSO, PETROBRAS Opportunity Gas #2 FPSO, PETROBRAS Tupi Pilot FPSO, PETROBRAS Guara FPSO, PETROBRAS Cernambi Sul FPSO, PETROBRAS Iracema North FPSO, OMV Maari FPSO, TULLOW T.E.N. FPSO, PETROBRAS Carioca FPSO, PETROBRAS Tartaruga Verde and Mestica FPSO, PETROBRAS Sepia FPSO, PETROBRAS Mero Pilot FPSO, Eni Mexico Area 1 FPSO, PETROBRAS Buzios 5 FPSO, PETROBRAS Marlim 1 FPSO, Equinor Bacalhau FPSO, Woodside Sangomar FPSO, Uaru FPSO, FPSO Raia, FPSO Gato do Mato - Orca, Hammerhead FPSO
|
Press page modec.com/news |
Metrics
| Valuation | |
|---|---|
| Market cap | ¥ 603.079B |
| Market cap (USD) | $ 3.769B |
| P/E | 8.72 |
| PEG | 0.08 |
| P/BV | 2.29 |
| P/S | 0.77 |
| P/OCF | 6.95 |
| P/FCF | 7.07 |
| Dividend yield | — |
| Turnover / mcap | — |
| Returns | |
|---|---|
| ROE | 27.0% |
| ROI | 19.0% |
| ROIC | 18.7% |
| Profit margin | 7.9% |
| Growth | |
|---|---|
| Revenue growing | Yes |
| Profits growing | Yes |
| Revenue up 3y | Yes |
| Revenue up 5y | No |
| Earnings growth 3y (net profit CAGR) | 112.9% |
| Quality | |
|---|---|
| Profitable | Yes |
| Margin expanding | Yes |
| Buying back stock | No |
| Diluting (TTM) | No |
| Debt/Equity | — |
| Podcast bulls (TTM) | Sign up |
| Podcast bears (TTM) | Sign up |
| Podcast sentiment (TTM) | Sign up |
| Podcast sentiment % (TTM) | Sign up |
| News sentiment (TTM) | 25 |
| Quality score | 58.8% |
| Insiders | |
|---|---|
| Buys, 1w | Sign up |
| Buys, 1m | Sign up |
| Buys, 1y | Sign up |
| Sells, 1w | Sign up |
| Sells, 1m | Sign up |
| Sells, 1y | Sign up |
Sign up to see this company's insider trades
| Figure | FY 2025 | FY 2024 | FY 2023 | FY 2022 | FY 2021 | FY 2020 | FY 2019 | FY 2018 | FY 2017 | FY 2016 | FY 2015 | FY 2014 | FY 2013 | FY 2012 |
|---|---|---|---|---|---|---|---|---|---|---|---|---|---|---|
| Revenue | 4.581B | 4.186B | 3.575B | 2.74B | 3.9B | 2.92B | 3.1B | 1.991B | 1.723B | 2.247B | 2.419B | 3.643B | 2.571B | 2.377B |
| Net profit | 360.677M | 220.404M | 96.536M | 37.377M | -363.975M | -123.214M | -169.852M | 196.418M | 175.305M | 205.287M | 47.653M | 52.176M | 49.746M | 65.245M |
| Free cash flow | 236.685M | 548.608M | 478.417M | -215.778M | 122.877M | 255.004M | -55.521M | 376.883M | -70.333M | 268.557M | 41.295M | — | — | — |
| Figure | FY 2025 | FY 2024 | FY 2023 | FY 2022 | FY 2021 | FY 2020 | FY 2019 | FY 2018 | FY 2017 | FY 2016 | FY 2015 | FY 2014 | FY 2013 | FY 2012 |
|---|---|---|---|---|---|---|---|---|---|---|---|---|---|---|
| Share price | 76.03 | 21 | 16.27 | 10.23 | 13.79 | 25.11 | 24.83 | 20.43 | 26.16 | 18.22 | 13.8 | 19.58 | 30.55 | 23.77 |
| Price performance 12m | 2.79 | 0.33 | 0.66 | -0.07 | -0.43 | 0 | 0.17 | -0.22 | 0.56 | 0.11 | -0.17 | -0.33 | 0.62 | — |
Filed figures
Lines the statements and their notes report beside the headline figures, read from the filings' XBRL as filed (no restatement applied), with figures computed from one filing's own lines. Cash-flow lines carry their cash direction: an outflow is negative. Each period links to its filing; a figure's period, report date and tag are in its tooltip.
| Figure | Dec 2016 | Dec 2017 | Dec 2018 | Dec 2019 | Dec 2020 | Dec 2021 | Dec 2022 | Dec 2023 | Dec 2024 | Dec 2025 |
|---|---|---|---|---|---|---|---|---|---|---|
| Balance sheet detail | ||||||||||
| Trade receivables (JPY) | 95.5B | 98.2B | 95.1B | 163B | 288M | 379M | 478M | 592M | 752M | 978M |
| ↳ YoY growth | -34.4% | +2.8% | -3.2% | +71.8% | +31.6% | +26.0% | +23.9% | +27.1% | +30.0% | |
| ↳ 5y CAGR | +27.7% | |||||||||
| Borrowings, current (JPY) | 7.81B | 14.5B | 6.14B | 13.9B | 84.5M | 427M | 19.1M | 57.8M | 55.5M | 238M |
| Borrowings, non-current (JPY) | 42.5B | 31.6B | 24.9B | 10.8B | 45.9M | 55,000 | 374M | 513M | 459M | 183M |
| Lease liabilities (JPY) | 29M | 8M | 48M | 3.78B | 3.01B | — | — | — | — | — |
| Cash and deposits (JPY) | 42.8B | 31.4B | 51.2B | 52.4B | 617M | 810M | 493M | 1.01B | 1.25B | 1.33B |
| Intangible assets (JPY) | 7.42B | 7.45B | 9.26B | 9.65B | 68.8M | 80.8M | 70.2M | 49.5M | 39.7M | 28.5M |
| Net debt (borrowings + leases - cash) (JPY) | 7.51B | 14.7B | -20.1B | -23.8B | -487M | -383M | -99.2M | -443M | -739M | -907M |
| Cash flow detail | ||||||||||
| Operating cash flow (JPY) | 30.4B | -3.32B | 45.2B | -3.25B | 302M | 152M | -209M | 486M | 561M | 244M |
| Purchases of property, plant and equipment (JPY) | -2.86B | -4.49B | -3.19B | -2.71B | -37.1M | -29.4M | -6.88M | -7.47M | -12.3M | -7.35M |
| Change in receivables (cash effect) (JPY) | 48.6B | -4.66B | 6.78B | -71.1B | 146M | -88.5M | -91.6M | -105M | -186M | -202M |
| Change in inventories (cash effect) (JPY) | 1.6B | 1.19B | -4.46B | 688M | -14.8B | — | — | — | — | — |
| Change in payables (cash effect) (JPY) | -40.1B | -13.8B | 23.6B | 64.7B | -87.1M | 301M | -438M | 260M | 155M | -220M |
| Dividends paid (cash effect) (JPY) | -2.04B | -2.19B | -2.89B | -3.03B | -24.4M | -19M | -19,000 | -10,000 | -22.5M | -50.7M |
| Share buybacks (cash effect) (JPY) | — | 0.00 | -97M | -89M | 0.00 | — | — | — | — | — |
| Interest paid (cash effect) (JPY) | -1.45B | -1.4B | -955M | -957M | -7.33M | -5.24M | -16.9M | -22.3M | -36.4M | -31.7M |
| Income taxes paid (cash effect) (JPY) | -2.85B | -4.55B | -5.88B | -4.59B | -13.6M | -18.1M | -28.3M | -15.3M | -57M | -86.7M |
| Operating cash flow before change in receivables (JPY) | -18.3B | 1.35B | 38.4B | 67.9B | 156M | 241M | -117M | 591M | 747M | 446M |
| Free cash flow (OCF - PPE - intangibles) (JPY) | 27.5B | -7.81B | 42B | -5.96B | 265M | 123M | -216M | 478M | 549M | 237M |
| Income detail | ||||||||||
| Research and development expense (JPY) | — | 160M | 195M | 232M | 482M | — | — | — | 16.5M | 23.9M |
| Total comprehensive income (JPY) | 21.7B | 16B | 19.4B | -25.6B | -199M | -294M | 283M | 104M | 265M | 375M |
| Comprehensive income to owners (JPY) | 23.5B | 15.6B | 19.1B | -25.8B | -198M | -298M | 279M | 73.4M | 228M | 323M |
| Provision for credit losses (JPY) | 821M | 115M | 84M | 10M | 743M | — | — | — | — | — |
| Credit cost ratio (credit losses / average receivables) (%) | 0.7% | 0.1% | 0.1% | 0.0% | 0.9% | — | — | — | — | — |
| Reported | Mar 24, 2017 | Mar 20, 2019 | Mar 20, 2019 | Mar 19, 2020 | Mar 29, 2022 | Mar 29, 2022 | Mar 28, 2023 | Mar 27, 2024 | Mar 26, 2026 | Mar 26, 2026 |
Sign up to see institutional holdings
Sign UpPodcast Mentions
Sign up to see podcast mentions and sentiment
Sign UpTimely disclosures published on TDnet, newest first, titles as filed in Japanese. The link opens the disclosure on TDnet. Filings with EDINET (periodic reports, extraordinary reports, offerings, holding and buy-back reports), newest first, titles as filed in Japanese. The link opens the filing on EDINET. Press releases from the company's own website, newest first.
2026年12月期 通期連結業績予想の修正(上方修正)に関するお知らせ
Bull 4
Bear 0
Guidance
2026年12月期第3四半期決算短信〔IFRS〕(連結)
Bull 2
Bear 0
Results





Prompts
Click prompts to add them under the company line, click again to take one out, then copy the result into your AI chat. Shared by Asian Century Stocks and Uncovered Thai Stocks. Thank you.
Modec, Inc. (ticker 6269), listed in Japan.
Copied
Company History
Name and ticker changes, and re-registrations under a new regulatory id. When a ticker stopped being used is not recorded, so former tickers are undated.
| Date | Change | Detail |
|---|---|---|
| Dec 31, 2021 | Reporting currency | Its JP reports are in USD instead of JPY from this period. Earlier figures are shown in USD, converted at each period end's exchange rate. |
ETFs Holding Modec, Inc.
Exchange-traded funds whose newest published daily portfolio holds one of the company's listings, largest weight first.
| ETF | Weight in ETF | Shares | Market value | As of |
|---|---|---|---|---|
| DFIS | 0.06% | 65,300 | $ 3.502M | Nov 12, 2026 |
| AVDS | 0.05% | 3,300 | $ 172.583K | Nov 16, 2026 |
| DFSI | 0.04% | 8,300 | $ 445.106K | Nov 12, 2026 |
| DFIC | 0.02% | 62,300 | $ 3.341M | Nov 12, 2026 |
| DXIV | 0.02% | 900 | $ 48.265K | Nov 12, 2026 |
| AVDV | 0.02% | 90,400 | $ 4.728M | Nov 16, 2026 |
| DFAI | 0.01% | 40,900 | $ 2.193M | Nov 12, 2026 |
| DFAX | 0.01% | 26,200 | $ 1.405M | Nov 12, 2026 |
| AVDE | 0.01% | 21,200 | $ 1.109M | Nov 16, 2026 |
| DIHP | 0.00% | 3,900 | $ 209.146K | Nov 12, 2026 |