自己株券買付状況報告書(法24条の6第1項に基づくもの)
Bull 3
Bear 0
Capital return
6268
|
Nabtesco Corporation is a Japanese industrial group operating through three main business segments: Component Solutions, Transport Solutions, and Accessibility Solutions. The Component Solutions segment designs, manufactures, and sells industrial robot components, including harmonic gears and reducers, under the Nabtesco brand. The Transport Solutions segment provides braking systems, automatic doors, coupling devices, and safety equipment for railway vehicles, aircraft, automobiles, and marine vessels, with key subsidiaries including Nabtesco Marine Shikoku, Nabtesco Automotive, and Nabtesco Aerospace. The Accessibility Solutions segment supplies automatic door systems, smoke exhaust equipment, platform safety devices, and welfare machinery for buildings and general industries, operating through subsidiaries such as Nabco Door, Nabco System, and Gilgen Door Systems. The group serves customers in the manufacturing, transportation, and construction sectors across Japan, Europe, Asia, and the Americas. Notable brands and entities within the group include T.S. Mechatronics, Comtesco, Nabtesco Precision Europe, Nabtesco Motion Control, Nabtesco Marine Europe, Nabtesco Marine Asia Pacific, Nabtesco Marinetec, Deep Sea Technologies, OVALO, adcos, NABCO Entrances, NABCO Canada, Royal Doors, Gilgen Door Systems, Wupper Glas und Tür Technik, Copas Systèmes, Access Entry, PACRAFT, Seimet, TMT Machinery, and Engilico. Summarised from the annual report, fiscal year ended Dec 2025 |
Industry Industrial Distribution | Homepage nabtesco.com |
| Sector Industrials | IR page nabtesco.com | |
|
Tags
industrial robot components, harmonic gears, railway braking systems, aircraft components, automotive braking systems, marine control systems, automatic door systems, smoke exhaust equipment, welfare machinery, packaging machinery, precision machinery, motion control, T.S. Mechatronics, Comtesco, Nabtesco Precision Europe, Nabtesco Motion Control, Nabtesco Power Control, Nabtesco Marine Shikoku, Nabtesco Automotive, Nabtesco Service, Nabtech, Asukadenki, Nabtesco Oclap, Nabtesco Marine Europe, Nabtesco Marine Asia Pacific, Nabtesco Marinetec, Deep Sea Technologies, R.K. Deep Sea Technologies, Nabtesco Aerospace, Nabtesco Automotive Products, NS Autotech, OVALO, adcos, Nabco Door, Nabco System, Niigata Nabco, Nabco Metal, Nabco Tohto, Nabco R, NABCO Entrances, NABCO Canada, Royal Doors, Gilgen Door Systems, Wupper Glas und Tür Technik, Copas Systèmes, Access Entry, GDS Vostok, PACRAFT, Seimet, TMT Machinery, Engilico, Nabtesco Link, Nabtesco India, Nabtesco USA, Nabtesco Europe, Nabtesco Technology Ventures
|
Press page nabtesco.com/news |
Metrics
| Valuation | |
|---|---|
| Market cap | ¥ 566.002B |
| Market cap (USD) | $ 3.55B |
| P/E | 27.43 |
| PEG | 2.02 |
| P/BV | 1.98 |
| P/S | 1.67 |
| P/OCF | 17.24 |
| P/FCF | 28.84 |
| Dividend yield | 1.7% |
| Turnover / mcap | — |
| Returns | |
|---|---|
| ROE | 5.3% |
| ROI | 5.3% |
| ROIC | 5.4% |
| Profit margin | 5.0% |
| Growth | |
|---|---|
| Revenue growing | No |
| Profits growing | Yes |
| Revenue up 3y | No |
| Revenue up 5y | No |
| Earnings growth 3y (net profit CAGR) | 13.6% |
| Quality | |
|---|---|
| Profitable | Yes |
| Margin expanding | Yes |
| Buying back stock | Yes |
| Diluting (TTM) | No |
| Debt/Equity | — |
| Podcast bulls (TTM) | Sign up |
| Podcast bears (TTM) | Sign up |
| Podcast sentiment (TTM) | Sign up |
| Podcast sentiment % (TTM) | Sign up |
| News sentiment (TTM) | 4 |
| Quality score | -15.8% |
| Insiders | |
|---|---|
| Buys, 1w | Sign up |
| Buys, 1m | Sign up |
| Buys, 1y | Sign up |
| Sells, 1w | Sign up |
| Sells, 1m | Sign up |
| Sells, 1y | Sign up |
| Figure | FY 2025 | FY 2024 | FY 2023 | FY 2022 | FY 2021 | FY 2020 | FY 2019 | FY 2018 | FY 2017 | FY 2016 | FY 2015 | FY 2014 | FY 2013 | FY 2012 |
|---|---|---|---|---|---|---|---|---|---|---|---|---|---|---|
| Revenue | 307.912B | 323.384B | 333.367B | 309.123B | 299.641B | 279.358B | 289.808B | 294.626B | 282.326B | 244.618B | 187B | 219.657B | 202.292B | 179.543B |
| Net profit | 15.255B | 10.188B | 14.226B | 10.415B | 64.771B | 20.505B | 17.931B | 21.029B | 22.996B | 17.584B | 11.059B | 17.746B | 14.978B | 13.269B |
| Free cash flow | 19.623B | 1.752B | -11.401B | -1.092B | 28.602B | 15.506B | 23.67B | — | — | 12.335B | 1.678B | — | — | — |
| Figure | FY 2025 | FY 2024 | FY 2023 | FY 2022 | FY 2021 | FY 2020 | FY 2019 | FY 2018 | FY 2017 | FY 2016 | FY 2015 | FY 2014 | FY 2013 | FY 2012 |
|---|---|---|---|---|---|---|---|---|---|---|---|---|---|---|
| Share price | 4.006K | 2.808K | 2.88K | 3.361K | 3.407K | 4.523K | 3.266K | 2.392K | 4.32K | 2.72K | 2.48K | 3.48K | 2.374K | 1.935K |
| Price performance 12m | 0.43 | -0.02 | -0.14 | -0.01 | -0.25 | 0.38 | 0.37 | -0.45 | 0.59 | 0.1 | -0.29 | 0.47 | 0.23 | — |
Filed figures
Lines the statements and their notes report beside the headline figures, read from the filings' XBRL as filed (no restatement applied), with figures computed from one filing's own lines. Cash-flow lines carry their cash direction: an outflow is negative. Each period links to its filing; a figure's period, report date and tag are in its tooltip.
| Figure | Dec 2016 | Dec 2017 | Dec 2018 | Dec 2019 | Dec 2020 | Dec 2021 | Dec 2022 | Dec 2023 | Dec 2024 | Dec 2025 |
|---|---|---|---|---|---|---|---|---|---|---|
| Balance sheet detail | ||||||||||
| Trade receivables (JPY) | 65.7B | — | 75B | 69.2B | 74.6B | 75B | 77.2B | 79.2B | 88.9B | 75.4B |
| ↳ YoY growth | +10.0% | -7.7% | +7.9% | +0.4% | +3.0% | +2.5% | +12.3% | -15.2% | ||
| ↳ 5y CAGR | +1.1% | +5.2% | +0.2% | |||||||
| Borrowings, current (JPY) | 5.79B | — | 34.1B | 30.7B | 37B | 14.7B | 19.9B | 21.4B | 21.8B | 34.9B |
| Borrowings, non-current (JPY) | 11.2B | — | 11.2B | 13.2B | 2.87B | 2.9B | 366M | 173M | 10.1B | 10B |
| Bonds payable (JPY) | 10B | — | — | — | — | — | — | — | — | — |
| Lease liabilities (JPY) | — | — | — | 8.8B | 8.5B | 9.73B | 11B | 10.9B | 14B | 14.8B |
| Cash and deposits (JPY) | 41.8B | 44.1B | 54B | 58.7B | 64.7B | 113B | 124B | 77.8B | 74.5B | 73.3B |
| Intangible assets (JPY) | 20.9B | — | 5.08B | 5.13B | 3.91B | 4.25B | 6.37B | 11.6B | 13B | 13.5B |
| Right-of-use assets (JPY) | — | — | — | 9B | 7.56B | 8.88B | 10.1B | 8.91B | 12.1B | 12.8B |
| Net debt (borrowings + leases - cash) (JPY) | -13B | — | -8.73B | -14.8B | -16.3B | -85.5B | -93.1B | -45.4B | -28.6B | -13.5B |
| Cash flow detail | ||||||||||
| Operating cash flow (JPY) | 27.7B | 23.1B | 24.2B | 38.4B | 34.2B | 36.3B | 7.72B | 11.2B | 26.7B | 32.8B |
| Purchases of property, plant and equipment (JPY) | -14.5B | — | -20.7B | -13.7B | -17.1B | -7.74B | -8.81B | -22.6B | -24.9B | -13.2B |
| Purchases of intangible assets (JPY) | -920M | — | -840M | -1.02B | -1.55B | -1.56B | -2.56B | -3.02B | -3.45B | -2.81B |
| Change in receivables (cash effect) (JPY) | -467M | — | — | — | — | — | — | — | — | — |
| Change in inventories (cash effect) (JPY) | -1.1B | — | -4.45B | 2.02B | 4.61B | -3.85B | -5.14B | 197M | -755M | -3.52B |
| Change in payables (cash effect) (JPY) | -260M | — | 22M | -4.89B | -223M | 5.04B | 2.3B | -7.06B | -1.17B | -4.26B |
| Dividends paid (cash effect) (JPY) | -5.83B | — | -9.18B | -9.07B | -9.69B | -8.8B | -9.38B | -9.5B | -9.65B | -9.65B |
| Share buybacks (cash effect) (JPY) | -2M | — | — | — | — | — | — | — | -2M | -10.1B |
| Interest paid (cash effect) (JPY) | -106M | — | -112M | -256M | -190M | -165M | -194M | -574M | -736M | -847M |
| Income taxes paid (cash effect) (JPY) | -4.17B | — | -7.34B | -7.77B | -7.11B | -12.2B | -23.2B | -16.1B | -6.47B | -5.2B |
| Share-based compensation (JPY) | 143M | — | — | — | — | — | — | — | — | — |
| Operating cash flow before change in receivables (JPY) | 28.2B | — | — | — | — | — | — | — | — | — |
| Free cash flow (OCF - PPE - intangibles) (JPY) | 12.3B | — | 2.68B | 23.7B | 15.5B | 27B | -3.65B | -14.4B | -1.7B | 16.8B |
| Income detail | ||||||||||
| Research and development expense (JPY) | 7.36B | — | 10.2B | 9.92B | 8.97B | 9.62B | 10.9B | 11B | 12.1B | 13.4B |
| ↳ 5y CAGR | +1.5% | +4.0% | +8.4% | |||||||
| Total comprehensive income (JPY) | 13.4B | 27.7B | 21B | 19.5B | 23.3B | 75.8B | 20.5B | 23.5B | 22B | 23.6B |
| Comprehensive income to owners (JPY) | 15.2B | 27.8B | 19.6B | 17.6B | 20.2B | 71.4B | 18B | 21.1B | 19.1B | 21.3B |
| Segments | ||||||||||
| Accessibility Solutions · Segment operating income (JPY) | — | — | 4.63B | 8.57B | 7.73B | 7.64B | 2.83B | 6.17B | 9B | 9.09B |
| Component Solutions · Segment operating income (JPY) | — | — | 20.2B | 15.9B | 17.7B | 22.9B | 15.9B | 10.4B | 4.52B | 5.42B |
| Transport Solutions · Segment operating income (JPY) | — | — | 2.01B | 5.78B | 3.34B | 5.62B | 6.71B | 7.83B | 12.5B | 13.6B |
| Reported | Mar 28, 2018 | Mar 28, 2018 | Mar 25, 2020 | Mar 24, 2021 | Mar 24, 2021 | Mar 25, 2022 | Mar 24, 2023 | Mar 27, 2024 | Mar 25, 2026 | Mar 25, 2026 |
Podcast Mentions
Timely disclosures published on TDnet, newest first, titles as filed in Japanese. The link opens the disclosure on TDnet. Filings with EDINET (periodic reports, extraordinary reports, offerings, holding and buy-back reports), newest first, titles as filed in Japanese. The link opens the filing on EDINET. Press releases from the company's own website, newest first.
2026年12月期第3四半期決算短信〔IFRS〕(連結)
Bull 4
Bear 0
Results
自己株式の取得状況及び取得終了に関するお知らせ
Bull 2
Bear 0
Capital return
自己株式の取得状況及び取得終了に関するお知らせ 2026年11月02日 IR情報 適時開示
Bull 3
Bear 0
Capital return
2026年11月2日 各位 会社名 ナブテスコ株式会社 代表者代表取締役木村和正 (コード番号 6268 東証プライム) 問合せ先 コーポレート・コミュニケーション部長峯岸康 (TEL 03-5213-1134)
自己株式の取得状況及び取得終了に関するお知らせ (会社法第 165 条第2項の規定による定款の定めに基づく自己株式の取得) 当社は、会社法第165条第3項の規定により読み替えて適用される同法第156条の規定に基づく 自己株式の取得につきまして、以下の通り、取得状況をお知らせいたします。 なお、下記の取得をもちまして、2026年7月31日開催の取締役会決議に基づく自己株式の取得 は終了しましたので、併せてお知らせいたします。 記 1. 自己株式の取得状況 (1)取得対象株式 の種類 (2)取得 し た 株式 の 総数 (3)取得価額 の 総額 (4)取 得 期 間 (5)取 得 方 法
: 当社普通株式 : 1,445,500 株 : 6,422,216,300 円 : 2026 年 10 月1日~2026 年 10 月 30 日(約定ベース) : 東京証券取引所における市場買付け
2.取得した自己株式の累計 (1)取得対象株式 の種類 (2)取得 し た 株式 の 総数 (3)取得価額 の 総額 (4)取 得 期 間
: 当社普通株式 : 3,306,600 株 : 14,999,799,800 円 : 2026 年8月3日~2026 年 10 月 30 日(約定ベース)
(ご参考)
- 2026 年7月 31 日開催の取締役会における決議内容(2026 年7月 31 日公表) (1)取得株式 の 種類 : 当社普通株式 (2)取得し得る株式の総数 :
400 万株(上限) (発行済株式総数(自己株式を除く)に対する割合 3.40%)
(3)株式の取得価額の総額 : 150 億円(上限) (4)取 (5)取
得 得
期 方
間 : 2026 年8月3日~2026 年 11 月 30 日 法 : 東京証券取引所における市場買付け
2.自己株式の消却に関する決議内容(2026 年7月 31 日公表) (1)消却 する株式 の種類 : 当社普通株式 (2)消却 す る 株式 の 数 : 上記 1.により取得した自己株式の全数 (3)消却予定日 : 2026 年 12 月 15 日
自己株券買付状況報告書(法24条の6第1項に基づくもの)
Bull 0
Bear 0
Routine
自動ドアを広告メディアへ。大日本印刷と渋谷センター街で実証実験を開始
Bull 1
Bear 0
Product/operations

自動ドアを広告メディアへ。大日本印刷と渋谷センター街で実証実験を開始
2026年10月14日
- 事業
- 自動ドア
ナブテスコ株式会社(本社:東京都千代田区、社長:木村和正)の 住環境カンパニーは、大日本印刷株式会社(以下、DNP)と協業し、自動ドア用デジタルサイネージの広告・販促媒体としての有効性を検証する実証実験を、2026年9月29日から東京都渋谷区の渋谷センター街で開始しました。
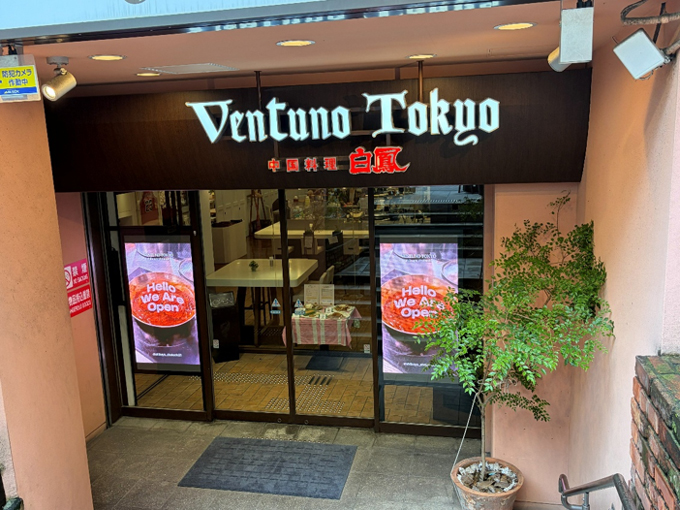
本実証実験では、渋谷センター街に面し、9月にリニューアルオープンした飲食店「Ventuno Tokyo シブヤショクドウ」の入口自動ドアに、当社の自動ドア用デジタルサイネージを設置し、人通りの多い商業エリアにおいて、店舗の来店促進効果や広告媒体としての価値を検証するとともに、商業施設や路面店舗への展開可能性を評価します。本実証実験では、当社がサイネージ機器の提供および効果検証を担当し、DNPはサイネージ配信管理システム「SmartSignage®」によるコンテンツ配信環境の提供に加え、ロケーション選定やコンテンツの調整・手配などを担当しています。
当社は、自動ドアを単なる出入口設備としてだけでなく、新たな価値を創出する情報発信プラットフォームとして活用することを目指しています。自動ドアが建物利用者や来店客など多くの人が必ず通行する設備であることに着目し、情報発信媒体として活用する「自動ドア用デジタルサイネージ」を展開しています。自動ドアの固定ガラス部分にディスプレイを設置することで、店舗情報や広告コンテンツの配信を可能とし、施設利用者への効果的な情報提供を実現します。
今回の実証実験で得られた知見をもとに、商業施設、飲食店、オフィスビル、駅施設などでの活用促進に向けて、広告事業者やコンテンツ配信事業者との連携を強化し、新たな広告・販促ソリューションの提供に取り組んでまいります。
| 【実証実験の概要】 | ||
| 実施期間 | : | 2026年9月29日~2026年11月30日 |
| 設置場所 | : | 東京都渋谷区宇田川町2-4-1 高木ビル1階「Ventuno Tokyo シブヤショクドウ」入口 |
| 実施内容 | : | 自動ドア用デジタルサイネージの設置・運用・効果検証 |
| 協業企業 | : | 大日本印刷株式会社 |
| 検証内容 | : | 来店促進効果、広告媒体価値、導入ニーズ等 |
※設置するLEDディスプレイは、自動ドアの固定ガラス部の屋内側に設置し、屋外に向けてコンテンツを配信します。
ディスプレイサイズは幅851mm、高さ1,601mmで、最大輝度2,000cd/m²の高輝度仕様を採用しています。
【本実証実験、およびデジタルサイネージに関するお問い合わせ先】
ナブテスコ株式会社 住環境カンパニー 営業部 TEL: 03-5213-1156
Email:こちら
関連ニュース
-
[Nabtesco Technology Ventures を通じた LOMBY株式会社への出資について
2026年09月30日
\- 事業\
- 出資・提携](https://www.nabtesco.com/news/20260930-18514/)
-
[国際福祉機器展 出展のお知らせ
2026年09月28日
\- 事業\
- 出展\
- 事業\
- 福祉機器](https://www.nabtesco.com/news/20260928-18518/)
-
[(舶用機器)内航船に向けた最適運航アプリケーションと連動する自動制御システムの実船検証を開始
2026年09月16日
\ -
[初代精密減速機RVが国立科学博物館の 「重要科学技術史資料(未来技術遺産)」に登録
2026年09月15日
\- 事業\
- 精密減速機](https://www.nabtesco.com/news/20260915-18428/)


© Nabtesco Corporation
News Release
Bull 0
Bear 3
Guidance
Date October 14, 2026
Nabtesco Corporation (Head Office: Chiyoda-ku, Tokyo; President: Kazumasa Kimura)
hereby announces that it has decided to change the scheduled date for the
announcement of its financial results for the third quarter of the fiscal year ending
December 2026, previously scheduled for October 30, 2026.
Details
- Revised Schedule
Item Before After
Announcement of Financial Results
for the Third Quarter of the Fiscal
Year Ending December 2026
October 30, 2026 November 13, 2026
Financial Results Briefing for the
Third Quarter of the Fiscal Year
Ending December 2026
(for institutional investors)
Note: The time of the earnings briefing for analysts and institutional investors will be announced
separately.
- Reason for the Change
As disclosed in the Company’s “Notice Regarding Submission of Amendment to
Internal Control Reports for Prior Fiscal Years and Material Weaknesses in Internal Control over Financial Reporting” dated September 30, 2026, pursuant to Article
24-4-5, Paragraph 1 of the Financial Instruments and Exchange Act, the Company
submitted to the Kanto Local Finance Bureau amendment reports to its internal
control reports for prior fiscal years, stating that there were material weaknesses that should have been disclosed. Accordingly, the Company is required to attach an
independent auditor’s review report to its financial results for the third quarter of the fiscal year ending December 2026. After considering the time required by the
independent auditor to complete its review and issue the review report, the Company has decided to change the scheduled date of the financial results announcement.
We sincerely apologize for the inconvenience and concern caused to our shareholders, investors, members of the media, and other stakeholders, and respectfully ask for your continued understanding and support.
End Notices of change the scheduled date for the announcement of its financial results for FY2026/Q3
Notices of change the scheduled date for the announcement of its financial results for FY2026/Q3 Oct 14, 2026 Others
Bull 0
Bear 4
Distress
Corporation Communication Dept., Nabtesco Corporation 9-18, Kaigan 1-chome, Minato-ku, Tokyo 105-0022 TEL: 03-3578-7070; FAX: 03-3578-7237 [Securities Code: 6268] http://www.nabtesco.com
News Release
Date October 14, 2026
Notices of change the scheduled date for the announcement of its financial results for FY2026/Q3 Nabtesco Corporation (Head Office: Chiyoda-ku, Tokyo; President: Kazumasa Kimura) hereby announces that it has decided to change the scheduled date for the announcement of its financial results for the third quarter of the fiscal year ending December 2026, previously scheduled for October 30, 2026. Details
- Revised Schedule Item Before After Announcement of Financial Results for the Third Quarter of the Fiscal Year Ending December 2026 October 30, 2026 November 13, 2026 Financial Results Briefing for the Third Quarter of the Fiscal Year Ending December 2026 (for institutional investors) Note: The time of the earnings briefing for analysts and institutional investors will be announced separately.
- Reason for the Change As disclosed in the Company’s “Notice Regarding Submission of Amendment to Internal Control Reports for Prior Fiscal Years and Material Weaknesses in Internal Control over Financial Reporting” dated September 30, 2026, pursuant to Article 24-4-5, Paragraph 1 of the Financial Instruments and Exchange Act, the Company submitted to the Kanto Local Finance Bureau amendment reports to its internal control reports for prior fiscal years, stating that there were material weaknesses that should have been disclosed. Accordingly, the Company is required to attach an independent auditor’s review report to its financial results for the third quarter of the fiscal year ending December 2026. After considering the time required by the independent auditor to complete its review and issue the review report, the Company has decided to change the scheduled date of the financial results announcement. We sincerely apologize for the inconvenience and concern caused to our shareholders, investors, members of the media, and other stakeholders, and respectfully ask for your continued understanding and support. End
1
2026年12月期第3四半期決算発表日変更のお知らせ 2026年10月14日 その他
Bull 0
Bear 4
Distress
ナブテスコ株式会社
コーポレート・コミュニケーション部
102 -0093 東京都千代田区平河町2丁目7番9号
TEL 03-5213 -1134 FAX 03-5213 -1171
[証券コード:6268] https://www.nabtesco.com
News Release 2026年10月14日
ナブテスコ株式会社(本社:東京都千代田区、社長:木村和正)は、2026年10月30日に 予定しておりました2026年12月期第 3四半期 決算発表日を下記に変更しましたこと、お知 らせいたします。
記
- 変更日
項目 変更前 変更後 2026年12月期第 3四半期決算発表 2026年10月30日 2026年11月13日 2026年12月期3Q決算説明会 (機関投資家向け) ※アナリスト・機関投資家向け決算説明会の開催時間は別途お知らせします。
- 日程 変更の理由 当社は、2026年9月30日に「過年度の内部統制報告書の訂正報告書の提出及び財務報告 に係る内部統制の開示すべき重要な不備に関するお知らせ」にて開示の通り、金融商品取引 法第 24 条の4の5第1項に基づき、関東財務局に提出した過年度の内部統制報告書におい て開示すべき重要な不備がある旨の記載をした内部統制報告書の訂正報告書を関東財務局 に提出いたしました。それを受け、2026年12月期第 3四半期 決算短信は監査人によるレビ ュー報告書の添付が義務付けられています。監査法人とレビュー報告書の受領までの期間を 考慮した結果、決算発表日程を変更することといたしました。
株主・投資家・報道関係者を含む関係者の皆様にはご迷惑とご心配をおかけしますことをお 詫び申し上げるとともに、引き続きご理解・ご支援を賜りますようお願い申し上げます。
Notice Regarding the Status of Acquisition of Own Shares Oct 01, 2026 Investor Relations Timely disclosure
Bull 0
Bear 0
Routine
(Translated) October 1, 2026
To whom it may concern, Company name: Nabtesco Corporation Representative: Kazumasa Kimura, Representative Director, President & CEO (Securities Code: 6268; Prime Section, Tokyo Stock Exchange)
自己株式の取得状況に関するお知らせ 2026年10月01日 IR情報 適時開示
Bull 0
Bear 0
Routine
2026年10月1日 各 位 会 社 名 ナブテスコ株式会社 代 表 者 代表取締役 木村 和正 (コード番号 6268 東証プライム) 問合せ先 コ ーポレート・コミュニケーション部長 峯岸 康 (TEL 03-5213-1134) 自己株式の取得状況に関するお知らせ (会社法第165条第2項の規定による定款の定めに基づく自己株式の取得) 当社は、会社法第165条第3項の規定により読み替えて適用される同法第156条の規定に基づく 自己株式の取得状況について、下記の通りお知らせします。 記
1 .取得株式の種類 : 当社普通株式 2.取得した株式の総数 : 771,600株 3.株式取得価額の総額 : 3,434,623,400円 4.取得期間 : 2026年9月1日~2026年9月30日(約定ベース) (ご参考) 1. 2026年7月31日開催の取締役会における決議内容(2026年7月31日公表) (1)取得株式の種類 : 当社普通株式 (2)取得し得る株式の総数 : 4 00万株(上限) (発行済株式総数(自己株式を除く)に対する割合 3.40%) (3)株式の取得価額の総額 : 150億円(上限) (4)取得期間 : 2026年8月3日~2026年11月30日 (5)取得方法 : 東京証券取引所における市場買付け 2. 上記取締役会決議に基づき取得した自己株式の累計(2026年9月30日現在) (1) 取得した株式の総数 : 1,861,100株 (2)取得価格の総額 : 8,577,583,500円 以 上
訂正半期報告書-第24期(2026/01/01-2026/06/30)
Bull 5
Bear 0
Results
訂正内部統制報告書-第23期(2025/01/01-2025/12/31)
Bull 0
Bear 5
Distress
訂正有価証券報告書-第23期(2025/01/01-2025/12/31)
Bull 4
Bear 0
Results
訂正半期報告書-第23期(2025/01/01-2025/12/31)
Bull 5
Bear 0
Results
訂正内部統制報告書-第22期(2024/01/01-2024/12/31)
Bull 0
Bear 5
Distress
訂正有価証券報告書-第22期(2024/01/01-2024/12/31)
Bull 0
Bear 0
Routine
訂正半期報告書-第22期(2024/01/01-2024/12/31)
Bull 0
Bear 0
Routine
訂正四半期報告書-第22期第1四半期(2024/01/01-2024/03/31)
Bull 0
Bear 0
Routine
訂正内部統制報告書-第21期(2023/01/01-2023/12/31)
Bull 0
Bear 5
Routine
shall prevail.
Bull 0
Bear 0
Routine
September 30, 2026
To whom it may concern,
Company name: Nabtesco Corporation
Representative: Kazumasa Kimura,
Representative Director
(Securities Code: 6268; Prime Section of the Tokyo Stock Exchange)
Notice of Filing Amended Annual Securities Reports and Amended Consolidated Financial Results for Past Fiscal Years Sep 30, 2026 Investor Relations Timely disclosure
Bull 0
Bear 0
Routine
(Translation) This document has been translated from the Japanese original for the convenience of overseas stakeholders. In the event of any discrepancy between this document and the Japanese original, the original shall prevail.
September 30, 2026
To whom it may concern, Company name: Nabtesco Corporation Representative: Kazumasa Kimura, Representative Director (Securities Code: 6268; Prime Section of the Tokyo Stock Exchange)
Notice Regarding Submission of Amendments to Internal Control Reports for Prior Fiscal Years and Material Weaknesses in Internal Control over Financial Reporting Sep 30, 2026 Investor Relations Timely disclosure
Bull 0
Bear 0
Not a release
(Translation) This document has been translated from the Japanese original for the convenience of overseas stakeholders. In the event of any discrepancy between this document and the Japanese original, the original shall prevail.
September 30, 2026
To whom it may concern, Company name: Nabtesco Corporation Representative: Kazumasa Kimura, Representative Director (Securities Code: 6268; Prime Section of the Tokyo Stock Exchange)
(Translation) This document has been translated from the Japanese original for the convenience of overseas stakeholders. In the event of any discrepancy between this document and the Japanese original, the original shall prevail.
To whom it may concern,
September 30, 2026
Company name: Nabtesco Corporation Representative: Kazumasa Kimura, Representative Director (Securities Code: 6268; Prime Section of the Tokyo Stock Exchange)
(Translation) This document has been translated from the Japanese original for the convenience of overseas stakeholders. In the event of any discrepancy between this document and the Japanese original, the original shall prevail.
To whom it may concern,
September 30, 2026
Company name: Nabtesco Corporation Representative: Kazumasa Kimura, Representative Director (Securities Code: 6268; Prime Section of the Tokyo Stock Exchange)
(Amended) Semiannual Report 2026 Sep 30, 2026 Investor Relations Securities report
Bull 0
Bear 0
Routine
[Cover] [Filing]
Amendment Report to Semiannual Report
[Articles of Basis]
Article 24-5-5 of the Financial Instruments and Exchange Act
[Submit to]
Kanto Finance Bureau
[Submission date]
September 30, 2026
[Semiannual accounting period]
The First Six-month of 24th fiscal period (From January 1, 2026 to June 30, 2026)
[Company name]
Nabtesco Corporation
[English translation name]
Nabtesco Corporation
[Title of Representative]
Kazumasa Kimura, Representative director
[Location of the head office]
7-9, Hirakawacho 2-chome, Chiyoda-ku, Tokyo
[Phone No.]
+81-3-5213-1134
[Name of administrative liaison]
Yasushi Minegishi, General Manager, Corporate Communications Dept.
[Near contact location]
7-9, Hirakawacho 2-chome, Chiyoda-ku, Tokyo
[Phone No.]
+81-3-5213-1134
[Name of administrative liaison]
Yasushi Minegishi, General Manager, Corporate Communications Dept.
[Locations for Public Inspection]
Tokyo Stock Exchange, Inc. (2-1, Nihonbashi Kabutocho, Chuo-ku, Tokyo)
- Reasons for Filing the Amendment Report to the Semiannual Report As errors were identified in certain information contained in the Semiannual Report for the 24th interim period (from January 1, 2026 to June 30, 2026), which was filed on August 14, 2026, the Company hereby files this Amendment to the Semiannual Report to correct such errors.
- Matters Amended Part I. Corporate Information Section 1. Overview of the Company
- Trend in Major Management Indicators Section 4. Accounting Status
- Summary of Interim Consolidated Financial Statements
- Amended Sections Amended sections are indicated by underlining. As the amendments are extensive, only the amended information is presented for the matters listed above.
Part one 【Corporate Information】 No.1 【Overview of the Company】
1 【Transition in Major Management Indicators】 Fiscal period Accounting period (Million yen) (Million Income before income taxes yen) Net income attributable to owners of (Million the parent yen) (Million Net income yen) Comprehensive income attributable (Million to owners of the parent yen) (Million Comprehensive income yen) Equity attributable to owners of the (Million parent yen) (Million Total assets yen) Net sales
First six-month of 23rd First six-month of 24th 23rd consolidated fiscal consolidated fiscal period consolidated fiscal period period From January 1, 2025 From January 1, 2026 From January 1, 2025 to June 30, 2025 to June 30, 2026 to December 31, 2025 (After Restatement) (After Restatement) 143,272
167,401
307,912
8,745
17,359
21,983
6,701
12,515
15,255
7,445
13,047
17,185
5,413
16,073
20,394
5,138
17,141
22,685
273,426
284,971
273,466
452,428
456,867
466,632
Basic earnings per share
(Yen)
55.76
106.78
128.15
Diluted earnings per share
(Yen)
55.76
106.78
128.15
Ratio of equity attributable to owners of the parent
(%)
60.4
62.4
58.6
(Million 20,327 22,029 32,824 yen) (Million Cash flows from investing activities (10,253) 5,202 (15,725) yen) (Million Cash flows from financing activities 4,509 (8,460) (13,559) yen) Cash and cash equivalents (Million 87,174 99,583 73,340 at fiscal year or interim end yen) (NOTE) 1 Since Nabtesco Corporation (hereinafter, the Company) prepared the summary of interim financial statements, the Cash flows from operating activities
Company does not provide the transition of non-consolidated management indicators. Figures are rounded to the nearest unit. Consolidated financial statements and summary of interim financial statements are prepared in accordance with International Financial Reporting Standards (IFRS) 4 From the first six-month period of consolidated FY2025, the hydraulic equipment business has been classified as a discontinued operation. Accordingly, net sales and profit before tax are presented for continuing operations only, excluding the discontinued operation. 5 The Company has determined that certain items, including its Equity in earnings of affiliates, require retrospective correction and has therefore revised and re-presented the comparative information. The figures for the interim consolidated accounting period and consolidated fiscal year of the 23rd term are presented on a revised and represented basis reflecting these corrections. For further details, please refer to “No.4 [Accounting Status], 1 The Summary of Interim Consolidated Financial Statements, Notes to the Interim Consolidated Financial Statements, 4. Restatement for Correction of Prior Period Errors.”
2 3
2 【Description of Business】
There have been no significant changes in the content of the business conducted by our group (the Company and our subsidiary companies) during the first six-month of the current fiscal year. Changes in significant subsidiaries are as follows, (Hydraulic Equipment Business) Following the transfer of 70% of the shares of Comtesco Corporation, which operates the hydraulic equipment business and had been excluded from the Component Solution Business and classified as discontinued operations in the previous fiscal year, on January 1, 2026, Comtesco Corporation and its subsidiaries were excluded from the scope of consolidation, and Comtesco Corporation became an affiliate accounted for by the equity method. Changes in major related companies are as described in "No.4 [Accounting Status], 1 The Summary of Interim Consolidated Financial Statements, Notes to the Interim Consolidated Financial Statements, 12. Loss of control over subsidiaries."
No.2 【Business Situation】 1 【Business Risks】 During the first six-month of the current fiscal year, there have been no significant changes in the status of business and accounting described in this semiannual report that could have a significant impact on the decisions of investors or Business and Other Risks described in the annual report for the previous fiscal year. There were no significant events which company should report.
2【Management's Analysis of Financial Condition, Results of Operations and Cash Flows】 (1) Analysis of Operating Results On July 31, 2025, in accordance with the share transfer agreement concluded with Comer Industries S.p.A. for the hydraulic equipment business of the Company and its consolidated subsidiaries, on December 31, 2025, we consolidated the business into a newly established wholly owned subsidiary (Comtesco Corporation) through an absorption-type company split, and completed the transfer of 70% of the outstanding shares of Comtesco Corporation on January 1, 2026. As a result, Comtesco Corporation became our equity-method affiliate. In addition, the amounts of continuing operations excluding discontinued operations are presented for net sales, operating income, and profit before income taxes. The amounts of interim income and profit attributable to owners of the parent are presented as the sum of continuing operations and discontinued operations. In the course of the interim review process by the independent auditors, in calculating the equity in earnings (losses) of affiliates accounted for by the equity method in certain of our equity-method affiliates, the financial figures obtained from such affiliates were calculated based on changes in the amount of net assets of the parent based on changes in the amount of net assets of the consolidated subsidiaries including those of the equity-method affiliates. As a result, it was found that the amounts of "Equity in earnings of affiliates" in our consolidated statements of income and "Investments accounted for using the equity method" in the consolidated statements of financial position had been continuously understated from the past fiscal years. The Company has determined that it is necessary to retroactively adjust the aforementioned errors based on the indication by the independent auditor, and have restated the condensed interim consolidated financial statements for the previous interim consolidated accounting period and the consolidated financial statements for the previous consolidated accounting year. In addition, other errors have been restated. Figures for the first half of the 23rd fiscal year and the consolidated fiscal year have been restated to reflect these figures. For further details, please refer to “No.4 [Accounting Status], 1 The Summary of Interim Consolidated Financial Statements, Notes to the Interim Consolidated Financial Statements, 4. Restatement of Prior Period Errors.” (Sales and Operating Income) In the first half of the current fiscal year, net sales of the Group increased by 16.8% year-on-year to ¥167,401 million due to the increase in sales in all segments. Operating income increased 69.4% to ¥15,759 million due to higher income from increased sales in component solutions, transport solutions and accessibility solutions business, as well as effects of profitability improvement activities under Project 10. The ratio of operating income to net sales was 9.4%. Operating results by business segment were as follows: ①
Component Solutions Business Sales increased by ¥8,700 million, or 23.6% to ¥45,521 million and operating income increased by ¥2,985 million or 160.8% to ¥4,841 million. Sales of precision reduction gears increased year-on-year due to favorable demand for industrial robots mainly from automobile manufacturers in China and South Korea and general industries.
②
Transport Solutions Business Sales increased by ¥7,955 million, or 17.1% to ¥54,422 million and operating income increased by ¥2,144 million, or 29.8% to ¥9,349 million. Sales of railroad vehicle equipment remained at the same level as the same period of the previous fiscal year due to steady demand in the domestic market and for subway in China, despite a decrease in European sales due to the sale of a subsidiary in Europe. Sales of aircraft equipment increased year-on-year due to an increase in demand for commercial aircraft. Sales of marine vessels equipment increased significantly year-on-year due to strong demand for new vessels, particularly in China, and MRO (Maintenance, Repair and Overhaul) demand. Sales of commercial vehicle equipment increased year on year due to a gradual recovery in the domestic market.
③
Accessibility Solutions Business Sales increased by ¥6,413 million, or 12.2% to ¥58,998 million and operating income increased by ¥1,429 million, or 33.6% to ¥5,675 million. Sales of the automatic doors business increased year-on-year due to strong demand for doors for overseas buildings and domestic platform doors, as well as the effect of foreign exchange rates.
④
Others Sales decreased by ¥1,061 million, or 14.3% to ¥8,459 million and operating income decreased by ¥207 million, or 29.7% to ¥490 million. Sales of Packaging Machines increased year-on-year due to steady demand for capital investment primarily among domestic food manufacturers.
(Income before tax) Financial income came to ¥749 million mainly due to foreign exchange gains, etc. Financial costs were ¥637 million mainly due to interest expenses. Equity in earnings of affiliates was ¥1,488 million. As a result, interim profit before tax increased by ¥8,613 million year-on-year to ¥17,359 million. (Net income attributable to owners of the parent) As a result, net income attributable to owners of the parent which is related to the continued operations, after deducting income tax expense of ¥5,670 million and net income attributable to non-controlling interests of ¥53 million, increased by ¥5,814 million year-on-year to ¥12,515million. Basic earnings per share decreased by ¥51.02 to ¥106.78. (2) Analysis of Financial Position As of the end of the previous consolidated fiscal year (December 31, 2025) (After Restatement)
①
As of the end of the first six-month period of the current consolidated fiscal year (June 30, 2026)
Total assets
466,632
456,867
Liabilities
176,264
160,025
Equities
290,368
296,842
(Million yen) Change
(9,765)
(16,239) 6,473
Assets Total assets as of June 30, 2026 were ¥456,867 million, a decrease of ¥9,765 million from December 31, 2025, consisting of ¥237,533 million in current assets and ¥219,334 million in non-current assets. The key contributing positive factors were an increase of ¥26,243 million in cash and cash equivalents, an increase of ¥8,947 million in investments accounted for using the equity method, and an increase of ¥5,031 in inventories. The main contributing negative factor were a decrease of ¥43,665 million in assets held for sale and a decrease of ¥9,658 in trade receivables.
②
Liabilities Total liabilities as of June 30, 2026 were ¥160,025 million, a decrease of ¥16,239 million from December 31, 2025, reflecting ¥128,071 million in current liabilities and ¥31,955 million in non-current liabilities. The main contributing positive factor was an increase of ¥8,451 million in borrowings under current assets. The main contributing negative factors were a decrease of ¥12,256 million in liabilities directly related to assets held for sale, a decrease of \10,009 million in borrowings under long-term liabilities, and a decrease of \5,199 million in operating payables.
③
Equity Total equity as of June 30, 2026 stood at ¥296,842 million. Equity attributable to owners of the parent was ¥284,971 million, an increase of ¥11,505 million from December 31, 2025. The main contributing positive factors were the net income attributable to owners of the parent of ¥12,515 million and an increase of ¥4,829 million in other components of equity due to exchange differences on foreign operations. Meanwhile, the main decreasing factor was a decrease in retained earnings of ¥4,706 million due to dividend payment and a decrease of ¥1,297 million in other components of equity related to the disposal group held for sale.
(3) Status of cash flows First six-month period of consolidated FY2025 (January 1, 2025 to June 30, 2025)
(Million yen) First six-month period of consolidated FY2026 (January 1, 2026 to June 30, 2026)
Cash flow from operating activities
20,327
22,029
Cash flow from investing activities
(10,253)
5,202
Free cash flow Cash flow from financing activities
10,074
27,231
4,509
(8,460)
Cash and cash equivalents (hereinafter, “cash”) on a consolidated basis as of June 30, 2026 totaled ¥99,583 million, an increase of ¥26,243 million from December 31, 2025, as cash gained from operating activities and proceeds from sales of shares of subsidiaries resulting in change in the scope of consolidation was mainly appropriated to capital expenditure and dividend payments. Cash flow from operating activities
①
Net cash generated from operating activities for the first six-month period of the current fiscal year totaled ¥22,029 million. The main factors for increases were non-interest income items such as interim income, depreciation and amortization, and a decrease in trade receivables. The main factors for decreases were an increase in inventories, a decrease in trade payables, and the payment of the income tax. Cash flow from investing activities
②
Net cash used in investing activities for the first six-month period of the current fiscal year amounted to ¥5,202 million. The main factors for increases were proceeds from sales of shares of subsidiaries resulting in change in scope of consolidation. Cash flow from financing activities
③
Net cash used in financing activities for the first six-month period of the current fiscal year totaled ¥8,460 million. The main factors for decrease was dividend payments. (4) Issues to be addressed in Business and Finance During the first six-month period of the fiscal year under review, there were no significant changes or new issues to be addressed by the Group. (5) R&D activities Research and development expenses for the first six-month period of the current fiscal year were ¥6,151 million. (6) Number of employees The exclusion of Comtesco Corporation and its subsidiaries from the scope of consolidation following the transfer of 70% of the shares of Comtesco Corporation resulted in a decrease of 647 employees of the Group. The number of employees, excluding employees seconded from our group to outside of our group, is the number of employees employed, including those seconded from outside of our group to our group.
3 【Significant Contracts】 During the first six-month period of the fiscal year, there were no major decisions or conclusions of significant management agreements.
No.3【Status of the Company Submitting the Report】 1【Status of Shares】 (1) 【Total Number of Shares】 ① 【Total number of shares】 Type
Total number of authorized shares (Share)
Common stock
400,000,000
Total
400,000,000
② 【Shares outstanding】
Type
Number of shares outstanding (shares) as of the date of filing As of August 14, 2026
Number of shares outstanding (shares) As of June 30, 2026
Common shares
118,064,699
118,064,699
Total
118,064,699
118,064,699
Name of stock exchange listings
Content
Tokyo Stock Exchange The number of shares per unit is Prime section 100 shares. -
-
(NOTE) The "Number of shares outstanding as of the filing date" column does not include the number of shares issued upon the exercise of stock acquisition rights to shares from August 1, 2026 to the filing date of this Semiannual Report.
(2) 【Status of Stock Acquisition Rights】 ① 【Details of stock option plan】 Not applicable.
② 【Status of other stock acquisition rights】 Not applicable.
(3) 【Status of Exercise of Bonds with Stock Acquisition Rights with Exercise Price Adjustment, etc.】 Not applicable.
(4) 【Changes in the number of issued shares, capital stock, etc.】
Date
June 30, 2026
Number of shares outstanding increase/decrease
Number of shares outstanding as the end of therm.
Change in capital (Million yen)
-
118,064,699
-
Balance of Change in legal Balance of legal capital surplus capital surplus capital (Million yen) (Million yen) (Million yen) 10,000
-
26,274
(5) 【Major Shareholders】
Shareholders
Address
As of June 30, 2026 Shareholding ratio Number of to number of Shares Held shares outstanding (thousands (excluding shares) treasury stock) (%)
The Master Trust Bank of Japan (Trust Account)
8-1 Akasaka 1-chome, Minato-ku, Tokyo AKASAKA INTERCITY AIR
18,368
15.61
Custody Bank of Japan (Trust Account)
8-12 Harumi 1-chome, Chuo-ku, Tokyo
11,668
9.92
5,171
4.40
3,760
3.20
3,556
3.02
2,953
2.51
2,563
2.18
2,099
1.78
1,636
1.39
1,587
1.35
53,362
45.35
Central Japan Railway Company FANUC CORPORATION BBH (LUX) FOR FIDELITY FUNDSGLOBAL TECHNOLOGY POOL (Standing agent) MUFG Bank, Ltd. GOLDMAN SACHS INTERNATIONAL (Standing agent) Goldman Sachs Japan Co., Ltd.
1-4 Meieki 1-chome, Nakamura-ku, Nagoya-shi, Aichi 3580 Shibokusa, Oshinomura, Minamitsuru-gun, Yamanashi 2A RUE ALBERT BORSCHETTE LUXEMBOURG L-1246
4-5 Marunouchi 1-chome, Chiyoda-ku, Tokyo PLUMTREE COURT, 25 SHOE LANE, LONDON EC4A 4AU, U.K.
BNYMSANV AS AGENT/CLIENTS 10 PERCENT
6-1 Toranomon 2-chome, Minato-ku, Tokyo Toranomon Hills Station Tower 240 GREENWICH STREET, NEW YORK, NEW YORK 10286 U.S.A.
(Standing agent) MUFG Bank, Ltd. BNYM AS AGENT/CLIENTS NON TREATY JASDEC
4-5 Marunouchi 1-chome, Chiyoda-ku, Tokyo 240 GREENWICH STREET, NEW YORK, NEW YORK 10286 U.S.A.
(Standing agent) MUFG Bank, Ltd. STATE STREET BANK AND TRUST COMPANY 505001 (Standing agent) Mizuho Bank, Ltd. JP MORGAN CHASE BANK 385781 (Standing agent) Mizuho Bank, Ltd. Total
4-5 Marunouchi 1-chome, Chiyoda-ku, Tokyo ONE CONGRESS STREET, SUITE 1, BOSTON, MASSACHUSETTS 15-1, Konan 2-chome, Minato-ku, Tokyo Shinagawa Intercity Tower A 25 BANK STREET, CANARY WHARF, LONDON, E14 5JP, UNITED KINGDOM 15-1, Konan 2-chome, Minato-ku, Tokyo Shinagawa Intercity Tower A -
(NOTE) 1 Number of shares held is rounded to the nearest thousand. 2 The following corporation submitted a report on the change of 5,047 thousand shares by a company on June 12, 2026. However, as the number of shares beneficially owned in the name of the said corporation cannot be confirmed as of June 30, 2026, it is not included in the above "Status of Major Shareholders."
- FIL Investments (Japan) Limited
- FIL Investments International
(6) 【Status of voting rights】 ① 【Shares outstanding】 Classification
As of June 30, 2026
Number of shares
Number of voting rights
Content
-
-
-
-
-
-
-
-
-
-
-
-
-
1,174,369
-
Non-voting stock Shares with restricted voting rights (Treasury stocks) Shares with restricted voting rights (other)
(Treasury stock held) Common shares 417,000 Shares with full voting rights (treasury stock, etc.) (Mutually Held Shares) Common shares 15,000 Common shares Shares with full voting rights (other) 117,436,900 Common shares Shares less than one unit 195,799 Number of shares outstanding
118,064,699
Voting rights of all shareholders
-
-
Shares less than one unit (100 shares)
-
-
1,174,369
-
(NOTE) 1 Common shares in the "Shares less than one unit" column include 22 shares of treasury stock owned by the Company and 40 shares of our stock owned by Japan Custody Bank, Ltd. (Trust Account E) as trust assets under the "Stock Benefit Trust (BBT)" plan. 2 "Shares with full voting rights (other)" column includes 6,000 shares (60 voting rights) in the name of the Japan Securities Depository Center, Inc. and 433,400 shares (4,334 voting rights) of ours owned by the Japan Custody Bank, Ltd. (Trust Account E) as trust assets for the "Stock Benefit Trust (BBT)" plan. The 4,334 voting rights are not exercised. ② 【Treasury stock】
Owner's name
Address of the holder
(Treasury stock held) Nabtesco Corporation (Mutually Held Shares) Kyokko Denki Co., Ltd.
7-9, Hirakawacho 2-chome, Chiyoda-ku, Tokyo 2-4 Aratacho 1-chome, Hyogo-ku, Kobe-shi, Hyogo
Total
-
Number of treasury stock
As of June 30, 2026 Ratio of shares Number of Total number of held to total shares held in shares to be number of the name of own shares others outstanding (%)
417,000
-
417,000
0.35
15,000
-
15,000
0.01
432,000
-
432,000
0.37
(NOTE) The above numbers of shares held do not include 433,400 shares of our company owned by Japan Custody Bank, Ltd. (Trust Account E) as trust assets under the "Stock Benefit Trust (BBT)" plan.
2 【Status of Management】 Not applicable.
No.4 【Accounting Status】
-
Preparation of summary of interim consolidated financial statements (1) In accordance with the provisions of Article 312 of the Ordinance on Terminology, Forms, and Preparation Methods of Consolidated Financial Statements (Ordinance of the Ministry of Finance No. 28 of 1976; hereinafter referred to as the "Ordinance on Consolidated Financial Statements"), we have prepared the interim consolidated financial statements in accordance with International Accounting Standards No. 34, "Interim Financial Reporting" (hereinafter referred to as "IAS No. 34") because they meet all of the requirements of "Designated International Accounting Standards Designated Companies" stipulated in Article 1-2, Item 2 of the Ordinance on Consolidated Financial Statements. Our summary of interim consolidated financial statements are Class one interim consolidated financial statements. (2) The summary of interim consolidated financial statements has been rounded to the nearest unit.
-
Restatement for Correction of Prior Period Errors As described in Note 4, “Restatement of Prior Period Errors,” to the Condensed Interim Consolidated Financial Statements, the Company determined that retrospective corrections were required for certain items, including its Equity in earnings of affiliates, and accordingly restated the comparative information. The condensed consolidated financial statements and related notes for the interim consolidated accounting period and consolidated fiscal year of the 23rd term presented below reflect such restatements.
-
Audit Certification Pursuant to Article 193-2-1 of the Financial Instruments and Exchange Act, we have received an interim review of the summary of interim consolidated financial statements for the first six-month of fiscal year (January 1, 2026 to June 30, 2026) by KPMG AZSA LLC.
1 【Summary of Interim Consolidated Financial Statement】 (1) 【Summary of Interim Consolidated Financial Position】
Note No.
End of consolidated FY2025 (as of December 31, 2025)
(Million yen) End of the first six-month period of consolidated FY2026 (as of June 30, 2026)
(After Restatement) Assets Current assets Cash and cash equivalents
73,340
99,583
Trade receivables
75,421
65,763
Contract assets
3,207
3,303
Other receivables
1,524
2,467
Inventories
52,838
57,870
Other financial assets
11
715
3,843
5,715
4,704
Subtotal
212,761
237,533
Assets held for sale
43,665
-
Total current assets
256,426
237,533
Property, plant and equipment
101,683
99,601
Intangible assets
13,477
12,735
Right-of-use asset
12,822
12,367
Goodwill
25,817
26,111
Investment property
9,143
9,793
Investments accounted for using the equity method
24,976
33,924
17,082
20,051
Other current assets
Non-current assets
Other financial assets Deferred tax assets
11
4,381
3,742
Other non-current assets
826
1,009
Total non-current assets
210,206
219,334
466,632
456,867
Total assets
Note No.
End of consolidated FY2025 (as of December 31, 2025)
(Million yen) End of the first six-month period of consolidated FY2026 (as of June 30, 2026)
(After Restatement) Liabilities and equity Liabilities Current liabilities Operating payables
45,161
Contract liabilities
39,961
13,111
11,842
34,946
43,397
Other payables
6,848
12,713
Income taxes payables
6,462
5,352
Provision
3,497
2,417
3,609
3,535
29
27
Borrowings
11
Lease liabilities Other financial liabilities
11
Other current liabilities Subtotal Liabilities directly associated with assets held for sale Total current liabilities
8,757
8,827
122,421
128,071
12,256
-
134,677
128,071
10,039
30
11,202
10,729
6,454
6,460
8,303
8,224
898
852
140
140
Non-current liabilities Borrowings
11
Lease liabilities Liabilities concerning retirement benefit Deferred tax liabilities Other financial liabilities Provision
11
Other non-current liabilities
4,551
5,519
Total non-current liabilities
41,587
31,955
176,264
160,025
10,000
10,000
Total liabilities Equity Capital stock Share premium
14,969
15,011
Retained earnings
219,443
227,275
Treasury shares
△3,008 30,764
△2,908
1,297
-
273,466
284,971
16,902
11,870
290,368
296,842
466,632
456,867
Other components of equity Other components of equity related to disposal groups held for sale Total equity attributable to owners of the parent Non-controlling interests Total equity Total liabilities and equity
35,592
(2) 【Summary of Interim Consolidated Statements of Income】 【First six-month of consolidated financial period】
Note No.
First six-month period of consolidated FY2025 (January 1, 2025 to June 30, 2025) (After Restatement)
(Million yen) First six-month period of consolidated FY2026 (January 1, 2026 to June 30, 2026)
Continuing operations Net sales
7,8
Cost of sales Gross profit
167,401
(100,298)
(115,180)
(34,215)
(37,314)
42,975
Other income
656
Selling, general and administrative expense Other expenses Operating income
143,272
7
Financial income
(110)
9,305 223
Financial costs
(833)
Equity in earnings of affiliates
52,221 1,289
(438)
15,759 749
(637)
50
1,488
8,745
17,359
(2,423)
(5,670)
1,122
1,359
7,445
13,047
6,701
12,515
744
533
7,445
13,047
Continuing operations
49.86
95.19
Discontinued operations
5.90
11.59
55.76
106.78
49.86
95.19
Profit (loss) before tax Income tax expenses Income from continuing operations
6,323
Discontinued operations Income from discontinued operations
13
Net income (loss)
11,689
Net income (loss) attributable to Owners of the parent Non-controlling interests Net income (loss) Net income (loss) per share Basic earnings (loss) per share (Yen)
Basic earnings per share (Yen)
10
Diluted earnings per share (Yen) Continuing operations Discontinued operations Diluted earnings (loss) per share (Yen)
10
5.90
11.59
55.76
106.78
(3) 【Summary of Interim Consolidated Statement of Comprehensive Income】 【First six-month of consolidated financial period】
Note No.
First six-month period of consolidated FY2025 (January 1, 2025 to June 30, 2025)
(Million yen) First six-month period of consolidated FY2026 (January 1, 2026 to June 30, 2026)
(After Restatement) Net income (loss)
7,445
13,047
890
2,322
890
2,322
(2,945)
1,536
(252)
236
(3,197)
1,772
(2,307) 5,138
17,141
Owners of the parent
5,413
16,073
Non-controlling interests
(276)
17,141
Other comprehensive income Items that will not be reclassified to profit or loss Net changes in financial assets measured at fair value through other comprehensive income Total components that will not be reclassified to profit or loss Components that will be reclassified to profit or loss Exchange differences on foreign operations Share of other comprehensive income of investments accounted for using equity method Total components that will be reclassified to profit or loss Other comprehensive income after taxes Total comprehensive income
4,093
Comprehensive income attributable to
Total comprehensive income
5,138
1,067
(4) 【Summary of Interim Consolidated Statement of Changes in Equity for the First Six-month Period】 First six-month period of current consolidated fiscal year (January 1, 2025 to June 30, 2025) (Million yen) Equity attributable to owners of the parent Note No. Balance as of January 1, 2025
Capital stock
Share premium
Retained earnings
Treasury shares
10,000
14,998
225,269
Net income (loss)
-
-
6,701
(3,638)
Other comprehensive income
-
-
-
-
Total comprehensive income
-
-
6,701
-
Acquisition, sales, etc. of Treasury shares
-
-
204
-
-
△3
-
(After Restatement)
Dividends
9
Change in scope of consolidation Change in interest in a controlled subsidiary Transfer from other components of equity to retained earnings Share-based compensation transactions Total transactions with owners, etc. Balance as of June 30, 2025
-
-
-
(4,826) -
-
-
28
-
-
-
-
204
-
-
51
-
-
-
79
204
10,000
15,077
(4,626)
227,344
(3,434)
Equity attributable to owners of the parent Total equity
Other components of equity Note No.
Balance as of January 1, 2025
(After Restatement) Net income (loss)
Other comprehensive income Total comprehensive income Acquisition, sales, etc. of Treasury shares Dividends Change in scope of consolidation Change in interest in a controlled subsidiary Transfer from other components of equity to retained earnings Share-based compensation transactions Total transactions with owners, etc. Balance as of June 30, 2025
9
attributable to
Non-controlling
Total equity
Exchange differences on foreign operations
Valuation difference due to change in fair value
21,183
4,747
25,930
272,559
17,185
289,744
-
-
-
6,701
744
7,445
(2,169)
882
(1,287)
(1,287)
(1,020)
(2,307)
-
200
-
200 (5,546) (39)
owners of the
Total
interests
parent
(2,169)
882
-
-
-
-
-
-
-
-
(4,826) -
(720)
-
-
-
28
(67)
-
(204)
(204)
-
-
-
51
-
51
(204)
(204)
(4,546)
(657)
273,426
16,252
(5,203)
- - 19,014
-
5,425
(1,287)
24,439
5,413
(276)
130
5,138
130
-
289,679
First six-month period of current consolidated fiscal year (January 1, 2026 to June 30, 2026) (Million yen) Equity attributable to owners of the parent Note No.
Other components of equity Retained earnings
Treasury shares
Exchange differences on foreign operations
Valuation difference due to change in fair value
24,948
5,816
12,515
(3,008) -
-
-
-
-
-
1,237
2,321
-
-
12,515
-
1,237
2,321
-
-
100
-
-
-
-
(5)
-
-
-
-
-
(4,706) -
-
1,297
-
-
-
27
-
-
-
42
-
-
-
(27)
-
42
100
1,870
10,000
15,011
(4,683)
(2,908)
27,482
Capital stock
Share premium
(After Restatement)
10,000
14,969
219,443
Net income (loss)
-
-
Other comprehensive income
-
Total comprehensive income Acquisition, sales, etc. of Treasury shares
Balance as of January 1, 2026
Dividends
8
Change in scope of consolidation Transfer from other components of equity to retained earnings Share-based compensation transactions Total transactions with owners etc. Balance as of June 30, 2026
227,275
Equity attributable to owners of the parent
Note No
Other components of equity Total
Balance as of January 1, 2026
Total equity Other components of attributable to equity related to the disposal group held for owners of the sale parent
Noncontrolling interests
Total equity
30,764
1,297
273,466
16,902
290,368
-
-
12,515
533
13,047
3,558
-
3,558
535
4,093
Total comprehensive income
3,558
-
16,073
1,067
17,141
Acquisition, sales, etc. of Treasury shares
-
-
96
-
96
-
- (1,297)
(614)
(5,320)
1,297
(4,706)
(27)
-
-
-
-
1,270
(1,297)
(After Restatement) Net income (loss)
Other comprehensive income
Dividends Change in scope of consolidation Transfer from other components of equity to retained earnings Share-based compensation transactions Total transactions with owners etc. Balance as of June 30, 2026
8
35,592
-
(5,485)
(5,485)
42
-
42
(4,568)
(6,099)
(10,667)
-
284,971
-
11,870
-
296,842
-
(27)
8,110
(5) 【Summary of Consolidated Statements of Cash Flows for the First Six-month Period】
Note No.
Cash flow from operating activities Net income (loss) Income from discontinued operations Depreciation and amortization Increase (decrease) in assets and liabilities concerning retirement benefits Interest and dividend income Interest expenses Loss (gain) on valuation of investment securities Equity in (earnings) losses of affiliates Loss (gain) on sales and disposal of non-current assets Income tax expense Decrease (increase) in trade receivables, contract assets and contract liabilities Decrease (increase) in inventories Increase (decrease) in trade payables Increase/decrease in consumption taxes payable/consumption taxes refund receivable Other Subtotal Interest received Dividend received Interest paid Income taxes paid Income taxes refunded (paid) Cash flow from operating activities Cash flow from investing activities Decrease (increase) in time deposits Purchase of property, plant and equipment Purchase of intangible assets Payments for acquisition of subsidiaries resulting in change in the scope of consolidation Proceeds from sale of subsidiaries resulting in change in the scope of consolidation Other Cash flow from investing activities Cash flow from financing activities Net increase (decrease) in short-term loans payable Repayment of long-term loans payable Payments for lease liabilities Net decrease (increase) in treasury shares Dividends paid Dividends paid to non-controlling interests Other Cash flow from financing activities Increase (decrease) in cash and cash equivalents Cash and cash equivalents at beginning of term Effect of exchange rate changes on cash and cash equivalents Increase (decrease) in cash and cash equivalents included in disposal groups classified as held for sale Cash and cash equivalents at end of term
12
First six-month period of consolidated FY2025 (January 1, 2025 to June 30, 2025) (After Restatement)
(Million yen) First six-month period of consolidated FY2026 (January 1, 2026 to June 30, 2026)
6,323 1,122 8,837
11,689 1,359 8,583
(26)
(33)
(246) 383 3 (50) 2 2,810
(267) 554 (67) (1,488) 27 6,268
14,871
9,388
(5,647) (5,683) 886
(4,557) (6,000)
(1,090) 22,495 178 437 (363) - (2,420) 20,327
1,919 27,626 176 598 (522) 1,070 (6,919) 22,029
(2,005) (7,020) (1,309)
(2,896) (2,400) (1,239)
-
11,930
350 (10,253)
(193) 5,202
(269)
1,251
-
12,088 (117) (1,941) 66 (4,824) (678) (86) 4,509 14,583 74,476
(1,651) (14) (2,079) 54 (4,705) (64) - (8,460) 18,771 73,340
(1,885)
1,197
-
6,274
87,174
99,583
【Notes on the Summary of Interim Consolidated Financial Statements】
-
Reporting company Nabtesco Corporation (the “Company”) is a company located in Japan. Our summary of interim consolidated financial statements are composed of the interests in us and our subsidiaries (together, the "Group") and affiliates, with an ended date of June 30, 2026. Our main businesses are Component Solutions Business, Transport Solutions Business, and Accessibility Solutions Business. The details are described in Note "7. Business Segments."
-
Basis of preparation (1) Compliance with IFRS The condensed interim consolidated financial statements have been prepared in accordance with IAS No. 34 under the provisions of Article 312, as they meet all the requirements of "Designated International Accounting Standards Designated Companies" stipulated in Article 1-2, Item 2 of the Regulations for Consolidated Financial Statements. The summary of interim consolidated financial statements were approved by Kazumasa Kimura, representative director, on August 14, 2026. (2) Basis for measurement The summary of interim consolidated financial statements of our group have been prepared on a historical cost basis, except for financial instruments measured at fair value, as described in Note 3, "Significant Accounting Policies," below. (3) Functional and presentation currencies The summary of interim consolidated financial statements of our group represent the Japanese yen, which is our functional currency.
-
Important accounting policies The significant accounting policies that our group applies in this condensed interim consolidated financial statements are the same as those applied in the consolidated financial statements for the previous fiscal year. Income tax expense for the first six-month of the current fiscal year is calculated using the estimated average annual effective tax rate.
-
Restatement for Correction of Prior Period Errors (1) Detail of restatement In calculating the Company’s share of profit or loss of certain associates accounted for using the equity method, it was discovered that the financial figures obtained from those associates had been calculated based on changes in their non-consolidated net assets, whereas they should have been calculated based on changes in consolidated net assets, including those of their subsidiaries. As a result, errors were identified whereby, principally, the amounts of “Share of profit of investments accounted for using the equity method” in the Company’s consolidated statement of income and “Investments accounted for using the equity method” in the consolidated statement of financial position had been continuously understated in prior years. The Company has determined that it is necessary to retroactively adjust the aforementioned errors based on the indication by the accounting auditor, and have restated the condensed interim consolidated financial statements for the previous interim consolidated accounting period and the consolidated financial statements for the previous consolidated accounting year. In addition, other errors have been restated. The main impact compared to before the restatement was an increase of ¥90 million in "Equity in earnings of affiliates" in the condensed interim consolidated statement of income for the previous interim consolidated accounting period, and an increase of ¥3,507 million in "Investment accounted for using the equity method" in the consolidated statement of financial position for the previous fiscal year. (2) Major effect of restatement First six-month of 23rd consolidated fiscal period (From January 1, 2025 to June 30, 2025)
Fiscal period
(Before Restatement)
(Million yen) (Million Income before income taxes yen) Net income attributable to owners of (Million the parent yen) (Million Net income yen) Comprehensive income attributable (Million to owners of the parent yen) (Million Comprehensive income yen) Net sales
(After Restatement)
Variance
143,272
143,272
-
8,544
8,745
201
6,513
6,701
188
7,257
7,445
188
5,388
5,413
25
5,112
5,138
26
Basic earnings per share
(Yen)
54.20
55.76
1.56
Diluted earnings per share
(Yen)
54.20
55.76
1.56
(Million 20,327 20,327 - yen) (Million Cash flows from investing activities (10,253) (10,253) - yen) (Million Cash flows from financing activities 4,509 4,509 - yen) Cash and cash equivalents (Million 87,174 87,174 - at fiscal year or interim end yen) Note From the first six-month period of consolidated FY2025, the hydraulic equipment business has been classified as a discontinued operation. Accordingly, net sales and profit before tax are presented for continuing operations only, excluding the discontinued operation. Cash flows from operating activities
Fiscal period
First six-month of 23rd consolidated fiscal period (From January 1, 2025 to June 30, 2025) (Before Restatement)
Equity attributable to owners of the (Million parent yen) (Million Total assets yen) Ratio of equity attributable (%) to owners of the parent
(After Restatement)
Variance
271,932
273,466
1,534
463,991
466,632
2,641
58.6
58.6
-
(3) Adjustment at the Beginning of the Earliest Period Presented As a cumulative effect of the retrospective correction of the above errors, retained earnings at the beginning of the previous fiscal year increased by ¥1,937 million
(4) Other outstanding matters The Company plans to file amendments to its annual securities reports for prior fiscal years by September 30, 2026, following the completion of its investigation into the above errors. Accordingly, as of the date of this report, no amendments have been made to the annual securities reports and other filings for prior periods. 5. Critical accounting judgments, estimates and assumptions The preparation of summary of interim consolidated financial statements in conformity with IFRS requires management to make judgments, estimates and assumptions that affect the application of accounting policies and the reported amounts of assets, liabilities, revenues and expenses. Actual results could differ from those estimates. Estimates and underlying assumptions are reviewed on an ongoing basis. Changes in accounting estimates are recognized in the period in which the estimates change and in future periods affected. Judgments that involve significant accounting estimates and estimates in these summary of interim consolidated financial statements are, in principle, the same as the consolidated financial statements for the previous fiscal year. 6. Change in presentation In accordance with IFRS 5, the Group classified the hydraulic equipment business as a discontinued operation. As a result, certain items in the consolidated statement of profit or loss, the consolidated statement of cash flows, and related notes to the consolidated financial statements for the previous consolidated fiscal year have been reclassified and presented accordingly. 7. Business Segments (1) Summary of reportable segments The Group’s reportable segments are components of the Group about which separate financial statement is available that is evaluated regularly at the Board of Directors’ meetings in deciding how to allocate the management resources and in assessing performance. The Group classifies its business segments into the following three reportable segments, based on the similarity of business models: 1) the “Component Solutions Business;” 2) the “Transport Solutions Business;” and 3) the “Accessibility Solutions Business.” The main lines of business of each reportable segment are as below.
Business segment Component Solutions Business
Main lines of business
Design, manufacture, sale, maintenance and repair of industrial robot components.
Transport Solutions Business
Design, manufacture, sale, maintenance and repair of brake equipment and automatic doors for rolling stock, aircraft parts, automobile brake equipment and drive control equipment, marine control equipment and other components
Accessibility Solutions Business
Design, manufacture, sale, installation, maintenance and repair of automatic door systems for buildings and general industries, platform safety equipment, etc., and parts thereof
(2) Information on reportable segments
The accounting policies of the reportable segments are the same as the accounting policies of our group described in "3. Important accounting policies “in the notes. Intersegment sales and transfers are based on prevailing market prices. First six-month period ended June 30, 2025 (January 1, 2025 to June 30, 2025) Reportable Segments (After Restatement)
Component Transport Accessibility Solutions Solutions Solutions
Total
Others
Total
(Million yen) Amount stated in summary of Adjustments consolidated statements of income
Net sales Sales to external customers Inter-segment sales Total sales Segment income (Operating income) Financial income
36,821
46,467
52,585
135,873
7,399
143,272
-
143,272
270
805
2
1,077
12
1,090
(1,090)
-
37,091
47,272
52,587
136,951
7,411
144,362
(1,090)
143,272
1,856
7,205
4,247
13,308
697
14,005
(4,700)
9,305 223
Financial costs
(833)
Equity in earnings of affiliates
50
Income before tax 8,745 Notes: 1. “Others” is a business segment that is not a reportable segment and consists of businesses that are engaged in the design, manufacture, sale, maintenance and repair of packaging machines, three-dimensional model production device and components thereof. 2. Adjustment to sales is as a result of eliminations of inter-segment transactions. 3. Adjustment to segment income (operating income) is total profit/loss, etc. that are not allocated to the respective segments. First six-month period ended June 30, 2026 (January 1, 2026 to June 30, 2026)
Reportable Segments Component Transport Solutions Solutions
Accessibilit y Solutions
Total
Others
Total
(Million yen) Amount stated in summary of Adjustments consolidated statements of income
Net sales Sales to external customers
45,521
54,422
58,998
158,942
416
963
7
1,386
Total sales
45,937
55,385
59,006
160,328
Segment income (Operating income)
4,841
9,349
5,675
19,865
Inter-segment sales
8,459 167,401
-
167,401
1,395
(1,395)
-
8,468 168,796
(1,395)
167,401
(4,597)
15,759
9 490
20,356
Financial income
749
Financial costs
(637)
Equity in earnings of affiliates
1,488
Income before tax 17,359 Notes: 1. “Others” is a business segment that is not a reportable segment and consists of businesses that are engaged in the design, manufacture, sale, maintenance and repair of packaging machines, three-dimensional model production devices and components thereof. 2. Adjustment to sales is as a result of eliminations of inter-segment transactions. 3. Adjustment to segment income (operating income) is total profit/loss, etc. that are not allocated to the respective segments.
Revenue from contracts with customers Our businesses are comprised of Component Solutions Business, Transport Solutions Business, Accessibility Solutions Business and Other Businesses, and are subject to periodic review by our Board of Directors to determine the allocation of management resources and assess performance. In our group, revenues earned through these businesses are presented as net sales. Net sales are broken down by major products. The relation between these disaggregated net sales and net sales by segment as described in Note "7. Business Segments" is as follows: There is no obligation to perform as an agent for our group.
Business segment
Major products Precision Reduction Gears
Component Solutions Business
45,146
330
375
Subtotal
36,821
45,521
Railroad Vehicle Equipment
14,365
14,104
Aircraft Equipment
11,417
13,846
6,025
6,625
11,507
15,340
3,154
4,508
Subtotal
46,467
54,422
Automatic Door
52,585
58,998
Subtotal
52,585
58,998
7,091
8,179
308
281
7,399
8,459
143,272
167,401
Commercial Vehicle Equipment Marine Vessels Equipment Others
Accessibility Solutions Business
Packaging Machines Others
Others
(Million yen) First six-month period of consolidated FY2026 (January 1, 2026 to June 30, 2026)
36,490
Other
Transport Solutions Business
First six-month period of consolidated FY2025 (January 1, 2025 to June 30, 2025)
Subtotal Total (NOTE) Amounts are expressed as external sales.
9.Cash dividends (1) Cash dividends paid were as follows: Previous interim consolidated fiscal year (January 1, 2025, to June 30, 2025) Resolution March 26, 2025
Total dividends (Millions of yen)
Dividends per share (yen)
Record Date
Effective date
4,826 40 December 31, 2024 March 27, 2025 Annual Shareholders' Meeting (NOTE) The total amount of dividends declared by resolution of the Ordinary General Meeting of Shareholders on March 26, 2025 includes dividends of 21 million yen on our shares held by the trust account (re-trustee: Japan Custody Bank, Ltd. (Trust Account E)) of Mizuho Trust & Banking Co., Ltd. related to the stock benefit trust (BBT). Current interim consolidated fiscal year (January 1, 2026, to June 30, 2026) Resolution March 26, 2026
Total dividends (Millions of yen)
Dividends per share (yen)
Record Date
Effective date
4,706 40 December 31, 2025 March 27, 2026 Annual Shareholders' Meeting (NOTE) The total amount of dividends declared by resolution of the Ordinary General Meeting of Shareholders on March 26, 2026 includes dividends of 18 million yen on our shares held by the trust account (re-trustee: Japan Custody Bank, Ltd. (Trust Account E)) of Mizuho Trust & Banking Co., Ltd. related to the stock benefit trust (BBT).
(2) Dividends for which the base date belongs to the current interim consolidated fiscal year and for which the effective date of distribution falls in the end of interim consolidated fiscal year Previous interim consolidated fiscal year (January 1, 2025, to June 30, 2025) Resolution
Total dividends (Millions of yen)
Dividends per share (yen)
Record Date
Effective date
July 31, 2025 Board of Directors’ 4,826 40 June 30, 2025 August 29, 2025 Meeting (NOTE) Total dividends declared by resolution of the Board of Directors on July 31, 2025 include dividends of 18 million yen on our shares held by the Trust Account (re-trustee: Japan Custody Bank, Ltd. (Trust Account E)) of Mizuho Trust & Banking Co., Ltd. related to the Share Benefit Trust (BBT). Current interim consolidated fiscal year (January 1, 2026, to June 30, 2026) Resolution
Total dividends (Millions of yen)
Dividends per share (yen)
Record Date
Effective date
July 31, 2026 Board of Directors’ 4,824 41 June 30, 2026 August 31, 2026 Meeting (NOTE) Total dividends declared by resolution of the Board of Directors on July 31, 2026 include dividends of 18 million yen on our shares held by the Trust Account (re-trustee: Japan Custody Bank, Ltd. (Trust Account E)) of Mizuho Trust & Banking Co., Ltd. related to the Share Benefit Trust (BBT).
10.Earnings per shares (1) Basis for calculating basic earnings per share (first six-month period) Basic earnings per share and the calculation basis are as follows: (First six-month of consolidated financial period) First six-month period of consolidated FY2025 (January 1, 2025 to June 30, 2025)
First six-month period of consolidated FY2026 (January 1, 2026 to June 30, 2026)
(After Restatement) (Millions of yen) Weighted average number of shares of common (Thousands stock of shares) Profit attributable to owners of the parent
Basic earnings per share
6,701
12,515
120,159
117,201
55.76
106.78
(Yen)
(2) Basis for calculating diluted earnings per share Diluted earnings per share and the calculation basis are as follows: (First six-month of consolidated financial period) First six-month period of consolidated FY2025 (January 1, 2025 to June 30, 2025)
First six-month period of consolidated FY2026 (January 1, 2026 to June 30, 2026)
(After Restatement) Diluted net income attributable to owners of the (Millions of parent yen) Weighted average number of shares of common (Thousands stock of shares) Effect of stock options using the stock acquisition (Thousands rights method of shares) (Thousands Diluted weighted average shares for common stock of shares) Diluted earnings per share
(Yen)
6,701
12,515
120,159
117,201
2
-
120,161
117,201
55.76
106.78
11.Financial instruments (1) Fair Value Measurements ① Financial assets measured at amortized cost Other financial assets Fair values of other financial assets are primarily valued based on the present value of these assets discounted at a rate adjusted for credit risk, segregated by certain time periods. ② Financial assets measured at fair value through profit or loss a Golf membership The fair value of golf memberships is valued based on quoted prices and other factors. Golf membership is included in "Other Financial Assets" in the Summary of Interim Consolidated Statements of Financial Position b Investment securities Debt instruments, which consist primarily of corporate bonds held for non-trading purposes, are calculated using valuation techniques based on quoted market prices of similar companies. Investment securities are included in "other financial assets" in the Summary of Interim Consolidated Financial Statement. ③ Financial assets measured at fair value through other comprehensive income Investment securities Equity instruments consisting primarily of stocks held for non-trading purposes. Listed stocks are calculated using quoted market prices on exchanges, and unlisted stocks are calculated using valuation techniques based on market prices of similar companies and valuation techniques based on net asset value. Investment securities are included in "other financial assets" in the Summary of Interim Consolidated Financial Statement. ④ Financial liabilities measured at amortized cost Borrowings The fair value of borrowings is calculated based on the present value of the sum of principal and interest discounted at the interest rate assumed for new similar borrowings. ⑤ Financial liabilities measured at fair value through profit or loss a Derivative financial liabilities The fair value of foreign currency forward contracts is calculated based on forward exchange rates and other factors. The fair values of foreign currency swap agreements and interest rate swap agreements are calculated based on prices provided by counterparty financial institutions, etc. Derivative financial liabilities are included in "Other financial liabilities" in the summary of interim consolidated statements of financial position. b Contingent consideration The fair value of the financial liabilities for contingent consideration is calculated based on the present value of future payments calculated using a Monte Carlo simulation, primarily based on forecasts of performance and other factors. Financial liabilities related to contingent consideration are included in "Other financial liabilities" in the Summary of Interim Consolidated Statements of Financial Position.
(2) Carrying amounts and fair values of each class of financial instruments The carrying amounts and fair values of financial assets and financial liabilities in the summary of interim consolidated statements of financial position are as follows: (Million yen) End of the first six-month period of consolidated FY2026 (as of June 30, 2026)
End of consolidated FY2025 (as of December 31, 2025) Book value
Fair value
Book value
Fair value
Financial assets Financial assets measured at amortized cost Other financial assets
3,467
3,467
6,163
6,163
3,467
3,467
6,163
6,163
Golf membership
157
157
157
157
Investment securities
320
320
343
343
477
477
500
500
Investment securities
13,855
13,855
17,231
17,231
Total financial assets measured at fair value through other comprehensive income
13,855
13,855
17,231
17,231
17,799
17,799
23,894
23,894
44,985
44,837
43,427
43,426
44,985
44,837
43,427
43,426
Derivative financial liabilities
911
911
863
863
Contingent consideration
17
17
17
17
927
927
880
880
45,913
45,765
44,307
44,306
Total financial assets measured at amortized cost Financial assets measured at fair value through profit or loss
Total financial assets measured at fair value through profit or loss Financial assets measured at fair value through other comprehensive income
Total of financial assets Financial Liabilities Financial liabilities measured at amortized cost Borrowings Total financial liabilities measured at amortized cost Financial Liabilities measure at fair value through profit or loss
Total financial liabilities measure at fair value through profit or loss Total financial liabilities
At initial recognition, the Company did not hold any financial assets or financial liabilities that were irrevocably elected to be designated as financial assets and financial liabilities measured at fair value through profit or loss. Cash and cash equivalents, trade receivables, contract assets, other receivables, trade payables, and other payables, which are financial instruments measured at amortized cost, are not included in the table above because their carrying amounts approximate fair value due to their short-term maturities.
(3) Level-based classification of the fair value hierarchy The recurring fair values of financial assets and financial liabilities are measured and analyzed as follows: These fair value amounts are categorized into three fair value hierarchies (levels 1 through 3) based on the inputs to the valuation techniques used (available market data). Each level is defined as follows: Level 1: Fair values measured at quoted prices in actively traded markets Level 2: Fair values calculated using observable prices, either directly or indirectly, other than Level 1 Level 3: Fair values derived from valuation techniques that include unobservable inputs Transfers between levels of the fair value hierarchy are recognized on the date that the events or changes in circumstances that give rise to the transfer occur. The following table presents the fair value hierarchy for financial assets and financial liabilities measured at fair value on a recurring basis: (Million yen) End of the previous consolidated fiscal year (As of December 31, 2025)
Level 1
Level 2
Level 3
Total
Other financial assets Financial assets to be measured at fair value through profit or loss Financial assets measured at fair value through other comprehensive income
-
157
320
477
6,323
-
7,532
13,855
-
911
17
927
Other financial liabilities Financial liabilities measured at fair value through profit or loss
(Million yen) End of the first six-month period of consolidated FY2026 (as of June 30, 2026)
Level 1
Level 2
Level 3
Total
Other financial assets Financial assets to be measured at fair value through profit or loss Financial assets measured at fair value through other comprehensive income
-
157
343
500
8,542
-
8,689
17,231
-
863
17
880
Other financial liabilities Financial liabilities measured at fair value through profit or loss
The fair value hierarchy for financial instruments measured at amortized cost, which is disclosed in "(2) Carrying amounts and fair values of each class of financial instruments," is categorized principally in Level 3. There were no transfers between Levels 1 and 2 and 3 in the previous fiscal year or the first three-month of current fiscal year. There were no significant assets or liabilities measured at fair value on a nonrecurring basis at the end of the previous or first six-month of current fiscal year.
(4) Information on Level 3 fair value measurements ① Valuation techniques and inputs Level 3 other financial assets and other financial liabilities consist primarily of unlisted equity securities and contingent consideration. The fair value of unlisted equity securities is determined using valuation techniques based on quoted market prices for comparable companies and valuation techniques based on net asset value. The fair value of the financial liabilities for contingent consideration is calculated based on the present value of future payments calculated using a Monte Carlo simulation, primarily based on forecasts of performance and other factors. ② Evaluation process Fair value measurements for Level 3 financial instruments are performed in accordance with relevant internal rules. When measuring fair value, the Company uses valuation techniques and inputs that most appropriately reflect the nature, characteristics and risks of the underlying financial instruments. ③ Level 3 sensitivity information for recurring fair value measurements Significant unobservable inputs for measuring the fair value of Level 3 financial instruments measured at fair value on a recurring basis are EBIT multiples, illiquidity discounts, and other inputs based on financial projections. Fair value is increased (decreased) by an increase (decrease) in EBIT multiples and decreased (increased) by an increase (decrease) in illiquidity discounts. For instruments classified as Level 3, the increase or decrease in fair value of the change in the inputs that are not observable to reasonably possible alternative assumptions would not be material. ④ Reconciliation of financial instruments classified as Level 3 from the beginning of the period to the ending balance
Balance at beginning of period
First six-month period of consolidated FY2025 (January 1, 2025 to June 30, 2025)
(Million yen) First six-month period of consolidated FY2026 (January 1, 2026 to June 30, 2026)
Financial assets
Financial assets
Financial Liabilities
Financial Liabilities
6,723
30
7,852
17
157
1
827
(0)
(3)
1
22
(0)
160
-
805
-
Purchase
101
-
353
-
Sale
-
-
(0)
-
6,981
31
9,032
17
Total gains and losses Net Income (Loss) (Note 1) Other comprehensive (Note 2)
Balance at end of period
income
(NOTE) 1 Gains and losses recognized in profit or loss primarily represent unrealized gains and losses on financial instruments sold in the first six-month of current fiscal year and are included in "Financial income and loss" in the Summary of Interim Consolidated Statements of Income. 2 Gains and losses recognized in other comprehensive income are included in "Net changes in financial assets measured at fair value through other comprehensive income" in the summary of Interim Consolidated Statements of Comprehensive Income.
12.Loss of control over subsidiary First six-month period of consolidated FY2025 (From January 1, 2025 to June 30, 2025) Not applicable. First six-month period of consolidated FY2026 (From January 1, 2026 to June 30, 2026) Not applicable. (1) Overview of the Transaction On July 31, 2025, in accordance with the share transfer agreement concluded with Comer Industries S.p.A. for the hydraulic equipment business of the Company and its consolidated subsidiaries, on December 31, 2025, we consolidated the business into a newly established wholly owned subsidiary (Comtesco Corporation) through an absorption-type company split, and completed the transfer of 70% of the outstanding shares of Comtesco Corporation on January 1, 2026. As a result, Comtesco Corporation became our equity-method affiliate. During the current interim consolidated accounting period, the gain recognized on the change in ownership interest due to the loss of control of a consolidated subsidiary was 1,957 million yen, including the realization of exchange differences on translating foreign operations, and is included in "Interim income from discontinued operations" in the condensed interim consolidated statements of income. The portion of the gain attributable to the measurement of the residual investment held in the former subsidiary at fair value as of the date of loss of control is immaterial.
(2) Proceeds from sale of subsidiaries (Million yen) Item
Amount
Cash consideration received
17,724
Cash and cash equivalents held at the time of loss of (6,194) control Proceeds from sale of subsidiaries (net of cash 11,530 disposed) The consideration of 11,530 million yen for the transfer of the Hydraulic Equipment Business conducted in January 2026 was received during the current interim consolidated accounting period and recorded in "Cash flow from investing activities" in the Summary of Interim Consolidated Statements of Cash Flows.
(3) Assets and liabilities at the time of loss of control (Million yen) Item
Amount
Current assets
26,626
Non-current assets
14,498
Total assets
41,125
Current liabilities
9,573
Non-current liabilities
969
Total current liabilities
10,541
13.Discontinued operations (1) Summary of discontinued operations On July 31, 2025, in accordance with the share transfer agreement concluded with Comer Industries S.p.A. for the hydraulic equipment business of the Company and its consolidated subsidiaries, on December 31, 2025, we consolidated the business into a newly established wholly owned subsidiary (Comtesco Corporation) through an absorption-type company split, and completed the transfer of 70% of the outstanding shares of Comtesco Corporation on January 1, 2026. Accordingly, the hydraulic equipment business has been classified as discontinued operations for the previous interim consolidated accounting period.. (2) Profit (loss) from discontinued operations (Million yen) First six-month period of consolidated FY2026 (January 1, 2026 to June 30, 2026)
First six-month period of consolidated FY2025 (January 1, 2025 to June 30, 2025) Discontinued operations Income Costs Profit (loss) before tax from discontinued operations Income tax expenses Income from discontinued operations
21,295
1,957
(19,785)
-
1,510
1,957
(388)
(598)
1,122
1,359
(NOTE) In the current interim consolidated accounting period, income of ¥1.869 billion recognized mainly from the realization of exchange differences on translating foreign operations associated with the transfer of shares of Comer Industries S.p.A. is included. (3) Net income (loss) attributable to (Million yen) First six-month period of consolidated FY2026 (January 1, 2026 to June 30, 2026)
First six-month period of consolidated FY2025 (January 1, 2025 to June 30, 2025) Owners of the parent Income from continuing operations Income from discontinued operations
5,992 709
11,156 1,359
Total
6,701
12,515
Income from continuing operations
331
533
Income from discontinued operations
413
-
Total
744
533
Cash flows from operating activities
First six-month period of consolidated FY2025 (January 1, 2025 to June 30, 2025) 1,762
(Million yen) First six-month period of consolidated FY2026 (January 1, 2026 to June 30, 2026) -
Cash flows from investing activities
(1,310)
11,530
Cash flows from financing activities
(411)
-
41
11,530
Non-controlling interests
(4) Cash flows from discontinued operations
Total
14.Commitment Significant commitments contractually committed to the acquisition of property, plant and equipment are as follows: (Million yen) End of consolidated FY2025 (as of December 31, 2025) Commitment
End of consolidated FY2026 (as of June 30, 2026)
2,803
2,097
15.Significant subsequent events (Purchase and retirement of treasury stock) The Company resolved at its Board of Directors, at a meeting held on July 31, 2026, to set the maximum allowance for acquisition of own shares, pursuant to Article 156 of the Companies Act as applied pursuant to Article 165, Paragraph 3 of the same act and to cancel treasury shares pursuant to Article 178 of the Companies Act. (1) Reason for Conducting the Share Repurchase We will increase shareholder value per share and repurchase and retire treasury stock to improve capital efficiency. (2) Contents of matters pertaining to the acquisition ① Class of shares to be acquired: Our common share of the Company ② Total number of shares which can be acquired: Up to 4 million shares (Percentage of the total number of issued shares (excluding treasury stare) 3.40%) ③ Total amount of shares acquisition cost: Up to 15 billion yen ④ Acquisition period: August 3, 2026 to November 30, 2026 ⑤ Method of acquisition: Open market purchase on the Tokyo Stock Exchange (3) Details of retirement ① Class of shares to be cancelled: Our common share of the Company ② Number of shares to be cancelled: All the shares acquired as per 2 above ③ Scheduled date for the cancellation: December 15, 2026
2 【Others】 With regard to the interim dividend for the 24th fiscal period (from January 1, 2026 to December 31, 2026), at the Board of Directors meeting held on July 31, 2026, the Company resolved to pay an interim dividend to shareholders or registered pledgees of record as of June 30, 2026 as follows. ①
Total interim dividend
②
Dividend for first six-month
③
Effective Date and Commencement Date of Payment
¥4,824 million 41 yen August 31, 2026
Part two 【Information on Assurance Companies, etc. of Submitting Companies】 Not applicable.
[Cover] [Filing]
Confirmation Report
[Articles of Basis]
Item 1 on the table in Article 24-5-1 of the Financial Instruments and Exchange Act
[Submit to]
Kanto Finance Bureau
[Submission date]
September 30, 2026
[Company name]
Nabtesco Corporation
[English translation name]
Nabtesco Corporation
[Name of Representative]
Kazumasa Kimura, representative director
[Name of Chief Financial Officer]
Not applicable.
[Near contact location]
7-9, Hirakawacho 2-chome, Chiyoda-ku, Tokyo
[Locations for Public Inspection]
Tokyo Stock Exchange, Inc.
- [Matters Concerning the Adequacy of the Content of the Semiannual Report] Kazumasa Kimura, the representative director of our company, has confirmed that the content of the semiannual report for the first six months of 24th accounting period (from January 1, 2026, to June 30, 2026) is accurately stated in accordance with the Financial Instruments and Exchange Act. 2
- [Special Matters] There are no notable matters to report upon confirmation.
(Amended) Annual Security Report FY2025 Sep 30, 2026 Investor Relations Securities report
Bull 0
Bear 3
Routine
(Translation) This document has been translated from the Japanese original for the convenience of overseas stakeholders. In the event of any discrepancy between this document and the Japanese original, the original shall prevail.
[Cover] [Filing]
Amendment Report to Annual Securities Report
[Articles of Basis]
Article 24(1) of the Financial Instruments and Exchange Act
[Submit to]
Kanto Finance Bureau
[Submission date]
September 30, 2026
[Fiscal year]
23rd fiscal period (from January 1, 2025 to December 31, 2025)
[Company name]
Nabtesco Corporation
[English translation name]
Nabtesco Corporation
[Title and Name of Representative]
Kazumasa Kimura, Representative director
[Location of the head office]
7-9, Hirakawacho 2-chome, Chiyoda-ku, Tokyo
[Phone No.]
+81-3-5213-1134
[Name of administrative liaison]
Yasushi Minegishi, General Manager, Corporate Communications Dept.
[Near contact location]
7-9, Hirakawacho 2-chome, Chiyoda-ku, Tokyo
[Phone No.]
+81-3-5213-1134
[Name of administrative liaison]
Yasushi Minegishi, General Manager, Corporate Communications Dept.
[Locations for Public Inspection]
Tokyo Stock Exchange, Inc. (2-1, Nihonbashi Kabutocho, Chuo-ku, Tokyo)
―1―
(Translation) This document has been translated from the Japanese original for the convenience of overseas stakeholders. In the event of any discrepancy between this document and the Japanese original, the original shall prevail.
- Reasons for Filing the Amendment Report to the Annual Securities Report In April 2026, the Company became aware that TMT Machinery, Inc., (Nabtesco's ownership interest is 33%.) an equity-method affiliate, had recorded a gain on extinguishment of tie-in shares arising from the absorption-type merger of one of its subsidiaries (approximately ¥600 million attributable to Nabtesco's ownership interest). Upon becoming aware of this matter, the Company shared the information with its independent auditor and commenced an investigation into the retained earnings accumulated within TMT Machinery's subsidiaries and affiliated entities. As TMT Machinery is an unlisted company and does not prepare consolidated financial statements, the Company had historically applied the equity method based on TMT Machinery's standalone financial statements. Through its investigation, the Company identified that substantial retained earnings had accumulated within TMT Machinery's subsidiaries and affiliated entities and that the portion attributable to the Company had not been reflected in the share of profit (loss) of investments accounted for using the equity method. While continuously consulting with its independent auditor, the Company proceeded with a detailed review of the scope and amount of profits to be recognized. In the course of the accounting auditor’s interim review procedures for the condensed interim consolidated financial statements included in the Semi-annual Securities Report filed on August 14, 2026, the Company re-examined the scope and amounts of profit to be recognized and determined that the aggregate unrecognized amount was expected to be approximately ¥2.8 billion based on the Company’s ownership interest. Following discussions with the accounting auditor, the Company determined that it would be appropriate to recognize share of profit (loss) of investments accounted for using the equity method in accordance with the timing at which profits and losses arose at the subsidiaries and other entities in prior fiscal years, and to correct other errors at the same time. Accordingly, the Company determined that it was necessary to retrospectively amend its Annual Securities Reports, Semi-annual Securities Reports and Quarterly Securities Reports for prior fiscal years. As a result, certain information contained in the Annual Securities Report for the 23rd fiscal year (from January 1, 2025 to December 31, 2025), filed by the Company on March 25, 2026, requires correction. Accordingly, pursuant to the provisions of Article 24-2, paragraph (1) of the Financial Instruments and Exchange Act, the Company hereby files this Amendment Report to the Annual Securities Report. The amended consolidated financial statements and non-consolidated financial statements have been audited by KPMG AZSA LLC, and the relevant independent auditor’s report is attached hereto.
- Matters Amended Part I. Corporate Information Section 1. Overview of the Company
- Trend in Major Management Indicators
- Description of Business
- Status of Affiliated Companies Section 2. Business Conditions
- Management Policies, Business Environment and Issues to Be Addressed
- Management’s Discussion and Analysis of Financial Condition, Results of Operations and Cash Flows Section 4. Status of the Company Submitting the Report
- Status of Corporate Governance Section 5. Accounting Status
- Consolidated Financial Statements
- Non-consolidated Financial Statements
- Amended Sections Amended sections are indicated by underlining. As the amendments are extensive, only the amended information is presented for the matters listed above.
―2―
(Translation) This document has been translated from the Japanese original for the convenience of overseas stakeholders. In the event of any discrepancy between this document and the Japanese original, the original shall prevail.
Part one 【Corporate Information】 No.1 【Overview of the Company】 1 【Changes in Major Management Indicators】 (1) Consolidated management indicators Fiscal term
19th
20th
21st
22nd
23rd
Fiscal year
2021/12
2022/12
2023/12
2024/12
2025/12
(Million yen) Income before income (Million taxes yen) Net income attributable to (Million owners of the parent yen) (Million Net income yen) Comprehensive income (Million attributable to owners of yen) the parent (Million Comprehensive income yen) Equity attributable to (Million owners of the parent yen) (Million Total assets yen) Equity attributable to owners of the parent per (Yen) share Total basic earnings per (Yen) share Net sales
299,641
309,123
333,367
280,458
307,912
101,806
16,553
25,316
14,225
21,983
64,771
10,415
14,226
10,188
15,255
67,846
12,338
16,102
11,765
17,185
71,573
19,048
20,762
19,360
20,394
75,924
21,597
23,217
22,184
22,685
241,372
251,250
262,721
272,559
273,466
483,653
462,440
428,630
449,845
466,632
2,011.28
2,093.15
2,188.27
2,268.84
2,333.54
534.29
86.79
118.52
84.83
127.87
(Yen)
534.14
86.78
118.50
84.82
127.87
(%)
49.9
54.3
61.3
60.6
58.6
(%)
29.4
4.2
5.5
3.8
5.6
Price-earnings ratio
(times)
6.4
38.8
24.3
33.1
31.3
Cash flows from operating activities Cash flows from investing activities Cash flows from financing activities Cash and cash equivalents at fiscal year end
(Million yen) (Million yen) (Million yen) (Million yen)
36,340
7,717
11,177
26,650
32,824
67,147
13,231
-46,295
-28,733
-15,725
-57,960
-13,456
-13,482
-4,137
112,771
124,413
77,835
74,476
-13,559
Number of employees
(Persons)
7,844
7,928
8,158
8,227
8,472
Diluted earnings per share Ratio of equity attributable to owners of the parent Profit ratio of equity attributable to owners of the parent company
73,340
(NOTE) 1 Figures are rounded to the nearest unit. 2 Consolidated financial statements are prepared in accordance with International Financial Reporting Standards (IFRS). 3 From the current consolidated fiscal year, the hydraulic equipment business has been classified as a discontinued operation. Accordingly, net sales and profit before tax for the 22nd and 23rd fiscal years are presented for continuing operations only, excluding the discontinued operation.
―3―
(Translation) This document has been translated from the Japanese original for the convenience of overseas stakeholders. In the event of any discrepancy between this document and the Japanese original, the original shall prevail.
(2) Non-consolidated management indicators Fiscal term
19th
20th
21st
22nd
23rd
Fiscal year
2021/12
2022/12
2023/12
2024/12
2025/12
Net sales Ordinary income Net Income Common stock Number of issued shares Net assets Total assets
(Million yen) (Million yen) (Million yen) (Million yen) (Thousan ds of shares) (Million yen) (Million yen)
Net assets per share
(Yen)
Dividends per share (including interim dividends per share)
(Yen)
Net income per share
163,288
167,511
176,334
155,923
177,112
18,703
19,635
11,653
6,759
14,275
51,427
37,966
14,527
7,956
11,753
10,000
10,000
10,000
10,000
10,000
121,064
121,064
121,064
121,064
118,065
170,165
169,220
174,651
174,038
167,519
311,706
292,573
275,331
274,292
278,450
1,417.76
1,454.85
1,454.59
1,448.69
1,429.43
77.00
78.00
80.00
80.00
80.00
(38.00)
(39.00)
(40.00)
(40.00)
(40.00)
(Yen)
424.22
316.39
121.02
66.24
98.52
Fully diluted Net income per share
(Yen)
424.11
316.32
121.00
66.24
98.52
Equity Ratio
(%)
54.6
59.7
63.4
63.4
60.2
Return on equity
(%)
35.6
22.0
8.5
4.6
6.9
Price-earnings ratio
(times)
8.0
10.6
23.8
42.4
40.7
Dividend payout ratio
(%)
18.2
24.7
66.1
120.8
81.2
2,369
2,390
2,448
2,485
2,186
(342)
(317)
(344)
(334)
(299)
(%)
77.0
77.9
68.9
69.1
91.7
(%)
(112.7)
(110.0)
(141.1)
(169.9)
(213.2)
Highest stock price
(Yen)
5,610
3,805
3,795
2,984
4,107
Lowest stock price
(Yen)
3,120
2,709
2,518
2,121
1,889
Number of employees (Average number of temporary employees) Total shareholder return (Comparative index: TOPIX including dividends)
(Persons)
(NOTE) 1 Figures are rounded to the nearest unit. 2 The highest and lowest share prices are those on the First Section of the Tokyo Stock Exchange before April 3, 2022, and those on the Prime Market of the Tokyo Stock Exchange after April 4, 2022. 3 Of the ¥80 per share dividend for the 23rd fiscal year, the ¥40 per share year-end dividend is subject to approval at the Annual General Meeting of Shareholders to be held on March 26, 2026.
―4―
(Translation) This document has been translated from the Japanese original for the convenience of overseas stakeholders. In the event of any discrepancy between this document and the Japanese original, the original shall prevail.
2 【Corporate History】 Year and month
History
September. 2003 TS Corporation (formerly Teijin Seiki Co., Ltd.) and NABCO Ltd. established the Company through a share transfer. The Company listed our shares on the First Section of the Tokyo Stock Exchange. October, 2004 The Company absorbed two wholly owned subsidiaries, TS Corporation (formerly Teijin Seiki Co., Ltd.) and NABCO Ltd., through a simplified merger process. February, 2008. The Company established a Nabtesco Power Control (Thailand) Co., Ltd. in Thailand. December, 2009 Established Nabtesco Automotive Corporation. The automobile-related equipment business was transferred to January, 2011
the company. Established Jiangsu Nabtesco KTK Railroad Products Co., Ltd. in China.
April, 2011 Acquired Automatic Door division (now Gilgen Door Systems AG) from KABA Holding AG of Switzerland. August, 2011. The head office was relocated to the current site (7-9, Hirakawa-cho 2-chome, Chiyoda-ku, Tokyo). October, 2011 Established Jiangsu Nabtesco Hydraulic Co., Ltd. (currently Nabtesco (China) Precision Equipment Co., Ltd.) in China. April, 2016 Acquired additional shares in NABCO Systems Co., Ltd., and made it a subsidiary. March, 2017 April, 2022
Acquired an equity interests in OVALO GmbH and made it a subsidiary. Shifted from the First Section to the Prime Market due to a review of the market classification of the Tokyo Stock Exchange.
August, 2023 Acquired an equity interest in R.K. DEEP SEA TECHNOLOGIES LIMITED and made it a subsidiary. December, 2025 The hydraulic equipment business was transferred to Comtesco Corporation through an absorption-type company split. (NOTE) 1. As of January 1, 2026, 70% of the issued shares of Comtesco Corporation was transferred to Comer Industries S.p.A. 2. The history of the wholly-owned subsidiaries TS Corporation (formerly Teijin Seiki Co., Ltd.) and NABCO Ltd. are as follows. TS Corporation. August, 1944
NABCO Ltd.
Spun off as Teijin Aircraft Industry Co., Ltd. from Teikoku
March, 1925
Nippon Air Brake Co., Ltd. was established in Kobe through
Jinzo-Kenshi Kaisha, Ltd., (renamed TEIJIN LIMITED in
the investment of three companies: Kobe Steel, Ltd., Engine
November 1962).
Manufacturing Co., Ltd., Tokyo Gas Electric Industrial Co., Ltd. and began manufacturing air brake equipment for railroad vehicles.
September, 1945 Name changed to Teijin Seiki Co., Ltd.
March 1933
Started manufacturing of automotive oil brake equipment.
November, 1945 Started manufacturing textile machinery.
June 1937
Started manufacturing automotive air brake systems.
February, 1949
Head office moved from Iwakuni to Osaka.
December,
Name changed to Nippon Brake Systems Co., Ltd.
August, 1949
Listed on the Osaka Securities Exchange
June, 1946
March, 1955
Started manufacturing functional parts for aircraft.
March, 1959
Started manufacturing of machine tools and industrial
1943 Name changed to Nippon Air Brake Co., Ltd.
February, 1949 Started manufacturing hydraulic equipment. May, 1949
Listed on the Osaka Securities Exchange
machinery. September, 1961 Started manufacturing Hydraulic equipment.
December 1953 Started manufacturing of door systems for railroad vehicles.
September, 1962 Listed on the 1st section of the Tokyo Stock Exchange.
July, 1956
Started manufacturing of automatic door systems for
October, 1999
Head office moved from Osaka to Tokyo.
June 1963
Started manufacturing of marine control equipment.
March, 2000
Teijin Seiki Textile Machinery Co., Ltd. (dissolved in March February, 1985 Listed on the 1st section of the Tokyo Stock Exchange.
buildings.
- is established. The textile machinery business was transferred to the company. April, 2002
Established TMT Machinery Inc. as a joint venture with
April, 1992
Name changed to NABCO, Ltd.
Toray Engineering Co., Ltd. and Murata Machinery Co., Ltd. In April 2003, the synthetic fiber machinery business was transferred to the company. October, 2003
Name changed to TS Corporation.
October, 1999 Transferred the passenger car oil brake business to Bosch Brake System Co., Ltd. (now Bosch Corporation).
October, 2004
Eliminated due to the merger with Nabtesco Corporation.
October, 2004 Eliminated due to the merger with Nabtesco Corporation.
―5―
(Translation) This document has been translated from the Japanese original for the convenience of overseas stakeholders. In the event of any discrepancy between this document and the Japanese original, the original shall prevail.
3 【Description of business】 The group consists of the Company, 66 subsidiaries, and 12 affiliated companies. Main businesses of the Group are divided into Component Solutions Business, Transport Solutions Business, and Accessibility Solutions Business. Its business operations and their positioning and relation to segments are as follows. The categories shown below are the same as those of segments. (1) Business Activities Segment name Component solutions business
Business Activities
Design, manufacture, sale, maintenance and repair of industrial robot parts
Design, manufacture, sale, maintenance and repair of brake systems, door systems, Transport
couplers and safety systems for railway cars, parts for aircraft, brake systems, drive
solutions business
control systems and safety systems for automobiles, control systems and fire extinguishing systems for marine vessels, etc., and parts thereof.
Accessibility solutions business
Design, manufacture, sale, installation, maintenance, and repair of buildings and general industrial automatic doors, smoke emission equipment, platform safety equipment, welfare and nursing care equipment, and other components. Design, manufacture, sale, maintenance and repair of packaging machinery,
Others
machine tools, forging machinery, textile machinery, three-dimensional model creation equipment and other general industrial machinery and other components.
―6―
(Translation) This document has been translated from the Japanese original for the convenience of overseas stakeholders. In the event of any discrepancy between this document and the Japanese original, the original shall prevail. (2) Relationship between the segments of the Company, its subsidiaries and affiliates Business Segment
Component Solutions Business
Domestic
Nabtesco (China) Precision Equipment Co., Ltd.
Nabtesco Corporation T.S. Mechatech Co., Ltd. Comtesco Corporation
※1 ※1 ※1 ※1 ※2
Transport Solutions Business
Nabtesco Corporation NABCO DOOR Ltd. NABCO SYSTEM CO., LTD. Niigata Nabco Pty. Ltd. Nabco Metal Co., Ltd. Nabco Toto Co., Ltd. NABCO-R CO., LTD.
CMET, Inc. TMT machinery Inc. and three other companies
Nabtesco Corporation Nabtesco Link Corporation Company-wide
Subsidiaries and affiliates Total of 78
NABCO Auto Door (Beijing) Co., Ltd.
※1
Shanghai Nabtesco Business Management Co., Ltd. ※1 Nabtesco India Private Ltd. Nabtesco USA Inc. Nabtesco Europe GmbH Nabtesco Technology Ventures AG Nabtesco Technology Ventures (Cayman) Ltd. Nabtesco Technology Ventures L.P.
※1 ※1 ※1 ※1 ※1 ※1 ※1
NABCO Entrances, Inc. ※1 NABCO Canada Inc. ※1 Royal Doors Ltd. ※1 Gilgen Door Systems AG ※1 Gilgen Nabtesco (Hong Kong) Limited ※1 Gilgen Door Systems Germany GmbH ※1 Gilgen Door Systems Austria GmbH ※1 Gilgen Door Systems Italy srl ※1 Wupper Glas und Tür Technik GmbH ※1 Gilgen Door Systems Australia Pty Ltd. ※1 Copas Systèmes SAS ※1 Access Entry Pty Ltd. ※1 GDS Vostok AG ※2 ※1 ※1 PACRAFT (Dalian) Packaging Technology Co., Ltd. ※1 ※1 PACRAFT America Corporation PACRAFT Europe GmbH ※1 ※2 Engilico Engineering Solutions NV ※1 Engilico BV ※1 Engilico USA, LLC ※1 Engilico Trading, LLC ※1 SHANGHAI TMT MACHINERY, INC. and three other ※2 companies ※1 ※1 ※1 ※1 ※1 ※1
PACRAFT Co., Ltd.
Others
※1 ※1 ※1 ※1 ※2 ※1,3 ※1,3 ※1,3 ※1 Jiangsu Nabtesco KTK Railroad Products Co., Ltd. Chengdu Nabtesco KTK Railroad Products Co., Ltd. ※1 Nabtesco Oclap S.r.l. ※1 ※1 Nabtesco Marine Machinery (Shanghai) Co., Ltd. Nabtesco Marine Europe B.V. ※1 Nabtesco Marine Asia Pacific Pte. Ltd. ※1 Nabtesco Marinetec Co., Ltd. ※1 Deep Sea Technologies SMPC ※1 R.K. DEEP SEA TECHNOLOGIES LIMITED ※1 Nabtesco Aerospace, Inc. ※1 Nabtesco Aerospace Europe GmbH ※1 ※1 Nabtesco Automotive System (Shanghai) Co., Ltd. Nabtesco Automotive Products (Thailand) Co., Ltd. ※1 Taiwan Nabtesco Service Co., Ltd. ※1 Nabtesco Service Southeast Asia Co., Ltd. ※1 NS Autotech Co., Ltd. ※2 OVALO GmbH ※1 adcos GmbH ※1
※1 Changzhou Nabtesco Precision Machinery Co., Ltd. ※1,3 Nabtesco Precision Europe GmbH Nabtesco Motion Control, Inc. Shanghai Nabtesco Motion-Equipment Co., Ltd. Shanghai Nabtesco Hydraulic Co., Ltd. Nabtesco Power Control (Thailand) Co., Ltd. Nabtesco Power Control Europe GmbH
Nabtesco Corporation Nabtesco Marine Shikoku Co., Ltd. Nabtesco Automotive Corporation Nabtesco Service Co., Ltd. NABTEC Co., Ltd. Kyokko Denki Co., Ltd.
Accessibility Solutions Business
As of December 31, 2025 Overseas
20 domestic companies
58 overseas companies
―7―
(Translation) This document has been translated from the Japanese original for the convenience of overseas stakeholders. In the event of any discrepancy between this document and the Japanese original, the original shall prevail.
※1 Consolidated subsidiaries ※2 Affiliated companies accounted for by the equity method ※3 Classified as a discontinued operation (NOTE) Changes in Consolidated Subsidiaries and Affiliated companies (Consolidated Subsidiaries) Increase 3 companies Access Entry Pty Ltd. was excluded from equity-method affiliates and became a consolidated subsidiary of the Company as a result of Gilgen Door Systems AG, a group company of the Company, acquiring additional shares in Access Entry Pty Ltd., increasing its ownership interest from 33% to 80%. NABCO-R CO., LTD. (formerly RINTATSU Co.,Ltd.) became a consolidated subsidiary of the Company as NABCO SYSTEM CO., LTD., a group company of the Company, acquired 100% of its shares. Comtesco Co., Ltd., a wholly owned group company of the Company, was newly established. Decrease 1 company Shanghai Nabtesco Hydraulic Equipment Trading Co., Ltd. transferred its assets to Shanghai Nabtesco Hydraulic Co., Ltd. and was subsequently liquidated.
(Affiliated companies) Decrease 1 company As a result of Gilgen Door Systems AG acquiring additional shares in Access Entry Pty Ltd., increasing its ownership interest from 33% to 80%, Access Entry Pty Ltd. was excluded from equity-method affiliates and became a consolidated subsidiary of the Company.
―8―
(Translation) This document has been translated from the Japanese original for the convenience of overseas stakeholders. In the event of any discrepancy between this document and the Japanese original, the original shall prevail.
(3) Organization chart of the business (Subsidiaries)
(Affiliates)
(Precision reduction gears) Nabtesco (China) Precision Equipment Co., Ltd.
Shanghai Nabtesco Motion-Equipment Co., Ltd.
Changzhou Nabtesco Precision Machinery Co., Ltd. Nabtesco Precision Europe GmbH Component Solutions Business
Nabtesco Motion Control, Inc. (Hydraulic equipment)Note Comtesco Corporation Shanghai Nabtesco Hydraulic Co., Ltd. Nabtesco Power Control (Thailand) Co., Ltd. Nabtesco Power Control Europe GmbH
(the Others) T.S. Mechatech Co., Ltd. (Railroad Vehicle Equipment) Jiangsu Nabtesco KTK Railroad Products Co., Ltd., others
Nabtesco Oclap S.r.l. (Marine vessel equipment) Nabtesco Marine Shikoku Co., Ltd.
Kyokko Denki Co., Ltd.
Nabtesco Marine Machinery (Shanghai) Co., Ltd. Nabtesco Marine Europe B.V. Nabtesco Marine Asia Pacific Pte. Ltd. Nabtesco Marintec Co., Ltd.
(Aircraft equipment) Nabtesco Aerospace, Inc.
Customers
Nabtesco Corporation
Transport Solutions Business
R.K. DEEP SEA TECHNOLOGIES LIMITED. and others
Nabtesco Aerospace Europe GmbH (Commercial vechicle equipment) Nabtesco Automotive Corporation Nabtesco Automotive System (Shanghai) Co., Ltd. Nabtesco Automotive Products(Thailand) Co., Ltd.
(Others) Nabtesco Service Co., Ltd.
NS Autotech Co., Ltd.
NABTEC Co., Ltd. Taiwan Nabtesco Service Co., Ltd. OVALO GmbH and others (Automatic Door business) Accessibility Solutions Business
NABCO DOOR Ltd.
GDS Vostok AG
NABCO SYSTEM CO., LTD. and others NABCO Auto Door (Beijing) Co., Ltd. NABCO Entrances, Inc. and others Gilgen Door Systems AG and others
(Packaging Machines ) PACRAFT Co., Ltd.
TMT machinery Inc.
PACRAFT (Dalian) Packaging Technology Co., Ltd. PACRAFT America Corporation Others
PACRAFT Europe GmbH Engilico Engineering Solutions NV and others
(Others)
CMET, Inc.
Note : Classified as a discontinued operation
―9―
(Translation) This document has been translated from the Japanese original for the convenience of overseas stakeholders. In the event of any discrepancy between this document and the Japanese original, the original shall prevail.
4 【Status of Affiliated Companies】
Name
As of December 31, 2025
Address
Common stock (Million yen)
Main business (Note 1)
Percentage of voting rights held [owned] (%)(Note 2)
(Consolidated Subsidiaries) NABCO DOOR Ltd.
Kita-ku,Osaka city Osaka prefecture
848
Accessibility
100.0
Nabtesco Automotive Corporation
Chiyoda-ku, Tokyo
450
Transport
100.0
Nabtesco Service Co., Ltd.
Shinagawa, Tokyo, Japan
300
Transport
100.0
NABCO SYSTEM CO., LTD.
Chiyoda-ku, Tokyo
300
Accessibility
85.9
PACRAFT Co., Ltd.
Minato-ku, Tokyo
245
Others
100.0
Comtesco Corporation (Note 5)
Tarui-cho, Prefecture
0
Component
100.0
Nabtesco (China) Precision Equipment Co., Ltd. (Note 3)
China Jiangsu province
Component
Jiangsu Nabtesco KTK Railroad Products Co., Ltd. (Notes 3 and 4)
Thousand of USD 50,000
China Jiangsu province
1,800
Shanghai Nabtesco Hydraulic Co., Ltd. (Note 3, 5)
China Shanghai City
Nabtesco Aerospace, Inc.
United States Washington state
NABCO Entrances, Inc.
United States Wisconsin State
Gilgen Door Systems AG (Note 6)
Switzerland Bern
Nabtesco Precision Europe GmbH Nabtesco Power Control (Thailand)Co., Ltd. (Note 3, 5) Other 52 companies
gifu
Thousand of USD 14,500 Thousand of USD 1,000 Thousand of USD 0.3 Thousand of CHF 2,001
Transport Component Transport Accessibility
Related content
Sales, installation and maintenance of our products. Interlocking officers, etc. No Lending and Borrowing of Funds, etc. Interlocking officers, etc. Yes Sales, installation and maintenance of the Company’s products Interlocking officers, etc. No Sales, installation and maintenance of the Company’s products. Interlocking officers, etc. Yes Lending and borrowing of funds Interlocking officers, etc. Yes Interlocking officers, etc. Yes
Mutual supply of products and parts with the Company, etc. Interlocking officers, etc. No Mutual supply of products and 50.0 parts with the Company Interlocking officers, etc. No Mutual supply of products and 55.0 parts with the Company Interlocking officers, etc. Yes Mutual supply of products and 100.0 parts with the Company (100.0) Interlocking officers, etc. No Mutual supply of products and 100.0 parts with the Company (100.0) Interlocking officers, etc. No 67.0
Accessibility
100.0
Thousands of EUR 51
Component
100.0 Sales of our products (100.0) Interlocking officers, etc. No
Thailand Thousands of THB Chonburi Prefecture 700,000
Component
70.0
Mutual supply of products and parts with the Company Interlocking officers, etc. Yes
-
-
-
33.0
Interlocking officers, etc. Yes
Germany Dusseldorf
-
-
Kita-ku,Osaka city Osaka prefecture
450
Interlocking officers, etc. No
(Equity-method affiliates) TMT machinery Co., Ltd. 11 other companies
Others
- - - - - (NOTE) 1 The name of the segment is shown in the main business section. 2 Percentage of voting rights held [owned] column (in parentheses) is indirect ownership. 3 A specified subsidiary. 4 Although the Company holds 50% of the voting rights, it is considered to have substantial control, and therefore it is considered a consolidated subsidiary. 5 Classified as a discontinued operation 6 Gilgen Door System AG exceed 10% of total revenue. (Main items of profit and loss and balance sheet) (1) Sales 34,626 million yen (2) Income before tax 738 million yen (3) Net income 531 million yen (4) Net asset 12,394 million yen (5) Total asset 40,409 million yen
―10―
(Translation) This document has been translated from the Japanese original for the convenience of overseas stakeholders. In the event of any discrepancy between this document and the Japanese original, the original shall prevail.
5 【Employee Status】 (1) Consolidated basis As of December 31, 2025 Business Segment
Number of employees
Component Solutions Business
1,781
Transport Solutions Business
2,216
Accessibility Solutions Business
3,637
Others
442
Company-wide (common)
396 Total
8,472
(NOTE) 1 The number of employees is the number of employees employed, including those seconded from outside our group to our group, except for those seconded from our group to outside our group. 2 The number of temporary employees is omitted because it is less than 10 out of 100 of the number of employees. (2) Status of the submitting company Number of employees
Average age(years)
Average length of service (year)
2,186 ( 299 )
42.6
16.9
Business Segment
As of December 31, 2025 Average annual salary (thousands of yen) 7,153
Number of employees 628 ( 236 ) 962 ( 50 ) 258 ( 12 ) 13 ( 1) 325 ( - ) 2,186 ( 299 )
Component Solutions Business Transport Solutions Business Accessibility Solutions Business Others Company-wide (common) Total
(NOTE) 1 The number of employees is the number of employees employed, including those seconded from other companies to us, except for those seconded from us to other companies. 2 Average annual salary includes bonuses and non-standard wages. 3 Figures in (superscription) in the number of employee’s column are the average number of temporary employees per year. 4 The primary factor behind the change in the number of employees was a decrease in personnel resulting from the absorption-type company split of the hydraulic equipment business to Comtesco Corporation, resulting in a decrease of 299 employees compared with the end of the previous fiscal year.
(3) Union Information The labor unions of the submitting companies belong to JAM as a top organization, and as of December 31, 2025, there were 1,707 union members. Labor-management relations are in a smooth relationship, and there are no noteworthy matters. In addition, labor unions are formed in some consolidated subsidiaries, and there are no noteworthy matters regarding labormanagement relations as they are in a smooth relationship.
―11―
(Translation) This document has been translated from the Japanese original for the convenience of overseas stakeholders. In the event of any discrepancy between this document and the Japanese original, the original shall prevail.
(4) Percentage of female workers in managerial positions, percentage of male workers taking childcare leave, and differences in wages between male and female workers ①
Status of the submitting company Current fiscal year
Percentage of female workers in managerial positions (%)(NOTE1)
Percentage of male workers taking childcare leave (%)(NOTE2)
3.8
91.9
Differences in wages between male and female workers (%)(NOTE1 and 3) All workers
Regular workers
80.1
Part-timers and fixed-term workers
80.8
80.3
(NOTE) 1 Calculated in accordance with the provisions of the “The Act on Promotion of Women’s Participation and
Advancement in the Workplace” (Law No. 64 of 2015). Percentage of female workers in managerial positions is as of December 31, 2025 2 In accordance with the provisions of the “Act on the Welfare of Workers Who Take Care of Children or Other Family Members Including Child Care and Family Care Leave”(Law No. 76 of 1991), calculated by Article 71-6, Item 1 of the "Ordinance for Enforcement of the Act on the Welfare of Workers Who Take Care of Children or Other Family Members Including Child Care and Family Care Leave" (Labor Ordinance No. 25 of 1991). The rate of male employees taking childcare leave may exceed 100% due to the effects of taking childcare leave, etc. on children born in the previous year. 3 There is no difference in treatment according to gender in the wage system. Figures for overseas employees are calculated based on the theoretical wages of non-regular employees who worked in Japan and those who worked part-time on a full-time basis. Reduced working hours due to childcare or nursing care are not compensated.
<Supplementary Explanation for each figure> ・Details of the Company’s human capital KPIs are disclosed in “Part II: Business Overview, 2. Approach to and Initiatives on Sustainability, (3) Promotion of Human Capital Management.” Detailed data on employment-related indicators and diversity initiatives are available in the “Social Data” section of the ESG Data Book on the Company’s sustainability website. ・In order to realize the “Leaders in Innovation” vision set forth in its long-term vision, the Company recognizes the enhancement of its human capital portfolio and the incorporation of diverse perspectives into corporate management as one of its key initiatives. During the period of the three-year Medium-Term Management Plan starting in 2025, the Company has set a target to increase the ratio of women in management positions from 3.0% to 4.1%. To promote the internal development and advancement of female managers, the Company identifies prospective management candidates within each department and provides tailored development support, including the formulation of development plans and assistance in addressing individual challenges based on each candidate’s career aspirations and needs. In addition, the Company conducts training programs for mid-career female employees who are candidates for management positions and their supervisors, as well as diversity training aimed at eliminating unconscious bias related to gender. Through these initiatives, the Company seeks to strengthen its talent pipeline to achieve a continuous increase in the ratio of women in management positions. ・The gender pay gap at the Company primarily results from the higher proportion of men in senior management positions and higher job grades with respect to base compensation. In other words, the gap does not arise from differences in treatment for equivalent roles, but rather from differences in the composition of job grades. Accordingly, the Company recognizes the development and promotion of female managers and management candidates as an important management issue. Through the transition to a role-based personnel system, the Company has reduced seniority-based elements and shifted to a compensation structure that more clearly reflects roles and responsibilities. As a result, the gender pay gap temporarily widened in the first year following the introduction of the new system. By job grade, the pay gap is attributable to higher average age and length of service among women in lower job grades, and a higher proportion of men and higher salary levels in upper job grades. In addition, gender differences are observed in variable compensation such as overtime pay, suggesting the possibility that challenging assignments may be disproportionately allocated to men and that unconscious bias may exist in job placement and assignment decisions. In light of these factors, the Company is committed to correcting the gender pay gap by ensuring a stronger linkage between roles and compensation, promoting fair access to opportunities through diversity education and enhanced evaluation capabilities, and systematically developing and promoting female managers and management candidates. ・The Company believes that an increase in male employees who actively participate in childcare contributes to the promotion of diversity and the creation of innovation. Accordingly, the Company has set a target of “one month” for the duration of childcare leave (including special leave) and has established an environment that encourages male employees to take childcare leave proactively. In addition, the Company offers a variety of work style options tailored to individual circumstances and needs, enabling employees to remain active regardless of their life stage. By promoting men’s participation in childcare, the Company aims to create a diverse and inclusive workplace environment.
―12―
(Translation) This document has been translated from the Japanese original for the convenience of overseas stakeholders. In the event of any discrepancy between this document and the Japanese original, the original shall prevail.
② Consolidated Subsidiaries Current fiscal year
Name
Differences in wages between male and female workers (%)(NOTE1 and 3) Percentage of female Percentage of male workers in managerial workers taking childcare Part-timers and Regular leave (%)(NOTE2) positions (%)(NOTE1) All workers fixed-term workers workers
NABTEC Co., Ltd.
-
66.7
82.9
83.6
67.6
Nabtesco Service Co., Ltd.
8.0
66.7
81.1
88.4
65.0
Nabtesco Automotive Corporation
4.2
100.0
63.8
70.9
66.9
PACRAFT Co., Ltd.
8.6
85.7
80.2
81.0
45.7
T.S. Mechatech Co., Ltd.
-
50.0
72.4
73.7
80.2
NABCO DOOR Ltd.
1.9
58.3
69.2
68.1
80.5
NABCO SYSTEM CO., LTD.
1.8
62.5
69.1
68.9
73.2
Comtesco Corporation Note4
-
-
-
-
-
(NOTE) 1 Calculated in accordance with the provisions of the “The Act on Promotion of Women’s Participation and
Advancement in the Workplace” (Law No. 64 of 2015). Percentage of female workers in managerial positions is as of December 31, 2025
2
In accordance with the provisions of the “Act on the Welfare of Workers Who Take Care of Children or Other Family Members Including Child Care and Family Care Leave”(Law No. 76 of 1991), calculated by Article 71-6, Item 1 of the "Ordinance for Enforcement of the Act on the Welfare of Workers Who Take Care of Children or Other Family Members Including Child Care and Family Care Leave" (Labor Ordinance No. 25 of 1991). The rate of male employees taking childcare leave may exceed 100% due to the effects of taking childcare leave, etc. on children born in the previous year. 3 There is no difference in treatment according to gender in the wage system. Figures for overseas employees are calculated based on the theoretical wages of non-regular employees who worked in Japan and those who worked part-time on a full-time basis. Reduced working hours due to childcare or nursing care are not compensated. 4 As the Company transferred its hydraulic equipment business through a company split effective December 31, 2025, the indicators “percentage of male employees taking childcare leave” and “gender pay gap” are disclosed on a basis that includes the reporting company, as indicated in item ①.
―13―
(Translation) This document has been translated from the Japanese original for the convenience of overseas stakeholders. In the event of any discrepancy between this document and the Japanese original, the original shall prevail.
No.2 【Business Conditions】 1 [Management Policies, Management Environment and Issues to be Addressed] Our Corporate Philosophy is stated “The Nabtesco Group, with our unique motion control technology, will provide safety, comfort and a sense of security in daily lives as well as any form of transportation” The Nabtesco Way is the statement of the stance and mindset that achieves this Corporate Philosophy, as The Principles We Value. Under this philosophy and the principles, we are promoting a long-term value creation story, consisting of the Long-term Vision that illustrates our aim for 2030, Management Materiality that presents the important challenges we need to work on to achieve our Long-term Goals, and the Medium-term Management Plan, which describes measures to achieve our Long-term Targets. Through these measures, we aim to bring innovation while improving economic value, environmental value and social value in the long-term, in pursuit of management that sustainably develops both society and our group.
<Nabtesco’s Value Creation Story>
―14―
(Translation) This document has been translated from the Japanese original for the convenience of overseas stakeholders. In the event of any discrepancy between this document and the Japanese original, the original shall prevail.
(1) The Nabtesco Way In 2012, the Nabtesco Group formulated “The Nabtesco Way,” which describes our Corporate Philosophy and Action Guidelines, and we have been working to put our Corporate Philosophy into practice while conducting activities to spread it throughout the Group. In 2023, we revised “The Nabtesco Way” with the intention of ensuring that diverse human resources around the world understand and empathize with them and act even more enthusiastically, in light of the recent changes in the external and internal environments. In new “The Nabtesco Way,” our Corporate Philosophy has been retained, while Our Promises and Action Guidelines have been revised to reorganize the principles to be passed on to the next generation, and to incorporate a new perspective that takes on challenges, and has been consolidated to the six points of “The Principles We Value.” The Company aims to deliver greater than expected satisfaction to society by grasping the needs and issues of customers and society from “See the people. See the planet.” perspective, using the spirit of “Be open, fair, and honest.”, and “Enjoying the challenge” of valuing “Stay curious. Explore further.” while “Create together.” with diversity, and promoting autonomous “Improve ourselves. Advance society”
(2) Long-term Vision The Group has established a long-term vision, “Leaders in Innovation for the Future,” as a guideline for realizing the Group's growth and development toward 2030, and "Our Aim for 2030."
―15―
(Translation) This document has been translated from the Japanese original for the convenience of overseas stakeholders. In the event of any discrepancy between this document and the Japanese original, the original shall prevail.
In order to achieve our long-term vision, we have set the concept of our long-term vision up to 2030 as shown in the diagram below. Based on the “Identity of Nabtesco” accumulated so far, we aim to create new value in the market and become “leaders in innovation” one step ahead of our customers by promoting business while focusing on “technology,” “globalization,” and “contributions.”
(3) Management Materiality Our group positions its “management materiality” as particularly important management issues in achieving its long-term goals, and aims to realize sustainable growth for both society and the Group by proactively addressing these issues. To this end, the Group has structured its management materiality around three pillars: “Measures to improve our financial performance,” “Measures to enhance our management foundation,” and “Specific measures to achieve long-term targets.” Through initiatives addressing both financial and non-financial aspects, the Group seeks, from a long-term perspective, to achieve a balance between economic value and environmental and social value. Going forward, the Group will further strengthen its management foundation and continue to create value for its stakeholders by promptly and appropriately reviewing its management materiality in response to changes in the business environment and societal expectations. Details of the Group’s management materiality are described in “2. Approach to and Initiatives on Sustainability, (1) Overall Approach to Sustainability.”
―16―
(Translation) This document has been translated from the Japanese original for the convenience of overseas stakeholders. In the event of any discrepancy between this document and the Japanese original, the original shall prevail.
(4) Medium-Term Management Plan The Nabtesco group, toward the realization of the long-term vision for fiscal 2030, which it announced in February 2021, has formulated its medium-term management plan (hereinafter “MTMP) for the three years from fiscal 2025. 【Basic policy of MTMP】 “Reviving Potential, Evolving Excellence.” Reviving Potential; Reviving our profitability by executing Project 10 Evolving Excellence; Evolving our technology from “motion control” to “smart motion control” to provide new value that meets the needs of society ① Management Targets The Nabtesco Group has set the targets for the medium-term management plan for FY2025 to FY2027 as follows. ROIC
: 10% or over
Return to shareholders:Approximately DOE 3.5% with stable dividend and share buyback in accordance of financial condition Environmental target:Reduce CO2 emissions by 50% in 2027 (Baseline year: fiscal 2015/aligned with the SBT 1.5-degree Celsius target)
Our result in FY2025 was as follows FY2025 (Result) ROIC
4.5%
DOE
3.5%
Reduction in CO₂ emissions (Scope1+2、Baseline year: fiscal 2015)
-43.6%
(NOTES) 1. At the Annual General Meeting of Shareholders scheduled to be held on March 26, 2026, the Company proposes an agenda item (resolution) entitled “Appropriation of Surplus.” If this proposal is approved, the DOE ratio is expected to be as stated above. 2. Figures for FY2025 out of the above CO2 emissions reductions are based on the totals as of the filing date.
② Medium- to Long-term Management Strategies Nabtesco is reviving profitability by executing Project 10 (Reviving Potential) and evolving our technology toward smart motion control (Evolving Excellence) to deliver the value of our products and services, ultimately achieving our long-term vision of becoming a “leaders in innovation for the future.”
- Regain earning power and profitability by executing Project 10 Enhance profits through business growth, cost reduction, and optimization of fixed costs.
- Smart Motion Control Our core competence in component technology is evolving from “motion control” to “smart motion control,” including electrification, integration and data solutions. This will create new value to address societal challenges in our business fields.
- Build a resilient corporate foundation Optimize our portfolio based on our vision (smart motion control) and profitability (ROIC) (NOTE) Forward-looking statements in this Annual Securities Report are based on information available to the Company as of the end of the fiscal year under review. Actual results may differ from these statements due to factors such as those listed in "3. Business and Other Risks."
―17―
(Translation) This document has been translated from the Japanese original for the convenience of overseas stakeholders. In the event of any discrepancy between this document and the Japanese original, the original shall prevail.
2 【Policies and Measures for Sustainability Management】 Within Nabtesco’s value creation story, the Group positions its “management materiality,” which forms its core, as particularly important management issues. Through initiatives addressing both financial and non-financial aspects, the Group aims to achieve a balance between economic value and environmental and social value, thereby pursuing sustainable growth for both society and the Group. The Group believes that accurately capturing changes in the business and management environment and promptly and appropriately reviewing its management materiality—referred to as “dynamic materiality”—is essential to promoting long-term value creation. By steadily executing actions based on its management materiality and further strengthening its management foundation, the Group will continue to strive to create value for its stakeholders. Forward-looking statements in this Annual Securities Report are based on information available to the Company as of the end of the fiscal year under review. Actual results may differ from these statements due to factors such as those listed in “3. Business and Other Risks.” (1) Response to overall sustainability ① Governance To strengthen sustainability governance, the Nabtesco Group dissolved its former CSR Committee in 2023 and established the “Management Materiality Committee,” which reports directly to the CEO. The Committee works in coordination with other committees reporting directly to the CEO, with an executive officer serving as Chair of the Management Materiality Committee providing oversight. The Committee is responsible for setting targets and KPIs for each management materiality item, as well as monitoring progress against those targets. The activities of the Committee are deliberated by the Management Materiality Committee and the Management Committee, and are subsequently reported to the Board of Directors, thereby enhancing the effectiveness of sustainability governance across the Group. <Structure to promote sustainability governance (As of January 1, 2026)>
―18―
(Translation) This document has been translated from the Japanese original for the convenience of overseas stakeholders. In the event of any discrepancy between this document and the Japanese original, the original shall prevail.
② Strategy ■Structure of Our Management Materiality Our management materiality is comprised of three pillars. By fostering financial and non-financial measures and striving to achieve economic value, environmental value and social value from long-term perspective, we will provide value to our stakeholders, maintaining profitable growth. For “Measures to improve our financial performance,” we will work to consistently achieve our short-term revenue targets, ensure the efficient distribution of our managerial resources, and increase our capital efficiency for the promotion of ROIC-oriented management. For “Measures to enhance our management foundation,” we have identified items that need reinforcement to more effectively contribute to society through our business activities. Consequently, we will implement intensive measures for activities related to ESG items, considering their connections to our profit and growth. Moreover, by implementing “Specific measures to achieve the long-term goals,” we will strengthen our business activities, including social contributions, and thereby promote our long-term growth. ■Management Materiality Identification Process and Regular Reviewing Our group identifies management materiality by extracting social issues addressed through our business strategy and ESG items closely related to our business, analyzing their significance from the perspectives of impact on our company and stakeholders. In terms of their validity, we engage in deliberations with external experts, conduct reviews within the Management Materiality Committee and the Management Committee, and finalize decisions at the Board of Directors’ meeting. For management materiality, changes are made once a year to respond swiftly and appropriately to shifts in the business and societal requirements. Regardless of whether changes are made, the final decision is made once a year at the Board of Directors’ meeting. (Identification process) STEP1:Recognition of issues ・Based on social challenges from those addressed through our Group’s business strategy and ESG items closely related to our business, the social challenges within the social and business environments surrounding our Group are extracted. STEP2:Analysis of significance ・Based on the concept of double materiality, the significance of issues or challenges is analyzed from the perspectives of “impact on the Company” and “impact on stakeholders,” with the results organized into priority issues. ・Alignment with Group-wide material risks determined based on risk assessment results is assessed.
STEP3:Identification of materiality ・Opinions are exchanged with external experts. ・Materiality is determined by the Board of Directors, following discussions at the Management Materiality Committee and the Management Committee, and an assessment of its validity.
―19―
(Translation) This document has been translated from the Japanese original for the convenience of overseas stakeholders. In the event of any discrepancy between this document and the Japanese original, the original shall prevail.
STEP4:Goal setting and monitoring ・Goals and action plans are set based on the priority level of the management materiality item. ・The progress of each action plan is regularly monitored, and efforts toward achieving the goals are managed and promoted. STEP5:Regular revision ・Changes are made once a year according to changes in the business and societal requirements, expectations from stakeholders, and changes in the business strategies of our Group. In 2025, we re-evaluated the validity and significance of our recognition of issues, responding to changes in the internal and external environment related to “improving profitability and clarifying innovation areas as required by the Mediumterm Management Plan.” and “double materiality, a key societal requirement.” As a result, we have decided to maintain the management materiality items established in FY2024. [Measures to improve our financial performance] Based on our aim to achieve both the optimization of portfolio balance and improvements in ROIC, we manage these measures under the following item: “Promote ROIC management” [Measures to enhance our management foundation] This has been organized from an ESG perspective into the following categories: E: “Countermeasures for climate change” S: “Promote human capital management” and “Pursue safety, comfort and a sense of security” G: “Enhance corporate governance” and “Build a resilient corporate foundation”
•
[Specific measures to achieve long-term targets] To indicate the directions and strategies of the medium-term management plan more clearly, this has been managed to the following: “Meet social challenges through smart motion control,” “Drive innovative manufacturing through digital transformation”, and “Enhance global management.” In addition, for each management materiality item, sub-materiality and KPIs will be established to strengthen the progress management of various initiatives, thereby enhancing effectiveness.
―20―
(Translation) This document has been translated from the Japanese original for the convenience of overseas stakeholders. In the event of any discrepancy between this document and the Japanese original, the original shall prevail.
③ Risk Management Details of the Group’s risk management, including sustainability-related risks, are described in “3. Business Risks.” ④ Indicators and Targets The targets, indicators, key activity results in FY2025 and plans for respective issues concerning “Enhancing our management foundation” with relation to the management materiality are shown below. <Targets, indicators, key activity results and plans concerning sustainability>
ES G Ca teg ory
Management Materiality items
Desirable Direction/Major Actions
Targets for FY2025 (Extracts)
Environment (E)
・Strengthen efforts ・Reduce CO2 aligned with medium- to longtoward term targets (42% reduction compared to decarbonization FY2015) ・Strengthen efforts ・Improve the accuracy of Scope 3 calculation Countermeasures for toward data Climate Change decarbonization that involve the supply chain
Results for FY2025 (Extracts)
・Reduced CO2 emissions aligned with mediumto long-term targets (43.6% reduction* compared to FY2015) ・Conducted supplier briefings (including individual explanations on data collection methods, etc.)
・Ensure labor safety ・Initiatives to achieve zero workplace accidents ・Implemented Group-wide labor safety training ・Implemented product safety screening and employee product safety training for newly developed items
and zero major incidents Pursue Safety, ・Ensure safety of Comfort and a Sense product and services ・Implement product safety screening and of Security employee training program Society (S)
・Organizational culture that fosters innovation ・Align business Enhance Human Capital Management strategy and human resources strategy
Enhance corporate governance
Governance (G)
Build a resilient corporate structure
・Implement internal communication initiatives ・Plan and implement measures for the mobilization of internal human resources ・Promotion of activities to ensure that the personnel system is well-established ・Plan and implement initiatives for human resources data visualization and utilization
・Held town hall meetings with the CEO to facilitate dialogue with management ・Implemented measures to revitalize the Job Challenge Program ・Implemented measures to promote understanding and ensure proper implementation of the personnel system
・Ensure transparency of management ・Promote compliance
・Implemented measures to revitalize the Job ・Continue the effectiveness evaluation of the Board of Directors based on an analysis of self- Challenge Program ・Implemented measures to promote assessments from each executive understanding and ensure proper ・Conduct training and enhance collaboration with relevant locations to strengthen compliance implementation of the personnel system
・Ensure business continuity ・Build a resilient supply chain
・Promote information security measures to strengthen cybersecurity ・Integrate Group development meetings with Group-wide intellectual property strategy discussions to promote intellectual property management with the aim of improving core competence (intellectual capital) ・Support suppliers in obtaining resilience certification
・Corrected security vulnerabilities by verifying compliance with security guidelines across all locations ・Conducted Group-wide security training ・Integrated Group development meetings with Group-wide intellectual property strategy discussions to restructure into a unified strategic execution framework ・Achieved suppliers' resilience certification (10 suppliers as planned)
Note Figures for FY2025 out of the above CO2 emissions reductions are based on the totals as of the filing date.
―21―
(Translation) This document has been translated from the Japanese original for the convenience of overseas stakeholders. In the event of any discrepancy between this document and the Japanese original, the original shall prevail.
The activity targets related to our management materiality for FY2026 have been established as follows, after verification of their alignment with our Group-wide material risks. ES G Cat ego ry
Management Materiality items
Environm ent (E)
Countermeasures for Climate Change
Desirable Direction/Major Actions
Targets for FY2026 (Extracts)
・Strengthen efforts toward decarbonization ・Strengthen efforts toward decarbonization that involve the supply chain
Society (S)
・Ensure labor safety Pursue Safety, Comfort ・Ensure safety of product and services and a Sense of Security ・Organizational culture that fosters innovation Enhance Human Capital Management
Enhance corporate governance
・Align business strategy and human resources strategy
・Reduce CO2 emissions aligned with medium- to long-term targets (46% reduction compared to FY2015) ・Promote the development of environmentally conscious products ・Improve the accuracy of Scope 3 emissions calculation data ・Initiatives to achieve zero workplace accidents and zero major incidents ・Implement product safety screening and employee training programs aimed at enhancing product safety ・Implement internal communication initiatives ・Implement engagement enhancement initiatives through dialogue, evaluation, and recognition ・Promote role-based organizational and talent management to execute business strategy
Governance (G)
・Promote compliance
・Continue the effectiveness evaluation of the Board of Directors based on an analysis of self-assessments from each executive ・Conduct training and enhance collaboration with relevant locations to strengthen compliance
・Ensure business continuity
・Promote information security measures to strengthen cybersecurity
・Build a resilient supply chain
・Enhance support and monitoring to raise awareness of business continuity management ・Discuss Group technology development strategies and intellectual property strategies to promote smart motion control at Group development meetings ・Support suppliers in obtaining resilience certification
・Ensure transparency of management
Build a resilient corporate structure
(2) Disclosure in line with the recommendations made by the Task Force on Climate-related Financial Disclosures (TCFD) The Group expressed its support for the recommendations made by the Task Force on Climate-related Financial Disclosures (TCFD). Accordingly, we are fostering the disclosure of related information in line with the TCFD’s recommendations, including that about the progress made with our climate change-related measures. ① Governance Nabtesco Corporation's Board of Directors determines and supervises our strategies, basic policies, and the execution of important operations by sharing information through reports on important issues. Regarding climate change, the executive officer in charge of production innovation serves as supervisor and the executive officer in charge of environmental security reports on the progress toward the CO2 emission reduction goal and the status of major environmental facility investments. Under the guidance and supervision by the Board of Directors, the President and CEO (hereinafter, "CEO") establishes Nabtesco Group’s environmental philosophy, environmental action guidelines, and long-term goals. At the Executive Officers Committee (composed of the CEO and executive officers), the director in charge of environmental security reports the status of CO2 emissions at internal companies and main group companies. If there is a gap between the current status and the goal, we identify the causes and take measures accordingly. If any item under discussion or report is deemed to affect our business, the CEO determines appropriate measures and reflects them in our business strategies. As a promoting organization under the direct control of the CEO that is involved in Environment, Safety, and Health (ESH) management, Nabtesco has established the ESH Committee with jurisdiction over the entire Nabtesco Group. The CEO appoints the chairperson and members of the ESH Committee from our officers, including members of the Board of Directors. The chairperson of the ESH Committee collects important information on the environment, safety, and health, including climate change-related risks and opportunities, from our companies and group companies. The chairperson also visits each site to carry out ESH audits and company-wide energy conservation meetings, etc. The ESH Committee uses the results of this monitoring to evaluate importance and deliberate measures for any issues deemed to be important Meeting
Climate change-related agenda
Major action (Environment): Reduction of environmental impact (CO2 emissions, twice a year) Board of Directors Reduction of environmental impact: CO2 emissions per unit of sales; energy conservation and meeting creation; development of environment-friendly products (four times a year) Introduction of major environmental equipment (as necessary) Meeting of Reduction of environmental impact executive officers CO2 emissions per unit of sales, energy conservation and energy creation (12 times a year) ESH Committee Reduction of environmental impact meeting CO2 emissions per unit of sales, energy conservation and energy creation (At least twice a year)
―22―
(Translation) This document has been translated from the Japanese original for the convenience of overseas stakeholders. In the event of any discrepancy between this document and the Japanese original, the original shall prevail.
② Strategies In order to identify and manage the possible impact of climate change on our business activities, we are analyzing the risks and opportunities across the entire supply chain, including our business partners and customers, using multiple scenarios developed by external parties about temperature rises, including the “below 2 degrees Celsius” scenario. When the result of the audits by the ESH Committee shows that any issues (risks or opportunities) associated with climate change have an important effect on our business, they are reflected to our business strategies by the determination of the CEO. The Nabtesco Group identifies “Countermeasures for climate change” as one of the management materiality issues which is the important challenges for the achievement of our long-term vision. The Management Materiality Committee collaborates with the ESH committee and other relevant committees to regularly evaluate these issues. Activities are discussed and determined by the Management Committee and reported to the Board of Directors. In the future, the following risks are anticipated depending on requests from the market or customers: increase of carbon prices, increase of operating costs due to the purchase of electricity from renewable sources, increase of capital expenditures for the introduction of power generation equipment, etc. using renewable resources and the increase of R&D costs for energysaving product development. There are also physical risks such as business interruption due to damaged infrastructure or unstable electric power supply caused by wind or water disaster. On the other hand, the following opportunities are also expected: new business opportunities from the establishment of new laws and regulations (e.g. the energy-efficiency labeling system becoming obligatory) and the expansion of opportunities for the Maintenance, Repair, Overhaul (MRO) business, etc. due to a change in consumers' preferences for longer product lives to reduce CO2 emissions as their awareness of climate change increases. Going forward, Nabtesco Corporation will continue to strive to identify risks and opportunities associated with the environment and make efforts to take measures to address the risks and realize the opportunities, including the further promotion of energy conservation activities. ③ Risk Management The ESH Committee collects important information related to risks and opportunities associated with climate change from the companies and group companies and evaluates whether or not they have a significant impact on our business activities and discusses measures for issues that are determined to be important. They evaluate and prioritize possible amount of financial impact and probability or feasibility. The ESH Committee draws up and discusses the measures to address highly probable risks on a preferential basis, regardless of their impact. In addition to climate change, the ESH Committee evaluates waste, chemical substances, and employees' safety and health.
―23―
(Translation) This document has been translated from the Japanese original for the convenience of overseas stakeholders. In the event of any discrepancy between this document and the Japanese original, the original shall prevail.
<Measures taken in line with the TCFD’s recommendations: Results of risk assessment (Scenario we referred to: IEA450IEA NZE 2050/RCP2.6/RCP8.5)> ■Transition risk ▲:Risks ●:Opportunities Typ e
Climate
Impact
Business risk/Opportunity
change related assessm risk item Higher carbon tax rate
ent
Measures taken by Nabtesco (Medium-term)
(Short-term)
(Medium- to long-term)
Large
(Long-term)
▲Increase in energy & procurement costs
・Promote the use of renewable energy
●Differentiation by low-carbon products
• Introduce carbon pricing
●Better evaluation due to appropriate information
• Promote efficient replacement with substitute
disclosure
materials • Operate the energy-saving product
Regulatory
Regulation
▲Increase in energy
(energy
conservation cost
conservation
▲Increase in development cost to deal
▲Decrease in demand for old models
with regulations
Large ●Larger sales of
&
products with higher
low carbon)
fuel efficiency
due to new regulations
(Example: TRS segments and Others)
(Example: TRS segment)
●Increase in demand for products that
●Increase in demand for more
comply with the regulations
efficient new models
(Example: TRS segments and Others)
(Example: TRS segment)
certification system • Follow the guidelines on capital investment and energy conservation • Expand the lineup of products with higher fuel efficiency • Develop products for which new types of fuels can be used ・Invest in the development of technologies
Policies
▲Increase in cost to deal with
Large
and products
laws and regulations
• Strategically disclose climate change-related information
Technology
Replacement with lowcarbon
▲Increase in cost to acquire new element technology
Medium
▲Increase in cost due to the
●Entry into a new market by the development
diversification of needs
of new element technology
products
in development activities
Large
superior to those of competitors
(Example: CMP segment)
Large
Criticism against the industry
Medium
▲Negative reputation due to a delay in environmental measures ●Increase in sales of environmentally friendly products ●Better brand image due to the implementation of environmental measures
Market Market uncertainties
▲Increase in the operational cost due to RE100 measures ・Promote the use of renewable energy ●Better evaluation due to appropriate information disclosure
Reputation
■Physical risk e
development trends
●Higher competitiveness based on technologies
▲Increase in cost due to increased need to reduce CO2 emissions ●Increase in demand due to modal shift and electrification (Example: TRS segment)
Climate
companies in line with the regulatory and • Develop new mobility products
●Need for electrification
behavior
Typ
products and form partnerships with other
▲Lagging behind competitors
Changes in consumption
•Make technological investments, develop
・Promote the use of renewable energy • Strategically disclose climate change-related information
▲:Risks ●:Opportunities Impact
Business risk/Opportunity
change related assessm risk item
ent
Frequent occurrence of Acute
drought events
(Medium-term)
(Medium- to long-term)
▲Damage to infrastructure, suspension of operations
・Foster BCP
wind turbines)
system
▲Damage to infrastructure, suspension of operations Large ●Increase in need to establish water resource infrastructure (Example: CMP segment) ●Increase in demand for construction machinery for reconstruction activities (Example: CMP segment)
• Optimize the on-site assignment of employees • Use weather forecast services and take
emergency measures ▲Suspension of operations due to floods ●Increase in the need to ・Examine measures against storms and floods establish water resource with suppliers infrastructure (Example: • Increase resilience of the electricity system CMP segment) ▲Increase in air-conditioning • Review the location of bases and capital investment costs • Reuse water and review the water circulation ▲Increase in electricity costs system due to lower power • Use weather forecast services and take generation efficiency emergency measures ●Increase in the need for higher efficiency at plants (Example: CMP segment)
Large
patterns Chronic
Rise in average
• Procure components from multiple suppliers • Increase the resilience of the electricity
Changes in precipitation
(Long-term)
Large ●Increase in need to increase the resilience of power infrastructure (Example: CMFS equipment for
typhoons Heavy rain/
Measures taken by Nabtesco (Short-term)
Large
temperatures
(NOTE) As for impact, we classified the size into “Large,” “Medium” and “Small” based on the frequency of occurrence and financial impact. Frequency of occurrence: Occurs frequently/Has occurred/May occur/May not occur/Will never occur Financial impact: Serious (¥5 billion or more)/Large (¥2.5 billion to ¥5 billion)/Medium (¥500 million to ¥2.5 billion)/Minor (¥100 million to ¥500 million)/Very minor (Less than ¥100 million)
―24―
(Translation) This document has been translated from the Japanese original for the convenience of overseas stakeholders. In the event of any discrepancy between this document and the Japanese original, the original shall prevail.
④ Indicators and Goals The Nabtesco Group are aiming to reduce CO2 global emissions from the entire Nabtesco Group by 63% as of FY2030 and by 100% as of FY2050 compared to FY2015 levels. This target has been approved by the SBT Initiative. By Fiscal Year 2025, we achieved a cumulative reduction of 43.6%, and the Group are steadily reducing emissions at a pace in line with our target. In addition, the group are expanding activities from the company alone to our suppliers as well. Of the greenhouse gas emissions from the entire supply chain, the percentage of emissions from purchased goods and services (category 1 of Scope 3 emissions) is high, making it essential for our suppliers to take initiatives to reduce their greenhouse gas emissions. In response, we conduct a survey of our main suppliers (the top suppliers constituting 70% of annual purchases) to see if they have set voluntary targets to reduce their greenhouse gas emissions. As of FY2024, 63% of our main suppliers have set voluntary targets to reduce their greenhouse gas emissions and begun to take initiatives to achieve these targets. Starting in FY2025, the Company has begun providing support to suppliers for the calculation of Scope 3 greenhouse gas emissions. To enable suppliers to address greenhouse gas reductions across the entire supply chain, including their own emissions, the Company continues to strengthen its support framework. <Long-term emissions reduction targets (aligned with the 1.5 degrees Celsius scenario/Scope1+2)> FY2015 (Baseline year)
FY2030 (Down 63%)
FY2050 (Down 100%)
54,803
20,277
0
Global emissions (t-CO₂) <CO2 Emission Reduction Result CO2 (t-CO₂) FY2021
FY2022
FY2023
FY2024
FY2025
Direct emissions (Scope 1)
4,061
3,893
4,929
4,173
4,038
Indirect emissions through the use of electricity and others (Scope 2)
41,021
43,140
38,495
34,763
26,861
(NOTES)1 Figures for FY2025 out of the above emissions are current totals as of the filling date, and figures obtained from thirdparty guarantees will be disclosed on our website. 2 The calculation scope includes Nabtesco Corporation, and major Japanese and overseas consolidated subsidiaries. 3 The calculation policy and standards comply with the Act on the Regional Use of Energy and the Act on the Promotion of Global Warming Countermeasures, and are aligned with the internal Guidelines on the Management of Environmental Information.
<Emissions from the supply chain (Scope 3) FY2024 Results (NOTE)1, 2> Category
Emissions (t-CO2)
Rate (%)
1
Purchased goods and services
745,904
69.71%
2
Capital goods
99,144
9.27%
6,118
0.57%
191,617
17.91%
954
0.09%
3 4
Fuel- and energy-related activities Upstream transportation and distribution
Remarks
5
Waste generated in operations
6
Business travel
6,380
0.60%
7
Employee commuting
1,703
0.16%
8
Upstream leased assets
-
-
9
Downstream transportation and distribution
-
-
10
Processing of sold products
-
-
11
Use of sold products
17,445
1.63%
12
End-of life treatment of sold products
773
0.07%
13
Downstream leased assets
-
-
N/A (No corresponding leased assets)
14
Franchises
-
-
N/A (No corresponding franchises)
15
Investments
-
-
N/A (No corresponding investments)
Total
1,070,037
N/A (No corresponding leased assets) N/A (Completed products transported on consignment are included in Category 4) N/A (Nabtesco products are completed products and not processed after being sold)
100%
(NOTES) 1 As the results for FY2025 are being compiled, information on the results for FY2024 are presented. 2 The Scope 3 calculations for FY2024 were made by the following method and for the following period and scope. :Calculation method: As shown in the basic guidelines on the calculation of greenhouse gas emissions from supply chains set by the Ministry of the Environment and the Ministry of Economy, Trade and Industry :Calculation period: January 1 to December 31, 2024
―25―
(Translation) This document has been translated from the Japanese original for the convenience of overseas stakeholders. In the event of any discrepancy between this document and the Japanese original, the original shall prevail.
(3) Enhance Human Capital Management Under the slogan, “Leaders in Innovation,” as upheld in its long-term vision, the Nabtesco group has been striving to increase its corporate value, with a focus on meeting customer needs and exceeding the expectations of both customers and society alike. This effort carries on a long tradition dating back not only to the Company’s founding but also to the aims of its two predecessor companies prior to their integration. Toward this goal, we are striving to enhance both our financial impact and social impact by boosting our performance and contributing to the solution of social challenges. To this end, we need to enhance our existing businesses while also searching for new businesses, as proposed in the theory of organizational ambidexterity. To meet this requirement, we must foster reforms for the various categories of capital that provide us with a foundation for innovation. In particular, human capital is essential for our value creation process, and the group accordingly aims to manage and optimize its human capital toward becoming “Leaders in Innovation.” In order to “meet” the expectations of customers, we need personnel who are strongly committed to meeting the needs of customers through unyielding technological innovation, performance & quality improvement and higher productivity. To take the next step of then exceeding the expectations of customers and society, we need to develop and attract personnel who can expand our existing business domains and launch new businesses to create and propose expectation-exceeding value. As an organization, we also need to gain the ability to respond agilely to changes in our business environment. To this end, managers are required to play important roles to encourage individual employees to take actions autonomously and independently and to serve as an intermediary to foster not only traditional top-down measures taken under the leadership of top management but also bottom-up measures taken at the initiative of general employees. Our group’s human capital management is thus based on measures promoted by the three actors: top management, middle managers, and individual employees. The group will proactively make investments to support these three actors in fulfilling their respective roles and will strongly repeat the cycle of meeting and exceeding the expectations of customers and society toward the achievement of its long-term vision.
―26―
(Translation) This document has been translated from the Japanese original for the convenience of overseas stakeholders. In the event of any discrepancy between this document and the Japanese original, the original shall prevail.
①
Vision for Human Capital Management The group believes that the creation of new value will be promoted by the fulfillment of defined roles by the company & top management, organizations & managers, and individual employees. Based on this recognition, we have set a vision for each of the above for the optimization of human capital.
The role of the company & top management is to create a situation & environment that allows for Action. The role of organizations & managers is to inspire individuals to find seeds for Action. The role of individual employees is to sprout those seeds for “Innovation in Action.” The group upholds this vision for its human capital management.
―27―
(Translation) This document has been translated from the Japanese original for the convenience of overseas stakeholders. In the event of any discrepancy between this document and the Japanese original, the original shall prevail.
② Gaps between Reality and Vision: Identification of Issues The group regularly conducts an employee engagement & organizational diagnosis survey to grasp employees’ subjective ideas based on their Engagement Scores (ES) and clarify the present situation from the viewpoint of individuals and organizational culture. When designing the questionnaire for organizational diagnosis, we first set “innovation items” that are thought to be highly related to challenges, co-creation, learning and creativity—elements that help foster innovation. We then classified the questions into those related to individuals (individuals’ indicators) and those related to the organization (organizational indicators). For these two types of indicators, we analyzed the survey results with a focus on correlations between the sufficiency rating given to each of the question items, including both innovation items and others, and the item’s connection to innovation. The graph shown below indicates the level of each item’s connection to innovation (horizontal axis) and its sufficiency rating (vertical axis).The items shown on the lower right side of the two graphs are items that are strongly connected to innovation but for which the sufficiency rating is low. As for individuals, the survey results imply that a driving force for innovation would be individual employees feeling satisfied with their jobs and able to feel a sense of achievement and selfgrowth. For the organizational indicators set for the company & top management and for organizations & managers, the key items are “Outlook for the achievement of targets,” “Identification of social changes by the company ahead of others” and “Creation of a culture of embracing challenges” for the former and are “Solution of issues across the departments” and “Development of the next generation of leaders” for the latter. Based on the survey results, we have formulated the following hypothesis: To become “Leaders in Innovation,” it is essential for Nabtesco to focus more on these key items to promote measures gathering the “company & top management,” “organizations & managers” and “individuals” to narrow the gap.
―28―
(Translation) This document has been translated from the Japanese original for the convenience of overseas stakeholders. In the event of any discrepancy between this document and the Japanese original, the original shall prevail.
③ Indicators and Goals In order to narrow the gap as described on the previous page, we have set indexes for innovation, linkage and engagement as indicators to realize the vision set for each of the three actors, which is the “company & top management,” “organizations & managers” and “individuals.” These three indicators are set based on the results of the organizational diagnosis and the engagement scores, and we have also set the third quartile value for FY2022 as the immediate target for each indicator. The innovation index is an indicator intended for the creation of the situation & environment that allows for Action. We will further instill The Nabtesco Way across the board and enhance our human resources portfolio to encourage both organizations and individuals to take actions toward their shared goal for innovation. The linkage index is an indicator designed to enhance support for individual employees through the establishment and improvement of the personnel assignment, education and evaluation systems and new business creation systems toward encouraging employees to take actions to “meet” and “exceed” our customers’ expectations, being inspired to find seeds for Action. The engagement index is an indicator intended to encourage individuals to sprout seeds for “My Innovation in Action” by implementing The Nabtesco Way with ownership, developing their careers in an autonomous manner, and by fostering reskilling to develop an innovation mindset. We will sophisticate our human capital management by adjusting the KPIs on human capital in line with changes in related issues, while monitoring progress made with the implementation strategies and for each of the indicators. <Key performance indicators (KPIs) for human capital> [Company & top management] [Organizations & managers] Innovation index Linkage index
[Individuals] Engagement index
(NOTES) 1. As the results for FY2025 are being compiled, information on the results for FY2024 is presented. 2. The figures for FY2022 have been retrospectively adjusted as a result of using divisional averages to align both data for the aggregation of organizational audits and engagement surveys. In conjunction with this revision, the target for human capital KPI has also been retroactively revised to the third quartile figure for FY2022.
[Company & top management]Innovation index Systematic measures to improve the Innovation Index
―29―
(Translation) This document has been translated from the Japanese original for the convenience of overseas stakeholders. In the event of any discrepancy between this document and the Japanese original, the original shall prevail.
[Organizations & managers] Linkage index Systematic measures to improve the Linkage Index
[Individuals] Engagement index Systematic measures to improve the Engagement Index
―30―
(Translation) This document has been translated from the Japanese original for the convenience of overseas stakeholders. In the event of any discrepancy between this document and the Japanese original, the original shall prevail.
(4) Intellectual Property Management Strategies to Lead Sustainable Innovation Creation The Nabtesco Group has positioned its intellectual property as a core value generating competitiveness in the pursuit of sustainable growth and expansion in business for all of its stakeholders, including customers and partner companies. It seeks to bolster corporate value by developing its Intellectual Property Management Strategy, which focuses on protecting and enhancing competitive advantages, across the Group. Nabtesco’s Core Competence entails not only so-called core competence (core strengths) but also the technologies, etc. necessary to provide value to customers, even those owned by competitors. Since we cannot provide value to customers with core competence alone, we refer to a broader scope which includes intellectual properties and intangible assets that cover not only intellectual property rights such as patents, but also know-how, transaction records, and supply chains. We also determine the core competence we currently hold (current core competence) and the core competence we will need in the future (future core competence) for each business. In addition, current and future core competences are visualized and shared in a company-wide perspective (functions and objectives). <Nabtesco‘s Core Competence>
―31―
(Translation) This document has been translated from the Japanese original for the convenience of overseas stakeholders. In the event of any discrepancy between this document and the Japanese original, the original shall prevail.
①
Governance From FY2025, in order to discuss technology development strategy and intellectual property strategy in an integrated manner, the Group dissolved the company-wide intellectual property strategy deliberation framework that had previously been in place and began holding an annual Group Development Meeting. This meeting, attended by the CEO and senior management, discusses and deliberates the basic policies for the Group-wide technology development strategy and intellectual property strategy. Based on the basic policies determined at the Group Development Meeting, the Company holds Company Roadmap Meetings approximately three times a year to discuss and deliberate company-specific technology development strategies and intellectual property strategies for each in-house company and group company. These meetings are attended by the presidents and senior executives of the respective in-house companies and group companies, together with the Head of the Technology Division and senior members of the Technology Division. The Company Roadmap Meetings were previously forums focused primarily on technology development within each in-house company; however, in FY2024, they were integrated with the Company Intellectual Property Strategy Deliberation meetings in order to enable integrated discussions of technology development strategy and intellectual property strategy. In addition, from FY2025, the Company has been holding Technology Division Heads Meetings approximately six times a year to share the status of activities at each Company Roadmap Meeting and to discuss and deliberate common technology and intellectual property issues across the in-house companies and group companies. These meetings are attended by the Head of the Technology Division, as well as heads of technology divisions from the corporate functions and in-house companies. The Technology Division Heads Meetings previously focused mainly on common technology issues across the Group; however, in FY2025, they were integrated with the Intellectual Property Enhancement Committee, which had served as a forum for discussing Group-wide intellectual property issues, in order to enable integrated discussions of technology and intellectual property issues. Matters discussed at the Technology Division Heads Meetings are formulated as strategic proposals and deliberated at the Group Development Meeting, where they are reflected in the basic policies for the following fiscal year. In this way, the activities of the Group Development Meeting, Company Roadmap Meetings, and Technology Division Heads Meetings are organically linked and evolve in a spiral manner. In addition, since FY2022, the basic policy for the Company-wide intellectual property strategy has been reported to the Board of Directors once a year and is subject to its oversight. Intellectual property strategies related to individual businesses are incorporated into business strategies and are reported to, and overseen by, the Board of Directors as appropriate.
―32―
(Translation) This document has been translated from the Japanese original for the convenience of overseas stakeholders. In the event of any discrepancy between this document and the Japanese original, the original shall prevail.
② Strategies ■Creation of New Businesses through IP Landscape Analysis The Nabtesco Group is working to enhance its core value and acquire new value by searching for new market/customer needs by the effective use of IP landscape analysis. Regarding the equipment and systems for which the Group’s products and services are adopted, we globally collect information available in the public domain, including patent and other intellectual property information, as well as information available from papers, magazines and other companies, in order to conduct macro analyses of the related technologies, market trends and customer needs. Based on the analysis results, we search for new business themes and new market/customer needs, verify our development themes, and also search for open innovation partners in our effort to set our future business policies and promote discussion across internal organizations, such as in-house companies, about collaboration with other companies. ■Management of Core Technological Information and Strategy to Acquire Intellectual Property Rights The Nabtesco Group’s competitive advantages, which provide us with core value (intellectual properties and intangible assets), include not only invention but also deep relationships of trust with customers, successful branding in the market, ideas for products and services, design and manufacturing know-how, its supply chain and human resources. For the core value that we can keep confidential, we impose strict management controls to protect them as confidential technological information, while for technologies that we cannot keep confidential because we sell them, we protect them based on our strategy to acquire intellectual property rights proactively. We will protect our existing and future intellectual properties as our core value through the management of core technological information and the strategy to acquire intellectual property rights, thereby continuing to enhance the Nabtesco Group’s core competency regarding intellectual property, in turn, increasing our corporate value.
●Intellectual property strategies for acquiring and strengthening core value
―33―
(Translation) This document has been translated from the Japanese original for the convenience of overseas stakeholders. In the event of any discrepancy between this document and the Japanese original, the original shall prevail.
③ Risk Management ■Confidential Information Management and Strategy to Acquire Intellectual Property Rights The Nabtesco Group identifies its core value as a source of competitiveness. The Group’s core value includes the unwavering trust of customers, brand perception established in the marketplace and technological as well as design/manufacturing ideas and know-how related to products and services provided. These core value elements, including a number of patents, designs, trademarks and marketing intelligence, are protected by safeguards for intellectual assets. As for created core competence (intellectual properties and intangible assets), we impose strict management controls to protect it as core technological information (confidential information) in principle. As part of our efforts to manage core technological information, we provide information management education to all officers and employees (including temporary staff) every year and ensure to collect evidences that can be valid in trials in Japan and overseas. In addition, we endeavor to maintain the management system in collaboration with the Business Auditing Department. Meanwhile, for technological core competence that cannot be kept confidential because we disclose it in our business activities such as product sales, we protect it based on our strategy to acquire intellectual property rights by building an intellectual property network. As of the end of 2025, we have built the intellectual property portfolio comprising a number of patents, utility models, and designs (including those under application) (approx. 2,200 cases in Japan, approx. 1,200 cases in Asia, approx. 1,100 cases in Europe, and approx.. 500 cases in the Americas). We will protect our current core competence as well as our future core competence which is yet to be created through the management of core technological information and the strategy to acquire intellectual property rights, thereby continuing to enhance the Nabtesco group’s comprehensive ability regarding intellectual properties and intangible assets and increase our corporate value.
■Execution of Intellectual Property Clearance Since Nabtesco Group considers protecting customer’s business and products as an essential factor, Group conducts intellectual property clearance as a part of the commercialization process, making it essential to protect customers’ businesses and products. More specifically, it undertakes activities during the commercialization process, including those related to core technology information management, the acquisition of intellectual property rights, protection against the infringement of intellectual property right by other companies, compliance with technological agreements, anticounterfeiting, and the protection of trademarks or copyrights. We have conducted intellectual property clearance for more than 190 products and services since 2018. ■Elimination of Counterfeits In order to ensure that customers who trust Nabtesco’s brand and purchase its products do not suffer any damage, the Nabtesco Group has a policy of thoroughly eliminating counterfeits of its brands, even if it incurs costs. In addition to information from in-house companies and Group companies within and outside Japan, we visit exhibitions and monitor the status of listings on EC sites and corporate websites on a regular basis, and periodically monitor companies that stopped infringing on our products after warning them in the past in an effort to detect any counterfeits as soon as possible. As a result, we have provided more than 420 infringement warnings since 2018.
―34―
(Translation) This document has been translated from the Japanese original for the convenience of overseas stakeholders. In the event of any discrepancy between this document and the Japanese original, the original shall prevail.
④ Indicators and Goals ■Transition from a quantity-driven approach to a quality-driven approach Since 2017, we have systematized the Intellectual Property Strategy activities to acquire and reinforce our core competence (intellectual properties and intangible assets) by adding Intellectual Property Creation to the criteria for evaluating the performance of in-house companies and Group companies. Each of the in-house and Group companies is now obliged to develop Intellectual Property Strategy activities as business plans for each fiscal year, as set forth in the Medium-Term Business Plan of each in-house company and Group companies, and to implement them accordingly. Furthermore, the Nabtesco Group strives to develop a corporate culture facilitating the creation of new businesses, ideas about new technologies, and design/manufacturing know-how among all engineers. To this end, employees are encouraged to be proactive as part of an evaluation target for business performance of respective in-house companies. In an attempt to motivate individual employees to become more innovative, Nabtesco gives awards to engineers with spectacular innovations which contribute our business (a total of 256 engineers have been awarded until 2025), to honor their achievements at a ceremony for the corporate foundation anniversary. Through these initiatives, the number of intellectual property creation filings relating to inventions, designs, and knowhow has been maintained at a certain level or higher, as shown in the graph below. In FY2025, the Company shifted its activities with the objective of further enhancing quality rather than quantity, and set target numbers for intellectual property creation filings related to Smart Motion Control in order to accelerate the resolution of social issues through Smart Motion Control. As a result, the number of intellectual property creation filings related to Smart Motion Control amounted to 325, exceeding the planned target of 180. On the other hand, the number of intellectual property creation filings related to development themes other than Smart Motion Control and to production technologies declined, resulting in a total of 637 filings overall. Going forward, while continuing to focus on intellectual property creation activities related to Smart Motion Control and managing them against specific targets, the Company will also strive to maintain a certain level of intellectual property creation filings overall. <Number of notifications on intellectual property creation>
Note1 Figures above does not include Hydraulic Equipment 2 Stright part of the chart in 2025 is smart motion control related creation
―35―
(Translation) This document has been translated from the Japanese original for the convenience of overseas stakeholders. In the event of any discrepancy between this document and the Japanese original, the original shall prevail.
■Measures to Promote Innovation through Intellectual Exploration As part of efforts to stimulate innovation through so-called intellectual exploration, we have been promoting activities to increase diversity of intellectual property creators since 2022. The ratio of inventors has been set as an indicator for such activities. The ratio of inventors is the ratio of actual number of inventors who notified intellectual property creation to the total number of our engineers including not only those engaging in development but also production engineers. The ratio, which is calculated in each financial year, indicates whether diversity is maintained and improved on a continuous basis. The target is set at 80% or higher, and to sustain this level, the Company is implementing various initiatives, including small group activities. The target was not achieved, partly due to the impact of a shift from FY2025 toward activities aimed at further enhancing quality over quantity, including the strengthening of intellectual property creation related to smart motion control. In FY2026, the Company aims to achieve the target by once again strengthening support for intellectual property creation by developers, designers, and production engineers working on development themes other than smart motion control. In addition, we will strive to promote innovation as a unified team across the company based on the system for intellectual property creation supporters, such as sales representatives who have identified new market needs and brought about innovation. <Ratio of inventors (including know-how and design inventors)>
Note Figures above does not include Hydraulic Equipment
―36―
(Translation) This document has been translated from the Japanese original for the convenience of overseas stakeholders. In the event of any discrepancy between this document and the Japanese original, the original shall prevail.
3 【Business and Other Risks】 (1) The Group’s Risk Management Structure We have systems in place to ensure that profits, losses, asset efficiency, quality and disasters, among other matters, are reported to the Board of Directors properly and in a timely manner with respect to the execution of duties. By leveraging these systems, we strive for the early identification of risks and the minimization of losses. With an eye on the sustainable enhancement of corporate value, we established the Risk Management Committee as an organization under the direct supervision of the CEO that is responsible mainly for deliberating important matters. The committee members are appointed by the CEO. The Chairperson of the Risk Management Committee (Managing Executive Officer) provides reports at management meetings such as Management Committee attended by CEO, Board of Directors meetings and etc. regarding the risk management initiatives periodically. (2) Risk Management The Risk Management Committee has been identifying serious risks related to the entire company based on the results of risk assessments made by the administrative departments, in-house companies and Group companies, discussing countermeasures for these risks, and also following up on the progress made for the implementation of the countermeasures. We also analyze the factors that have caused the risk to materialize in the past. Then we prioritize the risks to be addressed and check our tolerance for the risks, make plans to deal with them, discuss the plans, and implement them. Furthermore, specialized staff at head office departments, such as the internal control department, carry out audits on the operational risk management situation of our workplaces, give necessary and appropriate expert advice for operational improvements, and report the details to the Board of Directors to ensure the appropriate monitoring of the responses made to risks at each of the workplaces. To deal with risks, Nabtesco implements the following procedures: (1) risk analysis, (2) risk assessment, and (3) risk judgment. In risk analysis, we analyze the materiality of each risk based on its occurrence frequency (by five-grade evaluation) and level of impact (by four-grade evaluation). Based on the results gained from the risk analysis, we give the risk an overall score (by four-grade evaluation) and then specify the level of necessary countermeasures for the risk (also by four-grade evaluation)
―37―
(Translation) This document has been translated from the Japanese original for the convenience of overseas stakeholders. In the event of any discrepancy between this document and the Japanese original, the original shall prevail.
(3) Major Risks Principal risks relevant to the business and accounting status of the Group described in the Annual Securities Report and deemed significant are as follows. If such risks materialize, they may affect our group's performance and financial position. Note that the risks regarding future contents included in the matters described below were based on the judgment of the Company as of the end of the current consolidated fiscal year. Major risks on the Group
Frequency
Impact
Medium
Medium
② Risk relevant to geopolitical factors
Medium
Medium
Low
Large
④ Risks relevant to procurement
Medium
Medium
Low
Large
⑥ Risks relevant to competition
Medium
Medium
⑦ Risks relevant to information security
Medium
Medium to Large
⑧ Risks relevant to intellectual property
Medium
Medium
⑨ Risks relevant to company acquisitions
Low to Medium
Medium to Large
High
Medium
① Risks relevant to the economy, markets and currency ③ Risks relevant to large-scale disasters and climate change ⑤ Risks relevant to product quality
⑩ Risks relevant to recruiting human resources
Risk Map
Large
Impact Medium
Small
Low
Medium Frequency
―38―
High
(Translation) This document has been translated from the Japanese original for the convenience of overseas stakeholders. In the event of any discrepancy between this document and the Japanese original, the original shall prevail.
① Risks relevant to the economy, markets and currency The Group's businesses are directly or indirectly related to a number of industries, including automobile, construction machinery, railroad, industrial machinery and so on, in Japan and overseas. Market fluctuations and trends in capital expenditure in these industries, fluctuations on currency may affect the operating results and financial position of the Group. Frequency
Medium
Impact
Medium
The Group mitigates risks associated with economic fluctuations by operating businesses across a wide range of industries that are subject to different economic cycles. In addition, the Group seeks to minimize the impact of economic fluctuations on its financial performance by expanding its MRO (Maintenance, Repair and Overhaul) business, which is less susceptible to economic cycles. Countermeas ure
Furthermore, as one of the basic policies of the Medium-Term Management Plan launched in 2025, the Group has set forth the evolution of its core strength in “motion control” into “smart motion control” (electrification, integration, and data utilization). Through this initiative, the Group is working to create new value by addressing social issues related to its business domains. By responding to increasingly diverse and sophisticated customer needs and providing new valueadded solutions, the Group aims to expand its businesses. With regard to the impact of fluctuations in foreign exchange rates, the Group implements risk hedging measures, including the use of forward exchange contracts.
② Risks relevant to geopolitical factors In pursuit of further growth and profitability, the Group actively conducts business mainly in Asia, North America and Europe. Therefore, the Group is subject not only to economic and market risks but also to political turmoil and unforeseeable amendments to laws and regulations in various countries, which may affect the markets for particular products. Such events are likely to impact operating results of the Group. Frequency
Medium
Impact
Medium
The Group regularly monitors political and social conditions, public security, and other relevant factors at and around the locations of its business sites, and strives to implement appropriate measures as necessary. In addition, the Group holds regular compliance liaison meetings and security trade control liaison Countermeas ure
meetings for operationally responsible personnel at its domestic and overseas group companies, through which it shares information across the Group on developments in new laws and regulations in each country, economic sanctions, and export control regimes. With respect to risks such as procurement disruptions arising from geopolitical risks, the Group is advancing initiatives including multiple sourcing, as described in the section “Risks Related to Procurement” below.
―39―
(Translation) This document has been translated from the Japanese original for the convenience of overseas stakeholders. In the event of any discrepancy between this document and the Japanese original, the original shall prevail.
③ Risks relevant to large-scale disasters and climate change The Group operates business sites around the world, including factories in Japan and overseas. In recent years, risks associated with various disasters—such as wind and flood damage stemming from global climate change, large-scale earthquakes, pandemics, and other factors leading to social disruption—have been increasing. As a result, the Group’s business performance and financial condition may be adversely affected by personal and property damage, delays in the procurement of materials, and disruptions to logistics networks. In addition, there is no assurance that losses arising from such events will be sufficiently covered by insurance or other measures. Frequency
Countermeas ure
Low
Impact
Large
Within the Group, the ESH Committee, which serves as a CEO-direct reporting body responsible for promoting ESH management, collects important information related to the environment, safety, disaster prevention, and health, including risks and opportunities associated with climate change. The Committee deliberates on the assessment of materiality and on measures to address matters assessed as material. As part of its initiatives to address global climate change, the Group has set long-term greenhouse gas emission reduction targets on a Group-wide basis and is advancing activities at its business sites in Japan and overseas to achieve CO₂ emission reduction targets. Through these initiatives, the Group is promoting activities to fulfill its social responsibilities related to climate change. In response to the increasing severity and frequency of natural disasters in recent years, the Group is committed to implementing consistent measures for initial response at the time of a disaster and for business continuity, as well as to conducting ongoing education and training during normal times. Specifically, the Group is systematically and organizationally implementing initiatives such as: (i) conducting voluntary drills at each site in addition to legally required drills to verify and improve the effectiveness of manuals; (ii) enhancing the knowledge and decision-making capabilities of all domestic employees through e-learning programs; (iii) promoting the assignment of personnel certified under the BCAO (Business Continuity Advancement Organization) qualification; and (iv) supporting the establishment of site-level frameworks for business continuity and resumption in the event of a disaster. In preparation for large-scale earthquakes and similar events, the Group is thoroughly implementing seismic retrofitting of existing buildings, ensuring seismic resistance in the construction of new factories and facilities, and carrying out measures to prevent the overturning of shelves, cabinets, and similar fixtures at all business sites. In addition, through annual ESH audits and regular safety patrols conducted at each site, the Group continues to rigorously promote initiatives to prevent human-caused accidents.
④ Risks relevant to procurement The Group procurement mainly metal parts and electronic and electrical components from approximately 1,600 suppliers of various sizes. If the supply of parts is disrupted and alternative suppliers cannot be secured due to external factors such as natural disasters or cyberattacks that suspend procurement functions, or due to the bankruptcy of suppliers, the Group’s business performance and financial condition may be adversely affected as a result of deteriorating product margins and the occurrence of opportunity losses. Frequency
Medium
Impact
Medium
The Group has established a framework to promote supply chain BCP (Business Continuity Planning) activities to address large-scale disasters and risks in general, and is working to enhance the resilience of the entire supply chain by encouraging its suppliers to obtain resilience-related certifications. With respect to cyberattacks, the Group regularly assesses the information security Countermeas ure
levels of its suppliers and continues to provide support for improvement. In addition to these initiatives, the Group maintains regular communication with its suppliers through measures such as questionnaire surveys. Furthermore, the Group regularly conducts risk assessments and monitoring of major components and raw materials, and promotes multiple sourcing to establish a procurement structure that does not rely on specific supply sources.
―40―
(Translation) This document has been translated from the Japanese original for the convenience of overseas stakeholders. In the event of any discrepancy between this document and the Japanese original, the original shall prevail.
⑤ Risks relevant to product quality The Group manufactures a full lineup of products in line with carefully designed quality control standards to prevent defects. However, in case of significant product defects leading to a recall or product liability issues occurring, the potentially massive costs arising from litigation, recall and so on could adversely impact the Group's business performance and financial position. Frequency
Low
Impact
Large
The Group conducts its product development, manufacturing, and sales activities in accordance with ISO 9001, the international standard for quality management systems. In addition, where required, the Group has obtained certifications for industry-specific quality management systems (QMS), such as IATF 16949 and JIS Q 9100, and has established management frameworks tailored to the requirements of each industry. Countermeas ure
To ensure the quality and safety of products shipped to the market, the Group conducts rigorous quality and product safety reviews during the development and design stages prior to product launch. Furthermore, the stability of manufacturing processes is continuously monitored, and appropriate inspections are conducted prior to shipment, enabling the Group to provide products that meet customer expectations. In addition, the Group has established the Quality and Product Liability (PL) Committee as a body reporting directly to the CEO to promote quality and PL management, and is working to enhance quality and safety standards across the Group.
⑥ Risks relevant to competition The Group has a wide lineup of products with high market shares in the domestic and overseas markets. If the market share of its products were to fall due to the delays in the development of new products or the development of new products by other companies, the Group's business performance and financial position could be adversely impacted. Frequency
Medium
Impact
Medium
The Group is engaged in the development of differentiated products with cost competitiveness that accurately captures customer needs. In addition to its core technologies—such as mechanical design, electrical and electronic design, and quality assurance—which have been accumulated and continuously enhanced through responding to customer needs, the Group possesses advanced elemental technologies including various analytical capabilities such as CAE and thermal analysis, as well as control technologies. Countermeas ure
By integrating these capabilities, the Group has established its proprietary motion control technologies. Furthermore, by leveraging cutting-edge elemental technologies and development methodologies strengthened through open innovation—such as advanced electronic control technologies, model-based development, and digital twins—the Group has built a development framework capable of responding to increasingly diverse customer needs and accelerating development speed. Looking ahead, the Group will further advance electrification, system integration, and data utilization to accelerate the evolution toward smart motion control, and will promote the development and provision of products and services, including those for predictive maintenance.
―41―
(Translation) This document has been translated from the Japanese original for the convenience of overseas stakeholders. In the event of any discrepancy between this document and the Japanese original, the original shall prevail.
⑦ Risks relevant to information security The Group obtains personal information and confidential information of its customers and trading partners through business activities, and holds confidential information of its business and technologies. In the event of a leakage of information, or destruction or falsification of important data, or system halt due to the unexpected levels of cyber-attacks, unauthorized access, or intrusion of computer viruses, etc., this could result in production stoppages and a deterioration of trust, potentially affecting the Group’s business performance and financial condition. Frequency
Countermeas ure
Medium
Impact
Medium to Large
In response to the increasing information security risks in recent years, the Group has established an Information Security Committee with the objective of enhancing information security levels across the Group. The Committee formulates basic policies on information security, works to strengthen security measures, and enables prompt responses to serious security incidents. In addition, the Group has established various management regulations to promote organizational and continuous implementation of security measures for information assets, ensures that these regulations are thoroughly communicated to all employees, and conducts regular education and training on the proper management of information assets. To address risks to information assets such as unauthorized access, leakage, falsification, loss, destruction, and obstruction of use, the Group has implemented security systems designed to mitigate risks and enable the rapid recovery of operations, while continuously conducting vulnerability assessments and implementing countermeasures. Furthermore, the Group is establishing system management with strict access controls, including restricting access to data on a user-by-user basis. In addition, the Group conducts regular internal and external audits of its information security initiatives to ensure continuous improvement of information security management.
⑧ Risks relevant to intellectual property The Group seeks to protect its proprietary technologies through the management of intellectual property rights, including patents, as well as the management of confidential information, and appropriately manages intellectual property and other intangible assets related to its proprietary technologies. At the same time, the Group exercises the utmost care to avoid infringing upon the intellectual property rights or other rights of third parties. However, if third parties were to infringe upon the Group’s intellectual property rights, if confidential information were to be leaked, or if the Group were to be alleged by third parties to have infringed upon their intellectual property rights, such events could adversely affect the Group’s business performance and financial condition. Frequency
Countermeas ure
Medium
Impact
Medium
To ensure the sustainable competitive advantage of its intellectual property and intangible assets (core value), which serve as the source of the Group’s business competitiveness, the Group promotes close collaboration between its intellectual property division and business divisions. From the product and service planning and development stages, technologies that can be effectively analyzed are protected through intellectual property rights, while design know-how that is difficult to analyze and manufacturing know-how continuously generated during mass production are protected through rigorous management of confidential information. In particular, with respect to confidential information management, in addition to strictly enforcing the execution of non-disclosure agreements prior to disclosure of confidential information to third parties, the Group has established a confidential information protection framework that enables it to demonstrate, both domestically and internationally, its legitimate ownership of such confidential information. Through this framework, the Group also addresses the risk of unintended leakage of confidential information. Furthermore, in products, countries, and regions where counterfeit products are prevalent, the Group regularly conducts investigations into counterfeit products and undertakes elimination measures, utilizing local experts as appropriate. With regard to brand counterfeiting in particular, the Group places emphasis on preventing the distribution of counterfeit products in order to protect customers who may otherwise suffer harm by purchasing products they believe to be genuine. At the same time, to prevent the occurrence of litigation and other significant business risks at an early stage, the Group has established a framework for intellectual property clearance in close collaboration between its intellectual property division and business divisions. This framework involves conducting investigations and analyses of third-party intellectual property rights— including not only patents but also trademarks and copyrights—not only during the product and service planning and development stages but also thereafter, as well as obtaining noninfringement opinions and licenses through internal and external patent attorneys and lawyers, as necessary.
―42―
(Translation) This document has been translated from the Japanese original for the convenience of overseas stakeholders. In the event of any discrepancy between this document and the Japanese original, the original shall prevail.
⑨Risks relevant to company acquisitions The Group seeks to enhance the production system for its products in Japan and overseas, its sales and service systems, and its technology platform through company acquisitions. However, if the effects that were expected at the time of the acquisition cannot be gained in the future, the Group may recognize impairment loss of fixed asset such as goodwill and the Group’s business performance, and financial position may be affected. Frequency
Low to Medium
Impact
Medium to Large
The Group has established Group M&A Guidelines to clarify its acquisition processes. In addition, Countermeas ure
during the consideration stage of potential acquisitions, the Group conducts due diligence on target companies and reviews the post-acquisition operation and management of such companies.
⑩Risks relevant to recruiting human resources The Group seeks to promote global business activities and maintain and improve its competitiveness by recruiting and developing a broad range of human resources with competence in manufacturing, development, sales and other specialized fields. However, failure to recruit and develop a sufficient number of personnel due to intensified competition over human resources and the retirement of employees may lead to a drop in competitiveness, affecting the Group’s business performance and financial position. Frequency
High
Impact
Medium
To secure a diverse pool of talent, the Group is promoting initiatives such as adopting various recruitment methods, including alumni recruitment¹ and referral recruitment², as well as establishing a professional track system to attract and retain highly specialized professionals. In addition, from the perspective of health and productivity management, the Group implements Countermeas initiatives that contribute to maintaining employee health, including tailored support through the ure
assignment of occupational health professionals and collaborative health promotion activities jointly undertaken by the health insurance association and the Company (collabo-health). Furthermore, the Group operates an internal job posting system aimed at employee retention and is committed to fostering employee engagement and maintaining a vibrant organization by creating a workplace where employees feel motivated and energized.
―43―
(Translation) This document has been translated from the Japanese original for the convenience of overseas stakeholders. In the event of any discrepancy between this document and the Japanese original, the original shall prevail.
4 【Management’s Analysis of Financial Condition, Results of Operations and Cash Flows】 (1) Summary of Business Results and Others ① Operating Results As the Company announced on July 31, 2025, in the "Notice Concerning the Company Split (Simplified Absorption-Type Company Split) of the Hydraulic Equipment Business and the Execution of the Share Purchase Agreement and the Shareholders’ Agreement with Comer Industries S.p.A.," a resolution was made regarding the company split of the hydraulic equipment business and the transfer of shares of the subsidiary succeeding the business. Therefore, from the third quarter of this consolidated fiscal year, the business is classified as a discontinued operation in accordance with IFRS 5. Accordingly, net sales, operating income, and income before tax are presented excluding the discontinued operations from the beginning of this consolidated fiscal year, while net income and Net income attributable to owners of the parent are shown as the sum of continuing and discontinued operations. During the consolidated fiscal year under review, showed an increase in demand for Component solutions, Transport solutions and Accessibility solutions business. As a result, the Group’s net sales amounted to ¥307,912 million. Operating income amounted to ¥20,956 million, despite the positive impact of increased revenue and the profitability improvement activities under Project 10, due to loss on liquidation of subsidiaries related to railway vehicle equipment and impairment losses of goodwill associated with Deep Sea Technologies. Income before tax was ¥21,983 million and net income attributable to owners of the parent was ¥15,255 million.
Net sales Current consolidated fiscal year (ended December 31, 2025) Previous fiscal year (ended December 31, 2024) YoY change (%)
Operating income
Income before income taxes
(Million yen) Profit attributable to the owners of the parent
307,912
20,956
21,983
15,255
280,458
13,157
14,225
10,188
9.8
59.3
54.5
49.7
The following is an overview of the business results by segment for the fiscal year under review. [Net Sales] Current consolidated fiscal Previous fiscal year year (ended December 31, 2024) (ended December 31, 2025)
(Million yen) YoY change (%)
Component Solutions Business
67,646
79,325
17.3
Transport Solutions Business
88,727
100,473
13.2
Accessibility Solutions Business
106,771
110,668
3.7
Others
17,315
17,445
0.8
Total
280,458
307,912
9.8
[Operating income] Current consolidated fiscal year (ended December 31, 2024) (ended December 31, 2025) Previous fiscal year
(Million yen) YoY change (%)
Component Solutions Business
2,667
5,420
103.2
Transport Solutions Business
12,389
13,698
10.6
Accessibility Solutions Business
9,340
9,541
2.1
Others
1,043
2,194
110.3
-12,282
-9,897
-
Corporate or elimination Total
13,157
―44―
20,956
59.3
(Translation) This document has been translated from the Japanese original for the convenience of overseas stakeholders. In the event of any discrepancy between this document and the Japanese original, the original shall prevail.
② Financial Position
Assets Liabilities
End of previous fiscal year (as of December 31, 2024) 449,845 160,101
End of current fiscal year (as of December 31, 2025) 466,632 176,264
289,744
290,368
Equity
(Million yen) YoY change 16,787 16,163 624
(Assets) Total assets as of December 31, 2025 were ¥466,632 million, an increase of ¥16,787 million from December 31, 2024, consisting of ¥256,426 million in current assets and ¥210,206 million in non-current assets. The key contributing positive factors were an increase of ¥43,665 million in assets held for sale due to the classification of the hydraulic equipment business as a discontinued operation in accordance with IFRS 5. The key contributing negative factors were a decrease of ¥13,512 million in operating receivable and a decrease of ¥12,657 million in tangible fixed assets. (Liabilities) Total liabilities as of December 31, 2025 were ¥176,264 million, an increase of ¥16,163 million from December 31, 2024, reflecting ¥134,677 million in current liabilities and ¥41,587 million in non-current liabilities. The key contributing positive factors were an increase of ¥13,129 million in borrowings under current liabilities and an increase of ¥12,256 million in liabilities directly related to assets held for sale due to the classification of the hydraulic equipment business as a discontinued operation based on IFRS 5. The key contributing negative factors were a decrease of ¥9,181 million in other liabilities.
(Equity) Total equity as of December 31, 2025 stood at ¥290,368 million. Equity attributable to owners of the parent was ¥273,466 million, an increase of ¥907 million from December 31, 2024. The key contributing positive factors were an increase in net income attributable to owners of the parent of ¥15,255 million and an increase of ¥4,834 million in other capital caused by factors such as exchange differences on foreign operations. Meanwhile, the main contributing negative factor was a decrease of ¥20,089 million in retained earnings due to dividend payment and the retirement of treasury stock. As a result of the above, the ratio of equity attributable to owners of the parent was 58.6%, and equity attributable to owners of the parent per share was ¥2,333.54. (2) Cash Flow
(Million yen) Previous fiscal year (ended December 31, 2024)
Current consolidated fiscal year (ended December 31, 2025)
Cash flows from operating activities
26,650
32,824
Cash flows from investing activities
-28,733
Free cash flow
-2,083
-15,725
Cash flows from financing activities
-4,137
17,098
-13,559
Cash and cash equivalents (hereinafter, “cash”) on a consolidated basis as of December 31, 2025 stood at ¥73,340 million, a decrease of ¥1,136 million from December 31, 2024 as a result of the use of funds acquired from operating activities primarily for capital expenditures, mainly reflecting capital investment, and dividend payment. [Cash flows from operating activities] Net cash generated from operating activities for the fiscal year totaled ¥32,824 million. The principal positive factors included increases in net income, depreciation and amortization. Meanwhile, the main negative factors were an increase in inventories and the decrease in operating liabilities. [Cash flows from investing activities] Net cash used in investing activities for the fiscal year amounted to ¥15,725 million. The main factor for decreases were payments for the purchase of property, plant, and equipment. [Cash flows from financing activities] Net cash used in financing activities for the fiscal year under review was ¥13,559 million. The main factor for decrease was proceeds from long-term borrowings. The main factor for decrease was the acquisition of treasury stock and the dividend payments.
―45―
(Translation) This document has been translated from the Japanese original for the convenience of overseas stakeholders. In the event of any discrepancy between this document and the Japanese original, the original shall prevail.
(3) Status of production, orders and sales ① Production Results Production results by segment for the fiscal year under review are as follows: Segment name
Production (Million yen)
YoY change (%)
Component Solutions Business
81,841
20.4
Transport Solutions Business
101,796
11.2
Accessibility Solutions Business
112,394
4.2
Others
19,504
16.3
315,535
11.0
Total (NOTE) The above amounts are figures after elimination of intersegment transactions.
② Orders Received The results of orders in the fiscal year under review by business segment are as follows: Segment name
Orders received (Million yen)
Order backlog (Million yen)
YoY change (%)
YoY change (%)
Component Solutions Business
82,428
16.2
19,666
18.7
Transport Solutions Business
109,354
8.4
100,199
9.7
Accessibility Solutions Business
111,145
8.7
47,803
1.0
Others
20,326
14.5
12,387
30.3
323,254
10.8
180,055
9.3
Total
(NOTE) The above amounts are figures after elimination of intersegment transactions.
③ Sales Results Sales results by business segment for the fiscal year under review are as follows. Segment name
Sales (Million yen)
YoY change (%)
Component Solutions Business
79,325
17.3
Transport Solutions Business
100,473
13.2
Accessibility Solutions Business
110,668
3.7
Others
17,445
0.8
307,912
9.8
Total
(NOTE) 1 The above amounts are figures after elimination of inter-segment transactions. 2 No customer accounts for more than 10% of total sales.
―46―
(Translation) This document has been translated from the Japanese original for the convenience of overseas stakeholders. In the event of any discrepancy between this document and the Japanese original, the original shall prevail.
(4) Analysis and examination of the status of operating results, etc. from the management's perspective ① Important Accounting Policies and Estimates Important accounting policies and estimates used in the consolidated financial statements of our Group are as described in “5. Accounting Status 1. Consolidated Financial Statements, etc., (1) Notes to Consolidated Financial Statements, Note 3. Significant Accounting Policies and Notes 6. Significant Accounting Judgments, Estimates and Assumptions.” ② Recognition, analysis, and consideration of the status of operating results for the fiscal year under review
- Net sales (Excluding discontinued operations) Net sales for the current consolidated fiscal year increased by 9.8% year on year to ¥307,912 million. This increase was increased demand in the Component Solutions Business, the Transport Solutions Business, and the Accessibility Solutions Business.
- Operating income (Excluding discontinued operations) Operating income increased 59.3% to ¥20,956 million, despite the positive impact of increased revenue and the profitability improvement activities under Project 10, due to loss on liquidation of subsidiaries related to railway vehicle equipment and impairment losses of goodwill associated with Deep Sea Technologies. The ratio of operating income to net sales was 6.8%.
- Income before tax
(Excluding discontinued operations)
Financial income came to ¥992 million due to foreign exchange gains, etc. Financial costs were ¥1,105 million due to the recording of interest expenses and other expenses. Equity in earnings of affiliates was ¥1,140 million. As a result, income before tax ended at ¥21,983 million, increased by 54.5% year-on-year. 4) Net income attributable to owners of the parent (Including discontinued operations) In total, net income attributable to owners of the parent increased by 49.7% year-on-year to ¥15,255 million, net of income tax expenses of ¥ 5,833 million and net income attributable to non-controlling interests of ¥1,930 million. Total basic earnings per share increased by ¥43.04 year-on-year to ¥127.87. Results by business segment for the fiscal year under review are as follows. (Component solutions business) Orders received for component solutions increased by 16.2% year-on-year, to ¥82,428 million. Net sales increased by 17.3% year-on-year, to ¥79,325 million, and operating income increased by 103.2% year-on-year, to ¥5,420 million. Sales of precision reduction gears increased year-on-year as the inventory of industrial robots, which had been prolonged, reached an appropriate level, and demand remained steady. (Transport solutions business) Orders received for transport solutions increased by 8.4% year-on-year, to ¥109,354 million. Net sales increased by 13.2% yearon-year, to ¥100,473 million, and operating income increased by 10.6% year-on-year, to ¥13,698 million. Sales of railroad vehicle equipment increased year-on-year due to strong demand for new railroad vehicles and MRO (Maintenance, Repair and Overhaul) both domestically and internationally. Sales of aircraft equipment increased year-on-year due to increased demand from increased defense spending and increased revenue from commercial aircraft. Sales of marine vessels equipment increased year-on-year due to strong demand for new vessels and MRO. Sales of commercial vehicle equipment remained at the same level as the same period of the previous fiscal year due to demand in the Southeast Asian market continued to stagnate, while domestic market demand remained solid. In the fiscal year under review, we recorded loss on liquidation of subsidiaries of ¥1,324 million related to railway vehicle equipment and an impairment loss of ¥989 million on goodwill related to Deep Sea Technologies.
―47―
(Translation) This document has been translated from the Japanese original for the convenience of overseas stakeholders. In the event of any discrepancy between this document and the Japanese original, the original shall prevail.
(Accessibility solutions business) Orders received for accessibility solutions increased by 8.7% year-on-year, to ¥111,145 million. Net sales increased by 3.7% year-on-year, to ¥110,668 million, and operating income increased by 2.1% year-on-year, to ¥9,541 million. Sales from the automatic doors business increased year-on-year due to steady demand for doors and platform doors in Japan. (Others) Orders received for others businesses increased by 14.5% year-on-year, to ¥20,326 million. Net sales increased by 0.8% yearon-year, to ¥17,445 million, and operating income decreased by 110.3% year- on-year to ¥2,194 million. Sales of packaging machines remained at the same level as the same period of the previous fiscal year due to domestic demand for equipment renewal was steady, but overseas capital investment continued to be postponed.
③ Analysis of capital resources and fund liquidity Our Group's main cash requirements for operating activities include working capital required for production activities (raw materials, personnel expenses, etc.), selling expenses for acquiring orders, and R&D expenses for strengthening the competitiveness of existing businesses and creating new products and businesses. Investing activities include capital expenditures, primarily for capacity expansion and others for precision reduction gears in component solutions segment. Financing activity includes ¥12,900 million of short-term borrowing. In the FY2026, the Group plans to invest ¥12,500 million of capital expenditure. The funds required for the Group’s business activities are mainly procure through the use of own funds, borrowings from financial institutions, etc., and the Group selects the optimal financing methods while closely monitoring indicators such as the ratio of equity attributable to owners of the parent and ROE. The balance of loans at the end of the fiscal year under review was ¥44,985 million yen, an increase of ¥13,101 million yen from the previous fiscal year-end. ④ Objective indicators for judging the status of achievement of management policies, strategies and targets We have set financial targets of ROIC 10% or over as management targets in our medium-term management plan starting in FY2025. The trends in each indicator in the current fiscal year is as follows.
23rd fiscal year (FY2025) ROIC (%)
4.5
DOE (%)
3.5
NOTE The Company proposes an agenda item (resolution) entitled “Appropriation of Surplus” at the Annual General Meeting of Shareholders scheduled to be held on March 26, 2026. If this proposal is approved, the DOE ratio is expected to be as stated above.
―48―
(Translation) This document has been translated from the Japanese original for the convenience of overseas stakeholders. In the event of any discrepancy between this document and the Japanese original, the original shall prevail.
5 【Significant Management Contracts】 (Agreement on the Introduction of Technology, etc.) Name of Contract Company
Nabtesco Corporation
Subject of the contract
Conclusion agreement Effective Date
Contract period
Manufacturing and sales contract of nose steering, input nose steering and flap drives which are equipped with F-15 fighter.
January, 1983
Until December 2028
Technology and sales helicopter equipment
January, 1989
Until December 2028
Technology adopters
United States Parker-Hannifin Corporation
contracts
of
(NOTE) As compensation for the above-mentioned contracts, the Company pays a fixed amount or a fixed rate of sales. (Share Transfer Agreement and shareholders’ Agreement) On July 31, 2025, the Company’s Board of Directors resolved to execute a share transfer agreement with Comer Industries S.p.A., under which the Company would transfer 70% of the issued shares of Comtesco Corporation to Comer Industries S.p.A., after consolidating the Company’s hydraulic equipment business by transferring to a newly established wholly owned subsidiary of the Company (Comtesco Corporation) through an absorption-type company split. At the same time, the Board also resolved to execute a shareholders’ agreement concerning Comtesco Corporation with Comer Industries S.p.A. The share transfer was completed effective January 1, 2026. For further details, please refer to “Part V: Financial Information, 2. Financial Statements, Notes (Business Combinations).”
―49―
(Translation) This document has been translated from the Japanese original for the convenience of overseas stakeholders. In the event of any discrepancy between this document and the Japanese original, the original shall prevail.
6【R&D activities】
Based on our corporate philosophy of “The Nabtesco Group, with our unique motion control technology, will provide safety, comfort and a sense of security in daily lives as well as any form of transportation,” our group sets the goal of our R&D activities for profitable growth and engages in R&D by formulating R&D plans in cooperation with our business strategies. With respect to the direction of its research and development activities, the Group is promoting various R&D initiatives aimed at creating “smart motion control” products that can only be realized by the Group. Building on its core strength in mechanical and component technologies, the Group combines electrification with system integration, sensing technologies, data analytics, and software technologies to drive innovation in smart motion control. Research and development expenses for the current consolidated fiscal year amounted to ¥13,436 million. These expenses include research and development costs related to the hydraulic equipment business. The research objectives, major issues, research results, and R&D expenditures by segment are as follows.
(1) Component Solutions Business The Precision Equipment Company and Power Control Company are the main R&D centers for Precision reduction gears and its systems, as well as Hydraulic equipment for construction machinery and its systems. Major achievements in the fiscal year under review included the expansion of models for RV series for industrial robots, newly innovated product such as small size of precision reduction gears “RVminiⓇ series” and “MonocrankⓇ series,” development of condition monitoring sensors, the development of gear head series for semicondoctors and FPD market, the development of series of AGV drive units, the launch of energy-saving pump and valve systems for construction machinery, the strengthening of lineup of running and turning units for construction machinery, the launch of compact and high power density VC series motor models for construction machinery, and the study of equipment compatible with ICT and electrification of construction machinery. Research and development expenses in this segment totaled ¥2,044 million. (2) Transport Solutions Business The Railroad Products Company, Aerospace Company, Marine Control Systems Company and Nabtesco Automotive Co., Ltd. are responsible for the research and development of brake systems for railroad vehicles and door systems, aircraft flight control equipment and systems, marine engine control systems, and various devices and equipment for commercial vehicle brakes and passenger vehicle clutches. Major achievements during the fiscal year under review included the development of brake control systems and equipment (vehicle control) for railcars for the global market, development of oil-free compressor with improved dust environmental performance, the development of electric actuators for flight control, engaging in system integration development for autonomous vessels by applying the ship speed and engine power control unit “TELEGRAPH AGENT,” the development of control equipment and fuel injection valves for environmentally friendly engines, the Group launched highpressure solenoid valves for engine starting, the development of electric compressors that respond to the electrification of commercial vehicles in addition to the development of conventional air brake equipment for commercial vehicles. Research and development expenses in this segment totaled ¥3,077 million. (3) Accessibility Solutions Business The Accessibility Innovations Company plays a central role in R&D of automatic door for buildings, automatic platform gates, platforms screen doors, and welfare equipment. Major achievements during the fiscal year under review included the development of high-value-added automatic door, the launch of designated fire prevention facilities (combined fire prevention facilities) with smoke shielding performance (CAS certified), the business expansion of automatic door with digital signage and starting advertisement delivery business, the development of automatic platform gates and high-value-added screen doors for railway station platforms, the development and launch of assist units for cart, development of small and oversea type of wheel unit for rollators and the others. Research and development expenses in this segment totaled ¥4,067 million yen. (4) Others PACRAFT Co., Ltd. and CMET Inc. play a central role in the R&D of such products as automated filling/sealing packaging machines and stereolithography system (3D printers) respectively. Major achievements during the fiscal year under review included the development of packaging machines in response to high productivity demands, the development of labor-saving and automation equipment in the front and rear processes of packaging machines, the development of medium size of stereolithography system “ATOMm-4000II”for manufacturing industry, the development of CMFS equipment for overseasmade wind power generation, completion of full-scale testing and transition to mass production of CMFS for 3 MW wind turbines owned by a major European power generation operator; development of CMFS cloud services and commencement of services in Japan and overseas; and development of gear tooth surface life diagnostics for yaw gears within the cloud platform, among other initiatives. Research and development expenses in this segment totaled ¥920 million.
(5) Corporate division The Corporate Division actively engages in R&D activities related to fundamental technologies and new business fields that are common to the entire Group, as well as joint R&D activities with universities, research institutes, and other companies. In 2024, the Group established an innovation hub in North America and has been continuously exploring technological seeds and potential collaboration partners. Research and development expenses related to the Corporate Division are ¥3,328 million.
―50―
(Translation) This document has been translated from the Japanese original for the convenience of overseas stakeholders. In the event of any discrepancy between this document and the Japanese original, the original shall prevail.
No.3 【Status of Facilities】
- 【Overview of Capital Expenditures】 In our group, we invested primarily in expanding domestic capacity and improving productivity, and, upgrading facilities in overseas. As a result, capital expenditures for the fiscal year under review totaled ¥11,587 million (investments in property, plant and equipment and intangible assets). These expenses include capital expenditures related to the hydraulic equipment business. In component solutions business, capital expenditures totaled ¥5,736 million, mainly for the capacity expansion and other investment in precision reduction gears. Capital expenditures in transport solutions business amounted to ¥2,931 million, mainly for R&D capital expenditures in marine vessels equipment, and for renewal of capital expenditures related to facility and productivity improvement in railroad vehicle equipment and aircraft equipment. In accessibility solutions business, capital expenditures totaled ¥1,862 million, mainly for R&D and facility upgrades at automatic door. In the others segment, capital expenditures totaled ¥343 million, mainly for capital expenditures in upgrade of facilities and R&D. Capital expenditures of ¥715 million were made for companywide and common assets, mainly for updating information management systems and building a next-generation IT platform. In addition, the Company appropriated its own funds to the primary investors in all of its capital requirements.
2 [Status of major facilities] (1) Submitting Company As of December 31, 2025 Book value (Million yen) Buildings and structures
Machinery and equipment
Land (Area m2)
Others
Total
Number of employees (person)
7,271
11,290
1,755 (118,602)
1,662 21,978
552
15,182
5,663
5,660 13,721 40,227 (181,700)
69
Production facilities for brake systems and other equipment of railroad vehicles
1,550
640
3,431 (27,000)
350
5,972
360
Production facilities for marine vessels equipment, and others
1,081
534
698 (70,780)
178
2,491
209
Transport Solutions
Production facilities for aircraft equipment
5,014
1,281
541 (81,323)
253
7,089
393
Konan Plant (Higashinada-ku, Kobe)
Accessibility Solutions
Production facilities for automatic doors for buildings and others
499
113
90 (11,018)
355
1,057
258
Rental real estate (Matsuyama, Ehime Prefecture)
Common to Headquarters
Land for factories, buildings and structures
70
1
676 (57,236)
0
746
-
Site name (Location)
Segment Name
Details of facilities
Tsu Plant (Tsu, Mie)
Component Solutions
Production facilities for precision reduction gears
Land for the Hamamatsu Plant (Hamana-ku, Hamamatsu)
Component Solutions
Kobe Plant (Nishi-ku, Kobe)
Transport Solutions
Seishin plant (Nishi-ku, Kobe)
Transport Solutions and Common to Headquarters
Gifu Plant (Tarui-cho, Huwa-gun, Gifu Prefecture)
Production facilities for precision reduction gears
(NOTE) 1 The book value is the book value in the non-consolidated financial statements based on Japanese GAAP. 2 Other includes tools, furniture and fixtures, and construction in progress. 3.Book value is after the impairment loss. 4 Leased equipment from other than consolidated companies consist primarily of the Tokyo head office building of the submitting company, which is subject to annual rent of ¥302 million.
―51―
(Translation) This document has been translated from the Japanese original for the convenience of overseas stakeholders. In the event of any discrepancy between this document and the Japanese original, the original shall prevail.
(2) Domestic subsidiaries
Company and site name (Location)
As of December 31, 2025 Segment Name
Nabtesco Automotive Corporation Yamagata Plant (Murayama City, Yamagata) 2 other business sites
Transport Solutions
NABCO SYSTEM CO., LTD. (Chiyoda-ku, Tokyo) 4 other companies
Accessibilit y Solutions
NABCO DOOR Ltd. Head Office (Kita-ku, Osaka) 24 other business sites
Accessibilit y Solutions
Details of facilities Production facilities for brake systems and others in automobiles Head Office with sales facilities and rental real estate Head Office and sales facilities
Book value (Million yen) Buildings Machinery Land Right-ofand and (Area m2) use assets structures equipment
641
2,938
251
14,332
1,107
454
745 (43,957)
-
1,896
113
595 (36,433)
2,770
494
22
1,759 (4,133)
628
66
2,969
463
944 (35,639)
219
134
2,500
328
29 (43,495)
1
858
8,167
288
(3) Foreign subsidiaries
Nabtesco (China) Precision Equipment Co., Ltd. Head Office and Plant (Jiangsu Province, China) Changzhou Nabtesco Precision Machinery Co., Ltd. Head Office and Plant (Jiangsu Province, China) Nabtesco Power Control (Thailand) Co., Ltd. Head Office and Plant (Chonburi, Thailand) Note 3 Shanghai Nabtesco Hydraulic Co., Ltd. Head Office and Plant (Shanghai, China) Note 3
Total
1,097
PACRAFT Co., Ltd. Production facilities for Iwakuni Plant Others 888 314 packaging (Iwakuni City, Yamaguchi) 6 other business sites machines Comtesco Corporation Production Headquaters Component facilities for (Tarui-cho, Huwa-gun, Gifu) 5,459 1,820 Solutions hydraulic 2 other business sites equipment Note 4 (NOTE) 1 The carrying amount is based on IFRS. 2 Other includes tools, furniture and fixtures, and construction in progress. 3 The amount is included investment property of ¥8,398 million. 4 Classified as discontinued operation
Site name (Location)
Others
Number of employees (person)
8,956
Note3
As of December 31, 2025 Segment Name
Book value (Million yen) Details of facilities Buildings and structures
Machinery and equipment
Land Right-of-use assets (Area m2)
Others
Number of Total employees (person)
Component Solutions
Production facilities for precision reduction gears
1,439
1,076
-
308
84 2,907
132
Component Solutions
Production facilities for reduction gears
-
1,079
-
-
16 1,095
135
Component Solutions
Production facilities for hydraulic equipment
128
197
552 (47,988)
11
71
960
93
Component Solutions
Production facilities for hydraulic equipment
664
1,201
-
75
196 2,136
265
460 (26,271)
4,711
265 6,940
1,464
Production facilities for Accessibility automatic doors 1,027 476 Solutions for buildings and others (NOTE) 1 The carrying amount is based on IFRS. 2 Other includes tools, furniture and fixtures, and construction in progress. 3. Classified as discontinued operation Gilgen Door Systems AG (Bern, Switzerland) 8 other companies
―52―
(Translation) This document has been translated from the Japanese original for the convenience of overseas stakeholders. In the event of any discrepancy between this document and the Japanese original, the original shall prevail.
3 [Plans for new construction, retirement, etc.] (1) Construction of major facilities The Group’s capital investment plans take into account a comprehensive range of factors, including demand forecasts, production plans, and the ratio of investment to profit plans. Capital investment plans are formulated individually by the Company and each of our consolidated subsidiaries in principle, but the Production Innovation Division plays a central role in coordinating these plans so that the entire Group does not have overlapping investments. The capital expenditure plan for the year ending December 31, 2026 (new construction and expansion) will be ¥12,500 million, and the breakdown by segment is as follows.
Segment name
Planned amount (Million yen)
Component Solutions
2,300
Transport Solutions
5,600
Accessibility Solutions
3,100
Others
500
Headquarters and common Total
1,000
Major contents and purpose of facilities Renewal of facility and environmental investments in precision reduction gears Investment for development and capacity increase in Marine vessel equipment, renewal of facility and productivity improvement in Railroad vehicle equipment and Aircraft equipment, new product development and renewal of facility in Commercial vehicle equipment, etc. R&D and renewal of equipment in Automatic Door, etc. Renewal of facility and productivity improvement in Packaging machines, etc. Increasing the production capacity of packaging machines and conducting R&D , etc. Information management systems and building a nextgeneration IT platform, etc.
12,500
-
Fund procurement Methods Own funds
Own funds
Own funds
Own funds
Own funds -
(2) Disposal of major facilities With the exception of removal and sales for recurring equipment renewals, there are no plans for remove or sell any significant equipment.
―53―
(Translation) This document has been translated from the Japanese original for the convenience of overseas stakeholders. In the event of any discrepancy between this document and the Japanese original, the original shall prevail.
No.4 【Status of the Company Submitting the Report】 1
【Status of Shares】 (1) 【Total Number of Shares】 ① 【Total number of shares】 Type
Total number of authorized shares
Common stock
400,000,000
Total
400,000,000
② 【Shares outstanding】
Type
Number of shares Number of shares outstanding (shares) outstanding (shares) as Name of stock exchange As of December 31, of the date of filing listings 2025 (March 25, 2026)
Content
Common shares
118,064,699
118,064,699
Tokyo Stock Exchange Prime section
The number of shares per unit is 100 shares.
Total
118,064,699
118,064,699
-
-
(NOTE) The "Number of shares outstanding as of the filing date" column does not include the number of shares issued upon the exercise of stock acquisition rights to shares from March 1, 2026 to the filing date of this Annual Securities Report.
―54―
(Translation) This document has been translated from the Japanese original for the convenience of overseas stakeholders. In the event of any discrepancy between this document and the Japanese original, the original shall prevail.
(2) 【Status of Stock Acquisition Rights】 ① 【Details of stock option plan】 As of the end of the fiscal year (December 31, 2025)
As of the end of the previous month of the filing date (February 28, 2026)
July 31, 2015
Same as left
8 directors and 11 executive officers
Same as left
Number of stock options (unit)
10
Same as left
Class of shares for stock options
Common shares
Same as left
Number of shares for stock options
1,000 (Note) 1
Same as left
Payment on exercise price of stock options (Yen)
1 per share
Same as left
Date of resolution Classification and number of grantees
From August 21, 2015 to August 20, 2040 Issue price for shares upon exercise of stock options Issue price 2,420 and appropriation to capital (Yen) Amount incorporated into capital 1,210 Period for exercising stock options
Conditions for exercising the new stock options Items related to transfer of stock options
Same as left Same as left
(NOTE) 2
Same as left
Transfer of share options shall require the approval of the board of directors.
Same as left
Matters concerning the delivery of the stock options (NOTE) 3 Same as left in connection with the organizational restructuring (NOTE) 1 The number of shares subject to the stock options; The number of shares subject to each stock options (hereinafter referred to as the "number of granted shares") shall be 100 shares. Provided, however, that in the event that we effect a share split or reverse share split after the Allotment Date, the number of granted shares shall be adjusted according to the following formula: Number of shares granted after adjustment = Number of shares granted before adjustment × Ratio of stock split and reverse stock split Such adjustment shall be made with respect to the number of shares subject to the stock acquisition rights that have not been exercised at that time, and any fraction less than 1 share resulting from the above adjustment shall be discarded. In addition to the above, in the event that we effect a merger, a company split, or a share exchange, or in any other event that requires an adjustment to the number of granted shares in accordance with such circumstances, we shall be entitled to make an adjustment to the number of granted shares as deemed necessary by the Board of Directors to the extent reasonable. 2 Conditions for exercising the new stock options ①A holder of the rights to subscribe for new shares may exercise the rights only within 10 days (if the tenth day falls on a holiday, then no later than the next business day) from the day following the day on which the holder of the rights to subscribe for new shares has lost the position of both the directors and the executive officers of the Company. ②The exercise of stock options shall be effected by collectively exercising all of the number of stock options allotted. ③In the event of the death of a holder of stock options who has been allotted, only one of the direct legal heirs of such holder of stock options may inherit the rights of such holder of stock options. ④Other conditions shall be as set forth in the "Stock Option Allotment Agreement" concluded between the Company and holders of stock options by resolution of the Board of Directors of the Company with respect to the issuance of stock options. 3 Matters concerning the delivery of the stock options in connection with the organizational restructuring In the event of a merger (limited to the case where we cease to exist due to a merger), an absorption-type demerger or an incorporation-type demerger (limited to the case where each of us becomes a split company), or a share exchange or a share transfer (limited to the case where each of us becomes a wholly-owned subsidiary) (hereinafter collectively referred to as "organizational restructuring"), the share warrants of the corporation (hereinafter referred to as "the restructured corporation") as set forth in Article 236, Paragraph 1, Item 8 (a) to (e) inclusive of the Companies Act shall be delivered to the holder of the share warrants who holds the share warrants which remain immediately before the effective date of the organizational restructuring. ①Type of stock of the Company to be restructured to be subject to the stock options The type of stock shall be common stock of the Company to be restructured. ②Number of restructured companies subject to stock options Decisions shall be made in accordance with (NOTE) 1 above after taking into consideration the conditions of the organizational restructuring. ③Assets to be contributed at the time of exercise of the rights The value of assets to be contributed upon the exercise of each of the stock options to be delivered shall be the amount obtained by multiplying the exercise price after the realignment stipulated below by the number of shares of the restructured company subject to each of such stock options to be determined in accordance with ② above. The exercise price after the reorganization shall be one yen per share of the restructured company's shares that can be delivered by exercising each stock acquisition right to be delivered. ④Exercise period for the rights The period from the date of commencement of the period during which the stock options may be exercised or the effective date of the organizational restructuring, whichever is later, until the expiration date of the period during which the stock options may be exercised. ⑤Restriction on acquisition of stock options by transfer Acquisition of the rights to subscribe for new shares by transfer shall require approval by a resolution of the Board of Directors of the Company to be restructured.
―55―
(Translation) This document has been translated from the Japanese original for the convenience of overseas stakeholders. In the event of any discrepancy between this document and the Japanese original, the original shall prevail.
As of the end of the fiscal year (December 31, 2025)
As of the end of the previous month of the filing date (February 28, 2026)
April 28, 2016
Same as left
7 directors and 12 executive officer
Same as left
Number of stock options (unit)
36
18
Class of shares for stock options
Common shares
Same as left
Number of shares for stock options
3,600 (Note 1)
1,800(Note 1)
1 per share
Same as left
From May 21, 2016 to May 20, 2041 Issue price 2,564 Amount incorporated into capital 1,282
Same as left
Date of resolution Classification and number of grantees
Payment on exercise price of stock options (Yen) Period for exercising stock options Issue price for shares upon exercise of stock options and appropriation to capital (Yen)
(NOTE) 2
Same as left
Transfer of share options shall require the approval of the board of directors.
Same as left
Conditions for exercising the new stock options Items related to transfer of stock options
Same as left
Same as left Matters concerning the delivery of the stock options (NOTE) 3 in connection with the organizational restructuring (NOTE) 1 The number of shares subject to the stock options; The number of shares subject to each stock options (hereinafter referred to as the "number of granted shares") shall be 100 shares. Provided, however, that in the event that we effect a share split or reverse share split after the Allotment Date, the number of granted shares shall be adjusted according to the following formula: Number of shares granted after adjustment = Number of shares granted before adjustment × Ratio of stock split and reverse stock split Such adjustment shall be made with respect to the number of shares subject to the stock acquisition rights that have not been exercised at that time, and any fraction less than 1 share resulting from the above adjustment shall be discarded. In addition to the above, in the event that we effect a merger, a company split, or a share exchange, or in any other event that requires an adjustment to the number of granted shares in accordance with such circumstances, we shall be entitled to make an adjustment to the number of granted shares as deemed necessary by the Board of Directors to the extent reasonable. 2 Conditions for exercising the new stock options ①A holder of the rights to subscribe for new shares may exercise the rights only within 10 days (if the tenth day falls on a holiday, then no later than the next business day) from the day following the day on which the holder of the rights to subscribe for new shares has lost the position of both the directors and the executive officers of the Company. ②The exercise of stock options shall be effected by collectively exercising all of the number of stock options allotted. ③In the event of the death of a holder of stock options who has been allotted, only one of the direct legal heirs of such holder of stock options may inherit the rights of such holder of stock options. ④Other conditions shall be as set forth in the "Stock Option Allotment Agreement" concluded between the Company and holders of stock options by resolution of the Board of Directors of the Company with respect to the issuance of stock options. 3 Matters concerning the delivery of the stock options in connection with the organizational restructuring In the event of a merger (limited to the case where we cease to exist due to a merger), an absorption-type demerger or an incorporation-type demerger (limited to the case where each of us becomes a split company), or a share exchange or a share transfer (limited to the case where each of us becomes a wholly-owned subsidiary) (hereinafter collectively referred to as "organizational restructuring"), the share warrants of the corporation (hereinafter referred to as "the restructured corporation") as set forth in Article 236, Paragraph 1, Item 8 (a) to (e) inclusive of the Companies Act shall be delivered to the holder of the share warrants who holds the share warrants which remain immediately before the effective date of the organizational restructuring. ①Type of stock of the Company to be restructured to be subject to the stock options The type of stock shall be common stock of the Company to be restructured. ②Number of restructured companies subject to stock options Decisions shall be made in accordance with (NOTE) 1 above after taking into consideration the conditions of the organizational restructuring. ③Assets to be contributed at the time of exercise of the rights The value of assets to be contributed upon the exercise of each of the stock options to be delivered shall be the amount obtained by multiplying the exercise price after the realignment stipulated below by the number of shares of the restructured company subject to each of such stock options to be determined in accordance with ② above. The exercise price after the reorganization shall be one yen per share of the restructured company's shares that can be delivered by exercising each stock acquisition right to be delivered. ④Exercise period for the rights The period from the date of commencement of the period during which the stock options may be exercised or the effective date of the organizational restructuring, whichever is later, until the expiration date of the period during which the stock options may be exercised. ⑤Restriction on acquisition of stock options by transfer Acquisition of the rights to subscribe for new shares by transfer shall require approval by a resolution of the Board of Directors of the Company to be restructured.
―56―
(Translation) This document has been translated from the Japanese original for the convenience of overseas stakeholders. In the event of any discrepancy between this document and the Japanese original, the original shall prevail.
② 【Details of rights plan】 Not applicable.
③ 【Status of other stock acquisition rights】 Not applicable.
(3) 【Status of Exercise of Bonds with Stock Acquisition Rights with Exercise Price Adjustment, etc.】 Not applicable.
(4) 【Changes in the number of issued shares, capital stock, etc.】 Date July 15, 2021 (Note) December 10, 2025 (Note)
Number of shares Number of shares Change in outstanding outstanding as the capital increase/decrease end of therm. (Million yen) -4,069,700
-2,999,400
Balance of Change in legal Balance of legal capital capital surplus capital surplus (Million yen) (Million yen) (Million yen)
121,064,099
-
10,000
-
26,274
118,064,699
-
10,000
-
26,274
(NOTE) Decrease in shares due to cancellation of treasury stock. (5) 【Breakdown of Shareholders】 As of December 31, 2025 Status of Shares (100 shares per unit) GovernOverseas investors Classification ment/Local Financial Securities Other Individuals Total Noncorporations public institution firms Individuals, and others individuals entity Number of 2 51 52 309 361 77 23,377 24,229 shareholders Number of shares held 13 362,144 55,540 131,342 488,072 347 141,844 1,179,302 (Unit) Percentage of number of 0.00 30.71 4.71 11.14 41.39 0.03 12.03 100.00 shares held (%)
Less than one unit Status of Shares - 134,499
-
(NOTE) 1 Treasury stock of 421,264 shares is included in "Individuals and others" and 4,212 units and 64 shares are included in "Shares less than one unit." 2 "Financial Institutions" includes 4,589 shares held by Japan Custody Bank, Ltd. (Trust Account E) as trust assets for the "Stock Benefit Trust (BBT=Board Benefit Trust)" (hereinafter referred to as "Stock Benefit Trust (BBT)") system, and 12 shares in "Shares of less than 1 unit." 3 "Other corporations" includes 60 units of shares in the name of the Japan Securities Depository Center, Inc.
―57―
(Translation) This document has been translated from the Japanese original for the convenience of overseas stakeholders. In the event of any discrepancy between this document and the Japanese original, the original shall prevail.
(6) 【Major Shareholders】
Shareholders
Address
As of December 31, 2025 Shareholding ratio to number of Number of shares outstanding Shares Held (excluding (thousands) treasury stock) (%)
The Master Trust Bank of Japan (Trust Account)
8-1 Akasaka 1-chome, Minato-ku, Tokyo AKASAKA INTERCITY AIR
19,855
16.88
Custody Bank of Japan (Trust Account)
8-12, Harumi 1-chome, Chuo-ku, Tokyo
11,210
9.53
Central Japan Railway Company
1-4, Meieki 1-chome, Nakamura-ku, Nagoya-shi, Aichi
5,171
4.40
FANUC CORPORATION
3580 Shibokusa, Oshino-mura, Minamitsurugun, Yamanashi
3,760
3.20
BBH (LUX) FOR FIDELITY FUNDSGLOBAL TECHNOLOGY POOL
2A RUE ALBERT BORSCHETTE LUXEMBOURG L-1246
3,556
3.02
3,501
2.98
2,806
2.39
2,579
2.19
2,049
1.74
1,676
1.42
56,163
47.74
(Standing agent) MUFG Bank, Ltd.
4-5, Marunouchi 1-chome, Chiyoda-ku, Tokyo
BNYM AS AGT/CLTS NON TREATY JASDEC
240 GREENWICH STREET, NEW YORK, NEW YORK 10286 U.S.A.
(Standing agent) MUFG Bank, Ltd.
4-5, Marunouchi 1-chome, Chiyoda-ku, Tokyo
BNYM AS AGT/CLTS 10 PERCENT (Standing agent) MUFG Bank, Ltd. BNYMSANV AS AGENT/CLIENTS LUX UCITS NON TREATY 1 (Standing agent) MUFG Bank, Ltd.
240 GREENWICH STREET, NEW YORK, NEW YORK 10286 U.S.A. 4-5 Marunouchi 1-chome, Chiyoda-ku, Tokyo VERTIGO BUILDING-POLARIS 2-4 RUE EUGENE RUPPERT L-2453 LUXEMBOURG GRAND DUCHY OF LUXEMBOURG 4-5, Marunouchi 1-chome, Chiyoda-ku, Tokyo
GOLDMAN SACHS INTERNATIONAL (Standing agent) Goldman Sachs Securities Co., Ltd. STATE STREET BANK WEST CLIENTTREATY 505103 (Standing agent) Mizuho Bank, Ltd. Total
PLUMTREE COURT, 25 SHOE LANE, LONDON EC4A 4AU, U.K. 6-1, Toranomon 2-chome, Minato-ku, Tokyo, Toranomon Hills Station Tower ONE CONGRESS STREET, SUITE 1, BOSTON, MASSACHUSETTS 15-1, Konan 2-chome, Minato-ku, Tokyo Shinagawa Intercity Tower A -
(NOTE) 1 Number of shares held is rounded to the nearest thousand. 2 The following corporation submitted a report on the change of 6,554,000 shares by four companies on November 10, 2025. However, as the number of shares beneficially owned in the name of the said corporation cannot be confirmed as of December 31, 2025, it is not included in the above "Status of Major Shareholders."
- Nomura Securities Co.,Ltd.
- NOMURA SECURITIES INTERNATIONAL, Inc.
- Nomura Asset Management Co., Ltd. 3 The following corporation submitted a report on the change of 4,682,000 shares by following company on November 6,
- However, as the number of shares beneficially owned in the name of the said corporation cannot be confirmed as of December 31, 2025, it is not included in the above "Status of Major Shareholders."
- Eastspring Investments.
―58―
(Translation) This document has been translated from the Japanese original for the convenience of overseas stakeholders. In the event of any discrepancy between this document and the Japanese original, the original shall prevail.
(7) 【Status of voting rights】 ① 【Shares outstanding】 As of December 31, 2025 Classification
Number of shares
Number of voting rights
Content
-
-
-
-
-
-
-
-
-
Non-voting stock Shares with restricted voting rights (Treasury stocks) Shares with restricted voting rights (other) Shares with full voting (treasury stock, etc.)
rights
Shares with full voting rights (other) Shares less than one unit
(Treasury stock held) Common shares 421,200 4 (Mutually Held Shares) Common shares 15,000 Common shares 117,494,000 Common shares 134,499
Number of shares outstanding
- - - 1,174,940
118,064,699
Voting rights of all shareholders
-
-
Shares less than one unit (100 shares)
-
- 1,174,940
-
-
(NOTE) 1 Common shares in the "Shares less than 1 unit" column include 64 shares of treasury stock owned by the Company and 12 shares of our stock owned by Japan Custody Bank, Ltd. (Trust Account E) as trust assets under the "Stock Benefit Trust (BBT)" plan. 2 "Shares with full voting rights (other)" column includes 6,000 shares (60 voting rights) in the name of the Japan Securities Depository Center, Inc. and 458,900 shares (4,589voting rights) of ours owned by the Japan Custody Bank, Ltd. (Trust Account E) as trust assets for the "Stock Benefit Trust (BBT)" plan. The 4,589 voting rights are not exercised. ② 【Treasury stock】
Number of treasury stock
Owner's name
Address of the holder
(Treasury stock held) Nabtesco Corporation (Mutually Held Shares) Kyokko Denki Co., Ltd.
7-9, Hirakawacho 2-chome, Chiyoda-ku, Tokyo 2-4 Aratacho 1-chome, Hyogo-ku, Kobe-shi, Hyogo
計
-
As of December 31, 2025 Ratio of shares Number of Total number of held to total shares held in shares to be number of the name of own shares others outstanding (%)
421,200
-
421,200
0.36
15,000
-
15,000
0.01
436,200
-
436,200
0.37
(NOTE) The above numbers of shares held do not include 458,900 shares of our company owned by Japan Custody Bank, Ltd. (Trust Account E) as trust assets under the "Stock Benefit Trust (BBT)" plan.
―59―
(Translation) This document has been translated from the Japanese original for the convenience of overseas stakeholders. In the event of any discrepancy between this document and the Japanese original, the original shall prevail.
(8) 【Details of executive and employee stock ownership plans】 ① Outline of Directors' and Employees' Stock Ownership Plan We have introduced a Stock Benefit Trust (BBT, hereinafter referred to as "Plan") as a stock-based compensation plan for our directors and executive officers (excluding outside directors, hereinafter referred to as "Directors, etc."). Under this system, shares of the Company are acquired through a trust (hereinafter referred to as the "Trust") using money to be contributed by the Company. Under this system, shares of the Company are awarded points (hereinafter referred to as "Share Grant Points") each year according to position, performance, etc. based on the Directors' Share Benefit Regulations established by the Company, and cash equivalent to the amount of the Company's shares and the liquidation proceeds of the Company's Shares (hereinafter referred to as "Shares of the Company") is awarded or benefits through the Trust (hereinafter referred to as "Grant Points") according to the number of such Share Grant Points at a predetermined time. The grants under this system include "grants at the time of service" in which points are awarded to directors in conjunction with the degree of achievement of the medium-term management plan, and "grants at the time of service" in which shares are awarded to directors, etc. at a certain time during their service, and "grants at the time of retirement" in which points are awarded to directors, etc. at the time of retirement. ②Total number of shares to be acquired by directors, etc. 458,912 shares ③ Scope of persons entitled to receive beneficial interest or other rights under the said officer's and employee's stock ownership plan Directors, etc. who satisfy the requirements for beneficiaries set forth in the Regulations Governing the Transfer of Shares by Directors
―60―
(Translation) This document has been translated from the Japanese original for the convenience of overseas stakeholders. In the event of any discrepancy between this document and the Japanese original, the original shall prevail.
2 【Status of acquisition of treasury stock】 【Class of Share】
Acquisition of common shares pursuant to Item 3 and 7, Article 155 of the Companies Act
(1) 【Status of Acquisition by Resolution at the General Meeting of Shareholders】 Not applicable (2) 【Status of acquisition by resolution of the Board of Directors】 Classification
Number of shares
Status of resolutions at the Board of Directors meeting (July 31, 2025) (Period of acquired from August 1, 2025 to December 30 2025)
4,000,000
10,000,000,000
-
-
2,999,400
9,999,816,100
1,000,600
183,900
25.0
0.0
-
-
25.0
0.0
Treasury stock acquired before the current fiscal year Treasury stock acquired in the current fiscal year Total number and total amount of shares underlying outstanding resolutions Percentage unexercised as of the end of the current fiscal year (%)
Total value (yen)
Treasury stock acquired during the period Percentage unexercised as of the filing date (%)
(3) 【Details of items that are not based on a resolution of the shareholders' meeting or a resolution of the Board of Directors】 Classification
Number of shares
Total value (yen)
Treasury stock acquired in the current fiscal year
400
1,093,983
Treasury stock acquired during the period
156
658,964
(NOTE) Shares of less than one unit purchased from March 1, 2026 to the filing date of the Annual Securities Report are not included in the repurchased shares during the period under review (4) 【Disposal and holding of treasury stock acquired】
Classification Acquired treasury stock offered to subscribers Acquired treasury stock disposed of by retirement Acquired treasury stock transferred in connection with the merger, share exchange, share issuance, and company split Others (Note 2,3) Number of treasury stock held (Note 4)
Current fiscal year Number of shares
Current term
Total value disposed Total value disposed Number of shares (Yen) (Yen)
-
-
-
-
2,999,400
10,426,844,214
-
-
-
-
-
-
1,800
8,085,042
1,800
6,257,412
421,264
-
419,620
-
(NOTE) 1 The number of treasury stocks held during the current period does not include the number of treasury stocks purchased and disposed of from March 1, 2026 to the filing date of the Annual Securities Report. 2 The breakdown for the current fiscal year is due to the disposition by the exercise of stock options. 3 The breakdown for the current term is due to the disposition by the exercise of stock options. 4. 458,912 shares of our company owned by Japan Custody Bank, Ltd. (Trust Account E) as trust assets under the "Stock Benefit Trust (BBT)" plan are not included in the above-mentioned treasury stock holdings.
―61―
(Translation) This document has been translated from the Japanese original for the convenience of overseas stakeholders. In the event of any discrepancy between this document and the Japanese original, the original shall prevail.
3 【Dividend Policy】 With respect to shareholder returns during the three-year Medium-Term Management Plan period starting in FY2025, the Company’s policy is to provide stable dividends with a target DOE (Dividend on Equity attributable to owners of the parent) of approximately 3.5%, together with flexible share repurchases. Based on this policy, the Company will implement a stable dividend policy that is not affected by short-term profit fluctuations resulting from rapid changes in the business environment. In accordance with the above policy, the Company plans to pay a year-end dividend of ¥40 per share for the current fiscal year. As a result, the annual dividend is expected to total ¥80 per share, including the interim dividend of ¥40 per share. The year-end dividend of ¥40 per share is subject to approval at the Annual General Meeting of Shareholders scheduled to be held on March 26, 2026. For the next fiscal year, the Company plans an annual dividend of ¥82 per share (an interim dividend of ¥41 per share and a year-end dividend of ¥41 per share). Dividends are scheduled to be paid twice a year, with record dates of June 30 and December 31. The Company’s Articles of Incorporation provide that interim dividends may be paid in accordance with Article 454, paragraph 5 of the Companies Act. (NOTE) Dividends of retained earnings with record dates in the current fiscal year are as follows: Total dividends Dividends per share Date of resolution (Million yen) (Yen) July 31, 2025 4,826 40 Board of Directors March 26, 2026 Annual Shareholders' 4,706 40 Meeting (Plan)
―62―
(Translation) This document has been translated from the Japanese original for the convenience of overseas stakeholders. In the event of any discrepancy between this document and the Japanese original, the original shall prevail.
4 【Status of Corporate Governance】 (1) 【Overview of Corporate Governance】 ① Basic Approach to Corporate Governance On the basis of our corporate philosophy of “providing safety, comfort and a sense of security in daily lives as well as any form of transportation with our unique motion control technology,” the Nabtesco Group will endeavor to strengthen its corporate governance by practicing the Nabtesco Way, in order to achieve sustained growth of the group, enhance corporate value over the medium and long term and earn greater trust from our stakeholders. We have developed the “Nabtesco Corporate Governance Basic Policy” by taking fully into account the intent and spirit of the Corporate Governance Code prescribed by Tokyo Stock Exchange, Inc. ② Overview of Corporate Governance Structure Our business operations are conducted based on the executive officer system and in-house company system, and we have established the Board of Directors, Executive Officers, Audit & Supervisory Board Members, Accounting Auditors, and the Management Committee to deliberate on important matters related to the execution of business operations. The Management Committee clearly distinguishes the functions of management decision-making, supervision, execution and management oversight.
- Basic Explanation of the Company's Organization [Board of Directors] The Board of Directors formulates the Group’s basic policies and strategies, makes decisions about the execution of important business matters and supervises the way business is carried out. It shall be composed of up to ten Directors, with at least onethird of them being independent outside directors. The number of members of the Board of Directors is limited to 10, of which at least one-third are independent outside directors. As of the date of submission, the Board of Directors consisted of 9 members, including five independent outside directors. The Board of Directors received reports on our basic management policy, matters related to important business execution, resolutions on matters stipulated in laws and the Articles of Incorporation, and the status of the execution of important business. In principle, the Board of Directors meets once a month, and 18 meetings were held in FY2025. Attendance by individual directors in the current fiscal year is as follows. Attendance/number of meetings (Note 1)
Name, etc Representative Director
Director
Outside Directors
Kazumasa Kimura
18 times /18 times
Seiji Takahashi
18 times /18 times
Atsushi Habe (Note 3)
4 times /4 times
Kiyoshi Ando
18 times /18 times
Hiroshi Usui (Note 2)
14 times /14 times
Toshiya Fujiwara (Note 3)
4 times /4 times
Mari Iizuka
17 times /18 times
Naoko Mizukoshi
18 times /18 times
Naoki Hidaka
18 times /18 times
Toshiya Takahata
18 times /18 times
Seiichiro Shirahata
17 times /18 times
(NOTE)1 Figures are based on the number of meetings held during the period of service. 2 Appointed on March 26, 2025. 3 Retired on March 26, 2025.
[Executive Officers Committee] A body devoted to the execution of business pursuant to the policies and strategies of the Board of Directors and under the supervision of the Board. The current Executive Officers’ Committee is composed of 24 Executive Officers.
―63―
(Translation) This document has been translated from the Japanese original for the convenience of overseas stakeholders. In the event of any discrepancy between this document and the Japanese original, the original shall prevail.
[Audit & Supervisory Board] The Audit & Supervisory Board audits the execution of duties of the Board of Directors and prepares Audit Reports. As a way of strengthening audit functions of the Group in line with the reinforcement of the Group management, the Audit & Supervisory Board has strengthened its audit system by establishing the Group Audit & Supervisory Board, membership of which includes the Audit & Supervisory Board Members of the Group companies. The Audit & Supervisory Board shall be composed of five or less Audit & Supervisory Board Members, of whom half or more of the members shall be Audit & Supervisory Board Members (Independent). The current Audit & Supervisory Board is composed of five members including three Audit & Supervisory Board Members (Independent). [Management Committee] In line with the policies decided by the Board of Directors, the Management Committee serves as the body that discusses important matters relating to execution of the Group’s business and reports on results and the execution of business. It is composed of the President (CEO), the Presidents of the in-house companies, Executive Officers of Corporate Headquarters, and Senior General Managers, etc. [Nomination Committee] The Company established the Nominating Committee as a consultative body of the Board of Directors to deliberate on the nomination of candidates for Director, Audit & Supervisory Board Member, President (CEO) and Representative Director positions as well as a successor plan for the new President (CEO), etc., and to report the results to the Board of Directors. The Nominating Committee is composed of five or fewer members, including one internal director and three or more independent outside directors. As of the date of submission, there were five independent outside directors, including four outside directors, as follows: Chairperson: Mari Iizuka (Outside Director) Member: Naoko Mizukoshi (Outside Director), Naoki Hidaka (Outside Director), Tetsuro Hirai (Outside Audit & Supervisory Board Member), Kazumasa Kimura (Representative director) In the fiscal year under review, we held three meetings of the Nominating Committee, which mainly deliberated on the appointment of executive officers and director candidates in FY2025, and reported to the Board of Directors. Attendance by individual members is as follows. Attendance/number of meetings (Note)
Name, etc Representative director
Kazumasa Kimura
3 times/3 times
Outside Director
Mari Iizuka(Chairperson)
3 times/3 times
Naoko Mizukoshi
2 times/3 times
Naoki Hidaka
3 times/3 times
Tetsuro Hirai
3 times/3 times
Audit & Supervisory Board Membe (independent)
(NOTE)
Numbers are based on the number of meetings held during the period of service.
[Remuneration Committee] The Remuneration Committee, as a consultative body of the Board of Directors, deliberates on remuneration of the management team, etc. and reports the results to the Board of Directors The Remuneration Committee is composed of five or fewer members, including 1 internal director and three or more independent outside directors. As of the date of submission, there were five independent outside directors, including four outside directors, as follows: Chairperson Naoko Mizukoshi (Outside Director) Member: Mari Iizuka (Outside Director), Toshiya Takahata (Outside Director), Masatoshi Hitomi (Outside Audit & Supervisory Board Member), Kazumasa Kimura (Representative director) In the fiscal year under review, we held two meetings of the Compensation Committee to discuss and report to the Board of Directors on the remuneration of directors in FY2025 based on the perspectives of the remuneration system and the concept of performance-linked remuneration as indicators. Attendance by individual members is as follows. Attendance/number of meetings (Note)
Name, etc Representative director
Kazumasa Kimura
2 times/2 times
Outside Director
Mari Iizuka
2 times/2 times
Naoko (Chairperson) Audit & Supervisory Board Membe (independent)
(NOTE)
Mizukoshi
2 times/2 times
Toshiya Takahata
2 times/2 times
Masatoshi Hitomi
2 times/2 times
Numbers are based on the number of meetings held during the period of service.
―64―
(Translation) This document has been translated from the Japanese original for the convenience of overseas stakeholders. In the event of any discrepancy between this document and the Japanese original, the original shall prevail.
[Compliance Committee] The Compliance Committee as a consultative body of the Board of Directors establishes and revises the “Nabtesco Group Code of Ethics” and deliberates priority challenges concerning the Group’s compliance system, and reports the results to the Board of Directors. The Compliance Committee is composed of members including independent outside directors and outside experts. As of the date of filing, the composition of the Compliance Committee is as follows: Chairperson: Kazumasa Kimura (Representative director) Member: Seiji Takahashi, Hiroshi Usui, Tomoaki Shiramizu, Tomohiro Kiriyama, Yasuhiro Tanabe (Outside Audit & Supervisory Board Member), Makoto Matsuo (Partner of MOMO-O, MATSUO & NAMBA) [Business Auditing Department (10 members)] The Business Auditing Department conducts internal business audits of Corporate Headquarters, internal companies and Group companies. 2) Corporate Governance Related Diagram
- Current Status of Internal Control System Based on its Basic Polices for the Construction of an Internal Control System, Nabtesco is working to enhance all the areas associated with internal control such as increased efficiency of management, compliance, information management, risk management and collaboration with the Audit & Supervisory Board Members under consistent principles, and integrate them to construct an internal control system. Outline of the Basic Policy for Establishing an Internal Control System Internal control for the Nabtesco Group shall be based on making The Nabtesco Way and the Nabtesco Group Code of Ethics cornerstones of proper and fair business activities, and requiring the Group’s directors, Audit & Supervisory Board Members and employees to comply with these norms and rules. The Chief Executive Officer (CEO) shall be the top executive responsible for the promotion of internal control. The Board of Directors shall examine the maintenance of internal control systems on a continual basis in line with changes in the business environment and social needs, revisions to laws and regulations, risk diversification and other factors, and shall conduct a review yearly and whenever else necessary.
―65―
(Translation) This document has been translated from the Japanese original for the convenience of overseas stakeholders. In the event of any discrepancy between this document and the Japanese original, the original shall prevail.
- Corporate Ethics on the practice and thorough implementation We have established the Nabtesco Group Code of Ethics in order to ensure that the entire Group will behave in a manner rooted in a higher sense of ethics, and we are working to practice and thorough implement corporate ethics. In addition, the Legal and Compliance Department, which is dedicated to compliance, promotes activities aimed not only at complying with laws and regulations, but also at establishing a higher standard of corporate ethics with the aim of enhancing the Group's corporate value over the medium to long term. In addition, we have established the Corporate Ethics Hotline and the Corporate Auditor Hotline to prevent and detect misconduct caused by violations of laws or illegal activities in our Group. Through the collection of information that is not reported on the ordinary line of office and appropriate measures, we are improving the self-cleansing function of the organization and ensuring social trust. ③ Risk Management System We have systems in place to ensure that profits, losses, asset efficiency, quality and disasters, among other matters, are reported to the Board of Directors properly and in a timely manner with respect to the execution of duties. By leveraging these systems, we strive for the early identification of risks and the minimization of losses. In order to eliminate antisocial forces, the Nabtesco Group Code of Ethics stipulates that the Nabtesco Group should cease any relationship with antisocial forces, and should an unreasonable demand from an antisocial force arise, it should take a firm stance, and that it should not respond to such demands. The Nabtesco Group strives to strengthen relations by, for example, obtaining the latest information on antisocial forces and receiving advice through daily cooperation with the police and antiviolence organizations, etc. Committees organized to enhance corporate governance including risk management include the following: [Management Materiality Committee] Through the identification of management materiality in our group, the formulation of action plans for materiality, and the management of progress, we aim to realize our long-term vision and improve our social, environmental, and economic value from both financial and non-financial perspectives from a long-term perspective. [Quality and PL Committee] Quality control and PL (Product Liability of products within our Group: Product safety control related to product liability) The objective of this system is to maintain and improve quality and ensure safety by establishing organizational and management standards for preventing quality defects, including safety defects, and for responding appropriately in the event of quality defects or PL issues. The system also aims to ensure the reliability of customers and contribute to the development of management. [ESH Committee] (Environment, Safety & Health: ESH) In addition to complying with basic policies concerning environmental preservation, safety, disaster prevention, and health, as well as domestic and overseas laws and regulations related to all of our business activities, from research and development to production, distribution, and sales of products, we have established standards for items that should be managed companywide, with the aim of ensuring the environmental preservation of the local community, the safety and health of employees and those engaged in business activities together with employees, and coexisting with the global environment, and fulfilling our corporate social responsibilities. [Risk Management Committee] The aim is to maintain and strengthen our group's risk management system by identifying major risks in our group, discussing countermeasures against them, and monitoring the status of risk management related to such risks.
[Information Security Committee] The aim is to establish basic rules for cyber security in our group and to promote efforts to improve the level of cyber security, and to respond swiftly in the event of a serious incident. ④ Status of Development of Systems to Ensure the Appropriateness of the Operations of Subsidiaries of the Reporting Company In addition to clarifying responsibilities and authority related to business execution in the Group Responsibility and Authority Regulations, our Group endeavors to execute business appropriately and efficiently by establishing a division of duties among each division. In addition, we have dispatched our officers and employees to our group companies as directors or corporate auditors to create a system that enables us to regularly and continuously comprehend important matters of our group companies, reports on business execution, monthly financial statements, and other details of the management of our group companies.
―66―
(Translation) This document has been translated from the Japanese original for the convenience of overseas stakeholders. In the event of any discrepancy between this document and the Japanese original, the original shall prevail.
⑤ Outline of limited liability agreement As the Company stipulates in the Articles of Incorporation provisions to enable the conclusion of limited liability agreements with Outside Directors and Audit & Supervisory Board Members (Independent), a limited liability agreement has been concluded with Outside Directors Mari Iizuka, Naoko Mizukoshi, Naoki Hidaka, Toshiya Takahata, and Seiichiro Shirahata, and Audit & Supervisory Board Members (Independent) Tetsuro Hirai, Masatoshi Hitomi, and Yasuhiro Tanabe. The details of the agreement are as follows. • Liability for damages under the agreement will be limited to 10 million yen or the amount set forth by laws and regulations, whichever is higher. • The limitation of liability mentioned above applies only if the Outside Director or Audit & Supervisory Board Member (Independent) acts in good faith and without gross negligence when performing their duties. ⑥ Matters concerning Directors and Officers liability insurance contract The Company has a Directors and Officers liability insurance contract (management risk protection insurance contract) in effect, as stipulated in Article 430-3 of the Companies Act, covering all Directors, Audit & Supervisory Board Members and Executive Officers of the Company and all its subsidiaries. An overview of the said contract is as follows. • The contract covers the liability of the insured for legal dispute fees and compensation for damages, etc. arising from company lawsuits, third-party lawsuits, shareholder’s derivative suits, etc. • Damages, etc. arising from criminal acts, etc. by the insured are not covered as a measure to prevent the impairment of the appropriateness of execution of duties by the insured. • The Company is fully responsible for insurance fees under the said contract. ⑦ Number of directors The Articles of Incorporation stipulate that we have no more than 10 directors. ⑧ Selection of directors The Articles of Incorporation of the Company provide that the resolution for the election of directors at the general meeting of shareholders shall be made by a majority of the votes of shareholders present who hold one-third or more of the voting rights of shareholders who are entitled to exercise their voting rights and shall not be made by cumulative voting. ⑨ Items that can be resolved at the Board of Directors meeting
- Purchase of treasury stock Pursuant to Paragraph 2 of Article 165 of the Companies Act, the Company's Articles of Incorporation provide that it may acquire its own shares by resolution of the Board of Directors. This is aimed at executing a flexible capital policy.
- Interim dividend Pursuant to Article 454, Paragraph 5 of the Companies Act, the Company's Articles of Incorporation provide that interim dividends may be paid by resolution of the Board of Directors. This is intended to provide flexible returns to shareholders.
- Exemption of Directors and Corporate Auditors from Liability The Company's Articles of Incorporation provide that, in the event of bona fide conduct and no gross negligence, the liability of directors and corporate auditors may be exempted from such liability within the limit set by laws and regulations by a resolution of the Board of Directors pursuant to the provisions of Paragraph 1 of Article 426 of the Companies Act. This is aimed at enabling directors and corporate auditors to fully fulfill their expected roles. ⑩ Requirements for Special Resolution at Shareholders Meetings The Articles of Incorporation of the Company stipulate that the resolutions of general meetings of shareholders pursuant to the provisions of Article 309, Paragraph 2 of the Companies Act shall be adopted by two-thirds or more of the voting rights of shareholders present who hold one-third or more of the voting rights of shareholders who are entitled to exercise their voting rights. This is intended to facilitate the smooth operation of the General Meeting of Shareholders.
―67―
(Translation) This document has been translated from the Japanese original for the convenience of overseas stakeholders. In the event of any discrepancy between this document and the Japanese original, the original shall prevail.
(2) 【Directors and Audit & Supervisory Board Members】 ① Directors and Audit & Supervisory Board Members
- The status of the Company’s officers as of March 25, 2026 (the filing date of the Securities Report) is as follows. 12 male and 2 female within management (Female ratio in management: 14.3%) Position Name
Position Name Date of birth
Brief history
Term
Jun. 2011
Representative Director Kazumasa Chief Executive Kimura Officer
Aug. 17, 1961
Representative Director, Managing Executive Officer, General Seiji Administration, Takahashi Human Resources and Legal & Compliance
Feb. 12, 1966
(CEO)
General Manager, Manufacturing Department, Tsu Plant, Precision Equipment Company of Nabtesco Corporation Jun. 2012 General Manager, Manufacturing department, Tarui Plant, Power Control Company of Nabtesco Corporation Apr. 2015 Representative Director and Vice President of Hyest Corporation (merged into Nabtesco Corporation in Apr. 2016) Mar. 2016 General Manager, Production Management Department, Power Control Company of Nabtesco Corporation Mar. 2017 Executive Officer and President, Power Control Company of Nabtesco Corporation Jan. 2019 Executive Officer, Corporate Planning, Accounting & Finance, Note 3 Information System and Corporate Communication of Nabtesco Corporation Mar. 2019 Director of Nabtesco Corporation Jan. 2021 Managing Executive Officer, Component Solution Segment, Senior General Manager, Technology and R&D Division, and in charge of Production Innovation of Nabtesco Corporation Jan. 2022 Assistant to Chief Executive Officer of Nabtesco Corporation Mar. 2022 Representative Director (to present), President (to present), and Chief Executive Officer of Nabtesco Corporation (to present) Jun. 2010 General Manager, Human Resources Department of Nabtesco Corporation Jul. 2015 General Manager, Human Resources Department of Nabtesco Corporation and President of Nabtesco Link Co., Ltd Aug. 2017 General Manager, Human Resources Department, Business Transformation Division of Nabtesco Corporation and President of Nabtesco Link Co., Ltd Mar. 2018 Executive Officer of Nabtesco Corporation Jan. 2021 Vice President, Accessibility Innovations Company, and in Note 3 charge of Business Management of Nabtesco Corporation Jan. 2022 Vice President, Accessibility Innovations Company of Nabtesco Corporation Jan. 2023 Managing Executive Officer (to present), President, Accessibility Innovations Company of Nabtesco Corporation Mar. 2023 Director of Nabtesco Corporation
Jan. 2025
Number of shares of the Company held
8,763
4,121
General Administration, Human Resources and Legal & Compliance (to present)
Mar. 2025 Representative Director (to present) Apr. 2008 General Manager, Development Department, Precision Equipment Company of Nabtesco Corporation
Jun. 2015 Executive Officer of Nabtesco Corporation (to present) Feb. 2017 Technology and R&D Division, in charge of European business of Nabtesco Corporation
Apr. 2017 Technology and R&D Division, in charge of European
Director, Executive Officer of Nabtesco, Representative director and CEO of Comtesco Corporation
Kiyoshi Ando
Jan. 10, 1964
business, and General Manager, Advanced Mobility System Division of Nabtesco Corporation May 2017 Technology and R&D Division, in charge of European business, and General Manager of Advanced Mobility System Division of Nabtesco Corporation and President of Nabtesco Europe GmbH May 2018 Technology and R&D Division, in charge of European business, and General Manager, Advanced Mobility System Note 3 Division of Nabtesco Corporation Deputy Senior General Manager, Technology and R&D Jul. 2018 Division, in charge of Innovation, and General Manager, Advanced Mobility System Division of Nabtesco Corporation Jan. 2019 Deputy Senior General Manager, Technology and R&D Division, in charge of Innovation of Nabtesco Corporation Jan. 2020 Deputy Senior General Manager, Technology and R&D Division of Nabtesco Corporation Jan. 2021 President, Power Control Company of Nabtesco Corporation Mar. 2024 Director of Nabtesco Corporation (to present) Jan. 2025 Executive Officer, Component Solution Segment (to present) Aug. 2025 Representative director and CEO of Comtesco Corporation (to present)
―68―
8,430
(Translation) This document has been translated from the Japanese original for the convenience of overseas stakeholders. In the event of any discrepancy between this document and the Japanese original, the original shall prevail.
Position Name Director Managing Executive Officer, Corporate Planning, Accounting & Finance, Information Systems and Corporate Communication
Director
Position Name Date of birth
Brief history
Dec. 2009 General Manager, Engineering Department, Aerospace Company Apr. 2013
Hiroshi Usui
Apr. 22, 1965
Mar. 2017 Jan. 2020 Jan. 2023 Jan. 2025 Mar. 2025 Jan. 2026
Mari Iizuka
Mar. 29, 1959
Apr. 1982 Aug. 1987 Jul. 1992 Apr. 2005 Apr. 2007 Apr. 2008 Apr. 2010 Mar. 2020 Apr. 1995 Apr. 1998 Sep. 1999 Sep. 2002
Director
Naoko Mizukoshi
Sep. 23, 1967
Nov. 2006 Jan. 2008 Mar. 2010 Jun. 2018 Dec. 2018 Mar. 2020 Jun. 2021 Apr. 2025 Apr. 1976 Apr. 2001 Apr. 2007 Apr. 2009 Apr. 2012
Director
Naoki Hidaka
May 16, 1953
Jun. 2013 Apr. 2015 Jun. 2018 Jun. 2019 Jun. 2020 Mar. 2021 Jun. 2022 Jan. 2026 Apr. 1986 Apr. 2012 Jun. 2014 Jun. 2015 Jun. 2016
Director
Term
Toshiya Takahata
Nov. 19, 1963
Oct. 2018 Apr. 2019 Jun. 2019 Apr. 2020 Mar. 2022
of the Company General Manager, Planning Department, Aerospace Company of the Company President of Nabtesco Aerospace Inc Executive officer of the Company, General Manager, Planning Department, Aerospace Company of the Company Vice President, Aerospace Company, and Plant Manager, Gifu Note 3 Plant of the Company Corporate Planning, Accounting & Finance, Information Systems and Corporate Communication of the Company (to present) Director of Nabtesco Corporation (to present) Managing executive officer of the Company (to present) Joined Henkel Hakusui Corporation (current Henkel Japan Ltd.) Joined The World Bank Asian Institute of Management Graduate school of Business Assistant Professor of Ritsumeikan Asia Pacific University Graduate School of Management Associate Professor of Ritsumeikan Asia Pacific University Note 3 Graduate School of Management Professor of Ritsumeikan Asia Pacific University Graduate School of Management Professor of Doshisha Business School (to present) Director of Nabtesco Corporation (to present) Registered at Osaka Bar Association Joined Miyazaki Law Firm Registered at Yokohama Bar Association (current Kanagawa Bar Association) Joined Nomura Research Institute, Ltd Registered at Dai-ni Tokyo Bar Association Joined Autodesk Co., Ltd. Registered at the State of California Bar Joined Microsoft Co., Ltd. (current Microsoft Japan, Co., Ltd.) Joined TMI Associates Note 3 Partner of TMI Associates Partner of Endeavour Law Office External Director of TIS Inc. (to present) Partner of Leftright Law & IP (to present) Director of Nabtesco Corporation (to present) Co-Founder & Chief Strategy Officer (CSO) of polisee Inc. Co-Founder, Director & Chief Strategy Officer (CSO) of polisee Inc. (to present) Joined SUMITOMO CORPORATION General Manager, Chicago Branch, Sumitomo Corporation of U.S.A. Executive Officer, General Manager of Metal Products for Automotive Industry Division of SUMITOMO CORPORATION Managing Executive Officer, Head of Chubu Block of SUMITOMO CORPORATION Senior Managing Executive Officer, Head of Kansai Block of SUMITOMO CORPORATION Representative Director, Senior Managing Executive Officer, and General Manager, Transportation & Construction Systems Business Unit of SUMITOMO CORPORATION Representative Director, Executive Vice President, Executive Officer, and General Manager, Transportation & Construction Systems Business Unit of SUMITOMO CORPORATION Special Adviser of SUMITOMO CORPORATION Adviser of SUMITOMO CORPORATION (retired in March 2020) Outside Director of BROTHER INDUSTRIES, LTD. (to present) Director of Nabtesco Corporation (to present) Outside Director of TOPCON CORPORATION Outside Director (Audit and Supervisory Committee Member) of TOPCON CORPORATION (to present)
Joined Seiko Epson Corporation Deputy Chief Operating Officer, Printer Operations Division of Seiko Epson Corporation Executive Officer of Seiko Epson Corporation General Administrative Manager, Intellectual Property Division of Seiko Epson Corporation Executive Officer of Seiko Epson Corporation (retired in March 2021) General Administrative Manager, Corporate Planning Division of Seiko Epson Corporation General Administrative Manager, DX Division of the Seiko Epson Corporation Director of Seiko Epson Corporation (retired in June 2021) General Administrative Manager, Corporate Strategy Division, General Administrative Manager, Sustainability Promotion Office of Seiko Epson Corporation Director of Nabtesco Corporation (to present)
―69―
Number of shares of the Company held
2,608
594
713
Note 3
1,779
Note 3
831
(Translation) This document has been translated from the Japanese original for the convenience of overseas stakeholders. In the event of any discrepancy between this document and the Japanese original, the original shall prevail.
Position Name
Position Name Date of birth
Brief history
Apr. 1983 Apr. 2009 Apr. 2013 Apr. 2015
Director
Seiichiro Shirahata
Mar. 3, 1961
Jan. 2018 Mar. 2018 Mar. 2020 Jan. 2022 Mar. 2023 Jun. 2024 Jun. 2025 Jun. 2010
Audit & Supervisory Board Members
Jun. 2015
Koji Nakano
Jan. 2, 1962
Mar. 2018 Jan. 2022 Mar. 2023 Jun. 2009 Jun. 2011
Audit & Yasuhito Supervisory Nakagawa Board Members
Jul. 2013
May 10, 1963
May 2014 Jan. 2016 Jan. 2020 Mar. 2024 Apr. 1980 Jan. 2006
Audit & Supervisory Tetsuro Hirai Board Members (Independent)
Dec. 19, 1955
Jan. 2008 Jun. 2010 Jun. 2011 Apr. 2018 Mar. 2019 Apr. 1981 Mar. 2003 Feb. 2006
Audit & Supervisory Masatoshi Board Members Hitomi (independent)
Apr. 2009
Nov. 9, 1957
Sep. 2010 Feb. 2015 Jul. 2016 Mar. 2017 Jan. 2020 Mar. 2024
Joined Nippon Paint Co., Ltd. (current Nippon Paint Holdings Co., td.) Division Director, Surface Treatment of Nippon Paint Co.,Ltd. Executive Officer of Nippon Paint Co., Ltd. Senior Executive Officer of Nippon Paint Holdings Co., Ltd. President, Representative Director of the Board of Nippon Paint Surf Chemicals Co., Ltd. Vice President of Nippon Paint Holdings Co., Ltd. President, Representative Director of the Board of Nippon Paint Marine Coatings Co., Ltd Vice President, Director of the Board of Nippon Paint Holdings Co.,Ltd Vice President of Nippon Paint Holdings Co., Ltd Adviser of Nippon Paint Holdings Co., Ltd. (retired in December 2022) Director of Nabtesco Corporation (to present) Outside Director of LINTEC Corporation (to present) Outside Director of TAKARA HOLDINGS INC. (to present)
Term
Number of shares of the Company held
Note 3
764
General Manager, Accounting & Finance Department of Nabtesco Corporation General Manager, Corporate Planning Department of Nabtesco Corporation General Manager of Shanghai Nabtesco Hydraulic Co., Ltd. Note 4 Executive Officer of Nabtesco Corporation Executive Officer, Business Audit of Nabtesco Corporation Audit & Supervisory Board Member of Nabtesco Corporation (to present) General Manager, Manufacturing Department, Tsu Plant, Precision Equipment Company of Nabtesco Corporation Plant Manager, Tsu Plant, Precision Equipment Company of Nabtesco Corporation Senior Manager, Assistant to General Manager, Production Innovation Division of Nabtesco Corporation Senior Manager, assistant to President, Precision Equipment Note 5 Company of Nabtesco Corporation President, Nabtesco (China) Precision Equipment Co., Ltd. Executive Officer (to present) and General Manager, Production Innovation Division (to present) of Nabtesco Corporation Audit & Supervisory Board Member of Nabtesco Corporation (to present) Joined Toyota Motor Co., Ltd. (current Toyota Motor Corporation) General Manager, Vehicle Planning Department, Global Strategic Production Planning Division and Project General Manager of China Division of Toyota Motor Corporation General Manager, Machinery Division, Motomachi Plant of Toyota Motor Corporation (retired in Jun. 2010) Note 4 Executive Officer of Toyota Tsusho Corporation Managing Executive Officer of Toyota Tsusho Corporation Technical Supervisor of Toyota Tsusho Corporation Audit & Supervisory Board Member of Nabtesco Corporation (to present) Joined Sony Corporation (current Sony Group Corporation) General Manager, Production Planning Department, Microsystems Network Company of Sony Corporation Representative Director and CFO of S-LCD Corporation (current Samsung Display Director, General Manager, Planning Management Department of Sony Energy Devices Corporation EVP & CFO of Sony Electronics Inc Note 5 The Audit Committee Aide of Sony Corporation General Manager, Administration Department of Soliton Systems K.K Director, General Manager, Administration Department of Soliton Systems K.K. (retired in March 2020) Outside Director of JAI A/S Audit & Supervisory Board Member of Nabtesco Corporation (to present)
―70―
13,912
8,023
-
1,383
(Translation) This document has been translated from the Japanese original for the convenience of overseas stakeholders. In the event of any discrepancy between this document and the Japanese original, the original shall prevail.
Position Name
Position Name Date of birth
Brief history
Term
Number of shares of the Company held
Note 5
-
Apr. 1987 May 2010
Audit & Supervisory Yasuhiro Board Members Tanabe (independent)
Nov. 7, 1960
Appointed Public Prosecutor Deputy General Manager, Special Trial Department of Tokyo District Public Prosecutors Office Dec. 2010 Deputy Superintending Prosecutor of Sendai District Public Prosecutors Office General Manager, Special Trial Department of Tokyo District Jul. 2012 Public Prosecutors Office Apr. 2013 General Manager, Criminal Affairs Department of Tokyo District Public Prosecutors Office Jan. 2014 General Manager, Criminal Affairs Department of Tokyo High Public Prosecutors Office Nov. 2014 Chief Prosecutor of Naha District Public Prosecutors Office Dec. 2015 Deputy Superintending Prosecutor of Osaka District Public Prosecutors Office Jun. 2017 Deputy Superintending Prosecutor of Osaka High Public Prosecutors Office Nov. 2019 Chief Prosecutor of Osaka District Public Prosecutors Office Apr. 2021 Superintending Prosecutor of Sapporo High Public Prosecutors Office Jun. 2022 Superintending Prosecutor of Fukuoka High Public Prosecutors Office (retired in July 2023) Oct. 2023 Special Advisor, National Institute of Advanced Industrial Science and Technology (to present) Nov. 2023 Registered at Dai-ni Tokyo Bar Association Dec. 2023 Joined Tokyo Fuji Law Office (to present) Mar. 2024 Audit & Supervisory Board Member of Nabtesco Corporation (to present) Total
51,921
(NOTE)1 Directors of Mari Iizuka, Naoko Mizukoshi, Naoki Hidaka, Toshiya Takahata and Seiichiro Shirahata are independent outside directors. 2 Audit & Supervisory Board Members of Tetsuro Hirai, Masatoshi Hitomi and Yasuhiro Tanabe are independent. 3 From the close of the ordinary general meeting of shareholders held on March 26, 2025 to the close of the ordinary general meeting of shareholders for FY2025 which plan to be held on March 26, 2026. 4 From the close of the ordinary general meeting of shareholders held on March 23, 2023 to the close of the ordinary general meeting of shareholders for FY2026. 5 From the close of the ordinary general meeting of shareholders held on March 26, 2024 to the close of the ordinary general meeting of shareholders for FY2027. 6 Skill matrix of specialization of each Directors and Audit & Supervisory Board Members are as follows. Field of specialization
Level of independenc e
Corporate management
Global
Legal, personnel & Manufacturing Financial labor affairs and risk and accounting management technology
Directors
Kazumasa Kimura
●
Seiji Takahashi
●
Kiyoshi Ando
●
●
Hiroshi Usui
●
●
●
●
●
●
●
● ●
● ●
●
●
Naoko Mizukoshi
●
Naoki Hidaka
●
●
●
●
●
●
●
Koji Nakano
●
●
Yasuhito Nakagawa
●
●
●
●
●
●
●
●
●
●
Audit & Supervisory Board Members
Tetsuro Hirai Masatoshi Hitomi Yasuhiro Tanabe
●
DX
●
Mari Iizuka
Toshiya Takahata Seiichiro Shirahata
Sales and marketing
● ●
●
●
● ●
●
●
● ●
●
● ●
―71―
●
(Translation) This document has been translated from the Japanese original for the convenience of overseas stakeholders. In the event of any discrepancy between this document and the Japanese original, the original shall prevail. (NOTE) 7 In order to invigorate the Board of Directors by separating decision-making and supervision from execution, the Company has introduced an executive officer system, and the business execution structure is as follows
Position
Name
President
Kazumasa Kimura
Duties Chief Executive Officer (CEO)
Managing Executive Seiji Takahashi General Administration, Human Resources and Legal & Compliance Officer Managing Executive Officer
Michihito Suzuki
President, Railroad Products Company
Managing Executive Officer
Hiroshi Usui
Corporate Planning, Accounting & Finance, Information Systems, and Corporate Communication
Managing Executive Officer
Takeshi Hanafusa
President, Accessibility Innovations Company
Executive Officer
Kiyoshi Ando
Representative Director and CEO Comtesco Corporation
Executive Officer
Ataru Inoue
President, Nabtesco Automotive Corporation
Executive Officer
Yukihiro Mizutani
President, Marine Control Systems Company
Executive Officer
Koichi Miyaguchi
General Manager, Innovation Strategy Division, and CVC Promotion Department
Executive Officer
Masakazu Kurita
Deputy General Manager, Innovation Strategy Division, and General Manager, New business Promotion Department
Executive Officer
Tomoaki Shiramizu
General Manager, Production Innovation Division
Executive Officer
Akihito Enomoto
Responsible for Sales Management, General Manager, Sales Business Development Department, Railroad Products Company
Executive Officer
Hiroshi Nerima President, Nabtesco Technology Ventures AG
Executive Officer
Hiroki Higuchi
Executive Officer
Tomohiro Kiriyama
Senior General Manager, Technology and R&D Division, and Innovation Strategy Division
Executive Officer
Kazumasa Shimizu
President, Nabtesco Service Co., Ltd.
Executive Officer
Hiroki Mori
General Manager, Sales Management Department and Sales Business Development Department, Precision Equipment Company
Executive Officer
Isao Ohashi
Deputy Senior General Manager, Technology and R&D Division, and in charge of Smart Motion Control Technology
Executive Officer
Sakiko Honda
General Manager, Human Resources Department, Innovation Strategy Division, and President, Nabtesco Link Co., Ltd.
Executive Officer
Masaru Sasaki
General Manager, Corporate Planning Department, and Innovation Strategy Division
Executive Officer
Masaru Sakamoto
Director, Nabtesco Automotive Co., Ltd.
President, Precision Equipment Company
Executive Officer Atsushi Takabatake Director, PACRAFT Co., Ltd. Executive Officer
Shigehiko Mitsuno
Executive Officer
Naruto Tanaka
Responsible for Platform Door and Assistive Products Business Unit, Accessibility Innovations Company
President, Aerospace Company
(NOTE) The business execution structure consists of 24 members, four of whom also serve as directors.
―72―
(Translation) This document has been translated from the Japanese original for the convenience of overseas stakeholders. In the event of any discrepancy between this document and the Japanese original, the original shall prevail.
- As an agenda item (matter for resolution) at the Annual General Meeting of Shareholders scheduled to be held on March 26, 2026, the Company proposes the election of nine (9) Directors. If this proposal is approved and adopted, the composition of the Company’s officers is expected to be as follows: 11 male and 3 female within management (Female ratio in management: 21.4%) Position Name
Position Name Date of birth
Brief history
Term
Jun. 2011
Representative Director Kazumasa Chief Executive Kimura Officer
Aug. 17, 1961
Representative Director, Managing Executive Officer, General Seiji Administration, Takahashi Human Resources and Legal & Compliance
Feb. 12, 1966
(CEO)
General Manager, Manufacturing Department, Tsu Plant, Precision Equipment Company of Nabtesco Corporation Jun. 2012 General Manager, Manufacturing department, Tarui Plant, Power Control Company of Nabtesco Corporation Apr. 2015 Representative Director and Vice President of Hyest Corporation (merged into Nabtesco Corporation in Apr. 2016) Mar. 2016 General Manager, Production Management Department, Power Control Company of Nabtesco Corporation Mar. 2017 Executive Officer and President, Power Control Company of Nabtesco Corporation Jan. 2019 Executive Officer, Corporate Planning, Accounting & Finance, Note 3 Information System and Corporate Communication of Nabtesco Corporation Mar. 2019 Director of Nabtesco Corporation Jan. 2021 Managing Executive Officer, Component Solution Segment, Senior General Manager, Technology and R&D Division, and in charge of Production Innovation of Nabtesco Corporation Jan. 2022 Assistant to Chief Executive Officer of Nabtesco Corporation Mar. 2022 Representative Director (to present), President (to present), and Chief Executive Officer of Nabtesco Corporation (to present) Jun. 2010 General Manager, Human Resources Department of Nabtesco Corporation Jul. 2015 General Manager, Human Resources Department of Nabtesco Corporation and President of Nabtesco Link Co., Ltd Aug. 2017 General Manager, Human Resources Department, Business Transformation Division of Nabtesco Corporation and President of Nabtesco Link Co., Ltd Mar. 2018 Executive Officer of Nabtesco Corporation Jan. 2021 Vice President, Accessibility Innovations Company, and in Note 3 charge of Business Management of Nabtesco Corporation Jan. 2022 Vice President, Accessibility Innovations Company of Nabtesco Corporation Jan. 2023 Managing Executive Officer (to present), President, Accessibility Innovations Company of Nabtesco Corporation Mar. 2023 Director of Nabtesco Corporation
Jan. 2025
Director Managing Executive Officer, President of Railroad Products Company
8,763
4,121
General Administration, Human Resources and Legal & Compliance (to present)
Mar. 2025 Representative Director (to present) Dec. 2009 General Manager, Engineering Department, Aerospace Company
Representative
Director Managing Executive Officer, Corporate Planning, Accounting & Finance, Information Systems and Corporate Communication
Number of shares of the Company held
Apr. 2013 Mar. 2017 Jan. 2020 Hiroshi Usui
Apr. 22, 1965
Jan. 2023 Jan. 2025 Mar. 2025 Jan. 2026 Mar. 2026 Jun. 2011 Apr. 2012
Apr. 2013 Jul. 2017 Michihito November 4, Jan. 2020 Suzuki 1962 Jul. 2021 Jan. 2022 Jan. 2025 Mar. 2026
of the Company General Manager, Planning Department, Aerospace Company of the Company President of Nabtesco Aerospace Inc Executive officer of the Company, General Manager, Planning Department, Aerospace Company of the Company Vice President, Aerospace Company, and Plant Manager, Gifu Note 3 Plant of the Company Corporate Planning, Accounting & Finance, Information Systems and Corporate Communication of the Company (to present) Director of Nabtesco Corporation Managing executive officer of the Company (to present) Representative Director of Nabtesco Corporation (to present) General Manager, Manufacturing Department, Railroad Products Company of the Company General Manager, Administration Department, Railroad Products Company of the Company Plant manager, Kobe Plant of the Company President, Nabtesco Oclap s.r.l Note 3 Executive Officer of the Company Plant manager, Kobe Plant of the Company President, Railroad Products Company of the Company (to present) Managing Executive Officer of the Company (to present) Director of Nabtesco Corporation (to present)
―73―
2,608
4,077
(Translation) This document has been translated from the Japanese original for the convenience of overseas stakeholders. In the event of any discrepancy between this document and the Japanese original, the original shall prevail.
Position Name
Director
Position Name Date of birth
Mari Iizuka
Mar. 29, 1959
Brief history
Apr. 1982 Aug. 1987 Jul. 1992 Apr. 2005 Apr. 2007 Apr. 2008 Apr. 2010 Mar. 2020 Apr. 1995 Apr. 1998 Sep. 1999 Sep. 2002
Director
Naoko Mizukoshi
Sep. 23, 1967
Nov. 2006 Jan. 2008 Mar. 2010 Jun. 2018 Dec. 2018 Mar. 2020 Jun. 2021 Apr. 2025 Apr. 1976 Apr. 2001 Apr. 2007 Apr. 2009 Apr. 2012
Director
Naoki Hidaka
May 16, 1953
Jun. 2013 Apr. 2015 Jun. 2018 Jun. 2019 Jun. 2020 Mar. 2021 Jun. 2022 Jan. 2026 Apr. 1983 Apr. 2009 Apr. 2013 Apr. 2015
Director
Seiichiro Shirahata
Mar. 3, 1961
Jan. 2018 Mar. 2018 Mar. 2020 Jan. 2022 Mar. 2023 Jun. 2024 Jun. 2025
Term
Joined Henkel Hakusui Corporation (current Henkel Japan Ltd.) Joined The World Bank Asian Institute of Management Graduate school of Business Assistant Professor of Ritsumeikan Asia Pacific University Graduate School of Management Associate Professor of Ritsumeikan Asia Pacific University Note 3 Graduate School of Management Professor of Ritsumeikan Asia Pacific University Graduate School of Management Professor of Doshisha Business School (to present) Director of Nabtesco Corporation (to present) Registered at Osaka Bar Association Joined Miyazaki Law Firm Registered at Yokohama Bar Association (current Kanagawa Bar Association) Joined Nomura Research Institute, Ltd Registered at Dai-ni Tokyo Bar Association Joined Autodesk Co., Ltd. Registered at the State of California Bar Joined Microsoft Co., Ltd. (current Microsoft Japan, Co., Ltd.) Joined TMI Associates Note 3 Partner of TMI Associates Partner of Endeavour Law Office External Director of TIS Inc. (to present) Partner of Leftright Law & IP (to present) Director of Nabtesco Corporation (to present) Co-Founder & Chief Strategy Officer (CSO) of polisee Inc. Co-Founder, Director & Chief Strategy Officer (CSO) of polisee Inc. (to present) Joined SUMITOMO CORPORATION General Manager, Chicago Branch, Sumitomo Corporation of U.S.A. Executive Officer, General Manager of Metal Products for Automotive Industry Division of SUMITOMO CORPORATION Managing Executive Officer, Head of Chubu Block of SUMITOMO CORPORATION Senior Managing Executive Officer, Head of Kansai Block of SUMITOMO CORPORATION Representative Director, Senior Managing Executive Officer, and General Manager, Transportation & Construction Systems Business Unit of SUMITOMO CORPORATION Representative Director, Executive Vice President, Executive Officer, and General Manager, Transportation & Construction Systems Business Unit of SUMITOMO CORPORATION Special Adviser of SUMITOMO CORPORATION Adviser of SUMITOMO CORPORATION (retired in March 2020) Outside Director of BROTHER INDUSTRIES, LTD. (to present) Director of Nabtesco Corporation (to present) Outside Director of TOPCON CORPORATION Outside Director (Audit and Supervisory Committee Member) of TOPCON CORPORATION (to present)
Joined Nippon Paint Co., Ltd. (current Nippon Paint Holdings Co., td.) Division Director, Surface Treatment of Nippon Paint Co.,Ltd. Executive Officer of Nippon Paint Co., Ltd. Senior Executive Officer of Nippon Paint Holdings Co., Ltd. President, Representative Director of the Board of Nippon Paint Surf Chemicals Co., Ltd. Vice President of Nippon Paint Holdings Co., Ltd. President, Representative Director of the Board of Nippon Paint Marine Coatings Co., Ltd Vice President, Director of the Board of Nippon Paint Holdings Co.,Ltd Vice President of Nippon Paint Holdings Co., Ltd Adviser of Nippon Paint Holdings Co., Ltd. (retired in December 2022) Director of Nabtesco Corporation (to present) Outside Director of LINTEC Corporation (to present) Outside Director of TAKARA HOLDINGS INC. (to present)
―74―
Number of shares of the Company held
594
713
Note 3
1,779
Note 3
764
(Translation) This document has been translated from the Japanese original for the convenience of overseas stakeholders. In the event of any discrepancy between this document and the Japanese original, the original shall prevail.
Position Name
Position Name Date of birth
Brief history
Apr. 1988 Apr. 1998 Jul. 2015 Feb. 2017 Jan. 2022 Director
Shinako Matsuyama
April. 19, 1964
Jul. 2023 Jul. 2024 Jun. 2025 Jul. 2025 Mar. 2026 Jun. 2010
Audit & Supervisory Board Members
Jun. 2015
Koji Nakano
Jan. 2, 1962,
Mar. 2018 Jan. 2022 Mar. 2023 Jun. 2009 Jun. 2011
Audit & Yasuhito Supervisory Nakagawa Board Members
Jul. 2013
May 10, 1963
May 2014 Jan. 2016 Jan. 2020 Mar. 2024 Apr. 1980 Jan. 2006
Audit & Supervisory Tetsuro Hirai Board Members (Independent)
Dec. 19, 1955
Jan. 2008 Jun. 2010 Jun. 2011 Apr. 2018 Mar. 2019 Apr. 1981 Mar. 2003 Feb. 2006
Audit & Supervisory Masatoshi Board Members Hitomi (independent)
Apr. 2009
Nov. 9, 1957
Sep. 2010 Feb. 2015 Jul. 2016 Mar. 2017 Jan. 2020 Mar. 2024
Joined NEC Informatec Systems, Ltd. (current NEC Solution Innovators, Ltd.) Joined Sony Corporation (current Sony Group Corporation) Joined Milliman, Inc Joined Tokyo Electron Ltd Digital Transformation Promotion, Corporate Innovation Division of Tokyo Electron Ltd. DX Planning and Promotion (Digital Transformation Promotion), Corporate Innovation Division of Tokyo Electron Ltd. Sub-leader of Business Process Reform DX Promotion Project (DX Planning and Promotion, Corporate Innovation Division) of Tokyo Electron Ltd. Outside Director of TANAKA SEIMITSU KOGYO CO., LTD. (to present) Vice President in charge of Promotion, Business Process Design Strategy Division of Tokyo Electron Ltd. (to present) Director of Nabtesco Corporation (to present)
Term
Number of shares of the Company held
Note 3
General Manager, Accounting & Finance Department of Nabtesco Corporation General Manager, Corporate Planning Department of Nabtesco Corporation General Manager of Shanghai Nabtesco Hydraulic Co., Ltd. Note 4 Executive Officer of Nabtesco Corporation Executive Officer, Business Audit of Nabtesco Corporation Audit & Supervisory Board Member of Nabtesco Corporation (to present) General Manager, Manufacturing Department, Tsu Plant, Precision Equipment Company of Nabtesco Corporation Plant Manager, Tsu Plant, Precision Equipment Company of Nabtesco Corporation Senior Manager, Assistant to General Manager, Production Innovation Division of Nabtesco Corporation Senior Manager, assistant to President, Precision Equipment Note 5 Company of Nabtesco Corporation President, Nabtesco (China) Precision Equipment Co., Ltd. Executive Officer (to present) and General Manager, Production Innovation Division (to present) of Nabtesco Corporation Audit & Supervisory Board Member of Nabtesco Corporation (to present) Joined Toyota Motor Co., Ltd. (current Toyota Motor Corporation) General Manager, Vehicle Planning Department, Global Strategic Production Planning Division and Project General Manager of China Division of Toyota Motor Corporation General Manager, Machinery Division, Motomachi Plant of Toyota Motor Corporation (retired in Jun. 2010) Note 4 Executive Officer of Toyota Tsusho Corporation Managing Executive Officer of Toyota Tsusho Corporation Technical Supervisor of Toyota Tsusho Corporation Audit & Supervisory Board Member of Nabtesco Corporation (to present) Joined Sony Corporation (current Sony Group Corporation) General Manager, Production Planning Department, Microsystems Network Company of Sony Corporation Representative Director and CFO of S-LCD Corporation (current Samsung Display Director, General Manager, Planning Management Department of Sony Energy Devices Corporation EVP & CFO of Sony Electronics Inc Note 5 The Audit Committee Aide of Sony Corporation General Manager, Administration Department of Soliton Systems K.K Director, General Manager, Administration Department of Soliton Systems K.K. (retired in March 2020) Outside Director of JAI A/S Audit & Supervisory Board Member of Nabtesco Corporation (to present)
―75―
13,912
8,023
-
1,383
(Translation) This document has been translated from the Japanese original for the convenience of overseas stakeholders. In the event of any discrepancy between this document and the Japanese original, the original shall prevail.
Position Name
Position Name Date of birth
Brief history
Term
Number of shares of the Company held
Note 5
-
Apr. 1987 May 2010
Audit & Supervisory Yasuhiro Board Members Tanabe (independent)
Appointed Public Prosecutor Deputy General Manager, Special Trial Department of Tokyo District Public Prosecutors Office Dec. 2010 Deputy Superintending Prosecutor of Sendai District Public Prosecutors Office General Manager, Special Trial Department of Tokyo District Jul. 2012 Public Prosecutors Office Apr. 2013 General Manager, Criminal Affairs Department of Tokyo District Public Prosecutors Office Jan. 2014 General Manager, Criminal Affairs Department of Tokyo High Public Prosecutors Office Nov. 2014 Chief Prosecutor of Naha District Public Prosecutors Office Dec. 2015 Deputy Superintending Prosecutor of Osaka District Public Prosecutors Office Jun. 2017 Deputy Superintending Prosecutor of Osaka High Public Prosecutors Office Nov. 2019 Chief Prosecutor of Osaka District Public Prosecutors Office Apr. 2021 Superintending Prosecutor of Sapporo High Public Prosecutors Office Jun. 2022 Superintending Prosecutor of Fukuoka High Public Prosecutors Office (retired in July 2023) Oct. 2023 Special Advisor, National Institute of Advanced Industrial Science and Technology (to present) Nov. 2023 Registered at Dai-ni Tokyo Bar Association Dec. 2023 Joined Tokyo Fuji Law Office (to present) Mar. 2024 Audit & Supervisory Board Member of Nabtesco Corporation (to present) Total
Nov. 7, 1960
46,737
(NOTE)1 Directors of Mari Iizuka, Naoko Mizukoshi, Naoki Hidaka, Seiichiro Shirahata and Shinako Matsushima are independent outside directors. 2 Audit & Supervisory Board Members of Tetsuro Hirai, Masatoshi Hitomi and Yasuhiro Tanabe are independent. 3 From the close of the ordinary general meeting of shareholders held on March 26, 2026 to the close of the ordinary general meeting of shareholders for FY2026. 4 From the close of the ordinary general meeting of shareholders held on March 23, 2023 to the close of the ordinary general meeting of shareholders for FY2026. 5 From the close of the ordinary general meeting of shareholders held on March 26, 2024 to the close of the ordinary general meeting of shareholders for FY2027. 6 Skill matrix of specialization of each Directors and Audit & Supervisory Board Members are as follows. Field of specialization Level of independenc e
Corporate management
Global
Legal, personnel & labor affairs and risk management
Directors
Kazumasa Kimura
●
Seiji Takahashi
●
Hiroshi Usui
●
●
Michihito Suzuki
●
●
●
●
●
●
●
Financial accounting
Manufacturin g and technology
●
●
●
●
●
●
●
DX
●
Mari Iizuka
●
Naoko Mizukoshi
●
Naoki Hidaka
●
●
●
●
●
●
●
●
●
●
●
Koji Nakano
●
●
Yasuhito Nakagawa
●
●
● ●
Seiichiro Shirahata Shinako Matsuyama
Sales and marketing
Audit & Supervisory Board Members
Tetsuro Hirai
●
●
●
Masatoshi Hitomi
●
●
●
Yasuhiro Tanabe
●
●
●
●
●
● ●
―76―
●
●
(Translation) This document has been translated from the Japanese original for the convenience of overseas stakeholders. In the event of any discrepancy between this document and the Japanese original, the original shall prevail. (NOTE) 7 In order to invigorate the Board of Directors by separating decision-making and supervision from execution, the Company has introduced an executive officer system, and the business execution structure is as follows
Position
Name
President
Kazumasa Kimura
Duties Chief Executive Officer (CEO)
Managing Executive Seiji Takahashi General Administration, Human Resources and Legal & Compliance Officer Managing Executive Officer
Michihito Suzuki
President, Railroad Products Company
Managing Executive Officer
Hiroshi Usui
Corporate Planning, Accounting & Finance, Information Systems, and Corporate Communication
Managing Executive Officer
Takeshi Hanafusa
President, Accessibility Innovations Company
Executive Officer
Ataru Inoue
President, Nabtesco Automotive Corporation
Executive Officer
Yukihiro Mizutani
President, Marine Control Systems Company
Executive Officer
Koichi Miyaguchi
General Manager, Innovation Strategy Division, and CVC Promotion Department
Executive Officer
Masakazu Kurita
Deputy General Manager, Innovation Strategy Division, and General Manager, New business Promotion Department
Executive Officer
Tomoaki Shiramizu
General Manager, Production Innovation Division
Executive Officer
Akihito Enomoto
Responsible for Sales Management, General Manager, Sales Business Development Department, Railroad Products Company
Executive Officer
Hiroshi Nerima President, Nabtesco Technology Ventures AG
Executive Officer
Hiroki Higuchi
Executive Officer
Tomohiro Kiriyama
Senior General Manager, Technology and R&D Division, and Innovation Strategy Division
Executive Officer
Kazumasa Shimizu
President, Nabtesco Service Co., Ltd.
Executive Officer
Hiroki Mori
General Manager, Sales Management Department and Sales Business Development Department, Precision Equipment Company
Executive Officer
Isao Ohashi
Deputy Senior General Manager, Technology and R&D Division, and in charge of Smart Motion Control Technology
Executive Officer
Sakiko Honda
General Manager, Human Resources Department, Innovation Strategy Division, and President, Nabtesco Link Co., Ltd.
Executive Officer
Masaru Sasaki
General Manager, Corporate Planning Department, and Innovation Strategy Division
Executive Officer
Masaru Sakamoto
Director, Nabtesco Automotive Co., Ltd.
President, Precision Equipment Company
Executive Officer Atsushi Takabatake Director, PACRAFT Co., Ltd. Executive Officer
Shigehiko Mitsuno
Executive Officer
Naruto Tanaka
Responsible for Platform Door and Assistive Products Business Unit, Accessibility Innovations Company
President, Aerospace Company
(NOTE) The business execution structure consists of 23 members, four of whom also serve as directors.
―77―
(Translation) This document has been translated from the Japanese original for the convenience of overseas stakeholders. In the event of any discrepancy between this document and the Japanese original, the original shall prevail.
② Outside Directors and Audit & Supervisory Board Members (Independent) The Company has five outside directors and three Audit & Supervisory Board Members (Independent) Mari Iizuka has a high level of expertise in the fields of global management human resources and international management strategies. In addition, she has participated in activities for promoting collaboration and cooperation between industry and academia, and has extensive insight based on such experience. For the Company, she has appropriately supervised management as an Outside Director since March 2020 and has also contributed to the strengthening of governance as chairman of the Nominating Committee and as a member of the Remuneration Committee. Although Mari Iizuka has not been involved in corporate management except as an Outside Director of the Company, the Company expects her to provide supervision and advice utilizing her insight to realize the Company's long-term vision toward 2030 and medium- to longterm improvement in corporate value. Based on her experience and insight, the Company requests the continued appointment of Mari Iizuka as Outside Director, as we expect her to provide supervision and advice utilizing her insight. There is no conflict of interest between The Doshisha and the other organizations, where Mari Iizuka serves, and the Company. Reasons for nomination as a candidate for Outside Director and overview of expected role: Naoko Mizukoshi has a high level of expertise as an attorney-at-law. In addition, she has held various posts including outside officers of other business entities and posts in public offices, including being a member of Unfair Competition Prevention Subcommittee, Intellectual Property Committee, Industrial Structure Council, Ministry of Economy, Trade and Industry and has extensive insight based on such experience. For the Company, she has appropriately supervised management as an Outside Director since March 2020 and also contributed to the strengthening of governance as chairman of the Remuneration Committee and as a member of the Nominating Committee. Therefore, the Company expects her to provide supervision and advice utilizing her insight to realize the Company's long-term vision toward 2030 and medium- to long-term improvement in corporate value. Based on her experience and insight, the Company requests the continued appointment of Naoko Mizukoshi as Outside Director, as we expect her to provide supervision and advice utilizing her insight. There is no conflict of interest between polisee Inc., Leftright Law & IP, TIS Inc. and other institutions where Naoko Mizukoshi served and the Group. Naoki Hidaka has diverse operational experience in overseas businesses as well as the business of transportation and construction systems, which are the Company's business domain, and also has extensive insight based on his experience as a corporate manager. For the Company, he has appropriately supervised management as an Outside Director of the Company since March 2021 and also contributed to the strengthening of governance as a member of the Nominating Committee. The Company therefore expects him to provide supervision and advice utilizing his knowledge to realize the Company's longterm vision toward 2030 and medium- to long-term improvement in corporate value, the Company requests the continued appointment of Naoki Hidaka as Outside Director, as we expect him to provide supervision and advice utilizing his knowledge. There is no conflict of interest between BROTHER INDUSTRIES, LTD., TOPCON CORPORATION and the other organizations, where Naoki Hidaka serves, and the Company. Toshiya Takahata has diverse operational experience in operations related to intellectual property, digital transformation, corporate planning, and sustainability, and also has extensive insight based on his experience as a corporate manager. For the Company, he has appropriately supervised management as an Outside Director since March 2022 and also contributed to the strengthening of governance as a member of the Remuneration Committee. The Company therefore expects him to provide supervision and advice utilizing his knowledge to realize the Company's long-term vision toward 2030 and medium- to longterm improvement in corporate value, the Company has appointed Toshiya Takahata as Outside Director, as we expect him to provide supervision and advice utilizing his insight. In addition, Toshiya Takahata is scheduled to retire upon the conclusion of the Annual General Meeting of Shareholders to be held on March 26, 2026. There is no conflict of interest between Seiko Epson Corporation, and the other organizations, where Toshiya Takahata serves, and the Company. Seiichiro Shirahata has experience in long-term overseas assignment as an engineer as well as diverse operational experience as a person responsible for the transition into a holding company and the spin-off of business segments, and also has extensive insight based on his experience as a corporate manager. For the Company, he has appropriately supervised management as an Outside Director since March 2023. The Company therefore expects him to provide supervision and advice utilizing his knowledge to realize the Company's long-term vision toward 2030 and medium- to long-term improvement in corporate value, the Company requests the continued appointment of Seiichiro Shirahata as Outside Director, as we expect him to provide supervision and advice utilizing his insight. There is no conflict of interest between organizations, where Seiichiro Shirahata serves, and the Company. Seiichiro Shirahata is to assume office as Outside Director of LINTEC Corporation as of June 20, 2024. Tetsuro Hirai has broad experience and extensive knowledge and insight on production. Additionally, he has experience as a corporate manager. The Company has appointed Tetsuro Hirai as Audit & Supervisory Board Member (Independent), so that we may seek his fair decisions based on the above, and objectiveness and neutrality toward management to strengthen our corporate governance. There is no conflict of interest between organizations where Tetsuro Hirai serves, and the Company.
―78―
(Translation) This document has been translated from the Japanese original for the convenience of overseas stakeholders. In the event of any discrepancy between this document and the Japanese original, the original shall prevail.
Masatoshi Hitomi has been engaged in accounting and administration in Japan and abroad for many years, and possesses broad insight into finance and accounting as well as experience in management. In addition, at Sony Corporation (current Sony Group Corporation), he was engaged in auditing by the Audit Committee. The Company has appointed Masatoshi Hitomi as Audit & Supervisory Board Member (Independent), so that we may seek his fair decisions based on the above, and objectiveness and neutrality toward management to strengthen our corporate governance. There is no conflict of interest between organizations where Masatoshi Hitomi serves, and the Company. Although Yasuhiro Tanabe has not been directly involved in corporate management, he served as a prosecutor for many years and has a high level of knowledge about laws and regulations. He also has a high level of expertise and insight into organizational management in general. The Company has appointed Yasuhiro Tanabe as Audit & Supervisory Board Member (Independent), so that we may seek his fair decisions based on the above, and objectiveness and neutrality toward management to strengthen our corporate governance. There is no conflict of interest between National Institute of Advanced Industrial Science and Technology, Tokyo Fuji Law Office and the other organizations, where Yasuhiro Tanabe serves, and the Company. In addition, as a matter for resolution at the Annual General Meeting of Shareholders scheduled to be held on March 26, 2026, the Company proposes the election of nine (9) Directors. If this proposal is approved and adopted, the Company will have five (5) Outside Directors and three (3) Outside Audit & Supervisory Board Members. Ms. Shinako Matsuyama, a candidate for Outside Director, has been engaged for many years in initiatives related to the promotion of digital technologies (IT/AI) utilization and possesses extensive experience and expertise in the formulation of DX(digital transformation) strategies. Since June 2025, she has served as an Outside Director of TANAKA SEIMITSU KOGYO CO., LTD., where she is involved in overseeing the management of the company. Although Ms. Matsuyama has not been
involved in company management other than in her capacity as an Outside Director, the Company expects that she will provide oversight and advice by leveraging her expertise in order to contribute to the achievement of the Company’s longterm vision toward 2030 and the enhancement of medium- to long-term corporate value. Accordingly, the Company has nominated her as an Outside Director. There are no special interests between the Company and TANAKA SEIMITSU KOGYO CO., LTD.. or Tokyo Electron Ltd.
The Company has established its own criteria for objectively determining the independence of outside directors and Audit & Supervisory Board Members (independent) (hereinafter collectively referred to as "outside officers"), and all of the Company's outside officers are independent in accordance with the following criteria.
―79―
(Translation) This document has been translated from the Japanese original for the convenience of overseas stakeholders. In the event of any discrepancy between this document and the Japanese original, the original shall prevail.
[Criteria for the Impartiality of Outside Directors/Audit & Supervisory Board Members (independent)] The Company considers an Outside Director/Audit & Supervisory Board Members (independent) to be impartial if all of the following requirements are met.
- The Outside Director/Audit & Supervisory Board Member is not a current major shareholder* of the Company or an executive of such shareholders; * Person who directly or indirectly holds more than 5% of all voting rights or a person who is listed among the top 10 shareholders in the most recent shareholder registry
- The Outside Director/Audit & Supervisory Board Member is not an executive of a major lender * of the Group; * A financial institution group (person who belongs to the consolidated group to which the Group’s direct lender belongs) from which the Group borrows funds, and from which the Group’s total amount of borrowing exceeds 2% of the Group’s consolidated total assets as of the end of the previous fiscal year
- The Outside Director/Audit & Supervisory Board Member is not a major business partner of the Group (defined by a yearly transaction amount that exceeds 1% of consolidated net sales) or its executive.
- The Outside Director/Audit & Supervisory Board Member is not a person for whom the Group is a major business partner (defined by a yearly transaction amount that exceeds 1% of the counterparty’s consolidated net sales) or its executive.
- The Outside Director/Audit & Supervisory Board Member is not a consultant, accounting professional, or legal professional who receives a large amount of remuneration (more than ¥6 million yearly) from the Group other than officers’ remuneration (including a case where an organization such as a corporation or an association to which the Outside Officer belongs receives remuneration);
- The Outside Director/Audit & Supervisory Board Member is not an executive of an organization such as a corporation or an association that receives a large amount of donations (more than ¥6 million yearly) from the Group.
- The Outside Director/Audit & Supervisory Board Member is not a spouse or a relative within the second degree of consanguinity of the Group’s executive; and
- The Outside Director/Audit & Supervisory Board Member does not fall under any of the above-mentioned items from (1) through (6) for the past three years.
- The Outside Director/Audit & Supervisory Board Member holds his/her office as an outside officer of Nabtesco for a period not exceeding eight years in total.
③ Relationship between supervision or auditing by outside directors or Audit & Supervisory Board Members (independent) and internal audits, corporate auditors, and accounting audits, as well as with the internal control division. The status of coordination and procedures among the Audit & Supervisory Board members (including outside Audit & Supervisory Board members), the accounting auditor, and the internal audit department, as well as the relationship with the internal audit department are described in [(3) Status of audits; ③ Cooperation with internal audits, audits by Audit & Supervisory Board members, and accounting audits.]
―80―
(Translation) This document has been translated from the Japanese original for the convenience of overseas stakeholders. In the event of any discrepancy between this document and the Japanese original, the original shall prevail.
(3) 【Status of audits】 ① Audits by Audit & Supervisory Board Members
- Audit & Supervisory Board Members and organization Our Audit & Supervisory Board consists of five members, two full-time and three Independent (part-time). Position
Name
Audit & Supervisory Board Members
Koji Nakano
Yasuhito Nakagawa
Audit & Supervisory Board Members (Independent)
Brief history
He has engaged mainly in finance, accounting and corporate planning divisions, and possesses management experience at Shanghai Nabtesco Hydraulic Co., Ltd., in addition to broad insight in the fields of finance and accounting and internal audit. He served as General Manager, Manufacturing Department, Tsu Plant, Precision Equipment Company and Plant Manager of the Plant and served as General Manager, Production Innovation Division. He also chaired the Group’s Environment, Safety & Health Committee. He thus has expertise and experience in production, particularly production technology and production management, as well as in environment, safety and health. In addition, he was engaged in management at Nabtesco (China) Precision Equipment Co., Ltd.
Tetsuro Hirai
He has broad experience and extensive knowledge and insight on production and has management experience.
Masatoshi Hitomi
He has been engaged in accounting and administration in Japan and abroad for many years, and possesses broad insight into finance and accounting as well as experience in management. In addition, at Sony Corporation (current Sony Group Corporation), he was engaged in auditing by the Audit Committee.
Yasuhiro Tanabe
Although he has not been directly involved in corporate management, he served as a prosecutor for many years and has a high level of knowledge about laws and regulations. He also has a high level of expertise and insight into organizational management in general.
In addition, we regularly hold liaison meetings (described below with the Group Audit & Supervisory Board) with domestic Group company Audit & Supervisory Board members, which are composed of the Audit & Supervisory Board members of each Group company, with the aim of sharing Group audit policies, priority implementation items, and audit information of each company, and raising the effectiveness of audits at each Group company. At the request of the Audit & Supervisory Board members, two employees are assigned to assist the Audit & Supervisory Board members in carrying out their duties. 2) Activities of Audit & Supervisory Board Members In principle, the Audit & Supervisory Board Members meet once a month, and 13 meetings were held in Fiscal Year 2025. Attendance by individual corporate auditors is as follows. Name, etc Audit & Supervisory Board Members Audit & Supervisory Board Members (Independent)
(NOTE)
Koji Nakano Yasuhito Nakagawa Tetsuro Hirai Masatoshi Hitomi Yasuhiro Tanabe
Attendance/number of meetings (Note 1) 13 times /13 times 13 times /13 times 13 times /13 times 13 times /13 times 13 times /13 times
Numbers are based on the number of meetings held during the period of service.
The main matters discussed and reported by the Audit & Supervisory Board during the fiscal year under review are as follows. The time required is about one hour per time. Matters for Audit Plan by Audit & Supervisory Board Members, re-appointment of Accounting Consultation Auditors, consent to audit fees of Accounting Auditors, Approval of Non-Guarantee Services by Accounting Auditors, audit reports of the Audit & Supervisory Board, Evaluation of the Effectiveness of the Audit & Supervisory Board etc. Matters to be Reported
Reports on the results of audits, reports on receipt of management confirmation reports, reports on attendance at important meetings, reports on corporate auditors at meetings of the Board of Directors, and summary reports on important matters such as the Management Committee
―81―
(Translation) This document has been translated from the Japanese original for the convenience of overseas stakeholders. In the event of any discrepancy between this document and the Japanese original, the original shall prevail.
- Activities of Audit & Supervisory Board and Audit & Supervisory Board Member We established audit policies and priority audit items for the current fiscal year as shown in the table below. Basic Auditing Policy Priority audit items
As an independent body entrusted by shareholders, Audit & Supervisory Board members shall contribute to ensuring the sound management of the Nabtesco Group and establishing a highquality corporate governance system that responds to social trust by auditing the execution of duties by directors. <Development and Operation of Internal Control System> ① Operational effectiveness and efficiency: Governance status of business sites and Group companies ② Reliability of financial reports: Important financial information such as orders, quality claims, delivery dates, and costs ③ Legal Compliance: Compliance System and Awareness ④ Preservation of assets: Acquisition and disposal processes, use and storage status <Individual Priority Issues> ① Efforts to Solve ESG Items Initiatives for DX (Digital Transformation) ② Initiatives for ROIC management ③
In particular, we closely monitored whether the Group's management policies are properly reflected in the priority issues and action plans of domestic sites and domestic and overseas Group companies, and whether business operations are being executed effectively and efficiently. We confirmed the status of these policies through on-site visits and attending major meetings. The Group companies to be audited are selected based on a comprehensive assessment of the degree of impact on consolidated results and the degree of risk. To enhance the effectiveness of audits by corporate auditors, the Company invites executive officers and division heads to the Audit & Supervisory Board and conducts interviews as necessary. Major activities in the current fiscal year are as follows. Main activities
Frequency of meetings
Full-time Audit & Supervisory Board Members
Audit & Supervisory Board Members (Independent)
Attendance at Board of Directors Meetings
18 times
■
■
Opinion Exchange Meeting with Representative
2 times
■
■
1 time
■
■
Directors Opinion Exchange Meeting with Independent Directors Participation in the Advisory Committee
8 times
■
Attendance at the Management Committee
19 times
■
Attendance at Executive Officers Committee
12 times
■
Attendance at CEO Committees
11 times
■
Attendance at internal control reporting meeting
1 time
■
Interviews with directors and executive officers
11 times
■
Visits to domestic sites
8 times
■
Participation in physical inventory
13 times
■
Visits to Group Companies
7 times
■
Attendance at the Group Audit & Supervisory
2 times
■
■
■
Board Meeting (NOTE) Activities related to information collaboration with the internal audit division and accounting auditors are described in [③ Cooperation with Internal Audits, Audits by Audit & Supervisory Board Members, and Accounting Audits.]
―82―
(Translation) This document has been translated from the Japanese original for the convenience of overseas stakeholders. In the event of any discrepancy between this document and the Japanese original, the original shall prevail.
②Internal Audit Status Our Business Audit Department (ten members) conducts internal audits of corporate divisions, in-house companies, and Group companies. The Internal Audit Department conducts surveys and assessments to determine whether overall operations are being processed, and asset management is being properly carried out. The results are compiled into an audit report and follow up on the status of improvements in areas pointed out or requested for improvement. Audit reports and follow-up reports are reported directly at regular meetings of the Audit & Supervisory Board attended by the representative director, full-time Audit & Supervisory Board members, and certain executive officers. The contents of these reports are posted in the Audit Report Database and disseminated to all directors and Audit & Supervisory Board members, including those from outside the Company. In addition, the Internal Audit Division reports periodically to the Board of Directors. ③Cooperation with Internal Audits, Audits by Audit & Supervisory Board Members, and Accounting Audits. With regard to cooperation between internal audits, audits by the Audit & Supervisory Board members, and accounting audits, the Business Audit Department and the Audit & Supervisory Board members work to enhance internal auditing operations by, for example, exchanging information and opinions on the annual business audit plan and the content of audits at regular audit councils. The Business Audit Department, the Accounting & Finance Department, the Audit & Supervisory Board members, and the accounting auditor exchange opinions and information about the development and operation of the Internal Control System for Financial Reporting. In addition, the Audit & Supervisory Board members receive briefings on the outline of the audit plan from the accounting auditor, and also receive briefings on the Group's accounting and internal control issues, etc. through accounting audit reports and quarterly review reports. Full-time Audit & Supervisory Board members and accounting auditors meet regularly to exchange opinions on important auditing issues and other matters. Committee Name
Summary
Month of implementation
Audit
and
intermediate
May
review
February and
review plan Intermediate
and
audit report meeting
August
Nabtesco group Audit &
January and August
Supervisory Board members’ meeting Business
Audit
Meeting
Report
On a monthly basis
Audit Council
August and November
J-SOX meeting
January, March, June and December
The accounting auditor shall explain to the Audit & Supervisory Board members, the outline of the plan for the audit and intermediate review of the business year. The accounting auditor shall report to the Board of Corporate Auditors on the outline of the audit and the status of implementation and the results of the intermediate review of the accounting results for the fiscal year.jp Audit & Supervisory Board members of each Group company report on their audits and share and discuss information in an effort to achieve uniformity and enhancement of audits. The Business Audit Department shall implement the Audit Operations Report. The results of internal audits conducted by the Internal Audit Department are reported to the Representative Director, Full-time Audit & Supervisory Board Members, and certain executive officers using audit reports and follow-up reports, and opinions are exchanged. In order to strengthen cooperation between the Audit & Supervisory Board members and the Business Auditing Department, discussions on audits and exchanges of information and opinions will be held through the Auditing Council. In addition, the Audit & Supervisory Board of the Group shall discuss, report and exchange opinions on audits between the Audit & Supervisory Board members and the corporate auditors of subsidiaries. The Business Audit Department, an independent evaluation division, reports to the full-time corporate auditors, the general manager of the Accounting Department, and the general manager of the Information System Department, and exchanges opinions regarding the implementation plans and progress of the development and operation evaluation of the Internal Control over Financial Reporting based on the Financial Instruments and Exchange Act.
―83―
(Translation) This document has been translated from the Japanese original for the convenience of overseas stakeholders. In the event of any discrepancy between this document and the Japanese original, the original shall prevail.
④ Accounting Auditors
- Name of auditing firm KPMG AZSA LLC
- Continuous audit period 23 years
- Names of lead CPAs assigned to audit Takeharu Kirikae, Designated Limited Liability Partner and Managing Partner Toyama Daisuke, Designated Limited Liability Partner and Managing Partner
- To assist in audit activities 24 CPAs and 50 others
- Policy and Reasons for Selection of Audit Firms The Audit & Supervisory Board has decided to appoint KPMG AZSA LLC. as an accounting auditor in consideration of the fact that the accounting auditor is not deemed to fall under any of the items of Paragraph 1 of Article 340 of the Companies Act and the evaluation of the accounting auditor.
- Evaluation of Audit Firms by Audit & Supervisory Board Members and the Audit & Supervisory Board The Audit & Supervisory Board receives reports from the accounting auditors on the content of audits, audit plans, and quality control systems, and evaluates their independence and appropriateness. During the fiscal year under review, the Board of Corporate Auditors has determined that there are no facts that would cause problems with respect to the activities, independence, and reliability of the accounting auditor.
―84―
(Translation) This document has been translated from the Japanese original for the convenience of overseas stakeholders. In the event of any discrepancy between this document and the Japanese original, the original shall prevail.
⑤ Details of Audit Fees
- Remuneration for Certified Public Accountants Previous consolidated fiscal year Classification
Current consolidated fiscal year
Compensation for audit certification services (Million yen)
Compensation for nonaudit services (Million yen)
Compensation for audit certification services (Million yen)
Compensation for nonaudit services (Million yen)
Submitting Company
122
-
111
-
Consolidated subsidiaries
16
-
16
-
Total
138
-
127
-
- Remuneration for the same network (KPMG) as audited CPAs, etc. excluding 1) Previous consolidated fiscal year Classification
Current consolidated fiscal year
Compensation for audit certification services (Million yen)
Compensation for nonaudit services (Million yen)
Compensation for audit certification services (Million yen)
Compensation for nonaudit services (Million yen)
Submitting Company
-
15
-
18
Consolidated subsidiaries
68
0
66
1
Total
68
15
66
19
Previous consolidated fiscal year The non-audit services of the submitting companies mainly consist of advisory services related to ESG and tax. The non-audit services of consolidated subsidiaries mainly consist of advisory services related to tax. Current consolidated fiscal year The non-audit services of the submitting companies mainly consist of advisory services related to ESG and tax. The non-audit services of consolidated subsidiaries mainly consist of advisory services related to tax. 3) Details of other remuneration based on important audit attestation services Previous consolidated fiscal year Not applicable. Current consolidated fiscal year Not applicable. 4) Policy for determining audit fees The policy for determining audit fees for our auditing CPAs is to be determined by obtaining the consent of the Audit & Supervisory Board in accordance with the provisions of Article 399 of the Companies Act, after comprehensively considering the content of audit services, etc. 5) Reasons why the Audit & Supervisory Board agreed to the remuneration, etc. of the accounting auditor The Audit & Supervisory Board confirms the content of audits by the accounting auditor, audit time and audit plan, trends in remuneration performance, and remuneration estimates. After reviewing the appropriateness of the accounting auditor's remuneration, the Audit & Supervisory Board agrees to Article 399-1 of the Companies Act.
―85―
(Translation) This document has been translated from the Japanese original for the convenience of overseas stakeholders. In the event of any discrepancy between this document and the Japanese original, the original shall prevail.
(4) 【Compensation of Directors and Audit & Supervisory Board Members】 ① Compensation of Directors and Audit & Supervisory Board Members
- Total amount of remuneration, etc. by officer classification, total amount of remuneration, etc. by type, and number of officers subject to remuneration Total remuneration by type (Millions yen) Classification
Director (excluding outside directors) Corporate Auditors (excluding independent Audit & Supervisory Board Members) Outside officers
Fixed Total amount of compensation remuneration (Millions yen) Monthly compensation
Incentive fee Board Benefit Trust (BBT) Benefits at the Retirement time of tenure benefit
Be subject to Number of officers (person)
156
95
20
17
23
6
54
54
-
-
-
2
81
81
-
-
-
8
(NOTE) 1 The number of officers eligible to serve as directors includes two retired directors during the fiscal year under review. 2. Monthly compensation consists of basic monthly compensation and total performance-linked compensation paid on a monthly straightline basis. 3 The amount of stock benefit trust (BBT) represents the amount expensed in the current period under Japanese GAAP based on the number of stock delivery points granted or expected to be granted in the current period. 4 The maximum amount of remuneration is within 400 million yen for directors (including within 70 million yen for outside directors) as resolved at the 21st Ordinary General Meeting of Shareholders (held on March 26, 2024) and 90 million yen for corporate auditors, as resolved at the 14th Ordinary General Meeting of Shareholders (held on March 28, 2017). 5 In addition to the above remuneration, the Company has introduced a stock-based compensation trust (BBT) for directors (excluding outside directors), a stock-based compensation plan resolved at the 14th Ordinary General Meeting of Shareholders (held on March 28, 2017). In accordance with the directors' stock-based compensation regulations stipulated in this plan, the Company contributes to the trust a maximum of 450 million yen (for 3 fiscal years) for directors' stock-based payment at the time of service and 420 million yen (for 3 fiscal years) for retirement benefits. At the 14th Ordinary General Meeting of Shareholders (held on March 28, 2017), the maximum amount of remuneration, which is separate from the remuneration limit stated in 5. above, is set at 56,000 points (one fiscal year) for benefits at the time of service and 51,000 points (one fiscal year) for benefits at the time of retirement. 6 The total amount of remuneration, etc. for each officer is omitted because there is no applicable officer who has paid 100 million yen or more.
② The contents of the policy and the method for determining the amount of Remuneration, etc. for officers or the method for calculating such amount
- Basic Policy of the Compensation System ・A system that shares the interests of shareholders and management by increasing the linkage between the Company’s business performance and stock value ・To act as an incentive to improve the Group's medium-to long-term performance ・The process of determining the compensation system should be objective and transparent.
- Compensation System ⅰ. The remuneration system for directors consists of "monthly remuneration," which consists of Basic remuneration that is fixed remuneration and Performance-linked compensation reflecting short-term performance, and "stock benefit trust (BBT)," which reflects the degree of achievement of the medium-term management plan and share value. ⅱ. "Basic remuneration" is a fixed remuneration according to the position of each director and is paid as a monthly remuneration. ⅲ. “Performance-linked compensation (monthly compensation)” is determined based on the degree of achievement of annual performance using the following formula. [Short-term performance-linked compensation] Short-term performance-linked remuneration = Standard amount for payment by position × Performance evaluation coefficient ※Performance assessment coefficient: Determined by a matrix table using ROIC and net income (attributable to owners of the parent) for the previous fiscal year for which thresholds are set as indicators (coefficient: 0.00 to 4.00) Directors in charge of internal companies will be added or deducted from short-term performance-linked remuneration based on the sales growth rate, degree of improvement in operating income, degree of improvement in ROIC, R&D indicators, environmental indicators, etc. of the company.
―86―
(Translation) This document has been translated from the Japanese original for the convenience of overseas stakeholders. In the event of any discrepancy between this document and the Japanese original, the original shall prevail.
iv. Share-based compensation is determined based on the following formula, utilizing the system of the Stock Benefit Trust (BBT) and depending on the degree of achievement of the Medium-Term Management Plan. [Share-based compensation granted at the time of service] Share-based compensation delivered at the time of service = Share-based compensation points by position × Performance evaluation coefficient × Mid-term Management Plan achievement coefficient ※Performance assessment coefficient: Determined by a matrix table using ROIC and net income (attributable to owners of the parent) for the previous fiscal year for which thresholds are set as indicators (coefficient: 0.00 to 4.00) ※ Coefficient of achievement under the medium-term management plan (three years): Set based on the degree of achievement of net sales and operating income set forth in the medium-term management plan (0 to 0.5) The vesting of points will be the date of the ordinary general meeting of shareholders for the last fiscal year ending within three years after the granting of points. [Stock-based compensation at the time of retirement] Share-based remuneration at the time of retirement = Share-based remuneration points by position The vesting of the delivery points shall be the date of resignation as a director. v. The remuneration of directors is based on a percentage distribution that emphasizes linkage to performance and shareholder value. Fixed compensation Position
Basic remuneration
Incentive fee Grant-type at the time Short-term of service performance Stock-based Linked remuneration compensation
Grant-type at retirement Stock-based compensation
Chairman of the Board and President
25%
35%
25%
15%
Director
25%
35%
25%
15%
(NOTE)This table is a model based on a 100% achievement rate for performance-linked remuneration, with the median value for each position.
vi. Remuneration for Outside Directors and the Audit & Supervisory Board Members is limited to fixed remuneration, in view of the fact that the Company is independent from the execution of business, and the portion reflecting business performance is excluded. vii. In the event that there is a material change in the performance of the previous fiscal year that serves as the basis for the calculation of performance-linked remuneration as a result of the restatement of prior fiscal years due to inappropriate accounting, etc., or in the event of a serious damage to the Company due to an illegal act of an officer, etc., the Company is able to request the full amount of performance-linked remuneration or the return of a portion of the remuneration. 3) Approach to Performance-Linked Compensation Indicators The performance-linked remuneration metrics paid to directors (excluding outside directors) are based on "ROIC" and "Net income (attributable to owners of the parent company)", which are the achievements of all employees' activities and the main indices leading to improved ROE. As a result, all directors are aware of the cost of capital and the dividend payout ratio, and we will promote management that is conscious of the sustainable growth of our group. In addition to management indicators such as the degree of ROIC improvement, directors in charge of business operations are provided with R&D indicators for promoting the creation of intellectual property, environmental indicators for reducing CO₂ emissions, and other indicators to provide incentives for improving business performance over the medium to long term. In addition, for the degree of achievement of the Medium-Term Management Plan, we have adopted "Net sales" and "Operating income" with the aim of promoting activities that are the results of all directors and employees' business activities and that unify the vector. The above indicators may be added to or deducted from the amount of impact caused by events that are not attributable to our management decisions. [Results of Key Performance-Based Compensation Indicators] ROIC
Net sales 3.4%
323,384 million yen
Operating income 15,012 million yen
Net income 10,188 million yen
Performance-linked remuneration for the fiscal year under review is calculated based on the figures for FY2024 which includes hydraulic equipment business result.
―87―
(Translation) This document has been translated from the Japanese original for the convenience of overseas stakeholders. In the event of any discrepancy between this document and the Japanese original, the original shall prevail.
- Method of Determination of Remuneration, etc. The Compensation Committee, which is composed of one internal director and four independent outside officers, deliberates and reports on the policy, compensation structure, and level of remuneration for directors, as well as the amount paid to each director, and the Board of Directors determines the amount. Remuneration for Audit & Supervisory Board members is determined after consultation with Audit & Supervisory Board members. The activities of the Committee for deliberating and determining director remuneration for the current fiscal year are as follows. [Number of Committee Meetings (from January to December 2025)] Committee, etc.
Number of meetings
Compensation Committee
2 times
Board of Directors
2 times
(5) 【Status of shareholding】 ①
SCriteria and principles for classifying investment shares We do not hold shares for net investment purposes, and all shares are classified as investment shares for purposes other than net investment purposes (hereafter, "strategic shareholdings"). Shares that are for net investment purposes are those whose purpose is to receive profits from changes in stock prices or dividends.
②
Investments in shares held for purposes other than net investment
- Method of verifying the rationality of holding policy and details of verification by the Board of Directors, etc. regarding the appropriateness of holding individual issues We hold strategic stockholdings only if they contribute to maintaining and enhancing our corporate value. In light of the situation at the end of the most recent fiscal year, the Company's basic policy is to dispose of and reduce strategic shareholdings as soon as possible. Under this policy, the Board of Directors annually examines whether the holding purpose is appropriate for each individual issue and whether the benefits and risks associated with holding are commensurate with the cost of capital, based on certain criteria, and reviews whether or not to continue holding shares and the number of shares. As a result of the verification, any issue deemed inappropriate for continuous holding will be sold without delay after considering the stock price, market trends, and other factors.
- Number of issues and balance sheet amount Number of issues (issue)
Total amount on the Balance Sheet (Million yen)
Unlisted stocks
17
406
Shares other than unlisted shares
5
6,208
(Issues with an increase in the number of shares in the current fiscal year) Number of issues (issue) Unlisted stocks
Total acquisition cost related to increase in number of shares (Million yen)
Reason for the increase in the number of shares
-
-
-
-
-
Shares other than unlisted shares
(Issues with an increase in the number of shares in the current fiscal year) Number of Total sales price related to issues decrease in number of shares (issue) (Million yen) Unlisted stocks
-
-
Shares other than unlisted shares
3
440
―88―
(Translation) This document has been translated from the Japanese original for the convenience of overseas stakeholders. In the event of any discrepancy between this document and the Japanese original, the original shall prevail.
- Information on the number of shares and the amount recorded on the balance sheet for each issue of specified investment shares and deemed holding shares Specified investment shares Current fiscal year Previous fiscal year Number of shares Balance Sheet Amount (Millions yen)
Issue
ShareNumber of shares Outline of holding purpose and business alliance, holdings quantitative effect of holding shares and reasons for Balance Sheet in the the increase in the number of shares Amount Company (Millions yen)
SINFONIA TECHNOLOGY CO., LTD.
400,000
400,000
3,628
2,568
Central Railway Company
Japan
500,000
500,000
2,169
1,483
East Railway Company
Japan
76,500
76,500
316
214
38,587
38,587
80
78
4,000
20,000
15
44
66,997
257
43,509
144
Sanyo Electric Railway Co., Ltd. The Diesel Ltd.
Hanshin Works,
Keio Corporation
Kintetsu Group Holdings Co.,Ltd.
We are primarily a business partner in Transport Solutions business and hold them to maintain and strengthen business relations.
Yes
It is a customer in Transport Solutions business and is owned to maintain and strengthen business relations.
Yes
It is a customer in Transport Solutions business and is owned to maintain and strengthen business relations.
None
It is a customer in Transport Solutions business and is owned to maintain and strengthen business relations.
Yes
It is a customer in Transport Solutions business and is owned to maintain and strengthen business relations.
None
Yes
None
(NOTE) Quantitative holding effects are not shown because they relate to trade secrets. The method of verifying the rationality of the holdings is described in "1) Method of verifying the rationality of holding policy and details of verification by the Board of Directors, etc. regarding the appropriateness of holding individual issues” ③
Investment shares held for pure investment purposes Not applicable
④ Securities for which the purpose of holding investment shares is changed from a pure investment purpose to a purpose other than a pure investment purpose in the current fiscal year Not applicable ⑤ Securities for which the purpose of holding investment shares is changed from a purpose other than pure investment to a pure investment purpose in the current fiscal year and during the past 4 fiscal years Not applicable.
―89―
(Translation) This document has been translated from the Japanese original for the convenience of overseas stakeholders. In the event of any discrepancy between this document and the Japanese original, the original shall prevail.
No.5 【Accounting Status】
- Preparation of Consolidated Financial Statements and Financial Statements (1) Our consolidated financial statements have been prepared in accordance with International Financial Reporting Standards ("IFRS") pursuant to the provisions of Article 312 of the "Regulations Concerning Terminology, Forms and Preparation Methods of Consolidated Financial Statements" (Ministry of Finance Ministerial Order No. 28 of issued in 1976, hereinafter referred to as the "Regulations Concerning Consolidated Financial Statements"). (2) Our financial statements have been prepared in accordance with the Regulations on Terminology, Forms and Preparation Methods of Financial Statements (Ordinance of the Ministry of Finance No. 59 of issued in 1963; hereinafter referred to as the "Regulations on Financial Statements, etc."). We are a company submitting special financial statements and preparing financial statements in accordance with the provisions of Article 127 of the Ordinance on Financial Statements, etc (3) The consolidated financial statements and financial statements have been rounded to the nearest unit.
- Audit Certification Pursuant to Article 193-2-1 of the Financial Instruments and Exchange Act, we have audited the consolidated financial statements for the fiscal year (January 1, 2025 to December 31, 2025) and the financial statements for the fiscal year (January 1, 2025 to December 31, 2025) by KPMG AZSA LLC In addition, we have submitted a Corrections Report of an Annual Securities Report, pursuant to Article 24-2-1 of the Financial Instruments and Exchange Act, and the consolidated financial statements and the non-consolidated financial statements after correction have been audited by KPMG AZSA LLC.
- Special efforts to ensure the appropriateness of the consolidated financial statements, etc. and the development of a system to properly prepare the consolidated financial statements, etc. based on IFRS As shown below, we are making special efforts to ensure the appropriateness of our consolidated financial statements and establishing a system for the proper preparation of consolidated financial statements based on IFRS. (1) In order to appropriately grasp the content of accounting standards, etc., and develop a system that enables us to respond to changes in accounting standards, etc. in a timely and accurate manner, we have joined the Financial Accounting Standards Corporation and participate in seminars conducted by auditing firms, etc. In addition, internal study meetings on the content of IFRS are held regularly to promote the acquisition of IFRS knowledge to practical personnel. (2) In applying IFRS, the Company obtains press releases and pronouncements issued by the International Accounting Standards Board from time to time to determine the latest standards. In addition, in order to prepare appropriate consolidated financial statements based on IFRS, we have prepared group-wide accounting policies in accordance with IFRS and account for them based on those policies
―90―
(Translation) This document has been translated from the Japanese original for the convenience of overseas stakeholders. In the event of any discrepancy between this document and the Japanese original, the original shall prevail.
1 【Consolidated Financial Statements and Notes to the Consolidated Financial Statement 】 (1) 【Consolidated Financial Statements】 ① 【Consolidated Statement of Financial Position】 (Million yen) Note No.
End of consolidated FY2024 (as of December 31, 2024)
End of consolidated FY2025 (as of December 31, 2025)
Assets Current assets Cash and cash equivalents
8
74,476
73,340
Trade receivables
9,24
88,932
75,421
Contract assets
26
3,212
3,207
Other receivables
9
1,361
1,524
Inventories
10
53,273
52,838
Other financial assets
24
698
715
Other current assets Subtotal Assets held for sale
11
Total current assets
7,016
5,715
228,970
212,761
-
43,665
228,970
256,426
Non-current assets Property, plant and equipment
12,14
114,340
101,683
Intangible assets
13,14
12,955
13,477
Right-of-use assets
14,15
12,122
12,822
Goodwill
13,14
26,259
25,817
Investment property
14,16
9,309
9,143
Investments accounted for using the equity method
17
24,348
24,976
Other financial assets
24
14,648
17,082
Deferred tax assets
23
3,430
4,381
Other non-current assets
3,464
826
Total non-current assets
220,875
210,206
449,845
466,632
Total assets
―91―
(Translation) This document has been translated from the Japanese original for the convenience of overseas stakeholders. In the event of any discrepancy between this document and the Japanese original, the original shall prevail.
(Million yen) Note No.
End of consolidated FY2024 (as of December 31, 2024)
End of consolidated FY2025 (as of December 31, 2025)
Liabilities and equity Liabilities Current liabilities Operating payables
18,24
51,178
45,161
Contract liabilities
26
11,463
13,111
Borrowings
21,24
21,817
34,946
Other payables
18,24
16,030
6,848
2,461
6,462
Provisions
19
2,233
3,497
Lease liabilities
21,24
3,319
3,609
Other financial liabilities
24
28
29
Other current liabilities
20
8,582 117,111
8,757
11
-
12,256
117,111
134,677
Income taxes payable
Subtotal Liabilities directly associated with assets held for sale Total current liabilities
122,421
Non-current liabilities Borrowings
21,24
10,067
10,039
Lease liabilities
21,24
10,634
11,202
Liabilities concerning retirement benefit
22
8,262
6,454
Deferred tax liabilities
23
8,514
8,303
Other financial liabilities
24
670
898
Provisions
19
-
140
Other non-current liabilities
20
4,844
4,551
42,990
41,587
160,101
176,264
10,000
10,000
Total non-current liabilities Total liabilities Equity Capital stock
25
Share premium
25
14,998
14,969
Retained earnings
25
225,269 -3,638 25,930
219,443 -3,008
-
1,297
272,559
273,466
Treasury stocks
25
Other components of equity
25
Other components of equity related to disposal groups held for sale Equity attributable to owners of the parent
30,764
Non-controlling interests
17,185
16,902
Total equity
289,744
290,368
449,845
466,632
Total liabilities and equity
―92―
(Translation) This document has been translated from the Japanese original for the convenience of overseas stakeholders. In the event of any discrepancy between this document and the Japanese original, the original shall prevail.
② 【Consolidated Income Statement】 (Million yen) Previous fiscal year (ended December 2024) (January 1, 2024 to December 31, 2024) (Consolidated basis)
Note No.
Current fiscal year (ended December 2025) (January 1, 2025 to December 31, 2025) (Consolidated basis)
Continuing operations Net sales
7,26
280,458
307,912
Cost of sales
27
-198,589
81,869
-214,239
Gross profit
93,673
Other income
28
1,158
1,862
Selling, general and administrative expense
27
Other expenses
28
-67,633
-71,626
Operating income
7
13,157
20,956
Financial income
29
1,035
992
Financial costs
29
Equity in earnings of affiliates
17
-917
950
-1,105
14,225
21,983
-3,920
10,305
-5,833
16,150
1,460
1,035
11,765
17,185
Owners of the parent
10,188
15,255
Non-controlling interests
1,577
1,930
Net income
11,765
17,185
Continuing operations
77.95
127.59
Discontinued operations
6.87
0.29
84.83
127.87
Continuing operations
77.95
127.58
Discontinued operations
6.87
0.29
84.82
127.87
-2,238
Income before tax Income tax expense
23
Income from continuing operations
-2,954
1,140
Discontinued operations Income from discontinued operations
33
Net income
Net income attributable to
Net income per share Basic earnings per share (Yen)
Basic earnings per share (Yen)
31
Diluted earnings per share (Yen)
Diluted earnings per share (Yen)
31
―93―
(Translation) This document has been translated from the Japanese original for the convenience of overseas stakeholders. In the event of any discrepancy between this document and the Japanese original, the original shall prevail.
③ 【Consolidated Statements of Comprehensive Income】
Note No. Net income
Previous fiscal year (ended December 2024) (January 1, 2024 to December 31, 2024) (Consolidated basis) 11,765
(Million yen) Current fiscal year (ended December 2025) (January 1, 2025 to December 31, 2025) (Consolidated basis) 17,185
Other comprehensive income Items that will not be reclassified to profit or loss Remeasurements liabilities (assets)
of
defined
benefit
Net changes in financial assets measured at fair value through other comprehensive income Total components that will not be reclassified to profit or loss Components that will be reclassified to profit or loss Exchange differences on foreign operations Share of other comprehensive income of investments accounted for using equity method Total components that will be reclassified to profit or loss
25
2,326
25
1,219
-1,215 1,311
3,546
96
25
6,590
5,359
25
284
44
6,873
5,403
Other comprehensive income after taxes
10,419
5,500
Total comprehensive income
22,184
22,685
Owners of the parent
19,360
20,394
Non-controlling interests
2,824
2,291
Total comprehensive income
22,184
22,685
Comprehensive income attributable to
―94―
(Translation) This document has been translated from the Japanese original for the convenience of overseas stakeholders. In the event of any discrepancy between this document and the Japanese original, the original shall prevail.
④ 【Consolidated Statement of Changes in Equity】 FY2024 (From January 1, 2024 to December 31, 2024) (Million yen) Equity attributable to owners of the parent Note No.
Balance as of January 1, 2024 Net income Other comprehensive income
25
Total comprehensive income
Other components of equity Retained earnings
Capital stock
Share premium
Treasury stocks
10,000
15,139
222,362
-
-
10,188
-
-
-
Exchange Valuation differences on difference due to change in fair foreign operations value
-3,943
15,516
3,646
-
-
-
-
-
5,667
1,213
-
10,188
-
5,667
1,213
-34
304
-
-
-9,651
-
-
-
-
-
-
-
Acquisition, sales, etc. of treasury shares
25
-
-
Dividends
25
-
-
Increase (decrease) in noncontrolling interests due to capital increase of subsidiaries
-
-
Transfer from other components of equity to retained earnings
-
-
2,404
-
-
-112
-
-
-
-
-
-7,281
304
-
-3,638
21,183
-112
Share-based transactions
compensation
30
Total transactions with owners, etc.
-
-142
Balance as of December 31, 2024
10,000
14,998
-142
225,269
Equity attributable to owners of the parent Other components of equity Note No. Remeasurements of net defined Total benefit liability (asset) Balance as of January 1, 2024 Net income Other comprehensive income
25
Total comprehensive income
Total equity attributable to owners of the parent
Non-controlling interests
Total equity
-
19,162
262,721
15,424
278,145
-
-
10,188
1,577
11,765
2,293
9,172
9,172
1,247
10,419
2,293
9,172
19,360
2,824
22,184
Acquisition, sales, etc. of treasury shares
25
-
-
270
-
270
Dividends
25
-
-
-
-
-9,651
-1,249
-10,900
-2,293
-2,404
-
-
-
-
-
-
-2,293
-2,404
-142
-142
Increase (decrease) in noncontrolling interests due to capital increase of subsidiaries Transfer from other components of equity to retained earnings Share-based transactions
compensation
Total transactions with owners, etc. Balance as of December 31, 2024
30
-
25,930
―95―
-
-9,522
272,559
185
-1,063
17,185
185
-10,586
289,744
4,747
(Translation) This document has been translated from the Japanese original for the convenience of overseas stakeholders. In the event of any discrepancy between this document and the Japanese original, the original shall prevail.
FY2025 (From January 1, 2025 to December 31, 2025) (Million yen) Equity attributable to owners of the parent Note No.
Balance as of January 1, 2025 Net income Other comprehensive income
25
Total comprehensive income
Other components of equity Capital stock
Share premium
Retained earnings
Treasury shares
Exchange differences on foreign operations
Valuation difference due to change in fair value
10,000
14,998
225,269
4,747
-
15,255
-3,638
21,183
-
-
-
-
-
-
-
-
5,063
1,303
-
-
15,255
-
5,063
1,303
-9,807
-
-
Acquisition, sales, etc. of treasury shares
25
-
-
-
Retirement of treasury stock
25
-
-
-
-
25
-
-
-10,437
10,437
Dividends
-
-
-
Change in reporting entities
-
-
-9,651 -
-
-
-
Changes in ownership interest in subsidiaries l
-
28
-
-
-
-
Other components of equity related to disposal groups held for sale
-
-
-
-
-
Transfer from other components of equity to retained earnings
-1,297
-
-
-993
-
-
-234
-
-57
-
-
-
-
-21,081
630
-1,297
-234
Share-based compensation transactions
30
Total transactions with owners, etc.
-29
-
Balance as of December 31, 2025
10,000
14,969
219,443
24,948
-3,008
5,816
Equity attributable to owners of the parent Note No.
Balance as of January 1, 2025
Remeasurements of net defined benefit liability (asset)
-
Net income Other comprehensive income
Other components of equity
25
Total comprehensive income
Other components of equity related to disposal groups held for sale
Total equity attributable to owners of the parent
Noncontrolling interests
Total equity
25,930
-
272,559
17,185
289,744
Total
-
-
-
15,255
1,930
17,185
-1,226
5,139
-
5,139
360
5,500
5,139
-
20,394
2,291
22,685
-9,807
-
-
-
-9,807
Acquisition, sales, etc. of treasury shares
25
-1,226 -
-
-
Retirement of treasury stock
25
-
-
-
Dividends
25
-
-
-
-
Change in reporting entities
-
-
-
-9,651
-2,637
130
-12,288
Change in stake in consolidated subsidiaries with continuing control
-
-
-
28
Other components of equity related to disposal groups held for sale
-67
-39
-
-1,297
1,297
-
-
-
1,226
993
-
-
-
-
-
-
-
-
Total transactions with owners, etc.
1,226
1,297
-19,487
-2,574
-57
-22,060
Balance as of December 31, 2025
-
-305
-57
1,297
273,466
16,902
290,368
Transfer from other components of equity to retained earnings Share-based compensation transactions
30
30,764
―96―
-
130
(Translation) This document has been translated from the Japanese original for the convenience of overseas stakeholders. In the event of any discrepancy between this document and the Japanese original, the original shall prevail.
⑤ 【Consolidated Statements of Cash Flows】 (Million yen) Note No. Cash flows from operating activities Net income Net income from discontinued operations Depreciation and amortization Gain from negative goodwill Impairment Loss Increase (decrease) in liabilities concerning retirement benefits Interest and dividend income Interest expenses Decrease (Increase) in valuation on investment securities Equity loss (gain) in earnings of affiliates Loss (gain) on sales of fixed assets Provision for loss on liquidation of subsidiaries Expenses of income tax Decrease (increase) in trade receivables Decrease (increase) in inventories Increase (decrease) in operating payables Others Subtotal Interest received
14
Interest paid Subsidy received
10,305 1,460 16,469 1,632 -
25
8
Effect of exchange rate changes on cash and cash equivalents
1,069
439
-736
-847 -
26,650
-6,468
32,824
-100 -24,898 -3,453
0 -13,201 -2,814
-1,128 749 99 -28,733
-455 457 1 -15,725
77,835
74,476
82 10,092 -240 -3,424 -2 71 -9,653 185 -1,249 - -4,137 -6,220
-5,203
285
12,590 - -183 -3,669 -10,065 67 -9,648 - -2,610 -39 -13,559 3,539
2,861
1,599 -6,274
Net increase/decrease in cash and cash equivalents included in assets of disposal groups classified as held for sale
11
-
Cash and cash equivalents at end of term
8
74,476
―97―
217
-451 864 -39 -1,140 167 1,324 7,599 2,165 -3,632 -4,264 296 38,078 356
-
21 21 21 21
16,150 1,035 17,258 989 -461
-456 733 33 -950 358 - 4,419 -3,696 -642 -1,168 1,738 29,669 356
2,759
Income taxes refunded (paid)
Cash and cash equivalents at beginning of term
FY 2025 (January 1, 2025 to December 31, 2025)
-567
Dividend received
Cash flows from operating activities Cash flows from investing activities Decrease in time deposits (Increase) Purchases of tangible fixed assets Purchases of intangible fixed assets Payments for acquisition of subsidiaries resulting in a change in the scope of consolidation Payments for acquisition of investment securities Proceeds from sale of investment securities Other Cash flows from investing activities Cash flows from financing activities Increase (decrease) in short-term bank loans Proceeds from long-term loans payable Repayment of long-term loans payable Payments of lease liabilities Payment for purchase of treasury stock Proceeds from sale of treasury stock Cash dividends paid Proceeds from payments from non-controlling interests Dividends paid to non-controlling interests Other Cash flows from financing activities Increase (decrease) in cash and cash equivalents
FY 2024 (January 1, 2024 to December 31, 2024)
73,340
(Translation) This document has been translated from the Japanese original for the convenience of overseas stakeholders. In the event of any discrepancy between this document and the Japanese original, the original shall prevail.
【Notes to Consolidated Financial Statements】
-
Reporting company Nabtesco Corporation (the "Company") is a company located in Japan. Our consolidated financial statements are composed of the interests in us and our subsidiaries (together, the "Group") and affiliates, with an ended date of December 31, 2025. Our main businesses are Component Solutions Business, Transport Solutions Business, and Accessibility Solutions Business. The details are described in Note "7. Business Segments."
-
Basis of preparation (1) Compliance with IFRS The consolidated financial statements have been prepared in accordance with IFRS pursuant to the provisions of Article 312 of the Ordinance on Consolidated Financial Statements as they satisfy all of the requirements of "Designated International Accounting Standards Designated Companies" set forth in Article 1-2 of the Ordinance on Consolidated Financial Statements. The consolidated financial statements for the fiscal year ended December 31, 2025, which were approved by our Board of Directors on March 25, 2026, were corrected and approved by our Board of Directors on September 30, 2026. . (2) Basis for measurement The consolidated financial statements of our group have been prepared on a historical cost basis, except for financial instruments measured at fair value, as described in Note 3, "Significant Accounting Policies," below. (3) Functional and presentation currencies The consolidated financial statements of our group represent the Japanese yen, which is our functional currency.
-
Important accounting policies The significant accounting policies applied in these consolidated financial statements are the same as those applied for all periods presented in these consolidated financial statements, unless otherwise indicated. (1) Basis of consolidation ① Subsidiary Subsidiaries are companies controlled by our group. The financial statements of subsidiaries are included in the consolidated financial statements from the date of inception to the date of termination of control. The accounting policies of the subsidiaries have been changed as necessary to align with the accounting policies applied by our group. Changes in ownership interests in subsidiaries that do not result in loss of control are accounted for as equity transactions. The difference between the non-controlling interest adjustment and the fair value of the consideration is recognized directly in equity as equity attributable to owners of the parent. Unrealized gains and losses arising from balances and transactions within our group and from transactions within our group are eliminated in the preparation of the consolidated financial statements. For subsidiaries with different closing dates, financial statements based on provisional closing as of the consolidated closing date are used. ② Investments in Affiliated Companies. Affiliated companies are companies over which the Group has significant influence, but not control, over their financial and operating policies. If our group holds more than 20% of the voting power of another company, we estimate that our group has significant influence over that other company. Investments in affiliates are accounted for using the equity method and are recognized at cost at the time of acquisition. Under the equity method, if there is a difference between the investment at the date of the investment and the corresponding investee's capital,
―98―
(Translation) This document has been translated from the Japanese original for the convenience of overseas stakeholders. In the event of any discrepancy between this document and the Japanese original, the original shall prevail.
such difference is included in the carrying amount of the investment as goodwill. The consolidated financial statements include the recognition of our group's share of net income or loss and other comprehensive income from the date of significant influence through the date of loss of significant influence, and adjustments are made to the amounts invested. Until our proportionate share of the loss of an affiliate exceeds our proportionate share of the investment in the entity, such proportionate share is charged to net income. No further excess is recognized as a loss unless our group incurs or pays a liability (legal or constructive) on behalf of an affiliate. In applying the equity method of accounting, we make adjustments necessary to align the accounting policies of our equity method investees with the accounting policies of our group. In addition, the consolidated financial statements include investments in affiliates whose fiscal year-end differs from our fiscal year-end because it is not practicable to unify the fiscal year-end to our fiscal year-end due to relationships with other shareholders and other factors. Significant transactions or events in the period arising from differences in the balance sheet dates are adjusted. The fiscal year-end of the affiliated companies accounted for by the equity method is mainly March 31. Unrealized gains and losses arising from transactions with affiliates accounted for by the equity method are deducted from investments to the extent of our Group's ownership interest in the investee. (2) Business Combination Business combinations are accounted for using the acquisition method. Identifiable assets and liabilities of the acquired company are measured at fair value at the date of acquisition. Goodwill is measured as the excess of the sum of the consideration transferred in a business combination, the amount of the noncontrolling interest in the acquired companies, and the fair value of the equity interest in the acquired companies previously held by the acquired companies over the net value of identifiable assets and liabilities at the date of acquisition. Acquisition-related costs are expensed in the period in which they are incurred. In addition, with respect to business combination transactions under common control, we account for them based on the book value prior to the occurrence of the business combination transaction. (3) Foreign currency ① Functional and Presentation Currencies The financial statements of each company in our group are prepared in the functional currency, which is the currency of the primary economic environment in which the company operates. The consolidated financial statements of our group represent the Japanese yen, which is our functional currency. ② Foreign Currency Transactions Transactions denominated in foreign currencies are translated into the functional currency at the exchange rates in effect at the transaction date. Monetary assets and liabilities denominated in foreign currencies at the end of the fiscal year are translated into the functional currency at the exchange rates in effect at the end of the fiscal year. Non-monetary assets and liabilities denominated in foreign currencies measured at cost are translated into the functional currency at the exchange rates in effect at the transaction date. Non-monetary assets and liabilities measured at fair value that are denominated in foreign currencies are translated into the functional currency at the exchange rate prevailing at the measurement date of such fair value. Exchange differences arising from translation are recognized in profit or loss. However, differences arising from the translation of financial instruments measured at fair value with the changes recognized in other comprehensive incomes are recorded in other comprehensive income. ③ Foreign operations Assets and liabilities of foreign operations are translated into Japanese yen at the year-end exchange rates. Revenues and expenses of foreign operations are translated into Japanese yen using the average exchange rate, unless the exchange rate fluctuates significantly. Translation differences arising from the translation of the financial statements of foreign operations are recognized in other comprehensive income and included in other components of equity. When foreign operations are disposed of, translation adjustments are reclassified to profit or loss. (4) Cash and cash equivalents Cash and cash equivalents include cash on hand, readily available deposits and short-term investments with original maturities of 3 months or less that are readily convertible to known amounts of cash and present insignificant risk of changes in value. (5) Inventories Inventories are measured at the lower of cost and net realizable value. The cost of inventories is determined principally based on the average cost method, which includes the cost of acquiring inventories, manufacturing and processing costs, and other costs incurred in bringing the inventories to their current location and condition. Net realizable value is the estimated selling price in the ordinary course of business less estimated costs to complete and estimated selling costs.
―99―
(Translation) This document has been translated from the Japanese original for the convenience of overseas stakeholders. In the event of any discrepancy between this document and the Japanese original, the original shall prevail.
(6) Financial Instruments ① Non-derivative financial assets Our group initially recognizes financial assets on the transaction date on which our group becomes a party to a contract for that financial instrument. Financial assets are initially measured at fair value. For financial assets that are not measured at fair value through profit or loss after initial recognition, transaction costs incurred directly to acquire the financial assets are included in the initial measurement amount. a Financial assets measured at amortized cost Financial assets are classified as financial assets measured at amortized cost when the following criteria are met. ・It is held based on a business model whose objective is to hold financial assets to recover contractual cash flows. ・The contractual terms of the financial assets give rise on specified dates to cash flows that are solely payments of principal and interest on the principal balance. Measurement after initial recognition is carried at amortized cost using the effective interest method. A loss valuation allowance is recognized for expected credit losses on financial assets measured at amortized cost. At the end of each fiscal year, our group compares the credit risk of financial assets as of the end of the fiscal year with the initial recognition date to evaluate whether there has been a significant increase in the credit risk associated with financial assets. If the credit risk associated with a financial asset has increased significantly since initial recognition, we measure the loss valuation allowance associated with that financial asset at an amount equal to the expected credit loss for the full period, and if not significantly increased, at an amount equal to the expected credit loss for the 12-month period. Notwithstanding the foregoing, for trade receivables and contract assets that do not contain a significant financial component, the Company measures the loss valuation allowance at an amount equal to the expected credit loss for the entire period. The provision for loss valuation allowance related to financial assets is recognized in profit or loss. If an event occurs that reduces the loss valuation allowance, the reversal of the loss valuation allowance is recognized in profit or loss. b Financial assets measured at fair value through other comprehensive income At initial recognition, our group elects to recognize changes in the fair value of equity instruments other than those held for trading in other comprehensive income, in principle. When the Company elects to recognize through other comprehensive income, the designation is made and applied on an ongoing basis as irrevocable. Subsequent to initial recognition, measurements are carried at fair value through other comprehensive income. When such financial assets are sold, the cumulative gain or loss recognized is reclassified from other comprehensive income to retained earnings at the time of sale. Dividends from such financial assets are recognized in profit or loss. c Financial assets measured at fair value through profit or loss Our group classifies financial assets other than financial assets measured at amortized cost or at fair value through other comprehensive income as financial assets measured at fair value through profit or loss. Subsequent to initial recognition, measurements are carried at fair value through profit or loss. Our group derecognizes financial assets when the contractual rights to cash flows have expired or have been transferred, or substantially all the risks and rewards of ownership have been transferred.
―100―
(Translation) This document has been translated from the Japanese original for the convenience of overseas stakeholders. In the event of any discrepancy between this document and the Japanese original, the original shall prevail.
② Non-derivative financial liabilities Our group initially recognizes the debt securities to be issued on the date of such issuance. All other financial liabilities are recognized on the transaction date on which our group becomes a party to the contract for the financial instrument. a Financial liabilities measured at amortized cost Our group initially measures financial liabilities measured at amortized cost with fair value plus direct transaction costs. Subsequent to initial recognition, they are measured at amortized cost using the effective interest method. b Financial liabilities measured at fair value through profit or loss Our group classifies financial liabilities other than financial liabilities measured at amortized cost as financial liabilities measured at fair value through profit or loss. Subsequent to initial recognition, measurements are carried at fair value through profit or loss. Our group derecognizes financial liabilities when contractual obligations are discharged, cancelled or expired. ③ Derivative Financial Instruments Our Group holds derivative financial instruments for the purpose of avoiding and mitigating the risk of fluctuations in foreign exchange rates and interest rates. Derivatives are initially recognized at fair value and the related transaction costs are recognized in profit or loss as incurred. Subsequent to initial recognition, measurements are carried at fair value through profit or loss. (7) Property, plant and equipment ① Recognition and Measurement Property and equipment are measured at cost less accumulated depreciation and accumulated impairment losses using the cost model. Cost includes the following costs directly related to the acquisition of assets: ・Employee benefits and assembly, installation and other costs directly arising from the manufacture of assets ・Estimates of the costs of dismantling and removing assets if the obligation is to remove or remove them. ・Capitalized borrowing costs ② Depreciation Property and equipment are depreciated using the straight-line method over the estimated useful lives of the respective components. Depreciation is calculated based on the depreciable value. Amortizable value is calculated by subtracting the residual value from the acquisition cost of the assets. Estimated useful lives are as follows: Buildings and structures Machinery and equipment Tools, furniture and fixtures
3 ~ 4 ~ 2 ~
50 17 20
Year Year Year
Depreciation methods, useful lives and residual values are reviewed at the end of each fiscal year and revised as necessary.
―101―
(Translation) This document has been translated from the Japanese original for the convenience of overseas stakeholders. In the event of any discrepancy between this document and the Japanese original, the original shall prevail.
(8) Goodwill and intangible assets ① Goodwill Measurement at the initial recognition is described in "(2) Business combinations." Subsequent to initial recognition, goodwill is stated at cost, less accumulated impairment losses. Goodwill is not amortized but is tested for impairment annually or whenever indicators of impairment exist. Impairment losses related to goodwill are not reversed. ② Research and development costs Expenditures for research activities conducted for the purpose of obtaining new scientific or technical knowledge and understanding are recognized as profit or loss as incurred. ③ Other intangible assets Other intangible assets are measured at cost less accumulated amortization and accumulated impairment losses using the cost model. In addition, intangible assets that are identified in a business combination separately from goodwill are measured at their acquisition date fair values as acquisition costs. Amortization is based on the straight-line method over the estimated useful life of the asset from the date the asset becomes available for use. Depreciation is calculated based on the depreciable value. Amortizable value is calculated by subtracting the residual value from the acquisition cost of the assets. Estimated useful lives are as follows: Software
3 ~
16
Year
Customer related asset
8 ~
19
Year
Technology assets
8 ~
10
Year
Others
7 ~
20
Year
Amortization methods, useful lives and residual values are reviewed at the end of each fiscal year and revised as necessary. Indefinite-lived intangible assets are stated at cost less accumulated impairment losses. In addition, they are not amortized but are tested for impairment annually or whenever indicators of impairment exist. (9) Lease (Lessee) ① Lease liabilities Lease liabilities are recognized from the inception date of the lease and are measured at the present value of lease payments that have not been paid. The discount rate is the calculated interest rate of the lease or the additional borrowing rate of our group if the calculated interest rate cannot be easily determined. Subsequent to the inception date, amounts will increase or decrease due to interest and lease payments on the lease liabilities. ② Right-of-use asset The right-of-use asset is measured at cost, adjusted for initial direct costs, prepaid lease payments, etc., to the initial measurement of the lease liability from the inception date of the lease. Subsequent to the inception date, the cost model is applied and measured net of accumulated depreciation and impairment losses. Amortized on a straight-line basis over the shorter of the useful life of the right-of-use asset or the end of the lease term from the lease commencement date. In addition, for short-term leases and leases where the underlying assets are small, the Company applies the exemption from recognition and does not recognize a right-of-use asset or a lease liability, but rather recognizes it as an expense on a straightline basis over the term of the lease. (Lessor) The Group classifies leases into finance leases and operating leases. A lease is classified as a finance lease if substantially all the risks and economic benefits associated with ownership of the underlying asset are transferred to the lessee; if all the risks and economic benefits associated with the ownership of the underlying assets are not substantially transferred to the lessee, then it is
―102―
(Translation) This document has been translated from the Japanese original for the convenience of overseas stakeholders. In the event of any discrepancy between this document and the Japanese original, the original shall prevail.
classified as an operating lease.
(10) Investment real estate Investment real estate is real estate held for the purpose of earning rental income or capital gains or both. The measurement and depreciation methods for investment properties are in accordance with property, plant and equipment. The estimated useful lives of the investment properties are 5 to 60 years. Depreciation methods, useful lives and residual values are reviewed at the end of each fiscal year and revised as necessary. (11) Assets held for sale Among assets or disposal groups for which the carrying amount is expected to be recovered principally through sale rather than through continuing use, assets that are currently available for immediate sale and for which the Group’s management has committed to a plan to sell, with the sale highly probable to be completed within one year, are classified as assets held for sale. (12)Impairment of non-financial assets The carrying value of our group's non-financial assets, excluding inventories, contract assets, assets held for sale, deferred tax assets and net defined benefit assets, is determined at each period end for indicators of impairment. If indicators of impairment are present, the recoverable amount of the asset is estimated. The recoverable amount of an asset or CGU is the greater of its value in use or fair value less costs to sell. In determining value in use, estimated future cash flows are discounted to present value using a pre-tax discount rate that reflects the time value of money and the risks specific to the asset. An impairment loss is recognized when the carrying amount of an asset or CGU exceeds its recoverable amount. For assets other than goodwill, previously recognized impairment losses are evaluated at the end of each period for indicators of loss reduction or extinguishment. If the estimates used in determining the recoverable amount change, the impairment loss is reversed. The reversal amount is limited to an amount not to exceed the carrying amount less depreciation and amortization if no impairment loss is recognized. The treatment of impairment losses related to goodwill is described in "(8) Goodwill and Intangible Assets ①Goodwill" and the treatment of impairment losses related to indefinite-lived intangible assets is described in "(8) Goodwill and Intangible Assets ③ Other Intangible Assets." (13) Employee benefit ①
Postretirement benefits Our Group has a retirement lump-sum payment plan and a pension plan as a postretirement benefit plan for employees. These plans are classified into defined contribution plans and defined benefit plans. a Defined contribution plan Costs related to postretirement benefits for defined contribution plans are recognized as an expense in the period in which the employees provide services. b Defined benefit plan The present value of defined benefit obligations and the related current service cost and prior service cost are calculated for each individual plan using the projected unit credit method. The discount rate is determined by establishing a discount period based on the expected period to future benefit payments and by reference to the market yield of high-quality corporate bonds at the end of the period corresponding to the discount period. Liabilities or assets related to defined benefit plans are calculated by deducting the fair value of plan assets from the present value of defined benefit obligations. Remeasurements of net defined benefit assets or liabilities are recognized in other comprehensive income in the period in which they occur and are transferred to retained earnings.
② Short-term employee benefits Short-term employee benefits are not discounted and are expensed as the related services are rendered.
―103―
(Translation) This document has been translated from the Japanese original for the convenience of overseas stakeholders. In the event of any discrepancy between this document and the Japanese original, the original shall prevail.
For bonuses, we recognize a liability for the estimated amount to be paid under those plans when our group has a current legal and constructive obligation to pay as a result of labor provided by employees in the past and the amount can be reliably estimated.
―104―
(Translation) This document has been translated from the Japanese original for the convenience of overseas stakeholders. In the event of any discrepancy between this document and the Japanese original, the original shall prevail.
(14) Reserves and contingent liabilities Provisions are recognized when, as a result of past events, our group has a legal or constructive obligation that is reasonably estimable and it is probable that an outflow of economic resources will occur to settle the obligation. The allowance is discounted to the present value of estimated future cash flows using a pre-tax discount rate that reflects the time value of money and the risks specific to the liability, if the time value of money is significant. Common stock Accrued warranty costs are provided for future expenditures, such as repair costs, which are incurred after delivery of the product, by estimating the amount of such costs incurred on a case-by-case basis. The allowance for losses on orders is provided for future losses on contract awards by individually estimating the estimated amount of losses on contracts awarded as of the end of the period. The provision for compensation losses is individually estimated and recorded, in order to provide for future losses related to compensation claims. The provision for losses on restructuring of affiliated companies is individually estimated and recorded, in order to provide for future losses arising from affiliated companies scheduled for restructuring. The provision for environmental remediation is individually estimated and recorded, in order to provide for future losses relating to environmental measures. If the Company has a liability that may be incurred as of the end of the fiscal year, and it cannot be ascertained if it is a liability as of the end of the fiscal year, or if it does not meet the recognition criteria for the allowance, it is recorded as a contingent liability. (15) Shareholders' Equity ① Common stock Common stock is classified as equity. Additional costs directly related to the issuance of common stock and stock options are recognized net of tax as a deduction of equity. ② Treasury stock When treasury stock is repurchased, consideration paid, including direct transaction costs, net of tax, is recognized as a deduction to equity. When treasury stock is disposed of, the difference between the consideration received and the carrying amount of treasury stock is recognized as equity. ③ Share-based payment transactions a Stock option system Until March 2017, we have introduced a stock option plan for our directors and executive officers (excluding outside directors, hereinafter referred to as "directors, etc.") that allows them to exercise their right to purchase our shares. Under the plan, stock options vest on the grant date of stock-based awards, and therefore are estimated at fair value at the grant date, and recognized as expense in a lump sum at the grant date, with the same amount recognized as equity. The fair value of options granted is determined using the Black-Scholes model, considering the terms and conditions of the options. This system was abolished in March 2017 (however, the stock options already granted to directors and others as stock-based compensation stock options that have not yet been exercised will continue to exist). b Board Benefit Trust Plan (Equity Settlement Type) In May 2017, we introduced an equity compensation plan to provide our directors, etc. with their own shares, etc. through trusts. Stock-based compensation is measured at the fair value of the services received and the corresponding increase in equity at the grant date (for equity instruments) and is recorded as an expense over the vesting period, with the same amount recognized as an increase in equity.
―105―
(Translation) This document has been translated from the Japanese original for the convenience of overseas stakeholders. In the event of any discrepancy between this document and the Japanese original, the original shall prevail.
(16) Revenue Our group recognizes revenue based on the following 5-step approach: Step 1: Identify Contracts with Customers Step 2: Identify Performance Obligations in Contracts Step 3: Calculate the transaction price Step 4: Allocate the transaction price to the performance obligations in the contract Step 5: Recognize revenue when the entity meets its performance obligations ① Performance obligations fulfilled at a point in time Our main business of the Group is the manufacture and sale of industrial robot parts, brake systems and door systems for railway vehicles, aircraft parts, brake systems and drive control systems for automobiles, marine vessel control systems, automatic door systems for buildings and general industries, and platform safety equipment. For the sale of these products, we recognize revenue principally at the time of delivery of the product as the customer often determines that control over the product and performance obligations will be satisfied at the time of delivery of the product. Revenue is measured at the consideration promised in customer contracts, less discounts, rebates and returns. ② Performance obligations to be met over a period of time Our group recognizes revenue in satisfaction of performance obligations over a period of time as control over products or services is transferred over a period of time if any of the following criteria are met: a
Consume the benefits provided by the customer as they perform at the same time.
b
The performance creates or appreciates the asset and the customer controls the creation or accretion of the asset.
c
It has the enforceable right to receive payment for the performance that it has completed to date, and does not create any other assets that can be diverted.
In our group, the revenue associated with performance obligations that are satisfied over a period of time is the performance obligation for platform safety equipment, etc. Revenue for platform safety equipment and other items is estimated and recognized on a progress basis. Progress is calculated as the ratio of actual costs to total estimated costs (input method). (17) Government subsidies Our group initially recognizes government subsidies as deferred revenue at fair value when the ancillary conditions for the subsidies are met and there is reasonable assurance that the subsidies will be received. Subsequent to initial recognition, subsidies related to assets are regularly recognized in profit or loss over the useful life of the asset. Subsidies related to revenue are recognized in profit or loss in the period in which the related expenses are recognized. (18) Financial income and costs Financial income consists of interest income, dividend income, gain on valuation of investment securities, foreign exchange gains, etc. Interest income is recognized as incurred using the effective interest method. Dividend income is recognized when our Group's right of receipt is established. Financial costs consist of interest expense, loss on devaluation of derivatives, and loss on devaluation of investment securities.
―106―
(Translation) This document has been translated from the Japanese original for the convenience of overseas stakeholders. In the event of any discrepancy between this document and the Japanese original, the original shall prevail.
(19) Corporate income tax Income taxes consist of current and deferred income taxes. These are recognized in profit or loss except for items recognized in other comprehensive income, items directly recognized in equity, and items recognized in business combinations. Current taxes are calculated by multiplying current taxable income by the tax rate enacted or substantially enacted as of the end of the fiscal year. Deferred income taxes are recognized for temporary differences between the financial statement carrying amounts of assets and liabilities and their respective tax bases. Deferred tax assets are recognized for deductible temporary differences, unused tax credit carryforwards and operating loss carryforwards to the extent that taxable income is expected to be available to recover them, and deferred tax liabilities are recognized for taxable temporary differences in principle. Deferred tax assets or liabilities are not recorded in the following cases: ・Initial recognition of an asset or liability in a transaction other than a business combination and which does not affect either accounting earnings or taxable income for tax purposes ・Differences on investments in subsidiaries, affiliates, and joint control where it is probable that the differences will not reverse in the foreseeable future ・Taxable temporary differences arising from initial recognition of goodwill Deferred income taxes are measured using tax rates expected to be in effect when temporary differences reverse under laws enacted or substantially enacted at the end of the fiscal year. Deferred tax assets and liabilities are offset when the Company has a legally enforceable right to offset current tax assets and liabilities and income taxes are imposed by the same taxing authority on the same taxable entity. (20)
Basic earnings per share Basic earnings per share is computed by dividing net income available to our common stockholders by the weighted average number of common shares outstanding, adjusted for treasury stock for the period. Diluted earnings per share is computed by adjusting for the effect of all dilutive potential common shares. Our potential common stock has stock options.
(21) Discontinued operation The Group classifies a business as a discontinued operation at the point when the business has either been disposed of or meets the criteria to be classified as held for sale, provided that it represents a separate major line of business or geographical area of operations. (22) Change in accounting policy The major new or revised pronouncements and interpretations not early adopted by our group as of December 31, 2025 are as follows: The impact of the adoption of this statement on our group is under consideration and cannot be estimated at this time. Compulsory The year of Statement of application period Standard name application for our Outline of new establishment and revision Standards (year beginning group thereafter) New requirements for the presentation and Presentation and IFRS No. 18 Disclosure in Financial Statements
January 1, 2027
FY2027
disclosure
of
financial
performance,
primarily in the income statement
―107―
(Translation) This document has been translated from the Japanese original for the convenience of overseas stakeholders. In the event of any discrepancy between this document and the Japanese original, the original shall prevail.
4.Additional information (1) Revision of errors of prior periods It has come to light that in the calculation of equity in earnings of affiliates at certain of the Company's equity-method affiliates, the financial figures obtained from the said equity-method affiliates, which should have been calculated based on changes in consolidated net assets, including the subsidiaries of said equity-method affiliates, were instead calculated based on changes in nonconsolidated net assets. As a result, an error was identified whereby the amounts reported as “Equity in earnings of affiliates” in the Company’s consolidated statements of income and “Investments accounted for using the equity method” in the consolidated statement of financial position have been consistently understated since prior years. The Company has determined that retrospective restatement was necessary regarding the above error and has revised the consolidated financial statements and other financial statements contained in the Annual Securities Reports, the Semi-Annual Reports and the Quarterly Reports that have already been submitted. We have also revised the other errors contained therein.
―108―
(Translation) This document has been translated from the Japanese original for the convenience of overseas stakeholders. In the event of any discrepancy between this document and the Japanese original, the original shall prevail.
- Change in presentation In accordance with IFRS 5, the Group classified the hydraulic equipment business as a discontinued operation from the third quarter of the current consolidated fiscal year. As a result, to conform to the presentation for the current consolidated fiscal year, certain items in the consolidated statement of profit or loss, the consolidated statement of cash flows, and related notes to the consolidated financial statements for the previous consolidated fiscal year have been reclassified and presented accordingly. 6.Critical accounting judgments, estimates and assumptions The preparation of consolidated financial statements in conformity with IFRS requires management to make judgments, estimates and assumptions that affect the application of accounting policies and the reported amounts of assets, liabilities, revenues and expenses. Actual results could differ from those estimates. Estimates and underlying assumptions are reviewed on an ongoing basis. Changes in accounting estimates are recognized in the period in which the estimates change and in future periods affected. Major accounting judgments, estimates and assumptions are as follows: (1) Valuation of inventory In accordance with "3. Important accounting policies " in the notes to inventories, our group makes assumptions about the cost of sales and selling expenses required to complete the calculation of net realizable value. Although management's best estimates and judgments determine these assumptions, they may be affected by changes in uncertain economic conditions in the future and could materially impact the consolidated financial statements if a review is required. The amount of the write-down of inventories is as described in Note "10. Inventories." (2) Significant assumptions used in the calculation of discounted cash flow projections for testing non-financial assets for impairment Our Group tests property, plant and equipment, intangible assets, right of use assets and goodwill for impairment in accordance with Note 3, "Important accounting policies." During the fiscal year under review, the following non-financial assets were tested for impairment. The goodwill impairment test is described in "Note 13. Goodwill and Intangible Assets," and the impairment of non-financial assets, including goodwill, is described in Note "14. Impairment of Non-Financial Assets." ① Gilgen's goodwill Goodwill (carrying amount: ¥19,709 million) related to Gilgen Door Systems AG and subsidiaries in Accessibility Solutions segment (hereinafter referred to as the "Gilgen Group") was tested for impairment on an annual basis in accordance with "Note
- Important accounting policies." As a result, no impairment loss was recorded for the goodwill as the value in use exceeded its carrying value. The recoverable amounts of non-financial assets related to Gilgen are measured at value in use. Value in use is calculated by discounting future cash flows determined based on the business plan of the business using a weighted-average cost of capital discount rate. Estimates of value in use include key assumptions such as projections of sales and operating margins in the business plan and discount rates based on weighted average cost of capital. These assumptions are determined based on management's best estimates and judgments; however, because of the high degree of uncertainty involved in forecasting demand for key market conditions and other factors, if the profitability of the business is reduced and it is determined that sufficient cash flow cannot be generated, the amount of non-financial assets recognized in the consolidated financial statements for the following fiscal year could be materially affected. ②
Goodwill of Deep Sea
Goodwill (carrying amount: ¥4,854 million) related to R.K. DEEP SEA TECHNOLOGIES LIMITED and one of its subsidiaries related to Marine Vessel Equipment in Transport Solutions segment were tested for impairment in accordance with "Note 3. Important accounting policies." As a result, impairment loss of ¥989 million was recorded for the goodwill as the value in use below its carrying value. The recoverable amount of non-financial assets related to Deep Sea is measured at value in use. Value in use is calculated by discounting future cash flows determined based on the business plan of the business using a weighted-average cost of capital
―109―
(Translation) This document has been translated from the Japanese original for the convenience of overseas stakeholders. In the event of any discrepancy between this document and the Japanese original, the original shall prevail.
discount rate. Estimates of value in use include significant assumptions such as forecasts of sales and operating income in the business plan and discount rates based on weighted average cost of capital. These assumptions are determined based on management's best estimates and judgments; however, because of the high degree of uncertainty involved in forecasting demand for key market conditions and other factors, if the profitability of the business is reduced and it is determined that sufficient cash flow cannot be generated, the amount of non-financial assets recognized in the consolidated financial statements for the following fiscal year could be materially affected.
―110―
(Translation) This document has been translated from the Japanese original for the convenience of overseas stakeholders. In the event of any discrepancy between this document and the Japanese original, the original shall prevail.
(3) Reserves and contingent liabilities Our group records reserves for product warranties and other items in the consolidated statements of financial condition. These accruals are based on our best estimate of the expenditures required to settle the obligation, taking into account the risks and uncertainties associated with the obligation at the end of the period. The amount of expenditures required to settle liabilities is calculated by comprehensively considering possible future results. However, the amount may be affected by the occurrence of unforeseeable events or changes in circumstances. If actual payments differ from the estimates, the amount recognized in the consolidated financial statements for the following fiscal year and thereafter may be materially affected. Contingent liabilities, if any, are disclosed after considering all available evidence at the date of the financial statements and considering their likelihood and amount of occurrence. The details of the allowance and its carrying value are described in Note "19. Reserves," and the contingent liabilities are described in Note "37. Contingent Liabilities. (4) Measurement of defined benefit obligations Our group has various retirement benefit plans, including defined benefit plans. The present value of the defined benefit obligations and related service costs for each of these plans are based on actuarial assumptions, such as discount rates and mortality rates. Although actuarial assumptions are determined based on management's best estimates and judgments, they may be affected by changes in uncertain economic conditions in the future and could materially impact the consolidated financial statements if a review is required.
(Amended) Semiannual Report 2025 Sep 30, 2026 Investor Relations Securities report
Bull 0
Bear 3
Routine
[Cover] [Filing]
Amendment Report to Semiannual Report
[Articles of Basis]
Article 24-5-5 of the Financial Instruments and Exchange Act
[Submit to]
Kanto Finance Bureau
[Submission date]
September 30, 2026
[Semiannual accounting period]
The First Six-month of 23rd fiscal period (From January 1, 2025 to June 30, 2025)
[Company name]
Nabtesco Corporation
[English translation name]
Nabtesco Corporation
[Title of Representative]
Kazumasa Kimura, representative director
[Location of the head office]
7-9, Hirakawacho 2-chome, Chiyoda-ku, Tokyo
[Phone No.]
+81-3-5213-1134
[Name of administrative liaison]
Yasushi Minegishi, General Manager, Corporate Communications Dept.
[Near contact location]
7-9, Hirakawacho 2-chome, Chiyoda-ku, Tokyo
[Phone No.]
+81-3-5213-1134
[Name of administrative liaison]
Yasushi Minegishi, General Manager, Corporate Communications Dept.
[Locations for Public Inspection]
Tokyo Stock Exchange, Inc. (2-1, Nihonbashi Kabutocho, Chuo-ku, Tokyo)
-1-
- Reasons for Filing the Amendment Report to the Semiannual Report In April 2026, the Company became aware that TMT Machinery, Inc., (Nabtesco's ownership interest is 33%.) an equity-method affiliate, had recorded a gain on extinguishment of tie-in shares arising from the absorption-type merger of one of its subsidiaries (approximately ¥600 million attributable to Nabtesco's ownership interest). Upon becoming aware of this matter, the Company shared the information with its independent auditor and commenced an investigation into the retained earnings accumulated within TMT Machinery's subsidiaries and affiliated entities. As TMT Machinery is an unlisted company and does not prepare consolidated financial statements, the Company had historically applied the equity method based on TMT Machinery's standalone financial statements. Through its investigation, the Company identified that substantial retained earnings had accumulated within TMT Machinery's subsidiaries and affiliated entities and that the portion attributable to the Company had not been reflected in the share of profit (loss) of investments accounted for using the equity method. While continuously consulting with its independent auditor, the Company proceeded with a detailed review of the scope and amount of profits to be recognized. In the course of the accounting auditor’s interim review procedures for the condensed interim consolidated financial statements included in the Semi-annual Securities Report filed on August 14, 2026, the Company re-examined the scope and amounts of profit to be recognized and determined that the aggregate unrecognized amount was expected to be approximately ¥2.8 billion based on the Company’s ownership interest. Following discussions with the accounting auditor, the Company determined that it would be appropriate to recognize share of profit (loss) of investments accounted for using the equity method in accordance with the timing at which profits and losses arose at the subsidiaries and other entities in prior fiscal years, and to correct other errors at the same time. Accordingly, the Company determined that it was necessary to retrospectively amend its Annual Securities Reports, Semi-annual Securities Reports and Quarterly Securities Reports for prior fiscal years. As a result, certain information contained in the Semiannual Report for the 23rd fiscal year (from January 1, 2025 to September 30, 2025), filed by the Company on August 8, 2025, requires correction. Accordingly, pursuant to the provisions of Article 24-5-5 of the Financial Instruments and Exchange Act, the Company hereby files this Amendment Report to the Annual Securities Report. The amended consolidated financial statements have been audited by KPMG AZSA LLC, and the relevant independent auditor’s report is attached hereto.
- Matters Amended Part I. Corporate Information Section 1. Overview of the Company
- Trend in Major Management Indicators Section 2. Business Conditions
- Management’s Discussion and Analysis of Financial Condition, Results of Operations and Cash Flows Section 4. Accounting Status
- Summary of Interim Consolidated Financial Statements
- Amended Sections Amended sections are indicated by underlining. As the amendments are extensive, only the amended information is presented for the matters listed above.
-2-
Part one 【Corporate Information】 No.1 【Overview of the Company】
1 【Transition in Major Management Indicators】 First six-month of 22nd First six-month of 23rd 22st consolidated fiscal consolidated fiscal period consolidated fiscal period period From January 1, 2024 From January 1, 2025 From January 1, 2024 to June 30, 2024 to June 30, 2025 to December 31, 2024
Fiscal period Accounting period (Million yen) (Million Income before income taxes yen) Net income attributable to owners of (Million the parent yen) (Million Net income yen) Comprehensive income attributable (Million to owners of the parent yen) (Million Comprehensive income yen) Equity attributable to owners of the (Million parent yen) (Million Total assets yen) Net sales
152,491
165,616
323,384
7,776
10,255
16,184
3,772
6,701
10,188
4,449
7,445
11,765
12,146
5,413
19,360
14,310
5,138
22,184
270,104
273,426
272,559
437,723
452,428
449,845
Total basic earnings per share
(Yen)
31.41
55.76
84.83
Diluted earnings per share
(Yen)
31.41
55.76
84.82
Ratio of equity attributable to owners of the parent
(%)
61.7
60.4
60.6
13,055
20,327
26,650
(19,291)
(10,253)
2,984
4,509
(28,733)
78,175
87,174
74,476
Cash flows from operating activities Cash flows from investing activities Cash flows from financing activities Cash and cash equivalents at fiscal year or interim end
(Million yen) (Million yen) (Million yen) (Million yen)
(4,137)
(NOTE) 1
Since Nabtesco Corporation (hereinafter, the Company) prepared the summary of interim financial statements, the Company does not provide the transition of non-consolidated management indicators. 2 Figures are rounded to the nearest unit. 3 Consolidated financial statements and summary of interim financial statements are prepared in accordance with International Financial Reporting Standards (IFRS)
2 【Description of Business】 There have been no significant changes in the content of the business conducted by our group (the Company and our subsidiary companies) during the first six-month of the current fiscal year. There are no changes in major affiliated companies.
-3-
No.2 【Business Situation】 1 【Business Risks】 During the first six-month of the current fiscal year, there have been no significant changes in the status of business and accounting described in this semiannual report that could have a significant impact on the decisions of investors or Business and Other Risks described in the annual report for the previous fiscal year. There were no significant events which company should report.
-4-
2【Management's Analysis of Financial Condition, Results of Operations and Cash Flows】 (1) Analysis of Operating Results (Sales and Operating Income) During the first six-month period under review, showed an increase in demand for component solutions, transport solutions and accessibility solutions business. As a result, the Group’s net sales increased 8.6% year-on-year to ¥165,616 million. Operating income increased 68.4% to ¥10,716 million due to the increased in sales in component solutions and transport solutions business, as well as the effects of profitability improvement activities under Project 10. Operating income to net sales was 6.5% Operating results by business segment were as follows: ①
Component Solutions Business Sales increased by ¥7,511 million, or 14.5% to ¥59,186 million and operating income increased by ¥1,192 million or 57.3% to ¥3,271 million. Sales of precision reduction gears increased significantly year-on-year due to industrial robot inventories, which had been prolonged, reached an appropriate level. Sales of hydraulic equipment increased year-on-year due to increase demand in China, although sluggish demand continued in the European market.
②
Transport Solutions Business Sales increased by ¥4,370 million, or 10.4% to ¥46,447 million and operating income increased by ¥1,835 million, or 34.2% to ¥7,205 million. Sales of railroad vehicle equipment increased year-on-year due to favorable demand for new railroad vehicles and MRO (Maintenance, Repair, and Overhaul) both domestically and internationally. Sales of aircraft equipment decreased year-on-year due to a temporary decline in MRO demand for commercial aircraft, despite the continuous demand expansion by MOD budget increase. Sales of commercial vehicle equipment decreased year-on-year due to continued sluggish demand in the Southeast Asian market. Sales of marine vessels equipment increased year-on-year due to favorable demand for new shipbuilding and MRO.
③
Accessibility Solutions Business Sales increased by ¥1,667 million, or 3.3% to ¥52,584 million and operating income increased by ¥148 million, or 3.6% to ¥4,247 million. Sales of the automatic doors business increased year-on-year due to domestic demand for building automatic doors and platform doors remained strong.
④ Others Sales decreased by ¥422 million, or 5.4% to ¥7,399 million and operating income increased by ¥561 million, or 411.7% to ¥697 million. Sales of Packaging Machines decreased year-on-year due to postponement of overseas capital investment.
-5-
(Income before tax) Financial income came to ¥246 million. Financial costs were ¥757 million mainly due to loss on valuation of derivatives. Equity in earnings of affiliates was ¥50 million. As a result, quarterly profit before tax increased by ¥2,479 million year-on-year to ¥10,255 million. (Net income attributable to owners of the parent) As a result, net income attributable to owners of the parent, after deducting income tax expense of ¥2,810 million and net income attributable to non-controlling interests of ¥744 million, increased by ¥2,929 million year-on-year to ¥6,701 million. Basic earnings per share increased by ¥24.35 to ¥55.76. (2) Analysis of Financial Position As of the end of the previous consolidated fiscal year (December 31, 2024)
As of the end of the first six-month period of the current consolidated fiscal year (June 30, 2025)
(Million yen) Change
Total assets
449,845
452,428
2,583
Liabilities
160,101
162,750
2,649
Equities
289,744
289,679
(65)
① Assets Total assets as of June 30, 2025 were ¥452,428 million, an increase of ¥2,583 million from December 31, 2024, consisting of ¥229,859 million in current assets and ¥222,570 million in non-current assets. The key contributing positive factors were an increase of ¥12,698 million in cash and cash equivalents, an increase of ¥5,332 million in inventories. The main contributing negative factor was a decrease of ¥16,786 million in trade receivables. ② Liabilities Total liabilities as of June 30, 2025 were ¥162,750 million, an increase of ¥2,649 million from December 31, 2024, reflecting ¥119,521 million in current liabilities and ¥43,228 million in non-current liabilities. The main contributing positive factor was a rise of ¥12,253 million in borrowings under non-current assets. The main contributing negative factors were a decrease of ¥6,297 million in operating payables. ③ Equity Total equity as of June 30, 2025 stood at ¥289,679 million. Equity attributable to owners of the parent was ¥273,426 million, an increase of ¥867 million from December 31, 2024. The main contributing positive factors were ¥6,701 million in net income attributable to owners of the parent. The main decreasing factor was a decrease in retained earnings of ¥4,826 million due to dividend payment and an increase of ¥1,491 million in exchange differences on foreign operations.
-6-
(3) Status of cash flows First six-month period of consolidated FY2024 (January 1, 2024 to June 30, 2024)
(Million yen) First six-month period of consolidated FY2025 (January 1, 2025 to June 30, 2025)
Cash flow from operating activities
13,055
20,327
Cash flow from investing activities
(19,291)
(10,253)
Free cash flow
(6,236)
10,074
Cash flow from financing activities
2,984
4,509
Cash and cash equivalents (hereinafter, “cash”) on a consolidated basis as of June 30, 2025 totaled ¥87,174 million, an increase of ¥12,698 million from December 31, 2024, as cash gained from operating activities was mainly appropriated to capital expenditure and dividend payments. ① Cash flow from operating activities Net cash generated from operating activities for the first six-month period of the current fiscal year totaled ¥20,327 million. The main factors for increases were operating income, other non-cash profit/losses including depreciation and amortization, and decrease in trade receivables. The main factors for decreases included an increase in inventories, decrease in operating payables, and the payment of the income tax. ② Cash flow from investing activities Net cash used in investing activities for the first six-month period of the current fiscal year amounted to ¥10,253 million. The main factors for decreases were payments for the purchase of property, plant, and equipment. ③ Cash flow from financing activities Net cash used in financing activities for the first six-month period of the current fiscal year totaled ¥4,509 million. The main factors for increase was proceeds from long-term borrowings. The main factors for decrease was dividend payments. (4) Issues to be addressed in Business and Finance During the first six-month period of the fiscal year under review, there were no significant changes or new issues to be addressed by the Group.
(5) R&D activities Research and development expenses for the first six-month period of the current fiscal year were ¥5,647 million.
3 【Significant Management Contracts】 Nabtesco Corporation’s Board of Directors resolved to execute the following agreements with Comer Industries S.p.A. (“Comer”) on July 31, 2025: the share purchase agreement, which stipulates that the Company will transfer
the Hydraulic
Equipment Business (the “Business”) to a wholly-owned subsidiary to be newly incorporated by the Company (the “New Company”) by way of absorption-type company split (the “Absorption-Type Company Split”, and the relevant agreement is referred to as the “Absorption-Type Company Split Agreement”) to consolidate the Business into the New Company, and 70% of the issued shares in the New Company to Comer (the “Share Transfer”) (the “Share Purchase Agreement”); and the shareholder’s agreement related to the New Company (the “Shareholders’ Agreement”). Please refer “No.4 【Accounting Status】, 1【Summary of Interim Consolidated Financial Statement】Note "14.Significant subsequent events" for more detail.
-7-
No.3【Status of the Company Submitting the Report】 1【Status of Shares】 (1) 【Total Number of Shares】 ① 【Total number of shares】 Type
Total number of authorized shares (Share)
Common stock
400,000,000
Total
400,000,000
② 【Shares outstanding】
Type
Number of shares outstanding (shares) as of the date of filing As of August 8, 2025
Number of shares outstanding (shares) As of June 30, 2025
Common shares
121,064,099
121,064,099
Total
121,064,099
121,064,099
Name of stock exchange listings
Content
Tokyo Stock Exchange The number of shares per unit is Prime section 100 shares. -
-
(NOTE) The "Number of shares outstanding as of the filing date" column does not include the number of shares issued upon the exercise of stock acquisition rights to shares from August 1, 2025 to the filing date of this Semiannual Report.
(2) 【Status of Stock Acquisition Rights】 ① 【Details of stock option plan】 Not applicable.
② 【Status of other stock acquisition rights】 Not applicable.
(3) 【Status of Exercise of Bonds with Stock Acquisition Rights with Exercise Price Adjustment, etc.】 Not applicable.
(4) 【Changes in the number of issued shares, capital stock, etc.】
Date
June 30, 2025
Number of shares outstanding increase/decrease
Number of shares outstanding as the end of therm.
Change in capital (Million yen)
-
121,064,099
-
-8-
Balance of Change in legal Balance of legal capital surplus capital surplus capital (Million yen) (Million yen) (Million yen) 10,000
-
26,274
(5) 【Major Shareholders】
Shareholders
Address
As of June 30, 2025 Shareholding ratio Number of to number of Shares Held shares outstanding (thousands (excluding shares) treasury stock) (%)
The Master Trust Bank of Japan (Trust Account)
8-1 Akasaka 1-chome, Minato-ku, Tokyo AKASAKA INTERCITY AIR
18,627
15.44
Custody Bank of Japan (Trust Account)
8-12 Harumi 1-chome, Chuo-ku, Tokyo
11,517
9.55
5,171
4.29
4,709
3.90
4,609
3.82
3,760
3.12
2,515
2.08
2,372
1.97
1,675
1.39
1,633
1.35
56,586
46.90
Central Japan Railway Company BNYMSANV AS AGENT/CLIENTS LUX UCITS NON TREATY 1 (Standing agent) MUFG Bank, Ltd. BBH (LUX) FOR FIDELITY FUNDSGLOBAL TECHNOLOGY POOL (Standing agent) MUFG Bank, Ltd.
1-4 Meieki 1-chome, Nakamura-ku, Nagoya-shi, Aichi VERTIGO BUILDING-POLARIS 2-4 RUE EUGENE RUPPERT L-2453 LUXEMBOURG GRAND DUCHY OF LUXEMBOURG 4-5 Marunouchi 1-chome, Chiyoda-ku, Tokyo 2A RUE ALBERT BORSCHETTE LUXEMBOURG L-1246
4-5 Marunouchi 1-chome, Chiyoda-ku, Tokyo
FANUC CORPORATION JPMorgan Chase & Co. STATE STREET BANK WEST CLIENTTREATY 505234 (Standing agent) Mizuho Bank, Ltd. STATE STREET BANK WEST CLIENTTREATY 505103 (Standing agent) Mizuho Bank, Ltd. GOLDMAN SACHS INTERNATIONAL (Standing agent) Goldman Sachs Japan Co., Ltd. Total
3580 Shibokusa, Oshinomura, Minamitsuru-gun, Yamanashi 7-3 Marunouchi 2-chome, Chiyoda-ku, Tokyo Tokyo Building 1776 HERITAGE DRIVE, NORTH QUINCY, MA 02171, U.S.A. 15-1, Konan 2-chome, Minato-ku, Tokyo Shinagawa Intercity Tower A ONE CONGRESS STREET, SUITE 1, BOSTON, MASSACHUSETTS 15-1, Konan 2-chome, Minato-ku, Tokyo Shinagawa Intercity Tower A PLUMTREE COURT, 25 SHOE LANE, LONDON EC4A 4AU, U.K. 6-1 Toranomon 2-chome, Minato-ku, Tokyo Toranomon Hills Station Tower -
(NOTE) 1 Number of shares held is rounded to the nearest thousand. 2 The following corporation submitted a report on the change of 6,277 thousand shares by a company on February 7, 2025. However, as the number of shares beneficially owned in the name of the said corporation cannot be confirmed as of June 30, 2025, it is not included in the above "Status of Major Shareholders."
- FIL Investments (Japan) Limited 3 The following corporation submitted a report on the change of 8,449 thousand shares by three companies on May 9, 2025. However, as the number of shares beneficially owned in the name of the said corporation cannot be confirmed as of June 30, 2025, it is not included in the above "Status of Major Shareholders."
- Nomura Securities Co., Ltd.
- Nomura International PLC
- Nomura Asset Management Co., Ltd.
-9-
(6) 【Status of voting rights】 ① 【Shares outstanding】 Classification
As of June 30, 2025
Number of shares
Number of voting rights
Content
-
-
-
-
-
-
-
-
-
-
-
-
-
1,204,994
-
Non-voting stock Shares with restricted voting rights (Treasury stocks) Shares with restricted voting rights (other)
(Treasury stock held) Common shares 421,000 Shares with full voting rights (treasury stock, etc.) (Mutually Held Shares) Common shares 15,000 Common shares Shares with full voting rights (other) 120,499,400 Common shares Shares less than one unit 128,699 Number of shares outstanding
121,064,099
Voting rights of all shareholders
-
-
Shares less than one unit (100 shares)
-
-
1,204,994
-
(NOTE) 1 Common shares in the "Shares less than one unit" column include 44 shares of treasury stock owned by the Company and 12 shares of our stock owned by Japan Custody Bank, Ltd. (Trust Account E) as trust assets under the "Stock Benefit Trust (BBT)" plan. 2 "Shares with full voting rights (other)" column includes 6,000 shares (60 voting rights) in the name of the Japan Securities Depository Center, Inc. and 458,900 shares (4,589 voting rights) of ours owned by the Japan Custody Bank, Ltd. (Trust Account E) as trust assets for the "Stock Benefit Trust (BBT)" plan. The 4,589 voting rights are not exercised. ② 【Treasury stock】
Owner's name
Address of the holder
(Treasury stock held) Nabtesco Corporation (Mutually Held Shares) Kyokko Denki Co., Ltd.
7-9, Hirakawacho 2-chome, Chiyoda-ku, Tokyo 2-4 Aratamacho 1-chome, Hyogo-ku, Kobe-shi, Hyogo
Total
-
Number of treasury stock
As of June 30, 2025 Ratio of shares Number of Total number of held to total shares held in shares to be number of the name of own shares others outstanding (%)
421,000
-
421,000
0.35
15,000
-
15,000
0.00
436,000
-
436,000
0.36
(NOTE) The above numbers of shares held do not include 458,900 shares of our company owned by Japan Custody Bank, Ltd. (Trust Account E) as trust assets under the "Stock Benefit Trust (BBT)" plan.
2 【Status of Management】 Not applicable.
- 10 -
No.4 【Accounting Status】
-
Preparation of summary of interim consolidated financial statements (1) In accordance with the provisions of Article 312 of the Ordinance on Terminology, Forms, and Preparation Methods of Consolidated Financial Statements (Ordinance of the Ministry of Finance No. 28 of 1976; hereinafter referred to as the "Ordinance on Consolidated Financial Statements"), we have prepared the interim consolidated financial statements in accordance with International Accounting Standards No. 34, "Interim Financial Reporting" (hereinafter referred to as "IAS No. 34") because they meet all of the requirements of "Designated International Accounting Standards Designated Companies" stipulated in Article 1-2, Item 2 of the Ordinance on Consolidated Financial Statements. Our summary of interim consolidated financial statements are Class one interim consolidated financial statements. (2) The summary of interim consolidated financial statements have been rounded to the nearest unit.
-
Audit Certification Pursuant to Article 193-2-1 of the Financial Instruments and Exchange Act, we have received an interim review of the summary of interim consolidated financial statements for the first six-month of fiscal year (January 1, 2025 to June 30, 2025) by KPMG AZSA LLC. In addition, we have submitted a Corrections Report of a Semiannual Report, pursuant to Article 24-5-5 of the Financial Instruments and Exchange Act, and the summary of interim consolidated financial statements after correction has received an interim review by KPMG AZSA LLC.
- 11 -
1 【Summary of Interim Consolidated Financial Statement】 (1) 【Summary of Interim Consolidated Financial Position】
Note No.
End of consolidated FY2024 (as of December 31, 2024)
(Million yen) End of the first six-month period of consolidated FY2025 (as of June 30, 2025)
Assets Current assets Cash and cash equivalents
74,476
87,174
Trade receivables
88,932
72,147
Contract assets
3,212
2,767
Other receivables
1,361
1,624
53,273
58,605
698
2,697
Inventories Other financial assets
11
Other current assets
7,016
4,845
Total current assets
228,970
229,859
Property, plant and equipment
114,340
113,909
Intangible assets
12,955
13,162
Non-current assets
Right-of-use asset
12,122
12,450
Goodwill
26,259
27,234
Investment property
9,309
9,196
Investments accounted for using the equity method
24,348
23,510
14,648
16,066
Other financial assets
11
Deferred tax assets
3,430
3,486
Other non-current assets
3,464
3,556
Total non-current assets
220,875
222,570
449,845
452,428
Total assets
- 12 -
Note No.
End of consolidated FY2024 (as of December 31, 2024)
(Million yen) End of the first six-month period of consolidated FY2025 (as of June 30, 2025)
Liabilities and equity Liabilities Current liabilities Operating payables
51,178
44,881
Contract liabilities
11,463
10,206
Borrowings
21,817
34,070
Other payables
11
16,030
14,480
Income taxes payables
2,461
2,565
Provision
2,233
1,978
3,319
3,409
28
-
Other current liabilities
8,582
7,933
Total current liabilities
117,111
119,521
10,067
10,052
10,634
10,954
8,262
8,249
8,514
8,887
Lease liabilities Other financial liabilities
11
Non-current liabilities Borrowings
11
Lease liabilities Liabilities concerning retirement benefit Deferred tax liabilities Other financial liabilities
670
719
Other non-current liabilities
11
4,844
4,367
Total non-current liabilities
42,990
43,228
Total liabilities
160,101
162,750
10,000
10,000
Equity Capital stock Share premium
14,998
15,077
Retained earnings
225,269
227,344
Treasury shares
(3,638)
(3,434)
Other components of equity
25,930
24,439
Equity attributable to owners of the parent
272,559
273,426
Non-controlling interests
17,185
16,252
Total equity
289,744
289,679
449,845
452,428
Total liabilities and equity
- 13 -
(2) 【Summary of Interim Consolidated Statements of Income】 【First six-month of consolidated financial period】 First six-month period of consolidated FY2024 (January 1, 2024 to June 30, 2024) 152,491
(Million yen) First six-month period of consolidated FY2025 (January 1, 2025 to June 30, 2025) 165,616
Cost of sales
(110,687)
(119,724)
Gross profit
41,803
45,892
Note No. Net sales
6,7
Other income Selling, general and administrative expense
496
670
(34,977)
(35,725)
Other expenses
8
(957)
(120)
Operating income
6
6,365
10,716
Financial income
1,586
246
Financial costs
(584)
(757)
409
50
Profit (loss) before tax
Equity in earnings of affiliates
7,776
10,255
Income tax expenses
(3,327)
(2,810)
Net income (loss)
4,449
7,445
3,772
6,701
677
744
4,449
7,445
Net income (loss) attributable to Owners of the parent Non-controlling interests Net income (loss) Net income (loss) per share Basic earnings (loss) per share (Yen)
10
31.41
55.76
Diluted earnings (loss) per share (Yen)
10
31.41
55.76
- 14 -
(3) 【Summary of Interim Consolidated Statement of Comprehensive Income】 【First six-month of consolidated financial period】
Note No.
First six-month period of consolidated FY2024 (January 1, 2024 to June 30, 2024)
Net income (loss)
(Million yen) First six-month period of consolidated FY2025 (January 1, 2025 to June 30, 2025)
4,449
7,445
552
890
552
890
8,948
(2,945)
361
(252)
9,309
(3,197)
Other comprehensive income after taxes
9,861
(2,307)
Total comprehensive income
14,310
5,138
12,146
5,413
Other comprehensive income Items that will not be reclassified to profit or loss Net changes in financial assets measured at fair value through other comprehensive income Total components that will not be reclassified to profit or loss Components that will be reclassified to profit or loss Exchange differences on foreign operations Share of other comprehensive income of investments accounted for using equity method Total components that will be reclassified to profit or loss
Comprehensive income attributable to Owners of the parent Non-controlling interests
2,164
(276)
Total comprehensive income
14,310
5,138
- 15 -
(4) 【Summary of Interim Consolidated Statement of Changes in Equity for the First Six-month Period】 First six-month period of current consolidated fiscal year (January 1, 2024 to June 30, 2024) (Million yen) Note No. Balance as of January 1, 2024
Other components of equity Capital stock
Share premium
Retained earnings
Treasury shares
Exchange differences on foreign operations
Valuation difference due to change in fair value
10,000
15,139
222,362
(3,943)
15,516
3,646
Net income (loss)
-
-
3,772
-
-
-
Other comprehensive income
-
-
-
-
7,828
546
Total comprehensive income
-
-
3,772
-
7,828
546
Acquisition, sales, etc. of Treasury shares
-
-
(34)
305
-
-
-
-
(4,825)
-
-
-
-
-
-
-
-
-
-
-
37
-
-
(37)
-
(209)
-
-
-
-
-
(209)
(4,822)
305
-
(37)
10,000
14,930
221,312
(3,637)
23,344
4,154
Dividends
9
Increase (decrease) in non-controlling interests due to capital increase of subsidiaries Transfer from other components of equity to retained earnings Share-based compensation transactions Total transactions with owners, etc. Balance as of June 30, 2024
Other components of equity Note No.
Balance as of January 1, 2024
Remeasurements of net defined benefit liability (asset)
Total equity attributable to owners of the parent
Total
Noncontrolling interests
Total equity
-
19,162
262,721
15,424
278,145
Net income (loss)
-
-
3,772
677
4,449
Other comprehensive income
-
8,374
8,374
1,487
9,861
Total comprehensive income
-
8,374
12,146
2,164
14,310
Acquisition, sales, etc. of Treasury shares
-
-
271
-
271
-
-
(4,825)
(448)
(5,273)
-
-
-
181
181
-
(37)
-
-
-
-
-
(209)
-
(209)
-
(37)
(4,763)
(267)
(5,030)
-
27,498
270,104
17,321
287,425
Dividends Increase (decrease) in non-controlling interests due to capital increase of subsidiaries Transfer from other components of equity to retained earnings Share-based compensation transactions Total transactions with owners, etc. Balance as of June 30, 2024
9
- 16 -
First six-month period of current consolidated fiscal year (January 1, 2025 to June 30, 2025) (Million yen) Other components of equity Note Capital stock No. Balance as of January 1, 2025
Share premium
Retained earnings
Treasury shares
Exchange differences on foreign operations
Valuation difference due to change in fair value
10,000
14,998
225,269
(3,638)
21,183
4,747
Net income (loss)
-
-
6,701
-
-
-
Other comprehensive income
-
-
-
-
(2,169)
882
Total comprehensive income
-
-
6,701
-
(2,169)
882
Acquisition, sales, etc. of Treasury shares
-
-
(3)
204
-
-
-
-
(4,826)
-
-
-
-
-
-
-
-
-
-
28
-
-
-
-
-
-
204
-
-
(204)
-
51
-
-
-
-
-
79
(4,626)
204
-
(204)
10,000
15,077
227,344
(3,434)
19,014
5,425
Dividends Change in consolidation
9 scope
of
Changes in ownership interest in subsidiaries
Transfer from other components of equity to retained earnings Share-based compensation transactions Total transactions with owners etc. Balance as of June 30, 2025
Other components of equity Note No
Balance as of January 1, 2025
Remeasurements of net defined benefit liability (asset)
Total equity attributable to owners of the parent
Total
Noncontrolling interests
Total equity
-
25,930
272,559
17,185
289,744
Net income (loss)
-
-
6,701
744
7,445
Other comprehensive income
-
(1,287)
(1,287)
(1,020)
(2,307)
Total comprehensive income
-
(1,287)
5,413
(276)
5,138
Acquisition, sales, etc. of Treasury shares
-
-
200
-
200
-
-
(4,826)
(720)
(5,546)
-
-
-
130
130
-
-
28
(67)
(39)
-
(204)
-
-
-
-
-
51
-
51
-
(204)
(4,546)
(657)
(5,203)
-
24,439
273,426
16,252
289,679
Dividends Change in consolidation
9 scope
of
Changes in ownership interest in subsidiaries
Transfer from other components of equity to retained earnings Share-based compensation transactions Total transactions with owners etc. Balance as of June 30, 2025
- 17 -
(5) 【Summary of Consolidated Statements of Cash Flows for the First Six-month Period】 First six-month period of consolidated FY2024 (January 1, 2024 to June 30, 2024)
(Million yen) First six-month period of consolidated FY2025 (January 1, 2025 to June 30, 2025)
4,449 7,809
7,445 8,837
656
-
(79)
(26)
(224) 362
(246) 383
Loss (gain) on valuation of investment securities Equity in (earnings) losses of affiliates
26 (409)
3 (50)
Loss (gain) on sales and disposal of non-current assets Income tax expense Decrease (increase) in trade receivables, contract assets and contract liabilities Decrease (increase) in inventories
64 3,327
2 2,810
8,055
14,871
(5,022)
(5,647)
(4,292)
(5,683)
2,009
886
Note No. Cash flow from operating activities Net income (loss) Depreciation and amortization Impairment loss Increase (decrease) in assets and liabilities concerning retirement benefits Interest and dividend income Interest expenses
Increase (decrease) in trade payables Increase/decrease in consumption payable/consumption taxes refund receivable Other
8
taxes
Subtotal
(635)
(1,090)
16,096
22,495
Interest received
169
178
Dividend received Interest paid
1,047 (358)
437 (363)
Income taxes paid
(3,899)
(2,420)
Cash flow from operating activities
13,055
20,327
Decrease (increase) in time deposits Purchase of property, plant and equipment
(712) (16,639)
(2,005) (7,020)
Purchase of intangible assets Payments for acquisition of subsidiaries resulting in change in the scope of consolidation Other
(1,538)
(1,309)
-
(269)
(403)
350
Cash flow from investing activities
(19,291)
(10,253)
Net increase (decrease) in short-term loans payable Income of long-term loans payable
(379) 10,090
12,088
Repayment of long-term loans payable Payments for lease liabilities
(118) (1,589)
- (117) (1,941)
72 (4,822)
66 (4,824)
181 (452)
- (678)
Cash flow from investing activities
Cash flow from financing activities
Net decrease (increase) in treasury shares Dividends paid
9
Proceeds from transfers from non-controlling interests Dividends paid to non-controlling interests Other
-
(86)
2,984
4,509
Increase (decrease) in cash and cash equivalents
(3,252)
14,583
Cash and cash equivalents at beginning of term Effect of exchange rate changes on cash and cash equivalents Cash and cash equivalents at end of term
77,835
74,476
3,592
(1,885)
78,175
87,174
Cash flow from financing activities
- 18 -
【Notes on the Summary of Interim Consolidated Financial Statements】
- Reporting company The Company is a company located in Japan. Our summary of interim consolidated financial statements are composed of the interests in us and our subsidiaries (together, the "Group") and affiliates, with an ended date of June 30, 2025. Our main businesses are Component Solutions Business, Transport Solutions Business, and Accessibility Solutions Business. The details are described in Note "6. Business Segments."
- Basis of preparation (1) Compliance with IFRS The condensed interim consolidated financial statements have been prepared in accordance with IAS No. 34 under the provisions of Article 312, as they meet all the requirements of "Designated International Accounting Standards Designated Companies" stipulated in Article 1-2, Item 2 of the Regulations for Consolidated Financial Statements. The summary of interim consolidated financial statements for the fiscal year ended December 31, 2025, which was approved by Kazumasa Kimura, representative director, on August 8, 2025, was corrected and approved by Kazumasa Kimura, representative director on September 30, 2026. (2) Basis for measurement The summary of interim consolidated financial statements of our group have been prepared on a historical cost basis, except for financial instruments measured at fair value, as described in Note 3, "Significant Accounting Policies," below. (3) Functional and presentation currencies The summary of interim consolidated financial statements of our group represent the Japanese yen, which is our functional currency.
- Important accounting policies The significant accounting policies that our group applies in this condensed interim consolidated financial statements are the same as those applied in the consolidated financial statements for the previous fiscal year. Income tax expense for the first six-month of the current fiscal year is calculated using the estimated average annual effective tax rate.
4.Additional information (1) Revision of errors of prior periods It has come to light that in the calculation of equity in earnings (losses) of affiliates at certain of the Company's equity-method affiliates, the financial figures obtained from the said equity-method affiliates, which should have been calculated based on changes in consolidated net assets, including the subsidiaries of said equity-method affiliates, were instead calculated based on changes in non-consolidated net assets. As a result, an error was identified whereby the amounts reported as “Equity in earnings of affiliates” in the Company’s consolidated statements of income and “Investments accounted for using the equity method” in the consolidated statement of financial position have been consistently understated since prior years. The Company has determined that retrospective restatement was necessary regarding the above error and has revised the consolidated financial statements and other financial statements contained in the Annual Securities Reports, the Semiannual Reports and the Quarterly Reports that have already been submitted. We have also revised the other errors contained therein.
- 19 -
- Critical accounting judgments, estimates and assumptions The preparation of summary of interim consolidated financial statements in conformity with IFRS requires management to make judgments, estimates and assumptions that affect the application of accounting policies and the reported amounts of assets, liabilities, revenues and expenses. Actual results could differ from those estimates. Estimates and underlying assumptions are reviewed on an ongoing basis. Changes in accounting estimates are recognized in the period in which the estimates change and in future periods affected. Judgments that involve significant accounting estimates and estimates in these summary of interim consolidated financial statements are, in principle, the same as the consolidated financial statements for the previous fiscal year.
- 20 -
- Business Segments (1) Summary of reportable segments The Group’s reportable segments are components of the Group about which separate financial statement is available that is evaluated regularly at the Board of Directors’ meetings in deciding how to allocate the management resources and in assessing performance. The Group classifies its business segments into the following three reportable segments, based on the similarity of business models: 1) the “Component Solutions Business;” 2) the “Transport Solutions Business;” and 3) the “Accessibility Solutions Business.” The main lines of business of each reportable segment are as below.
Business segment
Main lines of business
Component Solutions Business
The design, manufacture, sale, maintenance and repair of industrial robot components and equipment for construction machinery and its components The design, manufacture, sale, maintenance and repair of brake systems and automatic door operating systems for railroad vehicles, aircraft components, brake systems and drive control units for vehicles, control systems for marine vessels, and components thereof The design, manufacture, sale, installation, maintenance and repair of automatic door operating systems for buildings and general industry, platform safety systems, and components thereof
Transport Solutions Business Accessibility Solutions Business
(2) Information on reportable segments
The accounting policies of the reportable segments are the same as the accounting policies of our group described in "3. Important accounting policies “in the notes. Intersegment sales and transfers are based on prevailing market prices. I. First six-month period ended June 30, 2024 (January 1, 2024 to June 30, 2024) Reportable Segments Others
Total
144,670
7,821
152,491
-
152,491
2,554
20
2,574
(2,574)
-
50,922
147,223
7,841
155,065
(2,574)
152,491
4,099
11,548
136
11,684
(5,319)
6,365
Component Solutions
Transport Solutions
Accessibility Solutions
Total
Sales to external customers
51,675
42,077
50,917
Inter-segment sales
1,548
1,001
4
Total sales
53,223
43,078
Segment income (Operating income)
2,079
5,370
Adjustments
(Million yen) Amount stated in summary of consolidated statements of income
Net sales
Financial income
1,586
Financial costs
(584)
Equity in earnings of affiliates
409
Income before tax
7,776
Notes: 1.
“Others” is a business segment that is not a reportable segment and consists of businesses that are engaged in the design, manufacture, sale, maintenance and repair of packaging machines, three-dimensional model production device and components thereof. 2. Adjustment to sales is as a result of eliminations of inter-segment transactions. 3. Adjustment to segment income (operating income) is total profit/loss, etc. that are not allocated to the respective segments.
- 21 -
First six-month period ended June 30, 2025 (January 1, 2025 to June 30, 2025) (Million yen) Reportable Segments Component Solutions
Transport Accessibility Solutions Solutions
Total
Others
Total
Amount stated in summary of Adjustments consolidated statements of income
Net sales Sales to external customers
59,186
46,447
52,584
158,217
7,399
165,616
-
165,616
Inter-segment sales
1,467
825
3
2,296
12
2,308
(2,308)
-
Total sales
60,654
47,272
52,587
160,513
7,411
167,924
(2,308)
165,616
Segment income (Operating income)
3,271
7,205
4,247
14,723
697
15,420
(4,704)
10,716
Financial income
246
Financial costs
(757)
Equity in earnings of affiliates
50
Income before tax
10,255
Notes: 1.
“Others” is a business segment that is not a reportable segment and consists of businesses that are engaged in the design, manufacture, sale, maintenance and repair of packaging machines, three-dimensional model production devices and components thereof. 2. Adjustment to sales is as a result of eliminations of inter-segment transactions. 3. Adjustment to segment income (operating income) is total profit/loss, etc. that are not allocated to the respective segments.
- 22 -
- Revenue from contracts with customers Our businesses are comprised of Component Solutions Business, Transport Solutions Business, Accessibility Solutions Business and Other Businesses, and are subject to periodic review by our Board of Directors to determine the allocation of management resources and assess performance. In our group, revenues earned through these businesses are presented as net sales. Net sales are broken down by major products. The relation between these disaggregated net sales and net sales by segment as described in Note "6. Business Segments" is as follows: There is no obligation to perform as an agent for our group.
Business segment
Major products Precision Reduction Gears
Component Solutions Business
First six-month period of consolidated FY2024 (January 1, 2024 to June 30, 2024) 29,964
35,822
21,711
23,364
Subtotal
51,675
59,186
Railroad Vehicle Equipment
11,158
14,365
Aircraft Equipment
11,912
11,417
6,268
6,025
9,465
11,507
3,273
3,133
Subtotal
42,077
46,447
Automatic Door
50,917
52,584
Subtotal
50,917
52,584
7,541
7,091
280
307
7,821
7,399
152,491
165,616
Hydraulic Equipment
Transport Solutions Business
Commercial Vehicle Equipment Marine Vessels Equipment Others
Accessibility Solutions Business
Packaging Machines Others
Others
(Million yen) First six-month period of consolidated FY2025 (January 1, 2025 to June 30, 2025)
Subtotal Total (NOTE) Amounts are expressed as external sales.
- 23 -
- Impairment of non-financial assets Previous interim consolidated fiscal year (January 1, 2024, to June 30, 2024) (Millions of yen) Reportable Segments Others
Type of asset
Impairment loss
Goodwill
656
Total
656
As of the end of the previous interim consolidated accounting period, we tested goodwill of our consolidated subsidiary Engilico Engineering Solutions NV and its subsidiaries for impairment. As the recoverable amount was less than the carrying amount, we recognized an impairment loss related to this goodwill. The impairment loss is included in "Other expense" in the condensed interim consolidated statements of operations and is recognized in Others. The recoverable amount is measured at value in use (pre-tax discount rate: 14.6%). Current interim consolidated fiscal year (January 1, 2025, to June 30, 2025) Not applicable
- 24 -
9.Cash dividends (1) Cash dividends paid were as follows: Previous interim consolidated fiscal year (January 1, 2024, to June 30, 2024)
Resolution March 26, 2024
Total dividends (Millions of yen)
Dividends per share (yen)
Record Date
Effective date
4,825 40 December 31, 2023 March 27, 2024 Annual Shareholders' Meeting (NOTE) The total amount of dividends declared by resolution of the Ordinary General Meeting of Shareholders on March 26, 2024 includes dividends of 24 million yen on our shares held by the trust account (re-trustee: Japan Custody Bank, Ltd. (Trust Account E)) of Mizuho Trust & Banking Co., Ltd. related to the stock benefit trust (BBT). Current interim consolidated fiscal year (January 1, 2025, to June 30, 2025) Resolution March 26, 2025
Total dividends (Millions of yen)
Dividends per share (yen)
Record Date
Effective date
4,826 40 December 31, 2024 March 27, 2025 Annual Shareholders' Meeting (NOTE) The total amount of dividends declared by resolution of the Ordinary General Meeting of Shareholders on March 26, 2025 includes dividends of 21 million yen on our shares held by the trust account (re-trustee: Japan Custody Bank, Ltd. (Trust Account E)) of Mizuho Trust & Banking Co., Ltd. related to the stock benefit trust (BBT).
(2) Dividends for which the base date belongs to the current interim consolidated fiscal year and for which the effective date of distribution falls in the end of interim consolidated fiscal year Previous interim consolidated fiscal year (January 1, 2024, to June 30, 2024) Resolution
Total dividends (Millions of yen)
Dividends per share (yen)
Record Date
Effective date
July 31, 2024 Board of Directors’ 4,826 40 June 30, 2024 August 30, 2024 Meeting (NOTE) Total dividends declared by resolution of the Board of Directors on July 31, 2024 include dividends of 21 million yen on our shares held by the Trust Account (re-trustee: Japan Custody Bank, Ltd. (Trust Account E)) of Mizuho Trust & Banking Co., Ltd. related to the Share Benefit Trust (BBT). Current interim consolidated fiscal year (January 1, 2025, to June 30, 2025) Resolution
Total dividends (Millions of yen)
Dividends per share (yen)
Record Date
Effective date
July 31, 2025 Board of Directors’ 4,826 40 June 30, 2025 August 29, 2025 Meeting (NOTE) Total dividends declared by resolution of the Board of Directors on July 31, 2025 include dividends of 18 million yen on our shares held by the Trust Account (re-trustee: Japan Custody Bank, Ltd. (Trust Account E)) of Mizuho Trust & Banking Co., Ltd. related to the Share Benefit Trust (BBT).
- 25 -
10.Earnings per shares (1) Basis for calculating basic earnings per share (first six-month period) Basic earnings per share and the calculation basis are as follows (First six-month of consolidated financial period) First six-month period of consolidated FY2024 (January 1, 2024 to June 30, 2024) (Millions of yen) Weighted average number of shares of common (Thousands stock of shares) Profit attributable to owners of the parent
Basic earnings per share
(Yen)
First six-month period of consolidated FY2025 (January 1, 2025 to June 30, 2025)
3,772
6,701
120,084
120,159
31.41
55.76
(2) Basis for calculating diluted earnings per share Diluted earnings per share and the calculation basis are as follows: (First six-month of consolidated financial period) First six-month period of consolidated FY2024 (January 1, 2024 to June 30, 2024) Diluted net income attributable to owners of the (Millions of parent yen) Weighted average number of shares of common (Thousands stock of shares) Effect of stock options using the stock acquisition (Thousands rights method of shares) (Thousands Diluted weighted average shares for common stock of shares) Diluted earnings per share
(Yen)
- 26 -
First six-month period of consolidated FY2025 (January 1, 2025 to June 30, 2025)
3,772
6,701
120,084
120,159
3
2
120,087
120,161
31.41
55.76
11.Financial instruments (1) Fair Value Measurements ① Financial assets measured at amortized cost Other financial assets Fair values of other financial assets are primarily valued based on the present value of these assets discounted at a rate adjusted for credit risk, segregated by certain time periods. ② Financial assets measured at fair value through profit or loss a Golf membership The fair value of golf memberships is valued based on quoted prices and other factors. Golf membership is included in "Other Financial Assets" in the Summary of Interim Consolidated Statements of Financial Position b Derivative financial assets The fair value of foreign currency forward contracts is calculated based on forward exchange rates and other factors. Note that derivative financial assets are included in "other financial assets" in the Summary of Interim Consolidated Financial Statement. c Investment securities Debt instruments, which consist primarily of corporate bonds held for non-trading purposes, are calculated using appropriate valuation techniques based on recent transaction prices between third parties and other available market data. Investment securities are included in "other financial assets" in the Summary of Interim Consolidated Financial Statement. ③ Financial assets measured at fair value through other comprehensive income Investment securities Equity instruments consisting primarily of stocks held for non-trading purposes. Listed stocks are calculated using quoted market prices on exchanges, and unlisted stocks are calculated using valuation techniques based on market prices of similar companies and valuation techniques based on net asset value. Investment securities are included in "other financial assets" in the Summary of Interim Consolidated Financial Statement. ④ Financial liabilities measured at amortized cost Borrowings The fair value of borrowings is calculated based on the present value of the sum of principal and interest discounted at the interest rate assumed for new similar borrowings. ⑤ Financial liabilities measured at fair value through profit or loss a Derivative financial liabilities The fair value of foreign currency forward contracts is calculated based on forward exchange rates and other factors. The fair values of foreign currency swap agreements and interest rate swap agreements are calculated based on prices provided by counterparty financial institutions, etc. Derivative financial liabilities are included in "Other financial liabilities" in the summary of interim consolidated statements of financial position. b Contingent consideration The fair value of the financial liabilities for contingent consideration is calculated based on the present value of future payments calculated using a Monte Carlo simulation, primarily based on forecasts of performance and other factors. Financial liabilities related to contingent consideration are included in "Other financial liabilities" in the Summary of Interim Consolidated Statements of Financial Position.
- 27 -
(2) Carrying amounts and fair values of each class of financial instruments The carrying amounts and fair values of financial assets and financial liabilities in the summary of interim consolidated statements of financial position are as follows: (Million yen) End of the first six-month period of consolidated FY2025 (as of June 30, 2025)
End of consolidated FY2024 (as of December 31, 2024) Book value
Fair value
Book value
Fair value
Financial assets Financial assets measured at amortized cost Other financial assets
3,630
3,630
5,664
5,664
3,630
3,630
5,664
5,664
Golf membership
122
122
122
122
Derivative financial assets
-
-
8
8
Investment securities
-
-
102
102
122
122
232
232
Investment securities
11,594
11,594
12,867
12,867
Total financial assets measured at fair value through other comprehensive income
11,594
11,594
12,867
12,867
15,346
15,346
18,763
18,763
Borrowings
31,884
31,764
44,122
44,004
Other financial liabilities
31,884
31,764
44,122
44,004
Derivative financial liabilities
667
667
688
688
Contingent consideration
30
30
31
31
697
697
719
719
32,581
32,461
44,841
44,723
Total financial assets measured at amortized cost Financial assets measured at fair value through profit or loss
Total of financial assets measured at fair value through profit or loss Financial assets measured at fair value through other comprehensive income
Total of financial assets Financial Liabilities Financial liabilities measured at amortized cost
Financial Liabilities measure at fair value through profit or loss
Total financial liabilities measure at fair value through profit or loss Total financial liabilities
At initial recognition, the Company did not hold any financial assets or financial liabilities that were irrevocably elected to be designated as financial assets and financial liabilities measured at fair value through profit or loss. Cash and cash equivalents, trade receivables, contract assets, other receivables, trade payables, and other payables, which are financial instruments measured at amortized cost, are not included in the table above because their carrying amounts approximate fair value due to their short-term maturities.
- 28 -
(3) Level-based classification of the fair value hierarchy The recurring fair values of financial assets and financial liabilities are measured and analyzed as follows: These fair value amounts are categorized into three fair value hierarchies (levels 1 through 3) based on the inputs to the valuation techniques used (available market data). Each level is defined as follows: Level 1: Fair values measured at quoted prices in actively traded markets Level 2: Fair values calculated using observable prices, either directly or indirectly, other than Level 1 Level 3: Fair values derived from valuation techniques that include unobservable inputs Transfers between levels of the fair value hierarchy are recognized on the date that the events or changes in circumstances that give rise to the transfer occur. The following table presents the fair value hierarchy for financial assets and financial liabilities measured at fair value on a recurring basis: (Million yen) End of the previous consolidated fiscal year (As of December 31, 2024)
Level 1
Level 2
Level 3
Total
Other financial assets Financial assets to be measured at fair value through profit or loss Financial assets measured at fair value through other comprehensive income
-
122
-
122
4,872
-
6,723
11,594
-
667
30
697
Other financial liabilities Financial liabilities measured at fair value through profit or loss
(Million yen) End of the first six-month period of consolidated FY2025 (as of June 30, 2025)
Level 1
Level 2
Level 3
Total
Other financial assets Financial assets to be measured at fair value through profit or loss Financial assets measured at fair value through other comprehensive income
-
130
102
232
5,989
-
6,878
12,867
-
688
31
719
Other financial liabilities Financial liabilities measured at fair value through profit or loss
The fair value hierarchy for financial instruments measured at amortized cost, which is disclosed in "(2) Carrying amounts and fair values of each class of financial instruments," is categorized principally in Level 3. There were no transfers between Levels 1 and 2 and 3 in the previous fiscal year or the first three-month of current fiscal year. There were no significant assets or liabilities measured at fair value on a nonrecurring basis at the end of the previous or first six-month of current fiscal year.
- 29 -
(4) Information on Level 3 fair value measurements ① Valuation techniques and inputs Level 3 other financial assets and other financial liabilities consist primarily of unlisted equity securities and contingent consideration. The fair value of unlisted equity securities is determined using valuation techniques based on quoted market prices for comparable companies and valuation techniques based on net asset value. The fair value of the financial liabilities for contingent consideration is calculated based on the present value of future payments calculated using a Monte Carlo simulation, primarily based on forecasts of performance and other factors. ② Evaluation process Fair value measurements for Level 3 financial instruments are performed in accordance with relevant internal rules. When measuring fair value, the Company uses valuation techniques and inputs that most appropriately reflect the nature, characteristics and risks of the underlying financial instruments. ③ Level 3 sensitivity information for recurring fair value measurements Significant unobservable inputs for measuring the fair value of Level 3 financial instruments measured at fair value on a recurring basis are EBIT multiples, illiquidity discounts, and other inputs based on financial projections. Fair value is increased (decreased) by an increase (decrease) in EBIT multiples and decreased (increased) by an increase (decrease) in illiquidity discounts. For instruments classified as Level 3, the increase or decrease in fair value of the change in the inputs that are not observable to reasonably possible alternative assumptions would not be material. ④ Reconciliation of financial instruments classified as Level 3 from the beginning of the period to the ending balance
Balance at beginning of period
First six-month period of consolidated FY2024 (January 1, 2024 to June 30, 2024)
(Million yen) First six-month period of consolidated FY2025 (January 1, 2025 to June 30, 2025)
Financial assets
Financial assets
Financial Liabilities
Financial Liabilities
5,514
28
6,723
30
675
3
157
1
(26)
3
1
701
-
(3)
160
-
Purchase
618
-
101
-
Sale
-
-
-
-
6,806
31
6,981
31
Total gains and losses Net Income (Loss) (Note 1) Other comprehensive (Note 2)
Balance at end of period
income
(NOTE) 1 Gains and losses recognized in profit or loss primarily represent unrealized gains and losses on financial instruments sold in the first six-month of current fiscal year and are included in "Financial income and loss" in the Summary of Interim Consolidated Statements of Income. 2 Gains and losses recognized in other comprehensive income are included in "Net changes in financial assets measured at fair value through other comprehensive income" in the summary of Interim Consolidated Statements of Comprehensive Income.
- 30 -
12.Business Combination First six-month period of consolidated FY2024 (From January 1, 2024 to June 30, 2024) Not applicable First six-month period of consolidated FY2024 (From January 1, 2024 to June 30, 2024) Not applicable
13.Commitment Significant commitments contractually committed to the acquisition of property, plant and equipment are as follows: (Million yen) End of the first six-month period of consolidated FY2025 (as of June 30, 2025)
End of consolidated FY2024 (as of December 31, 2024) Commitment
5,554
1,984
14.Subsequent events (Concerning the Company Split (Simplified Absorption-Type Company Split) of the Hydraulic Equipment Business and the Execution of the Share Purchase Agreement and the Shareholders’ Agreement with Comer Industries S.p.A.) Nabtesco Corporation’s (the “Company”) Board of Directors resolved to execute the following agreements with Comer Industries S.p.A. (“Comer”) on July 31, 2025: (i) the share purchase agreement, which stipulates that the Company will transfer (a) the Hydraulic Equipment Business (the “Business”) to a wholly-owned subsidiary to be newly incorporated by the Company (the “New Company”) by way of absorption-type company split (the “Absorption-Type Company Split”, and the relevant agreement is referred to as the “Absorption-Type Company Split Agreement”) to consolidate the Business into the New Company, and (b)70% of the issued shares in the New Company to Comer (the “Share Transfer”) (the “Share Purchase Agreement”); and (ii) the shareholder’s agreement related to the New Company (the “Shareholders’ Agreement”). The Company will classify the Hydraulic Equipment Business as a discontinued operation business under the IFRS No.5 due to the Company Split. (1) Purpose of the Absorption-Type Company Split, the Share Transfer, and the execution of the Shareholders’ Agreement In the New Medium-term Management Plan presented on February 12, 2025, the Company announced that it will revive its profitability by Project 10 (“Reviving Potential”) and evolve its technology toward “smart motion control” (“Evolving Excellence”) to deliver the value of its products and services, with the aim of becoming a “Leaders in Innovation for the Future,” as set out in its Long-term Vision for fiscal 2030. Based on this New Medium-term Management Plan, the Company seeks to optimize the portfolio balance based on its vision and profitability (ROIC) and aims to build a resilient corporate foundation that enables stability and growth. The Business has a diverse product lineup for small to large scale models, among which its traveling units for hydraulic excavators account for a global market share of approximately 25% (the Company’s estimate), and many customers in Japan and overseas have adopted our products. However, in recent years, the rise of Chinese local hydraulic equipment manufactures and the shift to in-house production by construction equipment manufacturers have resulted in a severe competitive environment, and the recovery of profitability in the Business has become an issue. For this reason, the Company has been comprehensively examining the future shape of the Business, including partnering, from the perspective of the continuous growth of the Business and the Company’s Long-term Vision. As a result, the Company has determined that the Comer, which has a sales network, technology and product lineup that the Company’s group does not have, could become the best owner for the continuous growth of the Business, and has decided to execute the Share Purchase Agreement, which stipulates the Share Transfer after implementing the Absorption-Type Company Split, and the Shareholders’ Agreement. To date, Comer has developed a strategy that takes advantage of its broad product lineup, established through its efforts in high value-added technologies and products. The Company is confident that we will be able to provide higher value to more customers than ever before by capturing new market opportunities through the complementary sales networks of the Business and Comer, and by fostering the proposal capabilities through supplement of product lineup. The Company will use the consideration obtained from the Share Transfer to invest in its priority areas, including smart motion control, to realize the Long-term Vision, and seek to increase its corporate value over the medium to long term.
- 31 -
(2) Outline of the Absorption-Type Company Split, the Share Transfer, and the Shareholders’ Agreement The Company executes the Share Purchase Agreement, which stipulates that the Company will transfer the Business to the New Company by way of absorption-type company split to consolidate the Business into the New Company, and 70% of the issued shares in the New Company to Comer. The Business includes all of the equity interests held by the Company in Shanghai Nabtesco Hydraulic Co., Ltd., a subsidiary of the Company in China, all of the equity interests held by the Company in Nabtesco Power Control (Thailand) Co., Ltd., a subsidiary of the Company in Thailand, and all of the equity interests in Nabtesco Power Control Europe GmbH, a wholly owned subsidiary (sub-subsidiary company) of the Company in Germany. In addition, the Company executes the Shareholder Agreement, which set forth the terms and conditions for the operation of the New Company. (3) Overview of the Business Division to be Split (a) Description of Business Research, development, manufacture and sales of hydraulic equipment such as traveling units for hydraulic excavator (b) Reportable Segment Component Solutions Business (4) Timetable for the Absorption-Type Company Split and the Share Transfer Date of the Board of Directors’ resolution
July 31, 2025
Date of the execution of the Share Purchase
July 31, 2025
Agreement and the Shareholders’ Agreement Date of the execution of the Absorption-Type
September 2025 (scheduled)
Company Split Agreement Effective Date of the Absorption-Type Company
October 2025 (scheduled)
Split Closing Date of the Share Transfer
October 2025 (scheduled)
Note: The Absorption-Type Company Split will be implemented without obtaining approval thereof by a resolution of the Company’s shareholders’ meeting, as it is a simplified absorption-type company split for the Company as stipulated in Article 784, paragraph 2 of the Companies Act of Japan. (5) The Share Purchase Price JPY 14.2 billion The final share purchase price will be determined after the price adjustments, etc. as stipulated in the Share Purchase Agreement. (6) Impact on Consolidated Result The expected impact on full-year result due to the transactions above is currently under review.
- 32 -
(Acquisition of Own Shares and Cancellation of Treasury Shares) The Company’s Board of Directors, at a meeting held on July 31, 2025, resolved to set the maximum allowance for acquisition of own shares, pursuant to Article 156 of the Companies Act as applied pursuant to Article 165, Paragraph 3 of the same act and to cancel treasury shares pursuant to Article 178 of the Companies Act. (1) Reasons for the Acquisition of Treasury Shares increase the shareholder value per share and to improve capital efficiency The Company has decided to acquire its own shares and cancel its treasury shares in order to increase the shareholder value per share and to improve capital efficiency. (2) Details of the Acquisition (a)
Class of shares to be acquired
Common shares of the Company
(b)
Total number of shares which can be acquired
Up to 4 million shares (Ratio of outstanding shares (excluding treasury shares): 3.32%)
(c)
Total amount of share acquisition cost
Up to JPY 10 billion
(d)
Acquisition period
August 1, 2025, through to December 30, 2025
(e)
Method of acquisition
Open market purchase on the Tokyo Stock Exchange
(3) Details of the Cancellation (a)
Class of shares to be canceled
Common shares of the Company
(b)
Number of shares to be canceled
All the shares acquired as above
(c)
Scheduled date for the cancellation
To be determined
- 33 -
2 【Others】 With regard to the interim dividend for the 23nd fiscal period (from January 1, 2025 to December 31, 2025), at the Board of Directors meeting held on July 31, 2025, the Company resolved to pay an interim dividend to shareholders or registered pledgees of record as of June 30, 2025 as follows. ① Total interim dividend
¥4,826 million
② Dividend for first six-month
40 yen
③ Effective Date and Commencement Date of Payment
- 34 -
August 29, 2025
Part two 【Information on Assurance Companies, etc. of Submitting Companies】 Not applicable
- 35 -
SEMIANNUAL REVIEW REPORT ON CONSOLIDATED FINANCIAL STATEMENTS OF INDEPENDENT AUDITORS September 30, 2026 Nabtesco Corporation To the Board of Directors KPMG AZSA LLC. Tokyo Office Designated Limited Liability Partners Partners administering the affairs
Certified Public Takeharu Kirikae Accountant
Designated Limited Liability Partners Partners administering the affairs
Certified Public Daisuke Toyama Accountant
Auditor's conclusion Pursuant to the provisions of Article 193-2-1 of the Financial Instruments and Exchange Act, we have reviewed the Nabtesco Corporation's interim consolidated financial statements for the period from January 1, 2025 to December 31, 2025 (January 1, 2025 to June 30, 2025), which consist of the summary of interim consolidated statements of financial position, summary of interim consolidated statements of income, summary of interim consolidated statements of comprehensive income, condensed interim consolidated statements of changes in equity, summary of interim consolidated statements of cash flows and notes thereto, all of which are listed in "Accounting." In our review of the period, we did not believe in all material respects that the condensed interim consolidated financial statements referred to above did not present fairly, in all material respects, the financial position of Nabtesco Corporation and its consolidated subsidiaries as of June 30, 2025, the results of their operations for the interim period then ended, and their cash flows for the interim period in accordance with International Accounting Standards 34, Interim Financial Reporting, as defined by Section 312 of the Regulations Concerning Terminology, Forms and Preparation Methods of Consolidated Financial Statements. Basis for the auditor's conclusion We conducted our interim review in accordance with the standards of the interim review generally accepted in our country. Our responsibility under the criteria for the interim review is set forth under the caption "Auditor's Responsibility in Review of Condensed Interim Consolidated Financial Statements." We are independent of the Company and its consolidated subsidiaries in accordance with the provisions of the Code of Professional Ethics in Japan, which include the provisions applicable to the audit of financial statements of entities with high social impact, and we fulfill our other ethical responsibilities as an auditor. We believe that the evidence upon which we base our conclusions is obtained. Emphasis of Matter As stated in Note 14 to the Condensed Consolidated Interim Financial Statements, the company resolved at the Board of Directors meeting held on July 31, 2025, to consolidate the hydraulic equipment business of the company and its consolidated subsidiaries into a newly established wholly-owned subsidiary (hereinafter referred to as the "New Company") through an absorption-type company split. Subsequently, the company entered into a share transfer agreement with Comer Industries S.p.A. to transfer 70% of the issued shares of the New Company to Comer Industries S.p.A., and the agreement was concluded on the same date. This matter does not affect the conclusion of our audit firm. Other Matter As described in the Reasons for Filing the Amendment Report to the Semiannual Report, the Company has amended its semiannual consolidated financial statements. We previously issued our auditor’s report on the consolidated financial statements before amendment on August 8, 2025. In connection with the amendment, we hereby issue this auditor’s report on the amended semiannual consolidated financial statements. Responsibility of Management, Audit & Supervisory Board Members and Audit & Supervisory Board for the Summary of Interim
- 36 -
Consolidated Financial Statements Management is responsible for the preparation and fair presentation of the summary of interim consolidated financial statements in accordance with International Accounting Standards 34, Interim Financial Reporting. This includes establishing and operating such internal control as management deems necessary for the preparation and fair presentation of the summary of interim consolidated financial statements that are free from material misstatement, whether due to fraud or error. In preparing the summary of interim consolidated financial statements, management is responsible for evaluating whether it is appropriate to prepare the summary of interim consolidated financial statements based on the going concern assumption and for disclosing matters related to a going concern in accordance with International Accounting Standards No. 1, Presentation of Financial Statements, Item 4. The responsibility of the Audit & Supervisory Board Members and Audit & Supervisory Board is to monitor the execution of directors' duties in the development and operation of the financial reporting process. Auditor's Responsibility for Review of Summary of Interim Consolidated Financial Statements during the Period The auditor's responsibility is to independently express a conclusion on the condensed interim consolidated financial statements in the interim review report based on the interim review performed by the auditor. In accordance with the standards of the interim review generally accepted in Japan, the auditor shall, through the course of the mediumterm review, make judgments as a professional expert and conduct the following with professional skepticism: ・Conduct questions, analytical procedures, and other interim review procedures primarily for management, financial, and accounting personnel. The interim review procedures are limited compared with the audits of financial statements for the fiscal year conducted in accordance with auditing standards generally accepted in Japan. ・If the auditor determines that there is significant uncertainty with respect to events or circumstances that raise substantial doubt about the Company's ability to continue as a going concern, the auditor will conclude, based on the evidence obtained, whether there are any matters in the summary of interim consolidated financial statements that would cause the auditor to believe that they are not fairly presented in accordance with International Accounting Standards No. 1, Presentation of Financial Statements, Item 4. In addition, if there is material uncertainty regarding the Company's ability to continue as a going concern, the auditor is required to alert the notes to the summary of interim consolidated financial statements in the Review Report during the period, or if the notes to the summary of interim consolidated financial statements for material uncertainty are not appropriate, to express a limited conclusion or a negative conclusion on the summary of interim consolidated financial statements. The auditor's conclusion is based on evidence obtained through the date of the interim review report; however, future events and circumstances may prevent the entity from continuing as a going concern ・Evaluate whether the presentation, composition and content of the summary interim consolidated financial statements, including the related notes, as well as whether there are any matters that cause the auditor to believe that the presentation and notes to the interim consolidated financial statements are not in accordance with International Accounting Standards 34, Interim Financial Reporting, and whether there are any matters that cause the auditor to believe that the summary of interim consolidated financial statements do not fairly present the underlying transactions and accounting events. ・Obtain evidence regarding the financial information of the Company and its consolidated subsidiaries that forms the basis for expressing a conclusion on the condensed interim consolidated financial statements. The auditor is responsible for directing, supervising and inspecting the interim review of the summary of interim consolidated financial statements. The auditor is solely responsible for the auditor's conclusions. The auditor shall report to the Audit & Supervisory Board Members and Audit & Supervisory Board on the scope of the planned interim review and the timing of its implementation, as well as important findings for the interim review. The auditors shall report to the Audit & Supervisory Board Members and Audit & Supervisory Board on compliance with the provisions of professional ethics in Japan regarding independence, matters that are reasonably likely to affect the auditor's independence, and in cases where countermeasures are taken to eliminate impediments or safeguards are applied to reduce the impediments to an acceptable level.
- 37 -
Interest There is no interest between the Company and its Consolidated Subsidiaries and the Auditing Corporation or its Operating Partners that should be stated pursuant to the provisions of the Certified Public Accountants Act. Notes to the Reader of Semiannual Review Report on Consolidated Financial Statements of Independent Auditors: The Semiannual Review Report on Consolidated Financial Statements of Independent Auditors herein is the English translation of the Semiannual Review Report on Consolidated Financial Statements of Independent Auditors as required by the Financial Instruments and Exchange Act. The end (NOTE) 1 The original report of the above interim review report is maintained separately by the Company (the company submitting the interim report). 2 XBRL are not included in the scope of auditing. Notes to the Reader of Independent Auditor’s Report: The Independent Auditor’s Report herein is the English translation of the Independent Auditor’s Report as required by the Financial Instruments and Exchange Act.
- 38 -
(Amended) Quarterly Report FY2024Q1 Sep 30, 2026 Investor Relations Securities report
Bull 0
Bear 3
Results
[Cover] [Filing]
Amendment Report to Quarterly Report
[Articles of Basis]
Article 24-4-7(4) of the Financial Instruments and Exchange Act
[Submit to]
Kanto Finance Bureau
[Submission date]
September 30, 2026
[Quarterly accounting period]
The First Three-month of 22nd fiscal period (From January 1, 2024 to March 31, 2024)
[Company name]
Nabtesco Corporation
[English translation name]
Nabtesco Corporation
[Title of Representative]
Kazumasa Kimura, representative director
[Location of the head office]
7-9, Hirakawacho 2-chome, Chiyoda-ku, Tokyo
[Phone No.]
+81-3-5213-1134
[Name of administrative liaison]
Yasushi Minegishi, General Manager, Corporate Communications Dept.
[Near contact location]
7-9, Hirakawacho 2-chome, Chiyoda-ku, Tokyo
[Phone No.]
+81-3-5213-1134
[Name of administrative liaison]
Yasushi Minegishi, General Manager, Corporate Communications Dept.
[Locations for Public Inspection]
Tokyo Stock Exchange, Inc. (2-1, Nihonbashi Kabutocho, Chuo-ku, Tokyo)
-1-
- Reasons for Filing the Amendment Report to the Quarterly Report In April 2026, the Company became aware that TMT Machinery, Inc., (Nabtesco's ownership interest is 33%.) an equity-method affiliate, had recorded a gain on extinguishment of tie-in shares arising from the absorption-type merger of one of its subsidiaries (approximately ¥600 million attributable to Nabtesco's ownership interest). Upon becoming aware of this matter, the Company shared the information with its independent auditor and commenced an investigation into the retained earnings accumulated within TMT Machinery's subsidiaries and affiliated entities. As TMT Machinery is an unlisted company and does not prepare consolidated financial statements, the Company had historically applied the equity method based on TMT Machinery's standalone financial statements. Through its investigation, the Company identified that substantial retained earnings had accumulated within TMT Machinery's subsidiaries and affiliated entities and that the portion attributable to the Company had not been reflected in the share of profit (loss) of investments accounted for using the equity method. While continuously consulting with its independent auditor, the Company proceeded with a detailed review of the scope and amount of profits to be recognized. In the course of the accounting auditor’s interim review procedures for the condensed interim consolidated financial statements included in the Semi-annual Securities Report filed on August 14, 2026, the Company re-examined the scope and amounts of profit to be recognized and determined that the aggregate unrecognized amount was expected to be approximately ¥2.8 billion based on the Company’s ownership interest. Following discussions with the accounting auditor, the Company determined that it would be appropriate to recognize share of profit (loss) of investments accounted for using the equity method in accordance with the timing at which profits and losses arose at the subsidiaries and other entities in prior fiscal years, and to correct other errors at the same time. Accordingly, the Company determined that it was necessary to retrospectively amend its Annual Securities Reports, Semi-annual Securities Reports and Quarterly Securities Reports for prior fiscal years. As a result, certain information contained in the Quarterly Report for the 22nd fiscal year (from January 1, 2024 to March 31, 2024), filed by the Company on May 14, 2024, requires correction. Accordingly, pursuant to the provisions of Article 24-4-7(4) of the Financial Instruments and Exchange Act, the Company hereby files this Amendment Report to the Annual Securities Report. The amended consolidated financial statements have been audited by KPMG AZSA LLC, and the relevant independent auditor’s report is attached hereto.
- Matters Amended Part I. Corporate Information Section 1. Overview of the Company
- Trend in Major Management Indicators Section 2. Business Conditions
- Management’s Discussion and Analysis of Financial Condition, Results of Operations and Cash Flows Section 4. Accounting Status
- Summary of Interim Consolidated Financial Statements
- Amended Sections Amended sections are indicated by underlining. As the amendments are extensive, only the amended information is presented for the matters listed above.
-2-
Part one 【Corporate Information】 No.1 【Overview of the Company】
1 【Transition in Major Management Indicators】 First three-month of 21st First three-month of 22nd consolidated fiscal period consolidated fiscal period
Fiscal period
From January 1, 2023 to March 31, 2023
Accounting period
21st full-year
From January 1, 2024 to March 31, 2024
From January 1, 2023 to December 31, 2023
81,929
72,181
333,367
10,552
4,898
25,316
6,490
2,466
14,226
6,936
2,778
16,102
7,637
5,923
20,762
8,267
6,992
23,217
254,252
263,855
262,721
437,619
429,553
428,630
(After restatement) (Million yen) (Million Income before income taxes yen) Net income attributable to owners of (Million the parent yen) (Million Net income yen) Comprehensive income attributable (Million to owners of the parent yen) (Million Comprehensive income yen) Equity attributable to owners of the (Million parent yen) (Million Total assets yen) Net sales
Total basic earnings per share
(Yen)
54.08
20.54
118.52
Diluted earnings per share
(Yen)
54.07
20.54
118.50
Ratio of equity attributable to owners of the parent
(%)
58.1
61.4
61.3
2,314
5,836
11,177
-20,231
-14,042
-46,295
-7,497
2,380
-13,482
99,425
73,306
77,835
Cash flows from operating activities Cash flows from investing activities Cash flows from financing activities Cash and cash equivalents at fiscal year or quarterly end
(Million yen) (Million yen) (Million yen) (Million yen)
(NOTE) 1
Since Nabtesco Corporation (hereinafter, the Company) prepared the summary of quarterly financial statements, the Company does not provide the transition of non-consolidated management indicators. 2 Figures are rounded to the nearest unit. 3 Consolidated financial statements and summary of quarterly financial statements are prepared in accordance with International Financial Reporting Standards (IFRS) 3 The Company has determined that retrospective restatement was necessary regarding "Equity in earnings of affiliates" and other matters and provides numerical values that reflect this restatement. For further details, please refer to "No.4 Accounting Status, 1 Summary of Quarterly Consolidated Financial Statements, Notes on the Summary of Quarterly Consolidated Financial Statements. 4. Additional information, (1) Revision of errors of prior periods."
2 【Description of Business】 There have been no significant changes in the content of the business conducted by our group (the Company and our subsidiary companies) during the first quarter of the current fiscal year. There are no changes in major affiliated companies.
-3-
-4-
No.2 【Business Situation】 1 【Business Risks】 During the first quarter of the current fiscal year, there have been no significant changes in the status of business and accounting described in this quarterly report that could have a significant impact on the decisions of investors or Business and Other Risks described in the annual report for the previous fiscal year. There were no significant events which company should report.
-5-
2【Management's Analysis of Financial Condition, Results of Operations and Cash Flows】 (1) Analysis of Operating Results (Sales and Operating Income) During the first quarter of the fiscal year, net sales of the Group decreased by ¥9,748 million, or 11.9%, year-on-year to ¥72,181 million, reflecting the strong domestic and overseas demand for automatic doors for buildings and the positive impact of foreign exchange rates on overseas businesses in Automatic Doors. In addition, sales of Aircraft Equipment increased due to growth in demand from both the commercial and defense sectors, while sales of Component Solutions decreased due to a significant decline in demand. Operating income decreased ¥1,641 million, or 30.0%, year-on-year to ¥3,837 million due to the significant impact of the decrease in income from Component Solutions, despite the increase in income from Transport Solutions and Accessibility Solutions due to the increase in sales. Operating income to net sales was 5.3%. Operating results by business segment were as follows: ①
Component Solutions Business Sales for Component Solutions Business decreased by ¥15,369 million, or 40.4% to ¥22,713 million and operating income decreased by ¥3,156 million or 79.5% to ¥816 million. Sales of Precision Reduction Gears decreased significantly year-on-year due to a decline in EV related and automation capital expenditures, as well as continued inventory adjustment for industrial robots. Sales of Hydraulic Equipment declined year on year due to the continued sluggish demand for construction machinery not only in the Chinese market but also in Europe, the United States, and Southeast Asia.
②
Transport Solutions Business Sales for Transport Solutions Business increased by ¥2,286 million, or 13.6% to ¥19,139 million and operating income increased by ¥909 million, or 62.6% to ¥2,362 million. Sales of Railroad Vehicle Equipment increased year on year due to steady growth in domestic and overseas MRO (Maintenance, Repair, and Overhaul). Sales of Aircraft Equipment increased substantially year-on-year due to the strong demand of the business for commercial aircraft due to passenger demand recovering to the level before the COVID19, as well as the expansion of demand for the Ministry of Defense. Sales of Commercial Vehicle Equipment remained at the same level as the same period of the previous fiscal year due to strong demand from domestic customers, despite a decline in demand in the Southeast Asian market. Sales of Marine Vessels Equipment increased year on year due to steady demand for new vessels and MRO, as well as expanded sales of new type of Main Engine Remote-Control System and Deep Sea products
③
Accessibility Solutions Business Sales for Accessibility Solutions Business increased by ¥4,074 million, or 17.8% to ¥27,013 million and operating income increased by ¥735 million, or 32.8% to ¥2,977 million. In Automatic Door business, sales increased year on year due to strong demand for doors for domestic and overseas buildings and overseas platform doors.
④ Others Sales for Others decreased by ¥739 million, or 18.2% to ¥3,317 million and operating income decreased by ¥105 million, or 25.9% to ¥300 million. Sales of Packaging Machines declined from the same period of the previous fiscal year due to a delay in the timing of delivery for the domestic market.
-6-
(Income before tax) Financial income was ¥745 million mainly due to foreign exchange gains. Financial costs amounted to ¥188 million mainly due to interest expenses. Equity in earnings of affiliates was ¥503 million. As a result, quarterly profit before tax decreased by ¥5,655 million year on year to ¥4,898 million.
(Net income attributable to owners of the parent) As a result, quarterly income attributable to owners of the parent, after deducting income tax expense of ¥2,120 million and quarterly income attributable to non-controlling interests of ¥312 million, decreased by ¥4,025 million year on year to ¥2,466 million. Basic quarterly earnings per share decreased by ¥33.54 to ¥20.54.
(2) Analysis of Financial Position
①
(Million yen)
As of the end of the previous consolidated fiscal year (December 31, 2023)
As of the end of the first three-month period of the current consolidated fiscal year (March 31, 2024)
Total Assets
428,630
429,553
923
Liabilities
150,485
149,296
Equities
278,145
280,256
-1,189
Change
2,111
Total Assets At the end of the first quarter, current assets were ¥218,904 million and non-current assets were ¥210,649 million. As a result, total assets increased by ¥923 million from the end of the previous fiscal year to ¥429,553 million. The main factors of the increase were a ¥6,167 million increase in inventories and a ¥3,751 million increase in the fixed assets, plant and equipment. The main factor for the decrease was a ¥9,616 million decrease in trade receivables.
② Liabilities At the end of the first quarter, current liabilities were ¥110,556 million and non-current liabilities were ¥38,741 million. As a result, total liabilities decreased by ¥1,189 million from the end of the previous fiscal year to ¥149,296 million. The main factor for the increase was an increase of ¥10,018 million in borrowings under non-current liabilities. The main decreasing factors were a decrease of ¥7,018 million in other payables and a decrease of ¥2,663 million in trade payables. ②
Equity Total equity at the end of the first quarter of the current fiscal year was ¥280,256 million. Total equity attributable to owners of the parent was ¥263,855 million, an increase of ¥1,134 million from the end of the previous fiscal year. The main factors of increase were an increase of ¥3,457 million in other factors of equity due to an increase in foreign currency translation adjustment and a quarterly profit attributable to owners of the parent of ¥2,466 million. The main factor for the decrease was a ¥4,825 million decrease in retained earnings due to dividends.
-7-
(3) Cash Flow First three-month period of consolidated FY2023 (January 1, 2023 to March 31, 2023)
(Million yen) First three-month period of consolidated FY2024 (January 1, 2024 to March 31, 2024)
(After restatement) Cash flows from operating activities
2,314
5,836
Cash flows from investing activities
-20,231
-14,042
Free cash flows
-17,917
-8,205
Cash flows from financing activities
-7,497
2,380
Cash and cash equivalents (hereinafter referred to as "cash") at the end of the first quarter of the current fiscal year decreased by ¥4,529 million from the end of the previous fiscal year to ¥73,306 million, as the funds acquired from operating activities were mainly used for capital expenditures and the payment of dividends. ① Cash flows from operating activities Net cash provided by operating activities in the first quarter of the current fiscal year under review was ¥5,836 million. The main factors contributing to this increase were non-cash items such as quarterly income, depreciation and amortization, and a decrease in trade receivables. The main reasons for the decrease were an increase in inventories and a decrease in trade payables. ② Cash flows from investing activities Net cash used in investing activities for the first quarter of the current fiscal year was ¥14,042 million. Major outflows included purchases of property, plant and equipment. ③ Cash flows from financing activities Net cash provided by financing activities in the first quarter under review amounted to ¥2,380 million. The main reason for the increase was proceeds from long-term loans payable. The main reason for the decrease was the payment of dividends. (4) Issues to be addressed in Business and Finance During the first quarter of the fiscal year under review, there were no significant changes or new issues to be addressed by the Group.
(5) R&D activities Research and development expenses for the first quarter of the current fiscal year were ¥2,800 million.
3【Significant Management Contracts】 During the first quarter of the fiscal year, there were no major decisions or conclusions of significant management agreements.
-8-
No.3【Status of the Company Submitting the Report】 1【Status of Shares】 (1) 【Total Number of Shares】 ① 【Total number of shares】 Type
Total number of authorized shares
Common stock
400,000,000
Total
400,000,000
② 【Shares outstanding】 Number of shares Number of shares outstanding (shares) as Type outstanding (shares) Name of stock exchange listings of the date of filing As of March 31, 2024 (May 14, 2024) Tokyo Stock Exchange Common shares 121,064,099 121,064,099 Prime section Total
121,064,099
121,064,099
Content The number of shares per unit is 100 shares.
-
-
(NOTE) The "Number of shares outstanding as of the filing date" column does not include the number of shares issued upon the exercise of stock acquisition rights to shares from May 1, 2024 to the filing date of this Quarterly Report.
(2) 【Status of Stock Acquisition Rights】 ① 【Details of stock option plan】 Not applicable. ② 【Status of other stock acquisition rights】 Not applicable.
(3) 【Status of Exercise of Bonds with Stock Acquisition Rights with Exercise Price Adjustment, etc.】 Not applicable.
(4) 【Changes in the number of issued shares, capital stock, etc.】 Date
Number of shares Number of shares Change in legal Balance of legal Change in capital Balance of capital outstanding outstanding as the capital surplus capital surplus (Million yen) (Million yen) increase/decrease end of therm. (Million yen) (Million yen)
March 31, 2024
-
121,064,099
-
10,000
-
(5) 【Major Shareholders】 As this quarterly accounting period is the first quarter accounting period, there are no items to be stated.
-9-
26,274
(6) 【Status of voting rights】 "Status of voting rights" as of the end of the first quarter under review is based on the shareholder register as of the previous record date (December 31, 2023) because it cannot be stated since the details of the shareholder register cannot be confirmed. ① 【Shares outstanding】 As of December 31, 2023 Classification
Number of shares
Number of voting rights
Content
-
-
-
-
-
-
-
-
-
-
-
-
-
Non-voting stock Shares with restricted voting rights (Treasury stocks) Shares with restricted voting rights (other) Shares with full voting rights (treasury stock, etc.) Shares with full voting rights (other) Shares less than one unit
(Treasury stock held) Common shares 435,600 (Mutually Held Shares) Common shares 15,000 Common shares 120,499,100 Common shares 114,399
Number of shares outstanding
1,204,991
121,064,099
Voting rights of all shareholders
-
-
Shares less than one unit (100 shares)
-
- 1,204,991
-
-
(NOTE) 1 Common shares in the "Shares less than 1 unit" column include 70 shares of treasury stock owned by the Company and 66 shares of our stock owned by Japan Custody Bank, Ltd. (Trust Account E) as trust assets under the "Stock Benefit Trust (BBT)" plan. 2 "Shares with full voting rights (other)" column includes 6,000 shares (60 voting rights) in the name of the Japan Securities Depository Center, Inc. and 589,800 shares (5,898 voting rights) of ours owned by the Japan Custody Bank, Ltd. (Trust Account E) as trust assets for the "Stock Benefit Trust (BBT)" plan. The 5,898 voting rights are not exercised. ② 【Treasury stock】
Owner's name
Address of the holder
(Treasury stock held) Nabtesco Corporation
7-9, Hirakawacho 2-chome, Chiyoda-ku, Tokyo 7-20 Motomachi-dori 5chome, Chuo-ku, Kobe-shi, Hyogo
(Mutually Held Shares) Kyokko Denki Co., Ltd. 計
Number of treasury stock
-
As of December 31, 2023 Ratio of shares Number of Total number of held to total shares held in shares to be number of the name of own shares others outstanding (%)
435,600
-
435,600
0.36
15,000
-
15,000
0.01
450,600
-
450,600
0.37
(NOTE) The above numbers of shares held do not include 589,800 shares of our company owned by Japan Custody Bank, Ltd. (Trust Account E) as trust assets under the "Stock Benefit Trust (BBT)" plan.
2【Status of Management】 Not applicable.
- 10 -
No.4 【Accounting Status】
-
Preparation of summary of quarterly consolidated financial statements (1) Our summary of quarterly consolidated financial statements have been prepared in accordance with International Accounting Standards No. 34, "Interim Financial Reporting" (hereinafter referred to as "IAS No. 34") pursuant to the provisions of Article 93 of the Ordinance on Terminology, Forms, and Preparation Methods of Quarterly Consolidated Financial Statements (Cabinet Office Ordinance No. 64 of 2007; hereinafter referred to as "Ordinance on Quarterly Consolidated Financial Statements") because they meet all of the requirements of "Designated International Accounting Standards Designated Companies" set forth in Article 1-2 of the Ordinance on Quarterly Consolidated Financial Statements. (2) The summary of quarterly consolidated financial statements have been rounded to the nearest unit.
-
Audit Certification Pursuant to Article 193-2-1 of the Financial Instruments and Exchange Act, we have received a quarterly review of the summary of quarterly consolidated financial statements for the first three-month of fiscal year (January 1, 2024 to March 31, 2024) and the first quarter of the current fiscal year (January 1, 2024 to March 31, 2024) by KPMG AZSA LLC. In addition, we have submitted a Corrections Report of a Quarterly Report, pursuant to Article 24-5-5 of the Financial Instruments and Exchange Act, and the summary of quarterly consolidated financial statements after correction has received a quarterly review by KPMG AZSA LLC.
- 11 -
1【Summary of Quarterly Consolidated Financial Statements】 (1) 【Summary of Quarterly Consolidated Statement of Financial Position】
Note No.
End of consolidated FY2023 (as of December 31, 2023)
(Million yen) End of the first three-month period of consolidated FY2024 (as of March 31, 2024)
Assets Current assets Cash and cash equivalents
77,835
73,306
Trade receivables
82,167
72,551
Contract assets
3,554
3,756
Other receivables
1,682
1,839
50,969
57,136
616
1,227
Inventories Other financial assets
11
Other current assets
6,995
9,089
Total current assets
223,818
218,904
Property, plant and equipment
107,527
111,278
Intangible assets
11,624
11,881
Non-current assets
Right-of-use asset
8,908
8,743
Goodwill
25,750
26,177
Investment real estate
10,394
10,367
Investments accounted for using the equity method
24,005
24,508
12,550
13,393
3,040
3,307
Other financial assets
11
Deferred tax assets Other non-current assets
1,013
994
Total non-current assets
204,812
210,649
428,630
429,553
Total assets
- 12 -
(Million yen) Note No.
End of consolidated FY2023 (as of December 31, 2023)
End of the first three-month period of consolidated FY2024 (as of March 31, 2024)
Liabilities and equity Liabilities Current liabilities Trade payables
50,783
48,121
Contract liabilities
11,024
10,087
21,400
19,006
Other payables
23,392
16,374
Income taxes payables
3,018
2,436
Provision
2,720
2,449
Lease liabilities
2,799
2,648
-
23
Other current liabilities
7,327
9,411
Total current liabilities
122,462
110,556
173
10,190
Lease liabilities
8,060
8,076
Liabilities concerning retirement benefit
9,174
9,292
Deferred tax liabilities
7,951
8,588
516
508
Other non-current liabilities
2,149
2,087
Total non-current liabilities
28,022
38,741
150,485
149,296
Capital stock
10,000
10,000
Share premium
15,139
15,093
Retained earnings
222,362
219,969
Treasury shares Other components of equity
-3,943
19,162
-3,827
22,620
Equity attributable to owners of the parent
262,721
263,855
Non-controlling interests
15,424
16,401
Total shareholders' equity
278,145
280,256
428,630
429,553
Borrowings
Other financial liabilities
11
11
Non-current liabilities Borrowings
Other financial liabilities
11
11
Total liabilities Capital
Total liabilities and equity
- 13 -
(2) 【Summary of Quarterly Consolidated Statements of Income】 【First Three-month of Consolidated Fiscal Year】
Note No.
First three-month period of consolidated FY2023 (From January 1, 2023 to March 31, 2023)
(Million yen) First three-month period of consolidated FY2024 (From January 1, 2024 to March 31, 2024)
(After restatement) Net sales
6, 7
Cost of sales Gross profit Other income Selling, general and administrative expense Other expenses
81,929
72,181
-60,807 21,122
-51,273
238
234
-15,718
-17,201
-163
20,908
-103
Operating income
6
5,478
3,837
Financial income
8
4,305
745
Financial cost
8
-139
907
-188
Profit (loss) before tax
10,552
4,898
Income tax expenses
-3,616
6,936
-2,120
6,490
2,466
446
312
6,936
2,778
Equity in earnings of affiliates
Net income (loss)
503
2,778
Net income (loss) attributable to Owners of the parent Non-controlling interests Net income (loss)
Net income (loss) per share Basic earnings (loss) per share
10
54.08
20.54
Diluted earnings (loss) per share
10
54.07
20.54
- 14 -
(3) 【Summary of Quarterly Consolidated Statements of Comprehensive Income】 【First Three-month of Consolidated Fiscal Year】
Note No.
(Million yen) First three-month period of consolidated FY2024 (From January 1, 2024 to March 31, 2024)
First three-month period of consolidated FY2023 (From January 1, 2023 to March 31, 2023) (After restatement)
Net income (loss)
6,936
2,778
7
263
7
263
1,286
3,755
37
196
1,323
3,951
Other comprehensive income after taxes
1,330
4,214
Total comprehensive income
8,267
6,992
Other comprehensive income Items that will not be reclassified to profit or loss Net changes in financial assets measured at fair value through other comprehensive income Total components that will not be reclassified to profit or loss Components that will be reclassified to profit or loss Exchange differences on foreign operations Share of other comprehensive income of investments accounted for using equity method Total components that will be reclassified to profit or loss
Comprehensive income attributable to Owners of the parent
7,637
5,923
Non-controlling interests
630
1,068
Total comprehensive income
8,267
6,992
- 15 -
(4) 【Summary of Quarterly Consolidated Statement of Changes in Equity】 First three-month period of previous consolidated fiscal year (From January 1, 2023 to March 31, 2023) (Million yen)
(After restatement)
Note No.
Balance as of January 1, 2023
Capital stock
Share
Retained
Treasury
premium
earnings
shares
Other components of equity Exchange differences on foreign operations
Valuation difference due to change in fair value
9,719
3,263
10,000
15,048
217,865
Net income (loss)
-
-
6,490
-4,646 -
-
-
Other comprehensive income
-
-
-
-
1,140
7
Total comprehensive income
-
-
6,490
-
1,140
7
Acquisition, sales, etc. of treasury shares
-
-
109
-
-
-
-
-16
-
-
-
-
-
-4,693 -
-
-
-
-
-
-
-
-
-
-35
109
-
-
10,000
15,013
-4,708
-4,537
10,859
3,270
Dividends
9
Transfer from other components of equity to retained earnings Share-based compensation transactions Total transactions with owners, etc. Balance as of March 31, 2023
-35
Other components of equity (After restatement)
Note Remeasurements No. of net defined benefit liability (asset)
Balance as of January 1, 2023
Total
219,647
Total equity attributable to owners of the parent
Non-controlling interests
Total equity
-
12,982
251,250
14,532
265,782
Net income (loss)
-
-
6,490
446
6,936
Other comprehensive income
-
1,147
1,147
184
1,330
Total comprehensive income
-
1,147
7,637
630
8,267
Acquisition, sales, etc. of treasury share
-
-
94
-
94
-
-
-
-
-4,693
-482
-5,175
-
-
-
Total transactions with owners, etc.
-
-
-35
-35
Balance as of March 31, 2023
-
14,129
Dividends Transfer from other components of equity to retained earnings Share-based compensation transactions
9
- 16 -
-
-4,634
254,252
-
-482
14,680
-
-5,117
268,932
First three-month period of current consolidated fiscal year (From January 1, 2024 to March 31, 2024) (Million yen) Other components of equity Note No.
Retained earnings
Treasury shares
Exchange differences on foreign operations
Valuation difference due to change in fair value
15,516
3,646
2,466
-3,943 -
-
-
-
-
-
3,195
263
-
-
2,466
-
3,195
263
-
-
116
-
-
-
-
-34
-4,825
-
-
-
-
-
-
-
-
-
-
-
0
-
-
-
-
-
-
-
-
-46
-0
116
-
10,000
15,093
-4,859
-3,827
18,711
-0
Capital stock
Share premium
10,000
15,139
222,362
Net income (loss)
-
-
Other comprehensive income
-
Total comprehensive income Acquisition, sales, etc. of treasury shares
Balance as of January 1, 2024
Dividends
9
Increase (decrease) in non-controlling interests due to capital increase of subsidiaries Transfer from other components of equity to retained earnings Share-based compensation transactions Total transactions with owners, etc. Balance as of March 31, 2024
-46
Other components of equity Note No.
Balance as of January 1, 2024
Remeasure ments of net defined benefit liability (asset)
Total
219,969
Total equity attributable to owners of the parent
Non-controlling interests
Total equity
-
19,162
262,721
15,424
278,145
Net income
-
-
2,466
312
2,778
Other comprehensive income
-
3,458
3,458
756
4,214
Total comprehensive income
-
3,458
5,923
1,068
6,992
Acquisition, sales, etc. of treasury shares
-
-
81
-
81
-
-
-4,825
-272
-
-
-
181
-5,097
-
-0
-
-
-
-46
-
-46
Dividends Increase (decrease) in non-controlling interests due to capital increase of subsidiaries Transfer from other components of equity to retained earnings Share-based compensation transactions
9
-
-
Total transactions with owners, etc.
-
Balance as of March 31, 2024
-
-0
22,620
- 17 -
-4,790
263,855
-91
16,401
181
-4,881
280,256
3,909
(5) 【Summary of Quarterly Consolidated Statement of Cash Flows】
Note No.
First three-month period of consolidated FY2023 (From January 1, 2023 to March 31, 2023)
(Million yen) First three-month period of consolidated FY2024 (From January 1, 2024 to March 31, 2024)
(After restatement) Cash flows from operating activities Net income
6,936 3,684
Depreciation and amortization
2,778 3,935
Increase (decrease) in liabilities concerning retirement benefits
98
97
Interest and dividend income
-60 100
-55 177
-907 13
-503 46
Interest expenses Decrease (Increase) in valuation on investment securities
8
Equity loss (gain) in earnings of affiliates Loss (gain) on sales of fixed assets Expenses of income tax Decrease (increase) in trade receivables Decrease (increase) in inventories Increase (decrease) in operating payables
-4,008 3,616 7,131
2,120 9,844
-4,705 2,238
-5,321 -3,677
146
Others
14,282
Subtotal
-8
-937
8,495
Interest received
59
Dividend received
19 -94
14 -178
-11,951
-2,556
2,314
5,836
Decrease in time deposits (Increase)
582
-630
Purchases of tangible fixed assets
-8,931 -375
-12,428 -679
-5,282
-
Other
-5,732 -493
- -304
Cash flows from investing activities
-20,231
-14,042
-2,316
-2,500 10,090
Interest paid Income taxes refunded (paid) Cash flows from operating activities
61
Cash flows from investing activities
Purchases of intangible fixed assets Payments for acquisition of subsidiaries resulting in a change in the scope of consolidation Payments for settlement of sales price on investment securities
12
Cash flows from financing activities Increase (decrease) in short-term bank loans Proceeds from long-term loans payable
- -60 -715
Repayment of long-term loans payable Payments of lease liabilities Decrease in treasury stocks (Increase) Cash dividends paid
9
Capital contribution from non-controlling interests Dividends paid to non-controlling interests Cash flows from financing activities
-57 -800
23 -4,408
16 -4,524
- -21
181 -25
-7,497
2,380
Increase (decrease) in cash and cash equivalents
-25,414
-5,825
Cash and cash equivalents at beginning of term
124,413
77,835
Effect of exchange rate changes on cash and cash equivalents Cash and cash equivalents at end of term
- 18 -
426
1,296
99,425
73,306
【Notes on the Summary of Quarterly Consolidated Financial Statements】
- Reporting company The Company is a company located in Japan. Our summary of quarterly consolidated financial statements are composed of the interests in us and our subsidiaries (together, the "Group") and affiliates, with an ended date of March 31, 2024. Our main businesses are Component Solutions Business, Transport Solutions Business, and Accessibility Solutions Business. The details are described in Note "6. Business Segments."
- Basis of preparation (1) Compliance with IFRS The summary of quarterly consolidated financial statements have been prepared in accordance with IFRS pursuant to the provisions of Article 93 of the Ordinance on Quarterly Consolidated Financial Statements as they satisfy all of the requirements of "Designated International Accounting Standards Designated Companies" set forth in Article 1-2 of the Ordinance on Quarterly Consolidated Financial Statements. The summary of quarterly consolidated financial statements for the first quarter of the fiscal year ended December 31, 2024, which was approved by Kazumasa Kimura, representative director, on May 14, 2024, was corrected and approved by Kazumasa Kimura, representative director, on September 30, 2026. (2) Basis for measurement The summary of quarterly consolidated financial statements of our group have been prepared on a historical cost basis, except for financial instruments measured at fair value, as described in Note 3, "Significant Accounting Policies," below. (3) Functional and presentation currencies The summary of quarterly consolidated financial statements of our group represent the Japanese yen, which is our functional currency.
- Important accounting policies The significant accounting policies that our group applies in this condensed quarterly consolidated financial statements are the same as those applied in the consolidated financial statements for the previous fiscal year. Income tax expense for the first quarter of the current fiscal year is calculated using the estimated average annual effective tax rate. In addition, our group continues to apply a 1-time exception to the recognition and disclosure of deferred tax assets and liabilities related to the International Tax Reform-Pillar 2 Model Rule of IAS No. 12, Income Taxes, which has no impact on summary of quarterly consolidated financial statements. 4.Additional information (1) Revision of errors of prior periods It has come to light that in the calculation of equity in earnings (losses) of affiliates at certain of the Company's equity-method affiliates, the financial figures obtained from the said equity-method affiliates, which should have been calculated based on changes in consolidated net assets, including the subsidiaries of said equity-method affiliates, were instead calculated based on changes in non-consolidated net assets. As a result, an error was identified whereby the amounts reported as "Equity in earnings of affiliates" in the Company’s consolidated statements of income and "Investments accounted for using the equity method" in the consolidated statement of financial position have been consistently understated since prior years. The Company has determined that retrospective restatement was necessary regarding the above error and has revised the consolidated financial statements and other financial statements contained in the Annual Securities Reports, the Semiannual Reports and the Quarterly Reports that have already been submitted. We have also revised the other errors contained therein. Compared to the numerical values prior to the restatement, the major impacts of the restatement are that in the summary of quarterly consolidated statements of income for the first three-month period of consolidated FY2023, "Equity in earnings of affiliates" increased by ¥33 million and "Net sales" decreased by ¥264 million.
- 19 -
(2) Major impacts of restatement First three-month of 21st consolidated fiscal period (From January 1, 2023 to March 31, 2023)
Fiscal period
(Prior to restatement) (Million yen) (Million Income before income taxes yen) Net income attributable to owners of (Million the parent yen) (Million Net income yen) Comprehensive income attributable (Million to owners of the parent yen) (Million Comprehensive income yen) Net sales
Impact
(After restatement)
82,193
81,929
10,825
10,552
6,699
6,490
7,145
6,936
7,782
7,637
8,412
8,267
-264 -273 -209 -209 -145 -145
Total basic earnings per share
(Yen)
55.82
54.08
Diluted earnings per share
(Yen)
55.82
54.07
-1.74
Cash flows from operating activities
(%)
2,314
2,314
-
(20,231)
-
(7,497)
-20,231
99,425
99,425
-
Cash flows from investing activities Cash flows from financing activities Cash and cash equivalents at fiscal year or quarterly end
(Million yen) (Million yen) (Million yen)
- 20 -
-7,497
-1.75
-
- Critical accounting judgments, estimates and assumptions The preparation of summary of quarterly consolidated financial statements in conformity with IFRS requires management to make judgments, estimates and assumptions that affect the application of accounting policies and the reported amounts of assets, liabilities, revenues and expenses. Actual results could differ from those estimates. Estimates and underlying assumptions are reviewed on an ongoing basis. Changes in accounting estimates are recognized in the period in which the estimates change and in future periods affected. Judgments that involve significant accounting estimates and estimates in these summary of quarterly consolidated financial statements are, in principle, the same as the consolidated financial statements for the previous fiscal year.
- 21 -
- Business Segments (1) Summary of reportable segments The Group’s reportable segments are components of the Group about which separate financial statement is available that is evaluated regularly at the Board of Directors’ meetings in deciding how to allocate the management resources and in assessing performance. The Group classifies its business segments into the following three reportable segments, based on the similarity of business models: 1) the “Component Solutions Business;” 2) the “Transport Solutions Business;” and 3) the “Accessibility Solutions Business.” The main lines of business of each reportable segment are as below.
Business segment
Main lines of business
Component Solutions Business
The design, manufacture, sale, maintenance and repair of industrial robot components and equipment for construction machinery and its components The design, manufacture, sale, maintenance and repair of brake systems and automatic door operating systems for railroad vehicles, aircraft components, brake systems and drive control units for vehicles, control systems for marine vessels, and components thereof The design, manufacture, sale, installation, maintenance and repair of automatic door operating systems for buildings and general industry, platform safety systems, and components thereof
Transport Solutions Business Accessibility Solutions Business
(2) Information on reportable segments
The accounting policies of the reportable segments are the same as the accounting policies of our group described in "3. Important accounting policies “in the notes. Intersegment sales and transfers are based on prevailing market prices. First three-month period of previous consolidated fiscal year (From January 1, 2023 to March 31, 2023) (Million yen)
Reportable Segments
(After restatement)
Others
Total
Amount stated in summary of Adjustments consolidated statements of income
Component
Transport
Accessibility
Total
38,082
16,853
22,939
77,874
4,055
81,929
-
81,929
716
316
4
1,035
96
1,131
-
Total sales
38,798
17,168
22,943
78,909
4,151
83,060
-1,131
Segment income (Operating income)
3,972
1,452
2,242
7,666
405
8,071
Net sales Sales to external customers Inter-segment sales
-1,131 -2,592
81,929 5,478 4,305
Financial income
-
Financial costs
-
-139
Equity in earnings of affiliates
-
907
Income before tax
-
10,552
Notes: 1. “Others” is a business segment that is not a reportable segment and consists of businesses that are engaged in the design, manufacture, sale, maintenance and repair of packaging machine, three-dimensional model production device and components thereof. 2. Adjustment to sales is as a result of eliminations of inter-segment transactions. 3. Adjustment to segment income (operating income) is total profit/loss, etc. that are not allocated to the respective segments.
- 22 -
First three-month period of current consolidated fiscal year (From January 1, 2024 to March 31, 2024) (Million yen)
Reportable Segments
Amount stated in summary of Adjustment consolidated s statements of income
Others
Total
68,865
3,317
72,181
-
72,181
3
1,173
10
1,184
-1,184
-
19,543
27,016
70,038
3,327
73,365
-1,184
72,181
2,362
2,977
6,155
300
6,455
-2,617
3,837
Component
Transport
Accessibility
22,713
19,139
27,013
766
405
23,479 816
Total
Net sales Sales to external customers Inter-segment sales Total sales Segment income (Operating income)
745
Financial income
-
Financial costs
-
-188
Equity in earnings of affiliates
-
503
Income before tax
-
4,898
Notes: 1. “Others” is a business segment that is not a reportable segment and consists of businesses that are engaged in the design, manufacture, sale, maintenance and repair of packaging machine, three-dimensional model production device and components thereof. 2. Adjustment to sales is as a result of eliminations of inter-segment transactions. 3. Adjustment to segment income (operating income) is total profit/loss, etc. that are not allocated to the respective segments.
- 23 -
- Revenue from contracts with customers Our businesses are comprised of Component Solutions Business, Transport Solutions Business, Accessibility Solutions Business and Other Businesses, and are subject to periodic review by our Board of Directors to determine the allocation of management resources and assess performance. In our group, revenues earned through these businesses are presented as net sales. Net sales are broken down by major products. The relation between these disaggregated net sales and net sales by segment as described in Note "6. Business Segments" is as follows: There is no obligation to perform as an agent for our group.
Business segment
Major products
First three-month period of consolidated FY2023 (From January 1, 2023 to March 31, 2023)
(Million yen) First three-month period of consolidated FY2024 (From January 1, 2024 to March 31, 2024)
(After restatement)
Component Solutions Business
Transport Solutions Business
Precision Reduction Gears
25,156
11,996
Hydraulic Equipment
12,925
10,716
Subtotal
38,082
22,713
Railroad Vehicle Equipment
4,447
5,239
Aircraft Equipment
3,393
4,826
3,153
3,175
3,991
4,183
1,869
1,715
Subtotal
16,853
19,139
Automatic Door
22,939
27,013
Subtotal
22,939
27,013
3,833
3,200
222
117
4,055
3,317
81,929
72,181
Commercial Vehicle Equipment Marine Vessels Equipment Others
Accessibility Solutions Business
Packaging Machines Others
Others Subtotal Total
(NOTE) Amounts are expressed as external sales.
- 24 -
- Financial income and costs (1) Financial income Breakdown of financial income is as follows: (Million yen) First three-month period of First three-month period of consolidated FY2023 consolidated FY2024 (From January 1, 2023 to (From January 1, 2024 to March 31, 2023) March 31, 2024) (After restatement) Interest income Financial assets measured at amortized cost
59
54
1
1
4,008
8
237
682
4,305
745
Dividends income Financial assets measured at fair value through other comprehensive income Gain on valuation of investment securities (Note) Financial assets measured at fair value through profit or loss Foreign exchange gain Total
(NOTE) For Harmonic Drive Systems Inc. shares for which a portion of the sale was completed in the first quarter of the previous fiscal year, the difference between the gross sales price and the fair value based on the average of the trading volume weighted average price (Volume Weighted Average Price) on each day during the same period of ¥886 million and the valuation gain of ¥3,114 million from the remeasurement of the shares held by the Company based on the closing price (fair value) on the last day of the fiscal year are included. (2) Financial cost The breakdown of financial costs is as follows: (Million yen) First three-month period of First three-month period of consolidated FY2023 consolidated FY2024 (From January 1, 2023 to (From January 1, 2024 to March 31, 2023) March 31, 2024) (After restatement) Interest expenses Financial liabilities measured at amortized cost
51
129
Lease liabilities
49
48
Financial assets measured at fair value through profit or loss
38
11
Total
139
188
Valuation loss from derivatives transactions
- 25 -
- Cash Dividend Cash dividends paid in previous first quarter and current first quarter were as follows: First three-month period of previous consolidated fiscal year (From January 1, 2023 to March 31, 2023) Resolution
Total dividends (Million yen)
Dividends per share (yen)
Record Date
Effective date
March 23, 2023 Annual Shareholders' 4,693 39 December 31, 2022 March 24, 2023 Meeting (NOTE) The total amount of dividends declared by resolution of the Ordinary General Meeting of Shareholders on March 23, 2023 includes dividends of ¥12 million on our shares held by the trust account (re-trustee: Japan Custody Bank, Ltd. (Trust Account E)) of Mizuho Trust & Banking Co., Ltd. related to the stock benefit trust (BBT). First three-month period of current consolidated fiscal year (From January 1, 2024 to March 31, 2024) Resolution
Total dividends (Million yen)
Dividends per share (yen)
Record Date
Effective date
March 26, 2024 Annual Shareholders' 4,825 40 December 31, 2023 March 27, 2024 Meeting (NOTE) The total amount of dividends declared by resolution of the Ordinary General Meeting of Shareholders on March 26, 2024 includes dividends of ¥24 million on our shares held by the trust account (re-trustee: Japan Custody Bank, Ltd. (Trust Account E)) of Mizuho Trust & Banking Co., Ltd. related to the stock benefit trust (BBT). 10. Earnings per shares (1) Basis for calculating basic earnings per share Basic earnings per share and the calculation basis are as follows: First three-month period of consolidated FY2023 (From January 1, 2023 to March 31, 2023)
First three-month period of consolidated FY2024 (From January 1, 2024 to March 31, 2024)
(After restatement) Profit attributable to owners of the parent (Million yen)
6,490
2,466
Weighted average number of shares of (Thousands common stock of shares)
120,025
120,054
54.08
20.54
Basic earnings per share
(Yen)
(2) Basis for calculating diluted earnings per share Diluted earnings per share and the calculation basis are as follows: First three-month period of consolidated FY2023 (From January 1, 2023 to March 31, 2023)
First three-month period of consolidated FY2024 (From January 1, 2024 to March 31, 2024)
(After restatement) Diluted net income attributable to (Million yen) owners of the parent Weighted average number of shares of (Thousands common stock of shares) Effect of stock options using the stock (Thousands acquisition rights method of shares) Diluted weighted average shares for (Thousands common stock of shares)
- 26 -
6,490
2,466
120,025
120,054
5
2
120,030
120,056
Diluted earnings per share
(Yen)
54.07
- 27 -
20.54
- Financial instruments (1) Fair Value Measurements ① Financial assets measured at amortized cost Other financial assets Fair values of other financial assets are primarily valued based on the present value of these assets discounted at a rate adjusted for credit risk, segregated by certain time periods. ② Financial assets measured at fair value through profit or loss a Golf membership The fair value of golf club memberships is valued based on quoted prices and other factors. Golf membership is included in "Other Financial Assets" in the Summary of Quarterly Consolidated Statements of Financial Position. b Derivative financial assets The fair value of foreign currency forward contracts is calculated based on forward exchange rates and other factors. Note that derivative financial assets are included in "other financial assets" in the Summary of Quarterly Consolidated Financial Statement. c Investment securities Debt instruments, which consist primarily of corporate bonds held for non-trading purposes, are calculated using appropriate valuation techniques based on the most recent market prices from third-party transactions and other available market data. Investment securities are included in "other financial assets" in the Summary of Quarterly Consolidated Financial Statement. ③ Financial assets measured at fair value through other comprehensive income Investment securities Equity instruments consisting primarily of stocks held for non-trading purposes. Listed stocks are calculated using quoted market prices on exchanges, and unlisted stocks are calculated using valuation techniques based on market prices of similar companies and valuation techniques based on net asset value. Investment securities are included in "other financial assets" in the Summary of Quarterly Consolidated Financial Statement. ④ Financial liabilities measured at amortized cost Borrowings The fair value of borrowings is calculated based on the present value of the sum of principal and interest discounted at the interest rate assumed for new similar borrowings. ⑤ Financial liabilities measured at fair value through profit or loss a Derivative financial liabilities The fair value of foreign currency forward contracts is calculated based on forward exchange rates and other factors. The fair values of foreign currency swap agreements and interest rate swap agreements are calculated based on prices provided by counterparty financial institutions, etc. Derivative financial liabilities are included in "Other financial liabilities" in the summary of quarterly consolidated statements of financial position. b Contingent consideration The fair value of the financial liabilities for contingent consideration is calculated based on the present value of future payments calculated using a Monte Carlo simulation, primarily based on forecasts of performance and other factors. Financial liabilities related to contingent consideration are included in "Other financial liabilities" in the Summary of Quarterly Consolidated Statements of Financial Position.
- 28 -
(2) Carrying amounts and fair values of each class of financial instruments The carrying amounts and fair values of financial assets and financial liabilities in the summary of quarterly consolidated statements of financial position are as follows: (Million yen) End of the previous consolidated fiscal year (As of December 31, 2023) Book value
Fair value
End of the first three-month period of consolidated FY2024 (As of March 31, 2024) Book value
Fair value
Financial assets Financial assets measured at amortized cost Other financial assets
3,543
3,543
4,266
4,266
3,543
3,543
4,266
4,266
Golf membership
127
127
127
127
Derivative financial assets
39
39
-
-
Investment securities
358
358
501
501
523
523
628
628
Investment securities
9,100
9,100
9,727
9,727
Total financial assets measured at fair value through other comprehensive income
9,100
9,100
9,727
9,727
13,167
13,167
14,620
14,620
Borrowings
21,572
21,572
29,196
29,156
Other financial liabilities
21,572
21,572
29,196
29,156
Derivative financial liabilities
487
487
503
503
Contingent consideration
28
28
28
28
Total financial liabilities measure at fair value through profit or loss
516
516
531
531
22,088
22,088
29,728
29,688
Total financial assets measured at amortized cost Financial assets measured at fair value through profit or loss
Total of financial assets measured at fair value through profit or loss Financial assets measured at fair value through other comprehensive income
Total of financial assets Financial Liabilities Financial liabilities amortized cost
measured
at
Financial Liabilities measure at fair value through profit or loss
Total financial liabilities
At initial recognition, the Company did not hold any financial assets or financial liabilities that were irrevocably elected to be designated as financial assets and financial liabilities measured at fair value through profit or loss. Cash and cash equivalents, trade receivables, contract assets, other receivables, trade payables, and other payables, which are financial instruments measured at amortized cost, are not included in the table above because their carrying amounts approximate fair value due to their short-term maturities.
- 29 -
(3) Level-based classification of the fair value hierarchy The recurring fair values of financial assets and financial liabilities are measured and analyzed as follows: These fair value amounts are categorized into three fair value hierarchies (levels 1 through 3) based on the inputs to the valuation techniques used (available market data). Each level is defined as follows: Level 1: Fair values measured at quoted prices in actively traded markets Level 2: Fair values calculated using observable prices, either directly or indirectly, other than Level 1 Level 3: Fair values derived from valuation techniques that include unobservable inputs Transfers between levels of the fair value hierarchy are recognized on the date that the events or changes in circumstances that give rise to the transfer occur. The following table presents the fair value hierarchy for financial assets and financial liabilities measured at fair value on a recurring basis: (Million yen) End of the previous consolidated fiscal year (As of December 31, 2023)
Level 1
Level 2
Level 3
Total
Other financial assets Financial assets to be measured at fair value through profit or loss Financial assets measured at fair value through other comprehensive income
-
166
358
523
3,945
-
5,156
9,100
-
487
28
516
Other financial liabilities Financial liabilities measured at fair value through profit or loss
(Million yen) End of the first three-month period of consolidated FY2024 (As of March 31, 2024)
Level 1
Level 2
Level 3
Total
Other financial assets Financial assets to be measured at fair value through profit or loss Financial assets measured at fair value through other comprehensive income
-
127
501
628
4,519
-
5,208
9,727
-
503
28
531
Other financial liabilities Financial liabilities measured at fair value through profit or loss
The fair value hierarchy for financial instruments measured at amortized cost, which is disclosed in "(2) Carrying amounts and fair values of each class of financial instruments," is categorized principally in Level 3. There were no transfers between Levels 1 and 2 and 3 in the previous fiscal year or the first three-month of current fiscal year. There were no significant assets or liabilities measured at fair value on a nonrecurring basis at the end of the previous or first three-month of current fiscal year.
- 30 -
(4) Information on Level 3 fair value measurements ① Valuation techniques and inputs Level 3 other financial assets and other financial liabilities consist primarily of unlisted equity securities and contingent consideration. The fair value of unlisted equity securities is determined using valuation techniques based on quoted market prices for comparable companies and valuation techniques based on net asset value. The fair value of the financial liabilities for contingent consideration is calculated based on the present value of future payments calculated using a Monte Carlo simulation, primarily based on forecasts of performance and other factors. ② Evaluation process Fair value measurements for Level 3 financial instruments are performed in accordance with relevant internal rules. When measuring fair value, the Company uses valuation techniques and inputs that most appropriately reflect the nature, characteristics and risks of the underlying financial instruments. ③ Level 3 sensitivity information for recurring fair value measurements Significant unobservable inputs for measuring the fair value of Level 3 financial instruments measured at fair value on a recurring basis are EBIT multiples, illiquidity discounts, and other inputs based on financial projections. Fair value is increased (decreased) by an increase (decrease) in EBIT multiples and decreased (increased) by an increase (decrease) in illiquidity discounts. For instruments classified as Level 3, the increase or decrease in fair value of the change in the inputs that are not observable to reasonably possible alternative assumptions would not be material. ④ Reconciliation of financial instruments classified as Level 3 from the beginning of the period to the ending balance (Million yen) First three-month period of consolidated First three-month period of consolidated FY2023 FY2024 (From January 1, 2023 to (From January 1, 2024 to March 31, 2023) March 31, 2024) Financial assets Balance at beginning of quarter
Financial Liabilities
Financial assets
Financial Liabilities
4,160
-
5,514
28
71
-
-59
-
Net Income (Loss) (Note 1)
0
-
-11
-
Other comprehensive (Note 2)
70
-
-48
-
Purchase
613
-
254
-
Sale
-0
-
-
-
4,844
-
5,709
28
Total gains and losses
Balance at end of quarter
income
(NOTE) 1 Gains and losses recognized in profit or loss primarily represent unrealized gains and losses on financial instruments sold in the first three-month of current fiscal year and are included in "Financial income" in the Summary of Quarterly Consolidated Statements of Income. 2 Gains and losses recognized in other comprehensive income are included in "Net changes in financial assets measured at fair value through other comprehensive income" in the summary of quarterly consolidated statements of comprehensive income.
- 31 -
12.Business Combination First three-month period of consolidated FY2023 (From January 1, 2023 to March 31, 2023) (Purchase of Shares of Copas Systèmes SAS) Our consolidated subsidiary, Gilgen Door Systems AG (hereinafter "Gilgen"), acquired 100% of the shares of Copas Systèmes SAS on January 3, 2023, making it a wholly owned subsidiary of our group. (1) The outline of the business combination ① Name and business of the acquired company Name of acquired company: Copas Systèmes SAS Business activities: Automatic door sales, construction and maintenance in Southeastern France ② Main reasons for the business combination In our Automatic Door business, we aim to strengthen our sales structure covering the four major markets of Japan, Europe, North America and China. We are working to establish our position as a global automatic door manufacturer by strengthening our direct sales bases in each market and expanding our value chain through partnerships with distributors. In the European market in particular, we have been engaged in M&A aimed at strengthening sales channels centered on Gilgen, but recently we have made a wholly owned subsidiary of Copas Systèmes SAS, which has a strong customernetwork in southeastern France. As a result, we will rebuild the value chain in the French market and further develop our business foundation in Europe. ③ Method of acquiring control of the acquired company Acquisition of shares for cash consideration ④ Acquisition date January 3, 2023 ⑤ Acquired ownership percentage 100%
(2) Acquisition consideration and its breakdown Cash
¥5,459 million
Total acquisition consideration
¥5,459 million
(3) Acquisition-related expenses Acquisition-related expenses amounted to ¥35 million and are included in "Selling, general and administrative expenses" in the consolidated statements of income.
- 32 -
(4) Assets acquired and liabilities assumed The Company provisionally accounted for this business combination in the first quarter of the previous fiscal year. However, the allocation of the purchase consideration to the assets acquired and liabilities assumed has been finalized in the second quarter of the previous fiscal year. As a result of the finalization of this provisional accounting treatment, non-current assets and non-current liabilities increased by ¥2,167 million and ¥542 million, respectively, and goodwill decreased by ¥1,625 million. Assets acquired and liabilities assumed at the date of acquisition were as follows: (Million yen) Amount Fair value of consideration paid (Note 1)
5,459
Total
5,459
Current assets (Note 2)
1,373
Non-current assets (Note 3)
2,270
Current liabilities
-1,010
Non-current liabilities
-583
Goodwill (Note) 4
3,411
Total
5,459
(NOTE) 1 There is no contingent consideration. 2 Cash and cash equivalents of ¥177 million are included. The aggregate contract amount for the fair value of trade and other receivables acquired of ¥759 million is ¥907 million and the estimated uncollectible amount is ¥147 million. 3 Includes customer-related assets of ¥1,454 million (useful life of 14 years) and software of ¥712 million (useful life of 16 years) that were not recognized by the acquired company. 4 Goodwill primarily reflects excess earning power and is not deductible for tax purposes. (5) Impact on the performance of our group Profit and loss information after the acquisition date recognized in the consolidated statement of income for the first threemonth of previous fiscal year and the estimated impact on the summary of quarterly consolidated financial statements of the business combination on January 1, 2023, the beginning of the previous fiscal year, are not presented because they are not material.
First three-month period of consolidated FY2024 (From January 1, 2024 to March 31, 2024) Not applicable
- 33 -
13.Commitment Significant commitments contractually committed to the acquisition of property, plant and equipment are as follows: (Million yen) End of the first three-month period of End of the previous consolidated fiscal year consolidated FY2024 (As of December 31, 2023) (As of March 31, 2024) Commitment
9,283
14.SUBSEQUENT EVENTS Not applicable.
- 34 -
9,429
2 【Others】 Not applicable
- 35 -
Part two 【Information on Assurance Companies, etc. of Submitting Companies】 Not applicable
- 36 -
Quarterly Review Report by Independent Auditors September 30, 2026 Nabtesco Corporation To the Board of Directors
KPMG AZSA LLC. Tokyo Office Designated Limited Liability Partners Partners administering the affairs
Certified Public Takeharu Kirikae Accountant
Designated Limited Liability Partners Partners administering the affairs
Certified Public Daisuke Toyama Accountant
Auditor’s conclusion Pursuant to the provision of Section 193-2(1) of the Financial Instruments and Exchange Act, we have reviewed the quarterly consolidated financial statements for the first quarter of the fiscal year from January 1, 2024 to December 31, 2024 (January 1, 2024 to March 31, 2024) and for the first quarter (January 1, 2024 to March 31, 2024), which are summarized in "Accounting Status," namely, the Summary of Quarterly Consolidation Financial Statements, Summary of Quarterly Consolidated Statements of Income, Summary of Quarterly Consolidated Statements of Comprehensive Income, Summary of Quarterly Consolidated Statement of Changes in Equity, Summary of Quarterly Consolidated Statement of Cash Flows, and Notes on the Summary of Quarterly Consolidated Financial Statements. In our Quarterly Review, the above Summary Quarterly Consolidated Financial Statements were not recognized in all material respects as to what Nabtesco Corporation and its Consolidated Subsidiaries believe they did not properly present the financial position of Nabtesco Corporation and its consolidated subsidiaries as of March 31, 2024, and the results of their operations and their cash flows for the first quarter ended on the same date, in accordance with International Accounting Standards No. 34, "Financial Reporting during the Term," as defined in Article 93 of the Regulations on Terminology, Forms, and Preparation Methods of Quarterly Consolidated Financial Statements. Basis for the auditor's conclusion We conducted our quarterly review in accordance with the quarterly review standards generally accepted in Japan. Our responsibility under the standards for quarterly reviews is set forth under the caption "Auditor's Responsibility in Quarterly Review of Condensed Quarterly Consolidated Financial Statements. We are independent of the Company and its consolidated subsidiaries in accordance with the provisions of the Code of Professional Ethics in Japan and we fulfill our other ethical responsibilities as an auditor. We believe that the evidence upon which we base our conclusions is obtained. Other Matter As described in the Reasons for Filing the Amendment Report to the Quarterly Report, the Company has amended its quarterly consolidated financial statements. We previously issued our auditor’s report on the consolidated financial statements before amendment on May 13, 2024. In connection with the amendment, we hereby issue this auditor’s report on the amended quarterly consolidated financial statements. Responsibility of Management, Corporate Auditors and Board of Corporate Auditors for the Condensed Quarterly Consolidated Financial Statements Management is responsible for the preparation and fair presentation of the summary of quarterly consolidated financial statements in accordance with International Accounting Standards 34, Interim Financial Reporting. This includes the design, implementation, and maintenance of internal control as management deems necessary to enable the preparation and fair presentation of summary of quarterly consolidated financial statements that are free from material misstatement, whether due to fraud or error. In preparing the summary of quarterly consolidated financial statements, management is responsible for evaluating whether it is appropriate to prepare the summary of quarterly consolidated financial statements based on the going concern assumption and for disclosing matters related to a going concern in accordance with International Accounting Standards No. 1, Presentation of Financial Statements, Item 4. The responsibility of the corporate auditors and the board of corporate auditors is to monitor the execution of directors' duties in the development and
- 37 -
operation of the financial reporting process. Auditor's Responsibility for the Quarterly Review of Summary of Quarterly Consolidated Financial Statements The auditor's responsibility is to independently express a conclusion on the summary of quarterly consolidated financial statements in the quarterly review report based on the quarterly review performed by the auditor. In accordance with quarterly review standards generally accepted in Japan, the auditor shall, through the course of the quarterly review, make judgments as a professional expert and conduct the following with professional skepticism: ・Conduct questions, analytical procedures and other quarterly review procedures mainly for management, persons responsible for financial and accounting matters, etc. The quarterly review procedures are limited compared with the procedures for auditing the financial statements for the fiscal year conducted in accordance with auditing standards generally accepted in Japan. ・If the Company determines that there is significant uncertainty with respect to events or circumstances that raise substantial doubt about the Company's ability to continue as a going concern, the Company will conclude, based on the evidence obtained, whether there are any matters in the summary of quarterly consolidated financial statements that would cause the Company to believe that they are not fairly presented in accordance with International Accounting Standards No. 1, Presentation of Financial Statements, Item 4. In addition, if there is material uncertainty regarding the Company's ability to continue as a going concern, the Company is required to alert the notes to the summary of quarterly consolidated financial statements in the quarterly review report or, if the notes to the summary of quarterly consolidated financial statements for material uncertainty are not appropriate, express a limited conclusion or a negative conclusion on the quarterly consolidated financial statements. The auditor's conclusion is based on evidence obtained through the date of the quarterly review report; however, future events and circumstances may prevent the entity from continuing as a going concern. ・Evaluate whether the presentation, composition and content of the condensed quarterly consolidated financial statements, including the related notes, as well as whether there are any matters that cause the Company to believe that the presentation and notes to the summary of quarterly consolidated financial statements are not in accordance with International Accounting Standards 34, Interim Financial Reporting, and whether there are any matters that cause the Company to believe that the summary of quarterly consolidated financial statements do not fairly present the underlying transactions and accounting events. ・Obtain evidence regarding the financial information of the Company and its consolidated subsidiaries that forms the basis for expressing a conclusion on the summary of quarterly consolidated financial statements. The auditor is responsible for directing, supervising and inspecting the quarterly review of the summary of quarterly consolidated financial statements. The auditor is solely responsible for the auditor's conclusions. The auditor shall report to the auditors and the board of auditors on the scope of the planned quarterly review and the timing of its implementation, as well as important findings in the quarterly review. The auditors shall report to the statutory auditors and the board of statutory auditors on compliance with the provisions of professional ethics in Japan regarding independence, matters that are reasonably likely to affect the auditor's independence, and in cases where countermeasures are taken to eliminate impediments or safeguards are applied to reduce the impediments to an acceptable level. Interests There are no interests between the Company and its Consolidated Subsidiaries and the Auditing Corporation or its Operating Partners that should be stated pursuant to the provisions of the Certified Public Accountants Act. Notes to the Reader of Quarterly Review Report by Independent Auditors: The Quarterly Review Report by Independent Auditors herein is the English translation of the Quarterly Review Report by Independent Auditors as required by the Financial Instruments and Exchange Act. The end (NOTE) 1 The original report of the above quarterly review report is maintained separately by the Company (the company submitting the quarterly report). 2 XBRL are not included in the scope of auditing.
- 38 -
(Amended) Semiannual Report FY2024 Sep 30, 2026 Investor Relations Securities report
Bull 0
Bear 3
Routine
[Cover] [Filing]
Amendment Report to Semiannual Report
[Articles of Basis]
Article 24-5-5 of the Financial Instruments and Exchange Act
[Submit to]
Kanto Finance Bureau
[Submission date]
September 30, 2026
[Semiannual accounting period]
The First Six-month of 22nd fiscal period (From January 1, 2024 to June 30, 2024)
[Company name]
Nabtesco Corporation
[English translation name]
Nabtesco Corporation
[Title of Representative]
Kazumasa Kimura, representative director
[Location of the head office]
7-9, Hirakawacho 2-chome, Chiyoda-ku, Tokyo
[Phone No.]
+81-3-5213-1134
[Name of administrative liaison]
Yasushi Minegishi, General Manager, Corporate Communications Dept.
[Near contact location]
7-9, Hirakawacho 2-chome, Chiyoda-ku, Tokyo
[Phone No.]
+81-3-5213-1134
[Name of administrative liaison]
Yasushi Minegishi, General Manager, Corporate Communications Dept.
[Locations for Public Inspection]
Tokyo Stock Exchange, Inc. (2-1, Nihonbashi Kabutocho, Chuo-ku, Tokyo)
-1-
- Reasons for Filing the Amendment Report to the Semiannual Report In April 2026, the Company became aware that TMT Machinery, Inc., (Nabtesco's ownership interest is 33%.) an equity-method affiliate, had recorded a gain on extinguishment of tie-in shares arising from the absorption-type merger of one of its subsidiaries (approximately ¥600 million attributable to Nabtesco's ownership interest). Upon becoming aware of this matter, the Company shared the information with its independent auditor and commenced an investigation into the retained earnings accumulated within TMT Machinery's subsidiaries and affiliated entities. As TMT Machinery is an unlisted company and does not prepare consolidated financial statements, the Company had historically applied the equity method based on TMT Machinery's standalone financial statements. Through its investigation, the Company identified that substantial retained earnings had accumulated within TMT Machinery's subsidiaries and affiliated entities and that the portion attributable to the Company had not been reflected in the share of profit (loss) of investments accounted for using the equity method. While continuously consulting with its independent auditor, the Company proceeded with a detailed review of the scope and amount of profits to be recognized. In the course of the accounting auditor’s interim review procedures for the condensed interim consolidated financial statements included in the Semi-annual Securities Report filed on August 14, 2026, the Company re-examined the scope and amounts of profit to be recognized and determined that the aggregate unrecognized amount was expected to be approximately ¥2.8 billion based on the Company’s ownership interest. Following discussions with the accounting auditor, the Company determined that it would be appropriate to recognize share of profit (loss) of investments accounted for using the equity method in accordance with the timing at which profits and losses arose at the subsidiaries and other entities in prior fiscal years, and to correct other errors at the same time. Accordingly, the Company determined that it was necessary to retrospectively amend its Annual Securities Reports, Semi-annual Securities Reports and Quarterly Securities Reports for prior fiscal years. As a result, certain information contained in the Semiannual Report for the 22nd fiscal year (from January 1, 2024 to September 30, 2024), filed by the Company on August 9, 2024, requires correction. Accordingly, pursuant to the provisions of Article 24-5-5 of the Financial Instruments and Exchange Act, the Company hereby files this Amendment Report to the Annual Securities Report. The amended consolidated financial statements have been audited by KPMG AZSA LLC, and the relevant independent auditor’s report is attached hereto.
- Matters Amended Part I. Corporate Information Section 1. Overview of the Company
- Trend in Major Management Indicators Section 2. Business Conditions
- Management’s Discussion and Analysis of Financial Condition, Results of Operations and Cash Flows Section 4. Accounting Status
- Summary of Interim Consolidated Financial Statements
- Amended Sections Amended sections are indicated by underlining. As the amendments are extensive, only the amended information is presented for the matters listed above.
-2-
Part one 【Corporate Information】 No.1 【Overview of the Company】
1 【Transition in Major Management Indicators】 First six-month of 21st First six-month of 22nd 21st consolidated fiscal consolidated fiscal period consolidated fiscal period period From January 1, 2023 From January 1, 2024 From January 1, 2023 to June 30, 2023 to June 30, 2024 to December 31, 2023
Fiscal period Accounting period
(After restatement) (Million yen) (Million Income before income taxes yen) Net income attributable to owners of (Million the parent yen) (Million Net income yen) Comprehensive income attributable (Million to owners of the parent yen) (Million Comprehensive income yen) Equity attributable to owners of the (Million parent yen) (Million Total assets yen) Net sales
162,733
152,491
333,367
15,707
7,776
25,316
9,633
3,772
14,226
10,448
4,449
16,102
16,181
12,146
20,762
17,583
14,310
23,217
262,874
270,104
262,721
429,375
437,723
428,630
Total basic earnings per share
(Yen)
80.26
31.41
118.52
Diluted earnings per share
(Yen)
80.25
31.41
118.50
Ratio of equity attributable to owners of the parent
(%)
61.2
61.7
61.3
11,637
13,055
11,177
(27,772)
(19,291)
(46,295)
(6,906)
2,984
(13,482)
103,686
78,175
77,835
Cash flows from operating activities Cash flows from investing activities Cash flows from financing activities Cash and cash equivalents at fiscal year or interim end
(Million yen) (Million yen) (Million yen) (Million yen)
(NOTE) 1
Since Nabtesco Corporation (hereinafter, the Company) prepared the summary of interim financial statements, the Company does not provide the transition of non-consolidated management indicators. 2 Figures are rounded to the nearest unit. 3 Consolidated financial statements and summary of interim financial statements are prepared in accordance with International Financial Reporting Standards (IFRS)
2 【Description of Business】 There have been no significant changes in the content of the business conducted by our group (the Company and our subsidiary companies) during the first six-month of the current fiscal year. There are no changes in major affiliated companies.
-3-
No.2 【Business Situation】 1 【Business Risks】 During the first six-month of the current fiscal year, there have been no significant changes in the status of business and accounting described in this semiannual report that could have a significant impact on the decisions of investors or Business and Other Risks described in the annual report for the previous fiscal year. There were no significant events which company should report.
-4-
2【Management's Analysis of Financial Condition, Results of Operations and Cash Flows】 (1) Analysis of Operating Results (Sales and Operating Income) During the first six-month period under review showed favorable demand for automatic door and the effects of exchange rates, as well as strong demand in aircraft equipment and marine vessels equipment. Meanwhile, in precision reduction gears, capital expenditure related to EV continued to decline and inventories of industrial robots continued to adjust. Moreover, demand for construction machinery in hydraulic equipment declined. As a result, the Group’s net sales decreased by ¥10,242 million, or 6.3% year-on-year to ¥152,491 million. Operating income decreased by ¥2,322 million, or 26.7% to ¥6,365 million due to the decrease in sales in component solutions business, despite the increase in operating income resulting from the increase in sales in transport solutions and accessibility solutions businesses. Operating income to net sales was 4.2% Operating results by business segment were as follows: ①
Component Solutions Business Sales decreased by ¥23,110 million, or 30.9% to ¥51,675 million and operating income decreased by ¥5,315 million or 71.9% to ¥2,079 million. Sales of precision reduction gears decreased significantly year-on-year due to a decline in EV related and automation capital expenditures, as well as continued inventory adjustment for industrial robots. Sales of hydraulic equipment for construction machinery declined year-on-year due to the continued sluggish demand for construction machinery not only in China but also in Europe, the United States, and Southeast Asia.
②
Transport Solutions Business Sales increased by ¥5,906 million, or 16.3% to ¥42,077 million and operating income increased by ¥1,719 million, or 47.1% to ¥5,370 million. Sales of railroad vehicle equipment increased year-on-year due to steady growth mainly in domestic market, as well as solid MRO (Maintenance, Repair, and Overhaul). Sales of aircraft equipment increased substantially year-on-year due to an expansion in demand resulting from increased defense budgets and a steady recovery in demand for commercial aircraft. Sales of commercial vehicle equipment remained at the same level as the same period of the previous fiscal year due to steady demand from domestic customers, despite a decline in demand in the Southeast Asian market. Sales of marine vessels equipment increased year-on-year due to strong demand for new vessels and MRO, as well as expanded sales of new type of main engine remote-control system and as a result of making company Deep Sea a consolidated subsidiary.
③
Accessibility Solutions Business Sales increased by ¥6,570 million, or 15.5% to ¥50,917 million and operating income increased by ¥1,667 million, or 68.6% to ¥4,099 million. In automatic door, sales increased year-on-year due to strong demand for doors for domestic and overseas buildings and platform doors, in addition to foreign exchange effects.
④ Others Sales increased by ¥127 million, or 1.7% to ¥7,821 million and operating income decreased by ¥285 million, or 67.7% to ¥136 million. Sales of packaging machines increased year on year due to strong domestic MRO and increased sales to the Chinese market. During the period under review, the company recorded an impairment loss of ¥656 million on goodwill related to Engilico, a consolidated subsidiary in Europe.
-5-
(Income before tax) Financial income was ¥1,586 million mainly due to foreign exchange gains. Financial costs amounted to ¥584 million mainly due to interest expenses and loss on valuation of derivatives. Equity in earnings of affiliates was ¥409 million. As a result, profit before tax decreased by ¥7,931 million year-on-year to ¥7,776 million. (Net income attributable to owners of the parent) As a result, net income attributable to owners of the parent, after deducting income tax expense of ¥3,327 million and net income attributable to non-controlling interests of ¥677 million, decreased by ¥5,861 million year-on-year to ¥3,772 million. Basic earnings per share decreased by ¥48.85 to ¥31.41.
(2) Analysis of Financial Position As of the end of the previous consolidated fiscal year (December 31, 2023)
As of the end of the first six-month period of the current consolidated fiscal year (June 30, 2024)
(Million yen) Change
Total assets
428,630
437,723
9,093
Liabilities
150,485
150,298
(187)
Equities
278,145
287,425
9,280
① Assets Total assets as of June 30, 2024 were ¥437,723 million, an increase of ¥9,093 million from December 31, 2023, consisting of ¥223,538 million in current assets and ¥214,185 million in non-current assets. The key contributing positive factors were an increase of ¥7,413 million in inventories, an increase of ¥5,040 million in tangible fixed assets. The main contributing negative factor was a decrease of ¥7,753 million in trade receivables. ② Liabilities Total liabilities as of June 30, 2024 were ¥150,298 million, a decrease of ¥187 million from December 31, 2023, reflecting ¥110,727 million in current liabilities and ¥39,571 million in non-current liabilities. The main contributing positive factor was a rise of ¥9,962 million in borrowings under non-current assets. The main contributing negative factors were a decrease of ¥7,651 million in other financial liabilities and a decrease of ¥2,040 million in operating payables. ③ Equity Total equity as of June 30, 2024 stood at ¥287,425 million. Equity attributable to owners of the parent was ¥270,104 million, an increase of ¥7,383 million from December 31, 2023. The main contributing positive factors were an increase of ¥8,337 million in other components of equity due to exchange differences on foreign operations and the net income attributable to owners of the parent of ¥3,772 million. Meanwhile, the main decreasing factor was a decrease in retained earnings of ¥4,825 million due to dividend payment.
-6-
(3) Status of cash flows First six-month period of consolidated FY2023 (January 1, 2023 to June 30, 2023)
(Million yen) First six-month period of consolidated FY2024 (January 1, 2024 to June 30, 2024)
(After restatement) Cash flow from operating activities
11,637
13,055
Cash flow from investing activities
(27,772)
(19,291)
Free cash flow
(16,136)
(6,236)
Cash flow from financing activities
(6,906)
2,984
Cash and cash equivalents (hereinafter, “cash”) on a consolidated basis as of June 30, 2024 totaled ¥78,175 million, an increase of ¥340 million from December 31, 2023, as cash gained from operating activities was mainly appropriated to capital expenditure and dividend payments. ① Cash flow from operating activities Net cash generated from operating activities for the first six-month period of the current fiscal year totaled ¥13,055 million. The main factors for increases were decreases in operating profits, depreciation and amortization, other non-cash profit/losses, and trade receivables. The main factors for decreases included an increase in inventories, decrease in operating payables, and the payment of the income tax. ② Cash flow from investing activities Net cash used in investing activities for the first six-month period of the current fiscal year amounted to ¥19,291 million. The main factors for decreases were payments for the purchase of property, plant, and equipment. ③ Cash flow from financing activities Net cash used in financing activities for the first six-month period of the current fiscal year totaled ¥2,984 million. The main factors for increase was proceeds from long-term borrowings. The main factors for decrease was dividend payments. (4) Issues to be addressed in Business and Finance During the first six-month period of the fiscal year under review, there were no significant changes or new issues to be addressed by the Group.
(5) R&D activities Research and development expenses for the first six-month period of the current fiscal year were ¥5,605 million.
3 【Significant Management Contracts】 During the first six-month period of the fiscal year, there were no major decisions or conclusions of significant management agreements.
-7-
No.3【Status of the Company Submitting the Report】 1【Status of Shares】 (1) 【Total Number of Shares】 ① 【Total number of shares】 Type
Total number of authorized shares (Share)
Common stock
400,000,000
Total
400,000,000
② 【Shares outstanding】
Type
Number of shares outstanding (shares) as of the date of filing As of August 9, 2024
Number of shares outstanding (shares) As of June 30, 2024
Common shares
121,064,099
121,064,099
Total
121,064,099
121,064,099
Name of stock exchange listings
Content
Tokyo Stock Exchange The number of shares per unit is Prime section 100 shares. -
-
(NOTE) The "Number of shares outstanding as of the filing date" column does not include the number of shares issued upon the exercise of stock acquisition rights to shares from August 1, 2024 to the filing date of this Semiannual Report.
(2) 【Status of Stock Acquisition Rights】 ① 【Details of stock option plan】 Not applicable.
② 【Status of other stock acquisition rights】 Not applicable.
(3) 【Status of Exercise of Bonds with Stock Acquisition Rights with Exercise Price Adjustment, etc.】 Not applicable.
(4) 【Changes in the number of issued shares, capital stock, etc.】
Date
June 30, 2024
Number of shares outstanding increase/decrease
Number of shares outstanding as the end of therm.
Change in capital (Million yen)
-
121,064,099
-
-8-
Balance of Change in legal Balance of legal capital surplus capital surplus capital (Million yen) (Million yen) (Million yen) 10,000
-
26,274
(5) 【Major Shareholders】
Shareholders
Address
As of June 30, 2024 Shareholding ratio Number of to number of Shares Held shares outstanding (thousands (excluding shares) treasury stock) (%)
The Master Trust Bank of Japan (Trust Account)
8-1 Akasaka 1-chome, Minato-ku, Tokyo AKASAKA INTERCITY AIR
16,905
14.01
Custody Bank of Japan (Trust Account)
8-12 Harumi 1-chome, Chuo-ku, Tokyo
10,560
8.75
BNYMSANV AS AGENT/CLIENTS LUX UCITS NON TREATY 1
VERTIGO BUILDING-POLARIS 2-4 RUE EUGENE RUPPERT L-2453 LUXEMBOURG GRAND DUCHY OF LUXEMBOURG
5,216
4.32
5,171
4.29
(Standing agent) MUFG Bank, Ltd. Central Japan Railway Company
7-1 Marunouchi 2-chome, Chiyoda-ku, Tokyo 1-4 Meieki 1-chome, Nakamura-ku, Nagoya-shi, Aichi
FANUC CORPORATION
3580 Shibokusa, Oshinomura, Minamitsuru-gun, Yamanashi
3,760
3.12
Harmonic Drive Systems Inc.
25-3 Minami-Oi 6-chome, Shinagawa-ku, Tokyo
3,265
2.71
BBH (LUX) FOR FIDELITY FUNDSGLOBAL TECHNOLOGY POOL
2A RUE ALBERT BORSCHETTE LUXEMBOURG L-1246
2,340
1.94
2,177
1.80
2,100
1.74
1,654
1.37
53,147
44.05
(Standing agent) MUFG Bank, Ltd. STATE STREET BANK WEST CLIENTTREATY 505234 (Standing agent) Mizuho Bank, Ltd. JPMorgan Chase & Co. GOLDMAN SACHS INTERNATIONAL (Standing agent) Goldman Sachs Japan Co., Ltd. Total
7-1 Marunouchi 2-chome, Chiyoda-ku, Tokyo 1776 HERITAGE DRIVE, NORTH QUINCY, MA 02171, U.S.A. 15-1, Konan 2-chome, Minato-ku, Tokyo Shinagawa Intercity Tower A 7-1 Marunouchi 2-chome, Chiyoda-ku, Tokyo Tokyo Building PLUMTREE COURT, 25 SHOE LANE, LONDON EC4A 4AU, U.K. 6-1 Toranomon 2-chome, Minato-ku, Tokyo Toranomon Hills Station Tower -
(NOTE) 1 Number of shares held is rounded to the nearest thousand. 2 The following corporation submitted a report on the change of 4,744,000 shares by a company on April 5, 2024. However, as the number of shares beneficially owned in the name of the said corporation cannot be confirmed as of June 30, 2024, it is not included in the above "Status of Major Shareholders."
- FIL Investments (Japan) Limited 3 The following corporation submitted a report on the change of 6,278,000 shares by a company on May 8, 2024. However, as the number of shares beneficially owned in the name of the said corporation cannot be confirmed as of June 30, 2024, it is not included in the above "Status of Major Shareholders."
- Eastspring Investments (Singapore) Ltd. 4 The following corporation submitted a report on the change of 6,265,000 shares by two companies on June 7, 2024. However, as the number of shares beneficially owned in the name of the said corporation cannot be confirmed as of June 30, 2024, it is not included in the above "Status of Major Shareholders."
- Nomura Securities Co., Ltd.
- Nomura Asset Management Co., Ltd. 5 The following corporation submitted a report on the change of 6,192,000 shares by two companies on June 20, 2024. However, as the number of shares beneficially owned in the name of the said corporation cannot be confirmed as of June 30, 2024, it is not included in the above "Status of Major Shareholders."
- Sumitomo Mitsui Trust Asset Management Co., Ltd.
- Nikko Asset Management Co., Ltd
-9-
(6) 【Status of voting rights】 ① 【Shares outstanding】 Classification
As of June 30, 2024
Number of shares
Number of voting rights
Content
-
-
-
-
-
-
-
-
-
-
-
-
-
1,205,103
-
Non-voting stock Shares with restricted voting rights (Treasury stocks) Shares with restricted voting rights (other)
(Treasury stock held) Common shares 422,300 Shares with full voting rights (treasury stock, etc.) (Mutually Held Shares) Common shares 15,000 Common shares Shares with full voting rights (other) 120,510,300 Common shares Shares less than one unit 116,499 Number of shares outstanding
121,064,099
Voting rights of all shareholders
-
-
Shares less than one unit (100 shares)
-
-
1,205,103
-
(NOTE) 1 Common shares in the "Shares less than one unit" column include 4 shares of treasury stock owned by the Company and 30 shares of our stock owned by Japan Custody Bank, Ltd. (Trust Account E) as trust assets under the "Stock Benefit Trust (BBT)" plan. 2 "Shares with full voting rights (other)" column includes 6,000 shares (60 voting rights) in the name of the Japan Securities Depository Center, Inc. and 517,200 shares (5,172 voting rights) of ours owned by the Japan Custody Bank, Ltd. (Trust Account E) as trust assets for the "Stock Benefit Trust (BBT)" plan. The 5,172 voting rights are not exercised. ② 【Treasury stock】
Owner's name
Address of the holder
(Treasury stock held) Nabtesco Corporation (Mutually Held Shares) Kyokko Denki Co., Ltd.
7-9, Hirakawacho 2-chome, Chiyoda-ku, Tokyo 2-4 Aratamacho 1-chome, Hyogo-ku, Kobe-shi, Hyogo
Total
-
Number of treasury stock
As of June 30, 2024 Ratio of shares Number of Total number of held to total shares held in shares to be number of the name of own shares others outstanding (%)
422,300
-
422,300
0.35
15,000
-
15,000
0.01
437,300
-
437,300
0.36
(NOTE) The above numbers of shares held do not include 517,200 shares of our company owned by Japan Custody Bank, Ltd. (Trust Account E) as trust assets under the "Stock Benefit Trust (BBT)" plan.
2 【Status of Management】 Not applicable.
- 10 -
No.4 【Accounting Status】
-
Preparation of summary of interim consolidated financial statements (1) In accordance with the provisions of Article 312 of the Ordinance on Terminology, Forms, and Preparation Methods of Consolidated Financial Statements (Ordinance of the Ministry of Finance No. 28 of 1976; hereinafter referred to as the "Ordinance on Consolidated Financial Statements"), we have prepared the interim consolidated financial statements in accordance with International Accounting Standards No. 34, "Interim Financial Reporting" (hereinafter referred to as "IAS No. 34") because they meet all of the requirements of "Designated International Accounting Standards Designated Companies" stipulated in Article 1-2, Item 2 of the Ordinance on Consolidated Financial Statements. Our summary of interim consolidated financial statements are Class one interim consolidated financial statements. (2) The summary of interim consolidated financial statements have been rounded to the nearest unit.
-
Audit Certification Pursuant to Article 193-2-1 of the Financial Instruments and Exchange Act, we have received an interim review of the summary of interim consolidated financial statements for the first six-month of fiscal year (January 1, 2024 to June 30, 2024) by KPMG AZSA LLC. In addition, we have submitted a Corrections Report of a Semiannual Report, pursuant to Article 24-5-5 of the Financial Instruments and Exchange Act, and the summary of interim consolidated financial statements after correction has received an interim review by KPMG AZSA LLC.
- 11 -
1 【Summary of Interim Consolidated Financial Statement】 (1) 【Summary of Interim Consolidated Financial Position】
Note No.
End of consolidated FY2023 (as of December 31, 2023)
(Million yen) End of the first six-month period of consolidated FY2024 (as of June 30, 2024)
Assets Current assets Cash and cash equivalents
77,835
78,175
Trade receivables
82,167
74,413
Contract assets
3,554
4,457
Other receivables
1,682
1,511
50,969
58,382
616
1,351
Inventories Other financial assets
12
Other current assets
6,995
5,249
Total current assets
223,818
223,538
Property, plant and equipment
107,527
112,567
Intangible assets
11,624
12,618
Non-current assets
Right-of-use asset
8,908
9,045
Goodwill
25,750
27,016
Investment property
10,394
10,339
Investments accounted for using the equity method
24,005
23,926
12,550
14,199
Deferred tax assets
3,040
3,608
Other non-current assets
1,013
866
Total non-current assets
204,812
214,185
428,630
437,723
Other financial assets
12
Total assets
- 12 -
Note No.
End of consolidated FY2023 (as of December 31, 2023)
(Million yen) End of the first six-month period of consolidated FY2024 (as of June 30, 2024)
Liabilities and equity Liabilities Current liabilities Operating payables
50,783
48,744
Contract liabilities
11,024
8,978
Borrowings
21,400
21,643
Other payables
12
23,392
15,741
Income taxes payables
3,018
2,644
Provision
2,720
2,716
2,799
2,656
-
79
Other current liabilities
7,327
7,526
Total current liabilities
122,462
110,727
Lease liabilities Other financial liabilities
12
Non-current liabilities Borrowings
12
Lease liabilities Liabilities concerning retirement benefit Deferred tax liabilities Other financial liabilities
12
173
10,135
8,060
8,519
9,174
9,119
7,951
8,944
516
714
Other non-current liabilities
2,149
2,141
Total non-current liabilities
28,022
39,571
Total liabilities
150,485
150,298
10,000
10,000
Equity Capital stock Share premium
15,139
14,930
Retained earnings
222,362
221,312
Treasury shares
(3,943)
(3,637)
Other components of equity
19,162
27,498
Equity attributable to owners of the parent
262,721
270,104
Non-controlling interests
15,424
17,321
Total equity
278,145
287,425
428,630
437,723
Total liabilities and equity
- 13 -
(2) 【Summary of Interim Consolidated Statements of Income】 【First six-month of consolidated financial period】
Note No.
First six-month period of consolidated FY2023 (January 1, 2023 to June 30, 2023)
(Million yen) First six-month period of consolidated FY2024 (January 1, 2024 to June 30, 2024)
(After restatement) Net sales
6,7
162,733
152,491
Cost of sales
(122,220)
(110,687)
Gross profit
40,513
41,803
487
496
(31,989)
(34,977)
Other income Selling, general and administrative expense Other expenses
8
(324)
(957)
Operating income
6
8,687
6,365
Financial income
9
5,023
1,586
Financial costs
9
(523)
(584)
2,519
409
Equity in earnings of affiliates Profit (loss) before tax
15,707
7,776
Income tax expenses
(5,259)
(3,327)
Net income (loss)
10,448
4,449
9,633
3,772
Net income (loss) attributable to Owners of the parent Non-controlling interests Net income (loss)
815
677
10,448
4,449
Net income (loss) per share Basic earnings (loss) per share (Yen)
11
80.26
31.41
Diluted earnings (loss) per share (Yen)
11
80.25
31.41
- 14 -
【Second quarter of consolidated financial period】 (Million yen) Second quarter of consolidated Second quarter of consolidated FY2023 FY2024 Note No. (April 1, 2023 to (April 1, 2024 to June 30, 2023) June 30, 2024) (After restatement) Net sales
80,804
80,309
Cost of sales
(61,412)
(59,414)
Gross profit
19,392
20,895
Other income Selling, general and administrative expense Other expenses
8
Operating income
249
262
(16,271)
(17,776)
(161)
(854)
3,209
2,528
Financial income
9
1,234
840
Financial costs
9
(900)
(395)
1,612
(94)
Equity in earnings of affiliates Profit (loss) before tax
5,155
2,879
Income tax expenses
(1,643)
(1,207)
Net income (loss)
3,512
1,671
3,143
1,306
Net income (loss) attributable to Owners of the parent Non-controlling interests Net income (loss)
369
365
3,512
1,671
Net income (loss) per share Basic earnings (loss) per share (Yen)
11
26.18
10.88
Diluted earnings (loss) per share (Yen)
11
26.18
10.88
- 15 -
(3) 【Summary of Interim Consolidated Statement of Comprehensive Income】 【First six-month of consolidated financial period】
Note No.
First six-month period of consolidated FY2023 (January 1, 2023 to June 30, 2023)
(Million yen) First six-month period of consolidated FY2024 (January 1, 2024 to June 30, 2024)
(After restatement) Net income (loss)
10,448
4,449
799
552
799
552
6,205
8,948
132
361
6,337
9,309
Other comprehensive income after taxes
7,135
9,861
Total comprehensive income
17,583
14,310
Owners of the parent
16,181
12,146
Non-controlling interests
1,402
2,164
Total comprehensive income
17,583
14,310
Other comprehensive income Items that will not be reclassified to profit or loss Net changes in financial assets measured at fair value through other comprehensive income Total components that will not be reclassified to profit or loss Components that will be reclassified to profit or loss Exchange differences on foreign operations Share of other comprehensive income of investments accounted for using equity method Total components that will be reclassified to profit or loss
Comprehensive income attributable to
- 16 -
【Second quarter of consolidated financial period】
Note No.
Second quarter of consolidated FY2023 (April 1, 2023 to June 30, 2023)
(Million yen) Second quarter of consolidated FY2024 (April 1, 2024 to June 30, 2024)
(After restatement) Net income (loss)
3,512
1,671
792
289
792
289
4,919
5,193
94
165
5,013
5,358
Other comprehensive income after taxes
5,805
5,647
Total comprehensive income
9,316
7,319
Other comprehensive income Items that will not be reclassified to profit or loss Net changes in financial assets measured at fair value through other comprehensive income Total components that will not be reclassified to profit or loss Components that will be reclassified to profit or loss Exchange differences on foreign operations Share of other comprehensive income of investments accounted for using equity method Total components that will be reclassified to profit or loss
Comprehensive income attributable to Owners of the parent
8,544
6,223
Non-controlling interests
773
1,096
Total comprehensive income
9,316
7,319
- 17 -
(4) 【Summary of Interim Consolidated Statement of Changes in Equity for the First Six-month Period】 First six-month period of current consolidated fiscal year (January 1, 2023 to June 30, 2023) (Million yen)
(After restatement)
Note No.
Balance as of January 1, 2023
Other components of equity Capital stock
Share premium
Retained earnings
Treasury shares
Exchange differences on foreign operations
Valuation difference due to change in fair value
10,000
15,048
217,865
(4,646)
9,719
3,263
Net income (loss)
-
-
9,633
-
-
-
Other comprehensive income
-
-
-
-
5,754
793
Total comprehensive income
-
-
9,633
-
5,754
793
Acquisition, sales, etc. of treasury shares
-
-
(16)
143
-
-
-
-
(4,693)
-
-
-
Share-based compensation transactions
-
9
-
-
-
-
Total transactions with owners, etc.
-
9
(4,708)
143
-
-
10,000
15,058
222,790
(4,504)
15,474
4,056
Dividends
10
Balance as of June 30, 2023
Other components of equity (After restatement)
Note No.
Balance as of January 1, 2023
Remeasurements of net defined benefit liability (asset)
Total equity attributable to owners of the parent
Total
Noncontrolling interests
Total equity
-
12,982
251,250
14,532
265,782
Net income (loss)
-
-
9,633
815
10,448
Other comprehensive income
-
6,547
6,547
588
7,135
Total comprehensive income
-
6,547
16,181
1,402
17,583
Acquisition, sales, etc. of treasury share
-
-
127
-
127
-
-
(4,693)
(1,477)
(6,170)
Share-based compensation transactions
-
-
9
-
9
Total transactions with owners, etc.
-
-
(4,557)
(1,477)
(6,034)
Balance as of June 30, 2023
-
19,530
262,874
14,458
277,332
Dividends
10
- 18 -
First six-month period of current consolidated fiscal year (January 1, 2024 to June 30, 2024) (Million yen) Note No. Balance as of January 1, 2024
Other components of equity Capital stock
Share premium
Retained earnings
Treasury shares
Exchange differences on foreign operations
Valuation difference due to change in fair value
10,000
15,139
222,362
(3,943)
15,516
3,646
Net income (loss)
-
-
3,772
-
-
-
Other comprehensive income
-
-
-
-
7,828
546
Total comprehensive income
-
-
3,772
-
7,828
546
Acquisition, sales, etc. of Treasury shares
-
-
(34)
305
-
-
-
-
(4,825)
-
-
-
-
-
-
-
-
-
-
-
37
-
-
(37)
-
(209)
-
-
-
-
-
(209)
(4,822)
305
-
(37)
10,000
14,930
221,312
(3,637)
23,344
4,154
Dividends
10
Increase (decrease) in non-controlling interests due to capital increase of subsidiaries Transfer from other components of equity to retained earnings Share-based compensation transactions Total transactions with owners, etc. Balance as of June 30, 2024
Other components of equity Note No.
Balance as of January 1, 2024
Remeasurements of net defined benefit liability (asset)
Total equity attributable to owners of the parent
Total
Noncontrolling interests
Total equity
-
19,162
262,721
15,424
278,145
Net income (loss)
-
-
3,772
677
4,449
Other comprehensive income
-
8,374
8,374
1,487
9,861
Total comprehensive income
-
8,374
12,146
2,164
14,310
Acquisition, sales, etc. of Treasury shares
-
-
271
-
271
-
-
(4,825)
(448)
(5,273)
-
-
-
181
181
-
(37)
-
-
-
-
-
(209)
-
(209)
-
(37)
(4,763)
(267)
(5,030)
-
27,498
270,104
17,321
287,425
Dividends Increase (decrease) in non-controlling interests due to capital increase of subsidiaries Transfer from other components of equity to retained earnings Share-based compensation transactions Total transactions with owners, etc. Balance as of June 30, 2024
10
- 19 -
(5) 【Summary of Interim Consolidated Statements of Cash Flows】
Note No
First six-month period of consolidated FY2023 (January 1, 2023 to June 30, 2023) (After restatement)
(Million yen) First six-month period of consolidated FY2024 (January 1, 2024 to June 30, 2024)
Cash flow from operating activities 10,448 7,424
4,449 7,809
-
656
319
(79)
(198) 227
(224) 362
(3,554) (2,519)
26 (409)
161 5,259
64 3,327
11,132
8,055
(8,628)
(5,022)
Other
2,379 1,386
(4,292) 1,374
Net income (loss) Depreciation and amortization Impairment loss Increase (decrease) in assets and liabilities concerning retirement benefits Interest and dividend income Interest expenses Loss (gain) on valuation of investment securities
8
9
Equity in (earnings) losses of affiliates Loss (gain) on sales and disposal of non-current assets Income tax expense Decrease (increase) in trade receivables, contract assets and contract liabilities Decrease (increase) in inventories Increase (decrease) in trade payables Subtotal
23,835
16,096
Interest received Dividend received Interest paid Income taxes paid
137 896 (206) (13,025)
169 1,047 (358) (3,899)
Cash flow from operating activities
11,637
13,055
430 (11,807) (1,270)
(712) (16,639) (1,538)
(5,282)
-
(9,752)
-
Cash flow from investing activities Decrease (increase) in time deposits Purchase of property, plant and equipment Purchase of intangible assets Payments for acquisition of shares of subsidiaries resulting in change in the scope of consolidation Payments for settlement of selling price of investment securities Other
13
Cash flow from investing activities
(91)
(403)
(27,772)
(19,291)
859 - (118) (1,479) (1) (4,690) - (1,477)
(379) 10,090 (118) (1,589) 72 (4,822) 181 (452)
Cash flow from financing activities Net increase (decrease) in short-term loans payable Income of long-term loans payable Repayment of long-term loans payable Payments for lease liabilities Net decrease (increase) in treasury shares Dividends paid Proceeds from transfers from non-controlling interests Dividends paid to non-controlling interests
10
(6,906)
2,984
Increase (decrease) in cash and cash equivalents
(23,041)
(3,252)
Cash and cash equivalents at beginning of term Effect of exchange rate changes on cash and cash equivalents Cash and cash equivalents at end of term
124,413
77,835
2,314
3,592
103,686
78,175
Cash flow from financing activities
- 20 -
【Notes on the Summary of Interim Consolidated Financial Statements】
- Reporting company The Company is a company located in Japan. Our summary of interim consolidated financial statements are composed of the interests in us and our subsidiaries (together, the "Group") and affiliates, with an ended date of June 30, 2024. Our main businesses are Component Solutions Business, Transport Solutions Business, and Accessibility Solutions Business. The details are described in Note "6. Business Segments."
- Basis of preparation (1) Compliance with IFRS The condensed interim consolidated financial statements have been prepared in accordance with IAS No. 34 under the provisions of Article 312, as they meet all the requirements of "Designated International Accounting Standards Designated Companies" stipulated in Article 1-2, Item 2 of the Regulations for Consolidated Financial Statements. The summary of interim consolidated financial statements for the fiscal year ended December 31, 2024, which was approved by Kazumasa Kimura, representative director, on August 9, 2024, was corrected and approved by Kazumasa Kimura, representative director on September 30, 2026. (2) Basis for measurement The summary of interim consolidated financial statements of our group have been prepared on a historical cost basis, except for financial instruments measured at fair value, as described in Note 3, "Significant Accounting Policies," below. (3) Functional and presentation currencies The summary of interim consolidated financial statements of our group represent the Japanese yen, which is our functional currency.
- Important accounting policies The significant accounting policies that our group applies in this condensed interim consolidated financial statements are the same as those applied in the consolidated financial statements for the previous fiscal year. Income tax expense for the first six-month of the current fiscal year is calculated using the estimated average annual effective tax rate. In addition, our group continues to apply a one-time exception to the recognition and disclosure of deferred tax assets and liabilities related to the International Tax Reform-Pillar 2 Model Rule of IAS No. 12, Income Taxes, which has no impact on summary of interim consolidated financial statements.
4.Additional information (1) Revision of errors of prior periods It has come to light that in the calculation of equity in earnings (losses) of affiliates at certain of the Company's equity-method affiliates, the financial figures obtained from the said equity-method affiliates, which should have been calculated based on changes in consolidated net assets, including the subsidiaries of said equity-method affiliates, were instead calculated based on changes in non-consolidated net assets. As a result, an error was identified whereby the amounts reported as “Equity in earnings of affiliates” in the Company’s consolidated statements of income and “Investments accounted for using the equity method” in the consolidated statement of financial position have been consistently understated since prior years. The Company has determined that retrospective restatement was necessary regarding the above error and has revised the consolidated financial statements and other financial statements contained in the Annual Securities Reports, the Semiannual Reports and the Quarterly Reports that have already been submitted. We have also revised the other errors contained therein. Compared to the numerical values prior to the restatement, the major impacts of the restatement are that in the summary of interim consolidated statements of income for the first six-month period of consolidated FY2023, "Equity in earnings of affiliates" increased by ¥230 million and "Net sales" and "Cost of sales" decreased by ¥264 million and ¥261 million, respectively.
- 21 -
(2) Major impacts of restatement First six-month period of consolidated FY2023 (January 1, 2023 to June 30, 2023)
Fiscal period
(Prior to restatement) (Million yen) (Million Income before income taxes yen) Net income attributable to owners of (Million the parent yen) (Million Net income yen) Comprehensive income attributable (Million to owners of the parent yen) (Million Comprehensive income yen) Net sales
Impact
(After restatement)
162,997
162,733
(264)
15,485
15,707
222
9,452
9,633
182
10,266
10,448
182
15,824
16,181
357
17,226
17,583
357
Basic earnings per share
(Yen)
78.74
80.26
1.52
Diluted earnings per share
(Yen)
78.74
80.25
1.52
11,637
11,637
-
(27,772)
(27,772)
-
(6,906)
(6,906)
-
103,686
103,686
-
Cash flows from operating activities Cash flows from investing activities Cash flows from financing activities Cash and cash equivalents at fiscal year or quarterly end
(Million yen) (Million yen) (Million yen) (Million yen)
- 22 -
- Critical accounting judgments, estimates and assumptions The preparation of summary of interim consolidated financial statements in conformity with IFRS requires management to make judgments, estimates and assumptions that affect the application of accounting policies and the reported amounts of assets, liabilities, revenues and expenses. Actual results could differ from those estimates. Estimates and underlying assumptions are reviewed on an ongoing basis. Changes in accounting estimates are recognized in the period in which the estimates change and in future periods affected. Judgments that involve significant accounting estimates and estimates in these summary of interim consolidated financial statements are, in principle, the same as the consolidated financial statements for the previous fiscal year.
- 23 -
- Business Segments (1) Summary of reportable segments The Group’s reportable segments are components of the Group about which separate financial statement is available that is evaluated regularly at the Board of Directors’ meetings in deciding how to allocate the management resources and in assessing performance. The Group classifies its business segments into the following three reportable segments, based on the similarity of business models: 1) the “Component Solutions Business;” 2) the “Transport Solutions Business;” and 3) the “Accessibility Solutions Business.” The main lines of business of each reportable segment are as below.
Business segment
Main lines of business
Component Solutions Business
The design, manufacture, sale, maintenance and repair of industrial robot components and equipment for construction machinery and its components The design, manufacture, sale, maintenance and repair of brake systems and automatic door operating systems for railroad vehicles, aircraft components, brake systems and drive control units for vehicles, control systems for marine vessels, and components thereof The design, manufacture, sale, installation, maintenance and repair of automatic door operating systems for buildings and general industry, platform safety systems, and components thereof
Transport Solutions Business Accessibility Solutions Business
(2) Information on reportable segments
The accounting policies of the reportable segments are the same as the accounting policies of our group described in "3. Important accounting policies “in the notes. Intersegment sales and transfers are based on prevailing market prices. First six-month period of previous consolidated fiscal year (From January 1, 2023 to June 30, 2023) (Million yen)
Reportable Segments Component Transport Accessibility
Total
Others
Total
Amount stated in summary of Adjustments consolidated statements of income
Net sales Sales to external customers
74,785
36,171
44,083
155,039
7,694
162,733
-
162,733
Inter-segment sales
1,419
850
6
2,275
191
2,466
(2,466)
-
Total sales
76,204
37,021
44,090
157,314
7,885
165,199
(2,466)
162,733
Segment income (Operating income)
7,394
3,651
2,432
13,477
422
13,898
(5,211)
8,687
Financial income
-
5,023
Financial costs
-
(523)
Equity in earnings of affiliates
-
2,519
Income before tax
-
15,707
Notes: 1. “Others” is a business segment that is not a reportable segment and consists of businesses that are engaged in the design, manufacture, sale, maintenance and repair of packaging machine, three-dimensional model production device and components thereof. 2. Adjustment to sales is as a result of eliminations of inter-segment transactions. 3. Adjustment to segment income (operating income) is total profit/loss, etc. that are not allocated to the respective segments.
- 24 -
First six-month period ended June 30, 2024 (January 1, 2024 to June 30, 2024) (Million yen)
Reportable Segments Component Transport Accessibility
Total
Others
Total
Amount stated in summary of Adjustments consolidated statements of income
Net sales Sales to external customers
51,675
42,077
50,917
144,670
7,821
152,491
-
152,491
Inter-segment sales
1,548
1,001
4
2,554
20
2,574
(2,574)
-
Total sales
53,223
43,078
50,922
147,223
7,841
155,065
(2,574)
152,491
Segment income (Operating income)
2,079
5,370
4,099
11,548
136
11,684
(5,319)
6,365
Financial income
-
1,586
Financial costs
-
(584)
Equity in earnings of affiliates
-
409
Income before tax
-
7,776
Notes: 1. “Others” is a business segment that is not a reportable segment and consists of businesses that are engaged in the design, manufacture, sale, maintenance and repair of packaging machine, three-dimensional model production device and components thereof. 2. Adjustment to sales is as a result of eliminations of inter-segment transactions. 3. Adjustment to segment income (operating income) is total profit/loss, etc. that are not allocated to the respective segments.
- 25 -
- Revenue from contracts with customers Our businesses are comprised of Component Solutions Business, Transport Solutions Business, Accessibility Solutions Business and Other Businesses, and are subject to periodic review by our Board of Directors to determine the allocation of management resources and assess performance. In our group, revenues earned through these businesses are presented as net sales. Net sales are broken down by major products. The relation between these disaggregated net sales and net sales by segment as described in Note "6. Business Segments" is as follows: There is no obligation to perform as an agent for our group.
Business segment
Major products Precision Reduction Gears
Component Solutions Business
First six-month period of consolidated FY2023 (January 1, 2023 to June 30, 2023) 50,165
29,964
24,620
21,711
Subtotal
74,785
51,675
Railroad Vehicle Equipment
10,453
11,158
Aircraft Equipment
7,967
11,912
6,270
6,268
8,205
9,465
3,275
3,273
Subtotal
36,171
42,077
Automatic Door
44,083
50,917
Subtotal
44,083
50,917
7,026
7,541
668
280
7,694
7,821
162,733
152,491
Hydraulic Equipment
Transport Solutions Business
Commercial Vehicle Equipment Marine Vessels Equipment Others
Accessibility Solutions Business
Packaging Machines Others
Others
(Million yen) First six-month period of consolidated FY2024 (January 1, 2024 to June 30, 2024)
Subtotal Total (NOTE) Amounts are expressed as external sales.
- 26 -
- Impairment of non-financial assets Previous interim consolidated fiscal year (January 1, 2023, to June 30, 2023) Not applicable Current interim consolidated fiscal year (January 1, 2024, to June 30, 2024) (Millions of yen) Reportable Segments Others
Type of asset
Impairment loss
Goodwill
656
Total
656
As of the end of the current interim consolidated accounting period, we tested goodwill of our consolidated subsidiary Engilico Engineering Solutions NV and its subsidiaries for impairment. As the recoverable amount was less than the carrying amount, we recognized an impairment loss related to this goodwill. The impairment loss is included in "Other expense" in the condensed interim consolidated statements of operations and is recognized in Others. The recoverable amount is measured at value in use (pre-tax discount rate: 14.6%).
- 27 -
9.Financial income and costs (1) Financial income Breakdown of financial income is as follows: (First six-month of consolidated financial period) (Million yen) First six-month period of First six-month period of consolidated FY2023 consolidated FY2024 (January 1, 2023 to (January 1, 2024 to June 30, 2023) June 30, 2024) Interest income Financial assets measured at amortized cost
136
156
62
68
3,554
-
1,271
1,362
5,023
1,586
Dividends income Financial assets measured at fair value through other comprehensive income Gain on valuation of investment securities (Note) Financial assets measured at fair value through profit or loss Foreign exchange gain Total
(NOTE) The above refers to the shares of Harmonic Drive Systems, Inc. (hereinafter referred to as "Harmonic") that were sold during the previous first-six month consolidated financial period. It includes the total sales amount calculated based on the average of the "Volume Weighted Average Price" (hereinafter referred to as "VWAP") for each day during the selling period, as well as the difference from the fair value at the end of the fiscal year 2022. (Second quarter of consolidated financial period) Second quarter of consolidated FY2023 (April 1, 2023 to June 30, 2023)
(Million yen) Second quarter of consolidated FY2024 (April 1, 2024 to June 30, 2024)
77
102
61
67
62
(8)
Interest income Financial assets measured at amortized cost Dividends income Financial assets measured at fair value through other comprehensive income Gain on valuation of investment securities (Note) Financial assets measured at fair value through profit or loss Foreign exchange gain Total
- 28 -
1,034
679
1,234
840
(2) Financial cost The breakdown of financial costs is as follows: (First six-month of consolidated financial period) (Million yen) First six-month period of First six-month period of consolidated FY2023 consolidated FY2024 (January 1, 2023 to (January 1, 2024 to June 30, 2023) June 30, 2024) Interest expenses Financial liabilities measured at amortized cost
134
252
Lease liabilities
94
110
295
196
Financial assets measured at fair value through profit or loss
-
26
Total
523
584
Valuation loss from derivatives transactions Financial assets measured at fair value through profit or loss Loss on valuation of investment securities
(Second quarter of consolidated financial period) Second quarter of consolidated FY2023 (April 1, 2023 to June 30, 2023)
(Million yen) Second quarter of consolidated FY2024 (April 1, 2024 to June 30, 2024)
Financial liabilities measured at amortized cost
83
123
Lease liabilities
43
62
257
185
Financial assets measured at fair value through profit or loss (Note)
516
26
Total
900
395
Interest expenses
Valuation loss from derivatives transactions Financial assets measured at fair value through profit or loss Loss on valuation of investment securities
(NOTE) The difference between the gross proceeds from the sale of the Harmonic shares completed during the second quarter of the previous fiscal year, based on the average VWAP for each day during the sale period, and the fair value at the end of the first quarter of the fiscal year.
- 29 -
- Cash dividends (1) Cash dividends paid were as follows: Previous interim consolidated fiscal year (January 1, 2023, to June 30, 2023) Resolution March 23, 2023
Total dividends (Millions of yen)
Dividends per share (yen)
Record Date
Effective date
4,693 39 December 31, 2022 March 24, 2023 Annual Shareholders' Meeting (NOTE) The total amount of dividends declared by resolution of the Ordinary General Meeting of Shareholders on March 23, 2023 includes dividends of 12 million yen on our shares held by the trust account (re-trustee: Japan Custody Bank, Ltd. (Trust Account E)) of Mizuho Trust & Banking Co., Ltd. related to the stock benefit trust (BBT). Current interim consolidated fiscal year (January 1, 2024, to June 30, 2024) Resolution March 26, 2024
Total dividends (Millions of yen)
Dividends per share (yen)
Record Date
Effective date
4,825 40 December 31, 2023 March 27, 2024 Annual Shareholders' Meeting (NOTE) The total amount of dividends declared by resolution of the Ordinary General Meeting of Shareholders on March 26, 2024 includes dividends of 24 million yen on our shares held by the trust account (re-trustee: Japan Custody Bank, Ltd. (Trust Account E)) of Mizuho Trust & Banking Co., Ltd. related to the stock benefit trust (BBT).
(2) Dividends for which the base date belongs to the current interim consolidated fiscal year and for which the effective date of distribution falls in the end of interim consolidated fiscal year Previous interim consolidated fiscal year (January 1, 2023, to June 30, 2023) Resolution
Total dividends (Millions of yen)
Dividends per share (yen)
Record Date
Effective date
July 31, 2023 Board of Directors’ 4,813 40 June 30, 2023 August 31, 2023 Meeting (NOTE) Total dividends declared by resolution of the Board of Directors on July 31, 2023 include dividends of 12 million yen on our shares held by the Trust Account (re-trustee: Japan Custody Bank, Ltd. (Trust Account E)) of Mizuho Trust & Banking Co., Ltd. related to the Share Benefit Trust (BBT). Current interim consolidated fiscal year (January 1, 2024, to June 30, 2024) Resolution
Total dividends (Millions of yen)
Dividends per share (yen)
Record Date
Effective date
July 31, 2024 Board of Directors’ 4,826 40 June 30, 2024 August 30, 2024 Meeting (NOTE) Total dividends declared by resolution of the Board of Directors on July 31, 2024 include dividends of 21 million yen on our shares held by the Trust Account (re-trustee: Japan Custody Bank, Ltd. (Trust Account E)) of Mizuho Trust & Banking Co., Ltd. related to the Share Benefit Trust (BBT).
- 30 -
11.Earnings per shares (1) Basis for calculating basic earnings per share (first six-month period) Basic earnings per share and the calculation basis are as follows (First six-month of consolidated financial period) First six-month period of consolidated FY2023 (January 1, 2023 to June 30, 2023) (Millions of yen) Weighted average number of shares of common (Thousands stock of shares) Profit attributable to owners of the parent
Basic earnings per share
(Yen)
First six-month period of consolidated FY2024 (January 1, 2024 to June 30, 2024)
9,633
3,772
120,031
120,084
80.26
31.41
(Second quarter of consolidated financial period) Second quarter of consolidated Second quarter of consolidated FY2023 FY2024 (April 1, 2023 to (April 1, 2024 to June 30, 2023) June 30, 2024) (Millions of yen) Weighted average number of shares of common (Thousands stock of shares) Profit attributable to owners of the parent
Basic earnings per share
(Yen)
3,143
1,306
120,037
120,111
26.18
10.88
(2) Basis for calculating diluted earnings per share Diluted earnings per share and the calculation basis are as follows: (First six-month of consolidated financial period) First six-month period of consolidated FY2023 (January 1, 2023 to June 30, 2023) Diluted net income attributable to owners of the (Millions of parent yen) Weighted average number of shares of common (Thousands stock of shares) Effect of stock options using the stock acquisition (Thousands rights method of shares) (Thousands Diluted weighted average shares for common stock of shares) Diluted earnings per share
(Yen)
First six-month period of consolidated FY2024 (January 1, 2024 to June 30, 2024)
9,633
3,772
120,031
120,084
10
3
120,041
120,087
80.25
31.41
(Second quarter of consolidated financial period) Second quarter of consolidated Second quarter of consolidated FY2023 FY2024 (April 1, 2023 to (April 1, 2024 to June 30, 2023) June 30, 2024) Diluted net income attributable to owners of the (Millions of parent yen) Weighted average number of shares of common (Thousands stock of shares) Effect of stock options using the stock acquisition (Thousands rights method of shares) (Thousands Diluted weighted average shares for common stock of shares) Diluted earnings per share
(Yen)
- 31 -
3,143
1,306
120,037
120,111
10
2
120,048
120,112
26.18
10.88
12.Financial instruments (1) Fair Value Measurements ① Financial assets measured at amortized cost Other financial assets Fair values of other financial assets are primarily valued based on the present value of these assets discounted at a rate adjusted for credit risk, segregated by certain time periods. ② Financial assets measured at fair value through profit or loss a Golf membership The fair value of golf memberships is valued based on quoted prices and other factors. Golf membership is included in "Other Financial Assets" in the Summary of Interim Consolidated Statements of Financial Position b Derivative financial assets The fair value of foreign currency forward contracts is calculated based on forward exchange rates and other factors. Note that derivative financial assets are included in "other financial assets" in the Summary of Interim Consolidated Financial Statement. c Investment securities Debt instruments, which consist primarily of corporate bonds held for non-trading purposes, are calculated using appropriate valuation techniques based on the most recent market prices from third-party transactions and other available market data. Investment securities are included in "other financial assets" in the Summary of Interim Consolidated Financial Statement. ③ Financial assets measured at fair value through other comprehensive income Investment securities Equity instruments consisting primarily of stocks held for non-trading purposes. Listed stocks are calculated using quoted market prices on exchanges, and unlisted stocks are calculated using valuation techniques based on market prices of similar companies and valuation techniques based on net asset value. Investment securities are included in "other financial assets" in the Summary of Interim Consolidated Financial Statement. ④ Financial liabilities measured at amortized cost Borrowings The fair value of borrowings is calculated based on the present value of the sum of principal and interest discounted at the interest rate assumed for new similar borrowings. ⑤ Financial liabilities measured at fair value through profit or loss a Derivative financial liabilities The fair value of foreign currency forward contracts is calculated based on forward exchange rates and other factors. The fair values of foreign currency swap agreements and interest rate swap agreements are calculated based on prices provided by counterparty financial institutions, etc. Derivative financial liabilities are included in "Other financial liabilities" in the summary of interim consolidated statements of financial position. b Contingent consideration The fair value of the financial liabilities for contingent consideration is calculated based on the present value of future payments calculated using a Monte Carlo simulation, primarily based on forecasts of performance and other factors. Financial liabilities related to contingent consideration are included in "Other financial liabilities" in the Summary of Interim Consolidated Statements of Financial Position.
- 32 -
(2) Carrying amounts and fair values of each class of financial instruments The carrying amounts and fair values of financial assets and financial liabilities in the summary of interim consolidated statements of financial position are as follows: (Million yen) End of the first six-month period of consolidated FY2024 (as of June 30, 2024)
End of consolidated FY2023 (as of December 31, 2023) Book value
Fair value
Book value
Fair value
Financial assets Financial assets measured at amortized cost Other financial assets
3,543
3,543
4,391
4,391
3,543
3,543
4,391
4,391
Golf membership
127
127
127
127
Derivative financial assets
39
39
-
-
Investment securities
358
358
323
323
523
523
449
449
Investment securities
9,100
9,100
10,710
10,710
Total financial assets measured at fair value through other comprehensive income
9,100
9,100
10,710
10,710
13,167
13,167
15,550
15,550
Borrowings
21,572
21,572
31,778
31,690
Other financial liabilities
21,572
21,572
31,778
31,690
Derivative financial liabilities
487
487
763
763
Contingent consideration
28
28
31
31
516
516
794
794
22,088
22,088
32,571
32,484
Total financial assets measured at amortized cost Financial assets measured at fair value through profit or loss
Total of financial assets measured at fair value through profit or loss Financial assets measured at fair value through other comprehensive income
Total of financial assets Financial Liabilities Financial liabilities measured at amortized cost
Financial Liabilities measure at fair value through profit or loss
Total financial liabilities measure at fair value through profit or loss Total financial liabilities
At initial recognition, the Company did not hold any financial assets or financial liabilities that were irrevocably elected to be designated as financial assets and financial liabilities measured at fair value through profit or loss. Cash and cash equivalents, trade receivables, contract assets, other receivables, trade payables, and other payables, which are financial instruments measured at amortized cost, are not included in the table above because their carrying amounts approximate fair value due to their short-term maturities.
- 33 -
(3) Level-based classification of the fair value hierarchy The recurring fair values of financial assets and financial liabilities are measured and analyzed as follows: These fair value amounts are categorized into three fair value hierarchies (levels 1 through 3) based on the inputs to the valuation techniques used (available market data). Each level is defined as follows: Level 1: Fair values measured at quoted prices in actively traded markets Level 2: Fair values calculated using observable prices, either directly or indirectly, other than Level 1 Level 3: Fair values derived from valuation techniques that include unobservable inputs Transfers between levels of the fair value hierarchy are recognized on the date that the events or changes in circumstances that give rise to the transfer occur. The following table presents the fair value hierarchy for financial assets and financial liabilities measured at fair value on a recurring basis: (Million yen) End of the previous consolidated fiscal year (As of December 31, 2023)
Level 1
Level 2
Level 3
Total
Other financial assets Financial assets to be measured at fair value through profit or loss Financial assets measured at fair value through other comprehensive income
-
166
358
523
3,945
-
5,156
9,100
-
487
28
516
Other financial liabilities Financial liabilities measured at fair value through profit or loss
(Million yen) End of the first six-month period of consolidated FY2024 (as of June 30, 2024)
Level 1
Level 2
Level 3
Total
Other financial assets Financial assets to be measured at fair value through profit or loss Financial assets measured at fair value through other comprehensive income
-
127
323
449
4,227
-
6,483
10,710
-
763
31
794
Other financial liabilities Financial liabilities measured at fair value through profit or loss
The fair value hierarchy for financial instruments measured at amortized cost, which is disclosed in "(2) Carrying amounts and fair values of each class of financial instruments," is categorized principally in Level 3. There were no transfers between Levels 1 and 2 and 3 in the previous fiscal year or the first three-month of current fiscal year. There were no significant assets or liabilities measured at fair value on a nonrecurring basis at the end of the previous or first six-month of current fiscal year.
- 34 -
(4) Information on Level 3 fair value measurements ① Valuation techniques and inputs Level 3 other financial assets and other financial liabilities consist primarily of unlisted equity securities and contingent consideration. The fair value of unlisted equity securities is determined using valuation techniques based on quoted market prices for comparable companies and valuation techniques based on net asset value. The fair value of the financial liabilities for contingent consideration is calculated based on the present value of future payments calculated using a Monte Carlo simulation, primarily based on forecasts of performance and other factors. ② Evaluation process Fair value measurements for Level 3 financial instruments are performed in accordance with relevant internal rules. When measuring fair value, the Company uses valuation techniques and inputs that most appropriately reflect the nature, characteristics and risks of the underlying financial instruments. ③ Level 3 sensitivity information for recurring fair value measurements Significant unobservable inputs for measuring the fair value of Level 3 financial instruments measured at fair value on a recurring basis are EBIT multiples, illiquidity discounts, and other inputs based on financial projections. Fair value is increased (decreased) by an increase (decrease) in EBIT multiples and decreased (increased) by an increase (decrease) in illiquidity discounts. For instruments classified as Level 3, the increase or decrease in fair value of the change in the inputs that are not observable to reasonably possible alternative assumptions would not be material. ④ Reconciliation of financial instruments classified as Level 3 from the beginning of the period to the ending balance
Balance at beginning of period
First six-month period of consolidated FY2023 (January 1, 2023 to June 30, 2023)
(Million yen) First six-month period of consolidated FY2024 (January 1, 2024 to June 30, 2024)
Financial assets
Financial assets
Financial Liabilities
Financial Liabilities
4,160
-
5,514
28
829
-
675
3
Net Income (Loss) (Note 1)
55
-
3
Other comprehensive (Note 2)
774
-
(26) 701
-
Purchase
613
-
618
-
Sale
(0)
-
-
-
5,602
-
6,806
31
Total gains and losses
Balance at end of period
income
(NOTE) 1 Gains and losses recognized in profit or loss primarily represent unrealized gains and losses on financial instruments sold in the first six-month of current fiscal year and are included in "Financial income" in the Summary of Interim Consolidated Statements of Income. 2 Gains and losses recognized in other comprehensive income are included in "Net changes in financial assets measured at fair value through other comprehensive income" in the summary of Interim Consolidated Statements of Comprehensive Income.
- 35 -
13.Business Combination First six-month period of consolidated FY2023 (From January 1, 2023 to June 30, 2023) (Purchase of Shares of Copas Systèmes SAS) Our consolidated subsidiary, Gilgen Door Systems AG (hereinafter "Gilgen"), acquired 100% of the shares of Copas Systèmes SAS on January 3, 2023, making it a wholly owned subsidiary of our group. (1) The outline of the business combination ① Name and business of the acquired company Name of acquired company: Copas Systèmes SAS Business activities: Automatic door sales, construction and maintenance in Southeastern France ② Main reasons for the business combination In our Automatic Door business, we aim to strengthen our sales structure covering the four major markets of Japan, Europe, North America and China. We are working to establish our position as a global automatic door manufacturer by strengthening our direct sales bases in each market and expanding our value chain through partnerships with distributors. In the European market in particular, we have been engaged in M&A aimed at strengthening sales channels centered on Gilgen, but recently we have made a wholly owned subsidiary of Copas Systèmes SAS, which has a strong customernetwork in southeastern France. As a result, we will rebuild the value chain in the French market and further develop our business foundation in Europe. ③ Method of acquiring control of the acquired company Acquisition of shares for cash consideration ④ Acquisition date January 3, 2023 ⑤ Acquired ownership percentage 100%
(2) Acquisition consideration and its breakdown Cash
¥5,459 million
Total acquisition consideration
¥5,459 million
(3) Acquisition-related expenses Acquisition-related expenses amounted to ¥35 million and are included in "Selling, general and administrative expenses" in the Interim Consolidated Statements of Income.
- 36 -
(4) Assets acquired and liabilities assumed The Company provisionally accounted for this business combination in the first quarter of the previous fiscal year. However, the allocation of the purchase consideration to the assets acquired and liabilities assumed has been finalized in the second quarter of the previous fiscal year. As a result of the finalization of this provisional accounting treatment, non-current assets and non-current liabilities increased by ¥2,167 million and ¥542 million, respectively, and goodwill decreased by ¥1,625 million. Assets acquired and liabilities assumed at the date of acquisition were as follows: (Million yen) Amount Fair value of consideration paid (Note 1)
5,459
Total
5,459
Current assets (Note 2)
1,373
Non-current assets (Note 3)
2,270
Current liabilities
(1,010)
Non-current liabilities
(583)
Goodwill (Note) 4
3,411
Total
5,459
(NOTE) 1 There is no contingent consideration. 2 Cash and cash equivalents of ¥177 million are included. The aggregate contract amount for the fair value of trade and other receivables acquired of ¥759 million is ¥907 million and the estimated uncollectible amount is ¥147 million. 3 Includes customer-related assets of ¥1,454 million (useful life of 14 years) and software of ¥712 million (useful life of 16 years) that were not recognized by the acquired company. 4 Goodwill primarily reflects excess earning power and is not deductible for tax purposes. (5) Impact on the performance of our group Profit and loss information after the acquisition date recognized in the interim consolidated statement of income for the first six-month of previous fiscal year and the estimated impact on the summary of interim consolidated financial statements of the business combination on January 1, 2023, the beginning of the previous fiscal year, are not presented because they are not material. First six-month period of consolidated FY2024 (From January 1, 2024 to June 30, 2024) Not applicable
14.Commitment Significant commitments contractually committed to the acquisition of property, plant and equipment are as follows: (Million yen) End of the first six-month period of consolidated FY2024 (as of June 30, 2024)
End of consolidated FY2023 (as of December 31, 2023) Commitment
9,283
15.Subsequent events Not applicable
- 37 -
9,038
2 【Others】 With regard to the interim dividend for the 22nd fiscal period (from January 1, 2024 to December 31, 2024), at the Board of Directors meeting held on July 31, 2024, the Company resolved to pay an interim dividend to shareholders or registered pledgees of record as of June 30, 2024 as follows. ① Total interim dividend
¥4,826 million
② Dividend for first six-month
40 yen
③ Effective Date and Commencement Date of Payment
- 38 -
August 30, 2024
Part two 【Information on Assurance Companies, etc. of Submitting Companies】 Not applicable
- 39 -
SEMIANNUAL REVIEW REPORT ON CONSOLIDATED FINANCIAL STATEMENTS OF INDEPENDENT AUDITORS September 30, 2026 Nabtesco Corporation To the Board of Directors KPMG AZSA LLC. Tokyo Office Designated Limited Liability Partners Partners administering the affairs
Certified Public Takeharu Kirikae Accountant
Designated Limited Liability Partners Partners administering the affairs
Certified Public Daisuke Toyama Accountant
Auditor's conclusion Pursuant to the provisions of Article 193-2-1 of the Financial Instruments and Exchange Act, we have reviewed the Nabtesco Corporation's interim consolidated financial statements for the period from January 1, 2024 to December 31, 2024 (January 1, 2024 to June 30, 2024), which consist of the summary of interim consolidated statements of financial position, summary of interim consolidated statements of income, summary of interim consolidated statements of comprehensive income, condensed interim consolidated statements of changes in equity, summary of interim consolidated statements of cash flows and notes thereto, all of which are listed in "Accounting." In our review of the period, we did not believe in all material respects that the condensed interim consolidated financial statements referred to above did not present fairly, in all material respects, the financial position of Nabtesco Corporation and its consolidated subsidiaries as of June 30, 2024, the results of their operations for the interim period then ended, and their cash flows for the interim period in accordance with International Accounting Standards 34, Interim Financial Reporting, as defined by Section 312 of the Regulations Concerning Terminology, Forms and Preparation Methods of Consolidated Financial Statements. Basis for the auditor's conclusion We conducted our interim review in accordance with the standards of the interim review generally accepted in our country. Our responsibility under the criteria for the interim review is set forth under the caption "Auditor's Responsibility in Review of Condensed Interim Consolidated Financial Statements." We are independent of the Company and its consolidated subsidiaries in accordance with the provisions of the Code of Professional Ethics in Japan and we fulfill our other ethical responsibilities as an auditor. We believe that the evidence upon which we base our conclusions is obtained. Other Matter As described in the Reasons for Filing the Amendment Report to the Semiannual Report, the Company has amended its semiannual consolidated financial statements. We previously issued our auditor’s report on the consolidated financial statements before amendment on August 9, 2024. In connection with the amendment, we hereby issue this auditor’s report on the amended semiannual consolidated financial statements. Responsibility of Management, Audit & Supervisory Board Members and Audit & Supervisory Board for the Summary of Interim Consolidated Financial Statements Management is responsible for the preparation and fair presentation of the summary of interim consolidated financial statements in accordance with International Accounting Standards 34, Interim Financial Reporting. This includes establishing and operating such internal control as management deems necessary for the preparation and fair presentation of the summary of interim consolidated financial statements that are free from material misstatement, whether due to fraud or error. In preparing the summary of interim consolidated financial statements, management is responsible for evaluating whether it is appropriate to prepare the summary of interim consolidated financial statements based on the going concern assumption and for disclosing matters related to a going concern in accordance with International Accounting Standards No. 1, Presentation of Financial Statements, Item 4. The responsibility of the Audit & Supervisory Board Members and Audit & Supervisory Board is to monitor the execution of directors' duties in the development and operation of the financial reporting process.
- 40 -
Auditor's Responsibility for Review of Summary of Interim Consolidated Financial Statements during the Period The auditor's responsibility is to independently express a conclusion on the condensed interim consolidated financial statements in the interim review report based on the interim review performed by the auditor. In accordance with the standards of the interim review generally accepted in Japan, the auditor shall, through the course of the mediumterm review, make judgments as a professional expert and conduct the following with professional skepticism: ・Conduct questions, analytical procedures, and other interim review procedures primarily for management, financial, and accounting personnel. The interim review procedures are limited compared with the audits of financial statements for the fiscal year conducted in accordance with auditing standards generally accepted in Japan. ・If the auditor determines that there is significant uncertainty with respect to events or circumstances that raise substantial doubt about the Company's ability to continue as a going concern, the auditor will conclude, based on the evidence obtained, whether there are any matters in the summary of interim consolidated financial statements that would cause the auditor to believe that they are not fairly presented in accordance with International Accounting Standards No. 1, Presentation of Financial Statements, Item 4. In addition, if there is material uncertainty regarding the Company's ability to continue as a going concern, the auditor is required to alert the notes to the summary of interim consolidated financial statements in the Review Report during the period, or if the notes to the summary of interim consolidated financial statements for material uncertainty are not appropriate, to express a limited conclusion or a negative conclusion on the summary of interim consolidated financial statements. The auditor's conclusion is based on evidence obtained through the date of the interim review report; however, future events and circumstances may prevent the entity from continuing as a going concern ・Evaluate whether the presentation, composition and content of the summary interim consolidated financial statements, including the related notes, as well as whether there are any matters that cause the auditor to believe that the presentation and notes to the interim consolidated financial statements are not in accordance with International Accounting Standards 34, Interim Financial Reporting, and whether there are any matters that cause the auditor to believe that the summary of interim consolidated financial statements do not fairly present the underlying transactions and accounting events. ・Obtain evidence regarding the financial information of the Company and its consolidated subsidiaries that forms the basis for expressing a conclusion on the condensed interim consolidated financial statements. The auditor is responsible for directing, supervising and inspecting the interim review of the summary of interim consolidated financial statements. The auditor is solely responsible for the auditor's conclusions. The auditor shall report to the Audit & Supervisory Board Members and Audit & Supervisory Board on the scope of the planned interim review and the timing of its implementation, as well as important findings for the interim review. The auditors shall report to the Audit & Supervisory Board Members and Audit & Supervisory Board on compliance with the provisions of professional ethics in Japan regarding independence, matters that are reasonably likely to affect the auditor's independence, and in cases where countermeasures are taken to eliminate impediments or safeguards are applied to reduce the impediments to an acceptable level. Interest There is no interest between the Company and its Consolidated Subsidiaries and the Auditing Corporation or its Operating Partners that should be stated pursuant to the provisions of the Certified Public Accountants Act. Notes to the Reader of Semiannual Review Report on Consolidated Financial Statements of Independent Auditors: The Semiannual Review Report on Consolidated Financial Statements of Independent Auditors herein is the English translation of the Semiannual Review Report on Consolidated Financial Statements of Independent Auditors as required by the Financial Instruments and Exchange Act. The end (NOTE) 1 The original report of the above interim review report is maintained separately by the Company (the company submitting the interim report). 2 XBRL are not included in the scope of auditing.
- 41 -
(Amended) Annual Securities Report FY2024 Sep 30, 2026 Investor Relations Securities report
Bull 0
Bear 3
Routine
(Translation) This document has been translated from the Japanese original for the convenience of overseas stakeholders. In the event of any discrepancy between this document and the Japanese original, the original shall prevail.
[Cover] [Filing]
Amendment Report to Annual Securities Report
[Articles of Basis]
Article 24(1) of the Financial Instruments and Exchange Act
[Submit to]
Kanto Finance Bureau
[Submission date]
September 30, 2026
[Fiscal year]
22nd fiscal period (from January 1, 2024 to December 31, 2024)
[Company name]
Nabtesco Corporation
[English translation name]
Nabtesco Corporation
[Title and Name of Representative]
Kazumasa Kimura, Representative director
[Location of the head office]
7-9, Hirakawacho 2-chome, Chiyoda-ku, Tokyo
[Phone No.]
+81-3-5213-1134
[Name of administrative liaison]
Yasushi Minegishi, General Manager, Corporate Communications Dept.
[Near contact location]
7-9, Hirakawacho 2-chome, Chiyoda-ku, Tokyo
[Phone No.]
+81-3-5213-1134
[Name of administrative liaison]
Yasushi Minegishi, General Manager, Corporate Communications Dept.
[Locations for Public Inspection]
Tokyo Stock Exchange, Inc. (2-1, Nihonbashi Kabutocho, Chuo-ku, Tokyo)
―1―
(Translation) This document has been translated from the Japanese original for the convenience of overseas stakeholders. In the event of any discrepancy between this document and the Japanese original, the original shall prevail.
- Reasons for Filing the Amendment Report to the Annual Securities Report In April 2026, the Company became aware that TMT Machinery, Inc., (Nabtesco's ownership interest is 33%.) an equity-method affiliate, had recorded a gain on extinguishment of tie-in shares arising from the absorption-type merger of one of its subsidiaries (approximately ¥600 million attributable to Nabtesco's ownership interest). Upon becoming aware of this matter, the Company shared the information with its independent auditor and commenced an investigation into the retained earnings accumulated within TMT Machinery's subsidiaries and affiliated entities. As TMT Machinery is an unlisted company and does not prepare consolidated financial statements, the Company had historically applied the equity method based on TMT Machinery's standalone financial statements. Through its investigation, the Company identified that substantial retained earnings had accumulated within TMT Machinery's subsidiaries and affiliated entities and that the portion attributable to the Company had not been reflected in the share of profit (loss) of investments accounted for using the equity method. While continuously consulting with its independent auditor, the Company proceeded with a detailed review of the scope and amount of profits to be recognized. In the course of the accounting auditor’s interim review procedures for the condensed interim consolidated financial statements included in the Semi-annual Securities Report filed on August 14, 2026, the Company re-examined the scope and amounts of profit to be recognized and determined that the aggregate unrecognized amount was expected to be approximately ¥2.8 billion based on the Company’s ownership interest. Following discussions with the accounting auditor, the Company determined that it would be appropriate to recognize share of profit (loss) of investments accounted for using the equity method in accordance with the timing at which profits and losses arose at the subsidiaries and other entities in prior fiscal years, and to correct other errors at the same time. Accordingly, the Company determined that it was necessary to retrospectively amend its Annual Securities Reports, Semi-annual Securities Reports and Quarterly Securities Reports for prior fiscal years. As a result, certain information contained in the Annual Securities Report for the 22nd fiscal year (from January 1, 2024 to December 31, 2024), filed by the Company on March 27, 2025, requires correction. Accordingly, pursuant to the provisions of Article 24-2, paragraph (1) of the Financial Instruments and Exchange Act, the Company hereby files this Amendment Report to the Annual Securities Report. The amended consolidated financial statements and non-consolidated financial statements have been audited by KPMG AZSA LLC, and the relevant independent auditor’s report is attached hereto.
- Matters Amended Part I. Corporate Information Section 1. Overview of the Company
- Trend in Major Management Indicators
- Description of Business
- Status of Affiliated Companies Section 2. Business Conditions
- Management Policies, Business Environment and Issues to Be Addressed
- Management’s Discussion and Analysis of Financial Condition, Results of Operations and Cash Flows Section 4. Status of the Company Submitting the Report
- Status of Corporate Governance Section 5. Accounting Status
- Consolidated Financial Statements
- Non-consolidated Financial Statements
- Amended Sections Amended sections are indicated by underlining. As the amendments are extensive, only the amended information is presented for the matters listed above.
―2―
(Translation) This document has been translated from the Japanese original for the convenience of overseas stakeholders. In the event of any discrepancy between this document and the Japanese original, the original shall prevail.
Part one 【Corporate Information】 No.1 【Overview of the Company】 1 【Changes in Major Management Indicators】 (1) Consolidated management indicators Fiscal term
18th
19th
20th
21st
22nd
Fiscal year
2020/12
2021/12
2022/12
2023/12
2024/12
(Million yen) Income before income (Million taxes yen) Net income attributable to (Million owners of the parent yen) (Million Net income yen) Comprehensive income (Million attributable to owners of yen) the parent (Million Comprehensive income yen) Equity attributable to (Million owners of the parent yen) (Million Total assets yen) Equity attributable to owners of the parent per (Yen) share Total basic earnings per (Yen) share Net sales
279,358
299,641
309,123
333,367
323,384
33,711
101,806
16,553
25,316
16,184
20,320
64,771
10,415
14,226
10,188
23,327
67,846
12,338
16,102
11,765
20,032
71,573
19,048
20,762
19,360
23,122
75,924
21,597
23,217
22,184
199,362
241,372
251,250
262,721
272,559
353,591
483,653
462,440
428,630
449,845
1,604.83
2,011.28
2,093.15
2,188.27
2,268.84
163.69
534.29
86.79
118.52
84.83
(Yen)
163.61
534.14
86.78
118.50
84.82
(%)
56.4
49.9
54.3
61.3
60.6
(%)
10.5
29.4
4.2
5.5
3.8
Price-earnings ratio
(times)
27.6
6.4
38.8
24.3
33.1
Cash flows from operating activities Cash flows from investing activities Cash flows from financing activities Cash and cash equivalents at fiscal year end
(Million yen) (Million yen) (Million yen) (Million yen)
34,203
36,340
7,717
11,177
26,650
-10,710
67,147
13,231
-46,295
-28,733
-17,497
-57,960
-13,456
-13,482
-4,137
64,665
112,771
124,413
77,835
74,476
Number of employees
(Persons)
7,717
7,844
7,928
8,158
8,227
Diluted earnings per share Ratio of equity attributable to owners of the parent Profit ratio of equity attributable to owners of the parent company
(NOTE) 1 Figures are rounded to the nearest unit. 2 Consolidated financial statements are prepared in accordance with International Financial Reporting Standards (IFRS).
―3―
(Translation) This document has been translated from the Japanese original for the convenience of overseas stakeholders. In the event of any discrepancy between this document and the Japanese original, the original shall prevail.
(2) Non-consolidated management indicators Fiscal term
18th
19th
20th
21st
22nd
Fiscal year
2020/12
2021/12
2022/12
2023/12
2024/12
Net sales Ordinary income Net Income Common stock Number of issued shares Net assets Total assets
(Million yen) (Million yen) (Million yen) (Million yen) (Thousan ds of shares) (Million yen) (Million yen)
Net assets per share
(Yen)
Dividends per share (including interim dividends per share)
(Yen)
Net income per share
150,145
163,288
167,511
176,334
155,923
15,514
18,703
19,635
11,653
6,759
12,039
51,427
37,966
14,527
7,956
10,000
10,000
10,000
10,000
10,000
125,134
121,064
121,064
121,064
121,064
118,647
170,165
169,220
174,651
174,038
222,834
311,706
292,573
275,331
274,292
954.65
1,417.76
1,454.85
1,454.59
1,448.69
75.00
77.00
78.00
80.00
80.00
(41.00)
(38.00)
(39.00)
(40.00)
(40.00)
(Yen)
96.98
424.22
316.39
121.02
66.24
Fully diluted Net income per share
(Yen)
96.93
424.11
316.32
121.00
66.24
Equity Ratio
(%)
53.2
54.6
59.7
63.4
63.4
Return on equity
(%)
10.2
35.6
22.0
8.5
4.6
Price-earnings ratio
(times)
46.6
8.0
10.6
23.8
42.4
Dividend payout ratio
(%)
77.3
18.2
24.7
66.1
120.8
2,366
2,369
2,390
2,448
2,485
(333)
(342)
(317)
(344)
(334)
(%)
140.7
108.9
110.1
97.6
97.9
(%)
(107.4)
(121.1)
(118.1)
(151.5)
(182.5)
Highest stock price
(Yen)
4,570
5,610
3,805
3,795
2,984
Lowest stock price
(Yen)
2,007
3,120
2,709
2,518
2,121
Number of employees (Average number of temporary employees) Total shareholder return (Comparative index: TOPIX including dividends)
(Persons)
(NOTE) 1 Figures are rounded to the nearest unit. 2 The highest and lowest share prices are those on the First Section of the Tokyo Stock Exchange before April 3, 2022, and those on the Prime Market of the Tokyo Stock Exchange after April 4, 2022.
―4―
(Translation) This document has been translated from the Japanese original for the convenience of overseas stakeholders. In the event of any discrepancy between this document and the Japanese original, the original shall prevail.
2 【Corporate History】 Year and month
History
September. 2003 TS Corporation (formerly Teijin Seiki Co., Ltd.) and NABCO Ltd. established the Company through a share transfer. The Company listed our shares on the First Section of the Tokyo Stock Exchange. October, 2004 The Company absorbed two wholly owned subsidiaries, TS Corporation (formerly Teijin Seiki Co., Ltd.) and NABCO Ltd., through a simplified merger process. February, 2008. The Company established a Nabtesco Power Control (Thailand) Co., Ltd. in Thailand. December, 2009 Established Nabtesco Automotive Corporation. The automobile-related equipment business was transferred to the company. January, 2011 April, 2011
Established Jiangsu Nabtesco KTK Railroad Products Co., Ltd. in China. Acquired Automatic Door division (now Gilgen Door Systems AG) from KABA Holding AG of Switzerland.
August, 2011. The head office was relocated to the current site (7-9, Hirakawa-cho 2-chome, Chiyoda-ku, Tokyo). October, 2011 Established Jiangsu Nabtesco Hydraulic Co., Ltd. (currently Nabtesco (China) Precision Equipment Co., Ltd.) in China. April, 2016 Acquired additional shares in NABCO Systems Co., Ltd., and made it a subsidiary. March, 2017 Acquired an equity interests in OVALO GmbH and made it a subsidiary. April, 2022 Shifted from the First Section to the Prime Market due to a review of the market classification of the Tokyo Stock Exchange. August, 2023
Acquired an equity interest in R.K. DEEP SEA TECHNOLOGIES LIMITED and made it a subsidiary.
(NOTE) The history of the wholly-owned subsidiaries TS Corporation (formerly Teijin Seiki Co., Ltd.) and NABCO Ltd. is as follows. TS Corporation.
NABCO Ltd.
August, 1944 Spun off as Teijin Aircraft Industry Co., Ltd. from Teikoku
March, 1925
Nippon Air Brake Co., Ltd. was established in Kobe through
Jinzo-Kenshi Kaisha, Ltd., (renamed TEIJIN LIMITED in
the investment of three companies: Kobe Steel, Ltd., Engine
November 1962).
Manufacturing Co., Ltd., Tokyo Gas Electric Industrial Co., Ltd. and began manufacturing air brake equipment for railroad vehicles.
September,
Name changed to Teijin Seiki Co., Ltd.
March 1933
Began manufacturing of automotive oil brake equipment.
Started manufacturing textile machinery.
June 1937
Began manufacturing automotive air brake systems.
December,
Name changed to Nippon Brake Systems Co., Ltd.
1945 November, 1945 February, 1949 Head office moved from Iwakuni to Osaka.
1943 August, 1949 Listed on the Osaka Securities Exchange
June, 1946
March, 1955
Began manufacturing functional parts for aircraft.
March, 1959
Began manufacturing of machine tools and industrial
Name changed to Nippon Air Brake Co., Ltd.
February, 1949 Began manufacturing hydraulic equipment. May, 1949
Listed on the Osaka Securities Exchange
machinery. September,
Began manufacturing Hydraulic equipment.
December 1953 Began manufacturing of door systems for railroad vehicles.
1961 September,
Listed on the 1st section of the Tokyo Stock Exchange.
July, 1956
October, 1999 Head office moved from Osaka to Tokyo. March, 2000
Began manufacturing of automatic door systems for buildings.
1962 June 1963
Began manufacturing of marine control equipment.
Teijin Seiki Textile Machinery Co., Ltd. (dissolved in March February, 1985 Listed on the 1st section of the Tokyo Stock Exchange. 2012) is established. The textile machinery business was transferred to the company.
April, 2002
Established TMT Machinery Inc. as a joint venture with
April, 1992
Name changed to NABCO, Ltd.
Toray Engineering Co., Ltd. and Murata Machinery Co., Ltd. In April 2003, the synthetic fiber machinery business was transferred to the company. October, 2003 Name changed to TS Corporation.
October, 1999 Transferred the passenger car oil brake business to Bosch Brake System Co., Ltd. (now Bosch Corporation).
October, 2004 Eliminated due to the merger with Nabtesco Corporation.
October, 2004 Eliminated due to the merger with Nabtesco Corporation.
―5―
(Translation) This document has been translated from the Japanese original for the convenience of overseas stakeholders. In the event of any discrepancy between this document and the Japanese original, the original shall prevail.
3 【Description of business】 The group consists of the Company, 64 subsidiaries, and 13 affiliated companies. Main businesses of the Group are divided into Component Solutions Business, Transport Solutions Business, and Accessibility Solutions Business. Its business operations and their positioning and relation to segments are as follows. The categories shown below are the same as those of segments. (1) Business Activities Segment name
Business Activities
Component solutions
Design, manufacture, sale, maintenance and repair of industrial robot parts,
business
construction machinery equipment and other components. Design, manufacture, sale, maintenance and repair of brake systems, door systems,
Transport
couplers and safety systems for railway cars, parts for aircraft, brake systems, drive
solutions business
control systems and safety systems for automobiles, control systems and fire extinguishing systems for marine vessels, etc., and parts thereof.
Accessibility solutions business
Design, manufacture, sale, installation, maintenance, and repair of buildings and general industrial automatic doors, smoke emission equipment, platform safety equipment, welfare and nursing care equipment, and other components. Design, manufacture, sale, maintenance and repair of packaging machinery,
Others
machine tools, forging machinery, textile machinery, three-dimensional model creation equipment and other general industrial machinery and other components.
―6―
(Translation) This document has been translated from the Japanese original for the convenience of overseas stakeholders. In the event of any discrepancy between this document and the Japanese original, the original shall prevail. (2) Relationship between the segments of the Company, its subsidiaries and affiliates Business Segment
Domestic
As of December 31, 2024 Overseas
Nabtesco (China) Precision Equipment Co., Ltd.
Nabtesco Corporation T.S. Mechatech Co., Ltd.
Nabtesco Automotive Products (Thailand) Co., Ltd. Taiwan Nabtesco Service Co., Ltd. Nabtesco Service Southeast Asia Co., Ltd. NS Autotech Co., Ltd. OVALO GmbH adcos GmbH
※1 ※1 ※1 ※1 ※2 ※1 ※1 ※1 ※1 ※1 ※1 ※1 ※1 ※1 ※1 ※1 ※1 ※1 ※1 ※1 ※1 ※1 ※1 ※1 ※2 ※1 ※1
NABCO Auto Door (Beijing) Co., Ltd.
※1
※1 Changzhou Nabtesco Precision Machinery Co., Ltd. Nabtesco Precision Europe GmbH Nabtesco Motion Control, Inc. Shanghai Nabtesco Motion-Equipment Co., Ltd. Shanghai Nabtesco Hydraulic Co., Ltd. Shanghai Nabtesco Hydraulic Equipment Trading Co., Ltd. Nabtesco Power Control (Thailand) Co., Ltd. Nabtesco Power Control Europe GmbH
Component Solutions Business
Nabtesco Corporation Nabtesco Marine Shikoku Co., Ltd. Nabtesco Automotive Corporation Nabtesco Service Co., Ltd. NABTEC Co., Ltd. Kyokko Denki Co., Ltd.
※1 ※1 ※1 ※1 ※2
Transport Solutions Business
Jiangsu Nabtesco KTK Railroad Products Co., Ltd. Chengdu Nabtesco KTK Railroad Products Co., Ltd. Nabtesco Oclap S.r.l.
Nabtesco Marine Machinery (Shanghai) Co., Ltd. Nabtesco Marine Europe B.V. Nabtesco Marine Asia Pacific Pte. Ltd. Nabtesco Marinetec Co., Ltd. Deep Sea Technologies SMPC R.K. DEEP SEA TECHNOLOGIES LIMITED Nabtesco Aerospace, Inc. Nabtesco Aerospace Europe GmbH
Nabtesco Automotive System (Shanghai) Co., Ltd.
Accessibility Solutions Business
Nabtesco Corporation NABCO DOOR Ltd. NABCO SYSTEM CO., LTD. Niigata Nabco Pty. Ltd. Nabco Metal Co., Ltd. Nabco Toto Co., Ltd.
PACRAFT Co., Ltd.
CMET, Inc. TMT machinery Inc. and three other companies Others
NABCO Entrances, Inc. ※1 NABCO Canada Inc. ※1 Royal Doors Ltd. ※1 Gilgen Door Systems AG ※1 Gilgen Nabtesco (Hong Kong) Limited ※1 Gilgen Door Systems Germany GmbH ※1 Gilgen Door Systems Austria GmbH ※1 Gilgen Door Systems Italy srl ※1 Wupper Glas und Tür Technik GmbH ※1 Gilgen Door Systems Australia Pty Ltd. ※1 Copas Systèmes SAS ※1 Access Entry Pty Ltd. ※2 GDS Vostok AG ※2 ※1 ※1 PACRAFT (Dalian) Packaging Technology Co., Ltd. ※1 ※1 PACRAFT America Corporation PACRAFT Europe GmbH ※1 ※2 Engilico Engineering Solutions NV ※1 Engilico BV ※1 Engilico USA, LLC ※1 Engilico Trading, LLC ※1 SHANGHAI TMT MACHINERY, INC. and three other ※2 companies ※1 ※1 ※1 ※1 ※1
ROIC
Nabtesco Corporation Nabtesco Link Corporation Company-wide
Subsidiaries and Total of 77 affiliates
Shanghai Nabtesco Business Management Co., Ltd. ※1 Nabtesco India Private Ltd. Nabtesco USA Inc. Nabtesco Europe GmbH Nabtesco Technology Ventures AG Nabtesco Technology Ventures (Cayman) Ltd. Nabtesco Technology Ventures L.P.
18 domestic companies
59 overseas companies
―7―
※1 ※1 ※1 ※1 ※1 ※1 ※1
(Translation) This document has been translated from the Japanese original for the convenience of overseas stakeholders. In the event of any discrepancy between this document and the Japanese original, the original shall prevail.
※1 Consolidated subsidiaries ※2 Affiliated companies accounted for by the equity method (NOTE) Changes in Consolidated Subsidiaries and Affiliated companies (Consolidated Subsidiaries) Decrease 2 company Gilgen Door Systems France S.a.r.l. had merged into Copas Systèmes SAS Gilgen Door Systems Scandinavia AB was liquidated
(Affiliated companies) Decrease 2 company Nabtesco transfer partial share of Dairiki Tekko Co., Ltd and all share of Minda Nabtesco Automotive Private Limited to the other organization and those company has been excluded from our affiliated companies.
―8―
(Translation) This document has been translated from the Japanese original for the convenience of overseas stakeholders. In the event of any discrepancy between this document and the Japanese original, the original shall prevail.
(3) Organization chart of the business (Subsidiaries)
(Affiliates)
(Precision reduction gears) Nabtesco (China) Precision Equipment Co., Ltd.
Shanghai Nabtesco Motion-Equipment Co., Ltd.
Changzhou Nabtesco Precision Machinery Co., Ltd. Nabtesco Precision Europe GmbH Component Solutions Business
Nabtesco Motion Control, Inc. (Hydraulic equipment) Shanghai Nabtesco Hydraulic Co., Ltd. Shanghai Nabtesco Hydraulic Equipment Trading Co., Ltd.
Nabtesco Power Control (Thailand) Co., Ltd. Nabtesco Power Control Europe GmbH
(the Others) T.S. Mechatech Co., Ltd. (Railroad Vehicle Equipment) Jiangsu Nabtesco KTK Railroad Products Co., Ltd., others
Nabtesco Oclap S.r.l. (Marine vessel equipment) Nabtesco Marine Shikoku Co., Ltd.
Kyokko Denki Co., Ltd.
Nabtesco Marine Machinery (Shanghai) Co., Ltd. Nabtesco Marine Europe B.V. Nabtesco Marine Asia Pacific Pte. Ltd. Nabtesco Marintec Co., Ltd.
(Aircraft equipment) Nabtesco Aerospace, Inc.
Customers
Nabtesco Corporation
Transport Solutions Business
R.K. DEEP SEA TECHNOLOGIES LIMITED. and others
Nabtesco Aerospace Europe GmbH (Commercial vechicle equipment) Nabtesco Automotive Corporation Nabtesco Automotive System (Shanghai) Co., Ltd. Nabtesco Automotive Products(Thailand) Co., Ltd.
(Others) Nabtesco Service Co., Ltd.
NS Autotech Co., Ltd.
NABTEC Co., Ltd. Taiwan Nabtesco Service Co., Ltd. OVALO GmbH and others (Automatic Door business) Accessibility Solutions Business
NABCO DOOR Ltd.
Access Entry Pty Ltd. GDS Vostok AG
NABCO SYSTEM CO., LTD. and others NABCO Auto Door (Beijing) Co., Ltd. NABCO Entrances, Inc. and others Gilgen Door Systems AG and others
(Packaging Machines ) PACRAFT Co., Ltd.
TMT machinery Inc.
PACRAFT (Dalian) Packaging Technology Co., Ltd. PACRAFT America Corporation Others
PACRAFT Europe GmbH Engilico Engineering Solutions NV and others
(Others)
CMET, Inc.
―9―
(Translation) This document has been translated from the Japanese original for the convenience of overseas stakeholders. In the event of any discrepancy between this document and the Japanese original, the original shall prevail.
4 【Status of Affiliated Companies】
Name
Address
As of December 31, 2024 Common stock (Million yen)
Main business (Note 1)
Percentage of voting rights held [owned] (%)(Note 2)
(Consolidated Subsidiaries) NABCO DOOR Ltd.
Kita-ku,Osaka city Osaka prefecture
848
Accessibility
100.0
Nabtesco Automotive Corporation
Chiyoda-ku, Tokyo
450
Transport
100.0
Nabtesco Service Co., Ltd.
Shinagawa, Tokyo, Japan
300
Transport
100.0
NABCO SYSTEM CO., LTD.
Chiyoda-ku, Tokyo
300
Accessibility
85.9
PACRAFT Co., Ltd.
Minato-ku, Tokyo
245
Others
100.0
Nabtesco (China) Precision Equipment Co., Ltd. (Note 3)
China Jiangsu province
Component
67.0
Jiangsu Nabtesco KTK Railroad Products Co., Ltd. (Notes 3 and 4)
Thousand of USD 50,000
China Jiangsu province
1,800
Transport
50.0
Shanghai Nabtesco Hydraulic Co., Ltd. (Note 3)
China Shanghai City
Thousand of USD 14,500
Component
55.0
Shanghai Nabtesco Hydraulic Equipment Trading Co., Ltd.
China Shanghai City
100
Component
67.0
Nabtesco Aerospace, Inc.
United States Washington state
NABCO Entrances, Inc.
United States Wisconsin State
Gilgen Door Systems AG (NOTE5)
Switzerland Bern
Nabtesco Precision Europe GmbH Nabtesco Power Control (Thailand)Co., Ltd. (NOTE)3 Other 50 companies
Thousand of USD 1,000 Thousand of USD 0.3 Thousand of CHF 2,001
Transport Accessibility
Related content
Sales, installation and maintenance of our products. Interlocking officers, etc. Yes Lending and Borrowing of Funds, etc. Interlocking officers, etc. Yes Sales, installation and maintenance of the Company’s products Interlocking officers, etc. No Sales, installation and maintenance of the Company’s products. Interlocking officers, etc. Yes Lending and borrowing of funds Interlocking officers, etc. Yes Mutual supply of products and parts with the Company, etc. Interlocking officers, etc. Yes Mutual supply of products and parts with the Company Interlocking officers, etc. Yes Mutual supply of products and parts with the Company Interlocking officers, etc. Yes Sales of our products Interlocking officers, etc. Yes
Mutual supply of products and 100.0 parts with the Company (100.0) Interlocking officers, etc. No Mutual supply of products and 100.0 parts with the Company (100.0) Interlocking officers, etc. No
Accessibility
100.0
Thousands of EUR 51
Component
100.0 Sales of our products (100.0) Interlocking officers, etc. Yes
Thailand Thousands of THB Chonburi Prefecture 700,000
Component
70.0
Mutual supply of products and parts with the Company Interlocking officers, etc. Yes
-
-
-
33.0
Interlocking officers, etc. Yes
-
-
Germany Dusseldorf
-
-
Kita-ku,Osaka city Osaka prefecture
450
-
-
Interlocking officers, etc. Yes
(Equity-method affiliates) TMT machinery Co., Ltd. 12 other companies
Others
-
(NOTE) 1 The name of the segment is shown in the main business section. 2 Percentage of voting rights held [owned] column (in parentheses) is indirect ownership. 3 A specified subsidiary. 4 Although the Company holds 50% of the voting rights, it is considered to have substantial control, and therefore it is considered a consolidated subsidiary. 5 Gilgen Door System AG exceed 10% of total revenue. (Main items of profit and loss and balance sheet) (1) Sales 35,075 million yen (2) Income before tax 2,463 million yen (3) Net income 2,026 million yen (4) Net asset 12,392 million yen (5) Total asset 40,093 million yen
―10―
(Translation) This document has been translated from the Japanese original for the convenience of overseas stakeholders. In the event of any discrepancy between this document and the Japanese original, the original shall prevail.
5 【Employee Status】 (1) Consolidated basis As of December 31, 2024 Business Segment
Number of employees
Component Solutions Business
1,830
Transport Solutions Business
2,192
Accessibility Solutions Business
3,404
Others
416
Company-wide (common)
385 Total
8,227
(NOTE) 1 The number of employees is the number of employees employed, including those seconded from outside our group to our group, except for those seconded from our group to outside our group. 2 The number of temporary employees is omitted because it is less than 10 out of 100 of the number of employees. (2) Status of the submitting company Number of employees
Average age(years)
Average length of service (year)
2,485 ( 334 )
42.4
17.1
Business Segment
As of December 31, 2024 Average annual salary (thousands of yen) 6,855
Number of employees 967 ( 268 ) 937 ( 51 ) 245 ( 13 ) 12 ( 1) 324 ( 1) 2,485 ( 334 )
Component Solutions Business Transport Solutions Business Accessibility Solutions Business Others Company-wide (common) Total
(NOTE) 1 The number of employees is the number of employees employed, including those seconded from other companies to us, except for those seconded from us to other companies. 2 Average length of service is the period of service at the wholly owned subsidiary prior to the merger. 3 Average annual salary includes bonuses and non-standard wages. 4 Figures in (superscription) in the number of employee’s column are the average number of temporary employees per year.
(3) Union Information The labor unions of the submitting companies belong to JAM as a top organization, and as of December 31, 2024, there were 1,972 union members. Labor-management relations are in a smooth relationship, and there are no noteworthy matters. In addition, labor unions are formed in some consolidated subsidiaries, and there are no noteworthy matters regarding labormanagement relations as they are in a smooth relationship.
―11―
(Translation) This document has been translated from the Japanese original for the convenience of overseas stakeholders. In the event of any discrepancy between this document and the Japanese original, the original shall prevail.
(4) Percentage of female workers in managerial positions, percentage of male workers taking childcare leave, and differences in wages between male and female workers ①
Status of the submitting company Current fiscal year
Percentage of female workers in managerial positions (%)(NOTE1)
Percentage of male workers taking childcare leave (%)(NOTE2)
3.0
76.6
Differences in wages between male and female workers (%)(NOTE1 and 3) All workers
Regular workers
81.8
Part-timers and fixed-term workers
83.2
78.9
(NOTE) 1 Calculated in accordance with the provisions of the "The Act on Promotion of Women’s Participation and
Advancement in the Workplace" (Law No. 64 of 2015). Percentage of female workers in managerial positions is as of December 31, 2024 2 In accordance with the provisions of the "Act on the Welfare of Workers Who Take Care of Children or Other Family Members Including Child Care and Family Care Leave"(Law No. 76 of 1991), calculated by Article 71-4, Item 1 of the "Ordinance for Enforcement of the Act on the Welfare of Workers Who Take Care of Children or Other Family Members Including Child Care and Family Care Leave" (Labor Ordinance No. 25 of 1991). The rate of male employees taking childcare leave may exceed 100% due to the effects of taking childcare leave, etc. on children born in the previous year. 3 There is no difference in treatment according to gender in the wage system. Figures for overseas employees are calculated based on the theoretical wages of non-regular employees who worked in Japan and those who worked part-time on a full-time basis. Reduced working hours due to childcare or nursing care are not compensated.
<Supplementary Explanation for each figure> ・KPIs for human capital of the submitting company is described on "No.2 Business Conditions, 2 Policies and Measures for Sustainability Management (3) Enhance Human Capital Management". For detailed data on employment-related data and diversity initiatives, please refer to the Social (Social) category in ESG data book on our sustainability website. ・We recognize that one of our key initiatives is to fulfill our human resources portfolio and incorporate a diverse range of perspectives in order to realize our long-term vision. By the end of the planning period of the general employer action plan under the Act on Promotion of Women's Participation and Advancement in the Workplace, the submitting company aims to raise the percentage of female workers in managerial positions from the current 3.0% to 4.1%. As part of our pipeline-building measures for the internal development of female managers, we conduct "Female manager candidate training" for mid-level employees and their supervisors as well as "Diversity training" to eliminate the unconscious bias surrounding female employees. ・As a result of analyzing the causes of wage differences between men and women at the submitting companies, the main reasons for the large wage differences are basic remuneration and various allowances for regular workers according to their position because of the percentage difference of senior positions. In addition to the aforementioned pipeline formulation measures, we are promoting the provision of equal opportunities regardless of gender by granting themes that lead to the career development of female employees. ・ We also recognize that an increase in the number of male workers with childcare participation experience leads to the promotion of diversity and the creation of innovation as stated in our long-term vision. Based on this recognition, we have set a goal of taking childcare leave (including special leave) of one month and are working to create an environment in which male workers are encouraged to take proactive childcare leave through the establishment of a Child Care Support Consultation Hotline to support employees taking childcare leave and the implementation of e-learning on childcare leave for all employees, etc.
―12―
(Translation) This document has been translated from the Japanese original for the convenience of overseas stakeholders. In the event of any discrepancy between this document and the Japanese original, the original shall prevail.
② Consolidated Subsidiaries Current fiscal year
Name
Differences in wages between male and female workers (%)(NOTE1 and 3) Percentage of female Percentage of male workers in managerial workers taking childcare Part-timers and Regular leave (%)(NOTE2) positions (%)(NOTE1) All workers fixed-term workers workers
NABTEC Co., Ltd.
-
80.0
88.9
88.9
76.7
Nabtesco Service Co., Ltd.
7.4
200.0
81.6
89.6
60.0
Nabtesco Automotive Corporation
4.3
100.0
61.9
69.8
64.3
PACRAFT Co., Ltd.
9.8
66.7
78.0
79.5
34.9
T.S. Mechatech Co., Ltd.
-
75.0
76.1
77.6
88.0
NABCO DOOR Ltd.
1.0
62.5
68.1
69.5
83.1
NABCO SYSTEM CO., LTD.
1.9
58.3
66.9
68.0
74.0
(NOTE) 1 Calculated in accordance with the provisions of the "The Act on Promotion of Women’s Participation and
2
Advancement in the Workplace" (Law No. 64 of 2015). Percentage of female workers in managerial positions is as of December 31, 2024 In accordance with the provisions of the "Act on the Welfare of Workers Who Take Care of Children or Other Family Members Including Child Care and Family Care Leave"(Law No. 76 of 1991), calculated by Article 71-4, Item 1 of the "Ordinance for Enforcement of the Act on the Welfare of Workers Who Take Care of Children or Other Family Members Including Child Care and Family Care Leave" (Labor Ordinance No. 25 of 1991). The rate of male employees taking childcare leave may exceed 100% due to the effects of taking childcare leave, etc. on children born in the previous year.
3 There is no difference in treatment according to gender in the wage system. Figures for overseas employees are calculated based on the theoretical wages of non-regular employees who worked in Japan and those who worked part-time on a full-time basis. Reduced working hours due to childcare or nursing care are not compensated.
―13―
(Translation) This document has been translated from the Japanese original for the convenience of overseas stakeholders. In the event of any discrepancy between this document and the Japanese original, the original shall prevail.
No.2 【Business Conditions】 1 [Management Policies, Management Environment and Issues to be Addressed] Our Corporate Philosophy is stated "The Nabtesco Group, with our unique motion control technology, will provide safety, comfort and a sense of security in daily lives as well as any form of transportation"t The Nabtesco Way is the statement of the stance and mindset that achieves this Corporate Philosophy, as The Principles We Value. Under this philosophy and the principles, we are promoting a long-term value creation story, consisting of the Long-term Vision that illustrates our aim for 2030, Management Materiality that presents the important challenges we need to work on to achieve our Long-term Goals, and the Medium-term Management Plan, which describes measures to achieve our Long-term Targets. Through these measures, we aim to bring innovation while improving economic value, environmental value and social value in the long-term, in pursuit of management that sustainably develops both society and our group.
<Nabtesco’s Value Creation Story>
―14―
(Translation) This document has been translated from the Japanese original for the convenience of overseas stakeholders. In the event of any discrepancy between this document and the Japanese original, the original shall prevail.
(1) The Nabtesco Way In 2012, the Nabtesco Group formulated "The Nabtesco Way," which describes our Corporate Philosophy and Action Guidelines, and we have been working to put our Corporate Philosophy into practice while conducting activities to spread it throughout the Group. In 2023, we revised "The Nabtesco Way" with the intention of ensuring that diverse human resources around the world understand and empathize with them and act even more enthusiastically, in light of the recent changes in the external and internal environments. In new "The Nabtesco Way," our Corporate Philosophy has been retained, while Our Promises and Action Guidelines have been revised to reorganize the principles to be passed on to the next generation, and to incorporate a new perspective that takes on challenges, and has been consolidated to the six points of "The Principles We Value." The Company aims to deliver greater than expected satisfaction to society by grasping the needs and issues of customers and society from "See the people. See the planet." perspective, using the spirit of "Be open, fair, and honest.", and "Enjoying the challenge" of valuing "Stay curious. Explore further." while "Create together." with diversity, and promoting autonomous "Improve ourselves. Advance society"
(2) Long-term Vision The Group has established a long-term vision, "Leaders in Innovation for the Future," as a guideline for realizing the Group's growth and development toward 2030, and "Our Aim for 2030."
―15―
(Translation) This document has been translated from the Japanese original for the convenience of overseas stakeholders. In the event of any discrepancy between this document and the Japanese original, the original shall prevail.
In order to achieve our long-term vision, we have set the concept of our long-term vision up to 2030 as shown in the diagram below. Based on the "Identity of Nabtesco" accumulated so far, we aim to create new value in the market and become "leaders in innovation" one step ahead of our customers by promoting business while focusing on "technology," "globalization," and "contributions."
(3) Management Materiality Our group positions management materiality as the most important management issue. To create long-term value, we are continuously and appropriately adjusting our management materiality in response to changes in the business and societal requirements. Accordingly, we strive to steadily take action on each item to further enhance our management foundation as we pursue the sustainable growth of both society and our group. Please refer 2 【Policies and Measures for Sustainability Management】(1 ) Response to overall sustainability for dital.
―16―
(Translation) This document has been translated from the Japanese original for the convenience of overseas stakeholders. In the event of any discrepancy between this document and the Japanese original, the original shall prevail.
(4) Medium-Term Management Plan The Nabtesco group, toward the realization of the long-term vision for fiscal 2030, which it announced in February 2021, has formulated its new medium-term management plan (hereinafter "MTMP) for the three years from fiscal 2025. 【Basic policy of New MTMP】 "Reviving Potential, Evolving Excellence." Reviving Potential;Reviving our profitability by executing Project 10 Evolving Excellence; Evolving our technology from "motion control" to "smart motion control" to provide new value that meets the needs of society ① Management Targets The Nabtesco Group has set the targets for the medium-term management plan for FY2025 to FY2027 as follows. ROIC
: ROIC: 10% or over
Return to shareholders:Approximately DOE 3.5% with stable dividend and share buyback in accordance of financial condition Environmental target:Reduce CO2 emissions by 50% in 2027 (Baseline year: fiscal 2015/aligned with the SBT 1.5-degree Celsius target)
Our result of previous MTMP (from FY2022 to 2024) was as follows FY2022
FY2023
FY2024
FY2024
(Result)
(Result)
(Result)
(Target)
ROIC
4.7%
4.0%
3.4%
10% or over
Dividend payout ratio
89.9%
67.5%
94.3%
35% over
Reduction in CO₂ emissions (Scope1+2、Baseline year: fiscal 2015)
-14.2%
-20.8%
-28.4%
-25%
(NOTES) Figures for FY2024 out of the above CO2 emissions reductions are based on the totals as of the filing date.
② Medium- to Long-term Management Strategies Nabtesco is reviving profitability by executing Project 10 (Reviving Potential) and evolving our technology toward smart motion control (Evolving Excellence) to deliver the value of our products and services, ultimately achieving our long-term vision of becoming a "leaders in innovation for the future."
- Regain earning power and profitability by executing Project 10 Enhance profits through business growth, cost reduction, and optimization of fixed costs.
- Smart Motion Control Our core competence in component technology is evolving from "motion control" to "smart motion control," including electrification, integration and data solutions. This will create new value to address societal challenges in our business fields.
- Build a resilient corporate foundation Optimize our portfolio based on our vision (smart motion control) and profitability (ROIC) (NOTE) Forward-looking statements in this Annual Securities Report are based on information available to the Company as of the end of the fiscal year under review. Actual results may differ from these statements due to factors such as those listed in "3. Business and Other Risks."
―17―
(Translation) This document has been translated from the Japanese original for the convenience of overseas stakeholders. In the event of any discrepancy between this document and the Japanese original, the original shall prevail.
2 【Policies and Measures for Sustainability Management】 The Group identified the priority issues to be addressed for management as "Management Materiality," which is a part of Nabtesco’s value creation path, we will bring innovation and improve economic value, environmental value and societal value in the long-term, in pursuit of management that sustainably develops both society and our group. To promote value creation in the long term, we deem it important to "dynamically" change its management materiality according to changes in the business and management environments. We will regularly review our management materiality so as to respond to such changes in a nimble manner. We will steadily take action concerning each management materiality item to further enhance our management foundation. Forward-looking statements in this Annual Securities Report are based on information available to the Company as of the end of the fiscal year under review. Actual results may differ from these statements due to factors such as those listed in "3. Business and Other Risks." (1) Response to overall sustainability ① Governance To enhance our sustainability governance, our group dissolved our previous CSR Committee in 2023 to pave the way for its existence as the newly established CEO-directed Management Materiality Committee. Collaborating with other CEO-directed committees, the Committee oversees the setting of goals and KPIs for each management materiality item, along with their progress and management. The activities are deliberated and determined at the Management Committee and reported to the Board of Directors’ meeting to enhance the effectiveness of group-wide sustainability governance. <Structure to promote sustainability governance (As of January 1, 2025)>
―18―
(Translation) This document has been translated from the Japanese original for the convenience of overseas stakeholders. In the event of any discrepancy between this document and the Japanese original, the original shall prevail.
② Strategy ■Structure of Our Management Materiality Our management materiality is comprised of three pillars. By fostering financial and non-financial measures and striving to achieve economic value, environmental value and social value from long-term perspective, we will keep providing value to our stakeholders, maintaining profitable growth. For "Measures to improve our financial performance," we will work to consistently achieve our short-term revenue targets, ensure the efficient distribution of our managerial resources, and increase our capital efficiency for the promotion of ROIC-oriented management. For "Measures to enhance our management foundation," we have identified items that need reinforcement to more effectively contribute to society through our business activities. Consequently, we will implement intensive measures for activities related to ESG items, considering their connections to our profit and growth. Moreover, by implementing "Specific measures to achieve the long-term goals," we will strengthen our business activities, including social contributions, and thereby promote our long-term growth. ■Management Materiality Identification Process and Regular Reviewing Our group identifies management materiality by extracting social issues addressed through our business strategy and ESG items closely related to our business, analyzing their significance from the perspectives of impact on our company and stakeholders. In terms of their validity, we engage in deliberations with external experts, conduct reviews within the Management Materiality Committee and the Management Committee, and finalize decisions at the Board of Directors’ meeting. For management materiality, changes are made once a year to respond swiftly and appropriately to shifts in the business and societal requirements. Regardless of whether changes are made, the final decision is made once a year at the Board of Directors’ meeting. (Identification process) STEP1:Recognition of issues ・Based on social challenges from those addressed through our Group’s business strategy and ESG items closely related to our business, the social challenges within the social and business environments surrounding our Group are extracted. STEP2:Analysis of significance ・Based on the concept of double materiality, the significance of issues or challenges is analyzed from the perspectives of "impact on the Company" and "impact on stakeholders," with the results organized into keywords.
STEP3:Identification of materiality ・Opinions are exchanged with external experts. ・Materiality is identified after obtaining approval from the Board of Directors, following discussions in the Management Materiality Committee and the Management Committee. STEP4:Goal setting and monitoring ・Goals and action plans are set based on the priority level of the management materiality item. ・The status of efforts on the goals and action plans are continually monitored. STEP5:Regular revision ・Changes are made once a year according to changes in the business and societal requirements, expectations from stakeholders, and changes in the business strategies of our Group.
―19―
(Translation) This document has been translated from the Japanese original for the convenience of overseas stakeholders. In the event of any discrepancy between this document and the Japanese original, the original shall prevail.
In 2024, we re-evaluated the validity and significance of our recognition of issues and changed materiality items to incorporate the aspects of "Improve profitability and clarify innovation areas as required by the new Medium-Term Management Plan" and "Double materiality, a key societal requirement." [Measures to improve our financial performance] Given that the new Medium-Term Management Plan further promotes optimization of portfolio balance and ROIC improvement, this item has been integrated into "Promote ROIC management" [Measures to enhance our management foundation] This has been reorganized from an ESG perspective into the following categories: E: "Countermeasures for climate change" S: "Promote human capital management" and "Pursue safety, comfort and a sense of security" G: "Enhance corporate governance" and "Build a resilient corporate foundation" [Specific measures to achieve long-term targets] To indicate the directions and strategies of the new medium-term management plan more clearly, this has been revised to the following: "Meet social challenges through smart motion control," "Transform to innovative manufacturing with digital tranformation ," and "Enhance global management." In addition, for each management materiality item, sub-materiality and KPIs will be established to strengthen the progress management of various initiatives, thereby enhancing effectiveness.
―20―
(Translation) This document has been translated from the Japanese original for the convenience of overseas stakeholders. In the event of any discrepancy between this document and the Japanese original, the original shall prevail.
③ Risk Management ■Basic Approach to Risk Management With the aim of maintaining and enhancing corporate value, the Group manages risk by appropriately identifying various risks associated with our business activities and mitigating the damages and losses through appropriate crisis management if any risks materialize.
- We manage risk while paying attention to trends in financial conditions and business environments.
- We manage risk in accordance with the relevant laws and regulations and from the perspective of Nabtesco Group’s social responsibilities, while also striving to disclose information promptly to minimize the impact and losses attributable to incidents that have occurred.
- We validate concrete risk management processes after the occurrence of incidents and strive to prevent their recurrence. ■Risk Management Basic Policy We have systems in place to ensure that profits, losses, asset efficiency, quality and disasters, among other matters, are reported to the Board of Directors properly and in a timely manner with respect to the execution of duties. By leveraging these systems, we strive for the early identification of risks and the minimization of losses. With an eye on the sustainable enhancement of corporate value, we established the Risk Management Committee as an organization under the direct supervision of the CEO that is responsible mainly for deliberating important matters. The committee members are appointed by the CEO. In addition, the Chairperson of the Risk Management Committee (Managing Executive Officer) consults and coordinates with the members of the Management Materiality Committee, Quality & PL Committee and Environment, and Safety and Health Committee, as required, and provides reports at management meetings such as Executive Officers Committee attended by CEO and Board of Directors meetings regarding the risk management initiatives periodically (approximately twice a year). ■Risk Management Methods ・Risk Management The Risk Management Committee has been identifying serious risks related to the entire company based on the results of risk assessments made by the administrative departments, in-house companies and Group companies, discussing countermeasures for these risks, and also following up on the progress made for the implementation of the countermeasures. We also analyze the factors that have caused the risk to materialize in the past. Then we prioritize the risks to be addressed and check our tolerance for the risks, make plans to deal with them, discuss the plans, and implement them. Furthermore, specialized staff at head office departments, such as the internal control department, carry out audits on the operational risk management situation of our workplaces, give necessary and appropriate expert advice for operational improvements, and report the details to the Board of Directors to ensure the appropriate monitoring of the responses made to risks at each of the workplaces. To deal with risks, Nabtesco implements the following procedures: (1) risk analysis, (2) risk assessment, and (3) risk judgment. In risk analysis, we analyze the materiality of each risk based on its occurrence frequency (by five-grade evaluation) and level of impact (by four-grade evaluation). Based on the results gained from the risk analysis, we give the risk an overall score (by four-grade evaluation) and then specify the level of necessary countermeasures for the risk (also by four-grade evaluation)
―21―
(Translation) This document has been translated from the Japanese original for the convenience of overseas stakeholders. In the event of any discrepancy between this document and the Japanese original, the original shall prevail.
■Serious Risks and Countermeasures Every year, the Company assess the risks faced by the entire Group in Japan and in other countries to identify serious risks. Then, for the identified serious risks, each department in charge of risk formulates and implements countermeasures based on their expertise. The following are some of the serious risks that have been identified and the measures taken to address them. ※Other serious risks are described on "3. Business Risks."
Serious risk Overseas business Geopolitical developme risks nt
Environme Climate nt change
Risk priority *1 ★
★
Freq. Impact *2 *3
C
C
C
B
Effects on the Group
Risk tolerance *4
・Delay or suspension of procurement, business and service activities
・Collection of information in the local area Medium ・Distribution of suppliers to high ・Enhancement of the effectiveness of BCP
・Increase in costs caused by carbon tax regulations, etc. ・Physical damage caused by torrential rains, etc. ・Increasing customer requests for the reduction of GHG emissions
・Set long-term goals for SBT certification ・Utilize renewable energy Low to ・Implement environmental medium education ・Awareness raising activities regarding climate change risks for suppliers
・Suspension of business and service activities Workrelated accident
Product quality
Occupation al health and safety risk
Quality risk
★★
★★
A
C
C
B
Measures
・Increase in costs due to loss and damage compensation, etc. ・Lower brand value
Low
・We have established a safety and health management framework in each office and allocated a manager of safety and health as well as a person in charge of safety management ・Periodic health examinations are conducted twice a year ・Industrial doctors visit the workplace
Low
・Establish management rules ・Obtain quality management system certification at production sites ・Implement training
*1 Risk priority: Risks are prioritized based on the following criteria. ★★★ : Measures need to be implemented promptly. ★★ : Measures need to be implemented as appropriate. ★ : Measures need to be implemented on a continual basis. *2 Occurrence frequency: A (extremely high), B (high), C (medium), D (low), E (almost never occurs) *3 Degree of impact: A (extreme), B (large), C (medium), D (small) *4 Risk tolerance: The identified risks are categorized into the following risk tolerance levels. Low: Should not be tolerated. Medium: Should be tolerated as necessary, in consideration of the benefits and merits. High: Should be tolerated proactively for the creation of opportunities, while implementing countermeasures as necessary.
―22―
(Translation) This document has been translated from the Japanese original for the convenience of overseas stakeholders. In the event of any discrepancy between this document and the Japanese original, the original shall prevail.
■Emerging Risks For "emerging risks" caused by changes in the external environment and other factors, we conduct regular reviews to check and manage their impact on our business Emerging risks
Risks related to securing human resources (Risk of shortage of human resources in the manufacturing industry due to population decline)
Risks related to information security (Cyber attack risk)
The Group has identified the shortage of human resources in the machinery manufacturing industry due to Japan's declining and aging population as an emerging risk. The Group maintains a high market share in niche machine parts and components by hiring and training a wide range of talented individuals in Description manufacturing, development, sales, and other of risks specialized fields. The manufacture of Nabtesco's machine parts requires a high level of expertise in turning, machining, and assembly, and it takes time to become established and skilled in the field. These are the main factors that are increasing the risk of difficulties in securing and training sufficient human resources, most notably a young workforce.
Through its business activities, the Group may obtain the personal information and/or confidential information of its customers and business partners, and also possesses confidential business and technical information. However cyber-attacks against companies and public institutions are becoming more sophisticated worldwide, and we are required to respond to higher level of risk by strengthening our defense system and information leakage protection.
The human resource shortage in Japan is directly related to the shortage of personnel at our mother factories in Japan as well as the shortage of specialists to continue to develop our special technologies and inspect our products. From a Potential medium- to long-term perspective, this could impacts on reduce productivity and the pace of technological business innovation, leading to a decline in competitiveness, which could affect the Group's performance and financial position.
There is a risk that cyber-attacks, which are complex and spreading worldwide, may result in the leakage of the above information, destruction or falsification of important data, or shutdown of systems and other equipment. In addition, the Group produces products used in public infrastructure and by public institutions, such as those in the railroad vehicle equipment business, those in the aviation equipment business, and railroad station platform doors, which may have an impact that compromises public safety. We recognize that this risk may become apparent in the medium to long term if cyber attacks become more common.
Risk reduction measures
The Group actively hires foreign nationals and elderly employees (rehiring after retirement) not only because of the shortage of human resources but also from the perspective of diversity. In addition, we minimize the business impacts of risks by adopting the following two main measures. One is enhancement of our technical training program. All new hires in the engineering field undergo Basic Technical Training for three years. After that, they are assigned to divisions to learn more about specialized technologies as well as company-wide cross-functional technologies, which leads to innovation. The other is to promote the introduction of process innovation, which is a way to reduce labor by automating factory production lines through the use of AI. In addition, we aim to stabilize quality by automating product inspections and visual inspections by having AI memorize the work content, check items, and judgment criteria of skilled workers, and by layering in machine learning, regardless of who is doing the work.
―23―
To minimize the impacts of cyber attack risks, Nabtesco has taken the following measures.
- Information security incident response We have established standards for responding to information security incidents and have a dedicated incident response team (CSIRT). This CSIRT works both to prevent the spread of damage caused by incidents and to quickly restore operations. We also conduct incident response verifications at least twice a year.
- Maintenance of various basic management regulations The Nabtesco Group has established and manages various regulations, including the Basic Rules for Information Management, the Information Security Management Standards, and the Information Security Incident Response Standards.
- Information security education To raise awareness of information security, we conduct annual Information Security Training for all employees. In addition, new employees and midcareer hires are required to take information security training upon joining the company. The training content is updated annually to reflect the latest trends in information security in a timely manner.
(Translation) This document has been translated from the Japanese original for the convenience of overseas stakeholders. In the event of any discrepancy between this document and the Japanese original, the original shall prevail.
④ Indicators and Targets The targets, indicators, key activity results in FY2024 and plans for respective issues concerning "Enhancing our management foundation" with relation to the management materiality are shown below. <Targets, indicators, key activity results and plans concerning sustainability>
Environment (E)
■ESG items having a major impact on financial issues ES G Desirable Management Cat Direction/Major Targets for FY2024 (Extracts) Achievements in FY2024(Extracts) Materiality items ego Actions ry ・Achieve ・Reduce CO2 emissions by ・Reduced CO2 emissions by 28.4% relative medium-to 25% relative to 2015 in line to 2015 in line with the MTMP target*2 Countermeasures long-term CO2 with the MTMP target ・Launched operations of environmentfor Climate emissions ・Launch environment-friendly friendly leading-edge plants (the Hamamatsu Change and Tarui Plants) leading-edge plants (the reduction targets Hamamatsu and Tarui Plants) ・Promote ・Foster the use of the ・Implemented the intrapreneurship program environment-and intrapreneurship program (Phase II) and promoted the launch of safety- conscious (Phase II) and the in-house projects that were approved in Phase I design and company innovation system ・Continued fostering the use of the in-house Deliver Solutions development company innovation system ・Promote the intrapreneurship for Social activities of the venture units ・Obtained Innovation Endorsement ・Create new Challenges businesses and ・Create new businesses and certification for the vessel condition Through Business products that contribute to the monitoring system "Cassandra" products that contribute to the social challenges social challenges ・Deal with ・Promote sustainability audits ・Conducted sustainability audits of supply risks accumulative total of 117 companies to ・Foster sustainability posed by awareness-raising activities identify ESG risks faced by suppliers, suppliers propose remedial measures, and promote ・Support the acquisition of resilience certification corrective actions ・Help suppliers Build a Resilient solve ESG ・Supported accumulative total of 60 Supply Chain companies in the acquisition of resilience issues certification, with accumulative total of 41 ・Support suppliers in companies acquiring resilience certification BCP by the end of 2024 Society (S) Governance (G)
・Build a diversity-based management system Increase the ・Enhance Effectiveness of discussions on Our Management medium- to Entities long-term strategies at Board of Directors’ meetings.
・Increase the management efficiency of the Board of Directors ・Foster the deliberation of important issues (global strategies, technological strategies and others)
・Expanded opportunities for information gathering to enhance external directors’ understanding of the Company ・Deliberated on key issues at the Board of Directors’ meetings (global strategies, MTMP and others)
(NOTES) Figures for Fiscal Year 2024 out of the above CO2 emissions reductions are based on the totals as of the filing date.
―24―
(Translation) This document has been translated from the Japanese original for the convenience of overseas stakeholders. In the event of any discrepancy between this document and the Japanese original, the original shall prevail.
■ESG items that drive sustainability power ESG Categ ory
Management Materiality items
Environment( E)
Foster Environmental Management
Desirable Direction/Major Targets for FY2024 (Extracts) Achievements in FY2024(Extracts) Actions ・Efficient use of raw ・Waste/ Water/ Chemical substance management: ・Waste/Water: Lowered than the previous year per sales Lowered than the previous year per sales unit unit materials and waste ・Extend the impact assessment survey for ・Chemical substance: Failed to achieve the target of being reduction biodiversity to the value chain lower than the previous year per sales unit ・Conserve ・Extended the impact assessment survey for biodiversity biodiversity ・Advance quality and ・Achieve the product safety-related targets safety management ・Promote functional safety measures
Pursue Safety, Comfort and a Sense of Security
・Establish and put into practice the Group-wide safety standards ・Implement the Safety Model Workplace Improvement Program (at 8 sites in Japan and 5 sites outside Japan)
to the value chain ・Product safety-related targets -Targeted rate for the achievement of the plans to conduct product safety reviews: Result 100% -Targeted rate for the achievement of the plans to educate employees for product safety: Result 100% ・Provided support for obtaining functional safety standards ・Conducted initial implementation of Group-wide safety standards ・Implemented the Safety Model Workplace Improvement Program and conducted a reporting session
Society(S)
・Revise the personnel system for general ・Revised the personnel system for general employees and ・Shift to business put the personnel system for managers into practice to focused management employees, and put the personnel system for managers into practice and get it well-established ensure that it was well-established of human resources the implementation of measures, ・Executed initiatives to fulfill the human resources ・Promote diversity & ・Enhance monitoring of KPIs and indicators, and disclosure portfolio (DX, women, global, and seniors) inclusion/ Advance of information about human capital ・Planned and executed various initiatives based on key Enhance Human the management of priority items for human capital KPIs ・Implement activities to promote The Nabtesco Capital human rights Way ・Implemented activities to promote The Nabtesco Way Management ・Improve employee ・Set and work to achieve priorities for health ・Introduced "one-on-one" meetings across the entire engagement management Group and held engagement workshops ・Introduce "one-on-one" meetings across the entire Group and make use of the talent management system
・Certified as a "Health & Productivity Management Outstanding Organization (Certified KIH Outstanding Organization)"
Governance(G)
Promote ・Promote community ・Promote community investment in the areas of ・The company newly sponsored an organization the environment, education and welfare (sponsorship activities for the Japan Inclusive Football Engagement with investment Federation and others) Local Community ・Currently reviewing further delegation of authority ・Enhance corporate ・Revise the system for regulation of responsibilities and authority to speed up ・Provided education to ensure compliance with antigovernance decision-making monopoly laws in Europe and appropriately responded to risk ・Ensure the EU directive on the protection of whistle-blowers ・Provide education to ensure compliance with Ensure management and anti-monopoly laws in Europe and appropriately ・Enhanced the disclosure of non-financial information in Management compliance respond to the EU directive on the protection of the securities report and issued an integrated report Transparency ・Proactively engage whistle-blowers in dialogue with ・Enhance the disclosure of non-financial stakeholders information
Our Group has been reviewing its management materiality since FY2025. The latest activity goals are as follows: ESG Categ ory
Management Materiality items
Desirable Direction/Major Actions
Targets for FY2025 (Extracts)
Environm ent (E)
・Strengthen efforts toward decarbonization ・Reduce CO2 aligned with medium- to long-term targets (42% reduction compared
Countermeasures for Climate ・Strengthen efforts toward decarbonization to FY2015) Change ・Improve the accuracy of Scope 3 calculation data that involve the supply chain ・Ensure labor safety
Pursue Safety, Comfort and a ・Ensure safety of product and services Sense of Security Society (S)
Enhance Human Capital Management
Governance (G)
Enhance corporate governance
Build a resilient corporate structure
・Organizational culture that fosters innovation
・Implement product safety screening and employee training program ・Implement internal communication initiatives ・Plan and implement measures for the mobilization of internal human resources
・Align business strategy and human resources strategy
・Promotion of activities to ensure that the personnel system is well-established ・Plan and implement initiatives for human resources data visualization and utilization
・Ensure transparency of management ・Promote compliance
・Initiatives to achieve zero workplace accidents and zero major incidents
・Continue the effectiveness evaluation of the Board of Directors based on an analysis of self-assessments from each executive ・Conduct training and enhance collaboration with relevant locations to strengthen compliance
・Ensure business continuity
・Promote information security measures to strengthen cybersecurity
・Build a resilient supply chain
・Integrate Group development meetings with Group-wide intellectual property strategy discussions to promote intellectual property management with the aim of improving core competence (intellectual capital) ・Support suppliers in obtaining resilience certification
―25―
(Translation) This document has been translated from the Japanese original for the convenience of overseas stakeholders. In the event of any discrepancy between this document and the Japanese original, the original shall prevail.
(2) Disclosure in line with the recommendations made by the Task Force on Climate-related Financial Disclosures (TCFD) The Group expressed its support for the recommendations made by the Task Force on Climate-related Financial Disclosures (TCFD). Accordingly, we are fostering the disclosure of related information in line with the TCFD’s recommendations, including that about the progress made with our climate change-related measurers. ① Governance Nabtesco Corporation's Board of Directors determines and supervises our strategies, basic policies, and the execution of important operations by sharing information through reports on important issues. Regarding climate change, the director in charge of production innovation serves as supervisor and the director in charge of environmental security reports on the progress toward the CO2 emission reduction goal and the status of major environmental facility investments. Under the guidance and supervision by the Board of Directors, the President and CEO (hereinafter, "CEO") establishes Nabtesco Group’s environmental philosophy, environmental action guidelines, and long-term goals. At the Executive Officers Committee (composed of the CEO and executive officers), the director in charge of environmental security reports the status of CO2 emissions at internal companies and main group companies. If there is a gap between the current status and the goal, we identify the causes and take measures accordingly. If any item under discussion or report is deemed to affect our business, the CEO determines appropriate measures and reflects them in our business strategies. As a promoting organization under the direct control of the CEO that is involved in Environment, Safety, and Health (ESH) management, Nabtesco has established the ESH Committee with jurisdiction over the entire Nabtesco Group. The CEO appoints the chairperson and members of the ESH Committee from our officers, including members of the Board of Directors. The chairperson of the ESH Committee collects important information on the environment, safety, and health, including climate change-related risks and opportunities, from our companies and group companies. The chairperson also visits each site to carry out ESH audits and company-wide energy conservation meetings, etc. The ESH Committee uses the results of this monitoring to evaluate importance and deliberate measures for any issues deemed to be important Meeting
Climate change-related agenda
Major action (Environment): Reduction of environmental impact (CO2 emissions, twice a year) Board of Directors Reduction of environmental impact: CO2 emissions per unit of sales; energy conservation and meeting creation; development of environment-friendly products (four times a year) Introduction of major environmental equipment (as necessary) Meeting of Reduction of environmental impact executive officers CO2 emissions per unit of sales, energy conservation and energy creation (12 times a year) ESH Committee Reduction of environmental impact meeting CO2 emissions per unit of sales, energy conservation and energy creation (At least twice a year) ② Strategies In order to identify and manage the possible impact of climate change on our business activities, we are analyzing the risks and opportunities across the entire supply chain, including our business partners and customers, using multiple scenarios developed by external parties about temperature rises, including the "below 2 degrees Celsius" scenario. When the result of the audits by the ESH Committee shows that any issues (risks or opportunities) associated with climate change have an important effect on our business, they are reflected to our business strategies by the determination of the CEO. The Nabtesco Group identifies "Countermeasures for climate change" as one of the management materiality issues which is the important challenges for the achievement of our long-term vision. The Management Materiality Committee collaborates with the ESH committee and other relevant committees to regularly evaluate these issues. Activities are discussed and determined by the Management Committee and reported to the Board of Directors. In the future, the following risks are anticipated depending on requests from the market or customers: increase of carbon prices, increase of operating costs due to the purchase of electricity from renewable sources, increase of capital expenditures for the introduction of power generation equipment, etc. using renewable resources and the increase of R&D costs for energysaving product development. There are also physical risks such as business interruption due to damaged infrastructure or unstable electric power supply caused by wind or water disaster.On the other hand, the following opportunities are also expected: new business opportunities from the establishment of new laws and regulations (e.g. the energy-efficiency labeling system becoming obligatory) and the expansion of opportunities for the Maintenance, Repair, Overhaul (MRO) business, etc. due to a change in consumers' preferences for longer product lives to reduce CO2 emissions as their awareness of climate change increases. Going forward, Nabtesco Corporation will continue to strive to identify risks and opportunities associated with the environment and make efforts to take measures to address the risks and realize the opportunities, including the further promotion of energy conservation activities. ③ Risk Management The ESH Committee collects important information related to risks and opportunities associated with climate change from the companies and group companies and evaluates whether or not they have a significant impact on our business activities and discusses measures for issues that are determined to be important. They evaluate and prioritize possible amount of financial impact and probability or feasibility. The ESH Committee draws up and discusses the measures to address highly probable risks on a preferential basis, regardless of their impact. In addition to climate change, the ESH Committee evaluates waste, chemical substances, and employees' safety and health.
―26―
(Translation) This document has been translated from the Japanese original for the convenience of overseas stakeholders. In the event of any discrepancy between this document and the Japanese original, the original shall prevail.
<Measures taken in line with the TCFD’s recommendations: Results of risk assessment (Scenario we referred to: IEA450IEA NZE 2050/RCP2.6/RCP8.5)> ■Transition risk ▲:Risks ●:Opportunities Typ e
Climate
Impact
Business risk/Opportunity
change related assessm risk item Higher carbon tax rate
ent
Measures taken by Nabtesco (Medium-term)
(Short-term)
(Medium- to long-term)
Large
(Long-term)
▲Increase in energy & procurement costs
・Promote the use of renewable energy
●Differentiation by low-carbon products
• Introduce carbon pricing
●Better evaluation due to appropriate information
• Promote efficient replacement with substitute
disclosure
materials • Operate the energy-saving product
Regulatory
Regulation
▲Increase in energy
(energy
conservation cost
conservation
▲Increase in development cost to deal
▲Decrease in demand for old models
with regulations
Large ●Larger sales of
&
products with higher
low carbon)
fuel efficiency
due to new regulations
(Example: TRS segments and Others)
(Example: TRS segment)
●Increase in demand for products that
●Increase in demand for more
comply with the regulations
efficient new models
(Example: TRS segments and Others)
(Example: TRS segment)
certification system • Follow the guidelines on capital investment and energy conservation • Expand the lineup of products with higher fuel efficiency • Develop products for which new types of fuels can be used ・Invest in the development of technologies
Policies
▲Increase in cost to deal with
Large
and products
laws and regulations
• Strategically disclose climate change-related information
Technology
Replacement with lowcarbon
▲Increase in cost to acquire new element technology
Medium
▲Increase in cost due to the
●Entry into a new market by the development
diversification of needs
of new element technology
products
in development activities
Large
superior to those of competitors
(Example: CMP segment)
Large
Criticism against the industry
Medium
▲Negative reputation due to a delay in environmental measures ●Increase in sales of environmentally friendly products ●Better brand image due to the implementation of environmental measures
Market Market uncertainties
▲Increase in the operational cost due to RE100 measures ・Promote the use of renewable energy ●Better evaluation due to appropriate information disclosure
Reputation
■Physical risk e
development trends
●Higher competitiveness based on technologies
▲Increase in cost due to increased need to reduce CO2 emissions ●Increase in demand due to modal shift and electrification (Example: TRS segment)
Climate
companies in line with the regulatory and • Develop new mobility products
●Need for electrification
behavior
Typ
products and form partnerships with other
▲Lagging behind competitors
Changes in consumption
•Make technological investments, develop
・Promote the use of renewable energy • Strategically disclose climate change-related information
▲:Risks ●:Opportunities Impact
Business risk/Opportunity
change related assessm risk item
ent
Frequent occurrence of Acute
drought events
(Medium-term)
(Medium- to long-term)
▲Damage to infrastructure, suspension of operations
・Foster BCP
wind turbines)
system
▲Damage to infrastructure, suspension of operations Large ●Increase in need to establish water resource infrastructure (Example: CMP segment) ●Increase in demand for construction machinery for reconstruction activities (Example: CMP segment)
• Optimize the on-site assignment of employees • Use weather forecast services and take
emergency measures ▲Suspension of operations due to floods ●Increase in the need to ・Examine measures against storms and floods establish water resource with suppliers infrastructure (Example: • Increase resilience of the electricity system CMP segment) ▲Increase in air-conditioning • Review the location of bases and capital investment costs • Reuse water and review the water circulation ▲Increase in electricity costs system due to lower power • Use weather forecast services and take generation efficiency emergency measures ●Increase in the need for higher efficiency at plants (Example: CMP segment)
Large
patterns Chronic
Rise in average
• Procure components from multiple suppliers • Increase the resilience of the electricity
Changes in precipitation
(Long-term)
Large ●Increase in need to increase the resilience of power infrastructure (Example: CMFS equipment for
typhoons Heavy rain/
Measures taken by Nabtesco (Short-term)
Large
temperatures
(NOTE) As for impact, we classified the size into "Large," "Medium" and "Small" based on the frequency of occurrence and financial impact. Frequency of occurrence: Occurs frequently/Has occurred/May occur/May not occur/Will never occur Financial impact: Serious (¥5 billion or more)/Large (¥2.5 billion to ¥5 billion)/Medium (¥500 million to ¥2.5 billion)/Minor (¥100 million to ¥500 million)/Very minor (Less than ¥100 million)
―27―
(Translation) This document has been translated from the Japanese original for the convenience of overseas stakeholders. In the event of any discrepancy between this document and the Japanese original, the original shall prevail.
④ Indicators and Goals The Nabtesco Group are aiming to reduce CO2 global emissions from the entire Nabtesco Group by 63% as of FY2030 and by 100% as of FY2050 compared to FY2015 levels. This target has been approved by the SBT Initiative. By Fiscal Year 2023, we achieved a cumulative reduction of 28.4%, and the Group are steadily reducing emissions at a pace in line with our target. In addition, the group are expanding activities from the company alone to our suppliers as well. Of the greenhouse gas emissions from the entire supply chain, the percentage of emissions from purchased goods and services (category 1 of Scope 3 emissions) is high, making it essential for our suppliers to take initiatives to reduce their greenhouse gas emissions. In response, we conduct a survey of our main suppliers (the top suppliers constituting 70% of annual purchases) to see if they have set voluntary targets to reduce their greenhouse gas emissions. As of FY2023, 72% of our main suppliers have set voluntary targets to reduce their greenhouse gas emissions and begun to take initiatives to achieve these targets. We will provide support so that all of our main suppliers set voluntary reduction targets by 2025. <Long-term emissions reduction targets (aligned with the 1.5 degrees Celsius scenario/Scope1+2)> FY2015 (Baseline year)
FY2030 (Down 63%)
FY2050 (Down 100%)
54,803
20,277
0
Global emissions (t-CO₂) <CO2 Emission Reduction Result CO2 (t-CO₂) FY2020
FY2021
FY2022
FY2023
FY2024
Direct emissions (Scope 1)
4,491
4,061
3,893
4,929
4,202
Indirect emissions through the use of electricity and others (Scope 2)
48,073
41,021
43,140
38,495
35,060
(NOTES)1 Figures for FY2024 out of the above emissions are current totals as of the filling date, and figures obtained from thirdparty guarantees will be disclosed on our website. 2 The calculation scope includes Nabtesco Corporation, and major Japanese and overseas consolidated subsidiaries. 3 The calculation policy and standards comply with the Act on the Regional Use of Energy and the Act on the Promotion of Global Warming Countermeasures, and are aligned with the internal Guidelines on the Management of Environmental Information.
<Emissions from the supply chain (Scope 3) FY2023 Results (NOTE)1, 2> Category
Emissions (t-CO2)
Rate (%)
1
Purchased goods and services
856,494
79.68%
2
Capital goods
30,922
2.88%
6,445
0.60%
154,878
14.41%
3 4
Fuel- and energy-related activities Upstream transportation and distribution
Remarks
5
Waste generated in operations
1,101
0.10%
6
Business travel
5,442
0.51%
7
Employee commuting
1,695
0.16%
8
Upstream leased assets
-
-
9
Downstream transportation and distribution
-
-
10
Processing of sold products
-
-
11
Use of sold products
170,061
1.58%
12
End-of life treatment of sold products
924
0.09%
13
Downstream leased assets
-
-
N/A (No corresponding leased assets)
14
Franchises
-
-
N/A (No corresponding franchises)
15
Investments
-
-
N/A (No corresponding investments)
Total
1,074,907
N/A (No corresponding leased assets) N/A (Completed products transported on consignment are included in Category 4) N/A (Nabtesco products are completed products and not processed after being sold)
100%
(NOTES) 1 As the results for FY2024 are being compiled, information on the results for FY2023 is presented. 2 The Scope 3 calculations for FY2023 were made by the following method and for the following period and scope. :Calculation method: As shown in the basic guidelines on the calculation of greenhouse gas emissions from supply chains set by the Ministry of the Environment and the Ministry of Economy, Trade and Industry :Targeted period: January 1 to December 31, 2023
―28―
(Translation) This document has been translated from the Japanese original for the convenience of overseas stakeholders. In the event of any discrepancy between this document and the Japanese original, the original shall prevail.
(3) Enhance Human Capital Management Under the slogan, "Leaders in Innovation," as upheld in its long-term vision, the Nabtesco group has been striving to increase its corporate value, with a focus on meeting customer needs and exceeding the expectations of both customers and society alike. This effort carries on a long tradition dating back not only to the Company’s founding but also to the aims of its two predecessor companies prior to their integration. Toward this goal, we are striving to enhance both our financial impact and social impact by boosting our performance and contributing to the solution of social challenges. To this end, we need to enhance our existing businesses while also searching for new businesses, as proposed in the theory of organizational ambidexterity. To meet this requirement, we must foster reforms for the various categories of capital that provide us with a foundation for innovation. In particular, human capital is essential for our value creation process, and the group accordingly aims to manage and optimize its human capital toward becoming "Leaders in Innovation." In order to "meet" the expectations of customers, we need personnel who are strongly committed to meeting the needs of customers through unyielding technological innovation, performance & quality improvement and higher productivity. To take the next step of then exceeding the expectations of customers and society, we need to develop and attract personnel who can expand our existing business domains and launch new businesses to create and propose expectation-exceeding value. As an organization, we also need to gain the ability to respond agilely to changes in our business environment. To this end, managers are required to play important roles to encourage individual employees to take actions autonomously and independently and to serve as an intermediary to foster not only traditional top-down measures taken under the leadership of top management but also bottom-up measures taken at the initiative of general employees. Our group’s human capital management is thus based on measures promoted by the three actors: top management, middle managers, and individual employees. The group will proactively make investments to support these three actors in fulfilling their respective roles and will strongly repeat the cycle of meeting and exceeding the expectations of customers and society toward the achievement of its long-term vision.
―29―
(Translation) This document has been translated from the Japanese original for the convenience of overseas stakeholders. In the event of any discrepancy between this document and the Japanese original, the original shall prevail.
①
Vision for Human Capital Management The group believes that the creation of new value will be promoted by the fulfillment of defined roles by the company & top management, organizations & managers, and individual employees. Based on this recognition, we have set a vision for each of the above for the optimization of human capital.
The role of the company & top management is to create a situation & environment that allows for Action. The role of organizations & managers is to inspire individuals to find seeds for Action. The role of individual employees is to sprout those seeds for "Innovation in Action." The group upholds this vision for its human capital management.
―30―
(Translation) This document has been translated from the Japanese original for the convenience of overseas stakeholders. In the event of any discrepancy between this document and the Japanese original, the original shall prevail.
② Gaps between Reality and Vision: Identification of Issues The group regularly conducts an employee engagement & organizational diagnosis survey to grasp employees’ subjective ideas based on their Engagement Scores (ES) and clarify the present situation from the viewpoint of individuals and organizational culture. When designing the questionnaire for organizational diagnosis, we first set "innovation items" that are thought to be highly related to challenges, co-creation, learning and creativity—elements that help foster innovation. We then classified the questions into those related to individuals (individuals’ indicators) and those related to the organization (organizational indicators). For these two types of indicators, we analyzed the survey results with a focus on correlations between the sufficiency rating given to each of the question items, including both innovation items and others, and the item’s connection to innovation. The graph shown below indicates the level of each item’s connection to innovation (horizontal axis) and its sufficiency rating (vertical axis).The items shown on the lower right side of the two graphs are items that are strongly connected to innovation but for which the sufficiency rating is low. As for individuals, the survey results imply that a driving force for innovation would be individual employees feeling satisfied with their jobs and able to feel a sense of achievement and selfgrowth. For the organizational indicators set for the company & top management and for organizations & managers, the key items are "Outlook for the achievement of targets," "Identification of social changes by the company ahead of others" and "Creation of a culture of embracing challenges" for the former and are "Solution of issues across the departments" and "Development of the next generation of leaders" for the latter. Based on the survey results, we have formulated the following hypothesis: To become "Leaders in Innovation," it is essential for Nabtesco to focus more on these key items to promote measures gathering the "company & top management," "organizations & managers" and "individuals" to narrow the gap.
―31―
(Translation) This document has been translated from the Japanese original for the convenience of overseas stakeholders. In the event of any discrepancy between this document and the Japanese original, the original shall prevail.
③ Indicators and Goals In order to narrow the gap as described on the previous page, we have set indexes for innovation, linkage and engagement as indicators to realize the vision set for each of the three actors, which is the "company & top management," "organizations & managers" and "individuals." These three indicators are set based on the results of the organizational diagnosis and the engagement scores, and we have also set the third quartile value for FY2022 as the immediate target for each indicator. The innovation index is an indicator intended for the creation of the situation & environment that allows for Action. We will further instill The Nabtesco Way across the board and enhance our human resources portfolio to encourage both organizations and individuals to take actions toward their shared goal for innovation. The linkage index is an indicator designed to enhance support for individual employees through the establishment and improvement of the personnel assignment, education and evaluation systems and new business creation systems toward encouraging employees to take actions to "meet" and "exceed" our customers’ expectations, being inspired to find seeds for Action. The engagement index is an indicator intended to encourage individuals to sprout seeds for "My Innovation in Action" by implementing The Nabtesco Way with ownership, developing their careers in an autonomous manner, and by fostering reskilling to develop an innovation mindset. We will sophisticate our human capital management by adjusting the KPIs on human capital in line with changes in related issues, while monitoring progress made with the implementation strategies and for each of the indicators. <Key performance indicators (KPIs) for human capital> [Company & top management] [Organizations & managers] Innovation index Linkage index
[Individuals] Engagement index
(NOTES) 1. As the results for FY2024 are being compiled, information on the results for FY2023 is presented. 2. The figures for FY2022 have been retrospectively adjusted as a result of using divisional averages to align both data for the aggregation of organizational audits and engagement surveys. In conjunction with this revision, the target for human capital KPI has also been retroactively revised to the third quartile figure for FY2022.
[Company & top management]Innovation index Systematic measures to improve the Innovation Index
―32―
(Translation) This document has been translated from the Japanese original for the convenience of overseas stakeholders. In the event of any discrepancy between this document and the Japanese original, the original shall prevail.
[Organizations & managers] Linkage index Systematic measures to improve the Linkage Index
[Individuals] Engagement index Systematic measures to improve the Engagement Index
―33―
(Translation) This document has been translated from the Japanese original for the convenience of overseas stakeholders. In the event of any discrepancy between this document and the Japanese original, the original shall prevail.
(4) Intellectual Property Management Strategies to Lead Sustainable Innovation Creation The Nabtesco Group has positioned its intellectual property as a core value generating competitiveness in the pursuit of sustainable growth and expansion in business for all of its stakeholders, including customers and partner companies. It seeks to bolster corporate value by developing its Intellectual Property Management Strategy, which focuses on protecting and enhancing competitive advantages, across the Group. Nabtesco’s Core Competence entails not only so-called core competence (core strengths) but also the technologies, etc. necessary to provide value to customers, even those owned by competitors. Since we cannot provide value to customers with core competence alone, we refer to a broader scope which includes intellectual properties and intangible assets that cover not only intellectual property rights such as patents, but also know-how, transaction records, and supply chains. We also determine the core competence we currently hold (current core competence) and the core competence we will need in the future (future core competence) for each business. In addition, current and future core competences are visualized and shared in a company-wide perspective (functions and objectives). <Nabtesco‘s Core Competence>
―34―
(Translation) This document has been translated from the Japanese original for the convenience of overseas stakeholders. In the event of any discrepancy between this document and the Japanese original, the original shall prevail.
①
Governance We have the Group Intellectual Property Strategy Committee comprising Nabtesco’s CEO and executives, which meets once a year to discuss and deliberate on the basic policies for group wide intellectual property strategies. In line with the policies set by the Committee, the Company Intellectual Property Strategy Committee, which is established by each of the in-house companies and Group companies, meets twice a year to discuss and deliberate on the company’s own intellectual property strategies. This Committee is composed of the in-house/Group company’s executives, including the in-house company president, who serves as chairperson of the Committee. Moreover, we have the Nabtesco Intellectual Property Strategy Subcommittee, which meets also twice a year to share information about the activities of the Company Intellectual Property Strategy Committees and intellectual property related issues faced commonly by the in-house and Group companies. This Subcommittee is composed of the heads of the administrative departments and representatives of the in-house and Group companies and is chaired by the head of the Technology and R&D Division. What the Subcommittee discussed at its meetings is reported to the Group Intellectual Property Strategy Committee in the form of a proposal about the strategies to be deliberated by the Committee, and the deliberation results are referred to when the Committee sets the basic policies on group wide intellectual property strategies for the next year. As described above, the activities of the Group Intellectual Property Strategy Committee, the Company Intellectual Strategy Committees and the Nabtesco Intellectual Property Strategy Subcommittee are organically linked for the spiral development of their activities. Moreover, since 2022, the basic policies on group wide intellectual property strategies have been annually reported to and checked by the Board of Directors. As for the intellectual property strategies for individual businesses, reports are made to and the details are checked by the Board of Directors as necessary. Since 2024, we have integrated our intellectual property and technology strategies and conducted a partial review of our councils to discuss and deliberate on the entire company roadmap. In 2025, we plan to review the meetings to discuss not only the internal company level but also the Group level, integrating intellectual property and technology strategies.
―35―
(Translation) This document has been translated from the Japanese original for the convenience of overseas stakeholders. In the event of any discrepancy between this document and the Japanese original, the original shall prevail.
② Strategies ■Creation of New Businesses through IP Landscape Analysis The Nabtesco Group is working to enhance its core value and acquire new value by searching for new market/customer needs by the effective use of IP landscape analysis. Regarding the equipment and systems for which the Group’s products and services are adopted, we globally collect information available in the public domain, including patent and other intellectual property information, as well as information available from papers, magazines and other companies, in order to conduct macro analyses of the related technologies, market trends and customer needs. Based on the analysis results, we search for new business themes and new market/customer needs, verify our development themes, and also search for open innovation partners in our effort to set our future business policies and promote discussion across internal organizations, such as in-house companies, about collaboration with other companies. ■Management of Core Technological Information and Strategy to Acquire Intellectual Property Rights The Nabtesco Group’s competitive advantages, which provide us with core value (intellectual properties and intangible assets), include not only invention but also deep relationships of trust with customers, successful branding in the market, ideas for products and services, design and manufacturing know-how, its supply chain and human resources. For the core value that we can keep confidential, we impose strict management controls to protect them as confidential technological information, while for technologies that we cannot keep confidential because we sell them, we protect them based on our strategy to acquire intellectual property rights proactively. We will protect our existing and future intellectual properties as our core value through the management of core technological information and the strategy to acquire intellectual property rights, thereby continuing to enhance the Nabtesco Group’s core competency regarding intellectual property, in turn, increasing our corporate value.
●Intellectual property strategies for acquiring and strengthening core value
―36―
(Translation) This document has been translated from the Japanese original for the convenience of overseas stakeholders. In the event of any discrepancy between this document and the Japanese original, the original shall prevail.
③ Risk Management ■Confidential Information Management and Strategy to Acquire Intellectual Property Rights The Nabtesco Group identifies its core value as a source of competitiveness. The Group’s core value includes the unwavering trust of customers, brand perception established in the marketplace and technological as well as design/manufacturing ideas and know-how related to products and services provided. These core value elements, including a number of patents, designs, trademarks and marketing intelligence, are protected by safeguards for intellectual assets. As for created core competence (intellectual properties and intangible assets), we impose strict management controls to protect it as core technological information (confidential information) in principle. As part of our efforts to manage core technological information, we provide information management education to all officers and employees (including temporary staff) every year and ensure to collect evidences that can be valid in trials in Japan and overseas. In addition, we endeavor to maintain the management system in collaboration with the Business Auditing Department. Meanwhile, for technological core competence that cannot be kept confidential because we disclose it in our business activities such as product sales, we protect it based on our strategy to acquire intellectual property rights by building an intellectual property network. As of the end of 2024, we have built the intellectual property portfolio comprising a number of patents, utility models, and designs (including those under application) (approx. 2,400 cases in Japan, approx. 1,600 cases in Asia, approx. 1,150 cases in Europe, and approx.. 500 cases in the Americas). We will protect our current core competence as well as our future core competence which is yet to be created through the management of core technological information and the strategy to acquire intellectual property rights, thereby continuing to enhance the Nabtesco group’s comprehensive ability regarding intellectual properties and intangible assets and increase our corporate value.
■Execution of Intellectual Property Clearance Since Nabtesco Group considers protecting customer’s business and products as an essential factor, Group conducts intellectual property clearance as a part of the commercialization process, making it essential to protect customers’ businesses and products. More specifically, it undertakes activities during the commercialization process, including those related to core technology information management, the acquisition of intellectual property rights, protection against the infringement of intellectual property right by other companies, compliance with technological agreements, anticounterfeiting, and the protection of trademarks or copyrights. We have conducted intellectual property clearance for more than 160 products and services since 2018. ■Elimination of Counterfeits In order to ensure that customers who trust Nabtesco’s brand and purchase its products do not suffer any damage, the Nabtesco Group has a policy of thoroughly eliminating counterfeits of its brands, even if it incurs costs. In addition to information from in-house companies and Group companies within and outside Japan, we visit exhibitions and monitor the status of listings on EC sites and corporate websites on a regular basis, and periodically monitor companies that stopped infringing on our products after warning them in the past in an effort to detect any counterfeits as soon as possible. As a result, we have provided more than 360 infringement warnings since 2018.
―37―
(Translation) This document has been translated from the Japanese original for the convenience of overseas stakeholders. In the event of any discrepancy between this document and the Japanese original, the original shall prevail.
④ Indicators and Goals ■Adding Intellectual Property Creation to the Criteria for Performance Evaluation Since 2017, we have systematized the Intellectual Property Strategy activities to acquire and reinforce our core competence (intellectual properties and intangible assets) by adding Intellectual Property Creation to the criteria for evaluating the performance of in-house companies and Group companies. Each of the in-house and Group companies is now obliged to develop Intellectual Property Strategy activities as business plans for each fiscal year, as set forth in the Medium-Term Business Plan of each in-house company and Group companies, and to implement them accordingly. Furthermore, the Nabtesco Group strives to develop a corporate culture facilitating the creation of new businesses, ideas about new technologies, and design/manufacturing know-how among all engineers. To this end, employees are encouraged to be proactive as part of an evaluation target for business performance of respective in-house companies. In an attempt to motivate individual employees to become more innovative, Nabtesco gives awards to engineers with spectacular innovations which contribute our business (a total of 234 engineers have been awarded until 2024), to honor their achievements at a ceremony for the corporate foundation anniversary. As a result of these activities, the number of notifications on intellectual property creation related to inventions, designs and know-how has seen consistent growth, as indicated by the following chart: Because the number of notifications on intellectual property creation through past efforts, the company will set different actions and targets to improve not only quantitiy but also quality. <Number of notifications on intellectual property creation>
■Measures to Promote Innovation through Intellectual Exploration As part of efforts to stimulate innovation through so-called intellectual exploration, we have been promoting activities to increase diversity of intellectual property creators since 2022. The ratio of inventors has been set as an indicator for such activities. The ratio of inventors is the ratio of actual number of inventors who notified intellectual property creation to the total number of our engineers including not only those engaging in development but also production engineers. The ratio, which is calculated in each financial year, indicates whether diversity is maintained and improved on a continuous basis. In addition, we will strive to promote innovation as a unified team across the company based on the system for intellectual property creation supporters, such as sales representatives who have identified new market needs and brought about innovation. <Ratio of inventors (including know-how and design inventors)>
―38―
(Translation) This document has been translated from the Japanese original for the convenience of overseas stakeholders. In the event of any discrepancy between this document and the Japanese original, the original shall prevail.
3 【Business and Other Risks】 Principal risks relevant to the business and accounting status of the Group described in the Annual Securities Report and deemed significant are as follows. If such risks materialize, they may affect our group's performance and financial position. Note that the risks regarding future contents included in the matters described below were based on the judgment of the Company as of the end of the current consolidated fiscal year. (1) Risks relevant to the economy and markets The Group's businesses are directly or indirectly related to a number of industries, including automobile, construction machinery, railroad, construction and industrial machinery and so on, in Japan and overseas. Market fluctuations and trends in capital expenditure in these industries may affect the operating results and financial position of the Group. (2) Risks relevant to overseas operations In pursuit of further growth and profitability, the Group actively conducts business mainly in Asia, North America and Europe. Therefore, the Group is subject not only to economic and market risks but also to political turmoil and unforeseeable amendments to laws and regulations in various countries, which may affect the markets for particular products. Such events are likely to impact operating results of the Group. (3) Risks relevant to large-scale disasters With the aim of minimizing damage and loss arising from disasters such as earthquakes, typhoons, floods and pandemics, terrorism, war, and other social disruptions, the Group has implemented the formulation of a business continuity plan, establishment of personnel crisis response rules along with the establishment of an emergency contact system, and has also conducted drills. However, the occurrence of human and material damage, stagnation in material procurement, and disruption of logistics networks due to such disasters may affect the Group's business performance and financial position. Furthermore, there is no guarantee that damage caused by these disasters will be fully covered by property and/or other insurance. (4) Risks relevant to exchange rate fluctuations The Group's overseas sales have been increasing every year. The Group also relies on imports of raw materials from overseas and, though it hedges its risks in foreign currency-denominated transactions through forward-exchange contracts, the Group's business performance and financial position is nonetheless affected by exchange rate fluctuations. The performance of overseas subsidiaries is also impacted by exchange rate fluctuations when converting to Japanese yen. (5) Risks relevant to procurement The Group ensures stable procurement by purchasing raw materials and components from multiple sources. However, if the prices of raw materials surge, or the supply of certain components becomes disrupted and alternate suppliers cannot be found, the Group’s business performance and financial position may be affected by lower profit margins on products or by opportunity loss. (6) Risks relevant to product quality The Group manufactures a full lineup of products in line with carefully designed quality control standards to prevent defects. However, in case of significant product defects leading to a recall or product liability issues occurring, the potentially massive costs arising from such a situation could adversely impact the Group's business performance and financial position. (7) Risks relevant to competition The Group has a wide lineup of products with high market shares in the domestic and overseas markets and develop cost competitive differentiated products that meet the needs of our customer. If the market shares of its products were to fall due to the delays in the development of new products or the development of new products by other companies, the Group's business performance and financial position could be adversely impacted.
―39―
(Translation) This document has been translated from the Japanese original for the convenience of overseas stakeholders. In the event of any discrepancy between this document and the Japanese original, the original shall prevail.
(8) Risks relevant to information security The Group obtains personal information and confidential information of its customers and trading partners through business activities, and holds confidential information of its business and technologies. The Group implements the enhancement of control systems and employee education for the management of such information, and takes appropriate security measures, including both the hardware and software of information systems. However, in the event of a leakage of information, or destruction or falsification of important data, or system halt due to the unexpected levels of cyber attacks, unauthorized access, or intrusion of computer viruses, etc., the Group’s credibility could suffer or its business performance and financial position could be adversely impacted. (9) Risks relevant to intellectual property The Group protects internally developed technologies under intellectual property rights, including patents, and holds such intellectual property rights under strict management, while paying close attention not to infringe the intellectual property rights of third parties. If, however, a third party infringes the intellectual property rights of the Group, or the Group faces any infringement alleged by a third party, the Group’s business performance and financial position could be adversely affected. (10) Risks relevant to laws, ordinances and regulations The Group operates its businesses globally, and is subject to the laws and regulations of the relevant countries and regions. In addition to thorough compliance with laws and regulations relating to its businesses, the Company has established a Code of Corporate Ethics of an even higher standard to reinforce its compliance system. Despite these intense efforts, however, it is impossible to completely eliminate risks concerning compliance, including individual illegal acts. In case of a material violation against laws and regulations, the Group’s business performance and financial position could be adversely affected. (11) Risks relevant to environment Recognizing the impacts of business activities on the global environment, the Group exerts efforts to improve energy efficiency, save resources, reduce hazardous substances and raise recycling efficiency in planning, developing, and designing its products. Furthermore, in manufacturing, selling, and distributing products, and providing services, the Group strives to cut down environmental burdens by positively introducing and applying advanced environmental technologies in pursuit of the reduction of CO2 emissions, effective use of resources, and challenges to zero emission. However, in the case of environmental pollution caused by the Group’s business activities, the Group’s business performance and financial position could be adversely affected due to decontamination costs and compensation for damage, etc. and the loss of credibility. (12) Risks relevant to company acquisitions The Group seeks to enhance the production system for its products in Japan and overseas, its sales and service systems, and its technology platform through company acquisitions. During the consideration phase of a company acquisition, the Company conducts due diligence on the target company and verifies the operations of the target company after the acquisition. However, if the effects that were expected at the time of the acquisition cannot be gained in the future, the Group’s business performance and financial position may be affected. . (13) Risks relevant to impairment of non-current assets The Group owns non-current assets, goodwill and intangible assets. In the event that profitability drops due to rapid changes in the business environment or other circumstances, and it is deemed that sufficient cash flows cannot be generated, the Group’s business performance and financial position may be affected due to the recording of an impairment loss on the relevant assets. (14) Risks relevant to recruiting human resources The Group seeks to promote global business activities and maintain and improve its competitiveness by recruiting and developing a broad range of human resources with competence in manufacturing, development, sales and other specialized fields. However, failure to recruit and develop a sufficient number of personnel due to intensified competition over human resources and the retirement of employees may lead to a drop in competitiveness, affecting the Group’s business performance and financial position.
―40―
(Translation) This document has been translated from the Japanese original for the convenience of overseas stakeholders. In the event of any discrepancy between this document and the Japanese original, the original shall prevail.
4 【Management’s Analysis of Financial Condition, Results of Operations and Cash Flows】 (1) Summary of Business Results and Others ① Operating Results During the consolidated fiscal year under review, showed favorable demand for automatic door and the effects of exchange rates, as well as strong demand in aircraft equipment and marine vessels equipment. Meanwhile, in precision reduction gears, a global decline in automotive related capital expenditures and demand for construction machinery in hydraulic equipment declined. As a result, the Group’s consolidated net sales came to ¥323,384 million. Operating income was ¥15,012 million due to the decrease in sales in component solutions business, despite the increase in operating income resulting from the increase in sales in transport solutions and accessibility solutions businesses. Income before taxes was ¥16,184 million and net income attributable to owners of the parent was ¥10,188 million.
Net sales Current consolidated fiscal year (ended December 31, 2024) Previous fiscal year (ended December 31, 2023) YoY change (%)
Operating income
Income before income taxes
(Million yen) Profit attributable to the owners of the parent
323,384
15,012
16,184
10,188
333,367
16,660
25,316
14,226
-3.0
-9.9
-36.1
-28.4
The following is an overview of the business results by segment for the fiscal year under review. [Net Sales] Current consolidated fiscal Previous fiscal year year (ended December 31, 2023) (ended December 31, 2024)
(Million yen) YoY change (%)
Component Solutions Business
138,089
110,571
-19.9
Transport Solutions Business
80,787
88,727
9.8
Accessibility Solutions Business
96,011
106,771
11.2
Others
18,480
17,315
Total
333,367
323,384
-6.3
-3.0
[Operating income] Current consolidated fiscal year (ended December 31, 2023) (ended December 31, 2024) Previous fiscal year
(Million yen) YoY change (%)
Component Solutions Business
10,376
4,523
-56.4
Transport Solutions Business
7,828
12,389
58.3
Accessibility Solutions Business
5,451
9,340
71.3
Others
3,385
1,043
-69.2
Corporate or elimination
-10,380
-12,282
Total
16,660
15,012
―41―
-9.9
(Translation) This document has been translated from the Japanese original for the convenience of overseas stakeholders. In the event of any discrepancy between this document and the Japanese original, the original shall prevail.
② Financial Position
Assets Liabilities
End of previous fiscal year (as of December 31, 2023) 428,630 150,485
End of current fiscal year (as of December 31, 2024) 449,845 160,101
278,145
289,744
Equity
(Million yen) YoY change 21,215 9,616 11,599
(Assets) Total assets as of December 31, 2024 were ¥449,845 million, an increase of ¥21,215 million from December 31, 2023, consisting of ¥228,970 million in current assets and ¥220,875 million in non-current assets. The main contributing positive factors were an increase of ¥6,766 million in trade receivables, an increase of ¥2,304 million in inventories, an increase of ¥6,814 million in tangible fixed assets, and an increase of ¥3,214 million in right of use assets. The key contributing negative factor was a decrease of ¥3,359 million in cash and cash equivalents. (Liabilities) Total liabilities as of December 31, 2024 were ¥160,101 million, an increase of ¥9,616 million from December 31, 2023, reflecting ¥117,111 million in current liabilities and ¥42,990 million in non-current liabilities. The key contributing positive factors were an increase of ¥10,312 million in borrowings, an increase of ¥439 million in contractual liabilities, an increase of ¥3,094 million in lease liabilities and an increase of ¥2,695 million in other non-current liabilities. The main contributing negative factors was a decrease of ¥7,362 million in other payables. (Equity) Total equity as of December 31, 2024 stood at ¥289,744 million. Equity attributable to owners of the parent was ¥272,559 million, an increase of ¥9,838 million from December 31, 2023. The key contributing positive factors were an increase in net income attributable to owners of the parent of ¥10,188 million and an increase of ¥6,768 million in other capital caused by factors such as exchange differences on foreign operations. Meanwhile, the main contributing negative factor was a decrease of ¥9,651 million in retained earnings due to dividend payment. As a result of the above, the ratio of equity attributable to owners of the parent was 60.6% and equity attributable to owners of the parent per share was ¥2,268.84. (2) Cash Flow
(Million yen) Previous fiscal year (ended December 31, 2023)
Current consolidated fiscal year (ended December 31, 2024)
Cash flows from operating activities
11,177
26,650
Cash flows from investing activities
-46,295
-28,733
Free cash flow
-35,118
-2,083
Cash flows from financing activities
-13,482
-4,137
Cash and cash equivalents (hereinafter, "cash") on a consolidated basis as of December 31, 2024 totaled at ¥74,476 million, a decrease of ¥3,359 million from December 31, 2023 as cash gained from operating activities and long term borrowings was mainly appropriated to capital expenditure and dividend payments. [Cash flows from operating activities] Net cash generated from operating activities for the fiscal year ended December 31, 2024 totaled ¥26,650 million. The main positive factors included increases in net income, depreciation and amortization. Meanwhile, the main negative factors were an increase in trade receivables and the payment of income taxes. [Cash flows from investing activities] Net cash used in investing activities for the fiscal year ended December 31, 2024 amounted to ¥28,733 million. The main factor for decrease was payments for the purchase of property, plant, and equipment. [Cash flows from financing activities] Net cash used in financing activities for the fiscal year ended December 31, 2024 under review was ¥4,137 million. The main factor for increase was proceeds from long-term borrowings. The main factor for decrease was dividend payments.
―42―
(Translation) This document has been translated from the Japanese original for the convenience of overseas stakeholders. In the event of any discrepancy between this document and the Japanese original, the original shall prevail.
(3) Status of production, orders and sales ① Production Results Production results by segment for the fiscal year under review are as follows: Segment name
Production (Million yen)
YoY change (%)
Component Solutions Business
111,372
-18.8
Transport Solutions Business
91,459
11.8
Accessibility Solutions Business
107,877
12.1
Others
16,776
-9.6
327,483
-1.9
Total (NOTE) The above amounts are figures after elimination of intersegment transactions.
② Orders Received The results of orders in the fiscal year under review by business segment are as follows: Segment name
Orders received (Million yen)
Order backlog (Million yen)
YoY change (%)
YoY change (%)
Component Solutions Business
114,229
1.4
18,760
24.2
Transport Solutions Business
100,845
0.5
91,319
15.3
Accessibility Solutions Business
102,244
1.2
47,326
-8.7
Others
17,751
-3.8
9,506
4.8
335,069
0.8
166,911
7.5
Total
(NOTE) The above amounts are figures after elimination of intersegment transactions.
③ Sales Results Sales results by business segment for the fiscal year under review are as follows. Segment name
Sales (Million yen)
YoY change (%)
Component Solutions Business
110,571
-19.9
Transport Solutions Business
88,727
9.8
Accessibility Solutions Business
106,771
11.2
Others
17,315
-6.3
323,384
-3.0
Total
(NOTE) 1 The above amounts are figures after elimination of inter-segment transactions. 2 No customer accounts for more than 10% of total sales.
―43―
(Translation) This document has been translated from the Japanese original for the convenience of overseas stakeholders. In the event of any discrepancy between this document and the Japanese original, the original shall prevail.
(4) Analysis and examination of the status of operating results, etc. from the management's perspective ① Important Accounting Policies and Estimates Important accounting policies and estimates used in the consolidated financial statements of our Group are as described in "5. Accounting Status 1. Consolidated Financial Statements, etc., (1) Notes to Consolidated Financial Statements, Note 3. Significant Accounting Policies and Notes 5. Significant Accounting Judgments, Estimates and Assumptions." ② Recognition, analysis, and consideration of the status of operating results for the fiscal year under review
- Net sales During the consolidated fiscal year under review, showed favorable demand for automatic door and the effects of exchange rates, as well as strong demand in aircraft equipment and marine vessels equipment. Meanwhile, in precision reduction gears, a global decline in automotive related capital expenditures and demand for construction machinery in hydraulic equipment declined. As a result, the Group’s net sales for the fiscal year under review decreased 3.0% from the previous fiscal year to ¥323,384 million.
- Operating income Operating income declined 9.9% to ¥15,012 million due to the decrease in sales in component solutions business, despite the increase in operating income resulting from the increase in sales in transport solutions and accessibility solutions businesses. The ratio of operating income to net sales was 4.6%.
- Income before tax Financial income came to ¥1,140 million due to foreign exchange gains, etc. Financial costs were ¥918 million due to the recording of interest expenses and other expenses. Equity in earnings of affiliates was ¥950 million. As a result, income before tax decreased by 36.1% year-on-year to ¥16,184 million.
- Net income attributable to owners of the parent In total, net income attributable to owners of the parent decreased by 28.4% year-on-year to ¥10,188 million, net of income tax expenses of ¥4,419 million and net income attributable to non-controlling interests of ¥1,577 million. Total basic earnings per share decreased by ¥33.69 year-on-year to ¥84.83. Results by business segment for the fiscal year under review are as follows. (Component solutions business) Orders received for component solutions increased by 1.4% year-on-year, to ¥114,229 million. Net sales decreased by 19.9% year-on-year, to ¥110,571 million, and operating income decreased by 56.4% year-on-year, to ¥4,523 million. Sales of precision reduction gears decreased year-on-year due to a slow recovery in EV related capital investment as well as prolonged inventory adjustment of industrial robots. Sales of hydraulic equipment decreased year-on-year due to continued sluggish demand in the U.S. and European markets, despite an increase in demand for Southeast Asia. (Transport solutions business) Orders received for transport solutions increased by 0.5% year-on-year, to ¥100,845 million. Net sales increased by 9.8% yearon-year, to ¥88,727 million, and operating income increased by 58.3% year-on-year, to ¥12,389 million. Sales of railroad vehicle equipment increased year-on-year due to solid demand for new railroad vehicles in Japan and MRO (Maintenance, Repair, Overhaul) demand in overseas. Sales of aircraft equipment increased year-on-year due to growth in demand resulting from increased defense-related expenditures and favorable demand for MRO in commercial aircraft. Sales of commercial vehicle equipment decreased year-on-year due to weak demand from Southeast Asian and domestic markets. Sales of marine vessel equipment increased year-on-year due to strong demand for new vessels and MRO, as well as a result of consolidation of Deep Sea as a subsidiary.
―44―
(Translation) This document has been translated from the Japanese original for the convenience of overseas stakeholders. In the event of any discrepancy between this document and the Japanese original, the original shall prevail.
(Accessibility solutions business) Orders received for accessibility solutions increased by 1.2% year-on-year, to ¥102,244 million. Net sales increased by 11.2% year-on-year, to ¥106,771 million, and operating income increased by 71.3% year-on-year, to ¥9,340 million. Sales of the automatic doors business increased year-on-year due to favorable demand of automatic doors for building and platform doors both in domestic and overseas, as well as foreign exchange effects. (Others) Orders received for others businesses decreased by 3.8% year-on-year, to ¥17,751 million. Net sales decreased by 6.3% by year-on-year, to ¥17,315 million, and operating income decreased by 69.2% year- on-year to ¥1,043 million. Sales of packaging machines decreased year-on-year due to the postponement of capital expenditures and the impact of delays in the timing of product deliveries both domestically and overseas, despite the strong performance of MRO. In the fiscal year under review, the company recorded an impairment loss of ¥656 million on goodwill related to Engilico, a consolidated subsidiary in Europe. (Corporate or elimination) During the fiscal year under review, the Company recorded an impairment loss of 976 million yen on non-business related real estate (investment property). ③ Analysis of capital resources and fund liquidity Our Group's main cash requirements for operating activities include working capital required for production activities (raw materials, personnel expenses, etc.), selling expenses for acquiring orders, and R&D expenses for strengthening the competitiveness of existing businesses and creating new products and businesses. Investing activities include capital expenditures, primarily for new building for precision reduction gears and renewal of building for hydraulic equipment in component solutions segment. Finansing activity include ¥10,000 million of long-term borrowing by Syndicated Loans. In the FY2025, the Group plans to invest ¥18,000 million of capital expenditures. The funds required for the Group’s business activities are mainly procure through the use of ou own funds, borrowings from financial institutions, etc., and the Group selects the optimal financing methods while closely monitoring indicators such as the ratio of equity attributable to owners of the parent and ROE. The balance of loans at the end of the fiscal year under review was ¥31,884 million yen, an increase of ¥10,312 million yen from the previous fiscal year-end. ④ Objective indicators for judging the status of achievement of management policies, strategies and targets We have set financial targets of ROIC 10% or over and a consolidated dividend payout ratio of 35% or more as management targets in our medium-term management plan starting in Fiscal Year 2022. The trends in each indicator during the period of the current medium-term management plan are as follows. 20th fiscal year (FY2022)
21st fiscal year (FY2023)
22nd fiscal year (FY2024)
ROIC(%)
4.7
4.0
3.4
Consolidated dividend payout ratio (%)
89.9
67.5
94.3
―45―
(Translation) This document has been translated from the Japanese original for the convenience of overseas stakeholders. In the event of any discrepancy between this document and the Japanese original, the original shall prevail.
5 【Significant Management Contracts】 (Agreement on the Introduction of Technology, etc.) Name of Contract Company
Subject of the contract
Conclusion agreement Effective Date
Manufacturing and sales contract of nose steering, input nose steering and flap drives which are equipped with F-15 fighter.
January, 1983
Technology and sales helicopter equipment
January, 1989
Until December 2028
United States Woodward HRT, Inc.
Manufacturing and sales contract of Rotary rudder servo actuator, canopy actuator, speed brake actuator, directional control valve and aerial refueling directional valve for F-15 fighter equipment.
July, 2015
Until June 2025
United States Woodward FST, Inc.
Manufacturing technology and sales contract of fuel injection nozzles for aircraft.
August, 1981
Until June 2025
Technology adopters
United States Parker-Hannifin Corporation
Nabtesco Corporation
contracts
of
Contract period Until December 2028
(NOTE) As compensation for the above-mentioned contracts, the Company pays a fixed amount or a fixed rate of sales.
―46―
(Translation) This document has been translated from the Japanese original for the convenience of overseas stakeholders. In the event of any discrepancy between this document and the Japanese original, the original shall prevail.
6【R&D activities】 Based on our corporate philosophy of "The Nabtesco Group, with our unique motion control technology, will provide safety, comfort and a sense of security in daily lives as well as any form of transportation," our group sets the goal of our R&D activities for profitable growth and engages in R&D by formulating R&D plans in cooperation with our business strategies. With regard to R&D investment, we are promoting R&D to create a new motion control "Smart Motion Control" product to realize leaders in innovation in 2030. This product combines hardware and component technologies that have strengths with software technologies such as AI and IoT by focusing on "electrification, systematization/integration and data solutions" R&Dexpenses for the fiscal year under review were ¥12,051 million. The research objectives, major issues, research results, and R&D expenditures by segment are as follows. (1) Component Solutions Business The Precision Equipment Company and Power Control Company are the main R&D centers for Precision reduction gears and its systems, as well as Hydraulic equipment for construction machinery and its systems. Major achievements in the fiscal year under review included the expansion of models for RV-Z series for industrial robots, development of condition monitoring sensors, the development of gear head series for semicondoctors and FPD market, the development of series of AGV drive units, the launch of energy-saving pump and valve systems for construction machinery, the strengthening of lineup of running and turning units for construction machinery, the launch of compact and high power density VC series motor models for construction machinery, and the study of equipment compatible with ICT and electrification of construction machinery. Research and development expenses in this segment totaled ¥1,991 million. (2) Transport Solutions Business The Railroad Products Company, Aerospace Company, Marine Control Systems Company and Nabtesco Automotive Co., Ltd. are responsible for the research and development of brake systems for railroad vehicles and door systems, aircraft flight control equipment and systems, marine engine control systems, and various devices and equipment for commercial vehicle brakes and passenger vehicle clutches. Major achievements during the fiscal year under review included the development of brake control systems and equipment for railcars for the global market (Launch of brake discs for Europe, energy-saving brake controllers (GB1) with disc brake systems for China, launch of oil-free compressor with improved dust environmental performance, the development of electric actuators for flight control, the launch of vessel speed optimization units "TELEGRAPH AGENT" to reduce crew workload, fuel consumption, the development of "HyperPilot" which collaborate with TELEGRAPH AGENT to output the optimized route and speed plan, the development of vessel attitude and speed control system for realization of unmanned vessels, the development of electric compressors that respond to the electrification of commercial vehicles in addition to the development of conventional air brake equipment for commercial vehicles, and the development of emergency driving stop systems for retrofit (EDSS) that contribute to improving the safety of existing buses. Research and development expenses in this segment totaled ¥3,436 million. (3) Accessibility Solutions Business The Accessibility Innovations Company plays a central role in R&D of automatic door for buildings, automatic platform Gates, platforms screen doors, and welfare equipment. Major achievements during the fiscal year under review included the development of high-value-added automatic door, the launch of designated fire prevention facilities (combined fire prevention facilities) with smoke shielding performance (CAS certified), the development of automatic door with digital signage and starting advertisement delivery business, the development of automatic platform gates and high-value-added screen doors for railway station platforms, the launch of new moderl for wheel unit for rollators with a speed control braking system and the others. Research and development expenses in this segment totaled ¥3,629 million yen. (4) Others PACRAFT Co., Ltd. and CMET Inc. play a central role in the R&D of such products as automated filling/sealing packaging machines, stereolithography system (3D printers) respectively. Major achievements during the fiscal year under review included the development of packaging machines in response to high productivity demands, the development of labor-saving and automation equipment in the front and rear processes of packaging machines, the development of materials for stereolithography system, sand-mold lamination molding equipment, the development of CMFS equipment for overseas-made wind power generation. Research and development expenses in this segment totaled ¥757 million.
(5) Corporate division The Corporate Division actively engages in R&D activities related to fundamental technologies and new business fields that are common to the entire Group, as well as joint R&D activities with universities, research institutes, and other companies. In new business fields, we began joint research with Gifu Pharmaceutical University in FY2024 on hydrogen and ammonia production technology. Research and development expenses related to the Corporate Division are ¥2,238 million.
―47―
(Translation) This document has been translated from the Japanese original for the convenience of overseas stakeholders. In the event of any discrepancy between this document and the Japanese original, the original shall prevail.
No.3 【Status of Facilities】
- 【Overview of Capital Expenditures】 In our group, we invested primarily in expanding domestic capacity and improving productivity, and in overseas, in upgrading facilities. As a result, capital expenditures for the fiscal year under review totaled ¥20,125 million (investments in property, plant and equipment and intangible assets). In component solutions business, capital expenditures totaled ¥13,898 million, mainly for the construction of a Hamamatsu Plant building in precision reduction gears, increased production at the Tsu Plant, and rebuilding of the Japanese Plant in hydraulic equipment. Capital expenditures in transport solutions business amounted to ¥2,591 million, mainly for R&D capital expenditures in marine vessels equipment, and for capital expenditures in railroad vehicle equipment and aircraft equipment. In accessibility solutions business, capital expenditures totaled ¥2,243 million, mainly for productivity improvements and facility upgrades at automatic door. In the others segment, capital expenditures totaled ¥405 million, mainly for capital expenditures in upgrade of facilities. Capital expenditures of ¥988 million were made for companywide and common assets, mainly for updating information management systems. In addition, the Company appropriated its own funds to the primary investors in all of its capital requirements.
2 [Status of major facilities] (1) Submitting Company As of December 31, 2024 Book value (Million yen) Buildings and structures
Machinery and equipment
Land (Area m2)
Others
Total
Number of employees (person)
Production facilities for precision reduction gears
7,171
13,237
1,755 (118,602)
1,935 24,098
596
Component Solutions
Factory land for precision reduction gears
15,994
6,192
5,660 10,632 38,478 (181,700)
64
Kobe Plant (Nishi-ku, Kobe)
Transport Solutions
1,626
596
3,431 (27,000)
292
5,945
349
Seishin plant (Nishi-ku, Kobe)
Transport Solutions and Component Solutions
Production facilities for brake systems and other equipment of railroad vehicles Production facilities for marine vessels equipment, hydraulic equipment and others
1,094
1,072
698 (70,780)
364
3,227
315
Tarui Plant (Tarui-cho, gifu Prefecture)
Component Solutions
Production facilities for hydraulic equipment
3,517
720
29 (43,495)
975
5,241
172
Gifu Plant (Tarui-cho, gifu Prefecture)
Transport Solutions
Production facilities for aircraft equipment
5,024
1,845
541 (81,323)
321
7,731
399
Konan Plant (Higashinada-ku, Kobe)
Accessibility Solutions
Production facilities for automatic doors for buildings and others
475
83
90 (11,018)
260
908
245
Rental real estate (Matsuyama, Ehime)
Common to Head Office
Land for factories, buildings and structures
76
1
735 (58,786)
0
812
-
Site name (Location)
Segment Name
Details of facilities
Tsu Plant (Tsu, Mie)
Component Solutions
Land for the Hamamatsu Plant (Hamana-ku, Hamamatsu)
(NOTE) 1 The book value is the book value in the non-consolidated financial statements based on Japanese GAAP. 2 Other includes tools, furniture and fixtures, and construction in progress. 3.Book value is after the impairment loss. 4 Leased equipment from other than consolidated companies consist primarily of the Tokyo head office building of the submitting company, which is subject to annual rent of ¥303 million.
―48―
(Translation) This document has been translated from the Japanese original for the convenience of overseas stakeholders. In the event of any discrepancy between this document and the Japanese original, the original shall prevail.
(2) Domestic subsidiaries As of December 31, 2024 Company and site name (Location)
Segment Name
Book value (Million yen) Details of facilities
Buildings Machinery Land Right-ofand and (Area m2) use assets structures equipment
Nabtesco Automotive Corporation Production Yamagata Plant Transport facilities for brake 1,146 498 (Murayama City, Solutions systems and others Yamagata Prefecture) in automobiles 2 other business sites NABCO SYSTEM CO., LTD. Accessibility Head Office and 1,953 152 (Chiyoda-ku, Tokyo) Solutions sales facilities 3 other companies NABCO DOOR Ltd. Head Office Accessibility Head Office and 520 - (Kita-ku, Osaka) sales facilities Solutions 23 other business sites PACRAFT Co., Ltd. Production Iwakuni Plant facilities for (Iwakuni City, Others 892 234 packaging Yamaguchi Prefecture) machines 6 other business sites (NOTE) 1 The carrying amount is based on IFRS. 2 Other includes tools, furniture and fixtures, and construction in progress.
Others
Total
Number of employees (person)
685
3,074
253
14,711
1,008
745 (43,957)
-
542 (31,311)
3,284
1,759 (4,133)
658
80
3,017
438
944 (35,639)
161
133
2,364
306
8,780
(NOTE)3
3 The amount is included investment property of ¥8,499 million.
(3) Foreign subsidiaries As of December 31, 2024 Site name (Location) Nabtesco (China) Precision Equipment Co., Ltd. Head Office and Plant (Jiangsu Province, China) Changzhou Nabtesco Precision Machinery Co., Ltd. Head Office and Plant (Jiangsu Province, China) Nabtesco Power Control (Thailand) Co., Ltd. Head Office and Plant (Chonburi, Thailand) Shanghai Nabtesco Hydraulic Co., Ltd. Head Office and Plant (Shanghai, China)
Segment Name
Book value (Million yen) Details of facilities Buildings and structures
Machinery and equipment
Land Right-of-use assets (Area m2)
Others
Number of employees Total (person)
Component Solutions
Production facilities for precision reduction gears
1,554
1,386
-
309
91 3,341
142
Component Solutions
Production facilities for reduction gears
-
1,002
-
-
8 1,010
115
Component Solutions
Production facilities for hydraulic equipment
150
240
515 (47,988)
21
82 1,008
99
Component Solutions
Production facilities for hydraulic equipment
708
1,431
-
77
169 2,384
256
407 (26,271)
3,584
345 5,687
1,356
Production facilities for Accessibility automatic doors 995 355 Solutions for buildings and others (NOTE) 1 The carrying amount is based on IFRS. 2 Other includes tools, furniture and fixtures, and construction in progress. Gilgen Door Systems AG (Bern, Switzerland) 7 other companies
―49―
(Translation) This document has been translated from the Japanese original for the convenience of overseas stakeholders. In the event of any discrepancy between this document and the Japanese original, the original shall prevail.
3 [Plans for new construction, retirement, etc.] (1) Construction of major facilities The Group’s capital investment plans take into account a comprehensive range of factors, including demand forecasts, production plans, and the ratio of investment to profit plans. Capital investment plans are formulated individually by the Company and each of our consolidated subsidiaries in principle, but the Production Innovation Division plays a central role in coordinating these plans so that the entire Group does not have overlapping investments. The capital expenditure plan for the year ending December 31, 2025 (new construction and expansion) was ¥18,000 million, and the breakdown by segment is as follows.
Segment name
Component Solutions Business
Transport Solutions Business
Accessibility Solutions Business Others Company-wide and common Total
Planned amount (Million yen)
8,100
Major contents and purpose of facilities
Renewal facility in precision reduction gears, renewal of hydraulic equipment plat buildings, etc.
Investment for development and productivity improvement in Marine vessel equipment, renewal of facility in Railroad 4,200 vehicle equipment, investment for productivity improvement in Aircraft equipment, new product development in Commercial vehicle equipment, etc. Productivity improvement in Automatic Doors and renewal of 3,600 plant building for subisidiaries, etc. Renewal of facility and productivity improvement in Packaging 500 machines, etc. Infromation management systems, R&D, environmental 情 1,600 measures, etc. 18,000
-
Fund procurement Methods Own funds
Own funds
Own funds Own funds Own funds
-
(2) Disposal of major facilities With the exception of retirements and sales for recurring equipment renewals, there are no plans for the retirement or sale of significant equipment.
―50―
(Translation) This document has been translated from the Japanese original for the convenience of overseas stakeholders. In the event of any discrepancy between this document and the Japanese original, the original shall prevail.
No.4 【Status of the Company Submitting the Report】 1
【Status of Shares】 (1) 【Total Number of Shares】 ① 【Total number of shares】 Type
Total number of authorized shares
Common stock
400,000,000
Total
400,000,000
② 【Shares outstanding】
Type
Number of shares Number of shares outstanding (shares) outstanding (shares) as Name of stock exchange As of December 31, of the date of filing listings 2024 (March 27, 2025)
Content
Common shares
121,064,099
121,064,099
Tokyo Stock Exchange Prime section
The number of shares per unit is 100 shares.
Total
121,064,099
121,064,099
-
-
(NOTE) The "Number of shares outstanding as of the filing date" column does not include the number of shares issued upon the exercise of stock acquisition rights to shares from March 1, 2025 to the filing date of this Annual Securities Report.
―51―
(Translation) This document has been translated from the Japanese original for the convenience of overseas stakeholders. In the event of any discrepancy between this document and the Japanese original, the original shall prevail.
(2) 【Status of Stock Acquisition Rights】 ① 【Details of stock option plan】 As of the end of the fiscal year (December 31, 2024)
As of the end of the previous month of the filing date (February 28, 2025)
July 31, 2015
Same as left
8 directors and 11 executive officers
Same as left
Number of stock options (unit)
10
Same as left
Class of shares for stock options
Common shares
Same as left
Number of shares for stock options
1,000 (Note 1)
Same as left
1 per share
Same as left
Date of resolution Classification and number of grantees
Payment on exercise price of stock options (Yen)
From August 21, 2015 to August 20, 2040 Issue price for shares upon exercise of stock options Issue price 2,420 and appropriation to capital (Yen) Amount incorporated into capital 1,210 Period for exercising stock options
Conditions for exercising the new stock options Items related to transfer of stock options
Same as left Same as left
(NOTE) 2
Same as left
Transfer of share options shall require the approval of the board of directors.
Same as left
Matters concerning the delivery of the stock options (NOTE) 3 Same as left in connection with the organizational restructuring (NOTE) 1 The number of shares subject to the stock options; The number of shares subject to each stock options (hereinafter referred to as the "number of granted shares") shall be 100 shares. Provided, however, that in the event that we effect a share split or reverse share split after the Allotment Date, the number of granted shares shall be adjusted according to the following formula: Number of shares granted after adjustment = Number of shares granted before adjustment × Ratio of stock split and reverse stock split Such adjustment shall be made with respect to the number of shares subject to the stock acquisition rights that have not been exercised at that time, and any fraction less than 1 share resulting from the above adjustment shall be discarded. In addition to the above, in the event that we effect a merger, a company split, or a share exchange, or in any other event that requires an adjustment to the number of granted shares in accordance with such circumstances, we shall be entitled to make an adjustment to the number of granted shares as deemed necessary by the Board of Directors to the extent reasonable. 2 Conditions for exercising the new stock options ①A holder of the rights to subscribe for new shares may exercise the rights only within 10 days (if the tenth day falls on a holiday, then no later than the next business day) from the day following the day on which the holder of the rights to subscribe for new shares has lost the position of both the directors and the executive officers of the Company. ②The exercise of stock options shall be effected by collectively exercising all of the number of stock options allotted. ③In the event of the death of a holder of stock options who has been allotted, only one of the direct legal heirs of such holder of stock options may inherit the rights of such holder of stock options. ④Other conditions shall be as set forth in the "Stock Option Allotment Agreement" concluded between the Company and holders of stock options by resolution of the Board of Directors of the Company with respect to the issuance of stock options. 3 Matters concerning the delivery of the stock options in connection with the organizational restructuring In the event of a merger (limited to the case where we cease to exist due to a merger), an absorption-type demerger or an incorporation-type demerger (limited to the case where each of us becomes a split company), or a share exchange or a share transfer (limited to the case where each of us becomes a wholly-owned subsidiary) (hereinafter collectively referred to as "organizational restructuring"), the share warrants of the corporation (hereinafter referred to as "the restructured corporation") as set forth in Article 236, Paragraph 1, Item 8 (a) to (e) inclusive of the Companies Act shall be delivered to the holder of the share warrants who holds the share warrants which remain immediately before the effective date of the organizational restructuring. ①Type of stock of the Company to be restructured to be subject to the stock options The type of stock shall be common stock of the Company to be restructured. ②Number of restructured companies subject to stock options Decisions shall be made in accordance with (NOTE) 1 above after taking into consideration the conditions of the organizational restructuring. ③Assets to be contributed at the time of exercise of the rights The value of assets to be contributed upon the exercise of each of the stock options to be delivered shall be the amount obtained by multiplying the exercise price after the realignment stipulated below by the number of shares of the restructured company subject to each of such stock options to be determined in accordance with ② above. The exercise price after the reorganization shall be one yen per share of the restructured company's shares that can be delivered by exercising each stock acquisition right to be delivered. ④Exercise period for the rights The period from the date of commencement of the period during which the stock options may be exercised or the effective date of the organizational restructuring, whichever is later, until the expiration date of the period during which the stock options may be exercised. ⑤Restriction on acquisition of stock options by transfer Acquisition of the rights to subscribe for new shares by transfer shall require approval by a resolution of the Board of Directors of the Company to be restructured.
―52―
(Translation) This document has been translated from the Japanese original for the convenience of overseas stakeholders. In the event of any discrepancy between this document and the Japanese original, the original shall prevail.
As of the end of the fiscal year (December 31, 2024)
As of the end of the previous month of the filing date (February 28, 2025)
April 28, 2016
Same as left
7 directors and 12 executive officer
Same as left
Number of stock options (unit)
54
36
Class of shares for stock options
Common shares
Same as left
Number of shares for stock options
5,400 (Note 1)
3,600(Note 1)
1 per share
Same as left
From May 21, 2016 to May 20, 2041 Issue price 2,564 Amount incorporated into capital 1,282
Same as left
Date of resolution Classification and number of grantees
Payment on exercise price of stock options (Yen) Period for exercising stock options Issue price for shares upon exercise of stock options and appropriation to capital (Yen)
(NOTE) 2
Same as left
Transfer of share options shall require the approval of the board of directors.
Same as left
Conditions for exercising the new stock options Items related to transfer of stock options
Same as left
Same as left Matters concerning the delivery of the stock options (NOTE) 3 in connection with the organizational restructuring (NOTE) 1 The number of shares subject to the stock options; The number of shares subject to each stock options (hereinafter referred to as the "number of granted shares") shall be 100 shares. Provided, however, that in the event that we effect a share split or reverse share split after the Allotment Date, the number of granted shares shall be adjusted according to the following formula: Number of shares granted after adjustment = Number of shares granted before adjustment × Ratio of stock split and reverse stock split Such adjustment shall be made with respect to the number of shares subject to the stock acquisition rights that have not been exercised at that time, and any fraction less than 1 share resulting from the above adjustment shall be discarded. In addition to the above, in the event that we effect a merger, a company split, or a share exchange, or in any other event that requires an adjustment to the number of granted shares in accordance with such circumstances, we shall be entitled to make an adjustment to the number of granted shares as deemed necessary by the Board of Directors to the extent reasonable. 2 Conditions for exercising the new stock options ①A holder of the rights to subscribe for new shares may exercise the rights only within 10 days (if the tenth day falls on a holiday, then no later than the next business day) from the day following the day on which the holder of the rights to subscribe for new shares has lost the position of both the directors and the executive officers of the Company. ②The exercise of stock options shall be effected by collectively exercising all of the number of stock options allotted. ③In the event of the death of a holder of stock options who has been allotted, only one of the direct legal heirs of such holder of stock options may inherit the rights of such holder of stock options. ④Other conditions shall be as set forth in the "Stock Option Allotment Agreement" concluded between the Company and holders of stock options by resolution of the Board of Directors of the Company with respect to the issuance of stock options. 3 Matters concerning the delivery of the stock options in connection with the organizational restructuring In the event of a merger (limited to the case where we cease to exist due to a merger), an absorption-type demerger or an incorporation-type demerger (limited to the case where each of us becomes a split company), or a share exchange or a share transfer (limited to the case where each of us becomes a wholly-owned subsidiary) (hereinafter collectively referred to as "organizational restructuring"), the share warrants of the corporation (hereinafter referred to as "the restructured corporation") as set forth in Article 236, Paragraph 1, Item 8 (a) to (e) inclusive of the Companies Act shall be delivered to the holder of the share warrants who holds the share warrants which remain immediately before the effective date of the organizational restructuring. ①Type of stock of the Company to be restructured to be subject to the stock options The type of stock shall be common stock of the Company to be restructured. ②Number of restructured companies subject to stock options Decisions shall be made in accordance with (NOTE) 1 above after taking into consideration the conditions of the organizational restructuring. ③Assets to be contributed at the time of exercise of the rights The value of assets to be contributed upon the exercise of each of the stock options to be delivered shall be the amount obtained by multiplying the exercise price after the realignment stipulated below by the number of shares of the restructured company subject to each of such stock options to be determined in accordance with ② above. The exercise price after the reorganization shall be one yen per share of the restructured company's shares that can be delivered by exercising each stock acquisition right to be delivered. ④Exercise period for the rights The period from the date of commencement of the period during which the stock options may be exercised or the effective date of the organizational restructuring, whichever is later, until the expiration date of the period during which the stock options may be exercised. ⑤Restriction on acquisition of stock options by transfer Acquisition of the rights to subscribe for new shares by transfer shall require approval by a resolution of the Board of Directors of the Company to be restructured.
―53―
(Translation) This document has been translated from the Japanese original for the convenience of overseas stakeholders. In the event of any discrepancy between this document and the Japanese original, the original shall prevail.
② 【Details of rights plan】 Not applicable.
③ 【Status of other stock acquisition rights】 Not applicable.
(3) 【Status of Exercise of Bonds with Stock Acquisition Rights with Exercise Price Adjustment, etc.】 Not applicable.
(4) 【Changes in the number of issued shares, capital stock, etc.】 Date July 15, 2021 (Note)
Number of shares Number of shares Change in outstanding outstanding as the capital increase/decrease end of therm. (Million yen) -4,069,700
121,064,099
Balance of Change in legal Balance of legal capital capital surplus capital surplus (Million yen) (Million yen) (Million yen)
-
10,000
-
26,274
(NOTE) Decrease in shares due to cancellation of treasury stock. (5) 【Breakdown of Shareholders】 As of December 31, 2024 Status of Shares (100 shares per unit) GovernOverseas investors Classification ment/Local Financial Securities Other Individuals Total Noncorporations public institution firms Individuals, and others individuals entity Number of 1 54 36 283 316 70 21,761 22,521 shareholders Number of shares held 10 359,414 48,669 164,839 488,619 228 147,703 1,209,482 (Unit) Percentage of number of 0.00 29.72 4.02 13.63 40.40 0.02 12.21 100.00 shares held (%)
Less than one unit Status of Shares - 115,899
-
(NOTE) 1 Treasury stock of 422,664 shares is included in "Individuals and others" and 4,226 units and 64 shares are included in "Shares less than one unit." 2 "Financial Institutions" includes 5,172 shares held by Japan Custody Bank, Ltd. (Trust Account E) as trust assets for the "Stock Benefit Trust (BBT=Board Benefit Trust)" (hereinafter referred to as "Stock Benefit Trust (BBT)") system, and 30 shares in "Shares of less than 1 unit." 3 "Other corporations" includes 60 units of shares in the name of the Japan Securities Depository Center, Inc.
―54―
(Translation) This document has been translated from the Japanese original for the convenience of overseas stakeholders. In the event of any discrepancy between this document and the Japanese original, the original shall prevail.
(6) 【Major Shareholders】
Shareholders
Address
As of December 31, 2024 Shareholding ratio to number of Number of shares outstanding Shares Held (excluding (thousands) treasury stock) (%)
The Master Trust Bank of Japan (Trust Account)
8-1 Akasaka 1-chome, Minato-ku, Tokyo AKASAKA INTERCITY AIR
18,322
15.19
Custody Bank of Japan (Trust Account)
8-12, Harumi 1-chome, Chuo-ku, Tokyo
11,562
9.58
Central Japan Railway Company
1-4, Meieki 1-chome, Nakamura-ku, Nagoya-shi, Aichi, JR central towers
5,171
4.29
5,168
4.28
3,760
3.12
3,310
2.74
3,265
2.71
2,947
2.44
2,276
1.89
1,921
1.59
57,701
47.83
BNYMSANV AS AGENT/CLIENTS LUX UCITS NON TREATY 1 (Standing agent) MUFG Bank, Ltd.
VERTIGO BUILDING-POLARIS 2-4 RUE EUGENE RUPPERT L-2453 LUXEMBOURG GRAND DUCHY OF LUXEMBOURG 4-5 Marunouchi 1-chome, Chiyoda-ku, Tokyo
FANUC CORPORATION
3580 Shibokusa, Oshinomura, Minamitsuru-gun, Yamanashi
BNYM AS AGT/CLTS NON TREATY JASDEC
240 GREENWICH STREET, NEW YORK, NEW YORK 10286 U.S.A.
(Standing agent) MUFG Bank, Ltd.
4-5 Marunouchi 1-chome, Chiyoda-ku, Tokyo
Harmonic Drive Systems Inc.
25-3, Minami-Oi 6-chome, Shinagawa-ku, Tokyo
BBH (LUX) FOR FIDELITY FUNDSGLOBAL TECHNOLOGY POOL
2A RUE ALBERT BORSCHETTE LUXEMBOURG L-1246
(Standing agent) MUFG Bank, Ltd.
4-5 Marunouchi 1-chome, Chiyoda-ku, To
STATE STREET BANK WEST CLIENTTREATY 505234
1776 HERITAGE DRIVE, NORTH QUINCY, MA 02171, U.S.A.
(Standing agent) Mizuho Bank, Ltd.
15-1, Konan 2-chome, Minato-ku, Tokyo Shinagawa Intercity Tower A
STATE STREET BANK AND TRUST COMPANY 505001
ONE CONGRESS STREET, SUITE 1, BOSTON, MASSACHUSETTS
(Standing agent) Mizuho Bank, Ltd.
15-1, Konan 2-chome, Minato-ku, Tokyo Shinagawa Intercity Tower A
Total
-
(NOTE) 1 Number of shares held is rounded to the nearest thousand. 2 The following corporation submitted a report on the change of 7,767,000 shares by two companies on August 7, 2024. However, as the number of shares beneficially owned in the name of the said corporation cannot be confirmed as of December 31, 2024, it is not included in the above "Status of Major Shareholders."
- Nomura Securities Co.,Ltd.
- Nomura Asset Management Co., Ltd. 3 The following corporation submitted a report on the change of 9,001,000 shares by two companies on November 21, 2024. However, as the number of shares beneficially owned in the name of the said corporation cannot be confirmed as of December 31, 2024, it is not included in the above "Status of Major Shareholders."
- Sumitomo Mitsui Trust Asset Management Co., Ltd.
- Nikko Asset Management Co., Ltd.,
―55―
(Translation) This document has been translated from the Japanese original for the convenience of overseas stakeholders. In the event of any discrepancy between this document and the Japanese original, the original shall prevail.
(7) 【Status of voting rights】 ① 【Shares outstanding】 As of December 31, 2024 Classification
Number of shares
Number of voting rights
Content
-
-
-
-
-
-
-
-
-
Non-voting stock Shares with restricted voting rights (Treasury stocks) Shares with restricted voting rights (other) Shares with full voting (treasury stock, etc.)
rights
Shares with full voting rights (other) Shares less than one unit
(Treasury stock held) Common shares 422,600 (Mutually Held Shares) Common shares 15,000 Common shares 120,510,600 Common shares 115,899
Number of shares outstanding
- - - 1,205,106
121,064,099
Voting rights of all shareholders
-
-
Shares less than one unit (100 shares)
-
- 1,205,106
-
-
(NOTE) 1 Common shares in the "Shares less than 1 unit" column include 64 shares of treasury stock owned by the Company and 30 shares of our stock owned by Japan Custody Bank, Ltd. (Trust Account E) as trust assets under the "Stock Benefit Trust (BBT)" plan. 2 "Shares with full voting rights (other)" column includes 6,000 shares (60 voting rights) in the name of the Japan Securities Depository Center, Inc. and 517,200 shares (5,172 voting rights) of ours owned by the Japan Custody Bank, Ltd. (Trust Account E) as trust assets for the "Stock Benefit Trust (BBT)" plan. The 5,172 voting rights are not exercised. ② 【Treasury stock】
Number of treasury stock
Owner's name
Address of the holder
(Treasury stock held) Nabtesco Corporation (Mutually Held Shares) Kyokko Denki Co., Ltd.
7-9, Hirakawacho 2-chome, Chiyoda-ku, Tokyo 2-4 Aratacho 1-chome, Hyogo-ku, Kobe-shi, Hyogo
計
-
As of December 31, 2024 Ratio of shares Number of Total number of held to total shares held in shares to be number of the name of own shares others outstanding (%)
422,600
-
422,600
0.35
15,000
-
15,000
0.01
437,600
-
437,600
0.36
(NOTE) The above numbers of shares held do not include 517,200 shares of our company owned by Japan Custody Bank, Ltd. (Trust Account E) as trust assets under the "Stock Benefit Trust (BBT)" plan.
―56―
(Translation) This document has been translated from the Japanese original for the convenience of overseas stakeholders. In the event of any discrepancy between this document and the Japanese original, the original shall prevail.
(8) 【Details of executive and employee stock ownership plans】 ① Outline of Directors' and Employees' Stock Ownership Plan We have introduced a Stock Benefit Trust (BBT) (the "Plan") as a stock-based compensation plan for our directors and executive officers (excluding outside directors) (hereinafter referred to as "Directors, etc."). Under this system, shares of the Company are acquired through a trust (hereinafter referred to as the "Trust") using money to be contributed by the Company. Under this system, shares of the Company are awarded points (hereinafter referred to as "Share Grant Points") each year according to position, performance, etc. based on the Directors' Share Benefit Regulations established by the Company, and cash equivalent to the amount of the Company's shares and the liquidation proceeds of the Company's Shares (hereinafter referred to as "Shares of the Company") is awarded or benefits through the Trust (hereinafter referred to as "Grant Points") according to the number of such Share Grant Points at a predetermined time. The grants under this system include "grants at the time of service" in which points are awarded to directors in conjunction with the degree of achievement of the medium-term management plan, and "grants at the time of service" in which shares are awarded to directors, etc. at a certain time during their service, and "grants at the time of retirement" in which points are awarded to directors, etc. at the time of retirement. ②Total number of shares to be acquired by directors, etc. 517,230 shares ③ Scope of persons entitled to receive beneficial interest or other rights under the said officer's and employee's stock ownership plan Directors, etc. who satisfy the requirements for beneficiaries set forth in the Regulations Governing the Transfer of Shares by Directors
―57―
(Translation) This document has been translated from the Japanese original for the convenience of overseas stakeholders. In the event of any discrepancy between this document and the Japanese original, the original shall prevail.
2 【Status of acquisition of treasury stock】 【Class of Share】
Acquisition of common shares pursuant to Item 7, Article 155 of the Companies Act
(1) 【Status of Acquisition by Resolution at the General Meeting of Shareholders】 Not applicable
(2) 【Status of acquisition by resolution of the Board of Directors】 Not applicable.
(3) 【Details of items that are not based on a resolution of the shareholders' meeting or a resolution of the Board of Directors】 Classification
Number of shares
Total value (yen)
Treasury stock acquired in the current fiscal year
863
2,180,711
Treasury stock acquired during the period
50
134,453
(NOTE) Shares of less than one unit purchased from March 1, 2025 to the filing date of the Annual Securities Report are not included in the repurchased shares during the period under review
(4) 【Disposal and holding of treasury stock acquired】
Classification Acquired treasury stock offered to subscribers Acquired treasury stock disposed of by retirement Acquired treasury stock transferred in connection with the merger, share exchange, share issuance, and company split
Current fiscal year Number of shares
Current term
Total value disposed Total value disposed Number of shares (Yen) (Yen)
-
-
-
-
-
-
-
-
-
-
-
-
Others (Note 2,3)
13,869
62,351,002
1,800
8,085,042
Number of treasury stock held (Note 4)
422,664
-
420,914
-
(NOTE) 1 The number of treasury stocks held during the current period does not include the number of treasury stocks purchased and disposed of from March 1, 2025 to the filing date of the Annual Securities Report. 2 The breakdown for the current fiscal year is due to the disposition by the exercise of stock options (13,800 shares, 62,040,798 yen) and the sale based on request for purchase less than one unit (69 shares, 310,204 yen) 3 The breakdown for the current term is due to the disposition by the exercise of stock options. 4. 517,230 shares of our company owned by Japan Custody Bank, Ltd. (Trust Account E) as trust assets under the "Stock Benefit Trust (BBT)" plan are not included in the above-mentioned treasury stock holdings.
―58―
(Translation) This document has been translated from the Japanese original for the convenience of overseas stakeholders. In the event of any discrepancy between this document and the Japanese original, the original shall prevail.
3 【Dividend Policy】 Based on the performance of our Group as a whole, we strive to ensure strategic growth investment, financial soundness, balance shareholder returns, and appropriately allocate corporate earnings in consideration of stable dividends. In addition, as a dividend policy during the period of the Medium-Term Management Plan up to FY2024, we aim to achieve a consolidated dividend payout ratio of 35% or more and to continuously increase the amount of dividends per share without setting a cap. Based on the above policy, the 22nd Ordinary General Meeting of Shareholders on March 26, 2025 resolved to pay a year-end dividend of 40 yen per share. As a result, the annual dividend, together with the interim dividend (40 yen per share), is set at 80 yen per share. (NOTE) Dividends of retained earnings with record dates in the current fiscal year are as follows: Total dividends Dividends per share Date of resolution (Million yen) (Yen) July 31, 2024 4,826 40 Board of Directors March 26, 2025 Annual Shareholders' 4,826 40 Meeting Regarding shareholder returns during the three-year period of our new medium-term management plan starting from FY2025, our policy is to "stable dividends with a target DOE (dividends on equity attributable to owners of the parent company) of approximately 3.5% and flexible share buybacks." Based on this policy, we will implement a stable dividend policy that is not affected by short-term profit fluctuations due to sudden changes in the environment. For the next fiscal year, we plan to pay an annual dividend of 80 yen per share (interim dividend of 40 yen and year-end dividend of 40 yen). The Company plans to pay dividends twice a year on the record dates of June 30 and December 31. The Articles of Incorporation stipulate that we may pay interim dividends as set forth in Paragraph 5 of Article 454 of the Companies Act.
―59―
(Translation) This document has been translated from the Japanese original for the convenience of overseas stakeholders. In the event of any discrepancy between this document and the Japanese original, the original shall prevail.
4 【Status of Corporate Governance】 (1) 【Overview of Corporate Governance】 ① Basic Approach to Corporate Governance On the basis of our corporate philosophy of "providing safety, comfort and a sense of security in daily lives as well as any form of transportation with our unique motion control technology," the Nabtesco Group will endeavor to strengthen its corporate governance by practicing the Nabtesco Way, in order to achieve sustained growth of the group, enhance corporate value over the medium and long term and earn greater trust from our stakeholders. We have developed the "Nabtesco Corporate Governance Basic Policy" by taking fully into account the intent and spirit of the Corporate Governance Code prescribed by Tokyo Stock Exchange, Inc. ①
Overview of Corporate Governance Structure Our business operations are conducted based on the executive officer system and in-house company system, and we have established the Board of Directors, Executive Officers, Audit & Supervisory Board Members, Accounting Auditors, and the Management Committee to deliberate on important matters related to the execution of business operations. The Management Committee clearly distinguishes the functions of management decision-making, supervision, execution and management oversight.
- Basic Explanation of the Company's Organization [Board of Directors] The Board of Directors formulates the Group’s basic policies and strategies, makes decisions about the execution of important business matters and supervises the way business is carried out. It shall be composed of up to ten Directors, with at least onethird of them being independent outside directors. The number of members of the Board of Directors is limited to 10, of which at least one-third are independent outside directors. As of the date of submission, the Board of Directors consisted of 9 members, including five independent outside directors. The Board of Directors received reports on our basic management policy, matters related to important business execution, resolutions on matters stipulated in laws and the Articles of Incorporation, and the status of the execution of important business. In principle, the Board of Directors meets once a month, and 15 meetings were held in FY2024. Attendance by individual directors in the current fiscal year is as follows. Attendance/number of meetings (Note 1)
Name, etc Chairman of the Board
Katsuhiro Teramoto (Note 2)
4 times/4 times
Representative Director
Kazumasa Kimura
15 times /15 times
Atsushi Habe (Note 4)
15 times /15 times
Toshiya Fujiwara (Note 4)
15 times /15 times
Seiji Takahashi
15 times /15 times
Kiyoshi Ando (Note 3)
11 times /11 times
Mari Iizuka
15 times /15 times
Naoko Mizukoshi
15 times /15 times
Naoki Hidaka
15 times /15 times
Toshiya Takahata
15 times /15 times
Seiichiro Shirahata
15 times /15 times
Director
Outside Directors
(NOTE)1 Figures are based on the number of meetings held during the period of service. 2 Retired on March 26, 2024. 3 Appointed on March 26, 2024. 4 Retired on March 26, 2025
[Executive Officers Committee] A body devoted to the execution of business pursuant to the policies and strategies of the Board of Directors and under the supervision of the Board. The current Executive Officers Committee is composed of 23 Executive Officers. [Audit & Supervisory Board] The Audit & Supervisory Board audits the execution of duties of the Board of Directors and prepares Audit Reports. As a way of strengthening audit functions of the Group in line with the reinforcement of the Group management, the Audit & Supervisory Board has strengthened its audit system by establishing the Group Audit & Supervisory Board, membership of which includes the Audit & Supervisory Board Members of the Group companies. The Audit & Supervisory Board shall be composed of five or less Audit & Supervisory Board Members, of whom half or more of the members shall be Audit & Supervisory Board Members (Independent). The current Audit & Supervisory Board is composed of five members including three Audit & Supervisory Board Members (Independent).
―60―
(Translation) This document has been translated from the Japanese original for the convenience of overseas stakeholders. In the event of any discrepancy between this document and the Japanese original, the original shall prevail.
[Management Committee] In line with the policies decided by the Board of Directors, the Management Committee serves as the body that discusses important matters relating to execution of the Group’s business and reports on results and the execution of business. It is composed of the President (CEO), the Presidents of the in-house companies, Executive Officers of Corporate Headquarters, and Senior General Managers, etc. [Nomination Committee] The Company established the Nominating Committee as a consultative body of the Board of Directors to deliberate on the nomination of candidates for Director, Audit & Supervisory Board Member, President (CEO) and Representative Director positions as well as a successor plan for the new President (CEO), etc., and to report the results to the Board of Directors. The Nominating Committee is composed of five or fewer members, including one internal director and three or more independent outside directors. As of the date of submission, there were five independent outside directors, including four outside directors, as follows: Chair person: Mari Iizuka (Outside Director) Member: Naoko Mizukoshi (Outside Director), Naoki Hidaka (Outside Director), Tetsuro Hirai (Outside Audit & Supervisory Board Member), Kazumasa Kimura (Representative director) In the fiscal year under review, we held three meetings of the Nominating Committee, which mainly deliberated on the appointment of executive officers and director candidates in FY2025, and reported to the Board of Directors. Attendance by individual members is as follows. Attendance/number of meetings (Note)
Name, etc Representative director
Kazumasa Kimura
3 times/3 times
Outside Director
Mari Iizuka(Chair Person)
3 times/3 times
Naoko Mizukoshi
3 times/3 times
Naoki Hidaka
3 times/3 times
Tetsuro Hirai
3 times/3 times
Audit & Supervisory Board Membe (independent)
(NOTE)
Figures are based on the number of meetings held during the period of service.
[Remuneration Committee] The Remuneration Committee, as a consultative body of the Board of Directors, deliberates on remuneration of the management team, etc. and reports the results to the Board of Directors The Remuneration Committee is composed of five or fewer members, including 1 internal director and three or more independent outside directors. As of the date of submission, there were five independent outside directors, including four outside directors, as follows: Chair person Naoko Mizukoshi (Outside Director) Member: Mari Iizuka (Outside Director), Toshiya Takahata (Outside Director), Masatoshi Hitomi (Outside Audit & Supervisory Board Member), Kazumasa Kimura (Representative director) In the fiscal year under review, we held four meetings of the Compensation Committee to discuss and report to the Board of Directors on the remuneration of directors in FY2024 based on the perspectives of the remuneration system and the concept of performance-linked remuneration as indicators. Attendance by individual members is as follows. Attendance/number of meetings (Note)
Name, etc Representative director
Kazumasa Kimura
4 times/4 times
Outside Director
Mari Iizuka
4 times/4 times
Naoko Mizukoshi ( Chair Person)
4 times/4 times
Toshiya Takahata
4 times/4 times
Takemi Nagasaka (Note 2)
1times/1 times
Masatoshi Hitomi
3 times/3 times
Audit & Supervisory Board Membe (independent)
(NOTE) 1 Figures are based on the number of meetings held during the period of service. 2 Retired on March 26, 2024
―61―
(Translation) This document has been translated from the Japanese original for the convenience of overseas stakeholders. In the event of any discrepancy between this document and the Japanese original, the original shall prevail.
[Compliance Committee] The Compliance Committee as a consultative body of the Board of Directors establishes and revises the "Nabtesco Group Code of Ethics" and deliberates priority challenges concerning the Group’s compliance system, and reports the results to the Board of Directors. The Compliance Committee is composed of members including independent outside directors and outside experts. As of the date of filing, the composition of the Compliance Committee is as follows: Chairman: Kazumasa Kimura (Representative director) Member: Seiji Takahashi, Hiroshi Usui, Tomoaki Shiramizu, Tomohiro Kiriyama, Yasuhiro Tanabe (Outside Audit & Supervisory Board Member), Makoto Matsuo (Partner of MOMO-O, MATSUO & NAMBA) [Business Auditing Department (nine members)] The Business Auditing Department conducts internal business audits of Corporate Headquarters, internal companies and Group companies. 2) Corporate Governance Related Diagram
- Current Status of Internal Control System Based on its Basic Polices for the Construction of an Internal Control System, Nabtesco is working to enhance all the areas associated with internal control—such as increased efficiency of management, compliance, information management, risk management and collaboration with the Audit & Supervisory Board Members under consistent principles, and integrate them to construct an internal control system. Outline of the Basic Policy for Establishing an Internal Control System Internal control for the Nabtesco Group shall be based on making The Nabtesco Way and the Nabtesco Group Code of Ethics cornerstones of proper and fair business activities, and requiring the Group’s directors, Audit & Supervisory Board Members and employees to comply with these norms and rules. The Chief Executive Officer (CEO) shall be the top executive responsible for the promotion of internal control. The Board of Directors shall examine the maintenance of internal control systems on a continual basis in line with changes in the business environment and social needs, revisions to laws and regulations, risk diversification and other factors, and shall conduct a review yearly and whenever else necessary.
―62―
(Translation) This document has been translated from the Japanese original for the convenience of overseas stakeholders. In the event of any discrepancy between this document and the Japanese original, the original shall prevail.
- Corporate Ethics Implementation and Thorough Implementation We have established the Nabtesco Group Code of Ethics in order to ensure that the entire Group will behave in a manner rooted in a higher sense of ethics, and we are working to implement and thoroughly implement corporate ethics. In addition, the Legal and Compliance Department, which is dedicated to compliance, promotes activities aimed not only at complying with laws and regulations, but also at establishing a higher standard of corporate ethics with the aim of enhancing the Group's corporate value over the medium to long term. In addition, we have established the Corporate Ethics Hotline and the Corporate Auditor Hotline to prevent and detect misconduct caused by violations of laws or illegal activities in our Group. Through the collection of information that is not reported on the ordinary line of office and appropriate measures, we are improving the self-cleansing function of the organization and ensuring social trust. ③ Risk Management System We have systems in place to ensure that profits, losses, asset efficiency, quality and disasters, among other matters, are reported to the Board of Directors properly and in a timely manner with respect to the execution of duties. By leveraging these systems, we strive for the early identification of risks and the minimization of losses. In order to eliminate antisocial forces, the Nabtesco Group Code of Ethics stipulates that the Nabtesco Group should cease any relationship with antisocial forces, and should an unreasonable demand from an antisocial force arise, it should take a firm stance, and that it should not respond to such demands. The Nabtesco Group strives to strengthen relations by, for example, obtaining the latest information on antisocial forces and receiving advice through daily cooperation with the police and antiviolence organizations, etc. Committees organized for the purpose of risk management include the following: [Management Materiality Committee] Through the identification of management materiality in our group, the formulation of action plans for materiality, and the management of progress, we aim to realize our long-term vision and improve our social, environmental, and economic value from both financial and non-financial perspectives from a long-term perspective. [Quality and PL Committee] Quality control and PL (Product Liability of products within our Group: Product safety control related to product liability) The objective of this system is to maintain and improve quality and ensure safety by establishing organizational and management standards for preventing quality defects, including safety defects, and for responding appropriately in the event of quality defects or PL issues. The system also aims to ensure the reliability of customers and contribute to the development of management. [ESH Committee] (Environment, Safety & Health: ESH) In addition to complying with basic policies concerning environmental preservation, safety, disaster prevention, and health, as well as domestic and overseas laws and regulations related to all of our business activities, from research and development to production, distribution, and sales of products, we have established standards for items that should be managed companywide, with the aim of ensuring the environmental preservation of the local community, the safety and health of employees and those engaged in business activities together with employees, and coexisting with the global environment, and fulfilling our corporate social responsibilities. [Risk Management Committee] The aim is to maintain and strengthen our group's risk management system by identifying major risks in our group, discussing countermeasures against them, and monitoring the status of risk management related to such risks.
[Information Security Committee] The aim is to establish basic rules for cyber security in our group and to promote efforts to improve the level of cyber security, and to respond swiftly in the event of a serious incident. ④ Status of Development of Systems to Ensure the Appropriateness of the Operations of Subsidiaries of the Reporting Company In addition to clarifying responsibilities and authority related to business execution in the Group Responsibility and Authority Regulations, our Group endeavors to execute business appropriately and efficiently by establishing a division of duties among each division. In addition, we have dispatched our officers and employees to our group companies as directors or corporate auditors to create a system that enables us to regularly and continuously comprehend important matters of our group companies, reports on business execution, monthly financial statements, and other details of the management of our group companies.
―63―
(Translation) This document has been translated from the Japanese original for the convenience of overseas stakeholders. In the event of any discrepancy between this document and the Japanese original, the original shall prevail.
⑤ Outline of limited liability agreement As the Company stipulates in the Articles of Incorporation provisions to enable the conclusion of limited liability agreements with Outside Directors and Audit & Supervisory Board Members (Independent), a limited liability agreement has been concluded with Outside Directors Mari Iizuka,Naoko Mizukoshi, Naoki Hidaka, Toshiya Takahata, and . Seiichiro Shirahata, and Audit & Supervisory Board Members (Independent) Messrs. Tetsuro Hirai, Masatoshi Hitomi, and Yasuhiro Tanabe. The details of the agreement are as follows. • Liability for damages under the agreement will be limited to 10 million yen or the amount set forth by laws and regulations, whichever is higher. • The limitation of liability mentioned above applies only if the Outside Director or Audit & Supervisory Board Member (Independent) acts in good faith and without gross negligence when performing their duties. ⑥ Matters concerning Directors and Officers liability insurance contract The Company has a Directors and Officers liability insurance contract (management risk protection insurance contract) in effect, as stipulated in Article 430-3 of the Companies Act, covering all Directors, Audit & Supervisory Board Members and Executive Officers of the Company and all its subsidiaries. An overview of the said contract is as follows. • The contract covers the liability of the insured for legal dispute fees and compensation for damages, etc. arising from company lawsuits, third-party lawsuits, shareholder’s derivative suits, etc. • Damages, etc. arising from criminal acts, etc. by the insured are not covered as a measure to prevent the impairment of the appropriateness of execution of duties by the insured. • The Company is fully responsible for insurance fees under the said contract. ⑦ Number of directors The Articles of Incorporation stipulate that we have no more than 10 directors. ⑧ Selection of Directors The Articles of Incorporation of the Company provide that the resolution for the election of directors at the general meeting of shareholders shall be made by a majority of the votes of shareholders present who hold one-third or more of the voting rights of shareholders who are entitled to exercise their voting rights and shall not be made by cumulative voting. ⑨ Items that can be resolved at the Board of Directors meeting
- Purchase of treasury stock Pursuant to Paragraph 2 of Article 165 of the Companies Act, the Company's Articles of Incorporation provide that it may acquire its own shares by resolution of the Board of Directors. This is aimed at executing a flexible capital policy.
- Interim dividend Pursuant to Article 454, Paragraph 5 of the Companies Act, the Company's Articles of Incorporation provide that interim dividends may be paid by resolution of the Board of Directors. This is intended to provide flexible returns to shareholders.
- Exemption of Directors and Corporate Auditors from Liability The Company's Articles of Incorporation provide that, in the event of bona fide conduct and no gross negligence, the liability of directors and corporate auditors may be exempted from such liability within the limit set by laws and regulations by a resolution of the Board of Directors pursuant to the provisions of Paragraph 1 of Article 426 of the Companies Act. This is aimed at enabling directors and corporate auditors to fully fulfill their expected roles. ⑩ Requirements for Special Resolution at Shareholders Meetings The Articles of Incorporation of the Company stipulate that the resolutions of general meetings of shareholders pursuant to the provisions of Article 309, Paragraph 2 of the Companies Act shall be adopted by two-thirds or more of the voting rights of shareholders present who hold one-third or more of the voting rights of shareholders who are entitled to exercise their voting rights. This is intended to facilitate the smooth operation of the General Meeting of Shareholders.
―64―
(Translation) This document has been translated from the Japanese original for the convenience of overseas stakeholders. In the event of any discrepancy between this document and the Japanese original, the original shall prevail.
(2) 【Directors and Audit & Supervisory Board Members】 ① Directors and Audit & Supervisory Board Members 12 male and 2 female within management (Female ratio in management: 14.3%) Position Name
Position Name Date of birth
Brief history
Term
Jun. 2011
Representative Director Kazumasa Chief Executive Kimura Officer
Aug. 17, 1961
Representative Director, Managing Executive Officer, General Seiji Administration, Takahashi Human Resources and Legal & Compliance
Feb. 12, 1966
(CEO)
General Manager, Manufacturing Department, Tsu Plant, Precision Equipment Company of Nabtesco Corporation Jun. 2012 General Manager, Manufacturing department, Tarui Plant, Power Control Company of Nabtesco Corporation Apr. 2015 Representative Director and Vice President of Hyest Corporation (merged into Nabtesco Corporation in Apr. 2016) Mar. 2016 General Manager, Production Management Department, Power Control Company of Nabtesco Corporation Mar. 2017 Executive Officer and President, Power Control Company of Nabtesco Corporation Jan. 2019 Executive Officer, Corporate Planning, Accounting & Finance, Note 3 Information System and Corporate Communication of Nabtesco Corporation Mar. 2019 Director of Nabtesco Corporation Jan. 2021 Managing Executive Officer, Component Solution Segment, Senior General Manager, Technology and R&D Division, and in charge of Production Innovation of Nabtesco Corporation Jan. 2022 Assistant to Chief Executive Officer of Nabtesco Corporation Mar. 2022 Representative Director (to present), President (to present), and Chief Executive Officer of Nabtesco Corporation (to present) Jun. 2010 General Manager, Human Resources Department of Nabtesco Corporation Jul. 2015 General Manager, Human Resources Department of Nabtesco Corporation and President of Nabtesco Link Co., Ltd Aug. 2017 General Manager, Human Resources Department, Business Transformation Division of Nabtesco Corporation and President of Nabtesco Link Co., Ltd Mar. 2018 Executive Officer of Nabtesco Corporation Jan. 2021 Vice President, Accessibility Innovations Company, and in Note 3 charge of Business Management of Nabtesco Corporation Jan. 2022 Vice President, Accessibility Innovations Company of Nabtesco Corporation Jan. 2023 Managing Executive Officer (to present), President, Accessibility Innovations Company of Nabtesco Corporation Mar. 2023 Director of Nabtesco Corporation
Jan. 2025
Number of shares of the Company held
7,494
3,909
General Administration, Human Resources and Legal & Compliance (to present)
Mar. 2025 Representative Director (to present) Apr. 2008 General Manager, Development Department, Precision Equipment Company of Nabtesco Corporation
Jun. 2015 Executive Officer of Nabtesco Corporation (to present) Feb. 2017 Technology and R&D Division, in charge of European business of Nabtesco Corporation
Apr. 2017 Technology and R&D Division, in charge of European Director, Executive Officer, Component Kiyoshi Solution Ando Segment, President, Power Control Company
May 2017
Jan. 10, 1964
May 2018 Jul. 2018 Jan. 2019 Jan. 2020 Jan. 2021 Mar. 2024 Jan. 2025
Director Managing Executive Officer, Corporate Planning, Accounting & Finance, Information Systems and Corporate Communication
Dec. 2009 Apr. 2013 Hiroshi Usui
Apr. 22, 1965
Mar. 2017 Jan. 2020 Jan. 2023 Jan. 2025 Mar. 2025
business, and General Manager, Advanced Mobility System Division of Nabtesco Corporation Technology and R&D Division, in charge of European business, and General Manager of Advanced Mobility System Division of Nabtesco Corporation and President of Nabtesco Europe GmbH Technology and R&D Division, in charge of European Note 3 business, and General Manager, Advanced Mobility System Division of Nabtesco Corporation Deputy Senior General Manager, Technology and R&D Division, in charge of Innovation, and General Manager, Advanced Mobility System Division of Nabtesco Corporation Deputy Senior General Manager, Technology and R&D Division, in charge of Innovation of Nabtesco Corporation Deputy Senior General Manager, Technology and R&D Division of Nabtesco Corporation President, Power Control Company of Nabtesco Corporation (to present) Director of Nabtesco Corporation (to present) Executive Officer, Component Solution Segment (to present) General Manager, Engineering Department, Aerospace Company of the Company General Manager, Planning Department, Aerospace Company of the Company President of Nabtesco Aerospace Inc Executive officer of the Company (to present) General Manager, Planning Department, Aerospace Company of the Company Note 3 Vice President, Aerospace Company, and Plant Manager, Gifu Plant of the Company Corporate Planning, Accounting & Finance, Information Systems and Corporate Communication of the Company (to present) Director of Nabtesco Corporation (to present)
―65―
8,388
2,308
(Translation) This document has been translated from the Japanese original for the convenience of overseas stakeholders. In the event of any discrepancy between this document and the Japanese original, the original shall prevail.
Position Name
Position Name Date of birth
Brief history
Apr. 1982
Director
Mari Iizuka
Mar. 29, 1959
Aug. 1987 Jul. 1992 Apr. 2005 Apr. 2007 Apr. 2008 Apr. 2010 Mar. 2020 Apr. 1995 Apr. 1998 Sep. 1999
Director
Naoko Mizukoshi
Sep. 23, 1967
Sep. 2002 Nov. 2006 Jan. 2008 Mar. 2010 Jun. 2018 Dec. 2018 Mar. 2020 Apr. 1976 Apr. 2001 Apr. 2007 Apr. 2009 Apr. 2012
Director
Naoki Hidaka
May 16, 1953
Jun. 2013 Apr. 2015 Jun. 2018 Jun. 2019 Jun. 2020 Mar. 2021 Jun. 2022 Apr. 1986 Apr. 2012 Jun. 2014 Jun. 2015 Jun. 2016
Director
Toshiya Takahata
Nov. 19, 1963
Oct. 2018 Apr. 2019 Jun. 2019 Apr. 2020 Mar. 2022 Apr. 1983 Apr. 2009 Apr. 2013 Apr. 2015
Director
Seiichiro Shirahata
Mar. 3, 1961
Jan. 2018 Mar. 2018 Mar. 2020 Jan. 2022 Mar. 2023 Jun. 2024
Term
Joined Henkel Hakusui Corporation (current Henkel Japan Ltd.) Joined The World Bank Asian Institute of Management Graduate school of Business Assistant Professor of Ritsumeikan Asia Pacific University Graduate School of Management Note 3 Associate Professor of Ritsumeikan Asia Pacific University Graduate School of Management Professor of Ritsumeikan Asia Pacific University Graduate School of Management Professor of Doshisha Business School (to present) Director of Nabtesco Corporation (to present) Registered at Osaka Bar Association Joined Miyazaki Law Firm Registered at Yokohama Bar Association (current Kanagawa Bar Association) Joined Nomura Research Institute, Ltd Registered at Dai-ni Tokyo Bar Association Joined Autodesk Co., Ltd. Registered at the State of California Bar Joined Microsoft Co., Ltd. (current Microsoft Japan, Co., Ltd.) Note 3 Joined TMI Associates Partner of TMI Associates Partner of Endeavour Law Office External Director of TIS Inc. (to present) Partner of Leftright Law & IP (to present) Director of Nabtesco Corporation (to present) Joined SUMITOMO CORPORATION General Manager, Chicago Branch, Sumitomo Corporation of U.S.A. Executive Officer, General Manager of Metal Products for Automotive Industry Division of SUMITOMO CORPORATION Managing Executive Officer, Head of Chubu Block of SUMITOMO CORPORATION Senior Managing Executive Officer, Head of Kansai Block of SUMITOMO CORPORATION Representative Director, Senior Managing Executive Officer, and General Manager, Transportation & Construction Systems Business Unit of SUMITOMO CORPORATION Representative Director, Executive Vice President, Executive Officer, and General Manager, Transportation & Construction Systems Business Unit of SUMITOMO CORPORATION Special Adviser of SUMITOMO CORPORATION Adviser of SUMITOMO CORPORATION (retired in March 2020) Outside Director of BROTHER INDUSTRIES, LTD. (to present) Director of Nabtesco Corporation (to present) Outside Director of TOPCON CORPORATION (to present)
Note 3
Joined Seiko Epson Corporation Deputy Chief Operating Officer, Printer Operations Division of Seiko Epson Corporation Executive Officer of Seiko Epson Corporation General Administrative Manager, Intellectual Property Division of Seiko Epson Corporation Executive Officer of Seiko Epson Corporation (retired in March 2021) General Administrative Manager, Corporate Planning Division Note 3 of Seiko Epson Corporation General Administrative Manager, DX Division of the Seiko Epson Corporation Director of Seiko Epson Corporation (retired in June 2021) General Administrative Manager, Corporate Strategy Division, General Administrative Manager, Sustainability Promotion Office of Seiko Epson Corporation Director of Nabtesco Corporation (to present) Joined Nippon Paint Co., Ltd. (current Nippon Paint Holdings Co., td.) Division Director, Surface Treatment of Nippon Paint Co.,Ltd. Executive Officer of Nippon Paint Co., Ltd. Senior Executive Officer of Nippon Paint Holdings Co., Ltd. President, Representative Director of the Board of Nippon Paint Surf Chemicals Co., Ltd. Vice President of Nippon Paint Holdings Co., Ltd. President, Representative Director of the Board of Nippon Paint Marine Note 3 Coatings Co., Ltd Vice President, Director of the Board of Nippon Paint Holdings Co.,Ltd Vice President of Nippon Paint Holdings Co., Ltd Adviser of Nippon Paint Holdings Co., Ltd. (retired in December 2022) Director of Nabtesco Corporation (to present) Outside Director of LINTEC Corporation (to present)
―66―
Number of shares of the Company held
382
458
1,143
535
342
(Translation) This document has been translated from the Japanese original for the convenience of overseas stakeholders. In the event of any discrepancy between this document and the Japanese original, the original shall prevail.
Position Name
Position Date of birth Name
Brief history
Jun. 2010
Audit & Supervisory Board Members
Jun. 2015
Koji Nakano
Jan. 2, 1962,
Mar. 2018 Jan. 2022 Mar. 2023 Jun. 2009 Jun. 2011
Audit & Yasuhito Supervisory Nakagawa Board Members
Jul. 2013
May 10, 1963
May 2014 Jan. 2016 Jan. 2020 Mar. 2024 Apr. 1980 Jan. 2006
Audit & Tetsuro Supervisory Hirai Board Members (Independent)
Dec. 19, 1955
Jan. 2008 Jun. 2010 Jun. 2011 Apr. 2018 Mar. 2019 Apr. 1981 Mar. 2003 Feb. 2006
Audit & Supervisory Masatoshi Board Members Hitomi (independent)
Apr. 2009
Nov. 9, 1957
Sep. 2010 Feb. 2015 Jul. 2016 Mar. 2017 Jan. 2020 Mar. 2024 Apr. 1987 May 2010 Dec. 2010 Jul. 2012 Apr. 2013 Jan. 2014
Audit & Supervisory Yasuhiro Board Members Tanabe (independent)
Nov. 7, 1960
Nov. 2014 Dec. 2015 Jun. 2017 Nov. 2019 Apr. 2021 Jun. 2022 Oct. 2023 Nov. 2023 Dec. 2023 Mar. 2024
Term
General Manager, Accounting & Finance Department of Nabtesco Corporation General Manager, Corporate Planning Department of Nabtesco Corporation General Manager of Shanghai Nabtesco Hydraulic Co., Ltd. Note 4 Executive Officer of Nabtesco Corporation Executive Officer, Business Audit of Nabtesco Corporation Audit & Supervisory Board Member of Nabtesco Corporation (to present) General Manager, Manufacturing Department, Tsu Plant, Precision Equipment Company of Nabtesco Corporation Plant Manager, Tsu Plant, Precision Equipment Company of Nabtesco Corporation Senior Manager, Assistant to General Manager, Production Innovation Division of Nabtesco Corporation Senior Manager, assistant to President, Precision Equipment Note 5 Company of Nabtesco Corporation President, Nabtesco (China) Precision Equipment Co., Ltd. Executive Officer (to present) and General Manager, Production Innovation Division (to present) of Nabtesco Corporation Audit & Supervisory Board Member of Nabtesco Corporation (to present) Joined Toyota Motor Co., Ltd. (current Toyota Motor Corporation) General Manager, Vehicle Planning Department, Global Strategic Production Planning Division and Project General Manager of China Division of Toyota Motor Corporation General Manager, Machinery Division, Motomachi Plant of Toyota Motor Corporation (retired in Jun. 2010) Note 4 Executive Officer of Toyota Tsusho Corporation Managing Executive Officer of Toyota Tsusho Corporation Technical Supervisor of Toyota Tsusho Corporation Audit & Supervisory Board Member of Nabtesco Corporation (to present) Joined Sony Corporation (current Sony Group Corporation) General Manager, Production Planning Department, Microsystems Network Company of Sony Corporation Representative Director and CFO of S-LCD Corporation (current Samsung Display Director, General Manager, Planning Management Department of Sony Energy Devices Corporation EVP & CFO of Sony Electronics Inc Note 5 The Audit Committee Aide of Sony Corporation General Manager, Administration Department of Soliton Systems K.K Director, General Manager, Administration Department of Soliton Systems K.K. (retired in March 2020) Outside Director of JAI A/S Audit & Supervisory Board Member of Nabtesco Corporation (to present) Appointed Public Prosecutor Deputy General Manager, Special Trial Department of Tokyo District Public Prosecutors Office Deputy Superintending Prosecutor of Sendai District Public Prosecutors Office General Manager, Special Trial Department of Tokyo District Public Prosecutors Office General Manager, Criminal Affairs Department of Tokyo District Public Prosecutors Office General Manager, Criminal Affairs Department of Tokyo High Public Prosecutors Office Chief Prosecutor of Naha District Public Prosecutors Office Deputy Superintending Prosecutor of Osaka District Public Prosecutors Office Deputy Superintending Prosecutor of Osaka High Public Prosecutors Office Chief Prosecutor of Osaka District Public Prosecutors Office Superintending Prosecutor of Sapporo High Public Prosecutors Office Superintending Prosecutor of Fukuoka High Public Prosecutors Office (retired in July 2023) Special Advisor, National Institute of Advanced Industrial Science and Technology (to present) Registered at Dai-ni Tokyo Bar Association Joined Tokyo Fuji Law Office (to present) Audit & Supervisory Board Member of Nabtesco Corporation (to present) Total
Note 5
Number of shares of the Company held
13,700
7,747
-
1,171
-
47,577
(NOTE)1 Directors of Mari Iizuka, Naoko Mizukoshi, Naoki Hidaka, Toshiya Takahata and Seiichiro Shirahata are independent outside directors. 2 Audit & Supervisory Board Members of Tetsuro Hirai, Masatoshi Hitomi and Yasuhiro Tanabe are independent. 3 From the close of the ordinary general meeting of shareholders held on March 26, 2025 to the close of the ordinary general meeting of shareholders for FY2025. 4 From the close of the ordinary general meeting of shareholders held on March 23, 2023 to the close of the ordinary general meeting of shareholders for FY2026. 5 From the close of the ordinary general meeting of shareholders held on March 26, 2024 to the close of the ordinary general meeting of shareholders for FY2027. 6 Skill matrix of specialization of each Directors and Audit & Supervisory Board Members are as follows.
―67―
(Translation) This document has been translated from the Japanese original for the convenience of overseas stakeholders. In the event of any discrepancy between this document and the Japanese original, the original shall prevail.
Field of specialization
Level of independenc e
Corporate management
Global
Legal, personnel & Manufacturing Financial labor affairs and risk and accounting management technology
Directors
Kazumasa Kimura
●
Seiji Takahashi
●
Kiyoshi Ando
●
●
Hiroshi Usui
●
●
●
●
●
●
●
● ●
● ●
●
●
Naoko Mizukoshi
●
Naoki Hidaka
●
●
●
●
●
●
●
Koji Nakano
●
●
Yasuhito Nakagawa
●
●
●
●
●
●
●
●
●
●
Audit & Supervisory Board Members
Tetsuro Hirai Masatoshi Hitomi Yasuhiro Tanabe
●
DX
●
Mari Iizuka
Toshiya Takahata Seiichiro Shirahata
Sales and marketing
● ●
●
●
● ●
●
●
● ●
●
● ●
―68―
●
(Translation) This document has been translated from the Japanese original for the convenience of overseas stakeholders. In the event of any discrepancy between this document and the Japanese original, the original shall prevail. (NOTE) 7 In order to invigorate the Board of Directors by separating decision-making and supervision from execution, the Company has introduced an executive officer system, and the business execution structure is as follows
Position
Name
President
Kazumasa Kimura
Duties Chief Executive Officer (CEO)
Managing Executive Seiji Takahashi General Administration, Human Resources and Legal & Compliance Officer Managing Executive Norimasa Takagi President, Aerospace Company Officer Managing Executive Officer
Michihito Suzuki
Executive Officer
Kiyoshi Ando
Executive Officer
Hiroshi Usui
Corporate Planning, Accounting & Finance, Information Systems, and Corporate Communication
Executive Officer
Ataru Inoue
President, Nabtesco Automotive Co., Ltd.
Executive Officer
Yukihiro Mizutani
President, Marine Control Systems Company
Executive Officer
Koichi Miyaguchi
General Manager, Innovation Strategy Division, and CVC Promotion Department
Executive Officer
Masakazu Kurita
Deputy General Manager, Innovation Strategy Division, and General Manager, New business Promotion Department
Executive Officer
Tomoaki Shiramizu
General Manager, Production Innovation Division
Executive Officer
Akihito Enomoto
Responsible for Sales Management, General Manager, Sales Business Development Department, Railroad Products Company
President, Railroad Products Company Component Solution Segment
President, Power Control Company
Executive Officer
Hiroshi Nerima President, Nabtesco Technology Ventures AG
Executive Officer
Hiroki Higuchi
Executive Officer
Tomohiro Kiriyama
Senior General Manager, Technology and R&D Division, and Innovation Strategy Division
Executive Officer
Kazumasa Shimizu
President, Nabtesco Service Co., Ltd.
Executive Officer
Takeshi Hanafusa
President, Accessibility Innovations Company
Executive Officer
Hiroki Mori
General Manager, Sales Management Department and Sales Business Development Department, Precision Equipment Company
Executive Officer
Isao Ohashi
Deputy Senior General Manager, Technology and R&D Division, and in charge of Smart Motion Control Technology
Executive Officer
Sakiko Honda
General Manager, Human Resources Department, Innovation Strategy Division, and President, Nabtesco Link Co., Ltd.
Executive Officer
Masaru Sasaki
General Manager, Corporate Planning Department, and Innovation Strategy Division
Executive Officer
Masaru Sakamoto
Director, Nabtesco Automotive Co., Ltd.
President, Precision Equipment Company
Executive Officer Atsushi Takabatake Director, PACRAFT Co., Ltd. (NOTE) The business execution structure consists of 23 members, four of whom also serve as directors.
―69―
(Translation) This document has been translated from the Japanese original for the convenience of overseas stakeholders. In the event of any discrepancy between this document and the Japanese original, the original shall prevail.
② Outside Directors and Audit & Supervisory Board Members (Independent) The Company has five outside directors and three Audit & Supervisory Board Members (Independent) Mari Iizuka has a high level of expertise in the fields of global management human resources and international management strategies. In addition, she has participated in activities for promoting collaboration and cooperation between industry and academia, and has extensive insight based on such experience. For the Company, she has appropriately supervised management as an Outside Director since March 2020 and has also contributed to the strengthening of governance as chairman of the Nominating Committee and as a member of the Remuneration Committee. Although Mari Iizuka has not been involved in corporate management except as an Outside Director of the Company, the Company expects her to provide supervision and advice utilizing her insight to realize the Company's long-term vision toward 2030 and medium- to longterm improvement in corporate value. Based on her experience and insight, the Company has re-appointed Mari Iizuka as Outside Director, as we expect her to provide supervision and advice utilizing her insight. There are no conflict of interest between The Doshisha and the other organizations, where Mari Iizuka serves, and the Company. Reasons for nomination as a candidate for Outside Director and overview of expected role:Naoko Mizukoshi has a high level of expertise as an attorney-at-law. In addition, she has held various posts including outside officers of other business entities and posts in public offices, including being a member of Unfair Competition Prevention Subcommittee, Intellectual Property Committee, Industrial Structure Council, Ministry of Economy, Trade and Industry and has extensive insight based on such experience. For the Company, she has appropriately supervised management as an Outside Director since March 2020 and also contributed to the strengthening of governance as chairman of the Remuneration Committee and as a member of the Nominating Committee. Although Naoko Mizukoshi has not been involved in corporate management except as an Outside Director of the Company, the Company expects her to provide supervision and advice utilizing her insight to realize the Company's long-term vision toward 2030 and medium- to longterm improvement in corporate value. Based on her experience and insight, the Company has appointed Naoko Mizukoshi as Outside Director, as we expect her to provide supervision and advice utilizing her insight. There are no conflict of interest between Endeavour Law Office, where Naoko Mizukoshi served as Partner; and Leftright Law & IP, where she serves, and the Group. Naoki Hidaka has diverse operational experience in overseas businesses as well as the business of transportation and construction systems, which are the Company's business domain, and also has extensive insight based on his experience as a corporate manager. For the Company, he has appropriately supervised management as an Outside Director of the Company since March 2021 and also contributed to the strengthening of governance as a member of the Nominating Committee. The Company therefore expects him to provide supervision and advice utilizing his knowledge to realize the Company's longterm vision toward 2030 and medium- to long-term improvement in corporate value, the Company has appointed Naoki Hidaka as Outside Director, as we expect him to provide supervision and advice utilizing his knowledge. There are no conflict of interest between BROTHER INDUSTRIES, LTD., TOPCON CORPORATION and the other organizations, where Naoki Hidaka serves, and the Company. Toshiya Takahata has diverse operational experience in operations related to intellectual property, digital transformation, corporate planning, and sustainability, and also has extensive insight based on his experience as a corporate manager. For the Company, he has appropriately supervised management as an Outside Director since March 2022 and also contributed to the strengthening of governance as a member of the Remuneration Committee. The Company therefore expects him to provide supervision and advice utilizing his knowledge to realize the Company's long-term vision toward 2030 and medium- to longterm improvement in corporate value, the Company has appointed Toshiya Takahata as Outside Director, as we expect him to provide supervision and advice utilizing his insight. There are no conflict of interest between Seiko Epson Corporation, and the other organizations, where Toshiya Takahata serves, and the Company. Seiichiro Shirahata has experience in long-term overseas assignment as an engineer as well as diverse operational experience as a person responsible for the transition into a holding company and the spin-off of business segments, and also has extensive insight based on his experience as a corporate manager. For the Company, he has appropriately supervised management as an Outside Director since March 2023. The Company therefore expects him to provide supervision and advice utilizing his knowledge to realize the Company's long-term vision toward 2030 and medium- to long-term improvement in corporate value, the Company has appointed Seiichiro Shirahata as Outside Director, as we expect him to provide supervision and advice utilizing his insight. There are no conflict of interest between organizations, where Seiichiro Shirahata serves, and the Company. Seiichiro Shirahata is to assume office as Outside Director of LINTEC Corporation as of June 20, 2024. Tetsuro Hirai has broad experience and extensive knowledge and insight on production. Additionally, he has experience as a corporate manager. The Company has appointed Tetsuro Hirai as Audit & Supervisory Board Member (Independent), so that we may seek his fair decisions based on the above, and objectiveness and neutrality toward management to strengthen our corporate governance. There are no conflict of interest between organizations, where Tetsuro Hirai serves, and the Company.
―70―
(Translation) This document has been translated from the Japanese original for the convenience of overseas stakeholders. In the event of any discrepancy between this document and the Japanese original, the original shall prevail.
Masatoshi Hitomi has been engaged in accounting and administration in Japan and abroad for many years, and possesses broad insight into finance and accounting as well as experience in management. In addition, at Sony Corporation (current Sony Group Corporation), he was engaged in auditing by the Audit Committee. The Company has appointed Masatoshi Hitomi as Audit & Supervisory Board Member (Independent), so that we may seek his fair decisions based on the above, and objectiveness and neutrality toward management to strengthen our corporate governance. There are no conflict of interest between organizations, where Masatoshi Hitomi serves, and the Company. Although Yasuhiro Tanabe has not been directly involved in corporate management, he served as a prosecutor for many years and has a high level of knowledge about laws and regulations. He also has a high level of expertise and insight into organizational management in general. The Company has appointed Yasuhiro Tanabe as Audit & Supervisory Board Member (Independent), so that we may seek his fair decisions based on the above, and objectiveness and neutrality toward management to strengthen our corporate governance. There are no conflict of interest between National Institute of Advanced Industrial Science and Technology, Tokyo Fuji Law Office and the other organizations, whereYasuhiro Tanabe serves, and the Company. The Company has established its own criteria for objectively determining the independence of outside directors and Audit & Supervisory Board Members (independent) (hereinafter collectively referred to as "outside officers"), and all of the Company's outside officers are independent in accordance with the following criteria. [Criteria for the Impartiality of Outside Directors/Audit & Supervisory Board Members (independent)] The Company considers an Outside Director/Audit & Supervisory Board Members (independent) to be impartial if all of the following requirements are met.
- The Outside Director/Audit & Supervisory Board Member is not a current major shareholder* of the Company or an executive of such shareholder; * Person who directly or indirectly holds more than 5% of all voting rights or a person who is listed among the top 10 shareholders in the most recent shareholder registry
- The Outside Director/Audit & Supervisory Board Member is not an executive of a major lender * of the Group; * A financial institution group (person who belongs to the consolidated group to which the Group’s direct lender belongs) from which the Group borrows funds, and from which the Group’s total amount of borrowing exceeds 2% of the Group’s consolidated total assets as of the end of the previous fiscal year
- The Outside Director/Audit & Supervisory Board Member is not a major business partner of the Group (defined by a yearly transaction amount that exceeds 1% of consolidated net sales) or its executive;
- The Outside Director/Audit & Supervisory Board Member is not a person for whom the Group is a major business partner (defined by a yearly transaction amount that exceeds 1% of the counterparty’s consolidated net sales) or its executive;
- The Outside Director/Audit & Supervisory Board Member is not a consultant, accounting professional, or legal professional who receives a large amount of remuneration (more than ¥6 million yearly) from the Group other than officers’ remuneration (including a case where an organization such as a corporation or an association to which the Outside Officer belongs receives remuneration);
- The Outside Director/Audit & Supervisory Board Member is not an executive of an organization such as a corporation or an association that receives a large amount of donations (more than ¥6 million yearly) from the Group;
- The Outside Director/Audit & Supervisory Board Member is not a spouse or a relative within the second degree of consanguinity of the Group’s executive; and
- The Outside Director/Audit & Supervisory Board Member does not fall under any of the above-mentioned items from (1) through (6) for the past three years.
- The Outside Director/Audit & Supervisory Board Member holds his/her office as an outside officer of Nabtesco for a period not exceeding eight years in total.
③ Relationship between supervision or auditing by outside directors or Audit & Supervisory Board Members (independent) and internal audits, corporate auditors, and accounting audits, as well as with the internal control division. The status of coordination and procedures among the Audit & Supervisory Board members (including outside Audit & Supervisory Board members), the accounting auditor, and the internal audit department, as well as the relationship with the internal audit department are described in [(3) Status of audits; ③ Cooperation with internal audits, audits by Audit & Supervisory Board members, and accounting audits.]
―71―
(Translation) This document has been translated from the Japanese original for the convenience of overseas stakeholders. In the event of any discrepancy between this document and the Japanese original, the original shall prevail.
(3) 【Status of audits】 ① Audits by Audit & Supervisory Board Members
- Audit & Supervisory Board Members and organization Our Audit & Supervisory Board consists of five members, two full-time and three Independent (part-time). Position
Name
Audit & Supervisory Board Members
Koji Nakano
Yasuhito Nakagawa
Audit & Supervisory Board Members (Independent)
Brief history
He has engaged mainly in finance, accounting and corporate planning divisions, and possesses management experience at Shanghai Nabtesco Hydraulic Co., Ltd., in addition to broad insight in the fields of finance and accounting and internal audit. He served as General Manager, Manufacturing Department, Tsu Plant, Precision Equipment Company and Plant Manager of the Plant and served as General Manager, Production Innovation Division. He also chaired the Group’s Environment, Safety & Health Committee. He thus has expertise and experience in production, particularly production technology and production management, as well as in environment, safety and health. In addition, he was engaged in management at Nabtesco (China) Precision Equipment Co., Ltd.
Tetsuro Hirai
He has broad experience and extensive knowledge and insight on production and has management experience.
Masatoshi Hitomi
He has been engaged in accounting and administration in Japan and abroad for many years, and possesses broad insight into finance and accounting as well as experience in management. In addition, at Sony Corporation (current Sony Group Corporation), he was engaged in auditing by the Audit Committee.
Yasuhiro Tanabe
Although he has not been directly involved in corporate management, he served as a prosecutor for many years and has a high level of knowledge about laws and regulations. He also has a high level of expertise and insight into organizational management in general.
In addition, we regularly hold liaison meetings (described below with the Group Audit & Supervisory Board) with domestic Group company Audit & Supervisory Board members, which are composed of the Audit & Supervisory Board members of each Group company, with the aim of sharing Group audit policies, priority implementation items, and audit information of each company, and raising the effectiveness of audits at each Group company. At the request of the Audit & Supervisory Board members, two employees are assigned to assist the Audit & Supervisory Board members in carrying out their duties. 2) Activities of Audit & Supervisory Board Members In principle, the Audit & Supervisory Board Members meets once a month, and 13 meetings were held in Fiscal Year 2024. Attendance by individual corporate auditors is as follows. Name, etc Audit & Supervisory Board Members Audit & Supervisory Board Members (Independent)
Isao Shimizu (Note 2) Koji Nakano Yasuhito Nakagawa (Note 3) Zenzo Sasaki (Note 2) Takemi Nagasaka (Note 2) Tetsuro Hirai Masatoshi Hitomi (Note 3) Yasuhiro Tanabe (Note 3)
Attendance/number of meetings (Note 1) 3 times/3 times 13 times /13 times 10 times/10 times 3 times/3 times 3 times/3 times 13 times /13 times 10 times /10 times 10 times /10 times
(NOTE) 1 Figures are based on the number of meetings held during the period of service. 2 Retired on March 26, 2024. 3 Appointed on March 26, 2024
The main matters discussed and reported by the Audit & Supervisory Board during the fiscal year under review are as follows. The time required is about one hour per time. Matters for Audit Plan by Audit & Supervisory Board Members, re-appointment of Accounting Consultation Auditors, consent to audit fees of Accounting Auditors, Approval of Non-Guarantee Services by Accounting Auditors, audit reports of the Audit & Supervisory Board, etc. Matters to be Reports on the results of audits, reports on receipt of management confirmation Reported reports, reports on attendance at important meetings, reports on corporate auditors at meetings of the Board of Directors, and summary reports on important matters such as the Management Committee
―72―
(Translation) This document has been translated from the Japanese original for the convenience of overseas stakeholders. In the event of any discrepancy between this document and the Japanese original, the original shall prevail.
- Activities of Audit & Supervisory Board and Audit & Supervisory Board Member We established audit policies and priority audit items for the current fiscal year as shown in the table below. Basic Auditing Policy Priority audit items
As an independent body entrusted by shareholders, Audit & Supervisory Board members shall contribute to ensuring the sound management of the Nabtesco Group and establishing a highquality corporate governance system that responds to social trust by auditing the execution of duties by directors. <Development and Operation of Internal Control System> ① Operational effectiveness and efficiency: Governance status of business sites and Group companies ② Reliability of financial reports: Important financial information such as orders, quality claims, delivery dates, and costs ③ Legal Compliance: Compliance System and Awareness ④ Preservation of assets: Acquisition and disposal processes, use and storage status <Individual Priority Issues> ① Efforts to Solve ESG Items Initiatives for DX (Digital Transformation) ② Initiatives for ROIC management ③
In particular, we closely monitored whether the Group's management policies are properly reflected in the priority issues and action plans of domestic sites and domestic and overseas Group companies, and whether business operations are being executed effectively and efficiently. We confirmed the status of these policies through on-site visits and attending major meetings. The Group companies to be audited are selected based on a comprehensive assessment of the degree of impact on consolidated results and the degree of risk. To enhance the effectiveness of audits by corporate auditors, the Company invites executive officers and division heads to the Audit & Supervisory Board and conducts interviews as necessary. Major activities in the current fiscal year are as follows. Main activities
Frequency of meetings
Full-time Audit & Supervisory Board Members
Audit & Supervisory Board Members (Independent)
Attendance at Board of Directors Meetings
15 times
■
■
Opinion Exchange Meeting with Representative
2 times
■
■
Directors Participation in the Advisory Committee
7 times
■
Attendance at the Management Committee
21 times
■
Attendance at Executive Officers Committee
12 times
■
Attendance at CEO Committees
10 times
■
Attendance at internal control reporting meeting
1 times
■
Interviews with directors and executive officers
12 times
■
Visits to domestic sites
8 times
■
Participation in physical inventory
12 times
■
Visits to Group Companies
7 times
■
Attendance at the Group Audit & Supervisory
2 times
■
■
Board Meeting (NOTE) Activities related to information collaboration with the internal audit division and accounting auditors are described in [③ Cooperation with Internal Audits, Audits by Audit & Supervisory Board Members, and Accounting Audits.]
―73―
(Translation) This document has been translated from the Japanese original for the convenience of overseas stakeholders. In the event of any discrepancy between this document and the Japanese original, the original shall prevail.
② Internal Audit Status Our Business Audit Department (nine members) conducts internal audits of corporate divisions, in-house companies, and Group companies. The Internal Audit Department conducts surveys and assessments to determine whether overall operations are being processed and asset management is being properly carried out. The results are compiled into an audit report and follow up on the status of improvements in areas pointed out or requested for improvement. Audit reports and follow-up reports are reported directly at regular meetings of the Audit & Supervisory Board attended by the representative director, full-time Audit & Supervisory Board members, and certain executive officers. The contents of these reports are posted in the Audit Report Database and disseminated to all directors and Audit & Supervisory Board members, including those from outside the Company. In addition, the Internal Audit Division reports periodically to the Board of Directors. ③ Cooperation with Internal Audits, Audits by Audit & Supervisory Board Members, and Accounting Audits. With regard to cooperation between internal audits, audits by the Audit & Supervisory Board members, and accounting audits, the Business Audit Department and the Audit & Supervisory Board members work to enhance internal auditing operations by, for example, exchanging information and opinions on the annual business audit plan and the content of audits at regular audit councils. The Business Audit Department, the Accounting & Finance Department, and the accounting auditor exchange opinions and information about the development and operation of the Internal Control System for Financial Reporting. In addition, the Audit & Supervisory Board members receive briefings on the outline of the audit plan from the accounting auditor, and also receive briefings on the Group's accounting and internal control issues, etc. through accounting audit reports and quarterly review reports. Full-time Audit & Supervisory Board members and accounting auditors meet regularly to exchange opinions on important auditing issues and other matters. Committee Name
Summary
Month of implementation
Audit and quarterly review
May
plan
The accounting auditor shall explain to the Audit & Supervisory Board members, the outline of the plan for the audit and quarterly review of the business year. The accounting auditor shall report to the Board of Corporate Auditors on the outline of the audit and the status of implementation and the results of the (quarterly) review of the accounting results for the fiscal year.jp
Quarterly review and audit
February, May
report meeting
August and
Nabtesco group Audit &
January and August
Audit & Supervisory Board members of each Group company report on their audits and share and discuss information in an effort to achieve uniformity and enhancement of audits. The Business Audit Department shall implement the Audit Operations Report.
On a monthly basis
The results of internal audits conducted by the Internal Audit Department are reported to the Representative Director, Full-time Audit & Supervisory Board Members, and certain executive officers using audit reports and follow-up reports, and opinions are exchanged. In order to strengthen cooperation between the Audit & Supervisory Board members and the Business Auditing Department, discussions on audits and exchanges of information and opinions will be held through the Auditing Council. In addition, the Audit & Supervisory Board of the Group shall discuss, report and exchange opinions on audits between the Audit & Supervisory Board members and the corporate auditors of subsidiaries. The Business Audit Department, an independent evaluation division, reports to the full-time corporate auditors, the general manager of the Accounting Department, and the general manager of the Information System Department, and exchanges opinions regarding the implementation plans and progress of the development and operation evaluation of the Internal Control over Financial Reporting based on the Financial Instruments and Exchange Act.
November Supervisory Board members’ meeting Business
Audit
Meeting
Report
Audit Council
August and November
J-SOX meeting
January, March, June and December
―74―
(Translation) This document has been translated from the Japanese original for the convenience of overseas stakeholders. In the event of any discrepancy between this document and the Japanese original, the original shall prevail.
④ Accounting Auditors
- Name of auditing firm KPMG AZSA LLC
- Continuous audit period 22 years
- Names of lead CPAs assigned to audit Takeharu Kirikae, Designated Limited Liability Partner and Managing Partner Takashi Inoue, Designated Limited Liability Partner and Managing Partner
- To assist in audit activities 13 CPAs and 36 others
- Policy and Reasons for Selection of Audit Firms The Audit & Supervisory Board has decided to appoint KPMG AZSA LLC. as an accounting auditor in consideration of the fact that the accounting auditor is not deemed to fall under any of the items of Paragraph 1 of Article 340 of the Companies Act and the evaluation of the accounting auditor.
- Evaluation of Audit Firms by Audit & Supervisory Board Members and the Audit & Supervisory Board The Audit & Supervisory Board receives reports from the accounting auditors on the content of audits, audit plans, and quality control systems, and evaluates their independence and appropriateness. During the fiscal year under review, the Board of Corporate Auditors has determined that there are no facts that would cause problems with respect to the activities, independence, and reliability of the accounting auditor.
―75―
(Translation) This document has been translated from the Japanese original for the convenience of overseas stakeholders. In the event of any discrepancy between this document and the Japanese original, the original shall prevail.
⑤ Details of Audit Fees
- Remuneration for Certified Public Accountants Previous consolidated fiscal year Classification
Current consolidated fiscal year
Compensation for audit certification services (Million yen)
Compensation for nonaudit services (Million yen)
Compensation for audit certification services (Million yen)
Compensation for nonaudit services (Million yen)
Submitting Company
126
-
122
-
Consolidated subsidiaries
16
-
16
-
Total
142
-
138
-
- Remuneration for the same network (KPMG) as audited CPAs, etc. excluding 1) Previous consolidated fiscal year Classification
Current consolidated fiscal year
Compensation for audit certification services (Million yen)
Compensation for nonaudit services (Million yen)
Compensation for audit certification services (Million yen)
Compensation for nonaudit services (Million yen)
Submitting Company
-
11
-
15
Consolidated subsidiaries
44
-
68
0
Total
44
11
68
15
Previous consolidated fiscal year The non-audit services of the submitting companies mainly consist of advisory services related to ESG. Current consolidated fiscal year The non-audit services of the submitting companies mainly consist of advisory services related to ESG. The non-audit services of consolidated subsidiaries mainly consist of advisory services related to tax. 3) Details of other remuneration based on important audit attestation services Previous consolidated fiscal year Not applicable. Current consolidated fiscal year Not applicable. 4) Policy for determining audit fees The policy for determining audit fees for our auditing CPAs is to be determined by obtaining the consent of the Audit & Supervisory Board in accordance with the provisions of Article 399 of the Companies Act, after comprehensively considering the content of audit services, etc. 5) Reasons why the Audit & Supervisory Board agreed to the remuneration, etc. of the accounting auditor The Audit & Supervisory Board confirms the content of audits by the accounting auditor, audit time and audit plan, trends in remuneration performance, and remuneration estimates. After reviewing the appropriateness of the accounting auditor's remuneration, the Audit & Supervisory Board agrees to Article 399-1 of the Companies Act.
―76―
(Translation) This document has been translated from the Japanese original for the convenience of overseas stakeholders. In the event of any discrepancy between this document and the Japanese original, the original shall prevail.
(4) 【Compensation of Directors and Audit & Supervisory Board Members】 ① Compensation of Directors and Audit & Supervisory Board Members
- Total amount of remuneration, etc. by officer classification, total amount of remuneration, etc. by type, and number of officers subject to remuneration Total remuneration by type (Millions yen) Classification
Director (excluding outside directors) Corporate Auditors (excluding independent Audit & Supervisory Board Members) Outside officers
Fixed Total amount of compensation remuneration (Millions yen) Monthly compensation
Incentive fee Board Benefit Trust (BBT) Benefits at the Retirement time of tenure benefit
Be subject to Number of officers (person)
188
118
35
-
35
6
54
54
-
-
-
3
79
79
-
-
-
10
(NOTE) 1 The number of officers eligible to serve as directors includes one retired director during the fiscal year under review. 2 The number of officers eligible for Audit & Supervisory Board Members includes one retired director during the fiscal year under review. 3 The number of officers eligible for outside directors includes two retired independent management during the fiscal year under review. 4 Monthly compensation consists of basic monthly compensation and total performance-linked compensation paid on a monthly straightline basis. 5 The amount of stock benefit trust (BBT) represents the amount expensed in the current period under Japanese GAAP based on the number of stock delivery points granted or expected to be granted in the current period. 6 The maximum amount of remuneration is within 400 million yen for directors (including within 70 million yen for outside directors) as resolved at the 21st Ordinary General Meeting of Shareholders (held on March 26, 2024) and 90 million yen for corporate auditors, as resolved at the 14th Ordinary General Meeting of Shareholders (held on March 28, 2017). 7 In addition to the above remuneration, the Company has introduced a stock-based compensation trust (BBT) for directors (excluding outside directors), a stock-based compensation plan resolved at the 14th Ordinary General Meeting of Shareholders (held on March 28, 2017). In accordance with the directors' stock-based compensation regulations stipulated in this plan, the Company contributes to the trust a maximum of 450 million yen (for 3 fiscal years) for directors' stock-based payment at the time of service and 420 million yen (for 3 fiscal years) for retirement benefits. At the 14th Ordinary General Meeting of Shareholders (held on March 28, 2017), the maximum amount of remuneration, which is separate from the remuneration limit stated in 5. above, is set at 56,000 points (one fiscal year) for benefits at the time of service and 51,000 points (one fiscal year) for benefits at the time of retirement. 8 The total amount of remuneration, etc. for each officer is omitted because there is no applicable officer who has paid 100 million yen or more.
② The contents of the policy and the method for determining the amount of Remuneration, etc. for officers or the method for calculating such amount
- Basic Policy of the Compensation System ・A system that shares the interests of shareholders and management by increasing the linkage between the Company’s business performance and stock value ・To act as an incentive to improve the Group's medium-to long-term performance ・The process of determining the compensation system should be objective and transparent.
- Compensation System ⅰ. The remuneration system for directors consists of "monthly remuneration," which consists of Basic remuneration that is fixed remuneration and Performance-linked compensation reflecting short-term performance, and "stock benefit trust (BBT)," which reflects the degree of achievement of the medium-term management plan and share value. ⅱ. "Basic remuneration" is a fixed remuneration according to the position of each director and is paid as a monthly remuneration. ⅲ. "Performance-linked compensation (monthly compensation)" is determined based on the degree of achievement of annual performance using the following formula. [Short-term performance-linked compensation] Short-term performance-linked remuneration = Standard amount for payment by position × Performance evaluation coefficient ※Performance assessment coefficient: Determined by a matrix table using ROIC and net income (attributable to owners of the parent) for the previous fiscal year for which thresholds are set as indicators (coefficient: 0.00 to 4.00) Directors in charge of internal companies will be added or deducted from short-term performance-linked remuneration based on the sales growth rate, degree of improvement in operating income, degree of improvement in ROIC, R&D indicators, environmental indicators, etc. of the company.
―77―
(Translation) This document has been translated from the Japanese original for the convenience of overseas stakeholders. In the event of any discrepancy between this document and the Japanese original, the original shall prevail.
iv. Share-based compensation is determined based on the following formula, utilizing the system of the Stock Benefit Trust (BBT) and depending on the degree of achievement of the Medium-Term Management Plan. [Share-based compensation granted at the time of service] Share-based compensation delivered at the time of service = Share-based compensation points by position × Performance evaluation coefficient × Mid-term Management Plan achievement coefficient ※Performance assessment coefficient: Determined by a matrix table using ROIC and net income (attributable to owners of the parent) for the previous fiscal year for which thresholds are set as indicators (coefficient: 0.00 to 4.00) ※Coefficient of achievement under the medium-term management plan (three years): Set based on the degree of achievement of net sales and operating income set forth in the medium-term management plan (0 to 0.5) The vesting of points will be the date of the ordinary general meeting of shareholders for the last fiscal year ending within three years after the granting of points. [Stock-based compensation at the time of retirement] Share-based remuneration at the time of retirement = Share-based remuneration points by position The vesting of the delivery points shall be the date of resignation as a director. v. The remuneration of directors is based on a percentage distribution that emphasizes linkage to performance and shareholder value. Fixed compensation Position
Chairman of the Board and President
Incentive fee
Grant-type at the time Short-term of service Basic remuneration performance Stock-based Linked remuneration compensation
Director
Grant-type at retirement Stock-based compensation
25%
35%
25%
15%
25%
35%
25%
15%
(NOTE)This table is a model based on a 100% achievement rate for performance-linked remuneration, with the median value for each position.
vi. Remuneration for Outside Directors and the Audit & Supervisory Board Members is limited to fixed remuneration, in view of the fact that the Company is independent from the execution of business, and the portion reflecting business performance is excluded. vii. In the event that there is a material change in the performance of the previous fiscal year that serves as the basis for the calculation of performance-linked remuneration as a result of the restatement of prior fiscal years due to inappropriate accounting, etc., or in the event of a serious damage to the Company due to an illegal act of an officer, etc., the Company is able to request the full amount of performance-linked remuneration or the return of a portion of the remuneration. 3) Approach to Performance-Linked Compensation Indicators The performance-linked remuneration metrics paid to directors (excluding outside directors) are based on "ROIC" and "Net income (attributable to owners of the parent company)", which are the achievements of all employees' activities and the main indices leading to improved ROE. As a result, all directors are aware of the cost of capital and the dividend payout ratio, and we will promote management that is conscious of the sustainable growth of our group. In addition to management indicators such as the degree of ROIC improvement, directors in charge of business operations are provided with R&D indicators for promoting the creation of intellectual property, environmental indicators for reducing CO₂ emissions, and other indicators to provide incentives for improving business performance over the medium to long term. In addition, for the degree of achievement of the Medium-Term Management Plan, we have adopted "Net sales" and "Operating income" with the aim of promoting activities that are the results of all directors and employees' business activities and that unify the vector. The above indicators may be added to or deducted from the amount of impact caused by events that are not attributable to our management decisions. [Results of Key Performance-Based Compensation Indicators] ROIC
Net sales 4.0%
333,367 million yen
Operating income 16,660 million yen
Net income 14,226 million yen
Performance-linked remuneration for the fiscal year under review is calculated based on the figures for FY2023
―78―
(Translation) This document has been translated from the Japanese original for the convenience of overseas stakeholders. In the event of any discrepancy between this document and the Japanese original, the original shall prevail.
- Method of Determination of Remuneration, etc. The Compensation Committee, which is composed of one internal director and four independent outside officers, deliberates and reports on the policy, compensation structure, and level of remuneration for directors, as well as the amount paid to each director, and the Board of Directors determines the amount. Remuneration for Audit & Supervisory Board members is determined after consultation with Audit & Supervisory Board members. The activities of the Committee for deliberating and determining director remuneration for the current fiscal year are as follows. [Number of Committee Meetings (from January to December 2024)] Committee, etc. Compensation Committee Board of Directors
Number of meetings Four times Twice
―79―
(Translation) This document has been translated from the Japanese original for the convenience of overseas stakeholders. In the event of any discrepancy between this document and the Japanese original, the original shall prevail.
(5) 【Status of shareholding】 ① Standard and Concept of Classification of Investment Shares We do not hold shares for net investment purposes, and all shares are classified as investment shares for purposes other than net investment purposes (hereafter, "strategic shareholdings"). Shares that are for net investment purposes are those whose purpose is to receive profits from changes in stock prices or dividends. Investments in shares held for purposes other than pure investment
②
- Method of verifying the rationality of holding policy and details of verification by the Board of Directors, etc. regarding the appropriateness of holding individual issues We hold strategic stockholdings only if they contribute to maintaining and enhancing our corporate value. In light of the situation at the end of the most recent fiscal year, the Company's basic policy is to dispose of and reduce strategic shareholdings as soon as possible. Under this policy, the Board of Directors annually examines whether the holding purpose is appropriate for each individual issue and whether the benefits and risks associated with holding are commensurate with the cost of capital, based on certain criteria, and reviews whether or not to continue holding shares and the number of shares. As a result of the verification, any issue deemed inappropriate for continuous holding will be sold without delay after considering the stock price, market trends, and other factors.
- Number of issues and balance sheet amount Number of issues (issue)
Total amount on the Balance Sheet (Million yen)
Unlisted stocks
17
406
Shares other than unlisted shares
7
4,788
(Issues with an increase in the number of shares in the current fiscal year) Number of issues (issue)
Total acquisition cost related to increase in number of shares (Million yen)
Unlisted stocks
-
-
Shares other than unlisted shares
1
0
(Issues with an increase in the number of shares in the current fiscal year) Number of Total sales price related to issues decrease in number of shares (issue) (Million yen) Unlisted stocks
-
-
Shares other than unlisted shares
3
324
―80―
Reason for the increase in the number of shares Dividend reinvestment by the Supplier Shareholding Association. This share had been sold by the end of FY2024.
(Translation) This document has been translated from the Japanese original for the convenience of overseas stakeholders. In the event of any discrepancy between this document and the Japanese original, the original shall prevail.
- Information on the number of shares and the amount recorded on the balance sheet for each issue of specified investment shares and deemed holding shares Specified investment shares Current fiscal year Previous fiscal year Number of shares Balance Sheet Amount (Millions yen)
Issue
ShareNumber of shares Outline of holding purpose and business alliance, holdings quantitative effect of holding shares and reasons for Balance Sheet in the the increase in the number of shares Amount Company (Millions yen)
SINFONIA TECHNOLOGY CO., LTD.
400,000
400,000
2,568
833
Central Railway Company
500,000
500,000
1,483
1,792
66,997
66,997
257
297
76,500
25,500
214
207
43,509
43,509
144
195
38,587
38,587
78
84
20,000
20,000
44
40
West Japan Railway Company
-
45,000
-
265
Tokyu Corporation
-
50,741
-
87
Keihan Holdings Co., Ltd.
-
10,857
-
40
Japan
Keio Corporation East Railway Company
Japan
Kintetsu Group Holdings Co.,Ltd. Sanyo Electric Railway Co., Ltd. The Hanshin Diesel Works, Ltd.
We are primarily a business partner in Transport Solutions business and hold them to maintain and strengthen business relations.
Yes
It is a customer in Transport Solutions business and is owned to maintain and strengthen business relations. The number of shares increased due to the stock split.
Yes
It is a customer in Transport Solutions business and is owned to maintain and strengthen business relations.
Yes
It is a customer in Transport Solutions business and is owned to maintain and strengthen business relations.
None
It is a customer in Transport Solutions business and is owned to maintain and strengthen business relations.
None
It is a customer in Transport Solutions business and is owned to maintain and strengthen business relations.
Yes
It is a customer in Transport Solutions business and is owned to maintain and strengthen business relations.
None
-
None
-
None
-
Yes
(NOTE) Quantitative holding effects are not shown because they relate to trade secrets. The method of verifying the rationality of the holdings is described in "1) Method of verifying the rationality of holding policy and details of verification by the Board of Directors, etc. regarding the appropriateness of holding individual issues" ③
Investment shares held for pure investment purposes Not applicable
④
Securities for which the purpose of holding investment shares is changed from a pure investment purpose to a purpose other than a pure investment purpose during the current fiscal year Not applicable
⑤
Securities for which the purpose of holding investment shares is changed from a purpose other than pure investment to a pure investment purpose during the current fiscal year Not applicable.
―81―
(Translation) This document has been translated from the Japanese original for the convenience of overseas stakeholders. In the event of any discrepancy between this document and the Japanese original, the original shall prevail.
No.5 【Accounting Status】
- Preparation of Consolidated Financial Statements and Financial Statements (1) Our consolidated financial statements have been prepared in accordance with International Financial Reporting Standards ("IFRS") pursuant to the provisions of Article 312 of the "Regulations Concerning Terminology, Forms and Preparation Methods of Consolidated Financial Statements" (Ministry of Finance Ministerial Order No. 28 of issued in 1976, hereinafter referred to as the "Regulations Concerning Consolidated Financial Statements"). (2) Our financial statements have been prepared in accordance with the Regulations on Terminology, Forms and Preparation Methods of Financial Statements (Ordinance of the Ministry of Finance No. 59 of issued in 1963; hereinafter referred to as the "Regulations on Financial Statements, etc."). We are a company submitting special financial statements and prepare financial statements in accordance with the provisions of Article 127 of the Ordinance on Financial Statements, etc (3) The consolidated financial statements and financial statements have been rounded to the nearest unit.
- Audit Certification Pursuant to Article 193-2-1 of the Financial Instruments and Exchange Act, we have audited the consolidated financial statements for the fiscal year (January 1, 2024 to December 31, 2024) and the financial statements for the fiscal year (January 1, 2024 to December 31, 2024) by KPMG AZSA LLC. In addition, we have submitted a Corrections Report of an Annual Securities Report, pursuant to Article 24-2-1 of the Financial Instruments and Exchange Act, and the consolidated financial statements and the non-consolidated financial statements after correction have been audited by KPMG AZSA LLC.
- Special efforts to ensure the appropriateness of the consolidated financial statements, etc. and the development of a system to properly prepare the consolidated financial statements, etc. based on IFRS As shown below, we are making special efforts to ensure the appropriateness of our consolidated financial statements and establishing a system for the proper preparation of consolidated financial statements based on IFRS. (1) In order to appropriately grasp the content of accounting standards, etc., and develop a system that enables us to respond to changes in accounting standards, etc. in a timely and accurate manner, we have joined the Financial Accounting Standards Corporation and participate in seminars conducted by auditing firms, etc. In addition, internal study meetings on the content of IFRS are held regularly to promote the acquisition of IFRS knowledge to practical personnel. (2) In applying IFRS, the Company obtains press releases and pronouncements issued by the International Accounting Standards Board from time to time to determine the latest standards. In addition, in order to prepare appropriate consolidated financial statements based on IFRS, we have prepared group-wide accounting policies in accordance with IFRS and account for them based on those policies
―82―
(Translation) This document has been translated from the Japanese original for the convenience of overseas stakeholders. In the event of any discrepancy between this document and the Japanese original, the original shall prevail.
1 【Consolidated Financial Statements and Notes on the Consolidated Financial Statement】 (1) 【Consolidated Statement of Financial Position】 ① 【Consolidated Statement of Financial Position】 (Million yen) Note No.
End of consolidated FY2023 (as of December 31, 2023)
End of consolidated FY2024 (as of December 31, 2024)
Assets Current assets Cash and cash equivalents
7
77,835
74,476
Trade receivables
8, 22
82,167
88,932
Contract assets
24
3,554
3,212
Other receivables
8
1,682
1,361
Inventories
9
50,969
53,273
Other financial assets
22
616
698
Other current assets
6,995
7,016
Total current assets
223,818
228,970
Non-current assets Property, plant and equipment
10, 12
107,527
114,340
Intangible assets
11, 12
11,624
12,955
Right-of-use assets
12, 13
8,908
12,122
Goodwill
11, 12
25,750
26,259
Investment property
12, 14
10,394
9,309
Investments accounted for using the equity method
15
24,005
24,348
Other financial assets
22
12,550
14,648
Deferred tax assets
21
3,040
3,430
Other non-current assets
1,013
3,464
Total non-current assets
204,812
220,875
428,630
449,845
Total assets
―83―
(Translation) This document has been translated from the Japanese original for the convenience of overseas stakeholders. In the event of any discrepancy between this document and the Japanese original, the original shall prevail.
(Million yen) Note No.
End of consolidated FY2023 (as of December 31, 2023)
End of consolidated FY2024 (as of December 31, 2024)
Liabilities and equity Liabilities Current liabilities Operating payables
16, 22
50,783
51,178
Contract liabilities
24
11,024
11,463
Borrowings
19, 22
21,400
21,817
Other payables
16, 22
23,392
16,030
3,018
2,461
17
2,720
2,233
Income taxes payable Provisions Lease liabilities
19, 22
2,799
3,319
Other financial liabilities
22
-
28
Other current liabilities
18
7,327
8,582
122,462
117,111
Total current liabilities Non-current liabilities Borrowings
19, 22
173
10,067
Lease liabilities
19, 22
8,060
10,634
Liabilities concerning retirement benefit
20
9,174
8,262
Deferred tax liabilities
21
7,951
8,514
Other financial liabilities
22
516
670
Other non-current liabilities
18
2,149
4,844
Total non-current liabilities Total liabilities
28,022
42,990
150,485
160,101
Equity Capital stock
23
10,000
10,000
Share premium
23
15,139
14,998
Retained earnings
23
222,362
225,269
Treasury stocks
23
Other components of equity
23
-3,943
-3,638
19,162
25,930
Equity attributable to owners of the parent
262,721
272,559
Non-controlling interests
15,424
17,185
Total equity
278,145
289,744
428,630
449,845
Total liabilities and equity
―84―
(Translation) This document has been translated from the Japanese original for the convenience of overseas stakeholders. In the event of any discrepancy between this document and the Japanese original, the original shall prevail.
② 【Consolidated Statements of Income】 (Million yen) Note No. Net sales
6, 24
Cost of sales
25
Previous fiscal year (From January 1, 2023 to December 31, 2023) (Consolidated basis) 333,367
Current fiscal year (From January 1, 2024 to December 31, 2024) (Consolidated basis) 323,384
-250,915
-236,147
-67,272
-71,051
5,202
1,140
Gross profit
82,452
Other income
26
Selling, general and administrative expense
25
Other expenses
26
Operating income
6,517
-5,038
6
Financial income
27
Financial costs
27
Equity in earnings of affiliates
15
16,660 -1,095
4,549
Income before tax
87,237 1,196
-2,370
15,012 -918
950
25,316
16,184
-9,215
16,102
-4,419
11,765
Owners of the parent
14,226
10,188
Non-controlling interests
1,876
1,577
Net income
16,102
11,765
Income tax expense
21
Net income Net income attributable to
Net income per share Basic earnings per share (Yen)
29
118.52
84.83
Diluted earnings per share (Yen)
29
118.50
84.82
―85―
(Translation) This document has been translated from the Japanese original for the convenience of overseas stakeholders. In the event of any discrepancy between this document and the Japanese original, the original shall prevail.
③ 【Consolidated Statements of Comprehensive Income】 (Million yen) Previous fiscal year (From January 1, 2023 to December 31, 2023) (Consolidated basis) 16,102
Current fiscal year (From January 1, 2024 to December 31, 2024) (Consolidated basis) 11,765
-162
2,326
917
1,219
755
3,546
23
6,236
6,590
23
124
284
6,360
6,873
Other comprehensive income after taxes
7,115
10,419
Total comprehensive income
23,217
22,184
Owners of the parent
20,762
19,360
Non-controlling interests
2,455
2,824
Total comprehensive income
23,217
22,184
Note No. Net income Other comprehensive income Items that will not be reclassified to profit or loss Remeasurements liabilities (assets)
of
defined
benefit
Net changes in financial assets measured at fair value through other comprehensive income Total components that will not be reclassified to profit or loss Components that will be reclassified to profit or loss Exchange differences on foreign operations Share of other comprehensive income of investments accounted for using equity method Total components that will be reclassified to profit or loss
23 23
Comprehensive income attributable to
―86―
(Translation) This document has been translated from the Japanese original for the convenience of overseas stakeholders. In the event of any discrepancy between this document and the Japanese original, the original shall prevail.
④ 【Consolidated Statement of Changes in Equity】 FY2023 (From January 1, 2023 to December 31, 2023) (Million yen) Equity attributable to owners of the parent Note No.
Balance as of January 1, 2023 Net income Other comprehensive income
23
Total comprehensive income
Other components of equity Retained earnings
Capital stock
Share premium
Treasury stocks
10,000
15,048
217,865
-
-
-
Exchange Valuation differences on difference due to change in fair foreign operations value 9,719
3,263
14,226
-4,646 -
-
-
-
-
-
5,797
911
-
-
14,226
-
5,797
911
-579
704
-
-
Acquisition, sales, etc. of treasury stocks
23
-
-
Dividends
23
-
-
-9,506
-
-
-
-
-
356
-
-
-529
-
91
-
-
-
-
Total transactions with owners, etc.
-
91
704
-
Balance as of December 31, 2023
10,000
15,139
-9,729
-3,943
15,516
-529
Transfer from other components of equity to retained earnings Share-based transactions
compensation
28
222,362
Equity attributable to owners of the parent Other components of equity Note No. Remeasurements of net defined Total benefit liability (asset) Balance as of January 1, 2023 Net income Other comprehensive income
23
Total comprehensive income
Total equity attributable to owners of the parent
Non-controlling interests
Total equity
-
12,982
251,250
14,532
265,782
-
-
14,226
1,876
16,102
-173
6,535
6,535
579
7,115
6,535
20,762
2,455
23,217
Acquisition, sales, etc. of treasury stocks
23
-173 -
-
125
-
125
Dividends
23
-
-
-9,506
-1,563
-11,069
173
-356
-
-
-
-
-
91
-
91
Total transactions with owners, etc.
173
Balance as of December 31, 2023
-
-356
-9,290
-1,563
-10,854
Transfer from other components of equity to retained earnings Share-based transactions
compensation
28
19,162
―87―
262,721
15,424
278,145
3,646
(Translation) This document has been translated from the Japanese original for the convenience of overseas stakeholders. In the event of any discrepancy between this document and the Japanese original, the original shall prevail.
FY2024 (From January 1, 2024 to December 31, 2024) (Million yen) Equity attributable to owners of the parent Note No.
Balance as of January 1, 2024 Net income Other comprehensive income
23
Total comprehensive income
Other components of equity Retained earnings
Capital stock
Share premium
Treasury stocks
10,000
15,139
222,362
-
-
-
Exchange Valuation differences on difference due to change in fair foreign operations value 15,516
3,646
10,188
-3,943 -
-
-
-
-
-
5,667
1,213
-
-
10,188
-
5,667
1,213
-34
304
-
-
-9,651
-
-
-
-
-
-
-
Acquisition, sales, etc. of treasury shares
23
-
-
Dividends
23
-
-
Increase (decrease) in noncontrolling interests due to capital increase of subsidiaries
-
-
Transfer from other components of equity to retained earnings
-
-
2,404
-
-
-112
-
-
-
-
-
-7,281
304
-
-3,638
21,183
-112
Share-based transactions
compensation
28
Total transactions with owners, etc.
-
-142
Balance as of December 31, 2024
10,000
14,998
-142
225,269
Equity attributable to owners of the parent Other components of equity Note No. Remeasurements of net defined Total benefit liability (asset) Balance as of January 1, 2024 Net income Other comprehensive income
23
Total comprehensive income
Total equity attributable to owners of the parent
Non-controlling interests
Total equity
-
19,162
262,721
15,424
278,145
-
-
10,188
1,577
11,765
2,293
9,172
9,172
1,247
10,419
2,293
9,172
19,360
2,824
22,184
Acquisition, sales, etc. of treasury shares
23
-
-
270
-
270
Dividends
23
-
-
-
-
-9,651
-1,249
-10,900
-2,293
-2,404
-
-
-
-
-
-
-2,293
-2,404
-142
-142
Increase (decrease) in noncontrolling interests due to capital increase of subsidiaries Transfer from other components of equity to retained earnings Share-based transactions
compensation
Total transactions with owners, etc. Balance as of December 31, 2024
28
-
25,930
―88―
-
-9,522
272,559
185
-1,063
17,185
185
-10,586
289,744
4,747
(Translation) This document has been translated from the Japanese original for the convenience of overseas stakeholders. In the event of any discrepancy between this document and the Japanese original, the original shall prevail.
⑤ 【Consolidated Statements of Cash Flows】 (Million yen)
Note No. Cash flows from operating activities Net income Depreciation and amortization Impairment Loss Increase (decrease) in liabilities concerning retirement benefits Interest and dividend income Interest expenses Decrease (Increase) in valuation on investment securities Loss (gain) on sale of shares of subsidiaries and associates Equity loss (gain) in earnings of affiliates Loss (gain) on sales of fixed assets Loss (gain) on exchange of land and buildings Expenses of income tax Decrease (increase) in trade receivables, contract assets and contract liabilities Decrease (increase) in inventories Increase (decrease) in operating payables Others
12
14
Cash flows from financing activities Increase (decrease) in short-term bank loans Proceeds from long-term loans payable Repayment of long-term loans payable Payments of lease liabilities Decrease (Increase) in treasury shares Cash dividends paid Proceeds from payments from non-controlling interests Dividends paid to non-controlling interests
30
19 19 19 19 23
Cash flows from financing activities Increase (decrease) in cash and cash equivalents
Current fiscal year (From January 1, 2024 to December 31, 2024) (Consolidated basis)
16,102 15,469 6,250
11,765 16,469 1,632
521
-567
-463 574 -3,569 -1,144 -4,549 282 -4,243 9,215 481
Subtotal Interest received Dividend received Interest paid Subsidy received Income taxes refunded (paid) Cash flows from operating activities Cash flows from investing activities Decrease (Increase) in time deposits Purchases of property, plant and equipment Purchases of intangible assets Payments for acquisition of shares of subsidiaries resulting in a change in the scope of consolidation Proceeds from sales of subsidiaries resulting in a change in the scope of consolidation Payments for acquisition of investment securities Proceeds from sale of investment securities Payments for settlement of sales price on investment securities Other Cash flows from investing activities
Previous fiscal year (From January 1, 2023 to December 31, 2023) (Consolidated basis)
-456 733 33 - -950 358 - 4,419 -3,696
223 -7,055 -1,525 26,569 375 901 -574 - -16,093 11,177
29,669 356 1,069 -736 2,759 -6,468 26,650
318 -22,578 -3,021
-100 -24,898 -3,453
-11,619
-
1,686
-
-1,694 12
-1,128 749
-642 -1,168 1,738
-9,752
-
353 -46,295
99 -28,733
3,000 32 -2,384 -3,060 -3 -9,503 - -1,563
82 10,092 -240 -3,424 69 -9,653 185 -1,249
-13,482 -48,600
-4,137 -6,220
Cash and cash equivalents at beginning of term Effect of exchange rate changes on cash and cash equivalents
7
124,413 2,021
77,835 2,861
Cash and cash equivalents at end of term
7
77,835
74,476
―89―
(Translation) This document has been translated from the Japanese original for the convenience of overseas stakeholders. In the event of any discrepancy between this document and the Japanese original, the original shall prevail.
【Notes to Consolidated Financial Statements】
-
Reporting company Nabtesco Corporation (the "Company") is a company located in Japan. Our consolidated financial statements are composed of the interests in us and our subsidiaries (together, the "Group") and affiliates, with an ended date of December 31, 2024. Our main businesses are Component Solutions Business, Transport Solutions Business, and Accessibility Solutions Business. The details are described in Note "6. Business Segments."
-
Basis of preparation (1) Compliance with IFRS The consolidated financial statements have been prepared in accordance with IFRS pursuant to the provisions of Article 312 of the Ordinance on Consolidated Financial Statements as they satisfy all of the requirements of "Designated International Accounting Standards Designated Companies" set forth in Article 1-2 of the Ordinance on Consolidated Financial Statements. The consolidated financial statements for the fiscal year ended December 31, 2024, which were approved by our Board of Directors on March 26, 2025, were corrected and approved by our Board of Directors on September 30, 2026. . (2) Basis for measurement The consolidated financial statements of our group have been prepared on a historical cost basis, except for financial instruments measured at fair value, as described in Note 3, "Significant Accounting Policies," below. (3) Functional and presentation currencies The consolidated financial statements of our group represent the Japanese yen, which is our functional currency.
-
Important accounting policies The significant accounting policies applied in these consolidated financial statements are the same as those applied for all periods presented in these consolidated financial statements, unless otherwise indicated. (1) Basis of consolidation ① Subsidiary Subsidiaries are companies controlled by our group. The financial statements of subsidiaries are included in the consolidated financial statements from the date of inception to the date of termination of control. The accounting policies of the subsidiaries have been changed as necessary to align with the accounting policies applied by our group. Changes in ownership interests in subsidiaries that do not result in loss of control are accounted for as equity transactions. The difference between the non-controlling interest adjustment and the fair value of the consideration is recognized directly in equity as equity attributable to owners of the parent. Unrealized gains and losses arising from balances and transactions within our group and from transactions within our group are eliminated in the preparation of the consolidated financial statements. For subsidiaries with different closing dates, financial statements based on provisional closing as of the consolidated closing date are used. ② Investments in Affiliated Companies. Affiliated companies are companies over which the Group has significant influence, but not control, over their financial and operating policies. If our group holds more than 20% of the voting power of another company, we estimate that our group has significant influence over that other company. Investments in affiliates are accounted for using the equity method and are recognized at cost at the time of acquisition. Under the equity method, if there is a difference between the investment at the date of the investment and the corresponding investee's
―90―
(Translation) This document has been translated from the Japanese original for the convenience of overseas stakeholders. In the event of any discrepancy between this document and the Japanese original, the original shall prevail.
capital, such difference is included in the carrying amount of the investment as goodwill. The consolidated financial statements include the recognition of our group's share of net income or loss and other comprehensive income from the date of significant influence through the date of loss of significant influence, and adjustments are made to the amounts invested. Until our proportionate share of the loss of an affiliate exceeds our proportionate share of the investment in the entity, such proportionate share is charged to net income. No further excess is recognized as a loss unless our group incurs or pays a liability (legal or constructive) on behalf of an affiliate. In applying the equity method of accounting, we make adjustments necessary to align the accounting policies of our equity method investees with the accounting policies of our group. In addition, the consolidated financial statements include investments in affiliates whose fiscal year-end differs from our fiscal year-end because it is not practicable to unify the fiscal year-end to our fiscal year-end due to relationships with other shareholders and other factors. Significant transactions or events in the period arising from differences in the balance sheet dates are adjusted. The fiscal year-end of the affiliated companies accounted for by the equity method is mainly March 31. Unrealized gains and losses arising from transactions with affiliates accounted for by the equity method are deducted from investments to the extent of our Group's ownership interest in the investee. (2) Business Combination Business combinations are accounted for using the acquisition method. Identifiable assets and liabilities of the acquired company are measured at fair value at the date of acquisition. Goodwill is measured as the excess of the sum of the consideration transferred in a business combination, the amount of the non-controlling interest in the acquired companies, and the fair value of the equity interest in the acquired companies previously held by the acquired companies over the net value of identifiable assets and liabilities at the date of acquisition. Acquisition-related costs are expensed in the period in which they are incurred. In addition, with respect to business combination transactions under common control, we account for them based on the book value prior to the occurrence of the business combination transaction. (3) Foreign currency ① Functional and Presentation Currencies The financial statements of each company in our group are prepared in the functional currency, which is the currency of the primary economic environment in which the company operates. The consolidated financial statements of our group represent the Japanese yen, which is our functional currency. ② Foreign Currency Transactions Transactions denominated in foreign currencies are translated into the functional currency at the exchange rates in effect at the transaction date. Monetary assets and liabilities denominated in foreign currencies at the end of the fiscal year are translated into the functional currency at the exchange rates in effect at the end of the fiscal year. Non-monetary assets and liabilities denominated in foreign currencies measured at cost are translated into the functional currency at the exchange rates in effect at the transaction date. Non-monetary assets and liabilities measured at fair value that are denominated in foreign currencies are translated into the functional currency at the exchange rate prevailing at the measurement date of such fair value. Exchange differences arising from translation are recognized in profit or loss. However, differences arising from the translation of financial instruments measured at fair value with the changes recognized in other comprehensive income are recorded in other comprehensive income. ③ Foreign operations Assets and liabilities of foreign operations are translated into Japanese yen at the year-end exchange rates. Revenues and expenses of foreign operations are translated into Japanese yen using the average exchange rate, unless the exchange rate fluctuates significantly. Translation differences arising from the translation of the financial statements of foreign operations are recognized in other comprehensive income and included in other components of equity. When foreign operations are disposed of, translation adjustments are reclassified to profit or loss. (4) Cash and cash equivalents Cash and cash equivalents include cash on hand, readily available deposits and short-term investments with original maturities of 3 months or less that are readily convertible to known amounts of cash and present insignificant risk of changes in value. (5) Inventories Inventories are measured at the lower of cost and net realizable value. The cost of inventories is determined principally based on the average cost method, which includes the cost of acquiring inventories, manufacturing and processing costs, and other costs incurred in bringing the inventories to their current location and condition. Net realizable value is the estimated selling price in the ordinary course of business less estimated costs to complete and estimated selling costs.
―91―
(Translation) This document has been translated from the Japanese original for the convenience of overseas stakeholders. In the event of any discrepancy between this document and the Japanese original, the original shall prevail.
(6) Financial Instruments ① Non-derivative financial assets Our group initially recognizes financial assets on the transaction date on which our group becomes a party to a contract for that financial instrument. Financial assets are initially measured at fair value. For financial assets that are not measured at fair value through profit or loss after initial recognition, transaction costs incurred directly to acquire the financial assets are included in the initial measurement amount. a Financial assets measured at amortized cost Financial assets are classified as financial assets measured at amortized cost when the following criteria are met. ・It is held based on a business model whose objective is to hold financial assets to recover contractual cash flows. ・The contractual terms of the financial assets give rise on specified dates to cash flows that are solely payments of principal and interest on the principal balance. Measurement after initial recognition is carried at amortized cost using the effective interest method. A loss valuation allowance is recognized for expected credit losses on financial assets measured at amortized cost. At the end of each fiscal year, our group compares the credit risk of financial assets as of the end of the fiscal year with the initial recognition date to evaluate whether there has been a significant increase in the credit risk associated with financial assets. If the credit risk associated with a financial asset has increased significantly since initial recognition, we measure the loss valuation allowance associated with that financial asset at an amount equal to the expected credit loss for the full period, and if not significantly increased, at an amount equal to the expected credit loss for the 12-month period. Notwithstanding the foregoing, for trade receivables and contract assets that do not contain a significant financial component, the Company measures the loss valuation allowance at an amount equal to the expected credit loss for the entire period. The provision for loss valuation allowance related to financial assets is recognized in profit or loss. If an event occurs that reduces the loss valuation allowance, the reversal of the loss valuation allowance is recognized in profit or loss. b Financial assets measured at fair value through other comprehensive income At initial recognition, our group elects to recognize changes in the fair value of equity instruments other than those held for trading in other comprehensive income, in principle. When the Company elects to recognize through other comprehensive income, the designation is made and applied on an ongoing basis as irrevocable. Subsequent to initial recognition, measurements are carried at fair value through other comprehensive income. When such financial assets are sold, the cumulative gain or loss recognized is reclassified from other comprehensive income to retained earnings at the time of sale. Dividends from such financial assets are recognized in profit or loss. c Financial assets measured at fair value through profit or loss Our group classifies financial assets other than financial assets measured at amortized cost or at fair value through other comprehensive income as financial assets measured at fair value through profit or loss. Subsequent to initial recognition, measurements are carried at fair value through profit or loss. Our group derecognizes financial assets when the contractual rights to cash flows have expired or have been transferred, or substantially all the risks and rewards of ownership have been transferred.
② Non-derivative financial liabilities Our group initially recognizes the debt securities to be issued on the date of such issuance. All other financial liabilities are recognized on the transaction date on which our group becomes a party to the contract for the financial instrument. a Financial liabilities measured at amortized cost Our group initially measures financial liabilities measured at amortized cost with fair value plus direct transaction costs. Subsequent to initial recognition, they are measured at amortized cost using the effective interest method.
―92―
(Translation) This document has been translated from the Japanese original for the convenience of overseas stakeholders. In the event of any discrepancy between this document and the Japanese original, the original shall prevail.
b Financial liabilities measured at fair value through profit or loss Our group classifies financial liabilities other than financial liabilities measured at amortized cost as financial liabilities measured at fair value through profit or loss. Subsequent to initial recognition, measurements are carried at fair value through profit or loss. Our group derecognizes financial liabilities when contractual obligations are discharged, cancelled or expired. ③ Derivative Financial Instruments Our Group holds derivative financial instruments for the purpose of avoiding and mitigating the risk of fluctuations in foreign exchange rates and interest rates. Derivatives are initially recognized at fair value and the related transaction costs are recognized in profit or loss as incurred. Subsequent to initial recognition, measurements are carried at fair value through profit or loss. (7) Property, plant and equipment ① Recognition and Measurement Property and equipment are measured at cost less accumulated depreciation and accumulated impairment losses using the cost model. Cost includes the following costs directly related to the acquisition of assets: ・Employee benefits and assembly, installation and other costs directly arising from the manufacture of assets ・Estimates of the costs of dismantling and removing assets if the obligation is to remove or remove them. ・Capitalized borrowing costs ② Depreciation Property and equipment are depreciated using the straight-line method over the estimated useful lives of the respective components. Depreciation is calculated based on the depreciable value. Amortizable value is calculated by subtracting the residual value from the acquisition cost of the assets. Estimated useful lives are as follows: Buildings and structures Machinery and equipment Tools, furniture and fixtures
3 ~ 4 ~ 2 ~
50 17 20
Year Year Year
Depreciation methods, useful lives and residual values are reviewed at the end of each fiscal year and revised as necessary. (8) Goodwill and intangible assets ① Goodwill Measurement at the initial recognition is described in "(2) Business combinations." Subsequent to initial recognition, goodwill is stated at cost, less accumulated impairment losses. Goodwill is not amortized but is tested for impairment annually or whenever indicators of impairment exist. Impairment losses related to goodwill are not reversed. ② Research and development costs Expenditures for research activities conducted for the purpose of obtaining new scientific or technical knowledge and understanding are recognized as profit or loss as incurred. ③ Other intangible assets Other intangible assets are measured at cost less accumulated amortization and accumulated impairment losses using the cost model. In addition, intangible assets that are identified in a business combination separately from goodwill are measured at their acquisition date fair values as acquisition costs. Amortization is based on the straight-line method over the estimated useful life of the asset from the date the asset becomes available for use. Depreciation is calculated based on the depreciable value. Amortizable value is calculated by subtracting the residual value from the acquisition cost of the assets.
―93―
(Translation) This document has been translated from the Japanese original for the convenience of overseas stakeholders. In the event of any discrepancy between this document and the Japanese original, the original shall prevail.
Estimated useful lives are as follows: Software
3 ~
16
Year
Customer related asset
8 ~
19
Year
Technology assets
8 ~
10
Year
Others
7 ~
20
Year
Amortization methods, useful lives and residual values are reviewed at the end of each fiscal year and revised as necessary. Indefinite-lived intangible assets are stated at cost less accumulated impairment losses. In addition, they are not amortized but are tested for impairment annually or whenever indicators of impairment exist. (9) Lease (Lessee) ① Lease liabilities Lease liabilities are recognized from the inception date of the lease and are measured at the present value of lease payments that have not been paid. The discount rate is the calculated interest rate of the lease or the additional borrowing rate of our group if the calculated interest rate cannot be easily determined. Subsequent to the inception date, amounts will increase or decrease due to interest and lease payments on the lease liabilities. ② Right-of-use asset The right-of-use asset is measured at cost, adjusted for initial direct costs, prepaid lease payments, etc., to the initial measurement of the lease liability from the inception date of the lease. Subsequent to the inception date, the cost model is applied and measured net of accumulated depreciation and impairment losses. Amortized on a straight-line basis over the shorter of the useful life of the right-of-use asset or the end of the lease term from the lease commencement date. In addition, for short-term leases and leases where the underlying assets are small, the Company applies the exemption from recognition and does not recognize a right-of-use asset or a lease liability, but rather recognizes it as an expense on a straightline basis over the term of the lease. (Lessor) The Group classifies leases into finance leases and operating leases. A lease is classified as a finance lease if substantially all the risks and economic benefits associated with ownership of the underlying asset are transferred to the lessee; if all the risks and economic benefits associated with the ownership of the underlying assets are not substantially transferred to the lessee, then it is classified as an operating lease (10) Investment real estate Investment real estate is real estate held for the purpose of earning rental income or capital gains or both. The measurement and depreciation methods for investment properties are in accordance with property, plant and equipment. The estimated useful lives of the investment properties are 5 to 60 years. Depreciation methods, useful lives and residual values are reviewed at the end of each fiscal year and revised as necessary. (11)Impairment of non-financial assets The carrying value of our group's non-financial assets, excluding inventories, contract assets, deferred tax assets and net defined benefit assets, is determined at each period end for indicators of impairment. If indicators of impairment are present, the recoverable amount of the asset is estimated. The recoverable amount of an asset or CGU is the greater of its value in use or fair value less costs to sell. In determining value in use, estimated future cash flows are discounted to present value using a pre-tax discount rate that reflects the time value of money and the risks specific to the asset. An impairment loss is recognized when the carrying amount of an asset or CGU exceeds its recoverable amount. For assets other than goodwill, previously recognized impairment losses are evaluated at the end of each period for indicators of loss reduction or extinguishment. If the estimates used in determining the recoverable amount change, the impairment loss is
―94―
(Translation) This document has been translated from the Japanese original for the convenience of overseas stakeholders. In the event of any discrepancy between this document and the Japanese original, the original shall prevail.
reversed. The reversal amount is limited to an amount not to exceed the carrying amount less depreciation and amortization if no impairment loss is recognized. The treatment of impairment losses related to goodwill is described in "(8) Goodwill and Intangible Assets ①Goodwill" and the treatment of impairment losses related to indefinite-lived intangible assets is described in "(8) Goodwill and Intangible Assets ③Other Intangible Assets." (12) Employee benefit Postretirement benefits
①
Our Group has a retirement lump-sum payment plan and a pension plan as a postretirement benefit plan for employees. These plans are classified into defined contribution plans and defined benefit plans. a Defined contribution plan Costs related to postretirement benefits for defined contribution plans are recognized as an expense in the period in which the employees provide services. b Defined benefit plan The present value of defined benefit obligations and the related current service cost and prior service cost are calculated for each individual plan using the projected unit credit method. The discount rate is determined by establishing a discount period based on the expected period to future benefit payments and by reference to the market yield of high-quality corporate bonds at the end of the period corresponding to the discount period. Liabilities or assets related to defined benefit plans are calculated by deducting the fair value of plan assets from the present value of defined benefit obligations. Remeasurements of net defined benefit assets or liabilities are recognized in other comprehensive income in the period in which they occur and are transferred to retained earnings. ② Short-term employee benefits Short-term employee benefits are not discounted and are expensed as the related services are rendered. For bonuses, we recognize a liability for the estimated amount to be paid under those plans when our group has a current legal and constructive obligation to pay as a result of labor provided by employees in the past and the amount can be reliably estimated. (13) Reserves and contingent liabilities Provisions are recognized when, as a result of past events, our group has a legal or constructive obligation that is reasonably estimable and it is probable that an outflow of economic resources will occur to settle the obligation. The allowance is discounted to the present value of estimated future cash flows using a pre-tax discount rate that reflects the time value of money and the risks specific to the liability, if the time value of money is significant. Common stock Accrued warranty costs are provided for future expenditures, such as repair costs, which are incurred after delivery of the product, by estimating the amount of such costs incurred on a case-by-case basis. The allowance for losses on orders is provided for future losses on contract awards by individually estimating the estimated amount of losses on contracts awarded as of the end of the period. If the Company has a liability that may be incurred as of the end of the fiscal year, and it cannot be ascertained if it is a liability as of the end of the fiscal year, or if it does not meet the recognition criteria for the allowance, it is recorded as a contingent liability. (14) Shareholders' Equity ① Common stock Common stock is classified as equity. Additional costs directly related to the issuance of common stock and stock options are recognized net of tax as a deduction of equity. ② Treasury stock When treasury stock is repurchased, consideration paid, including direct transaction costs, net of tax, is recognized as a deduction to equity. When treasury stock is disposed of, the difference between the consideration received and the carrying
―95―
(Translation) This document has been translated from the Japanese original for the convenience of overseas stakeholders. In the event of any discrepancy between this document and the Japanese original, the original shall prevail.
amount of treasury stock is recognized as equity.
―96―
(Translation) This document has been translated from the Japanese original for the convenience of overseas stakeholders. In the event of any discrepancy between this document and the Japanese original, the original shall prevail.
③ Share-based payment transactions a Stock option system Until March 2017, we have introduced a stock option plan for our directors and executive officers (excluding outside directors, hereinafter referred to as "directors, etc.") that allows them to exercise their right to purchase our shares. Under the plan, stock options vest on the grant date of stock-based awards, and therefore are estimated at fair value at the grant date, and recognized as expense in a lump sum at the grant date, with the same amount recognized as equity. The fair value of options granted is determined using the Black-Scholes model, considering the terms and conditions of the options. This system was abolished in March 2017 (however, the stock options already granted to directors and others as stock-based compensation stock options that have not yet been exercised will continue to exist). b Board Benefit Trust Plan (Equity Settlement Type) In May 2017, we introduced an equity compensation plan to provide our directors, etc. with their own shares, etc. through trusts. Stock-based compensation is measured at the fair value of the services received and the corresponding increase in equity at the grant date (for equity instruments) and is recorded as an expense over the vesting period, with the same amount recognized as an increase in equity. (15) Revenue Our group recognizes revenue based on the following 5-step approach: Step 1: Identify Contracts with Customers Step 2: Identify Performance Obligations in Contracts Step 3: Calculate the transaction price Step 4: Allocate the transaction price to the performance obligations in the contract Step 5: Recognize revenue when the entity meets its performance obligations ① Performance obligations fulfilled at a point in time Our main business of the Group is the manufacture and sale of industrial robot parts, equipment for construction machinery, brake systems and door systems for railway vehicles, aircraft parts, brake systems and drive control systems for automobiles, marine vessel control systems, automatic door systems for buildings and general industries, and platform safety equipment. For the sale of these products, we recognize revenue principally at the time of delivery of the product as the customer often determines that control over the product and performance obligations will be satisfied at the time of delivery of the product. Revenue is measured at the consideration promised in customer contracts, less discounts, rebates and returns. ② Performance obligations to be met over a period of time Our group recognizes revenue in satisfaction of performance obligations over a period of time as control over products or services is transferred over a period of time if any of the following criteria are met: a
Consume the benefits provided by the customer as they perform at the same time.
b
The performance creates or appreciates the asset and the customer controls the creation or accretion of the asset.
c
It has the enforceable right to receive payment for the performance that it has completed to date, and does not create any other assets that can be diverted.
In our group, the revenue associated with performance obligations that are satisfied over a period of time is the performance obligation for platform safety equipment, etc. Revenue for platform safety equipment and other items is estimated and recognized on a progress basis. Progress is calculated as the ratio of actual costs to total estimated costs (input method). (16) Government subsidies Our group initially recognizes government subsidies as deferred revenue at fair value when the ancillary conditions for the subsidies are met and there is reasonable assurance that the subsidies will be received. Subsequent to initial recognition, subsidies related to assets are regularly recognized in profit or loss over the useful life of the asset. Subsidies related to revenue are recognized in profit or loss in the period in which the related expenses are recognized.
―97―
(Translation) This document has been translated from the Japanese original for the convenience of overseas stakeholders. In the event of any discrepancy between this document and the Japanese original, the original shall prevail.
(17) Financial income and costs Financial income consists of interest income, dividend income, gain on valuation of investment securities, foreign exchange gains, etc. Interest income is recognized as incurred using the effective interest method. Dividend income is recognized when our Group's right of receipt is established. Financial costs consist of interest expense, loss on devaluation of derivatives, and loss on devaluation of investment securities. (18) Corporate income tax Income taxes consist of current and deferred income taxes. These are recognized in profit or loss except for items recognized in other comprehensive income, items directly recognized in equity, and items recognized in business combinations. Current taxes are calculated by multiplying current taxable income by the tax rate enacted or substantially enacted as of the end of the fiscal year. Deferred income taxes are recognized for temporary differences between the financial statement carrying amounts of assets and liabilities and their respective tax bases. Deferred tax assets are recognized for deductible temporary differences, unused tax credit carryforwards and operating loss carryforwards to the extent that taxable income is expected to be available to recover them, and deferred tax liabilities are recognized for taxable temporary differences in principle. Deferred tax assets or liabilities are not recorded in the following cases: ・Initial recognition of an asset or liability in a transaction other than a business combination and which does not affect either accounting earnings or taxable income for tax purposes ・Differences on investments in subsidiaries, affiliates, and joint control where it is probable that the differences will not reverse in the foreseeable future ・Taxable temporary differences arising from initial recognition of goodwill Deferred income taxes are measured using tax rates expected to be in effect when temporary differences reverse under laws enacted or substantially enacted at the end of the fiscal year. Deferred tax assets and liabilities are offset when the Company has a legally enforceable right to offset current tax assets and liabilities and income taxes are imposed by the same taxing authority on the same taxable entity. (19) Basic earnings per share Basic earnings per share is computed by dividing net income available to our common stockholders by the weighted average number of common shares outstanding, adjusted for treasury stock for the period. Diluted earnings per share is computed by adjusting for the effect of all dilutive potential common shares. Our potential common stock has stock options. (20) Change in accounting policy The major new or revised pronouncements and interpretations not early adopted by our group as of December 31, 2024 are as follows: The impact of the adoption of this statement on our group is under consideration and cannot be estimated at this time. Statement of Standards
Standard name
Compulsory The year of application period application for our Outline of new establishment and revision (year beginning group thereafter) New requirements for the presentation and
Presentation and IFRS No. 18 Disclosure in Financial Statements
January 1, 2027
FY2027
disclosure
of
financial
performance,
primarily in the income statement
―98―
(Translation) This document has been translated from the Japanese original for the convenience of overseas stakeholders. In the event of any discrepancy between this document and the Japanese original, the original shall prevail.
4.Additional information (1) Revision of errors of prior periods It has come to light that in the calculation of equity in earnings (losses) of affiliates at certain of the Company’s equity-method affiliates, the financial figures obtained from the said equity-method affiliates, which should have been calculated based on changes in consolidated net assets, including the subsidiaries of said equity-method affiliates, were instead calculated based on changes in non-consolidated net assets. As a result, an error was identified whereby the amounts reported as “Equity in earnings of affiliates” in the Company’s consolidated statements of income and “Investments accounted for using the equity method” in the consolidated statement of financial position have been consistently understated since prior years. The Company has determined that retrospective restatement was necessary regarding the above error and has revised the consolidated financial statements and other financial statements contained in the Annual Securities Reports, the Semiannual Reports and the Quarterly Reports that have already been submitted. We have also revised the other errors contained therein.
―99―
(Translation) This document has been translated from the Japanese original for the convenience of overseas stakeholders. In the event of any discrepancy between this document and the Japanese original, the original shall prevail.
5.Critical accounting judgments, estimates and assumptions The preparation of consolidated financial statements in conformity with IFRS requires management to make judgments, estimates and assumptions that affect the application of accounting policies and the reported amounts of assets, liabilities, revenues and expenses. Actual results could differ from those estimates. Estimates and underlying assumptions are reviewed on an ongoing basis. Changes in accounting estimates are recognized in the period in which the estimates change and in future periods affected. Major accounting judgments, estimates and assumptions are as follows: (1) Valuation of inventory In accordance with "3. Important accounting policies " in the notes to inventories, our group makes assumptions about the cost of sales and selling expenses required to complete the calculation of net realizable value. Although management's best estimates and judgments determine these assumptions, they may be affected by changes in uncertain economic conditions in the future and could materially impact the consolidated financial statements if a review is required. The amount of the write-down of inventories is as described in Note "9. Inventories." (2) Significant assumptions used in the calculation of discounted cash flow projections for testing non-financial assets for impairment Our Group tests property, plant and equipment, intangible assets, right of use assets and goodwill for impairment in accordance with Note 3, "Important accounting policies." During the fiscal year under review, the following non-financial assets were tested for impairment. The goodwill impairment test is described in Note "11. Goodwill and Intangible Assets," and the impairment of non-financial assets, including goodwill, is described in Note "12. Impairment of Non-Financial Assets." ①Gilgen's goodwill Goodwill (carrying amount: ¥17,251 million) related to Gilgen Door Systems AG and 8 subsidiaries in Accessibility Solutions segment (hereinafter referred to as the "Gilgen Group") was tested for impairment on an annual basis in accordance with Note 3, "Important accounting policies." As a result, no impairment loss was recorded for the goodwill as the value in use exceeded its carrying value. The recoverable amounts of non-financial assets related to Gilgen are measured at value in use. Value in use is calculated by discounting future cash flows determined based on the business plan of the business using a weighted-average cost of capital discount rate. Estimates of value in use include key assumptions such as projections of sales and operating margins in the business plan, projections of growth rates since the business plan period, and discount rates based on weighted average cost of capital. These assumptions are determined based on management's best estimates and judgments; however, because of the high degree of uncertainty involved in forecasting demand for key market conditions and other factors, if the profitability of the business is reduced and it is determined that sufficient cash flow cannot be generated, the amount of non-financial assets recognized in the consolidated financial statements for the following fiscal year could be materially affected. ② Goodwill of Power Control Company Goodwill (carrying amount: ¥2,582 million) related to Power Control Company in Component Solutions Business was tested for impairment on an annual basis in accordance with Note 3, "Important accounting policies." As a result, no impairment loss was recorded for the goodwill as the value in use exceeded its carrying value. The recoverable amount of non-financial assets related to Power Control Company is measured at value in use. Value in use is calculated by discounting future cash flows determined based on the business plan of the business using a weighted-average cost of capital discount rate. Estimates of value in use include significant assumptions such as forecasts of sales in the business plan, projections of growth rates since the business plan period, and discount rates based on weighted average cost of capital. These assumptions are determined based on management's best estimates and judgments; however, because of the high degree of uncertainty involved in forecasting demand for key market conditions and other factors, if the profitability of the business is reduced and it is determined that sufficient cash flow cannot be generated, the amount of non-financial assets recognized in the consolidated financial statements for the following fiscal year could be materially affected.
―100―
(Translation) This document has been translated from the Japanese original for the convenience of overseas stakeholders. In the event of any discrepancy between this document and the Japanese original, the original shall prevail.
③ Goodwill of Deep Sea Goodwill (carrying amount: ¥4,420 million) related to R.K. DEEP SEA TECHNOLOGIES LIMITED and one of its subsidiaries in Transport Solutions segment were tested for impairment in accordance with Note 3, "Important accounting policies." As a result, no impairment loss was recorded for the goodwill as the value in use exceeded its carrying value. The recoverable amount of non-financial assets related to Deep Sea is measured at value in use. Value in use is calculated by discounting future cash flows determined based on the business plan of the business using a weighted-average cost of capital discount rate. Estimates of value in use include significant assumptions such as forecasts of sales in the business plan, projections of growth rates since the business plan period, and discount rates based on weighted average cost of capital. These assumptions are determined based on management's best estimates and judgments; however, because of the high degree of uncertainty involved in forecasting demand for key market conditions and other factors, if the profitability of the business is reduced and it is determined that sufficient cash flow cannot be generated, the amount of non-financial assets recognized in the consolidated financial statements for the following fiscal year could be materially affected. (3) Reserves and contingent liabilities Our group records reserves for product warranties and other items in the consolidated statements of financial condition. These accruals are based on our best estimate of the expenditures required to settle the obligation, taking into account the risks and uncertainties associated with the obligation at the end of the period. The amount of expenditures required to settle liabilities is calculated by comprehensively considering possible future results. However, the amount may be affected by the occurrence of unforeseeable events or changes in circumstances. If actual payments differ from the estimates, the amount recognized in the consolidated financial statements for the following fiscal year and thereafter may be materially affected. Contingent liabilities, if any, are disclosed after considering all available evidence at the date of the financial statements and considering their likelihood and amount of occurrence. The details of the allowance and its carrying value are described in Note "17. "Reserves," and the contingent liabilities are described in Note "34. Contingent Liabilities." (4) Measurement of defined benefit obligations Our group has various retirement benefit plans, including defined benefit plans. The present value of the defined benefit obligations and related service costs for each of these plans are based on actuarial assumptions, such as discount rates and mortality rates. Although actuarial assumptions are determined based on management's best estimates and judgments, they may be affected by changes in uncertain economic conditions in the future and could materially impact the consolidated financial statements if a review is required.
(Amended) Annual Securities Report FY2023 Sep 30, 2026 Investor Relations Securities report
Bull 0
Bear 3
Results
(Translation) This document has been translated from the Japanese original for the convenience of overseas stakeholders. In the event of any discrepancy between this document and the Japanese original, the original shall prevail.
[Cover] [Filing]
Amendment Report to Annual Securities Report
[Articles of Basis]
Article 24(1) of the Financial Instruments and Exchange Act
[Submit to]
Kanto Finance Bureau
[Submission date]
September 30, 2026
[Fiscal year]
21st fiscal period (from January 1, 2023 to December 31, 2023)
[Company name]
Nabtesco Corporation
[English translation name]
Nabtesco Corporation
[Title of Representative]
Kazumasa Kimura, representative director
[Location of the head office]
7-9, Hirakawacho 2-chome, Chiyoda-ku, Tokyo
[Phone No.]
+81-3-5213-1134
[Name of administrative liaison]
Yasushi Minegishi, General Manager, Corporate Communications Dept.
[Near contact location]
7-9, Hirakawacho 2-chome, Chiyoda-ku, Tokyo
[Phone No.]
+81-3-5213-1134
[Name of administrative liaison]
Yasushi Minegishi, General Manager, Corporate Communications Dept.
[Locations for Public Inspection]
Tokyo Stock Exchange, Inc. (2-1, Nihonbashi Kabutocho, Chuo-ku, Tokyo)
―1―
(Translation) This document has been translated from the Japanese original for the convenience of overseas stakeholders. In the event of any discrepancy between this document and the Japanese original, the original shall prevail.
- Reasons for Filing the Amendment Report to the Annual Securities Report In April 2026, the Company became aware that TMT Machinery, Inc., (Nabtesco's ownership interest is 33%.) an equity-method affiliate, had recorded a gain on extinguishment of tie-in shares arising from the absorption-type merger of one of its subsidiaries (approximately ¥600 million attributable to Nabtesco's ownership interest). Upon becoming aware of this matter, the Company shared the information with its independent auditor and commenced an investigation into the retained earnings accumulated within TMT Machinery's subsidiaries and affiliated entities. As TMT Machinery is an unlisted company and does not prepare consolidated financial statements, the Company had historically applied the equity method based on TMT Machinery's standalone financial statements. Through its investigation, the Company identified that substantial retained earnings had accumulated within TMT Machinery's subsidiaries and affiliated entities and that the portion attributable to the Company had not been reflected in the share of profit (loss) of investments accounted for using the equity method. While continuously consulting with its independent auditor, the Company proceeded with a detailed review of the scope and amount of profits to be recognized. In the course of the accounting auditor’s interim review procedures for the condensed interim consolidated financial statements included in the Semi-annual Securities Report filed on August 14, 2026, the Company re-examined the scope and amounts of profit to be recognized and determined that the aggregate unrecognized amount was expected to be approximately ¥2.8 billion based on the Company’s ownership interest. Following discussions with the accounting auditor, the Company determined that it would be appropriate to recognize share of profit (loss) of investments accounted for using the equity method in accordance with the timing at which profits and losses arose at the subsidiaries and other entities in prior fiscal years, and to correct other errors at the same time. Accordingly, the Company determined that it was necessary to retrospectively amend its Annual Securities Reports, Semi-annual Securities Reports and Quarterly Securities Reports for prior fiscal years. As a result, certain information contained in the Annual Securities Report for the 21st fiscal year (from January 1, 2023 to December 31, 2023), filed by the Company on March 27, 2024, requires correction. Accordingly, pursuant to the provisions of Article 24-2, paragraph (1) of the Financial Instruments and Exchange Act, the Company hereby files this Amendment Report to the Annual Securities Report. The amended consolidated financial statements and non-consolidated financial statements have been audited by KPMG AZSA LLC, and the relevant independent auditor’s report is attached hereto.
- Matters Amended Part I. Corporate Information Section 1. Overview of the Company
- Trend in Major Management Indicators
- Description of Business
- Status of Affiliated Companies Section 2. Business Conditions
- Management Policies, Business Environment and Issues to Be Addressed
- Policies and Measurers for Sustainability Management
- Management’s Discussion and Analysis of Financial Condition, Results of Operations and Cash Flows Section 4. Status of the Company Submitting the Report
- Status of Corporate Governance Section 5. Accounting Status
- Consolidated Financial Statements
- Non-consolidated Financial Statements
- Amended Sections Amended sections are indicated by underlining. As the amendments are extensive, only the amended information is presented for the matters listed above.
―2―
(Translation) This document has been translated from the Japanese original for the convenience of overseas stakeholders. In the event of any discrepancy between this document and the Japanese original, the original shall prevail.
Part one 【Corporate Information】 No.1 【Overview of the Company】 1 【Changes in Major Management Indicators】 (1) Consolidated management indicators Fiscal term
17th
18th
19th
20th
21th
Fiscal year
2019/12
2020/12
2021/12
2022/12
2023/12
(Millions of yen) Income before income (Millions taxes of yen) Net income attributable to (Millions owners of the parent of yen) (Millions Net income of yen) Comprehensive income (Millions attributable to owners of of yen) the parent (Millions Comprehensive income of yen) Equity attributable to (Millions owners of the parent of yen) (Millions Total assets of yen) Equity attributable to owners of the parent per (Yen) share Total basic earnings per (Yen) share Net sales
Diluted earnings per share Ratio of equity attributable to owners of the parent Profit ratio of equity attributable to owners of the parent company Price-earnings ratio
289,808
279,358
299,641
309,123
333,367
27,979
33,711
101,806
16,553
25,316
17,931
20,320
64,771
10,415
14,226
19,951
23,327
67,846
12,338
16,102
17,602
20,032
71,573
19,048
20,762
19,459
23,122
75,924
21,597
23,217
187,398
199,362
241,372
251,250
262,721
344,558
353,591
483,653
462,440
428,630
1,508.53
1,604.83
2,011.28
2,093.15
2,188.27
144.50
163.69
534.29
86.79
118.52
(Yen)
144.42
163.61
534.14
86.78
118.50
(%)
54.4
56.4
49.9
54.3
61.3
(%)
9.8
10.5
29.4
4.2
5.5
(times)
22.6
27.6
6.4
38.8
24.3
38,433
34,203
36,340
7,717
11,177
-20,086
-10,710
67,147
13,231
-46,295
-13,365
-17,497
-57,960
-13,456
-13,482
58,686
64,665
112,771
124,413
77,835
7,736
7,717
7,844
7,928
8,158
Cash flows from operating (Millions activities of yen) Cash flows from investing (Millions activities of yen) Cash flows from financing (Millions activities of yen) Cash and cash equivalents (Millions at fiscal year end of yen) Number of employees
(Persons)
(NOTE) 1 Figures are rounded to the nearest unit. 2 Consolidated financial statements are prepared in accordance with International Financial Reporting Standards (IFRS). 3 Consolidated management indicators for the 17th fiscal term have not undergone corrections described in Section 1. Reasons for Submission of a Corrections Report of an Annual Securities Report.
―3―
(Translation) This document has been translated from the Japanese original for the convenience of overseas stakeholders. In the event of any discrepancy between this document and the Japanese original, the original shall prevail.
(2) Non-consolidated management indicators Fiscal term
17th
18th
19th
20th
21th
Fiscal year
2019/12
2020/12
2021/12
2022/12
2023/12
Net sales Ordinary income Net Income Common stock Number of issued shares Net assets Total assets
(Millions of yen) (Millions of yen) (Millions of yen) (Millions of yen) (Thousan ds of shares) (Millions of yen) (Millions of yen)
159,180
150,145
163,288
167,511
176,334
14,973
15,514
18,703
19,635
11,653
4,373
12,039
51,427
37,966
14,527
10,000
10,000
10,000
10,000
10,000
125,134
125,134
121,064
121,064
121,064
117,106
118,647
170,165
169,220
174,651
223,288
222,834
311,706
292,573
275,331
942.20
954.65
1,417.76
1,454.85
1,454.59
73.00
75.00
77.00
78.00
80.00
(36.00)
(41.00)
(38.00)
(39.00)
(40.00)
Net assets per share
(Yen)
Dividends per share (including interim dividends per share)
(Yen)
Net income per share
(Yen)
35.24
96.98
424.22
316.39
121.02
Fully diluted Net income per share
(Yen)
35.22
96.93
424.11
316.32
121.00
Equity Ratio
(%)
52.4
53.2
54.6
59.7
63.4
Return on equity
(%)
3.7
10.2
35.6
22.0
8.5
Price-earnings ratio
(times)
92.7
46.6
8.0
10.6
23.8
Dividend payout ratio
(%)
207.2
77.3
18.2
24.7
66.1
2,323
2,366
2,369
2,390
2,448
(337)
(333)
(342)
(317)
(344)
Number of employees (Average number of temporary employees) Total shareholder return (Comparative index: TOPIX including dividends)
(Persons) (%)
142.4
197.9
154.5
156.1
136.1
(%)
(118.1)
(126.8)
(143.0)
(139.5)
(178.9)
Highest stock price
(Yen)
3,675
4,570
5,610
3,805
3,795
Lowest stock price
(Yen)
2,216
2,007
3,120
2,709
2,518
(NOTE) 1 Figures are rounded to the nearest unit. 2 The highest and lowest share prices are those on the First Section of the Tokyo Stock Exchange before April 3, 2022, and those on the Tokyo Stock Exchange Prime Market after April 4, 2022. 3 Non-consolidated management indicators for the 17th fiscal term have not undergone corrections described in Section 1. Reasons for Submission of a Corrections Report of an Annual Securities Report.
―4―
(Translation) This document has been translated from the Japanese original for the convenience of overseas stakeholders. In the event of any discrepancy between this document and the Japanese original, the original shall prevail.
2 【History】 Year and month
History
September. 2003 TS Corporation (formerly Teijin Seiki Co., Ltd.) and NABCO Ltd. established the Company through a share transfer. The Company listed our shares on the First Section of the Tokyo Stock Exchange. October, 2004 The Company absorbed two wholly owned subsidiaries, TS Corporation (formerly Teijin Seiki Co., Ltd.) and NABCO Ltd., through a simplified merger process. February, 2008. The Company established a Nabtesco Power Control (Thailand) Co., Ltd. in Thailand. December, 2009 Established Nabtesco Automotive Corporation. The automobile-related equipment business was transferred to the company. January, 2011 April, 2011
Established Jiangsu Nabtesco KTK Railroad Products Co., Ltd. in China. Acquired Automatic Door division (now Gilgen Door Systems AG) from KABA Holding AG of Switzerland.
August, 2011. The head office was relocated to the current site (7-9, Hirakawa-cho 2-chome, Chiyoda-ku, Tokyo). October, 2011 Established Jiangsu Nabtesco Hydraulic Co., Ltd. (currently Nabtesco (China) Precision Equipment Co., Ltd.) in China. April, 2016 Acquired additional shares in NABCO Systems Co., Ltd., and made it a subsidiary. March, 2017 Acquired an equity interests in OVALO GmbH and made it a subsidiary. April, 2022 Shifted from the First Section to the Prime Market due to a review of the market classification of the Tokyo Stock Exchange. August, 2023
Acquired an equity interest in R.K. DEEP SEA TECHNOLOGIES LIMITED and made it a subsidiary.
(NOTE) The history of the wholly-owned subsidiaries TS Corporation (formerly Teijin Seiki Co., Ltd.) and NABCO Ltd. is as follows. TS Corporation. August, 1944
NABCO Ltd.
Spun off as Teijin Aircraft Industry Co., Ltd. from Teikoku
March, 1925
Nippon Air Brake Co., Ltd. was established in Kobe through
Jinzo-Kenshi Kaisha, Ltd., (renamed TEIJIN LIMITED in
the investment of three companies: Kobe Steel, Ltd., Engine
November 1962).
Manufacturing Co., Ltd., Tokyo Gas Electric Industrial Co., Ltd. and began manufacturing air brake equipment for railroad vehicles.
September, 1945 Name changed to Teijin Seiki Co., Ltd.
March 1933
Began manufacturing of automotive oil brake equipment.
June 1937
Began manufacturing automotive air brake systems.
November, 1945 Started manufacturing textile machinery. February, 1949 Head office moved from Iwakuni to Osaka.
December, 1943 Name changed to Nippon Brake Systems Co., Ltd.
August, 1949
Listed on the Osaka Securities Exchange
March, 1955
Began manufacturing functional parts for aircraft.
June, 1946
March, 1959
Began manufacturing of machine tools and industrial
Name changed to Nippon Air Brake Co., Ltd.
February, 1949 Began manufacturing hydraulic equipment. May, 1949
Listed on the Osaka Securities Exchange
machinery. September, 1961 Began manufacturing Hydraulic equipment.
December 1953 Began manufacturing of door systems for railroad vehicles.
September, 1962 Listed on the 1st section of the Tokyo Stock Exchange.
July, 1956
Began manufacturing of automatic door systems for
October, 1999
Head office moved from Osaka to Tokyo.
June 1963
Began manufacturing of marine control equipment.
March, 2000
Teijin Seiki Textile Machinery Co., Ltd. (dissolved in February, 1985 Listed on the 1st section of the Tokyo Stock Exchange.
buildings.
March 2012) is established. The textile machinery business was transferred to the company. April, 2002
Established TMT Machinery Inc. as a joint venture with
April, 1992
Name changed to NABCO, Ltd.
Toray Engineering Co., Ltd. and Murata Machinery Co., Ltd. In April 2003, the synthetic fiber machinery business was transferred to the company. October, 2003
Name changed to TS Corporation.
October, 1999 Transferred the passenger car oil brake business to Bosch Brake System Co., Ltd. (now Bosch Corporation).
October, 2004
Eliminated due to the merger with Nabtesco Corporation.
October, 2004 Eliminated due to the merger with Nabtesco Corporation.
―5―
(Translation) This document has been translated from the Japanese original for the convenience of overseas stakeholders. In the event of any discrepancy between this document and the Japanese original, the original shall prevail.
3【Description of business】 The group consists of the Company, 66 subsidiaries, and 15 affiliated companies. Main businesses of the Group are divided into Component Solutions Business, Transport Solutions Business, and Accessibility Solutions Business. Its business operations and their positioning and relation to segments are as follows. The categories shown below are the same as those of segments. (1) Business Activities Segment name
Business Activities
Component solutions
Design, manufacture, sale, maintenance and repair of industrial robot parts,
business
construction machinery equipment and other components. Design, manufacture, sale, maintenance and repair of brake systems, door systems,
Transport
couplers and safety systems for railway cars, parts for aircraft, brake systems, drive
solutions business
control systems and safety systems for automobiles, control systems and fire extinguishing systems for marine vessels, etc., and parts thereof.
Accessibility solutions business
Design, manufacture, sale, installation, maintenance, and repair of buildings and general industrial automatic doors, smoke emission equipment, platform safety equipment, welfare and nursing care equipment, and other components. Design, manufacture, sale, maintenance and repair of packaging machinery,
Others
machine tools, forging machinery, textile machinery, three-dimensional model creation equipment and other general industrial machinery and other components.
―6―
(Translation) This document has been translated from the Japanese original for the convenience of overseas stakeholders. In the event of any discrepancy between this document and the Japanese original, the original shall prevail. (2) Relationship between the segments of the Company, its subsidiaries and affiliates Business Segment
Domestic
Overseas
Nabtesco Corporation T.S. Mechatech Co., Ltd.
Nabtesco (China) Precision Equipment Co., Ltd. ※1 Changzhou Nabtesco Precision Machinery Co., Ltd.
Nabtesco Corporation Nabtesco Marine Shikoku Co., Ltd. Nabtesco Automotive Corporation Nabtesco Service Co., Ltd. NABTEC Co., Ltd. Dairiki Tekko Co., Ltd Kyokko Denki Co., Ltd.
※1 ※1 ※1 ※1 ※2 ※2
Nabtesco Corporation NABCO DOOR Ltd. NABCO SYSTEM CO., LTD. Niigata Nabco Pty. Ltd. Nabco Metal Co., Ltd. Nabco Toto Co., Ltd.
※1 ※1 ※1 ※1 ※1
Component Solutions Business
Transport Solutions Business
Accessibility Solutions Business
PACRAFT Co., Ltd.
Others
CMET, Inc. TMT machinery Inc. and three other companies
Nabtesco Corporation Nabtesco Link Corporation
※1 ※1 ※2
※1
Company-wide
Subsidiaries and affiliates Total of 81
As of December 31, 2023
19 domestic companies
※1 ※1 Nabtesco Precision Europe GmbH ※1 Nabtesco Motion Control, Inc. ※1 Shanghai Nabtesco Motion-Equipment Co., Ltd. ※2 Shanghai Nabtesco Hydraulic Co., Ltd. ※1 Shanghai Nabtesco Hydraulic Equipment Trading Co., Ltd. ※1 Nabtesco Power Control (Thailand) Co., Ltd. ※1 Nabtesco Power Control Europe GmbH ※1 ※1 Jiangsu Nabtesco KTK Railroad Products Co., Ltd. Chengdu Nabtesco KTK Railroad Products Co., Ltd. ※1 Nabtesco Oclap S.r.l. ※1 ※1 Nabtesco Marine Machinery (Shanghai) Co., Ltd. Nabtesco Marine Europe B.V. ※1 Nabtesco Marine Asia Pacific Pte. Ltd. ※1 Nabtesco Marinetec Co., Ltd. ※1 Deep Sea Technologies SMPC ※1 R.K. DEEP SEA TECHNOLOGIES LIMITED ※1 Nabtesco Aerospace, Inc. ※1 Nabtesco Aerospace Europe GmbH ※1 ※1 Nabtesco Automotive System (Shanghai) Co., Ltd. Nabtesco Automotive Products (Thailand) Co., Ltd. ※1 Minda Nabtesco Automotive Private Limited ※2 Taiwan Nabtesco Service Co., Ltd. ※1 Nabtesco Service Southeast Asia Co., Ltd. ※1 NS Autotech Co., Ltd. ※2 OVALO GmbH ※1 adcos GmbH ※1 ※1 NABCO Auto Door (Beijing) Co., Ltd. NABCO Entrances, Inc. ※1 NABCO Canada Inc. ※1 Royal Doors Ltd. ※1 Gilgen Door Systems AG ※1 Gilgen Nabtesco (Hong Kong) Limited ※1 Gilgen Door Systems Germany GmbH ※1 Gilgen Door Systems Austria GmbH ※1 Gilgen Door Systems France S.a.r.l. ※1 Gilgen Door Systems Italy srl ※1 Gilgen Door Systems Scandinavia AB ※1 Wupper Glas und Tür Technik GmbH ※1 Gilgen Door Systems Australia Pty Ltd. ※1 Copas Systèmes SAS ※1 Access Entry Pty Ltd. ※2 GDS Vostok AG ※2 PACRAFT (Dalian) Packaging Technology Co., Ltd. ※1 PACRAFT America Corporation ※1 PACRAFT Europe GmbH ※1 Engilico Engineering Solutions NV ※1 Engilico BV ※1 Engilico USA, LLC ※1 Engilico Trading, LLC ※1 SHANGHAI TMT MACHINERY, INC. and three other ※2 companies Shanghai Nabtesco Business Management Co., Ltd. ※1 Nabtesco India Private Ltd. ※1 Nabtesco USA Inc. ※1 Nabtesco Europe GmbH ※1 Nabtesco Technology Ventures AG ※1 Nabtesco Technology Ventures (Cayman) Ltd. ※1 Nabtesco Technology Ventures L.P. ※1 62 overseas companies
―7―
(Translation) This document has been translated from the Japanese original for the convenience of overseas stakeholders. In the event of any discrepancy between this document and the Japanese original, the original shall prevail.
※1 Consolidated subsidiaries ※2 Affiliated companies accounted for by the equity method (NOTE) Changes in Consolidated Subsidiaries and Affiliated Companies Accounted for by the Equity Method (Consolidated Subsidiaries) Increase: 3 companies Nabtesco Corporation acquired all the shares of Copas Systèmes SAS, Deep Sea Technologies SMPC and R.K. DEEP SEA TECHNOLOGIES LIMITED and made those companies as subsidiaries. Decrease: 1 company The Company has resolved to transfer all shares of TS Precision Co., Ltd. (Affiliated Companies Accounted for by the Equity Method) Increase: 1 company TMT machinery Inc. established TMT MACHINERY VIET NAM COMPANY LIMITED.
―8―
(Translation) This document has been translated from the Japanese original for the convenience of overseas stakeholders. In the event of any discrepancy between this document and the Japanese original, the original shall prevail.
(3) Organization chart of the business (Subsidiaries)
(Affiliates)
(Precision reduction gears) Nabtesco (China) Precision Equipment Co., Ltd.
Shanghai Nabtesco Motion-Equipment Co., Ltd.
Changzhou Nabtesco Precision Machinery Co., Ltd. Nabtesco Precision Europe GmbH Component Solutions Business
Nabtesco Motion Control, Inc. (Hydraulic equipment) Shanghai Nabtesco Hydraulic Co., Ltd. Shanghai Nabtesco Hydraulic Equipment Trading Co., Ltd.
Nabtesco Power Control (Thailand) Co., Ltd. Nabtesco Power Control Europe GmbH
(the Others) T.S. Mechatech Co., Ltd. (Railroad Vehicle Equipment) Jiangsu Nabtesco KTK Railroad Products Co., Ltd., others
Dairiki Tekko Co., Ltd
Nabtesco Oclap S.r.l. (Marine vessel equipment) Nabtesco Marine Shikoku Co., Ltd.
Kyokko Denki Co., Ltd.
Nabtesco Marine Machinery (Shanghai) Co., Ltd. Nabtesco Marine Europe B.V. Nabtesco Marine Asia Pacific Pte. Ltd. Nabtesco Marintec Co., Ltd.
(Aircraft equipment)
Customers
Nabtesco Corporation
Transport Solutions Business
R.K. DEEP SEA TECHNOLOGIES LIMITED. and others
Nabtesco Aerospace, Inc. Nabtesco Aerospace Europe GmbH (Commercial vechicle equipment) Nabtesco Automotive Corporation
Minda Nabtesco Automotive Private Limited
Nabtesco Automotive System (Shanghai) Co., Ltd. Nabtesco Automotive Products(Thailand) Co., Ltd.
(Others) Nabtesco Service Co., Ltd.
NS Autotech Co., Ltd.
NABTEC Co., Ltd. Taiwan Nabtesco Service Co., Ltd. OVALO GmbH and others
Accessibility Solutions Business
(Automatic Door business) NABCO DOOR Ltd.
Access Entry Pty Ltd. GDS Vostok AG
NABCO SYSTEM CO., LTD. and others NABCO Auto Door (Beijing) Co., Ltd. NABCO Entrances, Inc. and others Gilgen Door Systems AG and others (Packaging Machines ) PACRAFT Co., Ltd.
TMT machinery Inc.
PACRAFT (Dalian) Packaging Technology Co., Ltd. PACRAFT America Corporation Others
PACRAFT Europe GmbH Engilico Engineering Solutions NV and others[
(Others)
CMET, Inc.
―9―
(Translation) This document has been translated from the Japanese original for the convenience of overseas stakeholders. In the event of any discrepancy between this document and the Japanese original, the original shall prevail.
4 【Status of Affiliated Companies】
Name
Address
As of December 31, 2023 Common stock (Millions of yen)
Main business (Note 1)
Percentage of voting rights held [owned] (%)(Note 2)
(Consolidated Subsidiaries)
Related content
Sales, installation and maintenance of our products. Interlocking officers, etc. None Lending and Borrowing of Funds, etc. Interlocking officers, etc. Yes Sales, installation and maintenance of the Company’s products. Interlocking officers, etc. None Sales, installation and maintenance of the Company’s products. Interlocking officers, etc. Yes
NABCO DOOR Ltd.
Kita-ku,Osaka city Osaka prefecture
848
Accessibility
100.0
Nabtesco Automotive Corporation
Chiyoda-ku, Tokyo
450
Transport
100.0
Nabtesco Service Co., Ltd.
Shinagawa, Tokyo, Japan
300
Transport
100.0
NABCO SYSTEM CO., LTD.
Chiyoda-ku, Tokyo
300
Accessibility
85.9
PACRAFT Co., Ltd.
Minato-ku, Tokyo
245
Others
100.0
Nabtesco (China) Precision Equipment Co., Ltd. (Note 3)
China Jiangsu province
$ thousand 50,000
Component
67.0
Jiangsu Nabtesco KTK Railroad Products Co., Ltd. (Notes 3 and 4)
China Jiangsu province
1,800
Transport
50.0
Shanghai Nabtesco Hydraulic Co., Ltd. (Note 3)
China Shanghai City
$ thousand 14,500
Component
55.0
Shanghai Nabtesco Hydraulic Equipment Trading Co., Ltd.
China Shanghai City
100
Component
67.0
Nabtesco Aerospace, Inc.
United States Washington state
$ thousand 1,000
Transport
NABCO Entrances, Inc.
United States Wisconsin State
$ thousand 0.3
Accessibility
Gilgen Door Systems AG
Switzerland Bern
thousand CHF 2,001
Accessibility
100.0
Component
100.0 Sales of our products (100.0) Interlocking officers, etc. None
Component
70.0
Nabtesco Precision Europe GmbH Nabtesco Power Control (Thailand)Co., Ltd. (NOTE)3 Other 52 companies
Germany Dusseldorf
Thousands of euros 51 Thousands of Thai Thailand baht Chonburi Prefecture 700,000
Kita-ku,Osaka city Osaka prefecture
450
Lending and borrowing of funds Interlocking officers, etc. Yes Mutual supply of products and parts with the Company, etc. Interlocking officers, etc. Yes Mutual supply of products and parts with the Company Interlocking officers, etc. Yes Mutual supply of products and parts with the Company Interlocking officers, etc. Yes Sales of our products Interlocking officers, etc. Yes
Mutual supply of products and 100.0 parts with the Company (100.0) Interlocking officers, etc. None Mutual supply of products and 100.0 parts with the Company (100.0) Interlocking officers, etc. None
Interlocking officers, etc. None
Mutual supply of products and parts with the Company Interlocking officers, etc. None
(Equity-method affiliates) TMT machinery Co., Ltd. 14 other companies
Others
33.0
Interlocking officers, etc. Yes
(NOTE) 1 The name of the segment is shown in the main business section. 2 Percentage of voting rights held [owned] column (in parentheses) is indirect ownership. 3 A specified subsidiary. 4 Although the Company holds 50% of the voting rights, it is considered to have substantial control, and therefore it is considered a consolidated subsidiary.
―10―
(Translation) This document has been translated from the Japanese original for the convenience of overseas stakeholders. In the event of any discrepancy between this document and the Japanese original, the original shall prevail.
5 【Employee Status】 (1) Consolidated basis As of December 31, 2023 Business Segment
Number of employees
Component Solutions Business
1,898
Transport Solutions Business
2,134
Accessibility Solutions Business
3,343
Others
403
Company-wide (common)
380 Total
8,158
(NOTE) 1 The number of employees is the number of employees employed, including those seconded from outside our group to our group, except for those seconded from our group to outside our group. 2 The number of temporary employees is omitted because it is less than 10/100 of the number of employees. (2) Status of the submitting company Number of employees
Average age(years)
Average length of service (year)
2,448 ( 344 )
42.4
17.0
Business Segment
As of December 31, 2023 Average annual salary (thousands of yen) 6,957
Number of employees 968 ( 275 ) 909 ( 53 ) 237 ( 14 ) 9 ( - ) 325 ( 2) 2,448 ( 344 )
Component Solutions Business Transport Solutions Business Accessibility Solutions Business Others Company-wide (common) Total
(NOTE) 1 The number of employees is the number of employees employed, including those seconded from other companies to us, except for those seconded from us to other companies. 2 Average length of service is the period of service at the wholly owned subsidiary prior to the merger. 3 Average annual salary includes bonuses and non-standard wages. 4 Figures in (superscription) in the number of employee’s column are the average number of temporary employees per year.
(3) Union Information The labor unions of the submitting companies belong to JAM as a top organization, and as of December 31, 2023, there were 1,971 union members. Labor-management relations are in a smooth relationship, and there are no noteworthy matters. In addition, labor unions are formed in some consolidated subsidiaries, and there are no noteworthy matters regarding labormanagement relations as they are in a smooth relationship. t
―11―
(Translation) This document has been translated from the Japanese original for the convenience of overseas stakeholders. In the event of any discrepancy between this document and the Japanese original, the original shall prevail.
(4) Percentage of female workers in managerial positions, percentage of male workers taking childcare leave, and differences in wages between male and female workers ① Status of the submitting company
Current fiscal year
Percentage of female workers in managerial positions (%)(NOTE1)
Percentage of male workers taking childcare leave (%)(NOTE2)
3.0
80.8
Differences in wages between male and female workers (%)(NOTE1 and 3) All workers
Regular workers 80.6
Part-timers and fixed-term workers
82.7
70.5
(NOTE) 1 Calculated in accordance with the provisions of the “The Act on Promotion of Women’s Participation and
Advancement in the Workplace” (Law No. 64 of 2015). Percentage of female workers in managerial positions is as of December 31, 2023 2 In accordance with the provisions of the “Act on the Welfare of Workers Who Take Care of Children or Other Family Members Including Child Care and Family Care Leave”(Law No. 76 of 1991), calculated by Article 71-4, Item 1 of the "Ordinance for Enforcement of the Act on the Welfare of Workers Who Take Care of Children or Other Family Members Including Child Care and Family Care Leave" (Labor Ordinance No. 25 of 1991). The rate of male employees taking childcare leave may exceed 100% due to the effects of taking childcare leave, etc. on children born in the previous year. 3 There is no difference in treatment according to gender in the wage system. Figures for overseas employees are calculated based on the theoretical wages of non-regular employees who worked in Japan and those who worked part-time on a full-time basis. Reduced working hours due to childcare or nursing care are not compensated.
<Supplementary Explanation for each figure> ・KPIs for human capital of the submitting company is described on “No.2 Business Conditions, 2 Policies and Measures for Sustainability Management (3) Enhance Human Capital Management”. For detailed data on employment-related data and diversity initiatives, please refer to the Social (Social) category in ESG data book on our sustainability website.
・We recognize that one of our key initiatives is to fulfill our human resources portfolio and incorporate a diverse range of perspectives in order to become an "Leaders in innovation" as stated in our long-term vision. By the end of the planning period of the general employer action plan under the Act on Promotion of Women's Participation and Advancement in the Workplace, the submitting company aims to raise the percentage of female workers in managerial positions from the current 3.0% to 4.1%. As part of our pipeline-building measures for the internal development of female managers, we conduct "Female manager candidate training" for mid-level employees and their supervisors as well as "Diversity training" to eliminate the unconscious bias surrounding female employees. As a result of analyzing the causes of wage differences between men and women at the submitting companies, the main reasons for the wage differences are basic remuneration and various allowances for regular workers according to their position. In addition to the aforementioned pipeline formulation measures, we are promoting the provision of equal opportunities regardless of gender by granting themes that lead to the career development of female employees. We also recognize that an increase in the number of male workers with childcare participation experience leads to the promotion of diversity and the creation of innovation as stated in our long-term vision. Based on this recognition, we have set a goal of taking childcare leave (including special leave) of one month and are working to create an environment in which male workers are encouraged to take proactive childcare leave.
―12―
(Translation) This document has been translated from the Japanese original for the convenience of overseas stakeholders. In the event of any discrepancy between this document and the Japanese original, the original shall prevail.
② Consolidated Subsidiaries Name
Current fiscal year Differences in wages between male and female workers (%)(NOTE1 and 3) Percentage of female Percentage of male workers in managerial workers taking childcare Part-timers and Regular leave (%)(NOTE2) positions (%)(NOTE1) All workers fixed-term workers workers
NABTEC Co., Ltd.
-
50.0
86.4
89.7
53.7
Nabtesco Service Co., Ltd.
7.7
-
79.8
87.0
50.7
Nabtesco Automotive Corporation
3.8
300.0
58.2
65.8
63.9
PACRAFT Co., Ltd.
9.4
50.0
79.0
80.6
33.8
T.S. Mechatech Co., Ltd.
-
50.0
71.5
71.0
94.9
NABCO DOOR Ltd.
1.0
35.7
70.5
70.1
54.4
NABCO SYSTEM CO., LTD.
-
45.0
66.2
66.1
72.8
(NOTE) 1 Calculated in accordance with the provisions of the “The Act on Promotion of Women’s Participation and
Advancement in the Workplace” (Law No. 64 of 2015). Percentage of female workers in managerial positions is as of December 31, 2023
2
In accordance with the provisions of the “Act on the Welfare of Workers Who Take Care of Children or Other Family Members Including Child Care and Family Care Leave”(Law No. 76 of 1991), calculated by Article 71-4, Item 1 of the "Ordinance for Enforcement of the Act on the Welfare of Workers Who Take Care of Children or Other Family Members Including Child Care and Family Care Leave" (Labor Ordinance No. 25 of 1991). The rate of male employees taking childcare leave may exceed 100% due to the effects of taking childcare leave, etc. on children born in the previous year.
3 There is no difference in treatment according to gender in the wage system. Figures for overseas employees are calculated based on the theoretical wages of non-regular employees who worked in Japan and those who worked parttime on a full-time basis. Reduced working hours due to childcare or nursing care are not compensated.
―13―
(Translation) This document has been translated from the Japanese original for the convenience of overseas stakeholders. In the event of any discrepancy between this document and the Japanese original, the original shall prevail.
No.2 【Business Conditions】 1 [Management Policies, Management Environment and Issues to be Addressed] In order to realize our corporate philosophy, “Providing safety, comfort and a sense of security in daily lives as well as any form of transportation with our unique motion control technology,” the Nabtesco Group have adopted "The Nabtesco Way," which expresses our attitude and mindset as "The Principles We Value." We are promoting a long-term value creation story that consists of our "Long-term Vision," which is our aim for 2030, our "Management Materiality," which shows the long-term in achieving our long-term vision, and our "Medium-term Management Plan," which is our implementation measures. Through these efforts, we are pursuing management that aims for sustainable growth for both society and our group by creating innovation and improving economic, environmental and social value over the long term.
<Nabtesco’s Value Creation Story>
―14―
(Translation) This document has been translated from the Japanese original for the convenience of overseas stakeholders. In the event of any discrepancy between this document and the Japanese original, the original shall prevail.
(1) The Nabtesco Way In 2012, the Nabtesco Group formulated “The Nabtesco Way,” which describes our Corporate Philosophy and Action Guidelines, and we have been working to put our Corporate Philosophy into practice while conducting activities to spread it throughout the Group. In 2023, we revised “The Nabtesco Way” with the intention of ensuring that diverse human resources around the world understand and empathize with them and act even more enthusiastically, in light of the recent changes in the external and internal environments. In new “The Nabtesco Way,” our Corporate Philosophy has been retained, while Our Promises and Action Guidelines have been revised to reorganize the principles to be passed on to the next generation, and to incorporate a new perspective that takes on challenges, and has been consolidated to the six points of “The Principles We Value.” The Company aims to deliver greater than expected satisfaction to society by grasping the needs and issues of customers and society from “See the people. See the planet.” perspective, using the spirit of “Be open, fair, and honest.”, and “enjoying the challenge” of valuing “Stay curious. Explore further.” while “Create together.” with diversity, and promoting autonomous “Improve ourselves.”
(2) Long-term Vision The Group has established a long-term vision, “Leaders in Innovation for the Future,” as a guideline for realizing the Group's growth and development toward 2030, and "Our Aim for 2030."
―15―
(Translation) This document has been translated from the Japanese original for the convenience of overseas stakeholders. In the event of any discrepancy between this document and the Japanese original, the original shall prevail.
In order to achieve our long-term vision, we have set the concept of our long-term vision up to 2030 as shown in the diagram below. Based on the “Identity of Nabtesco” accumulated so far, we aim to create new value in the market and become “leaders in innovation” one step ahead of our customers by promoting business while focusing on “technology,” “globalization,” and “contributions.”
(3) Management Materiality The Nabtesco Group has identified the material management issues to be addressed for the achievement of its long-term vision. Our management materiality comprises three pillars. By fostering financial and non-financial measures, we will create both economic, environmental and social value from a long-term perspective. We will review the issues of management materiality in response to social changes and changes in management awareness of the issues and take actions toward further strengthen our management base and pursue the enhancement of corporate value.
(4) Medium-Term Management Plan In order to tackle in management materiality, has formulated a three-year medium-term management plan, “TIME FOR Challenge,” with fiscal 2022 as its first year.
TIME FOR CHALLENGE –Change Yourself, Change the World–
―16―
(Translation) This document has been translated from the Japanese original for the convenience of overseas stakeholders. In the event of any discrepancy between this document and the Japanese original, the original shall prevail.
①
Management Targets The Nabtesco Group has set the targets for the medium-term management plan for FY2022 to FY2024 as follows. ROIC : 10% or more Dividend payout ratio: 35% or more Focus on solving ESG issues Reduction in CO₂ emissions : -25% Baseline year: fiscal 2015/aligned with the SBT 1.5-degree Celsius target
FY2022(Result)
F’2023(Result)
FY2024(Target)
ROIC
4.7%
4.0%
10% or more
Dividend payout ratio
89.9%
67.5%
35% or more
Reduction in CO₂ emissions (Scope1+2、Baseline year: fiscal 2015)
-14.2%
-20.8%
-25%
(NOTES) Figures for Fiscal Year 2023 out of the above CO2 emissions reductions are based on the totals as of the filing date.
② Medium- to Long-term Management Strategies In order to become “Leaders in Innovation for the Future,” which is the Nabtesco Group’s long-term vision for 2030, the Group will take on the following three challenges under the medium-term management plan: “Challenge of fostering reforms,” “Challenge of fostering creativity,” and “Challenge of fostering globalization.” 「Challenge of fostering reforms」 ■ Enjoy the Challenge –Change the corporate culture to embrace failure and encourage employees to take on challenges– ・“Change ourselves”: Redefine our current action guidelines. ・“Change the company”: Implement innovation systems/tools ■Innovation for “New Motion Control” –Create and provide new value through DX, electrification and systematization– ・ Create new “tangible goods” through electrification and system integration. ・ Create new “intangible things” through IoT and data solution. ・ Attain highly efficient and environmentally friendly manufacturing through automation and DX. 「Challenge of Fostering Creativity」 ■Intelligent Imagination & Execution –Create and build new business models by promoting external collaboration– ・ Promote open innovation with our core value ・ Create new businesses by utilizing CVC and M&A ・ Expand to new business areas by accelerating collaboration between each business segment 「Challenge of Fostering Globalization」 ■Global Value Network –Strengthen global management systems– ・ Enhance overseas regional headquarters (Marketing, R&D, MRO and Shared services) ・ Establish a global HR system and secure and develop local leaders ・ Strengthen marketing activity in regions where the Nabtesco Group has yet to conduct business operations ・ Rebuild global supply chain (NOTE) Forward-looking statements in this Annual Securities Report are based on information available to the Company as of the end of the fiscal year under review. Actual results may differ from these statements due to factors such as those listed in "3. Business and Other Risks."
―17―
(Translation) This document has been translated from the Japanese original for the convenience of overseas stakeholders. In the event of any discrepancy between this document and the Japanese original, the original shall prevail.
2 【Policies and Measures for Sustainability Management】 The Group identified the priority issues to be addressed for management as “ (3) Management Materiality,” which is a part of Nabtesco’s value creation path, we will bring innovation and improve economic value, environmental value and social value in the long-term, in pursuit of management that sustainably develops both society and our group. To promote value creation in the long term, we deem it important to “dynamically” change its management materiality according to changes in the business and management environments. We will regularly review our management materiality so as to respond to such changes in a nimble manner. We will steadily take action concerning each management materiality item to further enhance our management foundation. Forward-looking statements in this Annual Securities Report are based on information available to the Company as of the end of the fiscal year under review. Actual results may differ from these statements due to factors such as those listed in “3. Business and Other Risks.” (1) Response to overall sustainability ① Governance To enhance our sustainability governance, our group dissolved our previous CSR Committee in 2023 to pave the way for its existence as the newly established CEO-directed Management Materiality Committee. Its chairperson and members are chosen from directors including executive officers and heads of relevant divisions, meeting at least twice a year. The Committee oversees the progress and management of management materiality, collaborating with other CEO-directed committees “Quality and PL Committee,” “ESH Committee,” “Risk Management Committee” and “Information Security Committee,” setting targets and KPIs for management materiality items, and regularly reviewing them. The activities are deliberated and determined at the Management Committee and reported to the Board of Directors’ meeting. The Committee also regularly reviews materiality itself and reports to the Board of Directors’ meeting. The reviewed results are deliberated at the Board of Directors’ meeting and decided upon, in order to raise the effectiveness of group-wide sustainability governance. <Structure to promote sustainability governance (as of January 1, 2024)>
―18―
(Translation) This document has been translated from the Japanese original for the convenience of overseas stakeholders. In the event of any discrepancy between this document and the Japanese original, the original shall prevail.
② Strategy ■Structure of Our Management Materiality Our management materiality is comprised of three pillars. By fostering financial and non-financial measures, we will keep providing value to our stakeholders, maintaining profitable growth. For “Measures to improve our financial performance,” we will work to consistently achieve our short-term revenue targets, ensure the efficient distribution of our managerial resources, and increase our capital efficiency for the promotion of ROICoriented management. For “Measures to enhance our management foundation,” we have designated items that will greatly affect us financially as “ESG items having a major impact on financial issues.” We will implement measures intensively for these ESG items, considering how they are connected with our financial outcomes. We have also identified “ESG items that drive sustainability power” as elements that will provide the foundation for us to continue creating value. We will implement measures for these items to reduce risks posed to our business continuity. Moreover, by implementing “Specific measures to achieve the long-term vision,” we will enhance our competitiveness and thereby promote our long-term growth. We will also reduce our capital costs by implementing “Measures to improve our financial performance” and “Measures to enhance our management foundation.” ■Management Materiality Identification Process and Regular Reviewing Our group intensively discussed how to identify its material management issues within the Group and also had dialogues about its management materiality with multiple long-term investors and ESG-oriented investors. Based on the results, we worked to identify our material management issues by attributing importance to the following three points:
- Has relevance to the reason for corporate existence, our corporate philosophy and long-term vision
- Has unique features that help differentiate our company
- Ensure compatibility between higher financial corporate value and the solution of social challenges In 2021, in order to identify our material management issues, we worked to uncover and list the short-, medium- and long-term issues faced by our administrative departments, which are tasked with promoting company-wide strategies, by using a specific analysis framework and in consideration of the future outlook of the external environment and the managerial resources that support our value creation, both of which we examined in the process of formulating the longterm vision. We have also selected as ESG items those that are closely related to our business in reference to the evaluation items adopted by the ESG rating organizations and based on the framework and standards set for the disclosure of nonfinancial information. We then categorized the listed items according to their importance, time axis and financial impact. Furthermore, we conducted analyses regarding the important items related to the long-term opportunities and risks posed to each of our businesses from the aspects of the sustainability of the business model and ESG. Finally, we reorganized all the key items into our management materiality.
―19―
(Translation) This document has been translated from the Japanese original for the convenience of overseas stakeholders. In the event of any discrepancy between this document and the Japanese original, the original shall prevail.
<Identification process of management materiality in FY2021>
(NOTES) 1 As of the date of submission, the Management Materiality Committee has replaced the CSR Committee. 2 Standards and others that we referred to:(*) ・International Integrated Reporting Council (IIRC): International Integrated Reporting Framework ・Sustainability Accounting Standards Board (SASB): SASB Standards ・Global Reporting Initiative (GRI): GRI Standards ・ISO 26000 (Guidelines on organizational corporate responsibility) ・Ministry of Economy, Trade and Industry: Guidance for Integrated Corporate Disclosure and Company-Investor Dialogues for Collaborative Value Creation
―20―
(Translation) This document has been translated from the Japanese original for the convenience of overseas stakeholders. In the event of any discrepancy between this document and the Japanese original, the original shall prevail.
We regularly review the identified management materiality in order to flexibly respond to change of business and management environments. In 2022, in order to redefine human capital as a primary source of value creation and implement integrated measures based on the new definition, we revised the human capital-related item to “Enhance human capital management” and also reviewed the actions to be taken for each related item. The results have already been approved by the Management Committee after deliberation by the CSR Committee and have also been reported to the Board of Directors. In 2023, the Management Materiality Committee reviewed progress and set action plans. The review deemed it unnecessary to change the management materiality in 2023, which was approved after deliberation at the Management Committee and Board of Directors’ meeting.
―21―
(Translation) This document has been translated from the Japanese original for the convenience of overseas stakeholders. In the event of any discrepancy between this document and the Japanese original, the original shall prevail.
③ Risk Management ■Basic Approach to Risk Management With the aim of maintaining and enhancing corporate value, the Group manages risk by appropriately identifying various risks associated with our business activities and mitigating the damages and losses through appropriate crisis management if any risks materialize.
- We manage risk while paying attention to trends in financial conditions and business environments.
- We manage risk in accordance with the relevant laws and regulations and from the perspective of Nabtesco Group’s social responsibilities, while also striving to disclose information promptly to minimize the impact and losses attributable to incidents that have occurred.
- We validate concrete risk management processes after the occurrence of incidents and strive to prevent their recurrence. ■Risk Management Basic Policy We have systems in place to ensure that profits, losses, asset efficiency, quality and disasters, among other matters, are reported to the Board of Directors properly and in a timely manner with respect to the execution of duties. By leveraging these systems, we strive for the early identification of risks and the minimization of losses. With an eye on the sustainable enhancement of corporate value, we established the Risk Management Committee as an organization under the direct supervision of the CEO that is responsible mainly for deliberating important matters. The committee members are appointed by the CEO. In addition, the Chairperson of the Risk Management Committee (Managing Executive Officer) consults and coordinates with the members of the Management Materiality Committee, Quality & PL Committee and Environment, and Safety and Health Committee, as required, and provides reports at management meetings such as Executive Officers Committee attended by CEO and Board of Directors meetings regarding the risk management initiatives periodically (approximately twice a year). ■Risk Management Methods ・Risk Management The Risk Management Committee has been identifying serious risks related to the entire company based on the results of risk assessments made by the administrative departments, in-house companies and Group companies, discussing countermeasures for these risks, and also following up on the progress made for the implementation of the countermeasures. We also analyze the factors that have caused the risk to materialize in the past. Then we prioritize the risks to be addressed and check our tolerance for the risks, make plans to deal with them, discuss the plans, and implement them. Furthermore, specialized staff at head office departments, such as the internal control department, carry out audits on the operational risk management situation of our workplaces, give necessary and appropriate expert advice for operational improvements, and report the details to the Board of Directors to ensure the appropriate monitoring of the responses made to risks at each of the workplaces. To deal with risks, Nabtesco implements the following procedures: (1) risk analysis, (2) risk assessment, and (3) risk judgment. In risk analysis, we analyze the materiality of each risk based on its occurrence frequency (by five-grade evaluation) and level of impact (by four-grade evaluation). Based on the results gained from the risk analysis, we give the risk an overall score (by four-grade evaluation) and then specify the level of necessary countermeasures for the risk (also by four-grade evaluation)
Internal Audit
―22―
(Translation) This document has been translated from the Japanese original for the convenience of overseas stakeholders. In the event of any discrepancy between this document and the Japanese original, the original shall prevail.
■Serious Risks and Countermeasures Every year, the Company assess the risks faced by the entire Group in Japan and in other countries to identify serious risks. Then, for the identified serious risks, each department in charge of risk formulates and implements countermeasures based on their expertise. The following are some of the serious risks that have been identified and the measures taken to address them. ※Other serious risks are described on “3. Business Risks.” Serious risk
Risk priority
Overseas Geopolitical business risks development
★
・Delay or suspension of procurement, business and service activities
・Collection of information in the local area Medium of suppliers ・Distribution to high ・Enhancement of the effectiveness of BCP
★
・Increase in costs caused by carbon tax regulations, etc. ・Physical damage caused by torrential rains, etc. ・Increasing customer requests for the reduction of GHG emissions
・Set long-term goals for SBT certification ・Utilize renewable energy Low to ・Implement environmental education medium ・Awareness raising activities regarding climate change risks for suppliers
Environment
Climate change
Effects on the Group
Risk tolerance
・Suspension of business and service activities Occupational Work-related health and accident safety risk
Product quality
Quality risk
★★
★★
・Increase in costs due to loss and damage compensation, etc. ・Lower brand value
Measures
Low
・We have established a safety and health management framework in each office and allocated a manager of safety and health as well as a person in charge of safety management ・Periodic health examinations are conducted twice a year ・Industrial doctors visit the workplace
Low
・Establish management rules ・Obtain quality management system certification at production sites ・Implement training
■Emerging Risks For “emerging risks” caused by changes in the external environment and other factors, we conduct regular reviews to check and manage their impact on our business. Serious risk The functional failure or Procurement degradation of suppliers due to disaster Information security
Information security breach
Risk priority
★★★
★★★
Effects on the Group ・Suspension of products and services due to difficult or defective procurement
・Suspension of business activities and services
Risk tolerance
Measures ・Local support for affected suppliers ・BCP training for suppliers
Low
Low
・Establish management rules ・Implement information security training ・Establish and operate an information security system
※Risk priority: Risks are prioritized based on the following criteria. ★★★:Measures need to be implemented promptly. ★★ :Measures need to be implemented as appropriate. :Measures need to be implemented on a continual basis. ★ ※Risk tolerance: The identified risks are categorized into the following risk tolerance levels. Low: Should not be tolerated. Medium: Should be tolerated as necessary, in consideration of the benefits and merits. High: Should be tolerated proactively for the creation of opportunities, while implementing countermeasures as necessary.
―23―
(Translation) This document has been translated from the Japanese original for the convenience of overseas stakeholders. In the event of any discrepancy between this document and the Japanese original, the original shall prevail.
④ Indicators and Targets The targets, indicators, key activity results and plans for respective issues concerning “Enhancing our management foundation” with relation to the management materiality are shown below. <Targets, indicators, key activity results and plans concerning sustainability> ■ESG items having a major impact on financial issues Measures to Enhance Our Management Foundation ESG Cate gory
Management Materiality items
Environment (E)
Desirable Direction/Major Actions ・Achieve medium-to long-term CO2 emissions reduction Countermeas targets ures for Climate Change
Targets for FY2023 (Extracts)
Achievements in FY2023 (Extracts)
Important targets for FY2024.
Society (S) Governance (G)
・Foster information disclosure in ・Fostered information disclosure ・Reduce CO 2 emissions by 25% line with the TCFD in line with theTCFD (disclosed relative to 2015 in line with the financial impact) MTMP target ・Reduce CO2 emissions by 18.9%relative to 2015 in line with ・Reduced CO2 emissions by ・Launch environment-friendly the MTMP target 20.8% relative to 2015 in line leading-edge plants (the with the MTMP target Hamamatsu and Tarui Plants) ・Build a system to procure renewable energy (CO2-free ・Implemented the procurement of electricity) at bases outside Japan environmental value certificates at bases outside Japan ・Promote environment- ・Foster the use of the ・Establishment of the Innovation ・Foster the use of the and safety- conscious intrapreneurship program and the Strategy Division intrapreneurship program (Phase Deliver design and development in-house company innovation II) and the in-house company ・Selected intrapreneurship ideas Solutions for innovation system system and launched venture units ・Create new businesses Social and products that ・Acquired Deep Sea Technologies ・Promote the intrapreneurship Challenges contribute to the social activities of the venture units ・Agreed to collaborate with the Through challenges Boeing Company for ・Create new businesses and Business decarbonization products that contribute to the social challenges ・Deal with supply risks ・Promote sustainability audits ・Conducted sustainability audits ・Promote sustainability audits posed by suppliers of a cumulative total of 84 ・Foster sustainability awareness・Foster sustainability awarenessraising activities companies to identify ESG risks raising activities ・Help suppliers solve faced by suppliers, propose ESG issues Build a ・Support the acquisition of ・Support the acquisition of remedial measures, and promote Resilient resilience certification resilience certification ・Support suppliers in corrective actions. Supply Chain BCP ・Supported a total of 44 companies in the acquisition of resilience certification ・Build a diversity-based ・Increase the management ・Promoted the empowerment of ・Increase the management management system efficiency of the Board of the executive team and fostered efficiency of the Board of the deliberation of important Directors ・Enhance discussions on Directors medium- to long-term ・Foster the deliberation of issues (global strategies, business ・Foster the deliberation of strategies at Board of important issues(global important issues (global Increase the portfolio, human resource strategies, human resource strategies, climate change-related strategies, technological Effectiveness Directors’ meetings. strategies, sustainability strategies and others) of Our strategies and others) governance and others) Management ・Reorganized the committees under the direct control of the Entities CEO and established the Management Materiality Committee and Information Security Committee
(NOTES) Figures for Fiscal Year 2023 out of the above CO2 emissions reductions are based on the totals as of the filing date.
―24―
(Translation) This document has been translated from the Japanese original for the convenience of overseas stakeholders. In the event of any discrepancy between this document and the Japanese original, the original shall prevail.
■ESG items that drive sustainability power Measures to Enhance Our Management Foundation ESG Cate gory
Management Materiality items
Environment(E) Society(S) Governance(G)
Desirable Achievements in Direction/Major Targets for FY2023(Extracts) Important targets for FY2024 FY2023(Extracts) Actions ・Efficient use of raw ・Spread Environmental ・Promoted the revised ・Waste/ Water/ Chemical materials and waste Philosophy and Environmental Environmental Philosophy and substance management: Lowered reduction Action Guidelines internally the Environmental Action than the previous year per sales Foster Guidelines between Group unit ・Conserve biodiversity ・Waste management / Environmenta members inside and outside conservation of water resources ・Extend the impact assessment l Management Japan and biodiversity survey for biodiversity to the ・Conducted an impact assessment value chain survey for biodiversity ・Advance quality and ・Product safety targets ・Product safety-related targets ・Achieve the product safetysafety management -Targeted rate for the
- Targeted rate for the related targets achievement of the plans to achievement of the plans to ・Promote functional safety conduct safety reviews :Result conduct product safety reviews: measures 100% Result 100% -Targeted rate for the
- Targeted rate for the achievement of the plans to achievement of the plans to Pursue Safety, educate employees for product educate employees for product Comfort and safety: Result 100% safety: Result 100% a Sense of Security ・Workplace safety targets ・Implemented the Safety Model ・Establish and put into practice Workplace Improvement the Group-wide safety standards Program (at 9 sites in Japan and ・Implement the Safety Model 5 sites outside Japan) Workplace Improvement ・Fostered habits to prevent unsafe Program (at 8 sites in Japan and 5 sites outside Japan) behavior (promoted safety regulations, for example) ・Shift to business ・Foster the project to reform the ・Launched a project to revise the ・Revise the personnel system for focused management personnel system personnel system for managers general employees, and put the of human resources personnel system for managers ・Enhance the disclosure of ・Established diversity of hiring into practice and get it wellinformation about human capital methods and implemented ・Promote diversity & established management measures for the mobilization of inclusion/ Advance the human resources management of human ・Revise The Nabtesco Way ・Enhance the implementation of rights measures, monitoring of KPIs ・Advance health management ・Disclosed stories about human Enhance and indicators, and disclosure of capital management and ・Improve employee Human information about human capital established KPI and engagement Capital implementation strategies ・Implement activities to promote Management The Nabtesco Way ・Revised The Nabtesco Way ・Certified as a Health & ・Set and work to achieve Productivity Management priorities for health management Outstanding Organization ・Introduce “one-on-one” meetings across the entire Group and make ・Partially introduced “one-onone” meetings use of the talent management system Promote ・Promote community ・Promote community investment ・Promoted community investment ・Promote community investment Engagement investment in the areas of the environment, in the areas of the environment, in the areas of the environment, with Local education and welfare education and welfare education and welfare Community ・Enhance corporate ・Globally implement measures to ・Evaluated the current state of the ・Revise the system for regulation governance ensure compliance with antisystem for regulation of of responsibilities and authority monopoly laws and prevent responsibilities and authority to speed up decision-making ・Ensure risk corruption management and ・Informed Group sites in all parts ・Provide education to ensure compliance of the world of the revisions compliance with anti-monopoly Ensure ・Hold the IR DAY event made to the Nabtesco Group laws in Europe and appropriately Management ・Proactively engage in Code of Ethics and implemented respond to the EU directive on Transparency dialogue with stakeholders activities to prevent corruption in the protection of whistle-blowers high-risk regions ・Enhance the disclosure of nonfinancial information ・Reviewed the management materiality
―25―
(Translation) This document has been translated from the Japanese original for the convenience of overseas stakeholders. In the event of any discrepancy between this document and the Japanese original, the original shall prevail.
(2) Disclosure in line with the recommendations made by the Task Force on Climate-related Financial Disclosures (TCFD) The Group expressed its support for the recommendations made by the Task Force on Climate-related Financial Disclosures (TCFD). Accordingly, we are fostering the disclosure of related information in line with the TCFD’s recommendations, including that about the progress made with our climate change-related measurers. ① Governance Nabtesco Corporation's Board of Directors determines and supervises our strategies, basic policies, and the execution of important operations by sharing information through reports on important issues. Regarding climate change, the director in charge of production innovation serves as supervisor and the director in charge of environmental security reports on the progress toward the CO2 emission reduction goal and the status of major environmental facility investments. Under the guidance and supervision by the Board of Directors, the President and CEO (hereinafter, "CEO") establishes Nabtesco Group’s environmental philosophy, environmental action guidelines, and long-term goals. At the Executive Officers Committee (composed of the CEO and executive officers), the director in charge of environmental security reports the status of CO2 emissions at internal companies and main group companies. If there is a gap between the current status and the goal, we identify the causes and take measures accordingly. If any item under discussion or report is deemed to affect our business, the CEO determines appropriate measures and reflects them in our business strategies. As a promoting organization under the direct control of the CEO that is involved in Environment, Safety, and Health (ESH) management, Nabtesco has established the ESH Committee with jurisdiction over the entire Nabtesco Group. The CEO appoints the chairperson and members of the ESH Committee from our officers, including members of the Board of Directors. The chairperson of the ESH Committee collects important information on the environment, safety, and health, including climate change-related risks and opportunities, from our companies and group companies. The chairperson also visits each site to carry out ESH audits and company-wide energy conservation meetings, etc. The ESH Committee uses the results of this monitoring to evaluate importance and deliberate measures for any issues deemed to be important
② Strategies In order to identify and manage the possible impact of climate change on our business activities, we are analyzing the risks and opportunities across the entire supply chain, including our business partners and customers, using multiple scenarios developed by external parties about temperature rises, including the “below 2 degrees Celsius” scenario. When the result of the audits by the ESH Committee shows that any issues (risks or opportunities) associated with climate change have an important effect on our business, they are reflected to our business strategies by the determination of the CEO. In the future, the following risks are anticipated depending on requests from the market or customers: increase of carbon prices, increase of operating costs due to the purchase of electricity from renewable sources, increase of capital expenditures for the introduction of power generation equipment, etc. using renewable resources and the increase of R&D costs for energysaving product development. There are also physical risks such as business interruption due to damaged infrastructure or unstable electric power supply caused by wind or water disaster. On the other hand, the following opportunities are also expected: new business opportunities from the establishment of new laws and regulations (e.g. the energy-efficiency labeling system becoming obligatory) and the expansion of opportunities for the Maintenance, Repair, Overhaul (MRO) business, etc. due to a change in consumers' preferences for longer product lives to reduce CO2 emissions as their awareness of climate change increases. Going forward, Nabtesco Corporation will continue to strive to identify risks and opportunities associated with the environment and make efforts to take measures to address the risks and realize the opportunities, including the further promotion of energy conservation activities. ③ Risk Management The ESH Committee collects important information related to risks and opportunities associated with climate change from the companies and group companies and evaluates whether or not they have a significant impact on our business activities and discusses measures for issues that are determined to be important. They evaluate and prioritize possible amount of financial impact and probability or feasibility. The ESH Committee draws up and discusses the measures to address highly probable risks on a preferential basis, regardless of their impact. In addition to climate change, the ESH Committee evaluates waste, chemical substances, and employees' safety and health.
―26―
(Translation) This document has been translated from the Japanese original for the convenience of overseas stakeholders. In the event of any discrepancy between this document and the Japanese original, the original shall prevail. <Measures taken in line with the TCFD’s recommendations: Results of risk assessment (Scenario we referred to: IEA450/RCP2.6/RCP8.5)>
■Transition risk Typ e
Climate
▲:Risks ●:Opportunities
Impact
Business risk/Opportunity
change related assessm risk item Higher carbon tax rate
ent
Measures taken by Nabtesco (Medium-term)
(Short-term)
(Medium- to long-term)
Large
(Long-term)
▲Increase in energy & procurement costs
・Promote the use of renewable energy
●Differentiation by low-carbon products
• Introduce carbon pricing
●Better evaluation due to appropriate information
• Promote efficient replacement with substitute materials
disclosure
• Operate the energy-saving product Regulation Regulatory
(energy conservation
▲Increase in development cost to deal
▲Increase in energy
▲Decrease in demand for old models
with regulations
conservation cost Large ●Larger sales of
&
products with higher
low carbon)
fuel efficiency
due to new regulations
(Example: TRS segments and Others)
(Example: TRS segment)
●Increase in demand for products that
●Increase in demand for more
comply with the regulations
efficient new models
(Example: TRS segments and Others)
(Example: TRS segment)
certification system • Follow the guidelines on capital investment and energy conservation • Expand the lineup of products with higher fuel efficiency • Develop products for which new types of fuels can be used ・Invest in the development of technologies
Policies
▲Increase in cost to deal with
Large
and products
laws and regulations
• Strategically disclose climate change-related information
Technology
Replacement with lowcarbon
▲Increase in cost to acquire new element technology
Medium
▲Increase in cost due to the
●Entry into a new market by the development
diversification of needs
of new element technology
products
products and form partnerships with other companies in line with the regulatory and development trends • Develop new mobility products
▲Lagging behind competitors
Changes in consumption
•Make technological investments, develop
in development activities
Large
●Higher competitiveness based on technologies
●Need for electrification
behavior
superior to those of competitors
(Example: CMP segment)
Market
▲Increase in cost due to increased need to reduce Market uncertainties
▲Increase in the operational cost due to RE100
CO2 emissions
measures
●Increase in demand due to
Large
●Better evaluation due to appropriate
modal shift and
・Promote the use of renewable energy
information disclosure
electrification (Example: TRS segment) Reputation
Criticism against
Medium
the industry
▲Negative reputation due to a delay in environmental measures
・Promote the use of renewable energy
●Increase in sales of environmentally friendly products
• Strategically disclose climate change-related
●Better brand image due to the implementation of environmental measures
information
■Physical risk Typ e
Climate
▲:Risks ●:Opportunities Impact
Business risk/Opportunity
change related assessm risk item
ent
Frequent occurrence of Acute
drought events
(Medium-term)
(Medium- to long-term)
▲Damage to infrastructure, suspension of operations
・Foster BCP
wind turbines)
system
▲Damage to infrastructure, suspension of operations Large ●Increase in need to establish water resource infrastructure (Example: CMP segment) ●Increase in demand for construction machinery for reconstruction activities (Example: CMP segment)
• Optimize the on-site assignment of employees • Use weather forecast services and take
emergency measures ▲Suspension of operations due to floods ●Increase in the need to ・Examine measures against storms and floods establish water resource with suppliers infrastructure (Example: • Increase resilience of the electricity system CMP segment) ▲Increase in air-conditioning • Review the location of bases and capital investment costs • Reuse water and review the water circulation ▲Increase in electricity costs system due to lower power • Use weather forecast services and take generation efficiency emergency measures ●Increase in the need for higher efficiency at plants (Example: CMP segment)
Large
patterns Chronic
Rise in average
• Procure components from multiple suppliers • Increase the resilience of the electricity
Changes in precipitation
(Long-term)
Large ●Increase in need to increase the resilience of power infrastructure (Example: CMFS equipment for
typhoons Heavy rain/
Measures taken by Nabtesco (Short-term)
Large
temperatures
(NOTE) As for impact, we classified the size into “Large,” “Medium” and “Small” based on the frequency of occurrence and financial impact. Frequency of occurrence: Occurs frequently/Has occurred/May occur/May not occur/Will never occur Financial impact: Serious (¥5 billion or more)/Large (¥2.5 billion to ¥5 billion)/Medium (¥500 million to ¥2.5 billion)/Minor (¥100 million to ¥500 million)/Very minor (Less than ¥100 million)
―27―
(Translation) This document has been translated from the Japanese original for the convenience of overseas stakeholders. In the event of any discrepancy between this document and the Japanese original, the original shall prevail.
④ Indicators and Goals The Nabtesco Group are aiming to reduce CO2 global emissions from the entire Nabtesco Group by 63% as of FY2030 and by 100% as of FY2050 compared to FY2015 levels. This target has been approved by the SBT Initiative. By Fiscal Year 2023, we achieved a cumulative reduction of 21%, and the Group are steadily reducing emissions at a pace in line with our target. In addition, the group are expanding activities from the company alone to our suppliers as well. Of the greenhouse gas emissions from the entire supply chain, the percentage of emissions from purchased goods and services (category 1 of Scope 3 emissions) is high, making it essential for our suppliers to take initiatives to reduce their greenhouse gas emissions. In response, we conduct a survey of our main suppliers (the top suppliers constituting 70% of annual purchases) to see if they have set voluntary targets to reduce their greenhouse gas emissions. As of FY2022, 72% of our main suppliers have set voluntary targets to reduce their greenhouse gas emissions and begun to take initiatives to achieve these targets. We will provide support so that all of our main suppliers set voluntary reduction targets by 2025. <Long-term emissions reduction targets (aligned with the 1.5 degrees Celsius scenario/Scope1+2)> FY2015 (Baseline year)
FY2030 (Down 63%)
FY2050 (Down 100%)
54,803
20,277
0
Global emissions (t-CO₂) <CO2 Emission Reduction Result CO2 (t-CO₂)> FY2019
FY2020
FY2021
FY2022
FY2023
Direct emissions (Scope 1)
6,599
4,491
4,061
3,893
4,930
Indirect emissions through the use of electricity and others (Scope 2)
53,874
48,073
41,021
43,140
38,499
(NOTES)1 Figures for FY2023 out of the above emissions are current totals as of the filling date, and figures obtained from thirdparty guarantees will be disclosed on our website. 2 The calculation scope includes Nabtesco Corporation, and major Japanese and overseas consolidated subsidiaries. 3 The calculation policy and standards comply with the Act on the Regional Use of Energy and the Act on the Promotion of Global Warming Countermeasures, and are aligned with the internal Guidelines on the Management of Environmental Information.
<Emissions from the supply chain (Scope 3) FY2022 Category
(NOTE)1, 2>
Emissions (t-CO2)
Rate (%)
1
Purchased goods and services
773,875
82.77%
2
Capital goods
35,801
3.83%
Remarks
Fuel- and energy-related activities Upstream transportation and distribution Waste generated in operations
6,354
0.68%
96,248
10.29%
909
0.10%
6
Business travel
2,063
0.22%
7
Employee commuting
1,589
0.17%
8
Upstream leased assets
-
-
9
Downstream transportation and distribution
-
-
10
Processing of sold products
-
-
11
Use of sold products
17,221
1.84%
12
End-of life treatment of sold products
908
0.10%
13
Downstream leased assets
-
-
N/A (No corresponding leased assets)
14
Franchises
-
-
N/A (No corresponding franchises)
15
Investments
-
-
N/A (No corresponding investments)
934,968
100%
3 4 5
Total
N/A (No corresponding leased assets) N/A (Completed products transported on consignment are included in Category 4) N/A (Nabtesco products are completed products and not processed after being sold)
(NOTES) 1 As the results for FY2023 are being compiled, information on the results for FY2022 is presented. 2 The Scope 3 calculations for FY2022 were made by the following method and for the following period and scope. :Calculation method: As shown in the basic guidelines on the calculation of greenhouse gas emissions from supply chains set by the Ministry of the Environment and the Ministry of Economy, Trade and Industry :Targeted period: January 1 to December 31, 2022
―28―
(Translation) This document has been translated from the Japanese original for the convenience of overseas stakeholders. In the event of any discrepancy between this document and the Japanese original, the original shall prevail.
(3) Enhance Human Capital Management Under the slogan, “Leaders in Innovation,” as upheld in its long-term vision, the Nabtesco group has been striving to increase its corporate value, with a focus on meeting customer needs and exceeding the expectations of both customers and society alike. This effort carries on a long tradition dating back not only to the Company’s founding but also to the aims of its two predecessor companies prior to their integration. Toward this goal, we are striving to enhance both our financial impact and social impact by boosting our performance and contributing to the solution of social challenges. To this end, we need to enhance our existing businesses while also searching for new businesses, as proposed in the theory of organizational ambidexterity. To meet this requirement, we must foster reforms for the various categories of capital that provide us with a foundation for innovation. In particular, human capital is essential for our value creation process, and the group accordingly aims to manage and optimize its human capital toward becoming “Leaders in Innovation.” In order to “meet” the expectations of customers, we need personnel who are strongly committed to meeting the needs of customers through unyielding technological innovation, performance & quality improvement and higher productivity. To take the next step of then exceeding the expectations of customers and society, we need to develop and attract personnel who can expand our existing business domains and launch new businesses to create and propose expectation-exceeding value. As an organization, we also need to gain the ability to respond agilely to changes in our business environment. To this end, managers are required to play important roles to encourage individual employees to take actions autonomously and independently and to serve as an intermediary to foster not only traditional top-down measures taken under the leadership of top management but also bottom-up measures taken at the initiative of general employees. Our group’s human capital management is thus based on measures promoted by the three actors: top management, middle managers, and individual employees. The group will proactively make investments to support these three actors in fulfilling their respective roles and will strongly repeat the cycle of meeting and exceeding the expectations of customers and society toward the achievement of its long-term vision.
―29―
(Translation) This document has been translated from the Japanese original for the convenience of overseas stakeholders. In the event of any discrepancy between this document and the Japanese original, the original shall prevail.
①
Vision for Human Capital Management The group believes that the creation of new value will be promoted by the fulfillment of defined roles by the company & top management, organizations & managers, and individual employees. Based on this recognition, we have set a vision for each of the above for the optimization of human capital. The role of the company & top management is to create a situation & environment that allows for Action. The role of organizations & managers is to inspire individuals to find seeds for Action. The role of individual employees is to sprout those seeds for “Innovation in Action.” The group upholds this vision for its human capital management.
―30―
(Translation) This document has been translated from the Japanese original for the convenience of overseas stakeholders. In the event of any discrepancy between this document and the Japanese original, the original shall prevail.
②
Gaps between Reality and Vision: Identification of Issues The group regularly conducts an employee engagement & organizational diagnosis survey to grasp employees’ subjective ideas based on their engagement scores (ES) and clarify the present situation from the viewpoint of individuals and organizational culture. When designing the questionnaire for organizational diagnosis, we first set “innovation items” that are thought to be highly related to challenges, co-creation, learning and creativity—elements that help foster innovation. We then classified the questions into those related to individuals (individuals’ indicators) and those related to the organization (organizational indicators). For these two types of indicators, we analyzed the survey results with a focus on correlations between the sufficiency rating given to each of the question items, including both innovation items and others, and the item’s connection to innovation. The graph shown below indicates the level of each item’s connection to innovation (horizontal axis) and its sufficiency rating (vertical axis).The items shown on the lower right side of the two graphs are items that are strongly connected to innovation but for which the sufficiency rating is low. As for individuals, the survey results imply that a driving force for innovation would be individual employees feeling satisfied with their jobs and able to feel a sense of achievement and selfgrowth. For the organizational indicators set for the company & top management and for organizations & managers, the key items are “Outlook for the achievement of targets,” “Identification of social changes by the company ahead of others” and “Creation of a culture of embracing challenges” for the former and are “Solution of issues across the departments” and “Development of the next generation of leaders” for the latter. Based on the survey results, we have formulated the following hypothesis: To become “Leaders in Innovation,” it is essential for Nabtesco to focus more on these key items.
―31―
(Translation) This document has been translated from the Japanese original for the convenience of overseas stakeholders. In the event of any discrepancy between this document and the Japanese original, the original shall prevail.
③
Indicators and Goals In order to narrow the gap as described on the previous page, we have set indexes for innovation, linkage and engagement as indicators to realize the vision set for each of the three actors. These three indicators are set based on the results of the organizational diagnosis and the engagement scores, and we aim to increase the score of each indicator to 75 points. We have also set factor-based indicators that are linked with the progress of individual actions to be taken to increase the scores. The innovation index is an indicator intended for the creation of the situation & environment that allows for Action. We will further instill The Nabtesco Way across the board and enhance our human resources portfolio to encourage both organizations and individuals to take actions toward their shared goal for innovation. The linkage index is an indicator designed to enhance support for individual employees through the establishment and improvement of the personnel assignment, education and evaluation systems and new business creation systems toward encouraging employees to take actions to “meet” and “exceed” our customers’ expectations, being inspired to find seeds for Action. The engagement index is an indicator intended to encourage individuals to sprout seeds for “My Innovation in Action” by implementing The Nabtesco Way with ownership, developing their careers in an autonomous manner, and by fostering reskilling to develop an innovation mindset. We will sophisticate our human capital management by adjusting the KPIs on human capital in line with changes in related issues, while monitoring progress made with the implementation strategies and for each of the indicators.
<Key performance indicators (KPIs) for human capital> Results-based indicator Important implementation strategy (NOTES)
Factor-based indicator
Company & top management Organizations & managers
Activity to increase employees’ awareness of The Nabtesco Way
Degree of penetration and assimilation of The Nabtesco Way
Activity to give commendations for innovation
Number of Nabtesco award recipients and total amount of monetary prizes
Enhancement of the human resources portfolio
Fill rate for employment of digital experts, female employees and nonJapanese personnel
Development of successors for each general manager position
Succession fill rate
Increased mobility of personnel within the Company
Numbers of people assigned to new businesses and those transferred across departments, and number of job rotations per person
Initiatives to “exceed” expectations: Creation of ideas and knowledge
Number of new innovation theme launches point
Initiatives to “meet” expectations: Higher productivity Support for diverse people to thrive Communication measures to promote innovation and the embracing of challenges Promotion of the process to implement The Nabtesco Way with ownership
Individuals
Promotion of measures for autonomous career development
Attendance at training seminars for skill enhancement
(NOTES) As the results for FY2023 are being compiled, information on the results for FY2022 is presented.
―32―
Total number of working hours saved through higher operational efficiency, and labor productivity indicator (Value added per person and per labor hour) Fill rate for digital experts and hiring rate for female new graduates and nonJapanese people Innovation target setting rate Results of one on one meeting and feedback interviews Declaration on “My Innovation in Action,” and frequency of one-on-one meetings Results related to second jobs, overseas studies and in-house job solicitation as well as to trainees dispatched overseas
Total number of hours spent in training, the cost of training and the number of trainees
(Translation) This document has been translated from the Japanese original for the convenience of overseas stakeholders. In the event of any discrepancy between this document and the Japanese original, the original shall prevail.
(4) Intellectual Property Management Strategies to Lead Sustainable Innovation Creation The Nabtesco Group has positioned its intellectual property as a core value generating competitiveness in the pursuit of sustainable growth and expansion in business for all of its stakeholders, including customers and partner companies. It seeks to bolster corporate value by developing its Intellectual Property Management Strategy, which focuses on protecting and enhancing competitive advantages, across the Group. Nabtesco’s Core Competence entails not only so-called core competence (core strengths) but also the technologies, etc. necessary to provide value to customers, even those owned by competitors. Since we cannot provide value to customers with core competence alone, we refer to a broader scope which includes intellectual properties and intangible assets that cover not only intellectual property rights such as patents, but also know-how, transaction records, and supply chains. We also determine the core competence we currently hold (current core competence) and the core competence we will need in the future (future core competence) for each business. In addition, current and future core competences are visualized and shared in a company-wide perspective (functions and objectives). <Nabtesco‘s Core Competence>
―33―
(Translation) This document has been translated from the Japanese original for the convenience of overseas stakeholders. In the event of any discrepancy between this document and the Japanese original, the original shall prevail.
①
Governance We have the Group Intellectual Property Strategy Committee comprising Nabtesco’s CEO and executives, which meets once a year to discuss and deliberate on the basic policies for group wide intellectual property strategies. In line with the policies set by the Committee, the Company Intellectual Property Strategy Committee, which is established by each of the in-house companies and Group companies, meets twice a year to discuss and deliberate on the company’s own intellectual property strategies. This Committee is composed of the in-house/Group company’s executives, including the in-house company president, who serves as chairperson of the Committee. Moreover, we have the Nabtesco Intellectual Property Strategy Subcommittee, which meets also twice a year to share information about the activities of the Company Intellectual Property Strategy Committees and intellectual property related issues faced commonly by the in-house and Group companies. This Subcommittee is composed of the heads of the administrative departments and representatives of the in-house and Group companies and is chaired by the head of the Technology and R&D Division. What the Subcommittee discussed at its meetings is reported to the Group Intellectual Property Strategy Committee in the form of a proposal about the strategies to be deliberated by the Committee, and the deliberation results are referred to when the Committee sets the basic policies on group wide intellectual property strategies for the next year. As described above, the activities of the Group Intellectual Property Strategy Committee, the Company Intellectual Strategy Committees and the Nabtesco Intellectual Property Strategy Subcommittee are organically linked for the spiral development of their activities. Moreover, since 2022, the basic policies on group wide intellectual property strategies have been annually reported to and checked by the Board of Directors. As for the intellectual property strategies for individual businesses, reports are made to and the details are checked by the Board of Directors as necessary.
―34―
(Translation) This document has been translated from the Japanese original for the convenience of overseas stakeholders. In the event of any discrepancy between this document and the Japanese original, the original shall prevail.
② Strategies ■Creation of New Businesses through IP Landscape Analysis The Nabtesco Group is working to enhance its core value and acquire new value by searching for new market/customer needs by the effective use of IP landscape analysis. Regarding the equipment and systems for which the Group’s products and services are adopted, we globally collect information available in the public domain, including patent and other intellectual property information, as well as information available from papers, magazines and other companies, in order to conduct macro analyses of the related technologies, market trends and customer needs. Based on the analysis results, we search for new business themes and new market/customer needs, verify our development themes, and also search for open innovation partners in our effort to set our future business policies and promote discussion across internal organizations, such as in-house companies, about collaboration with other companies. ■Management of Core Technological Information and Strategy to Acquire Intellectual Property Rights The Nabtesco Group’s competitive advantages, which provide us with core value (intellectual properties and intangible assets), include not only invention but also deep relationships of trust with customers, successful branding in the market, ideas for products and services, design and manufacturing know-how, its supply chain and human resources. For the core value that we can keep confidential, we impose strict management controls to protect them as confidential technological information, while for technologies that we cannot keep confidential because we sell them, we protect them based on our strategy to acquire intellectual property rights proactively. We will protect our existing and future intellectual properties as our core value through the management of core technological information and the strategy to acquire intellectual property rights, thereby continuing to enhance the Nabtesco Group’s core competency regarding intellectual property, in turn, increasing our corporate value.
―35―
(Translation) This document has been translated from the Japanese original for the convenience of overseas stakeholders. In the event of any discrepancy between this document and the Japanese original, the original shall prevail.
③ Risk Management ■Confidential Information Management and Strategy to Acquire Intellectual Property Rights The Nabtesco Group identifies its core value as a source of competitiveness. The Group’s core value includes the unwavering trust of customers, brand perception established in the marketplace and technological as well as design/manufacturing ideas and know-how related to products and services provided. These core value elements, including a number of patents, designs, trademarks and marketing intelligence, are protected by safeguards for intellectual assets. As for created core competence (intellectual properties and intangible assets), we impose strict management controls to protect it as core technological information (confidential information) in principle. As part of our efforts to manage core technological information, we provide information management education to all officers and employees (including temporary staff) every year and ensure to collect evidences that can be valid in trials in Japan and overseas. In addition, we endeavor to maintain the management system in collaboration with the Business Auditing Department. Meanwhile, for technological core competence that cannot be kept confidential because we disclose it in our business activities such as product sales, we protect it based on our strategy to acquire intellectual property rights by building an intellectual property network. As of the end of 2023, we have built the intellectual property network comprising a number of patents, utility models, and designs (including those under application) (more than 2,350 cases in Japan, more than 1,650 cases in Asia, more than 1,250 cases in Europe, and more than 450 cases in the Americas). We will protect our current core competence as well as our future core competence which is yet to be created through the management of core technological information and the strategy to acquire intellectual property rights, thereby continuing to enhance the Nabtesco group’s comprehensive ability regarding intellectual properties and intangible assets and increase our corporate value.
■Execution of Intellectual Property Clearance Since Nabtesco Group considers protecting customer’s business and products as an essential factor, Group conducts intellectual property clearance as a part of the commercialization process, making it essential to protect customers’ businesses and products. More specifically, it undertakes activities during the commercialization process, including those related to core technology information management, the acquisition of intellectual property rights, protection against the infringement of intellectual property right by other companies, compliance with technological agreements, anticounterfeiting, and the protection of trademarks or copyrights. We have conducted intellectual property clearance for more than 130 products and services since 2018. ■Elimination of Counterfeits In order to ensure that customers who trust Nabtesco’s brand and purchase its products do not suffer any damage, the Nabtesco Group has a policy of thoroughly eliminating counterfeits of its brands, even if it incurs costs. In addition to information from in-house companies and Group companies within and outside Japan, we visit exhibitions and monitor the status of listings on EC sites and corporate websites on a regular basis, and periodically monitor companies that stopped infringing on our products after warning them in the past in an effort to detect any counterfeits as soon as possible. As a result, we have provided more than 340 infringement warnings since 2018.
―36―
(Translation) This document has been translated from the Japanese original for the convenience of overseas stakeholders. In the event of any discrepancy between this document and the Japanese original, the original shall prevail.
④ Indicators and Goals ■Adding Intellectual Property Creation to the Criteria for Performance Evaluation Since FY2017, we have systematized the Intellectual Property Strategy activities to acquire and reinforce our core competence (intellectual properties and intangible assets) by adding Intellectual Property Creation to the criteria for evaluating the performance of in-house companies and Group companies. Each of the in-house and Group companies is now obliged to develop Intellectual Property Strategy activities as business plans for each fiscal year, as set forth in the Medium-Term Business Plan of each in-house company and Group companies, and to implement them accordingly. Furthermore, the Nabtesco Group strives to develop a corporate culture facilitating the creation of new businesses, ideas about new technologies, and design/manufacturing know-how among all engineers. To this end, employees are encouraged to be proactive as part of an evaluation target for business performance of respective in-house companies. In an attempt to motivate individual employees to become more innovative, Nabtesco gives awards to engineers with spectacular innovations which contribute our business (a total of 209 engineers have been awarded until 2023), to honor their achievements at a ceremony for the corporate foundation anniversary. As a result of these activities, the number of notifications on intellectual property creation related to inventions, designs and know-how has seen consistent growth, as indicated by the following chart: <Number of notifications on intellectual property creation>
■Measures to Promote Innovation through Intellectual Exploration As part of efforts to stimulate innovation through so-called intellectual exploration, we have been promoting activities to increase diversity of intellectual property creators since 2022. The ratio of inventors has been set as an indicator for such activities. The ratio of inventors is the ratio of actual number of inventors who notified intellectual property creation to the total number of our engineers including not only those engaging in development but also production engineers. The ratio, which is calculated in each financial year, indicates whether diversity is maintained and improved on a continuous basis. In addition, we will strive to promote innovation as a unified team across the company based on the system for intellectual property creation supporters, such as sales representatives who have identified new market needs and brought about innovation. <Ratio of inventors (including know-how and design inventors)>
―37―
(Translation) This document has been translated from the Japanese original for the convenience of overseas stakeholders. In the event of any discrepancy between this document and the Japanese original, the original shall prevail.
3 【Business and Other Risks】 Principal risks relevant to the business and accounting status of the Group described in the Annual Securities Report and deemed significant are as follows. If such risks materialize, they may affect our group's performance and financial position. Note that the risks regarding future contents included in the matters described below were based on the judgment of the Company as of the end of the current consolidated fiscal year. (1) Risks relevant to the economy and markets The Group's businesses are directly or indirectly related to a number of industries, including automobile, construction machinery, railroad, construction and industrial machinery and so on, in Japan and overseas. Market fluctuations and trends in capital expenditure in these industries may affect the operating results and financial position of the Group. (2) Risks relevant to overseas operations In pursuit of further growth and profitability, the Group actively conducts business mainly in Asia, North America and Europe. Therefore, the Group is subject not only to economic and market risks but also to political turmoil and unforeseeable amendments to laws and regulations in various countries, which may affect the markets for particular products. Such events are likely to impact operating results of the Group. (3) Risks relevant to large-scale disasters With the aim of minimizing damage and loss arising from disasters such as earthquakes, typhoons, floods and pandemics, terrorism, war, and other social disruptions, the Group has implemented the formulation of a business continuity plan, establishment of personnel crisis response rules along with the establishment of an emergency contact system, and has also conducted drills. However, the occurrence of human and material damage, stagnation in material procurement, and disruption of logistics networks due to such disasters may affect the Group's business performance and financial position. Furthermore, there is no guarantee that damage caused by these disasters will be fully covered by property and/or other insurance. (4) Risks relevant to exchange rate fluctuations The Group's overseas sales have been increasing every year. The Group also relies on imports of raw materials from overseas and, though it hedges its risks in foreign currency-denominated transactions through forward-exchange contracts, the Group's business performance and financial position is nonetheless affected by exchange rate fluctuations. The performance of overseas subsidiaries is also impacted by exchange rate fluctuations when converting to Japanese yen. (5) Risks relevant to procurement The Group ensures stable procurement by purchasing raw materials and components from multiple sources. However, if the prices of raw materials surge, or the supply of certain components becomes disrupted and alternate suppliers cannot be found, the Group’s business performance and financial position may be affected by lower profit margins on products or by opportunity loss. (6) Risks relevant to product quality The Group manufactures a full lineup of products in line with carefully designed quality control standards to prevent defects. However, in case of significant product defects leading to a recall or product liability issues occurring, the potentially massive costs arising from such a situation could adversely impact the Group's business performance and financial position. (7) Risks relevant to competition The Group has a wide lineup of products with high market shares in the domestic and overseas markets and develop cost competitive differentiated products that meet the needs of our customer. If the market shares of its products were to fall due to the delays in the development of new products or the development of new products by other companies, the Group's business performance and financial position could be adversely impacted.
―38―
(Translation) This document has been translated from the Japanese original for the convenience of overseas stakeholders. In the event of any discrepancy between this document and the Japanese original, the original shall prevail.
(8) Risks relevant to information security The Group obtains personal information and confidential information of its customers and trading partners through business activities, and holds confidential information of its business and technologies. The Group implements the enhancement of control systems and employee education for the management of such information, and takes appropriate security measures, including both the hardware and software of information systems. However, in the event of a leakage of information, or destruction or falsification of important data, or system halt due to the unexpected levels of cyber attacks, unauthorized access, or intrusion of computer viruses, etc., the Group’s credibility could suffer or its business performance and financial position could be adversely impacted. (9) Risks relevant to intellectual property The Group protects internally developed technologies under intellectual property rights, including patents, and holds such intellectual property rights under strict management, while paying close attention not to infringe the intellectual property rights of third parties. If, however, a third party infringes the intellectual property rights of the Group, or the Group faces any infringement alleged by a third party, the Group’s business performance and financial position could be adversely affected. (10) Risks relevant to laws, ordinances and regulations The Group operates its businesses globally, and is subject to the laws and regulations of the relevant countries and regions. In addition to thorough compliance with laws and regulations relating to its businesses, the Company has established a Code of Corporate Ethics of an even higher standard to reinforce its compliance system. Despite these intense efforts, however, it is impossible to completely eliminate risks concerning compliance, including individual illegal acts. In case of a material violation against laws and regulations, the Group’s business performance and financial position could be adversely affected. (11) Risks relevant to environment Recognizing the impacts of business activities on the global environment, the Group exerts efforts to improve energy efficiency, save resources, reduce hazardous substances and raise recycling efficiency in planning, developing, and designing its products. Furthermore, in manufacturing, selling, and distributing products, and providing services, the Group strives to cut down environmental burdens by positively introducing and applying advanced environmental technologies in pursuit of the reduction of CO2 emissions, effective use of resources, and challenges to zero emission. However, in the case of environmental pollution caused by the Group’s business activities, the Group’s business performance and financial position could be adversely affected due to decontamination costs and compensation for damage, etc. and the loss of credibility. (12) Risks relevant to company acquisitions The Group seeks to enhance the production system for its products in Japan and overseas, its sales and service systems, and its technology platform through company acquisitions. During the consideration phase of a company acquisition, the Company conducts due diligence on the target company and verifies the operations of the target company after the acquisition. However, if the effects that were expected at the time of the acquisition cannot be gained in the future, the Group’s business performance and financial position may be affected. (13) Risks relevant to impairment of non-current assets The Group owns non-current assets, goodwill and intangible assets. In the event that profitability drops due to rapid changes in the business environment or other circumstances, and it is deemed that sufficient cash flows cannot be generated, the Group’s business performance and financial position may be affected due to the recording of an impairment loss on the relevant assets. (14) Risks relevant to recruiting human resources The Group seeks to promote global business activities and maintain and improve its competitiveness by recruiting and developing a broad range of human resources with competence in manufacturing, development, sales and other specialized fields. However, failure to recruit and develop a sufficient number of personnel due to intensified competition over human resources and the retirement of employees may lead to a drop in competitiveness, affecting the Group’s business performance and financial position.
―39―
(Translation) This document has been translated from the Japanese original for the convenience of overseas stakeholders. In the event of any discrepancy between this document and the Japanese original, the original shall prevail.
4 【Management’s Discussion and Analysis of Financial Condition, Results of Operations and Cash Flows】 (1) Summary of Business Results and Others ① Operating Results
During the consolidated fiscal year under review, the Group saw a recovery in demand for aircraft equipment for private-
sector aircraft and the Ministry of Defense, and strong demand for marine vessel equipment for new ships and MRO (Maintenance, Repair, Overhaul) in response to environmental regulations. In the automatic door business, strong demand for domestic building doors and foreign exchange effects in the overseas market. As a result, the Group’s consolidated net sales came to ¥333,367 million. Although operating income increased due to higher sales in the Transport Solutions Business, in the Component Solutions
Business, the impact of lower demand in the second half of the fiscal year and the impact of higher personnel costs and electricity prices and delays in passing on cost increases resulted in lower operating profit. In Q4, there was an impairment loss on goodwill related to Gilgen Door Systems AG (hereinafter, “Gilgen”) and an impairment loss on fixed assets related to OVALO GmbH (hereinafter, “OVALO”). On the other hand, there was a gain on exchange of land and buildings. As a result, operating income was ¥16,660 million. Income before tax was ¥25,316 million, reflecting the valuation gain on the shares of Harmonic Drive Systems Inc. (hereinafter, “Harmonic”) as a result of completion of the sales of these shares. Net income attributable to owners of the parent was ¥14,226 million.
Net sales Current consolidated fiscal year (ended December 31, 2023) Previous fiscal year (ended December 31, 2022) YoY change (%)
Operating income
Income before income taxes
(Millions of yen) Profit attributable to the owners of the parent
333,367
16,660
25,316
14,226
309,123
18,654
16,553
10,415
7.8
-10.7
52.9
36.6
The following is an overview of the business results by segment for the fiscal year under review. [Net Sales] (Millions of yen)
Previous fiscal year (ended December 31, 2023)
Current consolidated fiscal year (ended December 31, 2022)
YoY change (%)
Component Solutions Business
140,629
138,089
-1.8
Transport Solutions Business
70,950
80,787
13.9
Accessibility Solutions Business
78,993
96,011
21.5
Others
18,551
18,480
-0.4
Total
309,123
333,367
7.8
Previous fiscal year (ended December 31, 2023)
Current consolidated fiscal year (ended December 31, 2022)
Component Solutions Business
15,948
10,376
Transport Solutions Business
6,714
7,828
-34.9
Accessibility Solutions Business
3,358
5,451
62.3
Others
1,484
3,385
128.1
Corporate or elimination
-8,850
-10,380
-
Total
18,654
16,660
-10.7
[Operating income]
―40―
(Millions of yen) YoY change (%)
16.6
(Translation) This document has been translated from the Japanese original for the convenience of overseas stakeholders. In the event of any discrepancy between this document and the Japanese original, the original shall prevail.
② Financial Position (Assets)
Total assets as of December 31, 2023 were ¥428,630 million, a decrease of ¥33,811 million from December 31, 2022,
consisting of ¥223,818 million in current assets and ¥204,812 million in non-current assets. The key contributing positive factors were an increase of ¥11,626 million in tangible fixed assets, an increase of ¥5,070 million in intangible assets, an increase of ¥7,725 million in goodwill and an increase of ¥8,327 million in Investment property. The key contributing negative factors were a decrease of ¥46,578 million in cash and cash equivalents and a decrease of ¥34,030 million in assets associated with the sale of Harmonic’s shares. (Liabilities) Total liabilities as of December 31, 2023 were ¥150,485 million, a decrease of ¥46,174 million from December 31, 2022, reflecting ¥122,462 million in current liabilities and ¥28,022 million in non-current liabilities. Despite an increase of ¥4,142 million in other payables, total liabilities decreased mainly due to a decrease of ¥5,335 million in operating payables, and a decrease of ¥8,717 million in income taxes payable and a decrease of ¥47,267 million in other financial liabilities associated with the sale of Harmonic’s shares. (Equity) Total equity as of December 31, 2023 stood at ¥278,145 million. Equity attributable to owners of the parent was ¥262,721 million, an increase of ¥11,471 million from December 31, 2022. The key contributing positive factors were the increase in net income attributable to owners of the parent of ¥14,226 million and an increase of ¥5,797 million in other capital caused by factors such as exchange differences on foreign operations. Meanwhile, the main contributing negative factor was a decrease of ¥9,506 million in retained earnings due to dividend payment. As a result of the above, the ratio of equity attributable to owners of the parent was 61.3%, and equity attributable to owners of the parent per share was ¥2,188.27.
(2) Cash Flow Cash and cash equivalents (hereinafter, “capital”) on a consolidated basis as of December 31, 2023 stood at ¥77,835 million, a decrease of ¥46,578 million from December 31, 2022 as a result of the use of funds acquired from operating activities primarily for capital expenditures, mainly reflecting capital investment, acquisition of subsidiaries, proceeds and costs associated with the sale of Harmonic’s shares, and dividend payment. (Cash flows from operating activities) Net cash generated from operating activities for the fiscal year totaled ¥11,177 million. The principal positive factors included increases in net income, depreciation and amortization. Meanwhile, the main negative factors was an increase in the payment of income taxes. (Cash flows from investing activities) Net cash used in investing activities for the fiscal year amounted to ¥46,295 million. The main negative factor were payments for purchase of property, plant and equipment, payments for acquisition of subsidiaries resulting in a change in the scope of consolidation, and payments related to the Harmonic shares sales (payments for settlement of sales price on investment securities). (Cash flows from financing activities) Net cash used in financing activities for the fiscal year under review was ¥13,482 million. The main negative factor was dividend payment.
―41―
(Translation) This document has been translated from the Japanese original for the convenience of overseas stakeholders. In the event of any discrepancy between this document and the Japanese original, the original shall prevail.
(3) Status of production, orders and sales ① Production Results
Production results by segment for the fiscal year under review are as follows: Segment name
Production (Millions of yen)
YoY change (%)
Component Solutions Business
137,220
-2.3
Transport Solutions Business
81,792
13.5
Accessibility Solutions Business
96,221
22.1
Others
18,557
-5.3
333,790
7.4
Total (NOTE) The above amounts are figures after elimination of intersegment transactions.
② Orders Received
The results of orders in the fiscal year under review by business segment are as follows: Segment name
Orders received (Millions of yen)
YoY change (%)
Order backlog (Millions of yen)
YoY change (%)
Component Solutions Business
112,690
-23.3
15,103
-62.7
Transport Solutions Business
100,323
27.8
79,201
32.7
Accessibility Solutions Business
101,049
15.8
51,853
10.8
Others
18,454
5.4
9,069
-0.3
332,516
0.7
155,226
-0.5
Total
(NOTE) The above amounts are figures after elimination of intersegment transactions.
③ Sales Results
Sales results by business segment for the fiscal year under review are as follows. Segment name
Sales (Millions of yen)
YoY change (%)
Component Solutions Business
138,089
-1.8
Transport Solutions Business
80,787
13.9
Accessibility Solutions Business
96,011
21.5
Others
18,480
-0.4
333,367
7.8
Total
(NOTE) 1 The above amounts are figures after elimination of inter-segment transactions. 2 No customer accounts for more than 10% of total sales.
―42―
(Translation) This document has been translated from the Japanese original for the convenience of overseas stakeholders. In the event of any discrepancy between this document and the Japanese original, the original shall prevail.
(4) Analysis and examination of the status of operating results, etc. from the management's perspective ① Important Accounting Policies and Estimates
Important accounting policies and estimates used in the consolidated financial statements of our Group are as described in
“5. Accounting Status 1. Consolidated Financial Statements, etc., (1) Notes to Consolidated Financial Statements, 3. Significant Accounting Policies and Notes 5. Significant Accounting Judgments, Estimates and Assumptions.”
②
Recognition, analysis, and consideration of the status of operating results for the fiscal year under review
- Net sales Our Group’s net sales for the fiscal year under review increased 7.8% from the previous fiscal year to ¥333,367 million. This is because the Group saw a recovery in demand for aircraft equipment for private-sector aircraft and the Ministry of Defense, and strong demand for marine vessel equipment for new ships and MRO in response to environmental regulations. In the automatic door business, strong demand for domestic building doors and foreign exchange effects in the overseas market.
- Operating income Operating income declined 10.7%, to ¥16,660 million. The ratio of operating income to net sales was 5.0%. Although operating income increased due to the higher sales in the Transport Solutions Business and a gain on exchange of land and buildings for Japanese consolidated subsidiary in the Accessibility Solutions Business, operating income decreased due to the impact of lower demand in the second half of the fiscal year and the impact of higher personnel costs and electricity prices, delays in passing on cost increases in the Component Solutions Business and an impairment loss on fixed assets related to OVALO GmbH in the Transport Solutions Business and an impairment loss on goodwill related to Gilgen Door Systems AG in the Accessibility Solutions Business.
- Income before income taxes Financial income was ¥5,202 million, which was mainly composed of valuation gains of ¥3,485 million from the completion of the sale of Harmonic’s shares and foreign exchange gains. Financial costs were ¥1,095 million mainly due to losses on the valuation of derivatives. Equity in earnings of affiliates was ¥4,549 million. As a result, income before tax ended at ¥25,316 million, an increase of 52.9% on a year-on-year basis.
- Net income attributable to owners of the parent In sum, net income attributable to owners of the parent was ¥14,226 million, an increase of 36.6% on a year-on-year basis, net of income tax expenses of ¥9,215 million and net profit attributable to non-controlling interests of ¥1,876 million. Total basic earnings per share were ¥118.52, an increase of ¥31.73 year on year. Results by business segment for the fiscal year under review are as follows. (Component solutions business) The amount of orders received for component solutions decreased 23.3% year on year to ¥112,690 million. Net sales decreased 1.8% year on year to ¥138,089 million, while operating income decreased 34.9% year on year to ¥10,376 million. Sales of precision reduction gears remained at the same level as the previous fiscal year due to demand for industrial robots remained reflecting strong investment mainly related to EVs in the first half, while EV related and automation capital investment decreased significantly in the second half. Sales of hydraulic equipment for construction machinery saw a year-on-year decrease due to a further decline in demand in the Chinese market, although demand was steady in Japan and Europe and North America.
―43―
(Translation) This document has been translated from the Japanese original for the convenience of overseas stakeholders. In the event of any discrepancy between this document and the Japanese original, the original shall prevail.
(Transport solutions business) The amount of orders received for transport solutions increased 27.8% year on year to ¥100,323 million. Net sales also increased 13.9% year on year to ¥80,787 million, while operating income rose 16.6% to ¥7,828 million. For railroad vehicle equipment, sales decreased year on year due to continued restraints on investing in new vehicles in the Japanese market, although demand for MRO was steady. Sales of aircraft equipment posted a year-on-year substantial increase as a steady recovery in demand for use in private-sector aircraft and an increase in demand for use in the Ministry of Defense. Sales of commercial vehicle equipment increased year on year due to a recovery in production by domestic customers. Marine vessel equipment saw a year-on-year substantial increase in sales due to strong demand for new vessels backed by strong domestic and overseas shipbuilding and shipping markets, as well as strong demand for MRO associated with environmental regulations. For the current fiscal year, impairment loss of ¥1,761 million on fixed assets related to OVALO was recorded. (Accessibility solutions business) The amount of orders received for accessibility solutions increased 15.8% year on year to ¥101,049 million. Net sales increased 21.5% year on year to ¥96,011 million, and operating income increased 62.3% year on year to ¥5,451 million. Sales of the automatic door business increased year on year, reflecting steady domestic demand for doors for buildings, as well as the acquisition of a sales company in France and the effect of foreign exchange. For the current fiscal year, a gain on exchange of land and buildings of ¥4,243 million for a consolidated domestic subsidiary and also an impairment loss on goodwill of ¥4,489 million related to Gilgen were recorded. (Others) The amount of orders received for others recorded a year-on-year increase of 5.4% to ¥18,454 million. Net sales dropped 0.4% year on year to ¥18,480 million, and operating income increased 128.1% year on year to ¥3,385 million. Sales of packaging machines increased year on year due to a recovery in demand and the elimination of a shortage of electronic components. ③
Analysis of capital resources and fund liquidity Our Group's main cash requirements for operating activities include working capital required for production activities (raw materials, personnel expenses, etc.), selling expenses for acquiring orders, and R&D expenses for strengthening the competitiveness of existing businesses and creating new products and businesses. Investing activities include capital expenditures, primarily for new investments and facility upgrades, to respond to increased production capacity, and M&A. At the end of the fiscal year under review, funds decreased by ¥9,752 million related to the sale of Harmonic’s shares. In the fiscal year ending December 2024, the Group plans to invest ¥27,000 million mainly in the component solutions segment, including the construction of new plant buildings for precision reduction gears and the renewal of plant buildings for hydraulic equipment. The funds required for the Group’s business activities are mainly procured through the use of our own funds, borrowings from financial institutions, etc., and the Group selects the optimal financing methods while closely monitoring indicators such as the ratio of equity attributable to owners of the parent and ROE. The balance of loans at the end of the fiscal year under review was ¥21,572 million yen, an increase of ¥1,263 million yen from the previous fiscal yearend.
④ Objective indicators for judging the status of achievement of management policies, strategies and targets
We have set financial targets of at least ROIC 10% or more and a consolidated dividend payout ratio of 35% or more as
management targets in our medium-term management plan starting in Fiscal Year 2022. The trends in each indicator during the period of the current medium-term management plan are as follows. 20th fiscal year (FY2022)
21th fiscal year (FY2023)
ROIC (%)
4.7
4.0
Consolidated dividend payout ratio (%)
89.9
67.5
―44―
(Translation) This document has been translated from the Japanese original for the convenience of overseas stakeholders. In the event of any discrepancy between this document and the Japanese original, the original shall prevail.
5 【Significant Management Contracts】 (Agreement on the Introduction of Technology, etc.) Name of Contract Company
Subject of the contract
Conclusion agreement Effective Date
Manufacturing and sales contract of nose steering, input nose steering and flap drives which are equipped with F-15 fighter.
January, 1983
Technology and sales helicopter equipment
January, 1989
Until December 2028
United States Woodward HRT, Inc.
Manufacturing and sales contract of Rotary rudder servo actuator, canopy actuator, speed brake actuator, directional control valve and aerial refueling directional valve for F-15 fighter equipment.
July, 2015
Until June 2025
United States Woodward FST, Inc.
Manufacturing technology and sales contract of fuel injection nozzles for aircraft.
August, 1981
Until June 2025
Technology adopters
United States Parker-Hannifin Corporation
Nabtesco Corporation
contracts
of
Contract period Until December 2028
(NOTE) As compensation for the above-mentioned contracts, the Company pays a fixed amount or a fixed rate of sales.
―45―
(Translation) This document has been translated from the Japanese original for the convenience of overseas stakeholders. In the event of any discrepancy between this document and the Japanese original, the original shall prevail.
6【R&D activities】
Based on our corporate philosophy of “The Nabtesco Group, with our unique motion control technology, will provide safety, comfort and a sense of security in daily lives as well as any form of transportation,” our group sets the goal of our R&D activities for profitable growth and engages in R&D by formulating R&D plans in cooperation with our business strategies. With regard to R&D investment, we are concentrating resources on business strategy development themes that will strengthen the competitiveness of existing businesses and enhance profitability, as well as development themes for the creation and nurturing of new products and businesses in growth fields. The R&D promotion system is led by the Technology and R&D Division, which is responsible for planning and execution at each internal company and at the Technology and R&D Division, mainly at consolidated subsidiaries. Our emphasis in development activities is to provide highly competitive, original products that are directly linked to the needs of our customers and end users. We are also developing environmentally conscious products related to climate change, such as product weight reduction and efficiency improvement, in order to realize a sustainable society. Research and development expenses for the fiscal year under review were ¥10,999 million. The research objectives, major issues, research results, and R&D expenditures by segment are as follows.
(1) Component Solutions Business The Precision Equipment Company and Power Control Company are the main R&D centers for Precision reduction gears and its systems, as well as Hydraulic equipment for construction machinery and its systems. Major achievements in the fiscal year under review included the development of models for RV-Z series for industrial robots (Certified as Nabtesco ECO PRODUCT), the development of gear head series for general industrial use based on “Precision reduction gears RV”, the development of series of AGV drive units, the launch of energy-saving pump and valve systems for construction machinery, the strengthening of lineup of running and turning units for construction machinery, the launch of compact and high power density VC series motor models for construction machinery, and the study of equipment compatible with ICT and electrification of construction machinery. Research and development expenses in this segment totaled ¥2,184 million. (2) Transport Solutions Business The Railroad Products Company, Aerospace Company, Marine Control Systems Company and Nabtesco Automotive Co., Ltd. are responsible for the research and development of brake systems for railroad vehicles and door systems, aircraft flight control equipment and systems, marine engine control systems, and various devices and equipment for commercial vehicle brakes and passenger vehicle clutches. Major achievements during the fiscal year under review included the development of brake control systems and equipment for railcars for the global market (Launch of brake discs for Europe, energy-saving brake controllers (GB1) and disc brake systems for China, launch of oil-free compressor with improved dust environmental performance, launch of brake control (deceleration control) system resistant to disturbances such as weather and aging, the development of electric actuators for flight control, the development of new remote control systems (M-800-VII) for marine main engines with enhanced security and networks such as onshore communications, the joint development with TOKYO KEIKI INC. in marine equipment, the development of software solutions (Pythia) to reduce fuel consumption by proposing optimal AI route and ship speed planning based on engine/hull modeling, AIS, and weather/sea conditions, the development of electric compressors that respond to the electrification of commercial vehicles in addition to the development of conventional air brake equipment for commercial vehicles, and the development of emergency driving stop systems for retrofit (EDSS) that contribute to improving the safety of existing buses. Research and development expenses in this segment totaled ¥2,850 million. (3) Accessibility Solutions Business The Accessibility Innovations Company plays a central role in R&D of automatic door for buildings, automatic platform Gates, platforms screen doors, and welfare equipment. Major achievements during the fiscal year under review included the development of high-value-added automatic door, launch of a new Automatic Door platform-“AD-Link,” and launching a new function that contributes to environmental conservation and barrier-free “NATRUS+e W,” the development of automatic door with digital signage, and the development of automatic platform gates and high-value-added screen doors for railway station platforms. Research and development expenses in this segment totaled ¥3,202 million yen. (4) Others PACRAFT Co., Ltd. and CMET Inc. play a central role in the R&D of such products as automated filling/sealing packaging machines, stereolithography system (3D printers). Major achievements during the fiscal year under review included the development of products that respond to changes in packaging materials and containers, the development of packaging machines and peripheral labor-saving and automation equipment to meet demands for improved productivity, the launch a new large-scale high-speed stereolithography system CSLA-9000, the development of CMFS equipment for wind turbines for foreign customers, and the business alliance with Austrian startup eologix-Ping to develop smart sensors for wind turbines. Research and development expenses in this segment totaled ¥699 million. (5) Corporate division The Corporate Division actively engages in R&D activities related to fundamental technologies and new business fields that are common to the entire Group, as well as joint R&D activities with universities, research institutes, and other companies. Research and development expenses related to the Corporate Division are ¥2,064 million.
―46―
(Translation) This document has been translated from the Japanese original for the convenience of overseas stakeholders. In the event of any discrepancy between this document and the Japanese original, the original shall prevail.
No.3 【Status of Facilities】 1 【Overview of Capital Expenditures】 In our group, we invested primarily in expanding domestic capacity and improving productivity, and in overseas, in upgrading facilities. As a result, capital expenditures for the fiscal year under review totaled ¥29,673 million (investments in property, plant and equipment and intangible assets). In component solutions business, capital expenditures totaled ¥22,834 million, mainly for the construction of a Hamamatsu Plant building in precision reduction gears, increased production at the Tsu Plant, and rebuilding of the Japanese Plant in hydraulic equipment. Capital expenditures in transport solutions business amounted to ¥2,624 million, mainly for R&D capital expenditures in marine vessels equipment, and for capital expenditures in railroad vehicle equipment and aircraft equipment. In accessibility solutions business, capital expenditures totaled ¥1,941 million, mainly for productivity improvements and facility upgrades at automatic door. In the others segment, capital expenditures totaled ¥701 million, mainly for capital expenditures in packaging machines. Capital expenditures of ¥1,574 million were made for companywide and common assets, mainly for updating information management systems. In addition, the Company appropriated its own funds to the primary investors in all of its capital requirements.
2 [Status of major facilities] (1) Submitting Company As of December 31, 2023 Site name (Location)
Book value (Millions of yen)
Segment Name
Details of facilities
Tsu Plant (Tsu, Mie)
Component Solutions
Land for the Hamamatsu Plant (Kita-ku, Hamamatsu)
Number of employees (person)
Buildings and structures
Machinery and equipment
Land (Area m2)
Production facilities for precision reduction gears
7,679
14,661
1,755 (118,602)
2,653
26,749
640
Component Solutions
Factory land for precision reduction gears
57
1
5,660 (181,700)
22,731
28,450
-
Kobe Plant (Nishi-ku, Kobe)
Transport Solutions
1,847
502
3,431 (27,000)
320
6,100
352
Seishin plant (Nishi-ku, Kobe)
Transport Solutions and Component Solutions
Production facilities for brake systems and other equipment of railroad vehicles Production facilities for marine vessels equipment, hydraulic equipment and others
1,140
1,193
698 (70,780)
326
3,357
317
Tarui Plant (Tarui-cho, gifu Prefecture)
Component Solutions
Production facilities for hydraulic equipment
2,667
721
29 (43,495)
539
3,956
203
Gifu Plant (Tarui-cho, gifu Prefecture)
Transport Solutions
Production facilities for aircraft equipment
5,397
2,245
541 (81,323)
414
8,597
374
Konan Plant (Higashinada-ku, Kobe)
Accessibilit y Solutions
Production facilities for automatic doors for buildings and others
489
102
90 (11,018)
223
904
237
Rental real estate (Matsuyama, Ehime)
Common to Head Office
Land for factories, buildings and structures
84
1
1,710 (58,786)
0
1,796
-
Others
Total
(NOTE) 1 The book value is the book value in the non-consolidated financial statements based on Japanese GAAP. 2 Other includes tools, furniture and fixtures, and construction in progress. 3 Leased equipment from other than consolidated companies consist primarily of the Tokyo head office building of the submitting company, which is subject to annual rent of ¥303 million.
―47―
(Translation) This document has been translated from the Japanese original for the convenience of overseas stakeholders. In the event of any discrepancy between this document and the Japanese original, the original shall prevail.
(2) Domestic subsidiaries As of December 31, 2023 Site name (Location)
Segment Name
Details of facilities
Book value (Millions of yen) Buildings and structures
Machinery and equipment
Nabtesco Automotive Production Corporation facilities for Yamagata Plant Transport brake 1,202 494 (Murayama City, Solutions systems and Yamagata Prefecture) others in 2 other business sites automobiles Nabtesco Service Co., Head Office Ltd. Head Office Transport and sales 256 141 (Shinagawa-ku, Tokyo) Solutions facilities 6 other business sites NABCO SYSTEM Head Office CO., LTD. Accessibilit and sales 2,005 151 (Chiyoda-ku, Tokyo) y Solutions facilities 3 other companies NABCO DOOR Ltd. Head Office Accessibilit Head Office and sales 550 - (Kita-ku, Osaka) y Solutions facilities 23 other business sites PACRAFT Co., Ltd. Production Iwakuni Plant facilities for (Iwakuni City, Others 875 250 packaging Yamaguchi Prefecture) machines 6 other business sites (NOTE) 1 The carrying amount is based on IFRS. 2 Other includes tools, furniture and fixtures, and construction in progress. 3 The amount is included investment property of ¥8,600 million.
Land Right-of-use assets (Area m2)
Others
Total
Number of employees (person)
745 (43,957)
-
845
3,285
240
335 (2,076)
306
38
1,075
165
543 (31,311)
2,045
8,836 (NOTE)3
13,579
996
1,759 (4,133)
615
94
3,018
434
944 (35,639)
209
102
2,381
294
(3) Foreign subsidiaries As of December 31, 2023 Site name (Location) Nabtesco (China) Precision Equipment Co., Ltd. Head Office and Plant (Jiangsu Province, China) Changzhou Nabtesco Precision Machinery Co., Ltd. Head Office and Plant (Jiangsu Province, China) Nabtesco Power Control (Thailand) Co., Ltd. Head Office and Plant (Chonburi, Thailand) Shanghai Nabtesco Hydraulic Co., Ltd. Head Office and Plant (Shanghai, China)
Segment Name
Details of facilities
Book value (Millions of yen)
Number of employees (person)
Buildings and structures
Machinery and equipment
Component Solutions
Production facilities for precision reduction gears
1,536
1,589
-
290
109
3,524
142
Component Solutions
Production facilities for reduction gears
-
1,056
-
-
8
1,063
131
Component Solutions
Production facilities for hydraulic equipment
170
295
458 (47,988)
30
75
1,028
114
Component Solutions
Production facilities for hydraulic equipment
704
1,503
-
74
231
2,511
265
390 (26,271)
2,151
321
4,233
1,315
Production facilities for Accessibilit automatic 1,031 339 doors for y Solutions buildings and others (NOTE) 1 The carrying amount is based on IFRS. 2 Other includes tools, furniture and fixtures, and construction in progress. Gilgen Door Systems AG (Bern, Switzerland) 9 other companies
―48―
Land Right-of-use assets (Area m2)
Others
Total
(Translation) This document has been translated from the Japanese original for the convenience of overseas stakeholders. In the event of any discrepancy between this document and the Japanese original, the original shall prevail.
3 [Plans for new construction, retirement, etc.] (1) Construction of major facilities The Group’s capital investment plans take into account a comprehensive range of factors, including demand forecasts, production plans, and the ratio of investment to profit plans. Capital investment plans are formulated individually by the Company and each of our consolidated subsidiaries in principle, but the Production Innovation Division plays a central role in coordinating these plans so that the entire Group does not have overlapping investments. The capital expenditure plan for the year ending December 31, 2024 (new construction and expansion) was ¥27,500 million, and the breakdown by segment is as follows. Segment name
Planned amount (Millions of yen)
Component Solutions Business
19,000
Transport Solutions Business
4,000
Accessibility Solutions
Constructing a new plant building for precision reduction gears and expanding its capacity and renewal of hydraulic equipment plant buildings, etc. Replacing facilities of railroad vehicle equipment, facilities for developing marine vessels equipment, facilities for new commercial vehicle equipment, etc.
Fund procurement Methods Own funds Own funds
Improving automatic door productivity and renewing facilities, etc.
Own funds
500
Expansion of packaging machines capacity and improve productivity, etc.
Own funds
Company-wide and common
1,400
Information management systems, R&D, environmental measures, etc.
Own funds
Total
27,500
Business Others
2,600
Major contents and purpose of facilities
-
-
(2) Disposal of major facilities With the exception of retirements and sales for recurring equipment renewals, there are no plans for the retirement or sale of significant equipment.
―49―
(Translation) This document has been translated from the Japanese original for the convenience of overseas stakeholders. In the event of any discrepancy between this document and the Japanese original, the original shall prevail.
No.4 【Status of the Company Submitting the Report】 1
【Status of Shares】 (1) 【Total Number of Shares】 ① 【Total number of shares】
Type
Total number of authorized shares
Common stock
400,000,000
Total
400,000,000
② 【Shares outstanding】 Type
Number of shares Number of shares outstanding (shares) outstanding (shares) as Name of stock exchange As of December 31, of the date of filing listings 2023 (March 27, 2024)
Content
Common shares
121,064,099
121,064,099
Tokyo Stock Exchange Prime section
The number of shares per unit is 100 shares.
Total
121,064,099
121,064,099
-
-
(NOTE) The "Number of shares outstanding as of the filing date" column does not include the number of shares issued upon the exercise of stock acquisition rights to shares from March 1, 2024 to the filing date of this Annual Securities Report.
―50―
(Translation) This document has been translated from the Japanese original for the convenience of overseas stakeholders. In the event of any discrepancy between this document and the Japanese original, the original shall prevail.
(2) 【Status of Stock Acquisition Rights】 ① 【Details of stock option plan】
As of the end of the fiscal year (December 31, 2023)
As of the end of the previous month of the filing date (February 29, 2024)
July 29, 2011
Same as left
9 directors and 11 executive officers
Same as left
Number of stock options (unit)
23
Same as left
Class of shares for stock options
Common shares
Same as left
Number of shares for stock options
2,300 (Note 1)
Same as left
1 per share
Same as left
Date of resolution Classification and number of grantees
Payment on exercise price of stock options (Yen)
From August 20, 2011 to August 19, 2036 Issue price for shares upon exercise of stock options Issue price 1,529 and appropriation to capital (Yen) Amount incorporated into capital 765 Period for exercising stock options
Conditions for exercising the new stock options Items related to transfer of stock options
Same as left Same as left
(NOTE) 2
Same as left
Transfer of share options shall require the approval of the board of directors.
Same as left
Matters concerning the delivery of the stock options (NOTE) 3 Same as left in connection with the organizational restructuring (NOTE) 1 The number of shares subject to the stock options; The number of shares subject to each stock options (hereinafter referred to as the "number of granted shares") shall be 100 shares. Provided, however, that in the event that we effect a share split or reverse share split after the Allotment Date, the number of granted shares shall be adjusted according to the following formula: Number of shares granted after adjustment = Number of shares granted before adjustment × Ratio of stock split and reverse stock split Such adjustment shall be made with respect to the number of shares subject to the stock acquisition rights that have not been exercised at that time, and any fraction less than 1 share resulting from the above adjustment shall be discarded. In addition to the above, in the event that we effect a merger, a company split, or a share exchange, or in any other event that requires an adjustment to the number of granted shares in accordance with such circumstances, we shall be entitled to make an adjustment to the number of granted shares as deemed necessary by the Board of Directors to the extent reasonable. 2 Conditions for exercising the new stock options ①A holder of the rights to subscribe for new shares may exercise the rights only within 10 days (if the tenth day falls on a holiday, then no later than the next business day) from the day following the day on which the holder of the rights to subscribe for new shares has lost the position of both the directors and the executive officers of the Company. ②The exercise of stock options shall be effected by collectively exercising all of the number of stock options allotted. ③In the event of the death of a holder of stock options who has been allotted, only one of the direct legal heirs of such holder of stock options may inherit the rights of such holder of stock options. ④Other conditions shall be as set forth in the "Stock Option Allotment Agreement" concluded between the Company and holders of stock options by resolution of the Board of Directors of the Company with respect to the issuance of stock options. 3 Matters concerning the delivery of the stock options in connection with the organizational restructuring In the event of a merger (limited to the case where we cease to exist due to a merger), an absorption-type demerger or an incorporation-type demerger (limited to the case where each of us becomes a split company), or a share exchange or a share transfer (limited to the case where each of us becomes a wholly-owned subsidiary) (hereinafter collectively referred to as "organizational restructuring"), the share warrants of the corporation (hereinafter referred to as "the restructured corporation") as set forth in Article 236, Paragraph 1, Item 8 (a) to (e) inclusive of the Companies Act shall be delivered to the holder of the share warrants who holds the share warrants which remain immediately before the effective date of the organizational restructuring. ①Type of stock of the Company to be restructured to be subject to the stock options The type of stock shall be common stock of the Company to be restructured. ②Number of restructured companies subject to stock options Decisions shall be made in accordance with (NOTE) 1 above after taking into consideration the conditions of the organizational restructuring. ③Assets to be contributed at the time of exercise of the rights The value of assets to be contributed upon the exercise of each of the stock options to be delivered shall be the amount obtained by multiplying the exercise price after the realignment stipulated below by the number of shares of the restructured company subject to each of such stock options to be determined in accordance with ② above. The exercise price after the reorganization shall be one yen per share of the restructured company's shares that can be delivered by exercising each stock acquisition right to be delivered. ④Exercise period for the rights The period from the date of commencement of the period during which the stock options may be exercised or the effective date of the organizational restructuring, whichever is later, until the expiration date of the period during which the stock options may be exercised. ⑤Restriction on acquisition of stock options by transfer Acquisition of the rights to subscribe for new shares by transfer shall require approval by a resolution of the Board of Directors of the Company to be restructured.
―51―
(Translation) This document has been translated from the Japanese original for the convenience of overseas stakeholders. In the event of any discrepancy between this document and the Japanese original, the original shall prevail.
As of the end of the fiscal year (December 31, 2023)
As of the end of the previous month of the filing date (February 29, 2024)
July 31, 2012
Same as left
8 directors and 14 executive officer
Same as left
Number of stock options (unit)
24
Same as left
Class of shares for stock options
Common shares
Same as left
Number of shares for stock options
2,400 (Note 1)
Same as left
1 per share
Same as left
Date of resolution Classification and number of grantees
Payment on exercise price of stock options (Yen) Period for exercising stock options Issue price for shares upon exercise of stock options and appropriation to capital (Yen)
From August 21, 2012 to August 20, 2037 Issue price 1,393 Amount incorporated into capital 697
Conditions for exercising the new stock options Items related to transfer of stock options
Same as left Same as left
(NOTE) 2
Same as left
Transfer of share options shall require the approval of the board of directors.
Same as left
Matters concerning the delivery of the stock options (NOTE) 3 Same as left in connection with the organizational restructuring (NOTE) 1 The number of shares subject to the stock options; The number of shares subject to each stock options (hereinafter referred to as the "number of granted shares") shall be 100 shares. Provided, however, that in the event that we effect a share split or reverse share split after the Allotment Date, the number of granted shares shall be adjusted according to the following formula: Number of shares granted after adjustment = Number of shares granted before adjustment × Ratio of stock split and reverse stock split Such adjustment shall be made with respect to the number of shares subject to the stock acquisition rights that have not been exercised at that time, and any fraction less than 1 share resulting from the above adjustment shall be discarded. In addition to the above, in the event that we effect a merger, a company split, or a share exchange, or in any other event that requires an adjustment to the number of granted shares in accordance with such circumstances, we shall be entitled to make an adjustment to the number of granted shares as deemed necessary by the Board of Directors to the extent reasonable. 2 Conditions for exercising the new stock options ①A holder of the rights to subscribe for new shares may exercise the rights only within 10 days (if the tenth day falls on a holiday, then no later than the next business day) from the day following the day on which the holder of the rights to subscribe for new shares has lost the position of both the directors and the executive officers of the Company. ②The exercise of stock options shall be effected by collectively exercising all of the number of stock options allotted. ③In the event of the death of a holder of stock options who has been allotted, only one of the direct legal heirs of such holder of stock options may inherit the rights of such holder of stock options. ④Other conditions shall be as set forth in the "Stock Option Allotment Agreement" concluded between the Company and holders of stock options by resolution of the Board of Directors of the Company with respect to the issuance of stock options. 3 Matters concerning the delivery of the stock options in connection with the organizational restructuring In the event of a merger (limited to the case where we cease to exist due to a merger), an absorption-type demerger or an incorporation-type demerger (limited to the case where each of us becomes a split company), or a share exchange or a share transfer (limited to the case where each of us becomes a wholly-owned subsidiary) (hereinafter collectively referred to as "organizational restructuring"), the share warrants of the corporation (hereinafter referred to as "the restructured corporation") as set forth in Article 236, Paragraph 1, Item 8 (a) to (e) inclusive of the Companies Act shall be delivered to the holder of the share warrants who holds the share warrants which remain immediately before the effective date of the organizational restructuring. ①Type of stock of the Company to be restructured to be subject to the stock options The type of stock shall be common stock of the Company to be restructured. ②Number of restructured companies subject to stock options Decisions shall be made in accordance with (NOTE) 1 above after taking into consideration the conditions of the organizational restructuring. ③Assets to be contributed at the time of exercise of the rights The value of assets to be contributed upon the exercise of each of the stock options to be delivered shall be the amount obtained by multiplying the exercise price after the realignment stipulated below by the number of shares of the restructured company subject to each of such stock options to be determined in accordance with ② above. The exercise price after the reorganization shall be one yen per share of the restructured company's shares that can be delivered by exercising each stock acquisition right to be delivered. ④Exercise period for the rights The period from the date of commencement of the period during which the stock options may be exercised or the effective date of the organizational restructuring, whichever is later, until the expiration date of the period during which the stock options may be exercised. ⑤Restriction on acquisition of stock options by transfer Acquisition of the rights to subscribe for new shares by transfer shall require approval by a resolution of the Board of Directors of the Company to be restructured.
―52―
(Translation) This document has been translated from the Japanese original for the convenience of overseas stakeholders. In the event of any discrepancy between this document and the Japanese original, the original shall prevail.
As of the end of the fiscal year (December 31, 2023)
As of the end of the previous month of the filing date (February 29, 2024)
July 31, 2013
Same as left
7 directors and 15 executive officer
Same as left
Number of stock options (unit)
23
Same as left
Class of shares for stock options
Common shares
Same as left
Number of shares for stock options
2,300 (Note 1)
Same as left
1 per share
Same as left
Date of resolution Classification and number of grantees
Payment on exercise price of stock options (Yen) Period for exercising stock options Issue price for shares upon exercise of stock options and appropriation to capital (Yen)
From August 21, 2013 to August 20, 2038 Issue price 1,978 Amount incorporated into capital 989
Conditions for exercising the new stock options Items related to transfer of stock options
Same as left Same as left
(NOTE) 2
Same as left
Transfer of share options shall require the approval of the board of directors.
Same as left
Matters concerning the delivery of the stock options (NOTE) 3 Same as left in connection with the organizational restructuring (NOTE) 1 The number of shares subject to the stock options; The number of shares subject to each stock options (hereinafter referred to as the "number of granted shares") shall be 100 shares. Provided, however, that in the event that we effect a share split or reverse share split after the Allotment Date, the number of granted shares shall be adjusted according to the following formula: Number of shares granted after adjustment = Number of shares granted before adjustment × Ratio of stock split and reverse stock split Such adjustment shall be made with respect to the number of shares subject to the stock acquisition rights that have not been exercised at that time, and any fraction less than 1 share resulting from the above adjustment shall be discarded. In addition to the above, in the event that we effect a merger, a company split, or a share exchange, or in any other event that requires an adjustment to the number of granted shares in accordance with such circumstances, we shall be entitled to make an adjustment to the number of granted shares as deemed necessary by the Board of Directors to the extent reasonable. 2 Conditions for exercising the new stock options ①A holder of the rights to subscribe for new shares may exercise the rights only within 10 days (if the tenth day falls on a holiday, then no later than the next business day) from the day following the day on which the holder of the rights to subscribe for new shares has lost the position of both the directors and the executive officers of the Company. ②The exercise of stock options shall be effected by collectively exercising all of the number of stock options allotted. ③In the event of the death of a holder of stock options who has been allotted, only one of the direct legal heirs of such holder of stock options may inherit the rights of such holder of stock options. ④Other conditions shall be as set forth in the "Stock Option Allotment Agreement" concluded between the Company and holders of stock options by resolution of the Board of Directors of the Company with respect to the issuance of stock options. 3 Matters concerning the delivery of the stock options in connection with the organizational restructuring In the event of a merger (limited to the case where we cease to exist due to a merger), an absorption-type demerger or an incorporation-type demerger (limited to the case where each of us becomes a split company), or a share exchange or a share transfer (limited to the case where each of us becomes a wholly-owned subsidiary) (hereinafter collectively referred to as "organizational restructuring"), the share warrants of the corporation (hereinafter referred to as "the restructured corporation") as set forth in Article 236, Paragraph 1, Item 8 (a) to (e) inclusive of the Companies Act shall be delivered to the holder of the share warrants who holds the share warrants which remain immediately before the effective date of the organizational restructuring. ①Type of stock of the Company to be restructured to be subject to the stock options The type of stock shall be common stock of the Company to be restructured. ②Number of restructured companies subject to stock options Decisions shall be made in accordance with (NOTE) 1 above after taking into consideration the conditions of the organizational restructuring. ③Assets to be contributed at the time of exercise of the rights The value of assets to be contributed upon the exercise of each of the stock options to be delivered shall be the amount obtained by multiplying the exercise price after the realignment stipulated below by the number of shares of the restructured company subject to each of such stock options to be determined in accordance with ② above. The exercise price after the reorganization shall be one yen per share of the restructured company's shares that can be delivered by exercising each stock acquisition right to be delivered. ④Exercise period for the rights The period from the date of commencement of the period during which the stock options may be exercised or the effective date of the organizational restructuring, whichever is later, until the expiration date of the period during which the stock options may be exercised. ⑤Restriction on acquisition of stock options by transfer Acquisition of the rights to subscribe for new shares by transfer shall require approval by a resolution of the Board of Directors of the Company to be restructured.
―53―
(Translation) This document has been translated from the Japanese original for the convenience of overseas stakeholders. In the event of any discrepancy between this document and the Japanese original, the original shall prevail.
As of the end of the fiscal year (December 31, 2023)
As of the end of the previous month of the filing date (February 29, 2024)
July 31, 2014
Same as left
8 directors and 13 executive officer
Same as left
Number of stock options (unit)
20
Same as left
Class of shares for stock options
Common shares
Same as left
Number of shares for stock options
2,000 (Note 1)
Same as left
1 per share
Same as left
Date of resolution Classification and number of grantees
Payment on exercise price of stock options (Yen)
From August 21, 2014 Period for exercising stock options to August 20, 203 Issue price for shares upon exercise of stock Issue price 2,241 options and appropriation to capital (Yen) Amount incorporated into capital 1,121 Conditions for exercising the new stock options Items related to transfer of stock options
Same as left Same as left
(NOTE) 2
Same as left
Transfer of share options shall require the approval of the board of directors.
Same as left
Matters concerning the delivery of the stock options in connection with the organizational (NOTE) 3 Same as left restructuring (NOTE) 1 The number of shares subject to the stock options; The number of shares subject to each stock options (hereinafter referred to as the "number of granted shares") shall be 100 shares. Provided, however, that in the event that we effect a share split or reverse share split after the Allotment Date, the number of granted shares shall be adjusted according to the following formula: Number of shares granted after adjustment = Number of shares granted before adjustment × Ratio of stock split and reverse stock split Such adjustment shall be made with respect to the number of shares subject to the stock acquisition rights that have not been exercised at that time, and any fraction less than 1 share resulting from the above adjustment shall be discarded. In addition to the above, in the event that we effect a merger, a company split, or a share exchange, or in any other event that requires an adjustment to the number of granted shares in accordance with such circumstances, we shall be entitled to make an adjustment to the number of granted shares as deemed necessary by the Board of Directors to the extent reasonable. 2 Conditions for exercising the new stock options ①A holder of the rights to subscribe for new shares may exercise the rights only within 10 days (if the tenth day falls on a holiday, then no later than the next business day) from the day following the day on which the holder of the rights to subscribe for new shares has lost the position of both the directors and the executive officers of the Company. ②The exercise of stock options shall be effected by collectively exercising all of the number of stock options allotted. ③In the event of the death of a holder of stock options who has been allotted, only one of the direct legal heirs of such holder of stock options may inherit the rights of such holder of stock options. ④Other conditions shall be as set forth in the "Stock Option Allotment Agreement" concluded between the Company and holders of stock options by resolution of the Board of Directors of the Company with respect to the issuance of stock options. 3 Matters concerning the delivery of the stock options in connection with the organizational restructuring In the event of a merger (limited to the case where we cease to exist due to a merger), an absorption-type demerger or an incorporation-type demerger (limited to the case where each of us becomes a split company), or a share exchange or a share transfer (limited to the case where each of us becomes a wholly-owned subsidiary) (hereinafter collectively referred to as "organizational restructuring"), the share warrants of the corporation (hereinafter referred to as "the restructured corporation") as set forth in Article 236, Paragraph 1, Item 8 (a) to (e) inclusive of the Companies Act shall be delivered to the holder of the share warrants who holds the share warrants which remain immediately before the effective date of the organizational restructuring. ①Type of stock of the Company to be restructured to be subject to the stock options The type of stock shall be common stock of the Company to be restructured. ②Number of restructured companies subject to stock options Decisions shall be made in accordance with (NOTE) 1 above after taking into consideration the conditions of the organizational restructuring. ③Assets to be contributed at the time of exercise of the rights The value of assets to be contributed upon the exercise of each of the stock options to be delivered shall be the amount obtained by multiplying the exercise price after the realignment stipulated below by the number of shares of the restructured company subject to each of such stock options to be determined in accordance with ② above. The exercise price after the reorganization shall be one yen per share of the restructured company's shares that can be delivered by exercising each stock acquisition right to be delivered. ④Exercise period for the rights The period from the date of commencement of the period during which the stock options may be exercised or the effective date of the organizational restructuring, whichever is later, until the expiration date of the period during which the stock options may be exercised. ⑤Restriction on acquisition of stock options by transfer Acquisition of the rights to subscribe for new shares by transfer shall require approval by a resolution of the Board of Directors of the Company to be restructured.
―54―
(Translation) This document has been translated from the Japanese original for the convenience of overseas stakeholders. In the event of any discrepancy between this document and the Japanese original, the original shall prevail.
As of the end of the fiscal year (December 31, 2023)
As of the end of the previous month of the filing date (February 29, 2024)
July 31, 2015
Same as left
8 directors and 11 executive officer
Same as left
Number of stock options (unit)
27
Same as left
Class of shares for stock options
Common shares
Same as left
Number of shares for stock options
2,700 (Note 1)
Same as left
1 per share
Same as left
Date of resolution Classification and number of grantees
Payment on exercise price of stock options (Yen)
Issue price for shares upon exercise of stock options and appropriation to capital (Yen)
From August 21, 2015 to August 20, 2040 Issue price 2,420 Amount incorporated into capital 1,210
Conditions for exercising the new stock options
(NOTE) 2
Same as left
Transfer of share options shall require the approval of the board of directors.
Same as left
Period for exercising stock options
Items related to transfer of stock options
Same as left Same as left
Matters concerning the delivery of the stock options in connection with the organizational (NOTE) 3 Same as left restructuring (NOTE) 1 The number of shares subject to the stock options; The number of shares subject to each stock options (hereinafter referred to as the "number of granted shares") shall be 100 shares. Provided, however, that in the event that we effect a share split or reverse share split after the Allotment Date, the number of granted shares shall be adjusted according to the following formula: Number of shares granted after adjustment = Number of shares granted before adjustment × Ratio of stock split and reverse stock split Such adjustment shall be made with respect to the number of shares subject to the stock acquisition rights that have not been exercised at that time, and any fraction less than 1 share resulting from the above adjustment shall be discarded. In addition to the above, in the event that we effect a merger, a company split, or a share exchange, or in any other event that requires an adjustment to the number of granted shares in accordance with such circumstances, we shall be entitled to make an adjustment to the number of granted shares as deemed necessary by the Board of Directors to the extent reasonable. 2 Conditions for exercising the new stock options ①A holder of the rights to subscribe for new shares may exercise the rights only within 10 days (if the tenth day falls on a holiday, then no later than the next business day) from the day following the day on which the holder of the rights to subscribe for new shares has lost the position of both the directors and the executive officers of the Company. ②The exercise of stock options shall be effected by collectively exercising all of the number of stock options allotted. ③In the event of the death of a holder of stock options who has been allotted, only one of the direct legal heirs of such holder of stock options may inherit the rights of such holder of stock options. ④Other conditions shall be as set forth in the "Stock Option Allotment Agreement" concluded between the Company and holders of stock options by resolution of the Board of Directors of the Company with respect to the issuance of stock options. 3 Matters concerning the delivery of the stock options in connection with the organizational restructuring In the event of a merger (limited to the case where we cease to exist due to a merger), an absorption-type demerger or an incorporation-type demerger (limited to the case where each of us becomes a split company), or a share exchange or a share transfer (limited to the case where each of us becomes a wholly-owned subsidiary) (hereinafter collectively referred to as "organizational restructuring"), the share warrants of the corporation (hereinafter referred to as "the restructured corporation") as set forth in Article 236, Paragraph 1, Item 8 (a) to (e) inclusive of the Companies Act shall be delivered to the holder of the share warrants who holds the share warrants which remain immediately before the effective date of the organizational restructuring. ①Type of stock of the Company to be restructured to be subject to the stock options The type of stock shall be common stock of the Company to be restructured. ②Number of restructured companies subject to stock options Decisions shall be made in accordance with (NOTE) 1 above after taking into consideration the conditions of the organizational restructuring. ③Assets to be contributed at the time of exercise of the rights The value of assets to be contributed upon the exercise of each of the stock options to be delivered shall be the amount obtained by multiplying the exercise price after the realignment stipulated below by the number of shares of the restructured company subject to each of such stock options to be determined in accordance with ② above. The exercise price after the reorganization shall be one yen per share of the restructured company's shares that can be delivered by exercising each stock acquisition right to be delivered. ④Exercise period for the rights The period from the date of commencement of the period during which the stock options may be exercised or the effective date of the organizational restructuring, whichever is later, until the expiration date of the period during which the stock options may be exercised. ⑤Restriction on acquisition of stock options by transfer Acquisition of the rights to subscribe for new shares by transfer shall require approval by a resolution of the Board of Directors of the Company to be restructured.
―55―
(Translation) This document has been translated from the Japanese original for the convenience of overseas stakeholders. In the event of any discrepancy between this document and the Japanese original, the original shall prevail.
As of the end of the fiscal year (December 31, 2023)
As of the end of the previous month of the filing date (February 29, 2024)
April 28, 2016
Same as left
7 directors and 12 executive officer
Same as left
Number of stock options (unit)
85
Same as left
Class of shares for stock options
Common shares
Same as left
Number of shares for stock options
8,500 (Note 1)
Same as left
1 per share
Same as left
Date of resolution Classification and number of grantees
Payment on exercise price of stock options (Yen) Period for exercising stock options Issue price for shares upon exercise of stock options and appropriation to capital (Yen)
From May 21, 2016 to May 20, 2041 Issue price 2,564 Amount incorporated into capital 1,282
Conditions for exercising the new stock options Items related to transfer of stock options
Same as left Same as left
(NOTE) 2
Same as left
Transfer of share options shall require the approval of the board of directors.
Same as left
Matters concerning the delivery of the stock options in connection with the organizational (NOTE) 3 Same as left restructuring (NOTE) 1 The number of shares subject to the stock options; The number of shares subject to each stock options (hereinafter referred to as the "number of granted shares") shall be 100 shares. Provided, however, that in the event that we effect a share split or reverse share split after the Allotment Date, the number of granted shares shall be adjusted according to the following formula: Number of shares granted after adjustment = Number of shares granted before adjustment × Ratio of stock split and reverse stock split Such adjustment shall be made with respect to the number of shares subject to the stock acquisition rights that have not been exercised at that time, and any fraction less than 1 share resulting from the above adjustment shall be discarded. In addition to the above, in the event that we effect a merger, a company split, or a share exchange, or in any other event that requires an adjustment to the number of granted shares in accordance with such circumstances, we shall be entitled to make an adjustment to the number of granted shares as deemed necessary by the Board of Directors to the extent reasonable. 2 Conditions for exercising the new stock options ①A holder of the rights to subscribe for new shares may exercise the rights only within 10 days (if the tenth day falls on a holiday, then no later than the next business day) from the day following the day on which the holder of the rights to subscribe for new shares has lost the position of both the directors and the executive officers of the Company. ②The exercise of stock options shall be effected by collectively exercising all of the number of stock options allotted. ③In the event of the death of a holder of stock options who has been allotted, only one of the direct legal heirs of such holder of stock options may inherit the rights of such holder of stock options. ④Other conditions shall be as set forth in the "Stock Option Allotment Agreement" concluded between the Company and holders of stock options by resolution of the Board of Directors of the Company with respect to the issuance of stock options. 3 Matters concerning the delivery of the stock options in connection with the organizational restructuring In the event of a merger (limited to the case where we cease to exist due to a merger), an absorption-type demerger or an incorporation-type demerger (limited to the case where each of us becomes a split company), or a share exchange or a share transfer (limited to the case where each of us becomes a wholly-owned subsidiary) (hereinafter collectively referred to as "organizational restructuring"), the share warrants of the corporation (hereinafter referred to as "the restructured corporation") as set forth in Article 236, Paragraph 1, Item 8 (a) to (e) inclusive of the Companies Act shall be delivered to the holder of the share warrants who holds the share warrants which remain immediately before the effective date of the organizational restructuring. ①Type of stock of the Company to be restructured to be subject to the stock options The type of stock shall be common stock of the Company to be restructured. ②Number of restructured companies subject to stock options Decisions shall be made in accordance with (NOTE) 1 above after taking into consideration the conditions of the organizational restructuring. ③Assets to be contributed at the time of exercise of the rights The value of assets to be contributed upon the exercise of each of the stock options to be delivered shall be the amount obtained by multiplying the exercise price after the realignment stipulated below by the number of shares of the restructured company subject to each of such stock options to be determined in accordance with ② above. The exercise price after the reorganization shall be one yen per share of the restructured company's shares that can be delivered by exercising each stock acquisition right to be delivered. ④Exercise period for the rights The period from the date of commencement of the period during which the stock options may be exercised or the effective date of the organizational restructuring, whichever is later, until the expiration date of the period during which the stock options may be exercised. ⑤Restriction on acquisition of stock options by transfer Acquisition of the rights to subscribe for new shares by transfer shall require approval by a resolution of the Board of Directors of the Company to be restructured.
―56―
(Translation) This document has been translated from the Japanese original for the convenience of overseas stakeholders. In the event of any discrepancy between this document and the Japanese original, the original shall prevail.
② 【Details of rights plan】 Not applicable.
③ 【Status of other stock acquisition rights】 Not applicable.
(3) 【Status of Exercise of Bonds with Stock Acquisition Rights with Exercise Price Adjustment, etc.】 Not applicable.
(4) 【Changes in the number of issued shares, capital stock, etc.】
Date July 15, 2021 (Note)
Number of Number of Balance of Change in legal Balance of legal shares shares Change in capital capital capital surplus capital surplus outstanding outstanding as (Millions of yen) (Millions of yen) (Millions of yen) (Millions of yen) increase/decrease the end of therm. -4,069,700
121,064,099
-
10,000
-
26,274
(NOTE) Decrease in shares due to cancellation of treasury stock. (5) 【Breakdown of Shareholders】 As of December 31, 2023 Status of Shares (100 shares per unit) Less than one GovernOverseas investors unit Classification ment/Local Financial Securities Other Individuals Status of Total Noncorporations public institution firms Individuals, and others Shares individuals entity Number of 1 58 48 320 356 71 23,510 24,364 - shareholders Number of shares held 10 331,665 43,121 163,822 517,336 284 153,259 1,209,497 114,399 (Unit) Percentage of number of 0.00 27.42 3.57 13.55 42.77 0.02 12.67 100.00 - shares held (%) (NOTE) 1 Treasury stock of 435,670 shares is included in "Individuals and others" and 4,356 units and 70 shares are included in "Shares less than one unit." 2 "Financial Institutions" includes 5,398 shares held by Japan Custody Bank, Ltd. (Trust Account E) as trust assets for the "Stock Benefit Trust (BBT=Board Benefit Trust)" (hereinafter referred to as "Stock Benefit Trust (BBT)") system, and 66 shares in "Shares of less than 1 unit." 3 "Other corporations" includes 60 units of shares in the name of the Japan Securities Depository Center, Inc.
―57―
(Translation) This document has been translated from the Japanese original for the convenience of overseas stakeholders. In the event of any discrepancy between this document and the Japanese original, the original shall prevail.
(6) 【Major Shareholders】
Shareholders
Address
As of December 31, 2023 Shareholding ratio to number of Number of shares outstanding Shares Held (excluding (thousands) treasury stock) (%)
The Master Trust Bank of Japan (Trust Account)
11-3 Hamamatsucho 2-chome, Minato-ku, Tokyo
18,404
15.26
Custody Bank of Japan (Trust Account)
8-12, Harumi 1-chome, Chuo-ku, Tokyo
8,961
7.43
Central Japan Railway Company
1-4, Meieki 1-chome, Nakamura-ku, Nagoya-shi, Aichi
5,171
4.29
4,247
3.52
BNYMSANV AS AGENT/CLIENTS LUX UCITS NON TRENTY 1 (Standing agent) MUFG Bank, Ltd.
VERTIGO BUILDING-POLARIS 2-4 RUE EUGENE RUPPERT L-2453 LUXEMBOURG GRAND DUCHY OF LUXENBOURG 7-1 Marunouchi 2-chome, Chiyoda-ku, Tokyo
FANUC CORPORATION
3580 Shibokusa, Oshinomura, Minamitsuru-gun, Yamanashi
3,760
3.12
Harmonic Drive Systems Inc.
25-3, Minami-Oi 6-chome, Shinagawa-ku, Tokyo
3,265
2.71
BBH (LUX) FOR FIDELITY FUNDSGLOBAL TECHNOLOGY POOL
2A RUE ALBERT BORS CHETTE LUXEMBOURG L-1246
2,947
2.44
2,109
1.75
2,104
1.74
2,078
1.72
53,045
43.97
(Standing agent) MUFG Bank, Ltd.
7-1 Marunouchi 2-chome, Chiyoda-ku, Tokyo
CREDIT SUISEE (LUXEMBOURG) S.A. / CUSTOMER ASSTS. FUNDS UCITS
- GRAND RUE L-1660 LUXEMBOURGS
(Standing agent) MUFG Bank, Ltd.
7-1 Marunouchi 2-chome, Chiyoda-ku, Tokyo
STATE SREET BANK WEST CLIENTTREATY 505234
1776 HERITAGE DRIVE, NORTH QUINCY, MA 02171, U.S.A.
(Standing agent) Mizuho Bank, Ltd.
15-1, Konan 2-chome, Minato-ku, Tokyo Shinagawa Intercity Tower A
THE BANK OF NEW YORK MELLON 140042
240 GREENWICH STREET, NEW YORK, NY 10286, U.S.A.
(Standing agent) Mizuho Bank, Ltd.
15-1, Konan 2-chome, Minato-ku, Tokyo Shinagawa Intercity Tower A
Total
-
(NOTE) 1 Number of shares held is rounded to the nearest thousand. 2 The following corporation submitted a report on the change of 6,137,000 shares by two companies on December 6, 2023. However, as the number of shares beneficially owned in the name of the said corporation cannot be confirmed as of December 31, 2023, it is not included in the above "Status of Major Shareholders."
- Sumitomo Mitsui Trust Asset Management Co., Ltd.
- Nikko Asset Management Co., Ltd., 3 The following corporation submitted a report on the change of 6,070,000 shares by 6 companies on December 20, 2023. However, as the number of shares beneficially owned in the name of the said corporation cannot be confirmed as of December 31, 2023, it is not included in the above "Status of Major Shareholders."
- BlackRock Japan Co., Ltd.
- BlackRock Fund Managers Limited
- BlackRock Fund Asset Management Ireland Limited
- BlackRock Fund Advisors
- BlackRock Institutional Trust Company, N.A.
- BlackRock Investment Management (UK) Limited
―58―
(Translation) This document has been translated from the Japanese original for the convenience of overseas stakeholders. In the event of any discrepancy between this document and the Japanese original, the original shall prevail.
(7) 【Status of voting rights】 ① 【Shares outstanding】 Classification
Number of shares -
-
-
-
-
-
-
-
-
Non-voting stock Shares with restricted voting rights (Treasury stocks) Shares with restricted voting rights (other) Shares with full voting rights (treasury stock, etc.) Shares with full voting rights (other) Shares less than one unit
As of December 31, 2023
Number of voting rights
(Treasury stock held) Common shares 435,600 (Mutually Held Shares) Common shares 15,000 Common shares 120,499,100 Common shares 114,399
Number of shares outstanding
- - - 1,204,991
-
- Shares less than one unit (100 shares)
-
121,064,099
Voting rights of all shareholders
Content
-
-
1,204,991
-
(NOTE) 1 Common shares in the "Shares less than 1 unit" column include 70 shares of treasury stock owned by the Company and 66 shares of our stock owned by Japan Custody Bank, Ltd. (Trust Account E) as trust assets under the "Stock Benefit Trust (BBT)" plan. 2 "Shares with full voting rights (other)" column includes 6,000 shares (60 voting rights) in the name of the Japan Securities Depository Center, Inc. and 589,800 shares (5,898 voting rights) of ours owned by the Japan Custody Bank, Ltd. (Trust Account E) as trust assets for the "Stock Benefit Trust (BBT)" plan. The 5,898 voting rights are not exercised. ② 【Treasury stock】 Owner's name
Address of the holder
(Treasury stock held) Nabtesco Corporation
7-9, Hirakawacho 2-chome, Chiyoda-ku, Tokyo 7-20 Motomachi-dori 5chome, Chuo-ku, Kobe-shi, Hyogo
(Mutually Held Shares) Kyokko Denki Co., Ltd. 計
Number of treasury stock
-
As of December 31, 2023 Ratio of shares Number of Total number of held to total shares held in shares to be number of the name of own shares others outstanding (%)
435,600
-
435,600
0.36
15,000
-
15,000
0.01
450,600
-
450,600
0.37
(NOTE) The above numbers of shares held do not include 589,800 shares of our company owned by Japan Custody Bank, Ltd. (Trust Account E) as trust assets under the "Stock Benefit Trust (BBT)" plan.
―59―
(Translation) This document has been translated from the Japanese original for the convenience of overseas stakeholders. In the event of any discrepancy between this document and the Japanese original, the original shall prevail.
(8) 【Details of executive and employee stock ownership plans】 ① Outline of Directors' and Employees' Stock Ownership Plan
We have introduced a Stock Benefit Trust (BBT) (the "Plan") as a stock-based compensation plan for our directors and executive
officers (excluding outside directors) (hereinafter referred to as "Directors, etc."). Under this system, shares of the Company are acquired through a trust (hereinafter referred to as the "Trust") using money to
be contributed by the Company. Under this system, shares of the Company are awarded points (hereinafter referred to as "Share Grant Points") each year according to position, performance, etc. based on the Directors' Share Benefit Regulations established by the Company, and cash equivalent to the amount of the Company's shares and the liquidation proceeds of the Company's Shares (hereinafter referred to as "Shares of the Company") is awarded or benefits through the Trust (hereinafter referred to as "Grant Points") according to the number of such Share Grant Points at a predetermined time. The grants under this system include "grants at the time of service" in which points are awarded to directors in conjunction with the degree of achievement of the medium-term management plan, and "grants at the time of service" in which shares are awarded to directors, etc. at a certain time during their service, and "grants at the time of retirement" in which points are awarded to directors, etc. at the time of retirement. ②Total number of shares to be acquired by directors, etc. 589,866 shares
③ Scope of persons entitled to receive beneficial interest or other rights under the said officer's and employee's stock ownership plan Directors, etc. who satisfy the requirements for beneficiaries set forth in the Regulations Governing the Transfer of Shares by Directors
―60―
(Translation) This document has been translated from the Japanese original for the convenience of overseas stakeholders. In the event of any discrepancy between this document and the Japanese original, the original shall prevail.
2 【Status of acquisition of treasury stock】 【Class of Share】
Acquisition of common shares pursuant to Item 7, Article 155 of the Companies Act
(1) 【Status of Acquisition by Resolution at the General Meeting of Shareholders】 Not applicable
(2) 【Status of acquisition by resolution of the Board of Directors】 Not applicable.
(3) 【Details of items that are not based on a resolution of the shareholders' meeting or a resolution of the Board of Directors】 Classification
Number of shares
Treasury stock acquired in the current fiscal year Treasury stock acquired during the period
Total value (yen) 1,033
2,927,712
-
-
(NOTE) Shares of less than one unit purchased from March 1, 2024 to the filing date of the Annual Securities Report are not included in the repurchased shares during the period under review
(4) 【Disposal and holding of treasury stock acquired】
Classification Acquired treasury stock offered to subscribers Acquired treasury stock disposed of by retirement Acquired treasury stock transferred in connection with the merger, share exchange, share issuance, and company split
Current fiscal year Number of shares
Current term
Total value disposed Total value disposed Number of shares (Yen) (Yen)
-
-
-
-
-
-
-
-
-
-
-
-
Others (Note 2)
307,200
1,381,526,064
-
-
Number of treasury stock held (Note 3)
435,670
-
435,670
-
(NOTE) 1 The number of treasury stocks held during the current period does not include the number of treasury stocks purchased and disposed of from March 1, 2024 to the filing date of the Annual Securities Report. 2 The breakdown for the current fiscal year is due to the disposition by a third-party allotment (300,000 shares, 1,349,136,000 yen) and the exercise of stock options (7,200 shares, 32,390,064 yen) to the Japan Custody Bank, Ltd. (Trust Account E) through an additional contribution to the Stock Benefit Trust (BBT). 3 589,866 shares of our company owned by Japan Custody Bank, Ltd. (Trust Account E) as trust assets under the "Stock Benefit Trust (BBT)" plan are not included in the above-mentioned treasury stock holdings.
―61―
(Translation) This document has been translated from the Japanese original for the convenience of overseas stakeholders. In the event of any discrepancy between this document and the Japanese original, the original shall prevail.
3 【Dividend Policy】 Based on the performance of our Group as a whole, we strive to ensure strategic growth investment, financial soundness, balance shareholder returns, and appropriately allocate corporate earnings in consideration of stable dividends. In addition, as a dividend policy during the period of the Medium-Term Management Plan up to Fiscal Year 2024, we aim to achieve a consolidated dividend payout ratio of 35% or more and to continuously increase the amount of dividends per share without setting a cap. Based on the above policy, the 21st Ordinary General Meeting of Shareholders on March 26, 2024 resolved to pay a year-end dividend of 40 yen per share. As a result, the annual dividend, together with the interim dividend (40 yen per share), is set at 80 yen per share. For the next fiscal year, we plan to pay an annual dividend of 80 yen per share (interim dividend of 40 yen and year-end dividend of 40 yen). The Company plans to pay dividends twice a year on the record dates of June 30 and December 31. The Articles of Incorporation stipulate that we may pay interim dividends as set forth in Paragraph 5 of Article 454 of the Companies Act. (NOTE) Dividends of retained earnings with record dates in the current fiscal year are as follows: Total dividends Dividends per share Date of resolution (Millions of yen) (Yen) July 31, 2023 4,813 40 Board of Directors March 26, 2024 Annual Shareholders' 4,825 40 Meeting
―62―
(Translation) This document has been translated from the Japanese original for the convenience of overseas stakeholders. In the event of any discrepancy between this document and the Japanese original, the original shall prevail.
4 【Status of Corporate Governance】 (1) 【Overview of Corporate Governance】 ① Basic Approach to Corporate Governance On the basis of our corporate philosophy of “providing safety, comfort and a sense of security in daily lives as well as any form of transportation with our unique motion control technology,” the Nabtesco Group will endeavor to strengthen its corporate governance by practicing the Nabtesco Way, in order to achieve sustained growth of the group, enhance corporate value over the medium and long term and earn greater trust from our stakeholders. We have developed the “Nabtesco Corporate Governance Basic Policy” by taking fully into account the intent and spirit of the Corporate Governance Code prescribed by Tokyo Stock Exchange, Inc. ②
Overview of Corporate Governance Structure Our business operations are conducted based on the executive officer system and in-house company system, and we have established the Board of Directors, Executive Officers, Audit & Supervisory Board Members, Accounting Auditors, and the Management Committee to deliberate on important matters related to the execution of business operations. The Management Committee clearly distinguishes the functions of management decision-making, supervision, execution and management oversight.
- Basic Explanation of the Company's Organization [Board of Directors] The Board of Directors formulates the Group’s basic policies and strategies, makes decisions about the execution of important business matters and supervises the way business is carried out. It shall be composed of up to ten Directors, with at least one-third of them being independent outside directors. The number of members of the Board of Directors is limited to 10, of which at least one-third are independent outside directors. As of the date of submission, the Board of Directors consisted of 10 members, including five independent outside directors. The Board of Directors received reports on our basic management policy, matters related to important business execution, resolutions on matters stipulated in laws and the Articles of Incorporation, and the status of the execution of important business. In principle, the Board of Directors meets once a month, and 16 meetings were held in Fiscal Year 2023. Attendance by individual directors in the current fiscal year is as follows. Attendance/number of Name, etc meetings (Note 1) Chairman of the Board
Katsuhiro Teramoto (Note 2)
16 times /16 times
Representative Director
Kazumasa Kimura
16 times /16 times
Atsushi Habe
16 times /16 times
Toshiya Fujiwara
16 times /16 times
Seiji Takahashi (Note 3)
12 times/12 times
Akiyoshi Kitamura (Note 4)
4 times/4 times
Mari Iizuka
15 times/16 times
Naoko Mizukoshi
16 times /16 times
Naoki Hidaka
16 times /16 times
Toshiya Takahata
15 times/16 times
Seiichiro Shirahata (Note 3)
12 times/12 times
Norio Uchida (Note 4)
4 times/4 times
Director
Outside Directors
(NOTE)1 Figures are based on the number of meetings held during the period of service. 2 Retired on March 26, 2024. 3 Appointed on March 23, 2023. 4 Retired on March 23, 2023.
[Executive Officers Committee] A body devoted to the execution of business pursuant to the policies and strategies of the Board of Directors and under the supervision of the Board. The current Executive Officers Committee is composed of 24 Executive Officers. [Audit & Supervisory Board] The Audit & Supervisory Board audits the execution of duties of the Board of Directors and prepares Audit Reports. As a way of strengthening audit functions of the Group in line with the reinforcement of the Group management, the Audit & Supervisory Board has strengthened its audit system by establishing the Group Audit & Supervisory Board, membership of which includes the Audit & Supervisory Board Members of the Group companies. The Audit & Supervisory Board shall be composed of five or less Audit & Supervisory Board Members, of whom half or more of the members shall be Audit & Supervisory Board Members (Independent). The current Audit & Supervisory Board is composed of five members including three Audit & Supervisory Board Members (Independent). [Management Committee] In line with the policies decided by the Board of Directors, the Management Committee serves as the body that discusses
―63―
(Translation) This document has been translated from the Japanese original for the convenience of overseas stakeholders. In the event of any discrepancy between this document and the Japanese original, the original shall prevail.
important matters relating to execution of the Group’s business and reports on results and the execution of business. It is composed of the President (CEO), the Presidents of the in-house companies, Executive Officers of Corporate Headquarters, and Senior General Managers, etc. [Nomination Committee] The Company established the Nominating Committee as a consultative body of the Board of Directors to deliberate on the nomination of candidates for Director, Audit & Supervisory Board Member, President (CEO) and Representative Director positions as well as a successor plan for the new President (CEO), etc., and to report the results to the Board of Directors. The Nominating Committee is composed of five or fewer members, including one internal director and three or more independent outside directors. As of the date of submission, there were five independent outside directors, including four outside directors, as follows: Chairman: Mari Iizuka (Outside Director) Member: Naoko Mizukoshi (Outside Director), Naoki Hidaka (Outside Director), Tetsuro Hirai (Outside Audit & Supervisory Board Member), Kazumasa Kimura (Representative director) In the fiscal year under review, we held three meetings of the Nominating Committee, which mainly deliberated on the appointment of executive officers and director candidates in Fiscal Year 2024, and reported to the Board of Directors. Attendance by individual members is as follows. Attendance/number of meetings (Note 1)
Name, etc Chairman of the Board (Chairman)
Katsuhiro Teramoto (Note 2)
3 times/3 times
Outside Director
Mari Iizuka
3 times/3 times
Naoko Mizukoshi
3 times/3 times
Naoki Hidaka
3 times/3 times
Tetsuro Hirai
3 times/3 times
Outside Audit & Supervisory Board Member
(NOTE) 1 Figures are based on the number of meetings held during the period of service. 2 Retired on March 26, 2024.
[Remuneration Committee] The Remuneration Committee, as a consultative body of the Board of Directors, deliberates on remuneration of the management team, etc. and reports the results to the Board of Directors The Remuneration Committee is composed of five or fewer members, including 1 internal director and three or more independent outside directors. As of the date of submission, there were five independent outside directors, including four outside directors, as follows: Chairman: Naoko Mizukoshi (Outside Director) Member: Mari Iizuka (Outside Director), Toshiya Takahata (Outside Director), Masatoshi Hitomi (Outside Audit & Supervisory Board Member), Kazumasa Kimura (Representative director) In the fiscal year under review, the Compensation Committee met twice to discuss and report to the Board of Directors on the remuneration of directors in Fiscal Year 2023 based on the perspectives of the remuneration system and the concept of performance-linked remuneration as indicators. Attendance by individual members is as follows. Attendance/number of meetings Name, etc (Note 1) Chairman of the Board Katsuhiro Teramoto (Note 2) 2 times/2 times (Chairman) Outside Director
Outside Audit & Supervisory Board Member
Mari Iizuka
1 time /2 times
Naoko Mizukoshi
2 times/2 times
Toshiya Takahata
2 times/2 times
Takemi Nagasaka (Note 2)
2 times/2 times
(NOTE) 1 Figures are based on the number of meetings held during the period of service. 2 Retired on March 26, 2024.
―64―
(Translation) This document has been translated from the Japanese original for the convenience of overseas stakeholders. In the event of any discrepancy between this document and the Japanese original, the original shall prevail.
[Compliance Committee] The Compliance Committee as a consultative body of the Board of Directors establishes and revises the “Nabtesco Group Code of Ethics” and deliberates priority challenges concerning the Group’s compliance system, and reports the results to the Board of Directors. The Compliance Committee is composed of members including independent outside directors and outside experts. As of the date of filing, the composition of the Compliance Committee is as follows: Chairman: Kazumasa Kimura (Representative director) Member: Atsushi Habe, Toshiya Fujiwara, Shoji Ijuin, Tomoaki Shiramizu, Tomohiro Kiriyama, Yasuhiro Tanabe (Outside Audit & Supervisory Board Member), Makoto Matsuo (Partner of MOMO-O, MATSUO & NAMBA) [Business Auditing Department (eight members)] The Business Auditing Department conducts internal business audits of Corporate Headquarters, internal companies and Group companies. 2) Corporate Governance Related Diagram
- Current Status of Internal Control System Based on its Basic Polices for the Construction of an Internal Control System, Nabtesco is working to enhance all the areas associated with internal control—such as increased efficiency of management, compliance, information management, risk management and collaboration with the Audit & Supervisory Board Members under consistent principles, and integrate them to construct an internal control system. Outline of the Basic Policy for Establishing an Internal Control System Internal control for the Nabtesco Group shall be based on making The Nabtesco Way and the Nabtesco Group Code of Ethics cornerstones of proper and fair business activities, and requiring the Group’s directors, Audit & Supervisory Board Members and employees to comply with these norms and rules. The Chief Executive Officer (CEO) shall be the top executive responsible for the promotion of internal control. The Board of Directors shall examine the maintenance of internal control systems on a continual basis in line with changes in the business environment and social needs, revisions to laws and regulations, risk diversification and other factors, and shall conduct a review yearly and whenever else necessary.
―65―
(Translation) This document has been translated from the Japanese original for the convenience of overseas stakeholders. In the event of any discrepancy between this document and the Japanese original, the original shall prevail.
- Corporate Ethics Implementation and Thorough Implementation We have established the Nabtesco Group Code of Ethics in order to ensure that the entire Group will behave in a manner rooted in a higher sense of ethics, and we are working to implement and thoroughly implement corporate ethics. In addition, the Legal and Compliance Department, which is dedicated to compliance, promotes activities aimed not only at complying with laws and regulations, but also at establishing a higher standard of corporate ethics with the aim of enhancing the Group's corporate value over the medium to long term. In addition, we have established the Corporate Ethics Hotline and the Corporate Auditor Hotline to prevent and detect misconduct caused by violations of laws or illegal activities in our Group. Through the collection of information that is not reported on the ordinary line of office and appropriate measures, we are improving the self-cleansing function of the organization and ensuring social trust. ③ Risk Management System We have systems in place to ensure that profits, losses, asset efficiency, quality and disasters, among other matters, are reported to the Board of Directors properly and in a timely manner with respect to the execution of duties. By leveraging these systems, we strive for the early identification of risks and the minimization of losses. In order to eliminate antisocial forces, the Nabtesco Group Code of Ethics stipulates that the Nabtesco Group should cease any relationship with antisocial forces, and should an unreasonable demand from an antisocial force arise, it should take a firm stance, and that it should not respond to such demands. The Nabtesco Group strives to strengthen relations by, for example, obtaining the latest information on antisocial forces and receiving advice through daily cooperation with the police and antiviolence organizations, etc. Committees organized for the purpose of risk management include the following: [Management Materiality Committee] Through the identification of management materiality in our group, the formulation of action plans for materiality, and the management of progress, we aim to realize our long-term vision and improve our social, environmental, and economic value from both financial and non-financial perspectives from a long-term perspective. [Quality and PL Committee] Quality control and PL (Product Liability of products within our Group: Product safety control related to product liability) The objective of this system is to maintain and improve quality and ensure safety by establishing organizational and management standards for preventing quality defects, including safety defects, and for responding appropriately in the event of quality defects or PL issues. The system also aims to ensure the reliability of customers and contribute to the development of management. [ESH Committee] (Environment, Safety & Health: ESH) In addition to complying with basic policies concerning environmental preservation, safety, disaster prevention, and health, as well as domestic and overseas laws and regulations related to all of our business activities, from research and development to production, distribution, and sales of products, we have established standards for items that should be managed companywide, with the aim of ensuring the environmental preservation of the local community, the safety and health of employees and those engaged in business activities together with employees, and coexisting with the global environment, and fulfilling our corporate social responsibilities. [Risk Management Committee] The aim is to maintain and strengthen our group's risk management system by identifying major risks in our group, discussing countermeasures against them, and monitoring the status of risk management related to such risks.
[Information Security Committee] The aim is to establish basic rules for cyber security in our group and to promote efforts to improve the level of cyber security, and to respond swiftly in the event of a serious incident. ④ Status of Development of Systems to Ensure the Appropriateness of the Operations of Subsidiaries of the Reporting Company In addition to clarifying responsibilities and authority related to business execution in the Group Responsibility and Authority Regulations, our Group endeavors to execute business appropriately and efficiently by establishing a division of duties among each division. In addition, we have dispatched our officers and employees to our group companies as directors or corporate auditors to create a system that enables us to regularly and continuously comprehend important matters of our group companies, reports on business execution, monthly financial statements, and other details of the management of our group companies.
―66―
(Translation) This document has been translated from the Japanese original for the convenience of overseas stakeholders. In the event of any discrepancy between this document and the Japanese original, the original shall prevail.
⑤ Outline of limited liability agreement
As the Company stipulates in the Articles of Incorporation provisions to enable the conclusion of limited liability agreements with Outside Directors and Audit & Supervisory Board Members (Independent), a limited liability agreement has been concluded with Outside Directors Ms. Mari Iizuka, Ms. Naoko Mizukoshi, Mr. Naoki Hidaka, Mr. Toshiya Takahata, and Mr. Seiichiro Shirahata, and Audit & Supervisory Board Members (Independent) Messrs. Tetsuro Hirai, Masatoshi Hitomi, and Yasuhiro Tanabe. The details of the agreement are as follows. • Liability for damages under the agreement will be limited to 10 million yen or the amount set forth by laws and regulations, whichever is higher. • The limitation of liability mentioned above applies only if the Outside Director or Audit & Supervisory Board Member (Independent) acts in good faith and without gross negligence when performing their duties.
⑥ Matters concerning Directors and Officers liability insurance contract
The Company has a Directors and Officers liability insurance contract (management risk protection insurance contract) in effect, as stipulated in Article 430-3 of the Companies Act, covering all Directors, Audit & Supervisory Board Members and Executive Officers of the Company and all its subsidiaries. An overview of the said contract is as follows. • The contract covers the liability of the insured for legal dispute fees and compensation for damages, etc. arising from company lawsuits, third-party lawsuits, shareholder’s derivative suits, etc. • Damages, etc. arising from criminal acts, etc. by the insured are not covered as a measure to prevent the impairment of the appropriateness of execution of duties by the insured. • The Company is fully responsible for insurance fees under the said contract.
⑦ Fixed number of directors
The Articles of Incorporation stipulate that we have no more than 10 directors.
⑧ Selection of Directors
The Articles of Incorporation of the Company provide that the resolution for the election of directors at the general meeting of shareholders shall be made by a majority of the votes of shareholders present who hold one-third or more of the voting rights of shareholders who are entitled to exercise their voting rights and shall not be made by cumulative voting.
⑨ Items that can be resolved at the Board of Directors meeting
- Purchase of treasury stock
Pursuant to Paragraph 2 of Article 165 of the Companies Act, the Company's Articles of Incorporation provide that it may acquire its own shares by resolution of the Board of Directors. This is aimed at executing a flexible capital policy.
- Interim dividend Pursuant to Article 454, Paragraph 5 of the Companies Act, the Company's Articles of Incorporation provide that interim dividends may be paid by resolution of the Board of Directors. This is intended to provide flexible returns to shareholders.
- Exemption of Directors and Corporate Auditors from Liability The Company's Articles of Incorporation provide that, in the event of bona fide conduct and no gross negligence, the liability of directors and corporate auditors may be exempted from such liability within the limit set by laws and regulations by a resolution of the Board of Directors pursuant to the provisions of Paragraph 1 of Article 426 of the Companies Act. This is aimed at enabling directors and corporate auditors to fully fulfill their expected roles. ⑩ Requirements for Special Resolution at Shareholders Meetings
The Articles of Incorporation of the Company stipulate that the resolutions of general meetings of shareholders pursuant to the provisions of Article 309, Paragraph 2 of the Companies Act shall be adopted by two-thirds or more of the voting rights of shareholders present who hold one-third or more of the voting rights of shareholders who are entitled to exercise their voting rights. This is intended to facilitate the smooth operation of the General Meeting of Shareholders.
―67―
(Translation) This document has been translated from the Japanese original for the convenience of overseas stakeholders. In the event of any discrepancy between this document and the Japanese original, the original shall prevail.
(2) 【Directors and Audit & Supervisory Board Members】 ① Directors and Audit & Supervisory Board Members 13 male and 2 female within management (Female ratio in management: 13.3%) Position Name
Position Name
Date of birth
Brief history
Jun. 2011
Representative Director Chief Executive Kazumasa Aug. 17, Kimura 1961 Officer (CEO)
Representative Director Senior Managing Executive Officer, Corporate Planning, Accounting & Finance, Information Systems and Corporate Communication
Atsushi Habe
Nov. 27, 1959,
Director Managing Executive Officer, Component Solution Segment, President, Toshiya Precision Fujiwara Equipment Company, and in charge of Production Innovation
Mar. 3, 1960
Term
General Manager, Manufacturing Department, Tsu Plant, Precision Equipment Company of Nabtesco Corporation Jun. 2012 General Manager, Manufacturing department, Tarui Plant, Power Control Company of Nabtesco Corporation Apr. 2015 Representative Director and Vice President of Hyest Corporation (merged into Nabtesco Corporation in Apr. 2016) Mar. 2016 General Manager, Production Management Department, Power Control Company of Nabtesco Corporation Mar. 2017 Executive Officer and President, Power Control Company of Nabtesco Corporation Note 3 Jan. 2019 Executive Officer, Corporate Planning, Accounting & Finance, Information System and Corporate Communication of Nabtesco Corporation Mar. 2019 Director of Nabtesco Corporation Jan. 2021 Managing Executive Officer, Component Solution Segment, Senior General Manager, Technology and R&D Division, and in charge of Production Innovation of Nabtesco Corporation Jan. 2022 Assistant to Chief Executive Officer of Nabtesco Corporation Mar. 2022 Representative Director (to present), President (to present), and Chief Executive Officer of Nabtesco Corporation (to present) Sep. 2006 General Manager, International Sales Department, Aerospace Company of Nabtesco Corporation Jun. 2011 General Manager, Planning Department, Aerospace Company of Nabtesco Corporation Nov. 2012 General Manager, Planning Department, Precision Equipment Company of Nabtesco Corporation Feb. 2016 General Manager, Sales Department, Precision Equipment Company of Nabtesco Corporation Oct. 2016 General Manager, Sales Promotion Department, Precision Equipment Company of Nabtesco Corporation Mar. 2017 Executive Officer of Nabtesco Corporation Mar. 2018 Vice President and General Manager, Sales Promotion Department, Precision Equipment Company of Nabtesco Corporation Note 3 Jan. 2019 President, Precision Equipment Company of Nabtesco Corporation Jan. 2020 Managing Executive Officer of Nabtesco Corporation Jan. 2021 Corporate Planning, Accounting & Finance, Information Systems, Business Transformation and Corporate Communication of Nabtesco Corporation Mar. 2021 Director of Nabtesco Corporation Jan. 2023 Corporate Planning, Accounting & Finance, Information Systems and Corporate Communication of Nabtesco Corporation (to present) Mar. 2023 Representative Director of Nabtesco Corporation (to present) Jan. 2024 Senior Managing Executive Officer of Nabtesco Corporation (to present) Jul. 2013 General Manager, Manufacturing Department, Tsu Plant, Precision Equipment Company of Nabtesco Corporation Mar. 2017 Plant Manager, Tsu Plant and General Manager, General Administration Department, Precision Equipment Company of Nabtesco Corporation Jan. 2019 Executive Officer of Nabtesco Corporation Jan. 2020 Responsible for production, Plant Manager, Tsu Plant and General Manager, General Administration Department, Precision Equipment Company, Project Leader, Hamamatsu Plant construction project of Nabtesco Corporation Jan. 2021 President, Precision Equipment Company of Nabtesco Corporation Note 3 Jan. 2022 Managing Executive Officer (to present), Component Solution Segment, President, Precision Equipment Company, and in charge of Production Innovation of Nabtesco Corporation
Mar. 2022 Director (to present), Managing Executive Officer,
Component Solution Segment, President, Precision Equipment Company, and in charge of Production Innovation and Hamamatsu Plant Construction Project of Nabtesco Corporation
Jan. 2024
Managing Executive Officer, Component Solution Segment, President, Precision Equipment Company, and in charge of Production Innovation of Nabtesco Corporation (to present)
―68―
Number of shares of the Company held
6,115
9,784
2,561
(Translation) This document has been translated from the Japanese original for the convenience of overseas stakeholders. In the event of any discrepancy between this document and the Japanese original, the original shall prevail.
Position Name
Position Name
Date of birth
Brief history
Jun. 2010 Jul. 2015 Aug. 2017 Director, President, Accessibility Innovations Company
Seiji Takahashi
Feb. 12, 1966
Mar. 2018 Jan. 2021 Jan. 2022 Jan. 2023 Mar. 2023 Apr. 2008 Jun. 2015 Feb. 2017 Apr. 2017 May 2017
Director, President, Power Control Company
Kiyoshi Ando
Jan. 10, 1964
May 2018 Jul. 2018 Jan. 2019 Jan. 2020 Jan. 2021 Mar. 2024 Apr. 1982
Director
Mari Iizuka
Mar. 29, 1959
Aug. 1987 Jul. 1992 Apr. 2005 Apr. 2007 Apr. 2008 Apr. 2010 Mar. 2020 Apr. 1995 Apr. 1998 Sep. 1999
Director
Naoko Sep. 23, Mizukoshi 1967
Sep. 2002 Nov. 2006 Jan. 2008 Mar. 2010 Jun. 2018 Dec. 2018 Mar. 2020
General Manager, Human Resources Department of Nabtesco Corporation General Manager, Human Resources Department of Nabtesco Corporation and President of Nabtesco Link Co., Ltd General Manager, Human Resources Department, Business Transformation Division of Nabtesco Corporation and President of Nabtesco Link Co., Ltd Executive Officer of Nabtesco Corporation Vice President, Accessibility Innovations Company, and in charge of Business Management of Nabtesco Corporation Vice President, Accessibility Innovations Company of Nabtesco Corporation Managing Executive Officer (to present), President, Accessibility Innovations Company of Nabtesco Corporation (to present) Director of Nabtesco Corporation (to present) General Manager, Development Department, Precision Equipment Company of Nabtesco Corporation Executive Officer of Nabtesco Corporation (to present) Technology and R&D Division, in charge of European business of Nabtesco Corporation Technology and R&D Division, in charge of European business, and General Manager, Advanced Mobility System Division of Nabtesco Corporation Technology and R&D Division, in charge of European business, and General Manager of Advanced Mobility System Division of Nabtesco Corporation and President of Nabtesco Europe GmbH Technology and R&D Division, in charge of European business, and General Manager, Advanced Mobility System Division of Nabtesco Corporation Deputy Senior General Manager, Technology and R&D Division, in charge of Innovation, and General Manager, Advanced Mobility System Division of Nabtesco Corporation Deputy Senior General Manager, Technology and R&D Division, in charge of Innovation of Nabtesco Corporation Deputy Senior General Manager, Technology and R&D Division of Nabtesco Corporation President, Power Control Company of Nabtesco Corporation (to present) Director of Nabtesco Corporation (to present) Joined Henkel Hakusui Corporation (current Henkel Japan Ltd.) Joined The World Bank Asian Institute of Management Graduate school of Business Assistant Professor of Ritsumeikan Asia Pacific University Graduate School of Management Associate Professor of Ritsumeikan Asia Pacific University Graduate School of Management Professor of Ritsumeikan Asia Pacific University Graduate School of Management Professor of Doshisha Business School (to present) Director of Nabtesco Corporation (to present) Registered at Osaka Bar Association Joined Miyazaki Law Firm Registered at Yokohama Bar Association (current Kanagawa Bar Association) Joined Nomura Research Institute, Ltd Registered at Dai-ni Tokyo Bar Association Joined Autodesk Co., Ltd. Registered at the State of California Bar Joined Microsoft Co., Ltd. (current Microsoft Japan, Co., Ltd.) Joined TMI Associates Partner of TMI Associates Partner of Endeavour Law Office External Director of TIS Inc. (to present) Partner of Leftright Law & IP (to present) Director of Nabtesco Corporation (to present)
―69―
Term
Number of shares of the Company held
Note 3
3,680
Note 3
8,341
Note 3
151
Note 3
182
(Translation) This document has been translated from the Japanese original for the convenience of overseas stakeholders. In the event of any discrepancy between this document and the Japanese original, the original shall prevail.
Position Name
Position Name
Date of birth
Brief history
Term
Number of shares of the Company held
Note 3
455
Note 3
212
Note 3
-
Note 4
13,470
Note 5
1,956
Note 4
-
Apr. 1976 Joined SUMITOMO CORPORATION Apr. 2001 General Manager, Chicago Branch, Sumitomo Corporation of U.S.A. Apr. 2007 Executive Officer, General Manager of Metal Products for Automotive Industry Division of SUMITOMO CORPORATION
Apr. 2009 Managing Executive Officer, Head of Chubu Block of SUMITOMO CORPORATION
Apr. 2012 Senior Managing Executive Officer, Head of Kansai Block of SUMITOMO CORPORATION
Director
Naoki Hidaka
May 16, 1953
Jun. 2013 Representative Director, Senior Managing Executive Officer, and Apr. 2015 Jun. 2018 Jun. 2019 Jun. 2020 Mar. 2021 Jun. 2022 Apr. 1986 Apr. 2012 Jun. 2014 Jun. 2015
Director
Toshiya Takahata
Jun. 2016
Nov. 19, Oct. 2018 1963
Apr. 2019 Jun. 2019 Apr. 2020
Mar. 2022 Apr. 1983 Apr. 2009 Apr. 2013 Apr. 2015
Director
Seiichiro Shirahata
Mar. 3, 1961
Jan. 2018 Mar. 2018 Mar. 2020 Jan. 2022 Mar. 2023 Jun. 2010
Audit & Koji Supervisory Board Nakano Members
Jun. 2015
Jan. 2, 1962,
Mar. 2018 Jan. 2022 Mar. 2023 Jun. 2009 Jun. 2011 Jul. 2013
Audit & Yasuhito May 10, May 2014 Supervisory Board Nakagawa 1963 Members Jan. 2016 Jan. 2020
Mar. 2024 Apr. 1980 Jan. 2006
Audit & Supervisory Board Members (Independent)
Tetsuro Hirai
Dec. 19, Jan. 2008 1955 Jun. 2010
Jun. 2011 Apr. 2018 Mar. 2019
General Manager, Transportation & Construction Systems Business Unit of SUMITOMO CORPORATION Representative Director, Executive Vice President, Executive Officer, and General Manager, Transportation & Construction Systems Business Unit of SUMITOMO CORPORATION Special Adviser of SUMITOMO CORPORATION Adviser of SUMITOMO CORPORATION (retired in March 2020) Outside Director of BROTHER INDUSTRIES, LTD. (to present) Director of Nabtesco Corporation (to present) Outside Director of TOPCON CORPORATION (to present) Joined Seiko Epson Corporation Deputy Chief Operating Officer, Printer Operations Division of Seiko Epson Corporation Executive Officer of Seiko Epson Corporation General Administrative Manager, Intellectual Property Division of Seiko Epson Corporation Executive Officer of Seiko Epson Corporation (retired in March 2021) General Administrative Manager, Corporate Planning Division of Seiko Epson Corporation General Administrative Manager, DX Division of the Seiko Epson Corporation Director of Seiko Epson Corporation (retired in June 2021) General Administrative Manager, Corporate Strategy Division, General Administrative Manager, Sustainability Promotion Office of Seiko Epson Corporation Director of Nabtesco Corporation (to present) Joined Nippon Paint Co., Ltd. (current Nippon Paint Holdings Co., td.) Division Director, Surface Treatment of Nippon Paint Co.,Ltd. Executive Officer of Nippon Paint Co., Ltd. Senior Executive Officer of Nippon Paint Holdings Co., Ltd. President, Representative Director of the Board of Nippon Paint Surf Chemicals Co., Ltd. Vice President of Nippon Paint Holdings Co., Ltd. President, Representative Director of the Board of Nippon Paint Marine Coatings Co., Ltd Vice President, Director of the Board of Nippon Paint Holdings Co.,Ltd Vice President of Nippon Paint Holdings Co., Ltd Adviser of Nippon Paint Holdings Co., Ltd. (retired in December 2022) Director of Nabtesco Corporation (to present) General Manager, Accounting & Finance Department of Nabtesco Corporation General Manager, Corporate Planning Department of Nabtesco Corporation General Manager of Shanghai Nabtesco Hydraulic Co., Ltd. Executive Officer of Nabtesco Corporation Executive Officer, Business Audit of Nabtesco Corporation Audit & Supervisory Board Member of Nabtesco Corporation (to present) General Manager, Manufacturing Department, Tsu Plant, Precision Equipment Company of Nabtesco Corporation Plant Manager, Tsu Plant, Precision Equipment Company of Nabtesco Corporation Senior Manager, Assistant to General Manager, Production Innovation Division of Nabtesco Corporation Senior Manager, assistant to President, Precision Equipment Company of Nabtesco Corporation President, Nabtesco (China) Precision Equipment Co., Ltd. Executive Officer (to present) and General Manager, Production Innovation Division (to present) of Nabtesco Corporation Audit & Supervisory Board Member of Nabtesco Corporation (to present) Joined Toyota Motor Co., Ltd. (current Toyota Motor Corporation) General Manager, Vehicle Planning Department, Global Strategic Production Planning Division and Project General Manager of China Division of Toyota Motor Corporation General Manager, Machinery Division, Motomachi Plant of Toyota Motor Corporation (retired in Jun. 2010) Executive Officer of Toyota Tsusho Corporation Managing Executive Officer of Toyota Tsusho Corporation Technical Supervisor of Toyota Tsusho Corporation Audit & Supervisory Board Member of Nabtesco Corporation (to present)
―70―
(Translation) This document has been translated from the Japanese original for the convenience of overseas stakeholders. In the event of any discrepancy between this document and the Japanese original, the original shall prevail.
Position Name
Position Name
Date of birth
Brief history
Term
Number of shares of the Company held
Note 5
1,000
Note 5
-
Apr. 1981 Joined Sony Corporation (current Sony Group Corporation) Mar. 2003 General Manager, Production Planning Department, Microsystems Network Company of Sony Corporation
Feb. 2006 Representative Director and CFO of S-LCD Corporation (current Samsung Display
Audit & Supervisory Board Masatoshi Members Hitomi (independent)
Apr. 2009 Director, General Manager, Planning Management Department of Sony
Nov. 9, 1957
Sep. 2010 Feb. 2015 Jul. 2016 Mar. 2017 Jan. 2020 Mar. 2024 Apr. 1987 May 2010 Dec. 2010 Jul. 2012 Apr. 2013 Jan. 2014
Audit & Supervisory Board Yasuhiro Members Tanabe (independent)
Nov. 7, 1960
Nov. 2014 Dec. 2015 Jun. 2017 Nov. 2019 Apr. 2021 Jun. 2022 Oct. 2023 Nov. 2023 Dec. 2023 Mar. 2024
Energy Devices Corporation EVP & CFO of Sony Electronics Inc The Audit Committee Aide of Sony Corporation General Manager, Administration Department of Soliton Systems K.K Director, General Manager, Administration Department of Soliton Systems K.K. (retired in March 2020) Outside Director of JAI A/S (to present) Audit & Supervisory Board Member of Nabtesco Corporation (to present) Appointed Public Prosecutor Deputy General Manager, Special Trial Department of Tokyo District Public Prosecutors Office Deputy Superintending Prosecutor of Sendai District Public Prosecutors Office General Manager, Special Trial Department of Tokyo District Public Prosecutors Office General Manager, Criminal Affairs Department of Tokyo District Public Prosecutors Office General Manager, Criminal Affairs Department of Tokyo High Public Prosecutors Office Chief Prosecutor of Naha District Public Prosecutors Office Deputy Superintending Prosecutor of Osaka District Public Prosecutors Office Deputy Superintending Prosecutor of Osaka High Public Prosecutors Office Chief Prosecutor of Osaka District Public Prosecutors Office Superintending Prosecutor of Sapporo High Public Prosecutors Office Superintending Prosecutor of Fukuoka High Public Prosecutors Office (retired in July 2023) Special Advisor, National Institute of Advanced Industrial Science and Technology (to present) Registered at Dai-ni Tokyo Bar Association Joined Tokyo Fuji Law Office (to present) Audit & Supervisory Board Member of Nabtesco Corporation (to present) Total
47,907
(NOTE)1 Directors of Mari Iizuka, Naoko Mizukoshi, Naoki Hidaka, Toshiya Takahata and Seiichiro Shirahata are independent outside directors. 2 Audit & Supervisory Board Members of Tetsuro Hirai, Masatoshi Hitomi and Yasuhiro Tanabe are independent. 3 From the close of the ordinary general meeting of shareholders held on March 26, 2024 to the close of the ordinary general meeting of shareholders for the fiscal year ending December 31, 2024. 4 From the close of the ordinary general meeting of shareholders held on March 23, 2023 to the close of the ordinary general meeting of shareholders for the fiscal year ending December 31, 2026. 5 From the close of the ordinary general meeting of shareholders held on March 26, 2024 to the close of the ordinary general meeting of shareholders for the fiscal year ending December 31, 2027. 6 Skill matrix of specialization of each Directors and Audit & Supervisory Board Members are as follows.
Level of independence
Directors Audit & Supervisory d
Kazumasa Kimura Atsushi Habe Toshiya Fujiwara Seiji Takahashi Kiyoshi Ando Mari Iizuka Naoko Mizukoshi Naoki Hidaka Toshiya Takahata Seiichiro Shirahata Koji Nakano Yasuhito Nakagawa Tetsuro Hirai Masatoshi Hitomi Yasuhiro Tanabe
Field of specialization Legal, personnel & Corporate Global labor affairs and risk management management ● ● ● ● ●
● ● ● ● ●
● ● ●
● ● ● ● ● ● ●
●
Financial accounting ● ●
Manufacturing and technology ● ●
Sales and marketing
DX
●
● ● ● ● ●
● ● ●
●
● ●
● ● ●
● ●
●
● ●
―71―
●
●
(Translation) This document has been translated from the Japanese original for the convenience of overseas stakeholders. In the event of any discrepancy between this document and the Japanese original, the original shall prevail. (NOTE) 7 In order to invigorate the Board of Directors by separating decision-making and supervision from execution, the Company has introduced an executive officer system, and the business execution structure is as follows.
Position
Name
Duties
President
Kazumasa Kimura
Chief Executive Officer (CEO)
Senior Managing Executive Officer
Atsushi Habe
Corporate Planning, Accounting & Finance, Information Systems, and Corporate Communication
Managing Executive Officer
Shoji Ijuin
General Administration, Human Resources and Legal & Compliance
Managing Executive Officer
Toshiya Fujiwara
Component Solutions Segment, President, Precision Equipment Company, and in charge of Production Innovation
Managing Executive Seiji Takahashi President, Accessibility Innovations Company Officer Managing Executive Norimasa Takagi President, Aerospace Company Officer Executive Officer
Kiyoshi Ando
President, Power Control Company
Executive Officer
Ataru Inoue
President, Nabtesco Automotive Co., Ltd.
Executive Officer
Yukihiro Mizutani
President, Marine Control Systems Company
Executive Officer
Michihito Suzuki
President, Railroad Products Company
Executive Officer
Koichi Miyaguchi
General Manager, Innovation Strategy Division, and CVC Promotion Department
Executive Officer
Hiroshi Usui
Vice President, Aerospace Company, and Plant Manager, Gifu Plant
Executive Officer
Masakazu Kurita
Deputy General Manager, Innovation Strategy Division, and General Manager, New business Promotion Department
Executive Officer
Tomoaki Shiramizu
General Manager, Production Innovation Division
Executive Officer
Akihito Enomoto
Responsible for Sales Management, General Manager, Sales Business Development Department, Railroad Products Company
Executive Officer
Hiroshi Nerima President, Nabtesco Technology Ventures AG
Executive Officer
Hiroki Higuchi
General Manager, Corporate Planning Department, and Innovation Strategy Division
Executive Officer
Tomohiro Kiriyama
Senior General Manager, Technology and R&D Division, and Innovation Strategy Division
Executive Officer
Kazumasa Shimizu
President, Nabtesco Service Co., Ltd.
Executive Officer
Takeshi Hanafusa
Plant Manager, Konan Plant, Accessibility Innovations Company
Executive Officer
Hiroki Mori
General Manager, Sales Management Department and Sales Business Development Department, Precision Equipment Company
Executive Officer
Isao Ohashi
Deputy Senior General Manager, Technology and R&D Division, and General Manager, Innovation Engineering Department
Executive Officer
Sakiko Honda
General Manager, Legal & Compliance Department
Executive Officer
Masaru Sasaki
General Manager, Human Resources Department, Innovation Strategy Division, and President, Nabtesco Link Co., Ltd.
(NOTE) The business execution structure consists of 24 members, five of whom also serve as directors.
―72―
(Translation) This document has been translated from the Japanese original for the convenience of overseas stakeholders. In the event of any discrepancy between this document and the Japanese original, the original shall prevail.
② Outside Directors and Audit & Supervisory Board Members (Independent) The Company has five outside directors and three Audit & Supervisory Board Members (Independent)
Although Ms. Mari Iizuka has not been involved in corporate management except as an Outside Director of the Company, she has a high level of expertise in the fields of global management human resources and international management strategies as a Professor of Doshisha Business School. She also held various posts including Chair of Japan Global Compact Academic Network, which was established for collaboration between business and academia for achievement of Sustainable Development Goals (SDGs), and as an Outside Director of the Company from March 2020, she has appropriately supervised management. Based on her experience and insight, the Company has appointed Ms. Mari Iizuka as Outside Director, as we expect her to provide supervision and advice utilizing her insight. There are no conflict of interest between The Doshisha and the other organizations, where Ms. Mari Iizuka serves, and the Company.
Although Ms. Naoko Mizukoshi has not been involved in corporate management except as an outside director, she has a high level of expertise as an attorney-at-law. She also held various posts including outside officers of other business entities and posts in public offices including a member of Unfair Competition Prevention Subcommittee, Intellectual Property Committee, Industrial Structure Council, Ministry of Economy, Trade and Industry. As an Outside Director of the Company from March 2020, she has appropriately supervised management. Based on her experience and insight, the Company has appointed Ms. Naoko Mizukoshi as Outside Director, as we expect her to provide supervision and advice utilizing her insight. There are no conflict of interest between Endeavour Law Office, where Ms. Naoko Mizukoshi served as Partner; and Leftright Law & IP, where she serves, and the Group. Mr. Naoki Hidaka has been engaged in the overseas businesses of SUMITOMO CORPORATION. After serving as General Manager of the Transportation & Construction Systems Business Unit, which operates in the same business domain as the Company, he served as Representative Director of SUMITOMO CORPORATION, and has broad experience and extensive knowledge and insight as a corporate manager. As an Outside Director of the Company from March 2021, he has appropriately supervised management. Based on his experience and insight, the Company has appointed Mr. Naoki Hidaka as Outside Director, as we expect him to provide supervision and advice utilizing his knowledge. There are no conflict of interest between BROTHER INDUSTRIES, LTD., TOPCON CORPORATION and the other organizations, where Mr. Naoki Hidaka serves, and the Company. Mr. Toshiya Takahata has been engaged in operations related to intellectual property, digital transformation, corporate planning, and sustainability at Seiko Epson Corporation. He has also served as a Director of Seiko Epson Corporation, and has broad experience and extensive knowledge and insight as a corporate manager. As an Outside Director of the Company from March 2022, he has appropriately supervised management. Based on his experience and insight, the Company has appointed Mr. Toshiya Takahata as Outside Director, as we expect him to provide supervision and advice utilizing his insight. There are no conflict of interest between Seiko Epson Corporation, and the other organizations, where Mr. Toshiya Takahata serves, and the Company. Mr. Seiichiro Shirahata possesses diverse operational experience, including a long-term overseas assignment as an engineer at Nippon Paint Co., Ltd. (current Nippon Paint Holdings Co., Ltd.), and he was also responsible for the said company's transition into a holding company and the spin-off of its business segments. He has also served as Director and Senior Executive Officer of Nippon Paint Holdings Co., Ltd., and has broad experience and extensive knowledge and insight as a corporate manager. As an Outside Director of the Company from March 2023, he has appropriately supervised management. Based on his experience and insight, the Company has appointed Mr. Seiichiro Shirahata as Outside Director, as we expect him to provide supervision and advice utilizing his insight. There are no conflict of interest between organizations, where Mr. Seiichiro Shirahata serves, and the Company. Mr. Seiichiro Shirahata is to assume office as Outside Director of LINTEC Corporation as of June 20, 2024. Mr. Tetsuro Hirai has broad experience and extensive knowledge and insight on production. Additionally, he has experience as a corporate manager. The Company has appointed Mr. Tetsuro Hirai as Audit & Supervisory Board Member (Independent), so that we may seek his fair decisions based on the above, and objectiveness and neutrality toward management to strengthen our corporate governance. There are no conflict of interest between organizations, where Mr. Tetsuro Hirai serves, and the Company. Mr. Masatoshi Hitomi has been engaged in accounting and administration in Japan and abroad for many years, and possesses broad insight into finance and accounting as well as experience in management. In addition, at Sony Corporation (current Sony Group Corporation), he was engaged in auditing by the Audit Committee. The Company has appointed Mr. Masatoshi Hitomi as Audit & Supervisory Board Member (Independent), so that we may seek his fair decisions based on the above, and objectiveness and neutrality toward management to strengthen our corporate governance. There are no conflict of interest between organizations, where Mr. Masatoshi Hitomi serves, and the Company.
―73―
(Translation) This document has been translated from the Japanese original for the convenience of overseas stakeholders. In the event of any discrepancy between this document and the Japanese original, the original shall prevail.
Although Mr. Yasuhiro Tanabe has not been directly involved in corporate management, he served as a prosecutor for many years and has a high level of knowledge about laws and regulations. He also has a high level of expertise and insight into organizational management in general. The Company has appointed Mr. Yasuhiro Tanabe as Audit & Supervisory Board Member (Independent), so that we may seek his fair decisions based on the above, and objectiveness and neutrality toward management to strengthen our corporate governance. There are no conflict of interest between National Institute of Advanced Industrial Science and Technology, Tokyo Fuji Law Office and the other organizations, where Mr. Yasuhiro Tanabe serves, and the Company. The Company has established its own criteria for objectively determining the independence of outside directors and Audit & Supervisory Board Members (independent) (hereinafter collectively referred to as "outside officers"), and all of the Company's outside officers are independent in accordance with the following criteria. [Criteria for the Impartiality of Outside Directors/Audit & Supervisory Board Members (independent)] The Company considers an Outside Director/Audit & Supervisory Board Members (independent) to be impartial if all of the following requirements are met.
- The Outside Director/Audit & Supervisory Board Member is not a current major shareholder* of the Company or an executive of such shareholder; * Person who directly or indirectly holds more than 5% of all voting rights or a person who is listed among the top 10 shareholders in the most recent shareholder registry
- The Outside Director/Audit & Supervisory Board Member is not an executive of a major lender * of the Group; * A financial institution group (person who belongs to the consolidated group to which the Group’s direct lender belongs) from which the Group borrows funds, and from which the Group’s total amount of borrowing exceeds 2% of the Group’s consolidated total assets as of the end of the previous fiscal year
- The Outside Director/Audit & Supervisory Board Member is not a major business partner of the Group (defined by a yearly transaction amount that exceeds 1% of consolidated net sales) or its executive;
- The Outside Director/Audit & Supervisory Board Member is not a person for whom the Group is a major business partner (defined by a yearly transaction amount that exceeds 1% of the counterparty’s consolidated net sales) or its executive;
- The Outside Director/Audit & Supervisory Board Member is not a consultant, accounting professional, or legal professional who receives a large amount of remuneration (more than ¥6 million yearly) from the Group other than officers’ remuneration (including a case where an organization such as a corporation or an association to which the Outside Officer belongs receives remuneration);
- The Outside Director/Audit & Supervisory Board Member is not an executive of an organization such as a corporation or an association that receives a large amount of donations (more than ¥6 million yearly) from the Group;
- The Outside Director/Audit & Supervisory Board Member is not a spouse or a relative within the second degree of consanguinity of the Group’s executive; and
- The Outside Director/Audit & Supervisory Board Member does not fall under any of the above-mentioned items from (1) through (6) for the past three years.
- The Outside Director/Audit & Supervisory Board Member holds his/her office as an outside officer of Nabtesco for a period not exceeding eight years in total.
④
Relationship between supervision or auditing by outside directors or Audit & Supervisory Board Members (independent) and internal audits, corporate auditors, and accounting audits, as well as with the internal control division.
The status of coordination and procedures among the Audit & Supervisory Board members (including outside Audit & Supervisory Board members), the accounting auditor, and the internal audit department, as well as the relationship with the internal audit department are described in [(3) Status of audits; ③ Cooperation with internal audits, audits by Audit &
Supervisory Board members, and accounting audits.]
―74―
(Translation) This document has been translated from the Japanese original for the convenience of overseas stakeholders. In the event of any discrepancy between this document and the Japanese original, the original shall prevail.
(3) 【Status of audits】 ① Audits by Audit & Supervisory Board Members
- Audit & Supervisory Board Members and organization Our Audit & Supervisory Board consists of five members, two full-time and three Independent (part-time). Position
Name
Audit & Supervisory Board Members
Koji Nakano
Yasuhito Nakagawa
Audit & Supervisory Board Members (Independent)
Brief history
He has engaged mainly in finance, accounting and corporate planning divisions, and possesses management experience at Shanghai Nabtesco Hydraulic Co., Ltd., in addition to broad insight in the fields of finance and accounting and internal audit. He served as General Manager, Manufacturing Department, Tsu Plant, Precision Equipment Company and Plant Manager of the Plant and served as General Manager, Production Innovation Division. He also chaired the Group’s Environment, Safety & Health Committee. He thus has expertise and experience in production, particularly production technology and production management, as well as in environment, safety and health. In addition, he was engaged in management at Nabtesco (China) Precision Equipment Co., Ltd.
Tetsuro Hirai
He has broad experience and extensive knowledge and insight on production and has management experience.
Masatoshi Hitomi
He has been engaged in accounting and administration in Japan and abroad for many years, and possesses broad insight into finance and accounting as well as experience in management. In addition, at Sony Corporation (current Sony Group Corporation), he was engaged in auditing by the Audit Committee.
Yasuhiro Tanabe
Although he has not been directly involved in corporate management, he served as a prosecutor for many years and has a high level of knowledge about laws and regulations. He also has a high level of expertise and insight into organizational management in general.
In addition, we regularly hold liaison meetings (described below with the Group Audit & Supervisory Board) with domestic Group company Audit & Supervisory Board members, which are composed of the Audit & Supervisory Board members of each Group company, with the aim of sharing Group audit policies, priority implementation items, and audit information of each company, and raising the effectiveness of audits at each Group company. At the request of the Audit & Supervisory Board members, two employees are assigned to assist the Audit & Supervisory Board members in carrying out their duties. 2) Activities of Audit & Supervisory Board Members In principle, the Audit & Supervisory Board Members meets once a month, and 13 meetings were held in Fiscal Year 2023. Attendance by individual corporate auditors is as follows. Name, etc Audit & Supervisory Board Members Audit & Supervisory Board Members (Independent)
Kenichi Kikuchi (Note 2) Isao Shimizu (Note 3) Koji Nakano (Note 4) Zenzo Sasaki (Note 3) Takemi Nagasaka (Note 3) Tetsuro Hirai
Attendance/number of meetings (Note 1) 3 times/3 times 13 times /13 times 10 times/10 times 13 times /13 times 13 times /13 times 13 times /13 times
(NOTE) 1 Figures are based on the number of meetings held during the period of service. 2 Retired on March 23, 2023. 3 Retired on March 26, 2024. 4 Appointed on March 23, 2023.
The main matters discussed and reported by the Audit & Supervisory Board during the fiscal year under review are as follows. The time required is about one hour per time. Audit Plan by Audit & Supervisory Board Members, re-appointment of Accounting Matters for Auditors, consent to audit fees of Accounting Auditors, audit reports of the Audit & Consultation Supervisory Board, consent to proposals for the appointment of Audit & Supervisory Board Members, etc. Reports on the results of audits, reports on receipt of management confirmation Matters to be reports, reports on attendance at important meetings, reports on corporate auditors at Reported meetings of the Board of Directors, and summary reports on important matters such as the Management Committee
―75―
(Translation) This document has been translated from the Japanese original for the convenience of overseas stakeholders. In the event of any discrepancy between this document and the Japanese original, the original shall prevail.
- Activities of Audit & Supervisory Board and Audit & Supervisory Board Members We established audit policies and priority audit items for the current fiscal year as shown in the table below. As an independent body entrusted by shareholders, Audit & Supervisory Board members shall Basic Auditing contribute to ensuring the sound management of the Nabtesco Group and establishing a highPolicy quality corporate governance system that responds to social trust by auditing the execution of duties by directors. <Development and Operation of Internal Control System> Priority audit ① Operational effectiveness and efficiency: Governance status of business sites and Group items companies ② Reliability of financial reports: Important financial information such as orders, quality claims, delivery dates, and costs ③ Legal Compliance: Compliance System and Awareness ④ Preservation of assets: Acquisition and disposal processes, use and storage status <Individual Priority Issues> ①Efforts to Solve ESG Issues ② Initiatives for DX (Digital Transformation) ③ Safety Initiatives
In particular, we closely monitored whether the Group's management policies are properly reflected in the priority issues and action plans of domestic sites and domestic and overseas Group companies, and whether business operations are being executed effectively and efficiently. We confirmed the status of these policies through on-site visits and attending major meetings. The Group companies to be audited are selected based on a comprehensive assessment of the degree of impact on consolidated results and the degree of risk. To enhance the effectiveness of audits by corporate auditors, the Company invites executive officers and division heads to the Audit & Supervisory Board and conducts interviews as necessary. Major activities in the current fiscal year are as follows. Frequency of meetings
Attendance at Board of Directors Meetings
16 times
Full-time Audit & Supervisory Board Members ■
Opinion Exchange Meeting with Representative
2 times
■
Main activities
Audit & Supervisory Board Members (Independent) ■ ■
Directors Participation in the Advisory Committee
5 times
■
Attendance at the Management Committee
19 times
■
Attendance at Executive Officers Committee
12 times
■
Attendance at CEO Committees
9 times
■
Attendance at internal control reporting meeting
1 time
■
Interviews with directors and executive officers
9 times
■
Visits to domestic sites
8 times
■
Participation in physical inventory
13 times
■
Visits to Group Companies
7 times
■
Attendance at the Group Audit & Supervisory
2 times
■
■
Board Meeting (NOTE) Activities related to information collaboration with the internal audit division and accounting auditors are described in [③ Cooperation with Internal Audits, Audits by Audit & Supervisory Board Members, and Accounting Audits.]
―76―
(Translation) This document has been translated from the Japanese original for the convenience of overseas stakeholders. In the event of any discrepancy between this document and the Japanese original, the original shall prevail.
② Internal Audit Status
Our Business Audit Department (eight members) conducts internal audits of corporate divisions, in-house companies, and
Group companies. The Internal Audit Department conducts surveys and assessments to determine whether overall operations are being processed and asset management is being properly carried out. The results are compiled into an audit report and
follow up on the status of improvements in areas pointed out or requested for improvement. Audit reports and follow-up reports are reported directly at regular meetings of the Audit & Supervisory Board attended by the representative director, full-time Audit & Supervisory Board members, and certain executive officers. The contents of these reports are posted in the Audit Report Database and disseminated to all directors and Audit & Supervisory Board members, including those from outside the Company. In addition, the Internal Audit Division reports periodically to the Board of Directors. ③ Cooperation with Internal Audits, Audits by Audit & Supervisory Board Members, and Accounting Audits.
With regard to cooperation between internal audits, audits by the Audit & Supervisory Board members, and accounting
audits, the Business Audit Department and the Audit & Supervisory Board members work to enhance internal auditing operations by, for example, exchanging information and opinions on the annual business audit plan and the content of audits at regular audit councils. The Business Audit Department, the Accounting & Finance Department, and the accounting auditor exchange opinions and information about the development and operation of the Internal Control System for Financial Reporting. In addition, the Audit & Supervisory Board members receive briefings on the outline of the audit plan from the accounting auditor, and also receive briefings on the Group's accounting and internal control issues, etc. through accounting audit reports and quarterly review reports. Full-time Audit & Supervisory Board members and accounting auditors meet regularly to exchange opinions on important auditing issues and other matters. Committee Name
Month of
Summary
implementation Audit and quarterly review
May
plan Quarterly review and audit
February, May,
report meeting
August, and November
Nabtesco group Audit &
January and
Supervisory Board members’
August
meeting Business Audit Report
On a monthly
Meeting
basis
Audit Council
August and November
J-SOX meeting
January, March, June and December
The accounting auditor shall explain to the Audit & Supervisory Board members, the outline of the plan for the audit and quarterly review of the business year. The accounting auditor shall report to the Audit & Supervisory Board members, the quarterly review of each quarterly settlement and the outline and results of the audit of the settlement of accounts for the business year. Audit & Supervisory Board members of each Group company report on their audits and share and discuss information in an effort to achieve uniformity and enhancement of audits. The Business Audit Department shall implement the Audit Operations Report. The results of internal audits conducted by the Internal Audit Department are reported to the Representative Director, Full-time Audit & Supervisory Board Members, and certain executive officers using audit reports and follow-up reports, and opinions are exchanged. In order to strengthen cooperation between the Audit & Supervisory Board members and the Business Auditing Department, discussions on audits and exchanges of information and opinions will be held through the Auditing Council. In addition, the Audit & Supervisory Board of the Group shall discuss, report and exchange opinions on audits between the Audit & Supervisory Board members and the corporate auditors of subsidiaries. The Business Audit Department, an independent evaluation division, reports to the full-time corporate auditors, the general manager of the Accounting Department, and the general manager of the Information System Department, and exchanges opinions regarding the implementation plans and progress of the development and operation evaluation of the Internal Control over Financial Reporting based on the Financial Instruments and Exchange Act.
―77―
(Translation) This document has been translated from the Japanese original for the convenience of overseas stakeholders. In the event of any discrepancy between this document and the Japanese original, the original shall prevail.
④ Accounting Auditors
-
Name of auditing firm KPMG AZSA LLC
-
Continuous audit period 21 years
-
Names of lead CPAs assigned to audit Takeharu Kirikae, Designated Limited Liability Partner and Managing Partner Takashi Inoue, Designated Limited Liability Partner and Managing Partner
-
To assist in audit activities 10 CPAs and 27 others
-
Policy and Reasons for Selection of Audit Firms The Audit & Supervisory Board has decided to appoint KPMG AZSA LLC. as an accounting auditor in consideration of the fact that the accounting auditor is not deemed to fall under any of the items of Paragraph 1 of Article 340 of the Companies Act and the evaluation of the accounting auditor.
-
Evaluation of Audit Firms by Audit & Supervisory Board Members and the Audit & Supervisory Board The Audit & Supervisory Board receives reports from the accounting auditors on the content of audits, audit plans, and quality control systems, and evaluates their independence and appropriateness. During the fiscal year under review, the Board of Corporate Auditors has determined that there are no facts that would cause problems with respect to the activities, independence, and reliability of the accounting auditor.
―78―
(Translation) This document has been translated from the Japanese original for the convenience of overseas stakeholders. In the event of any discrepancy between this document and the Japanese original, the original shall prevail.
④ Details of Audit Fees
- Remuneration for Certified Public Accountants End of previous fiscal year Classification
Current consolidated fiscal year
Compensation for audit certification services (Millions of yen)
Compensation for nonaudit services (Millions of yen)
Compensation for audit certification services (Millions of yen)
Compensation for nonaudit services (Millions of yen)
Submitting Company
110
126
Consolidated subsidiaries
14
16
Total
125
142
- Remuneration for the same network (KPMG) as audited CPAs, etc. (excluding 1) End of previous fiscal year Classification
Current consolidated fiscal year
Compensation for audit certification services (Millions of yen)
Compensation for nonaudit services (Millions of yen)
Compensation for audit certification services (Millions of yen)
Compensation for nonaudit services (Millions of yen)
Submitting Company
7
11
Consolidated subsidiaries
23
44
Total
23
7
44
11
End of previous fiscal year The non-audit services of the submitting companies mainly consist of advisory services related to ESG. Current consolidated fiscal year Non-audit services of the submitting companies are mainly ESG related and tax related advisory services, etc. 3) Details of other remuneration based on important audit attestation services End of previous fiscal year Not applicable. Current consolidated fiscal year Not applicable. 4) Policy for determining audit fees The policy for determining audit fees for our auditing CPAs is to be determined by obtaining the consent of the Audit & Supervisory Board in accordance with the provisions of Article 399 of the Companies Act, after comprehensively considering the content of audit services, etc. 5) Reasons why the Audit & Supervisory Board agreed to the remuneration, etc. of the accounting auditor The Audit & Supervisory Board confirms the content of audits by the accounting auditor, audit time and audit plan, trends in remuneration performance, and remuneration estimates. After reviewing the appropriateness of the accounting auditor's remuneration, the Audit & Supervisory Board agrees to Article 399-1 of the Companies Act.
―79―
(Translation) This document has been translated from the Japanese original for the convenience of overseas stakeholders. In the event of any discrepancy between this document and the Japanese original, the original shall prevail.
(4) 【Compensation of Directors and Audit & Supervisory Board Members】 ① Compensation of Directors and Audit & Supervisory Board Members
- Total amount of remuneration, etc. by officer classification, total amount of remuneration, etc. by type, and number of officers subject to remuneration
Classification
Director (excluding outside directors) Corporate Auditors (excluding independent Audit & Supervisory Board Members) Outside officers
Total remuneration by type (Millions of yen) Fixed Total amount of Incentive fee remuneration compensation (Millions of Board Benefit Trust (BBT) yen) Monthly compensation Benefits at the Retirement time of tenure benefit
Be subject to Number of officers (person)
270
127
41
9
93
6
54
54
3
73
73
9
(NOTE) 1 The number of officers eligible to serve as directors includes one retired director during the fiscal year under review. 2 The number of officers eligible for Audit & Supervisory Board Members includes one retired director during the fiscal year under review. 3 The number of officers eligible for outside directors includes one retired director during the fiscal year under review. 4 Monthly compensation consists of basic monthly compensation and total performance-linked compensation paid on a monthly straightline basis. 5 The amount of stock benefit trust (BBT) represents the amount expensed in the current period under Japanese GAAP based on the number of stock delivery points granted or expected to be granted in the current period. 6 The maximum amount of remuneration is within 400 million yen for directors (including within 50 million yen for outside directors) and 90 million yen for corporate auditors, as resolved at the 14th Ordinary General Meeting of Shareholders (held on March 28, 2017). Following approval at the 21st Ordinary General Meeting of Shareholders (held on March 26, 2024), the maximum amount of remuneration was revised to a maximum of 400 million yen per year (of which 70 million yen is paid to outside directors). 7 In addition to the above remuneration, the Company has introduced a stock-based compensation trust (BBT) for directors (excluding outside directors), a stock-based compensation plan resolved at the 14th Ordinary General Meeting of Shareholders (held on March 28, 2017). In accordance with the directors' stock-based compensation regulations stipulated in this plan, the Company contributes to the trust a maximum of 450 million yen (for 3 fiscal years) for directors' stock-based payment at the time of service and 420 million yen (for 3 fiscal years) for retirement benefits. At the 14th Ordinary General Meeting of Shareholders (held on March 28, 2017), the maximum amount of remuneration, which is separate from the remuneration limit stated in 5. above, is set at 56,000 points (one fiscal year) for benefits at the time of service and 51,000 points (one fiscal year) for benefits at the time of retirement. 8 The total amount of remuneration, etc. for each officer is omitted because there is no applicable officer who has paid 100 million yen or more.
② The contents of the policy and the method for determining the amount of Remuneration, etc. for officers or the method for calculating such amount
- Basic Policy of the Compensation System ・A system that shares the interests of shareholders and management by increasing the linkage between the Company’s business performance and stock value ・To act as an incentive to improve the Group's medium-to long-term performance ・The process of determining the compensation system should be objective and transparent.
- Compensation System ⅰ. The remuneration system for directors consists of "monthly remuneration," which consists of Basic remuneration that is fixed remuneration and Performance-linked compensation reflecting short-term performance, and "stock benefit trust (BBT)," which reflects the degree of achievement of the medium-term management plan and share value. ⅱ. "Basic remuneration" is a fixed remuneration according to the position of each director and is paid as a monthly remuneration. ⅲ. “Performance-linked compensation (monthly compensation)” is determined based on the degree of achievement of annual performance using the following formula. [Short-term performance-linked compensation] Short-term performance-linked remuneration = Standard amount for payment by position × Performance evaluation coefficient ※Performance assessment coefficient: Determined by a matrix table using ROIC and net income (attributable to owners of the parent) for the previous fiscal year for which thresholds are set as indicators (coefficient: 0.00 to 4.00) Directors in charge of internal companies will be added or deducted from short-term performance-linked remuneration based on the sales growth rate, degree of improvement in operating income, degree of improvement in ROIC, R&D indicators, environmental indicators, etc. of the company.
―80―
(Translation) This document has been translated from the Japanese original for the convenience of overseas stakeholders. In the event of any discrepancy between this document and the Japanese original, the original shall prevail.
iv. Share-based compensation is determined based on the following formula, utilizing the system of the Stock Benefit Trust (BBT) and depending on the degree of achievement of the Medium-Term Management Plan. [Share-based compensation granted at the time of service] Share-based compensation delivered at the time of service = Share-based compensation points by position × Performance evaluation coefficient × Mid-term Management Plan achievement coefficient ※Performance assessment coefficient: Determined by a matrix table using ROIC and net income (attributable to owners of the parent) for the previous fiscal year for which thresholds are set as indicators (coefficient: 0.00 to 4.00) ※Coefficient of achievement under the medium-term management plan: Set based on the degree of achievement of net sales and operating income set forth in the medium-term management plan (0 to 0.5) The vesting of points will be the date of the ordinary general meeting of shareholders for the last fiscal year ending within three years after the granting of points. [Stock-based compensation at the time of retirement] Share-based remuneration at the time of retirement = Share-based remuneration points by position The vesting of the delivery points shall be the date of resignation as a director. v. The remuneration of directors is based on a percentage distribution that emphasizes linkage to performance and shareholder value. Fixed compensation Position Chairman of the Board and President Director
Incentive fee Grant-type at the time Short-term of service performance Basic remuneration Stock-based Linked remuneration compensation
Grant-type at retirement Stock-based compensation
25%
35%
25%
15%
25%
35%
25%
15%
(NOTE)This table is a model based on a 100% achievement rate for performance-linked remuneration, with the median value for each position.
vi. Remuneration for Outside Directors and the Audit & Supervisory Board Members is limited to fixed remuneration, in view of the fact that the Company is independent from the execution of business, and the portion reflecting business performance is excluded. vii. In the event that there is a material change in the performance of the previous fiscal year that serves as the basis for the calculation of performance-linked remuneration as a result of the restatement of prior fiscal years due to inappropriate accounting, etc., or in the event of a serious damage to the Company due to an illegal act of an officer, etc., the Company is able to request the full amount of performance-linked remuneration or the return of a portion of the remuneration. 3) Approach to Performance-Linked Compensation Indicators The performance-linked remuneration metrics paid to directors (excluding outside directors) are based on "ROIC" and "Net income (attributable to owners of the parent company)", which are the achievements of all employees' activities and the main indices leading to improved ROE. As a result, all directors are aware of the cost of capital and the dividend payout ratio, and we will promote management that is conscious of the sustainable growth of our group. In addition to management indicators such as the degree of ROIC improvement, directors in charge of business operations are provided with R&D indicators for promoting the creation of intellectual property, environmental indicators for reducing CO₂ emissions, and other indicators to provide incentives for improving business performance over the medium to long term. In addition, for the degree of achievement of the Medium-Term Management Plan, we have adopted "Net sales" and "Operating income" with the aim of promoting activities that are the results of all directors and employees' business activities and that unify the vector. The above indicators may be added to or deducted from the amount of impact caused by events that are not attributable to our management decisions. [Results of Key Performance-Based Compensation Indicators] ROIC
Net sales
Operating income
Net income
4.7% 309,123 million yen 18,654 million yen 10,415 million yen Performance-linked remuneration for the fiscal year under review is calculated based on the figures for the fiscal year ended December 2022.
―81―
(Translation) This document has been translated from the Japanese original for the convenience of overseas stakeholders. In the event of any discrepancy between this document and the Japanese original, the original shall prevail.
- Method of Determination of Remuneration, etc. The Compensation Committee, which is composed of one internal director and four independent outside officers, deliberates and reports on the policy, compensation structure, and level of remuneration for directors, as well as the amount paid to each director, and the Board of Directors determines the amount. Remuneration for Audit & Supervisory Board members is determined after consultation with Audit & Supervisory Board members. The activities of the Committee for deliberating and determining director remuneration for the current fiscal year are as follows. [Number of Committee Meetings (from January to December 2023)] Committee, etc.
Number of meetings
Compensation Committee
Twice
Board of Directors
Twice
―82―
(Translation) This document has been translated from the Japanese original for the convenience of overseas stakeholders. In the event of any discrepancy between this document and the Japanese original, the original shall prevail.
(5) 【Status of shareholding】 ① Standard and Concept of Classification of Investment Shares
We do not hold shares for net investment purposes, and all shares are classified as investment shares for purposes other than
net investment purposes (hereafter, "strategic shareholdings"). Shares that are for net investment purposes are those whose purpose is to receive profits from changes in stock prices or dividends.
② Investments in shares held for purposes other than pure investment
- Method of verifying the rationality of holding policy and details of verification by the Board of Directors, etc. regarding the appropriateness of holding individual issues
We hold strategic stockholdings only if they contribute to maintaining and enhancing our corporate value. In light of the situation at the end of the most recent fiscal year, the Company's basic policy is to dispose of and reduce strategic shareholdings as soon as possible. Under this policy, the Board of Directors annually examines whether the holding purpose is appropriate for each individual issue and whether the benefits and risks associated with holding are commensurate with the cost of capital, based on certain criteria, and reviews whether or not to continue holding shares and the number of shares. As a result of the verification, any issue deemed inappropriate for continuous holding will be sold without delay after considering the stock price, market trends, and other factors. 2) Number of issues and balance sheet amount
Number of issues (issue)
Total amount on the Balance Sheet (Millions of yen)
Unlisted stocks
16
406
Shares other than unlisted shares
10
3,841
(Issues with an increase in the number of shares in the current fiscal year) Number of issues (issue)
Total acquisition cost related to increase in number of shares (Millions of yen)
Unlisted stocks
1
97
Shares other than unlisted shares
1
1
(Issues whose number of shares decreased in the current fiscal year) Number of Total sales price related to issues decrease in number of shares (issue) (Millions of yen) Unlisted stocks
Shares other than unlisted shares
―83―
Reason for the increase in the number of shares Strengthen business and collaborative relationships Dividend reinvestment by the Supplier Shareholding Association
(Translation) This document has been translated from the Japanese original for the convenience of overseas stakeholders. In the event of any discrepancy between this document and the Japanese original, the original shall prevail.
- Information on the number of shares and the amount recorded on the balance sheet for each issue of specified investment shares and deemed holding shares Specified investment shares Current fiscal year Previous fiscal year Issue
Number of shares Balance Sheet Amount (Millions of yen)
ShareNumber of shares Outline of holding purpose and business alliance, holdings quantitative effect of holding shares and reasons for Balance Sheet in the the increase in the number of shares Amount Company (Millions of yen) 100,000 It is a customer in Transport Solutions business and is owned to maintain and strengthen business Yes relations. The number of shares increased due to 1,621 the stock split.
Central Japan Railway Company
500,000
SINFONIA TECHNOLOGY CO., LTD.
400,000
400,000
833
590
66,997
66,997
297
324
West Japan Railway Company
45,000
45,000
265
258
East Japan Railway Company
25,500
25,500
207
192
43,509
43,509
195
189
50,741
50,372
87
84
38,587
38,587
84
82
10,857
10,857
40
37
20,000
20,000
40
28
Keio Corporation
Kintetsu Group Holdings Co.,Ltd.
Tokyu Corporation
Sanyo Electric Railway Co., Ltd. Keihan Holdings Co., Ltd. The Hanshin Diesel Works, Ltd.
1,792
We are primarily a business partner in Transport Solutions business and hold them to maintain and strengthen business relations.
Yes
It is a customer in Transport Solutions business and is owned to maintain and strengthen business relations.
Yes
It is a customer in Transport Solutions business and is owned to maintain and strengthen business relations.
None
It is a customer in Transport Solutions business and is owned to maintain and strengthen business relations.
None
It is a customer in Transport Solutions business and is owned to maintain and strengthen business relations.
None
It is a customer in Transport Solutions business and is owned to maintain and strengthen business relations. The increase in shares was due to the reinvestment of dividends by the holding association.
None
It is a customer in Transport Solutions business and is owned to maintain and strengthen business relations.
None
It is a customer in Transport Solutions business and is owned to maintain and strengthen business relations.
Yes
It is a customer in Transport Solutions business and is owned to maintain and strengthen business relations.
None
(NOTE) Quantitative holding effects are not shown because they relate to trade secrets. The method of verifying the rationality of the holdings is described in "1) Method of verifying the rationality of holding policy and details of verification by the Board of Directors, etc. regarding the appropriateness of holding individual issues” ③ Investment shares held for pure investment purposes Not applicable ④ Securities for which the purpose of holding investment shares is changed from a pure investment purpose to a purpose other than a pure investment purpose during the current fiscal year Not applicable ⑤ Securities for which the purpose of holding investment shares is changed from a purpose other than pure investment to a pure investment purpose during the current fiscal year Not applicable.
―84―
(Translation) This document has been translated from the Japanese original for the convenience of overseas stakeholders. In the event of any discrepancy between this document and the Japanese original, the original shall prevail.
No.5 【Accounting Status】
- Preparation of Consolidated Financial Statements and Financial Statements (1) Our consolidated financial statements have been prepared in accordance with International Financial Reporting Standards ("IFRS") pursuant to the provisions of Article 93 of the "Regulations Concerning Terminology, Forms and Preparation Methods of Consolidated Financial Statements" (Ministry of Finance Ministerial Order No. 28 of issued in 1976, hereinafter referred to as the "Regulations Concerning Consolidated Financial Statements"). (2) Our financial statements have been prepared in accordance with the Regulations on Terminology, Forms and Preparation Methods of Financial Statements (Ordinance of the Ministry of Finance No. 59 of issued in 1963; hereinafter referred to as the "Regulations on Financial Statements, etc."). We are a company submitting special financial statements and prepare financial statements in accordance with the provisions of Article 127 of the Ordinance on Financial Statements, etc. (3) The consolidated financial statements and financial statements have been rounded to the nearest unit.
- Audit Certification Pursuant to Article 193-2-1 of the Financial Instruments and Exchange Act, we have audited the consolidated financial statements for the fiscal year (January 1, 2023 to December 31, 2023) and the financial statements for the fiscal year (January 1, 2023 to December 31, 2023) by KPMG AZSA LLC In addition, we have submitted a Corrections Report of an Annual Securities Report, pursuant to Article 24-2-1 of the Financial Instruments and Exchange Act, and the consolidated financial statements and the non-consolidated financial statements after correction have been audited by KPMG AZSA LLC.
- Special efforts to ensure the appropriateness of the consolidated financial statements, etc. and the development of a system to properly prepare the consolidated financial statements, etc. based on IFRS As shown below, we are making special efforts to ensure the appropriateness of our consolidated financial statements and establishing a system for the proper preparation of consolidated financial statements based on IFRS. (1) In order to appropriately grasp the content of accounting standards, etc., and develop a system that enables us to respond to changes in accounting standards, etc. in a timely and accurate manner, we have joined the Financial Accounting Standards Corporation and participate in seminars conducted by auditing firms, etc. In addition, internal study meetings on the content of IFRS are held regularly to promote the acquisition of IFRS knowledge to practical personnel. (2) In applying IFRS, the Company obtains press releases and pronouncements issued by the International Accounting Standards Board from time to time to determine the latest standards. In addition, in order to prepare appropriate consolidated financial statements based on IFRS, we have prepared group-wide accounting policies in accordance with IFRS and account for them based on those policies
―85―
(Translation) This document has been translated from the Japanese original for the convenience of overseas stakeholders. In the event of any discrepancy between this document and the Japanese original, the original shall prevail.
1 【Consolidated Financial Statements and Notes on the Consolidated Financial Statement】 (1) 【Consolidated Statement of Financial Position】 ① 【Consolidated Statement of Financial Position】 Note No.
(Million yen) End of consolidated FY 2022 (as of December 31, 2022)
End of consolidated FY 2023 (as of December 31, 2023)
7
124,413
77,835
Trade receivables
8, 22
77,227
82,167
Contract assets
24
2,439
3,554
Other receivables
8
1,301
1,682
Inventories
9
49,236
50,969
Other financial assets
22
1,733
616
5,445
6,995
261,794
223,818
34,030
-
295,824
223,818
Assets Current assets Cash and cash equivalents
Other current assets Total Assets held for sale
10
Total current assets Non-current assets Property, plant and equipment
11, 13
95,901
107,527
Intangible assets
12, 13
6,554
11,624
Right-of-use assets
13, 14
9,972
8,908
Goodwill
12, 13
18,025
25,750
Investment property
15
2,066
10,394
Investments accounted for using the equity method
16
20,080
24,005
Other financial assets
22
10,041
12,550
Deferred tax assets
21
2,809
3,040
1,168
1,013
166,616
204,812
462,440
428,630
Other non-current assets Total non-current assets Total assets
―86―
(Translation) This document has been translated from the Japanese original for the convenience of overseas stakeholders. In the event of any discrepancy between this document and the Japanese original, the original shall prevail.
(Million yen) Note No.
End of consolidated FY 2022 (as of December 31, 2022)
End of consolidated FY 2023 (as of December 31, 2023)
Operating payables
17, 22
56,119
50,783
Contract liabilities
24
7,652
11,024
Borrowings
19, 22
19,943
21,400
Other payables
17, 22
19,250
23,392
11,734
3,018
Liabilities and equity Liabilities Current liabilities
Income taxes payable Provisions Lease liabilities Other financial liabilities
18
1,761
2,720
19, 22
2,479
2,799
22
47,267
-
Other current liabilities
6,292
7,327
Total current liabilities
172,499
122,462
Non-current liabilities Borrowings
19, 22
366
173
Lease liabilities
19, 22
8,403
8,060
Liabilities concerning retirement benefit
20
8,472
9,174
Deferred tax liabilities
21
4,726
7,951
Other financial liabilities
22
-
516
2,193
2,149
Other non-current liabilities Total non-current liabilities Total liabilities
24,160
28,022
196,658
150,485
Equity Capital stock
23
10,000
10,000
Share premium
23
15,048
15,139
Retained earnings
23
217,865
222,362
Treasury stocks
23
-4,646
-3,943
Other components of equity
23
12,982
19,162
Equity attributable to owners of the parent
251,250
262,721
Non-controlling interests
14,532
15,424
Total equity
265,782
278,145
462,440
428,630
Total liabilities and equity
―87―
(Translation) This document has been translated from the Japanese original for the convenience of overseas stakeholders. In the event of any discrepancy between this document and the Japanese original, the original shall prevail.
② 【Consolidated Statements of Income】
(Million yen) Note No.
Net sales
6, 24
Cost of sales
25
Previous fiscal year (January 1, 2022 to December 31, 2022) (Consolidated basis) 309,123
Current fiscal year (January 1, 2023 to December 31, 2023) (Consolidated basis) 333,367
-231,882
-250,915 -67,272
Gross profit
77,241
Other income
26
1,373
Selling, general and administrative expense
25
-59,620
Other expenses
26
-340
Operating income
6
18,654
Financial income
27
708
Financial costs
27
Equity in earnings of affiliates
16
-5,823
3,015
Income before tax
82,452 6,517
-5,038
16,660 5,202
-1,095
4,549
16,553
25,316
-4,215
12,338
-9,215
16,102
Owners of the parent
10,415
14,226
Non-controlling interests
1,923
1,876
Net income
12,338
16,102
Income tax expense
21
Net income Net income attributable to
Net income per share Basic earnings per share (Yen)
29
86.79
118.52
Diluted earnings per share (Yen)
29
86.78
118.50
―88―
(Translation) This document has been translated from the Japanese original for the convenience of overseas stakeholders. In the event of any discrepancy between this document and the Japanese original, the original shall prevail.
③ 【Consolidated Statements of Comprehensive Income】 Note No.
(Million yen) Current fiscal year (January 1, 2023 to December 31, 2023)
Previous fiscal year (January 1, 2022 to December 31, 2022)
Net income
12,338
16,102
23
586
-162
23
444
917
1,030
755
23
8,077
6,236
23
153
124
8,229
6,360
Other comprehensive income after taxes
9,259
7,115
Total comprehensive income
21,597
23,217
19,048
20,762
Other comprehensive income Items that will not be reclassified to profit or loss Remeasurements liabilities (assets)
of
defined
benefit
Net changes in financial assets measured at fair value through other comprehensive income Total components that will not be reclassified to profit or loss Components that will be reclassified to profit or loss Exchange differences on foreign operations Share of other comprehensive income of investments accounted for using equity method Total components that will be reclassified to profit or loss
Comprehensive income attributable to Owners of the parent Non-controlling interests
2,549
2,455
Total comprehensive income
21,597
23,217
―89―
(Translation) This document has been translated from the Japanese original for the convenience of overseas stakeholders. In the event of any discrepancy between this document and the Japanese original, the original shall prevail.
④ 【Consolidated Statement of Changes in Equity】 FY 2022 (January 1, 2022 to December 31, 2022)
(Million yen) Equity attributable to owners of the parent
Note No.
Balance as of January 1, 2022 Net income Other comprehensive income
23
Total comprehensive income
Other components of equity Retained earnings
Treasury stocks
Exchange Valuation differences on difference due to change in fair foreign operations value
Capital stock
Share premium
10,000
14,961
216,036
-4,784
2,090
3,069
-
-
10,415
-
-
-
-
-
-
-
7,629
437
-
-
10,415
-
7,629
437
Acquisition, sales, etc. of treasury stocks
23
-
-
-10
137
-
-
Dividends
23
-
-
-9,385
-
-
-
-
-
810
-
-
-243
-
88
-
-
-
-
Total transactions with owners, etc.
-
88
-8,586
137
-
-243
Balance as of December 31, 2022
10,000
15,048
217,865
-4,646
9,719
3,263
Transfer from other components of equity to retained earnings Share-based transactions
compensation
28
Equity attributable to owners of the parent Other components of equity Note No. Remeasurements of net defined Total benefit liability (asset) Balance as of January 1, 2022 Net income Other comprehensive income
23
Total comprehensive income
Total equity attributable to owners of the parent
Non-controlling interests
Total equity
-
5,159
241,372
15,084
256,456
-
-
10,415
1,923
12,338
566
8,633
8,633
626
9,259
566
8,633
19,048
2,549
21,597
Acquisition, sales, etc. of treasury stocks
23
-
-
127
-
127
Dividends
23
-
-
-9,385
-3,101
-12,486
-566
-810
-
-
-
-
-
88
-
88
Total transactions with owners, etc.
-566
-810
-9,170
-3,101
-12,271
Balance as of December 31, 2022
-
12,982
251,250
14,532
265,782
Transfer from other components of equity to retained earnings Share-based transactions
compensation
28
―90―
(Translation) This document has been translated from the Japanese original for the convenience of overseas stakeholders. In the event of any discrepancy between this document and the Japanese original, the original shall prevail.
FY 2023 (January 1, 2023 to December 31, 2023) (Million yen) Equity attributable to owners of the parent Note No.
Balance as of January 1, 2023 Net income Other comprehensive income
23
Total comprehensive income
Other components of equity Retained earnings
Treasury stocks
Exchange Valuation differences on difference due to change in fair foreign operations value
Capital stock
Share premium
10,000
15,048
217,865
-4,646
9,719
3,263
-
-
14,226
-
-
-
-
-
-
-
5,797
911
-
-
14,226
-
5,797
911
Acquisition, sales, etc. of treasury stocks
23
-
-
-579
704
-
-
Dividends
23
-
-
-9,506
-
-
-
-
-
356
-
-
-529
-
91
-
-
-
-
Total transactions with owners, etc.
-
91
-9,729
704
-
-529
Balance as of December 31, 2023
10,000
15,139
222,362
-3,943
15,516
3,646
Transfer from other components of equity to retained earnings Share-based transactions
compensation
28
Equity attributable to owners of the parent Other components of equity Note No. Remeasurements of net defined Total benefit liability (asset) Balance as of January 1, 2023 Net income Other comprehensive income
23
Total comprehensive income
Total equity attributable to owners of the parent
Non-controlling interests
Total equity
-
12,982
251,250
14,532
265,782
-
-
14,226
1,876
16,102
-173
6,535
6,535
579
7,115
-173
6,535
20,762
2,455
23,217
Acquisition, sales, etc. of treasury stocks
23
-
-
125
-
125
Dividends
23
-
-
-9,506
-1,563
-11,069
173
-356
-
-
-
-
-
91
-
91
Total transactions with owners, etc.
173
-356
-9,290
-1,563
-10,854
Balance as of December 31, 2023
-
19,162
262,721
15,424
278,145
Transfer from other components of equity to retained earnings Share-based transactions
compensation
28
―91―
(Translation) This document has been translated from the Japanese original for the convenience of overseas stakeholders. In the event of any discrepancy between this document and the Japanese original, the original shall prevail.
⑤ 【Consolidated Statements of Cash Flows】
(Million yen) Note No.
Current fiscal year (January 1, 2023 to December 31, 2023)
Previous fiscal year (January 1, 2022 to December 31, 2022)
Cash flows from operating activities Net income Depreciation and amortization Impairment Loss
13
12,338
16,102
14,454
15,469
-
6,250
Increase (decrease) in liabilities concerning retirement benefits
208
521
Interest and dividend income
-603
-463
Interest expenses Decrease (Increase) in valuation on investment securities Loss (gain) on sale of shares of subsidiaries and associates
194
574
5,535
-3,569
-
-1,144
-3,015
-4,549
-
-4,243
4,215
9,215
Decrease (increase) in trade receivables
1,630
481
Decrease (increase) in inventories
-5,161
Equity loss (gain) in earnings of affiliates Loss (gain) on sales of fixed assets
87
Decrease (Increase) in sales on investment property Loss (gain) on exchange of land and buildings
-65
15
Expenses of income tax
Increase (decrease) in operating payables
2,302
Others
-2,258
Subtotal Interest received Dividend received Income taxes refunded (paid) Cash flows from operating activities
-
223 -7,055 -1,525
29,861
26,569
338
375
929
Interest paid
282
901
-194
-574
-23,216
-16,093
7,717
11,177
Cash flows from investing activities Decrease in time deposits (Increase)
311
318
Purchases of tangible fixed assets
-8,809
-22,578
42
500
-2,559
-3,021
103
323
-
-11,619
-
1,686
Proceeds from sales of tangible fixed assets Purchases of intangible fixed assets Proceeds from sales on investment property Payments for acquisition of subsidiaries resulting in a change in the scope of consolidation Proceeds from sales of subsidiaries resulting in a change in the scope of consolidation Payments for acquisition of investment securities
30
-711
-1,694
Proceeds from sale of investment securities
22
47,690
12
Payments for settlement of sales price on investment securities
22
-28,471
-9,752
Proceeds from refund of leasehold deposits
22
6,573
99
-937
-570
13,231
-46,295
2,077 - -232 -2,854 33 -9,380 -3,101
3,000 32 -2,384 -3,060 -3 -9,503 -1,563
-13,456
-13,482
Other Cash flows from investing activities Cash flows from financing activities Increase (decrease) in short-term bank loans Proceeds from long-term loans payable Repayment of long-term loans payable Payments of lease liabilities Decrease in treasury stocks (Increase) Cash dividends paid Dividends paid to non-controlling interests
19 19 19 19 23
Cash flows from financing activities Increase (decrease) in cash and cash equivalents Cash and cash equivalents at beginning of term
7,492
-48,600
7
112,771
124,413
4,150
2,021
7
124,413
77,835
Effect of exchange rate changes on cash and cash equivalents Cash and cash equivalents at end of term
―92―
(Translation) This document has been translated from the Japanese original for the convenience of overseas stakeholders. In the event of any discrepancy between this document and the Japanese original, the original shall prevail.
【Notes to Consolidated Financial Statements】
- Reporting company Nabtesco Corporation (the "Company") is a company located in Japan. Our consolidated financial statements are composed of the interests in us and our subsidiaries (together, the "Group") and affiliates, with an ended date of December 31, 2023. Our main businesses are Component Solutions Business, Transport Solutions Business, and Accessibility Solutions Business. The details are described in Note "6. Business Segments."
- Basis of preparation (1) Compliance with IFRS The consolidated financial statements have been prepared in accordance with IFRS pursuant to the provisions of Article 93 of the Ordinance on Consolidated Financial Statements as they satisfy all of the requirements of "Designated International Accounting Standards Designated Companies" set forth in Article 1-2 of the Ordinance on Consolidated Financial Statements. The consolidated financial statements for the fiscal year ended December 31, 2023, which were approved by our Board of Directors on March 26, 2024, were corrected and approved by our Board of Directors on September 30, 2026. (2) Basis for measurement The consolidated financial statements of our group have been prepared on a historical cost basis, except for financial instruments measured at fair value, as described in Note "3. Significant Accounting Policies," below. (3) Functional and presentation currencies The consolidated financial statements of our group represent the Japanese yen, which is our functional currency.
- Important accounting policies The significant accounting policies applied in these consolidated financial statements are the same as those applied for all periods presented in these consolidated financial statements, unless otherwise indicated. (1) Basis of consolidation ① Subsidiary
Subsidiaries are companies controlled by our group. The financial statements of subsidiaries are included in the consolidated
financial statements from the date of inception to the date of termination of control. The accounting policies of the subsidiaries
have been changed as necessary to align with the accounting policies applied by our group. Changes in ownership interests in subsidiaries that do not result in loss of control are accounted for as equity transactions. The difference between the non-controlling interest adjustment and the fair value of the consideration is recognized directly in equity as equity attributable to owners of the parent. Unrealized gains and losses arising from balances and transactions within our group and from transactions within our group are eliminated in the preparation of the consolidated financial statements. For subsidiaries with different closing dates, financial statements based on provisional closing as of the consolidated closing date are used. ② Investments in Affiliated Companies.
Affiliated companies are companies over which the Group has significant influence, but not control, over their financial and
operating policies. If our group holds more than 20% of the voting power of another company, we estimate that our group has significant influence over that other company. Investments in affiliates are accounted for using the equity method and are recognized at cost at the time of acquisition. Under
the equity method, if there is a difference between the investment at the date of the investment and the corresponding investee's capital, such difference is included in the carrying amount of the investment as goodwill. The consolidated financial statements include the recognition of our group's share of net income or loss and other comprehensive income from the date of significant influence through the date of loss of significant influence, and adjustments
―93―
(Translation) This document has been translated from the Japanese original for the convenience of overseas stakeholders. In the event of any discrepancy between this document and the Japanese original, the original shall prevail.
are made to the amounts invested. Until our proportionate share of the loss of an affiliate exceeds our proportionate share of the investment in the entity, such proportionate share is charged to net income. No further excess is recognized as a loss unless our group incurs or pays a liability (legal or constructive) on behalf of an affiliate. In applying the equity method of accounting, we make adjustments necessary to align the accounting policies of our equity method investees with the accounting policies of our group. In addition, the consolidated financial statements include investments in affiliates whose fiscal year-end differs from our fiscal year-end because it is not practicable to unify the fiscal year-end to our fiscal year-end due to relationships with other shareholders and other factors. Significant transactions or events in the period arising from differences in the balance sheet dates are adjusted. The fiscal year-end of the affiliated companies accounted for by the equity method is mainly March 31. Unrealized gains and losses arising from transactions with affiliates accounted for by the equity method are deducted from investments to the extent of our Group's ownership interest in the investee. (2) Business Combination Business combinations are accounted for using the acquisition method. Identifiable assets and liabilities of the acquired company are measured at fair value at the date of acquisition. Goodwill is measured as the excess of the sum of the consideration transferred in a business combination, the amount of the non-controlling interest in the acquired companies, and the fair value of the equity interest in the acquired companies previously held by the acquired companies over the net value of identifiable assets and liabilities at the date of acquisition. Acquisition-related costs are expensed in the period in which they are incurred. In addition, with respect to business combination transactions under common control, we account for them based on the book value prior to the occurrence of the business combination transaction. (3) Foreign currency ① Functional and Presentation Currencies The financial statements of each company in our group are prepared in the functional currency, which is the currency of the primary economic environment in which the company operates. The consolidated financial statements of our group represent the Japanese yen, which is our functional currency. ② Foreign Currency Transactions Transactions denominated in foreign currencies are translated into the functional currency at the exchange rates in effect at the transaction date. Monetary assets and liabilities denominated in foreign currencies at the end of the fiscal year are translated into the functional currency at the exchange rates in effect at the end of the fiscal year. Non-monetary assets and liabilities denominated in foreign currencies measured at cost are translated into the functional currency at the exchange rates in effect at the transaction date. Non-monetary assets and liabilities measured at fair value that are denominated in foreign currencies are translated into the functional currency at the exchange rate prevailing at the measurement date of such fair value. Exchange differences arising from translation are recognized in profit or loss. However, differences arising from the translation of financial instruments measured at fair value with the changes recognized in other comprehensive income are recorded in other comprehensive income. ③ Foreign operations Assets and liabilities of foreign operations are translated into Japanese yen at the year-end exchange rates. Revenues and expenses of foreign operations are translated into Japanese yen using the average exchange rate, unless the exchange rate fluctuates significantly. Translation differences arising from the translation of the financial statements of foreign operations are recognized in other comprehensive income and included in other components of equity. When foreign operations are disposed of, translation adjustments are reclassified to profit or loss. (4) Cash and cash equivalents Cash and cash equivalents include cash on hand, readily available deposits and short-term investments with original maturities of 3 months or less that are readily convertible to known amounts of cash and present insignificant risk of changes in value. (5) Inventories Inventories are measured at the lower of cost and net realizable value. The cost of inventories is determined principally based on the average cost method, which includes the cost of acquiring inventories, manufacturing and processing costs, and other costs incurred in bringing the inventories to their current location and condition. Net realizable value is the estimated selling price in the ordinary course of business less estimated costs to complete and
―94―
(Translation) This document has been translated from the Japanese original for the convenience of overseas stakeholders. In the event of any discrepancy between this document and the Japanese original, the original shall prevail.
estimated selling costs.
―95―
(Translation) This document has been translated from the Japanese original for the convenience of overseas stakeholders. In the event of any discrepancy between this document and the Japanese original, the original shall prevail.
(6) Financial Instruments ① Non-derivative financial assets
Our group initially recognizes financial assets on the transaction date on which our group becomes a party to a contract for
that financial instrument.
Financial assets are initially measured at fair value. For financial assets that are not measured at fair value through profit or loss after initial recognition, transaction costs incurred directly to acquire the financial assets are included in the initial measurement amount. a Financial assets measured at amortized cost Financial assets are classified as financial assets measured at amortized cost when the following criteria are met. ・It is held based on a business model whose objective is to hold financial assets to recover contractual cash flows. ・The contractual terms of the financial assets give rise on specified dates to cash flows that are solely payments of principal and interest on the principal balance. Measurement after initial recognition is carried at amortized cost using the effective interest method. A loss valuation allowance is recognized for expected credit losses on financial assets measured at amortized cost. At the end of each fiscal year, our group compares the credit risk of financial assets as of the end of the fiscal year with the initial recognition date to evaluate whether there has been a significant increase in the credit risk associated with financial assets. If the credit risk associated with a financial asset has increased significantly since initial recognition, we measure the loss valuation allowance associated with that financial asset at an amount equal to the expected credit loss for the full period, and if not significantly increased, at an amount equal to the expected credit loss for the 12-month period. Notwithstanding the foregoing, for trade receivables and contract assets that do not contain a significant financial component, the Company measures the loss valuation allowance at an amount equal to the expected credit loss for the entire period. The provision for loss valuation allowance related to financial assets is recognized in profit or loss. If an event occurs that reduces the loss valuation allowance, the reversal of the loss valuation allowance is recognized in profit or loss. b Financial assets measured at fair value through other comprehensive income At initial recognition, our group elects to recognize changes in the fair value of equity instruments other than those held for trading in other comprehensive income, in principle. When the Company elects to recognize through other comprehensive income, the designation is made and applied on an ongoing basis as irrevocable. Subsequent to initial recognition, measurements are carried at fair value through other comprehensive income. When such financial assets are sold, the cumulative gain or loss recognized is reclassified from other comprehensive income to retained earnings at the time of sale. Dividends from such financial assets are recognized in profit or loss. c Financial assets measured at fair value through profit or loss Our group classifies financial assets other than financial assets measured at amortized cost or at fair value through other comprehensive income as financial assets measured at fair value through profit or loss. Subsequent to initial recognition, measurements are carried at fair value through profit or loss. Our group derecognizes financial assets when the contractual rights to cash flows have expired or have been transferred, or substantially all the risks and rewards of ownership have been transferred.
② Non-derivative financial liabilities
Our group initially recognizes the debt securities to be issued on the date of such issuance. All other financial liabilities are
recognized on the transaction date on which our group becomes a party to the contract for the financial instrument.
a Financial liabilities measured at amortized cost Our group initially measures financial liabilities measured at amortized cost with fair value plus direct transaction costs. Subsequent to initial recognition, they are measured at amortized cost using the effective interest method.
―96―
(Translation) This document has been translated from the Japanese original for the convenience of overseas stakeholders. In the event of any discrepancy between this document and the Japanese original, the original shall prevail.
b Financial liabilities measured at fair value through profit or loss Our group classifies financial liabilities other than financial liabilities measured at amortized cost as financial liabilities measured at fair value through profit or loss. Subsequent to initial recognition, measurements are carried at fair value through profit or loss. Our group derecognizes financial liabilities when contractual obligations are discharged, cancelled or expired. ③ Derivative Financial Instruments
Our Group holds derivative financial instruments for the purpose of avoiding and mitigating the risk of fluctuations in foreign
exchange rates and interest rates. Derivatives are initially recognized at fair value and the related transaction costs are recognized in profit or loss as incurred. Subsequent to initial recognition, measurements are carried at fair value through profit or loss.
(7) Property, plant and equipment ① Recognition and Measurement
Property and equipment are measured at cost less accumulated depreciation and accumulated impairment losses using the
cost model.
Cost includes the following costs directly related to the acquisition of assets: ・Employee benefits and assembly, installation and other costs directly arising from the manufacture of assets ・Estimates of the costs of dismantling and removing assets if the obligation is to remove or remove them. ・Capitalized borrowing costs ② Depreciation
Property and equipment are depreciated using the straight-line method over the estimated useful lives of the respective
components.
Depreciation is calculated based on the depreciable value. Amortizable value is calculated by subtracting the residual value from the acquisition cost of the assets. Estimated useful lives are as follows: Buildings and structures
3 ~
50
Year
Machinery and equipment
4 ~
17
Year
Tools, furniture and fixtures
2 ~
20
Year
Depreciation methods, useful lives and residual values are reviewed at the end of each fiscal year and revised as necessary. (8) Goodwill and intangible assets ① Goodwill
Measurement at the initial recognition is described in "(2) Business combinations." Subsequent to initial recognition, goodwill is stated at cost, less accumulated impairment losses. Goodwill is not amortized
but is tested for impairment annually or whenever indicators of impairment exist. Impairment losses related to goodwill are not reversed. ② Research and development costs
Expenditures for research activities conducted for the purpose of obtaining new scientific or technical knowledge and
understanding are recognized as profit or loss as incurred.
③ After considering non-cash items
Other intangible assets are measured at cost less accumulated amortization and accumulated impairment losses using the cost
model.
In addition, intangible assets that are identified in a business combination separately from goodwill are measured at their acquisition date fair values as acquisition costs. Amortization is based on the straight-line method over the estimated useful life of the asset from the date the asset becomes available for use. Depreciation is calculated based on the depreciable value. Amortizable value is calculated by subtracting the residual value from the acquisition cost of the assets.
―97―
(Translation) This document has been translated from the Japanese original for the convenience of overseas stakeholders. In the event of any discrepancy between this document and the Japanese original, the original shall prevail.
Estimated useful lives are as follows: Software
3 ~
16
Year
Customer related asset
8 ~
19
Year
Technology assets
8 ~
10
Year
Others
7 ~
20
Year
Amortization methods, useful lives and residual values are reviewed at the end of each fiscal year and revised as necessary. Indefinite-lived intangible assets are stated at cost less accumulated impairment losses. In addition, they are not amortized but are tested for impairment annually or whenever indicators of impairment exist. (9) Lease (Lessee) ① Lease liabilities
Lease liabilities are recognized from the inception date of the lease and are measured at the present value of lease
payments that have not been paid. The discount rate is the calculated interest rate of the lease or the additional borrowing rate of our group if the calculated interest rate cannot be easily determined. Subsequent to the inception date, amounts will increase or decrease due to interest and lease payments on the lease liabilities.
② Right-of-use asset
The right-of-use asset is measured at cost, adjusted for initial direct costs, prepaid lease payments, etc., to the initial
measurement of the lease liability from the inception date of the lease. Subsequent to the inception date, the cost model is applied and measured net of accumulated depreciation and impairment losses. Amortized on a straight-line basis over the shorter of the useful life of the right-of-use asset or the end of the lease term from the lease commencement date.
In addition, for short-term leases and leases where the underlying assets are small, the Company applies the exemption from recognition and does not recognize a right-of-use asset or a lease liability, but rather recognizes it as an expense on a straightline basis over the term of the lease. (Lessor) The Group classifies leases into finance leases and operating leases. A lease is classified as a finance lease if substantially all the risks and economic benefits associated with ownership of the underlying asset are transferred to the lessee; if all the risks and economic benefits associated with the ownership of the underlying assets are not substantially transferred to the lessee, then it is classified as an operating lease. (10) Investment real estate Investment real estate is real estate held for the purpose of earning rental income or capital gains or both. The measurement and depreciation methods for investment properties are in accordance with property, plant and equipment. The estimated useful lives of the investment properties are 5 to 60 years. Depreciation methods, useful lives and residual values are reviewed at the end of each fiscal year and revised as necessary. (11) Assets held for sale Assets or disposal groups for which the carrying amount is expected to be recovered through sale, rather than through continuous use, are classified as assets held for sale, such as those assets that can be immediately sold under the current conditions and for which the sale is completed within 1 year after the management of our group commits to the sale. (12)Impairment of non-financial assets The carrying value of our group's non-financial assets, excluding inventories, contract assets, assets held for sale, deferred tax assets and net defined benefit assets, is determined at each period end for indicators of impairment. If indicators of impairment are present, the recoverable amount of the asset is estimated. The recoverable amount of an asset or CGU is the greater of its value in use or fair value less costs to sell. In determining value in use, estimated future cash flows are discounted to present value using a pre-tax discount rate that reflects the time value
―98―
(Translation) This document has been translated from the Japanese original for the convenience of overseas stakeholders. In the event of any discrepancy between this document and the Japanese original, the original shall prevail.
of money and the risks specific to the asset. An impairment loss is recognized when the carrying amount of an asset or CGU exceeds its recoverable amount. For assets other than goodwill, previously recognized impairment losses are evaluated at the end of each period for indicators of loss reduction or extinguishment. If the estimates used in determining the recoverable amount change, the impairment loss is reversed. The reversal amount is limited to an amount not to exceed the carrying amount less depreciation and amortization if no impairment loss is recognized. The treatment of impairment losses related to goodwill is described in "(8) Goodwill and Intangible Assets ①Goodwill" and
the treatment of impairment losses related to indefinite-lived intangible assets is described in "(8) Goodwill and Intangible Assets ③Other Intangible Assets."
(13) Employee benefit
① Postretirement benefits
Our Group has a retirement lump-sum payment plan and a pension plan as a postretirement benefit plan for employees.
These plans are classified into defined contribution plans and defined benefit plans.
a Defined contribution plan Costs related to postretirement benefits for defined contribution plans are recognized as an expense in the period in which the employees provide services. b Defined benefit plan The present value of defined benefit obligations and the related current service cost and prior service cost are calculated for each individual plan using the projected unit credit method. The discount rate is determined by establishing a discount period based on the expected period to future benefit payments and by reference to the market yield of high-quality corporate bonds at the end of the period corresponding to the discount period. Liabilities or assets related to defined benefit plans are calculated by deducting the fair value of plan assets from the present value of defined benefit obligations. Remeasurements of net defined benefit assets or liabilities are recognized in other comprehensive income in the period in which they occur and are transferred to retained earnings. ② Short-term employee benefits
Short-term employee benefits are not discounted and are expensed as the related services are rendered. For bonuses, we recognize a liability for the estimated amount to be paid under those plans when our group has a current
legal and constructive obligation to pay as a result of labor provided by employees in the past and the amount can be reliably estimated. (14) Reserves and contingent liabilities Provisions are recognized when, as a result of past events, our group has a legal or constructive obligation that is reasonably estimable and it is probable that an outflow of economic resources will occur to settle the obligation. The allowance is discounted to the present value of estimated future cash flows using a pre-tax discount rate that reflects the time value of money and the risks specific to the liability, if the time value of money is significant. Common stock Accrued warranty costs are provided for future expenditures, such as repair costs, which are incurred after delivery of the product, by estimating the amount of such costs incurred on a case-by-case basis. The allowance for losses on orders is provided for future losses on contract awards by individually estimating the estimated amount of losses on contracts awarded as of the end of the period. If the Company has a liability that may be incurred as of the end of the fiscal year, and it cannot be ascertained if it is a liability as of the end of the fiscal year, or if it does not meet the recognition criteria for the allowance, it is recorded as a contingent liability. (15) Shareholders' Equity ① Common stock
Common stock is classified as equity. Additional costs directly related to the issuance of common stock and stock options are
―99―
(Translation) This document has been translated from the Japanese original for the convenience of overseas stakeholders. In the event of any discrepancy between this document and the Japanese original, the original shall prevail.
recognized net of tax as a deduction of equity. ② Treasury stock
When treasury stock is repurchased, consideration paid, including direct transaction costs, net of tax, is recognized as a
deduction to equity. When treasury stock is disposed of, the difference between the consideration received and the carrying
amount of treasury stock is recognized as equity.
―100―
(Translation) This document has been translated from the Japanese original for the convenience of overseas stakeholders. In the event of any discrepancy between this document and the Japanese original, the original shall prevail.
③ Share-based payment transactions a Stock option system
Until March 2017, we have introduced a stock option plan for our directors and executive officers (excluding outside
directors, hereinafter referred to as "directors, etc.") that allows them to exercise their right to purchase our shares. Under the plan, stock options vest on the grant date of stock-based awards, and therefore are estimated at fair value at the grant date, and recognized as expense in a lump sum at the grant date, with the same amount recognized as equity. The fair value of options granted is determined using the Black-Scholes model, considering the terms and conditions of the options. This system was abolished in March 2017 (however, the stock options already granted to directors and others as stock-based compensation stock options that have not yet been exercised will continue to exist). b Stock Benefit Trust Plan (Equity Settlement Type) In May 2017, we introduced an equity compensation plan to provide our directors, etc. with their own shares, etc. through trusts. Stock-based compensation is measured at the fair value of the services received and the corresponding increase in equity at the grant date (for equity instruments) and is recorded as an expense over the vesting period, with the same amount recognized as an increase in equity. (16) Revenue Our group recognizes revenue based on the following 5-step approach: Step 1: Identify Contracts with Customers Step 2: Identify Performance Obligations in Contracts Step 3: Calculate the transaction price Step 4: Allocate the transaction price to the performance obligations in the contract Step 5: Recognize revenue when the entity meets its performance obligations ① Performance obligations fulfilled at a point in time
Our main business of the Group is the manufacture and sale of industrial robot parts, equipment for construction machinery,
brake systems and door systems for railway vehicles, aircraft parts, brake systems and drive control systems for automobiles, marine vessel control systems, automatic door systems for buildings and general industries, and platform safety equipment. For the sale of these products, we recognize revenue principally at the time of delivery of the product as the customer often determines that control over the product and performance obligations will be satisfied at the time of delivery of the product. Revenue is measured at the consideration promised in customer contracts, less discounts, rebates and returns.
② Performance obligations to be met over a period of time
Our group recognizes revenue in satisfaction of performance obligations over a period of time as control over products or
services is transferred over a period of time if any of the following criteria are met: a Consume the benefits provided by the customer as they perform at the same time. b The performance creates or appreciates the asset and the customer controls the creation or accretion of the asset. c It has the enforceable right to receive payment for the performance that it has completed to date, and does not create any other assets that can be diverted. In our group, the revenue associated with performance obligations that are satisfied over a period of time is the performance
obligation for platform safety equipment, etc. Revenue for platform safety equipment and other items is estimated and recognized on a progress basis. Progress is calculated as the ratio of actual costs to total estimated costs (input method). (17) Financial income and costs Financial income consists of interest income, dividend income, gain on valuation of investment securities, foreign exchange gains, etc. Interest income is recognized as incurred using the effective interest method. Dividend income is recognized when our Group's right of receipt is established. Financial costs consist of interest expense, loss on devaluation of derivatives, and loss on devaluation of investment securities.
―101―
(Translation) This document has been translated from the Japanese original for the convenience of overseas stakeholders. In the event of any discrepancy between this document and the Japanese original, the original shall prevail.
(18) Corporate income tax Income taxes consist of current and deferred income taxes. These are recognized in profit or loss except for items recognized in other comprehensive income, items directly recognized in equity, and items recognized in business combinations. Current taxes are calculated by multiplying current taxable income by the tax rate enacted or substantially enacted as of the end of the fiscal year. Deferred income taxes are recognized for temporary differences between the financial statement carrying amounts of assets and liabilities and their respective tax bases. Deferred tax assets are recognized for deductible temporary differences, unused tax credit carryforwards and operating loss carryforwards to the extent that taxable income is expected to be available to recover them, and deferred tax liabilities are recognized for taxable temporary differences in principle. Deferred tax assets or liabilities are not recorded in the following cases: ・Initial recognition of an asset or liability in a transaction other than a business combination and which does not affect either accounting earnings or taxable income for tax purposes ・Differences on investments in subsidiaries, affiliates, and joint control where it is probable that the differences will not reverse in the foreseeable future ・Taxable temporary differences arising from initial recognition of goodwill Deferred income taxes are measured using tax rates expected to be in effect when temporary differences reverse under laws enacted or substantially enacted at the end of the fiscal year. Deferred tax assets and liabilities are offset when the Company has a legally enforceable right to offset current tax assets and liabilities and income taxes are imposed by the same taxing authority on the same taxable entity. (19) Basic net income Basic earnings per share is computed by dividing net income available to our common stockholders by the weighted average number of common shares outstanding, adjusted for treasury stock for the period. Diluted earnings per share is computed by adjusting for the effect of all dilutive potential common shares. Our potential common stock has stock options. (20) Change in accounting policy Our Group has adopted the following pronouncements from the fiscal year under review. The adoption of this statement did not have an impact on the consolidated financial statements. Statement of Standards
Standard name
Outline of New Establishment and Revision
IAS No. 12
Corporate income tax
Clarified accounting for deferred taxes on assets and liabilities arising from a single transaction
In addition, our group adopted the following pronouncements from the second quarter of the current fiscal year. The adoption of this statement did not have an impact on the consolidated financial statements. The Pillar 2 Model Rule contains a 1-time exception that eliminates the requirement to recognize and disclose the related deferred tax assets and liabilities, and our group retrospectively applies this exception; therefore, we have not recognized any deferred tax assets or liabilities related to the Pillar 2 Model Rule. Statement of Standards
Standard name
Outline of New Establishment and Revision
IAS No. 12
Corporate income tax
Temporary exceptions to recognition and disclosure of deferred tax assets and liabilities related to "International Tax Reform-Pillar 2 Model Rules"
―102―
(Translation) This document has been translated from the Japanese original for the convenience of overseas stakeholders. In the event of any discrepancy between this document and the Japanese original, the original shall prevail.
4.Additional information (1) Revision of errors of prior periods It has come to light that in the calculation of equity in earnings (losses) of affiliates at certain of the Company’s equity-method affiliates, the financial figures obtained from the said equity-method affiliates, which should have been calculated based on changes in consolidated net assets, including the subsidiaries of said equity-method affiliates, were instead calculated based on changes in non-consolidated net assets. As a result, an error was identified whereby the amounts reported as “Equity in earnings of affiliates” in the Company’s consolidated statements of income and “Investments accounted for using the equity method” in the consolidated statement of financial position have been consistently understated since prior years. The Company has determined that retrospective restatement was necessary regarding the above error and has revised the consolidated financial statements and other financial statements contained in the Annual Securities Reports, the Semiannual Reports and the Quarterly Reports that have already been submitted. We have also revised the other errors contained therein. :
―103―
(Translation) This document has been translated from the Japanese original for the convenience of overseas stakeholders. In the event of any discrepancy between this document and the Japanese original, the original shall prevail.
5.Critical accounting judgments, estimates and assumptions The preparation of consolidated financial statements in conformity with IFRS requires management to make judgments, estimates and assumptions that affect the application of accounting policies and the reported amounts of assets, liabilities, revenues and expenses. Actual results could differ from those estimates. Estimates and underlying assumptions are reviewed on an ongoing basis. Changes in accounting estimates are recognized in the period in which the estimates change and in future periods affected. Major accounting judgments, estimates and assumptions are as follows: (1) Valuation of inventory In accordance with "3. Important accounting policies " in the notes to inventories, our group makes assumptions about the cost of sales and selling expenses required to complete the calculation of net realizable value. Although management's best estimates and judgments determine these assumptions, they may be affected by changes in uncertain economic conditions in the future and could materially impact the consolidated financial statements if a review is required. The amount of the write-down of inventories is as described in Note "9. Inventories." (2) Significant assumptions used in the calculation of discounted cash flow projections for testing non-financial assets for impairment Our Group tests property, plant and equipment, intangible assets, right of use assets and goodwill for impairment in accordance with Note 3, "Important accounting policies." During the fiscal year under review, the following non-financial assets were tested for impairment. The goodwill impairment test is described in Note "12. Goodwill and Intangible Assets," and the impairment of non-financial assets, including goodwill, is described in Note "13. Impairment of Non-Financial Assets." ① Gilgen's goodwill
Goodwill (carrying amount: ¥16,435 million) related to Gilgen Door Systems AG and 8 subsidiaries in Accessibility
Solutions segment (hereinafter referred to as the "Gilgen Group") was tested for impairment on an annual basis in accordance with "Note 3. Important accounting policies." As a result, an impairment loss of ¥4,489 million was recorded for this goodwill because its value in use was less than its carrying amount. The recoverable amounts of non-financial assets related to Gilgen are measured at value in use. Value in use is calculated by discounting future cash flows determined based on the business plan of the business using a weighted-average cost of capital discount rate. Estimates of value in use include key assumptions such as projections of sales and operating margins in the business plan, projections of growth rates since the business plan period, and discount rates based on weighted average cost of capital. These assumptions are determined based on management's best estimates and judgments; however, because of the high degree of uncertainty involved in forecasting demand for key market conditions and other factors, if the profitability of the business is reduced and it is determined that sufficient cash flow cannot be generated, the amount of non-financial assets recognized in the consolidated financial statements for the following fiscal year could be materially affected.
② Goodwill of Power Control Company
Goodwill (carrying amount: ¥2,582 million) related to Power Control Company in Component Solutions Business was tested
for impairment on an annual basis in accordance with Note 3, “Important accounting policies." As a result, no impairment loss
was recorded for the goodwill as the value in use exceeded its carrying value. The recoverable amount of non-financial assets related to Power Control Company is measured at value in use. Value in use is calculated by discounting future cash flows determined based on the business plan of the business using a weighted-average cost of capital discount rate. Estimates of value in use include significant assumptions such as forecasts of sales in the business plan, projections of growth rates since the business plan period, and discount rates based on weighted average cost of capital. These assumptions are determined based on management's best estimates and judgments; however, because of the high degree of uncertainty involved in forecasting demand for key market conditions and other factors, if the profitability of the business is reduced and it is determined that sufficient cash flow cannot be generated, the amount of non-financial assets recognized in the consolidated financial statements for the following fiscal year could be materially affected.
―104―
(Translation) This document has been translated from the Japanese original for the convenience of overseas stakeholders. In the event of any discrepancy between this document and the Japanese original, the original shall prevail.
③ OVALO’s non-financial assets (property, plant and equipment, intangible assets and right of use assets)
OVALO GmbH and one of its subsidiaries in Transport Solutions segment were tested for impairment in accordance with
"Note 3. Important accounting policies" due to the Company's judgment that there were indications of impairment of nonfinancial assets related to this business, as production declines at major customers due to a semiconductor shortage during the
fiscal year under review. As a result, the value in use of the non-financial assets related to this business fell below its carrying amount, and therefore an impairment loss of ¥1,761 million (property, plant and equipment ¥590 million, intangible assets ¥392 million, and right of use assets ¥779 million) was recorded, which corresponds to the entire carrying amount. The recoverable amount of non-financial assets related to OVALO's business is measured at value in use. The value in use is calculated by discounting future cash flows based on OVALO Group's business plan at a discount rate based on the weightedaverage cost of capital. Estimates of value in use include assumptions such as sales forecasts for major customers in the business plan. These assumptions are determined based on management's best estimates and judgments; however, because of the high degree of uncertainty involved in forecasting demand for key market conditions and other factors, if the profitability of the business is reduced and it is determined that sufficient cash flow cannot be generated, the amount of non-financial assets recognized in the consolidated financial statements for the following fiscal year could be materially affected. (3) Reserves and contingent liabilities Our group records reserves for product warranties and other items in the consolidated statements of financial condition. These accruals are based on our best estimate of the expenditures required to settle the obligation, taking into account the risks and uncertainties associated with the obligation at the end of the period. The amount of expenditures required to settle liabilities is calculated by comprehensively considering possible future results. However, the amount may be affected by the occurrence of unforeseeable events or changes in circumstances. If actual payments differ from the estimates, the amount recognized in the consolidated financial statements for the following fiscal year and thereafter may be materially affected. Contingent liabilities, if any, are disclosed after considering all available evidence at the date of the financial statements and considering their likelihood and amount of occurrence. The details of the allowance and its carrying value are described in Note "18. Reserves," and the contingent liabilities are described in Note "34. Contingent Liabilities." (4) Measurement of defined benefit obligations Our group has various retirement benefit plans, including defined benefit plans. The present value of the defined benefit obligations and related service costs for each of these plans are based on actuarial assumptions, such as discount rates and mortality rates. Although actuarial assumptions are determined based on management's best estimates and judgments, they may be affected by changes in uncertain economic conditions in the future and could materially impact the consolidated financial statements if a review is required.
Creator: PScript5.dll Version 5.2.2
Bull 0
Bear 0
Routine
2026年9月30日
各位 会社名 ナブテスコ株式会社 代表者名代表取締役木村和正 (コード番号 6268 東証プライム) 問合せ先 コーポレート・コミュニケーション部長峯岸 康 (TEL 03-5213-1134)
過年度の有価証券報告書等に係る訂正報告書の提出 及び過年度の決算短信等に係る訂正に関するお知らせ
当社は、本日付けで過年度の有価証券報告書、四半期報告書及び半期報告書の訂正報告書を関東 財務局へ提出するとともに、過年度の決算短信の訂正を行いましたので、下記のとおりお知らせい たします。 記 1.訂正の経緯及び理由 当社は 2026 年 8 月 14 日に開示いたしました「(訂正・数値データ訂正) 「2026 年 12 月期第 2四半期(中間期)決算短信〔IFRS〕 (連結)」の一部訂正について」にてお知らせの通り、 持分法適用関連会社であるTMTマシナリー株式会社(当社出資比率 33%)の持分法による投 資利益について、会計監査人による指摘を踏まえ、過去に提出済みの有価証券報告書等に記載 されている連結財務諸表および財務諸表、四半期連結財務諸表並びに中間連結財務諸表の対象 となる部分について訂正することといたしました。 なお、過年度において重要性の観点から訂正を行っていなかった事項も併せて訂正しており ます。 2.訂正報告書提出の対象書類 有価証券報告書 第 19 期(自 2021 年 1 月 1 日 第 20 期(自 2022 年 1 月 1 日 第 21 期(自 2023 年 1 月 1 日 第 22 期(自 2024 年 1 月 1 日 第 23 期(自 2025 年 1 月 1 日
至 至 至 至 至
四半期報告書 第 21 期(自 2023 年 1 月 1 日 第 22 期(自 2024 年 1 月 1 日
至 2023 年 9 月 30 日) 至 2024 年 3 月 31 日)
半期報告書 第 22 期(自 2024 年 1 月 1 日 第 23 期(自 2025 年 1 月 1 日 第 24 期(自 2026 年 1 月 1 日
至 2024 年 6 月 30 日) 至 2025 年 6 月 30 日) 至 2026 年 6 月 30 日)
2021 年 12 月 31 日) 2022 年 12 月 31 日) 2023 年 12 月 31 日) 2024 年 12 月 31 日) 2025 年 12 月 31 日)
3.訂正対象の決算短信 決算短信 2025 年 12 月期決算短信〔IFRS〕(連結) 四半期決算短信 2024 年 12 月期第3四半期決算短信〔IFRS〕 (連結)* 2025 年 12 月期第1四半期決算短信〔IFRS〕 (連結)* 2025 年 12 月期第3四半期決算短信〔IFRS〕 (連結)* 2026 年 12 月期第1四半期決算短信〔IFRS〕 (連結) 2026 年 12 月期第2四半期(中間期)決算短信〔IFRS〕(連結) *は XBRL のみ提出いたします。 4.訂正による過年度の連結業績への影響額 今回の訂正に伴う過年度の連結業績への影響額は以下の通りです。 (単位:百万円) 期間
第 19 期 (2021 年 12 月期) 通期
第 20 期 (2022 年 12 月期) 通期
第 21 期 (2023 年 12 月期) 第3四半期
第 21 期 (2023 年 12 月期) 通期
項目 売上高 営業利益 税引前利益 親会社の所有者に 帰属する当期利益 資産合計 資本合計 売上高 営業利益 税引前利益 親会社の所有者に 帰属する当期利益 資産合計 資本合計 売上高 営業利益 税引前利益 親会社の所有者に 帰属する当期利益 資産合計 資本合計 売上高 営業利益 税引前利益 親会社の所有者に 帰属する当期利益 資産合計 資本合計
訂正前 (a) 299,802 30,017 101,966
訂正後 (b) 299,641 29,669 101,806
影響額 (b)-(a) -161 -348 -160
64,818
64,771
-47
-0.1%
481,718 254,995 308,691 18,097 15,763
483,653 256,456 309,123 18,654 16,553
1,935 1,461 432 557 790
0.4% 0.6% 0.1% 3.1% 5.0%
9,464
10,415
951
10.0%
459,293 263,228 243,584 12,948 21,072
462,440 265,782 243,320 12,846 21,351
3,147 2,554 -264 -102 279
0.7% 1.0% -0.1% -0.8% 1.3%
13,293
13,521
228
1.7%
423,215 275,764 333,631 17,376 25,629
427,285 278,738 333,367 16,660 25,316
4,070 2,974 -264 -716 -313
1.0% 1.1% -0.1% -4.1% -1.2%
14,554
14,226
-328
-2.3%
422,065 275,894
428,630 278,145
6,565 2,251
1.6% 0.8%
増減率 -0.1% -1.2% -0.2%
期間
第 22 期 (2024 年 12 月期) 第1四半期
第 22 期 (2024 年 12 月期) 第2四半期 (中間期)
第 22 期 (2024 年 12 月期) 通期
第 23 期 (2025 年 12 月期) 第2四半期 (中間期)
第 23 期 (2025 年 12 月期) 通期
第 24 期 (2026 年 12 月期) 第1四半期
第 24 期 (2026 年 12 月期) 第2四半期 (中間期)
項目 売上高 営業利益 税引前利益 親会社の所有者に 帰属する当期利益 資産合計 資本合計 売上高 営業利益 税引前利益 親会社の所有者に 帰属する当期利益 資産合計 資本合計 売上高 営業利益 税引前利益 親会社の所有者に 帰属する当期利益 資産合計 資本合計 売上高 営業利益 税引前利益 親会社の所有者に 帰属する当期利益 資産合計 資本合計 売上高 営業利益 税引前利益 親会社の所有者に 帰属する当期利益 資産合計 資本合計 売上高 営業利益 税引前利益 親会社の所有者に 帰属する当期利益 資産合計 資本合計 売上高 営業利益 税引前利益 親会社の所有者に 帰属する当期利益 資産合計 資本合計
訂正前 (a) 72,181 3,991 5,131
訂正後 (b) 72,181 3,837 4,898
2,640
影響額 (b)-(a)
増減率
0 -154 -233
0.0% -3.9% -4.5%
2,466
-174
-6.6%
425,650 278,067 152,491 6,426 7,839
429,553 280,256 152,491 6,365 7,776
3,903 2,189 0 -61 -63
0.9% 0.8% 0.0% -0.9% -0.8%
4,204
3,772
-432
-10.3%
433,343 285,406 323,384 14,788 15,747
437,723 287,425 323,384 15,012 16,184
4,380 2,019 0 224 437
1.0% 0.7% 0.0% 1.5% 2.8%
10,119
10,188
69
0.7%
445,544 287,278 165,616 10,605 10,054
449,845 289,744 165,616 10,716 10,255
4,301 2,466 0 111 201
1.0% 0.9% 0.0% 1.0% 2.0%
6,513
6,701
188
2.9%
448,267 287,186 307,912 20,726 21,656
452,428 289,679 307,912 20,956 21,983
4,161 2,493 0 230 327
0.9% 0.9% 0.0% 1.1% 1.5%
15,695
15,255
-440
-2.8%
463,991 288,834 83,032 8,209 9,613
466,632 290,368 83,032 8,122 9,082
2,641 1,534 0 -87 -531
0.6% 0.5% 0.0% -1.1% -5.5%
5,483
6,798
1,315
24.0%
444,613 286,046 167,401 15,759 17,359
447,800 287,683 167,401 15,759 17,359
3,187 1,637 0 0 0
0.7% 0.6% 0.0% 0.0% 0.0%
12,515
12,515
0
0.0%
456,867 296,842
456,867 296,842
0 0
0.0% 0.0%
Prompts
Click prompts to add them under the company line, click again to take one out, then copy the result into your AI chat. Shared by Asian Century Stocks and Uncovered Thai Stocks. Thank you.
Nabtesco Corporation (ticker 6268), listed in Japan.
Copied
ETFs Holding Nabtesco Corporation
Exchange-traded funds whose newest published daily portfolio holds one of the company's listings, largest weight first.