2026 年 10 月 30 日 各位 会社名株式会社PEGASUS 代表者名代表取締役社長 美馬成望 (コード番号:6262 東証スタンダード) 問合 せ 先専務取締役執行役員管理本部長岡田義秀 (TEL. 06-6451-1351) 「第 82 期(2027 年度)‐第 84 期(2029…
2026 年 10 月 30 日
各位
会社名株式会社PEGASUS
代表者名代表取締役社長
美馬成望
(コード番号:6262 東証スタンダード)
問合 せ 先専務取締役執行役員管理本部長岡田義秀
(TEL. 06-6451-1351)
「第 82 期(2027 年度)‐第 84 期(2029 年度)中期経営計画」の公表について
当社は、本日開催の取締役会において、2027 年度から 2029 年度までを対象とする中期経
営計画(以下、本中期経営計画といいます。
)の策定を決議いたしましたので、下記のとお
りお知らせいたします。
記
当社は、持続的な企業価値向上を実現するため、収益構造改革と自己資本の適正化を両面
から推進することを重点施策として、本中期経営計画を策定いたしました。
経営陣はステークホルダーの皆様の信頼に応えるべく、強い覚悟をもって本中期経営計
画を着実に実行してまいります。
1. 基本方針
資本効率の向上に向けて事業戦略と資本政策を構造的に見直し、事業戦略・資本政策・
ガバナンス改革を一体で推進することで、次期中期経営計画における ROE9%超・PBR
1倍超の達成につなげる。
また、本中期経営計画を、ROE9%超・PBR1倍超の達成に向けた「改革期間」と位置付
け、2029 年度の ROE 目標を 7.5%と設定し、持続的な企業価値向上に向けた経営基盤
の強化を図る。
2. 事業戦略
アパレルマシナリー事業では、製品ラインナップの強化を行った上で世界販売戦略の
練り直しを進める。また、
「無人縫製・合理化革新ライン構想」を打ち出し将来的な人
手不足に対し先手を打って自動化を行っていく。
オートモーティヴ事業では、顧客ニーズに対応した製品ラインナップの拡充を図ると
ともに、モノづくりにおける合理化投資を推進し、採算性の改善に積極的に取り組む。
3. 資本政策
本中期経営計画では、特に資本効率性を最優先に意識し、株主還元については、原則
DOE(株主資本配当率)6%以上の配当を実施する。還元の実施にあたっては、財務健
全性を維持しつつ、自己資本比率 60%台まで低減し、将来の成長投資の原資も適切に
確保していく。
なお、本中期経営計画の詳細につきましては、別添資料をご参照ください。
以
上
中期経営計画
第82期(2027年度)- 第84期(2029年度)
目次
1.はじめに
4.本中期経営計画
-
トップメッセージ
-
本中期経営計画基本方針
-
本日お伝えしたいこと
-
本中期経営計画財務目標
-
PEGASUSが目指すもの
-
本中期経営計画基本方針事業戦略|アパレルマシナリー事業
-
本中期経営計画方針|開示の背景
-
本中期経営計画基本方針事業戦略|オートモーティヴ事業
2.事業概要
5.重点戦略
-
セグメント別事業概要
-
重点戦略 インドへの販売強化|アパレルマシナリー事業
-
アパレルマシナリー事業概要
-
重点戦略 インドへの本格進出|オートモーティヴ事業
-
オートモーティヴ事業概要
6.PBR・ROE改善に向けた資本政策・株主還元
3.現中期経営計画の振り返り
-
PBR・ROE改善に向けた資本政策
-
目標値の達成状況見通し
-
キャッシュアロケーション・株主還元について
-
現中期経営計画の振り返り
-
B/Sマネジメント施策について
-
過去10年間を振り返っての課題認識
-
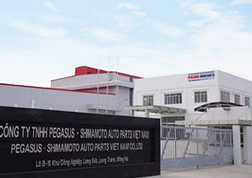
アパレルマシナリー事業の課題:ベトナム新工場
-
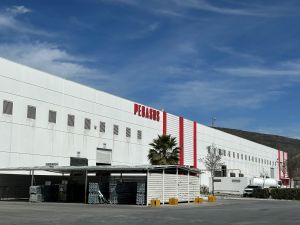
オートモーティヴ事業の課題:中国南通工場
7.事業戦略/資本政策を支えるESG戦略
-
G(ガバナンス):取締役会の実効性の向上について
-
G(ガバナンス):実効的なガバナンス体制への転換
-
G(ガバナンス):資本市場との対話
-
S(社会):人的資本戦略
-
E(環境):環境負荷軽減
2
- はじめに
1-1. トップメッセージ
本中期経営計画 <2027年度-2029年度> 策定にあたって
現中期経営計画<2024年度-2026年度>(以下、現中計)の3年間は、経営環境
の急激な変化が当社の業績に大きな影響を及ぼしました。こうした状況を踏まえ、
現行の事業モデルの延長線上では資本コストを上回る収益性の実現は困難であり、
抜本的な改革が必要です。
当社はROE9%、PBR1倍の早期達成を宣言しておりますが、本中期経営計画
(以下、本中計)策定にあたり、改めて資本効率性を高めるための事業戦略(守り
と攻め)と資本政策の構造的見直しを行った結果、ROE9%の達成は2032年度とし、
本中計<2029年度>のROE目標は7.5%といたします。
事業戦略の守りの観点では、在庫管理や生産構造の見直しや、投資規律の徹底に
より、資本効率の改善を図ります。
攻めの観点では、中国企業の台頭による低価格戦略への対応と、人材の補強が本
中計の使命となります。中国が辿ってきた成長路線をインドで再現することを視野
に、アパレルマシナリー事業・オートモーティヴ事業それぞれにおいて、最適な進
出形態を早期に見極めます。
また、アパレルマシナリー事業においては、縫製作業員に対する世界的な人材不
足に備え、全自動の縫製工場実現に向けての無人縫製構想を着実に前に進めてまい
ります。
資本政策も資本効率性向上の観点から抜本的に見直します。持続的な成長投資と
株主還元の充実を両立させることで、ROE9%の早期達成を実現してまいります。
本中計は、事業戦略、資本政策、ガバナンス改革を一体で推進する改革期間であ
り、次期中期経営計画(以下、次期中計)の達成に向けて、経営陣が強い覚悟を
もって実行してまいります。
株式会社PEGASUS
代表取締役社長
美馬成望
4
1-2. 本日お伝えしたいこと
本中期経営計画
第82期(2027年度)- 第84期(2029年度)
収益構造改革と自己資本の適正化を両面で行い、
ステークホルダーの信用を勝ち取り、企業価値の飛躍的向上を実現します。
アパレルマシナリー事業
ラインナップを強化した上で世界販売戦略を練り直します。無人縫製・合理化革新ライン構想を打ち出し将来的な人手不足
に対し先手を打って自動化していきます。
オートモーティヴ事業
顧客満足を満たすラインナップで、モノづくりにおいては合理化投資を促進し採算改善を積極的に行っていきます。
資本効率化
本中計の3年間は特に資本効率性を最優先に意識し、株主還元では原則DOE6%以上を目指します。株主還元の際には財務健
全性を重視し、自己資本比率60%台維持を目安に置きつつ、将来の成長投資の原資も適正に確保していきます。
【財務目標】
本中計では積極的な成長投資・戦略投資を実施し、かつ自己資本の適正化にも注力する仕込みの3年間と考えています
(2029年度 ROE目標7.5%)。
次期中計(2032年度)においてROE9%、PBR1倍につなげます。
5
1-2. 本日お伝えしたいこと
アパレルマシナリー事業の成長と収益性向上に向けた3つの重点戦略
1.収益性向上に向けた生産体制 2.全方位ラインナップ強化・
3.自社工場から顧客縫製工場
再編、原価改善、在庫・売掛
世界販売戦略による売上拡大
まで視野に入れた抜本的自
金管理強化 (P30)
(P32)
動化の促進 (P37)
重点施策
重点施策
重点施策
▸ 中国・ベトナムの生産能力再編
▸ 過剰生産の抑制・在庫適正化に
よるCCC改善
▸ アジア・アフリカ・南米におけ
るKOP(低価格戦略機)本格展
開
▸ 省力機の販売強化・
ラインナップ拡大
▸ 原価低減・投資採算管理の強化
▸ 人員体制強化
▸ 無人縫製実現に向けた
ロードマップの明確化
▸ 合理化革新ライン「FMS」の開発
進捗管理強化
重点指標
重点指標
重点指標
▸ CCC 11.8ヶ月 → 6.5ヶ月
▸ 売上高 138億円 → 200億円
▸ 自動機・省力機売上高
96億円 → 150億円
売上構成比 69% → 75%
6
1-2. 本日お伝えしたいこと
オートモーティヴ事業の成長と収益性向上に向けた2つの重点戦略
1.高付加価値へのシフトと生産拠点
拡大による持続的な売上成長と
収益基盤強化 (P42)
2.生産性・品質向上による
コストダウン (P49)
重点施策
重点施策
▸ 高付加価値商品へのシフト・
ラインナップ拡大
▸ 工程改善・自動化による生産性向上
▸ メキシコを中心とした
新規顧客拡大
▸ 材料変更・歩留まり改善による
原価低減
▸ 品質・技術・工法の標準化
重点指標
重点指標
▸ 売上高 83億円 → 100億円
▸ 累計コストダウン額 5.8億円
7
1-3. PEGASUSが目指すもの
経営基本方針
世界の人々と交流を深め、信頼される企業活動を展開します。
<企業理念>
ペガサス・テクノロジーを究め、世界品質のものづくりを目指
します。
人と技術を通じて、
常にお客様から学び、ニーズを形にし、サービスや情報の提供
に最善をつくします。
よりよい
関係先、社員との信頼関係を築き、互いの成長発展のために努
力します。
製品・サービス・品質
の提供に取り組み、
社会の発展に
PEGASUSは、
いつだって人のそばにある
貢献すること。
ペガサスグループ行動指針
社会貢献
お客様のために
会社資産・会社情報の尊重
人権の尊重
健全な職場
海外各国の法、文化の尊重
周知徹底
8
1-4. 本中期経営計画方針|開示の背景
1 外部環境の大きな変化
▸ 地政学リスクが顕在化し、
主要市場の動きに変化
▸ 中国企業等とのグローバル競争が
さらに激化
成長に向けた戦略の一部再考が必要に
2 コストとリターンの不均衡
▸ 株主資本コストは9%程度と推計
▸ 一方、ROEは 3期連続で5%未満
(24/3期~26/3期)
期待収益率改善に向けた事業の再構築が必要
3 本中計の前倒し公表
▸ 本来であれば本中計は来年5月に開示するところ、
上記の状況をふまえて前倒しの公表とした。
9
2.事業概要
2-1. セグメント別事業概要
当社の事業は、アパレルマシナリーとオートモーティヴの2つのセグメントで構成
されています
400
棒グラフ
売上高(左軸:億円単位)
20%
折れ線グラフ
営業利益率(右軸:%単位)
オートモーティヴ事業
15%
2025年度
ROE 1.0%
10%
300
4.4%
5%
216
0%
売上構成比:36%
自動車用安全ベルト関連部品を
はじめとするダイカスト部品の
製造販売
オートモーティヴ事業は
2007年事業開始と事業年
数は少ないものの売上構
成比36%まで成長
200
78
100
138
アパレルマシナリー事業
売上構成比:64%
ニット衣料等の縫製に使用される
環縫いミシンの製造販売
6/
3期
'2
5/
3期
'2
4/
3期
'2
3/
3期
'2
2/
3期
'2
1/
3期
'2
0/
3期
'2
9/
3期
'1
8/
3期
'1
7/
3期
'1
6/
3期
'1
5/
3期
'1
4/
3期
'1
3/
3期
'1
2/
3期
'1
1/
3期
'1
0/
3期
'1
9/
3期
'0
8/
3期
'0
7/
3期
'0
6/
3期
'0
5/
3期
'0
4/
3期
'0
3/
3期
'0
2/
3期
'0
'0
1/
3期
0
11
2-2. アパレルマシナリー事業概要
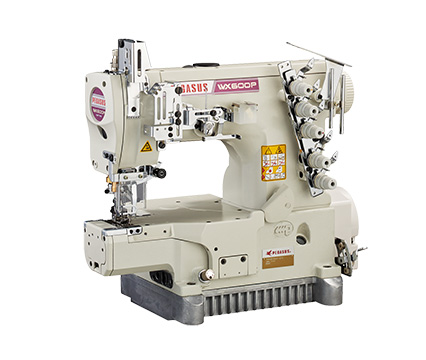
PEGASUSは、
110年の歴史を誇る
工業用ミシン「環縫いミシン」
の専業メーカーです
( か ん ぬ い )
環縫い
向いている用途:伸縮性のある素材に適している。
特徴:ルーパー糸で鎖状に絡ませる縫い目
Tシャツ
本縫い
ニット
ジーンズ
スポーツウェア
向いている用途:幅広い素材に対応。伸縮性には弱い。
特徴:上糸と下糸を結び合わせる最も一般的な縫い目
シャツ
パンツ
ジャケット
12
2-2. アパレルマシナリー事業概要
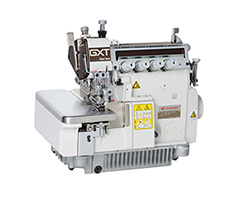
PEGASUSの多様な環縫いミシンは、伸縮性のある衣服のさまざまな箇所に使われ、
日常の身近な製品づくりを支えています
PEGASUSのミシン紹介
環縫い
PEGASUSは、
いつだって人のそばにある
:
13
2-2. アパレルマシナリー事業概要
高品質に裏打ちされた圧倒的なブランド力と販売技術力を強みに、
今後は自動機需要や低価格戦略機拡大を成長機会として取り込みます
PEGASUSのミシンが選ばれる理由
① 最高品質の部品を調達し※部品同士のすり合わせ精度を最高レベルまで引き上げ、個々の部品の一糸乱れ
ぬ連携を実現する品質管理力
※ 40数年共に品質を磨き上げ成長してきた部品調達先との信頼関係により実現
② 販売技術力(現場の技術力、顧客対応力、グローバルな販売拠点)
今後の環境変化
① 人手不足がより深刻化し、無人縫製(縫製の自動化・
省力化)が求められるようになる
② 新興国向けの従来型ミシンは品質を維持した低価格
機種が伸びる
今後の環境変化を踏まえた戦略
① 自動機メーカーの機能を自社に取り込み、ユニット
販売で利益率を向上させる
② 低価格戦略機(KOP: Key Operational Product)を南米、
アジア、アフリカへの市場拡大の突破口とする
③ 自社工場の生産体制の自動化にも注力する
高級環縫いミシンメーカーシェア
*当社調べ
27%
PEGASUS
73%
高級環縫いミシン同業
14
2-3. オートモーティヴ事業概要
高品質・高信頼性のモノづくりを強みに、
既存自動車部品からEV向け電装筐体・熱マネジメント部品へ展開しています
PEGASUS 既存部品
ICE車両搭載位置
2
4
6
1
5
4
2
3
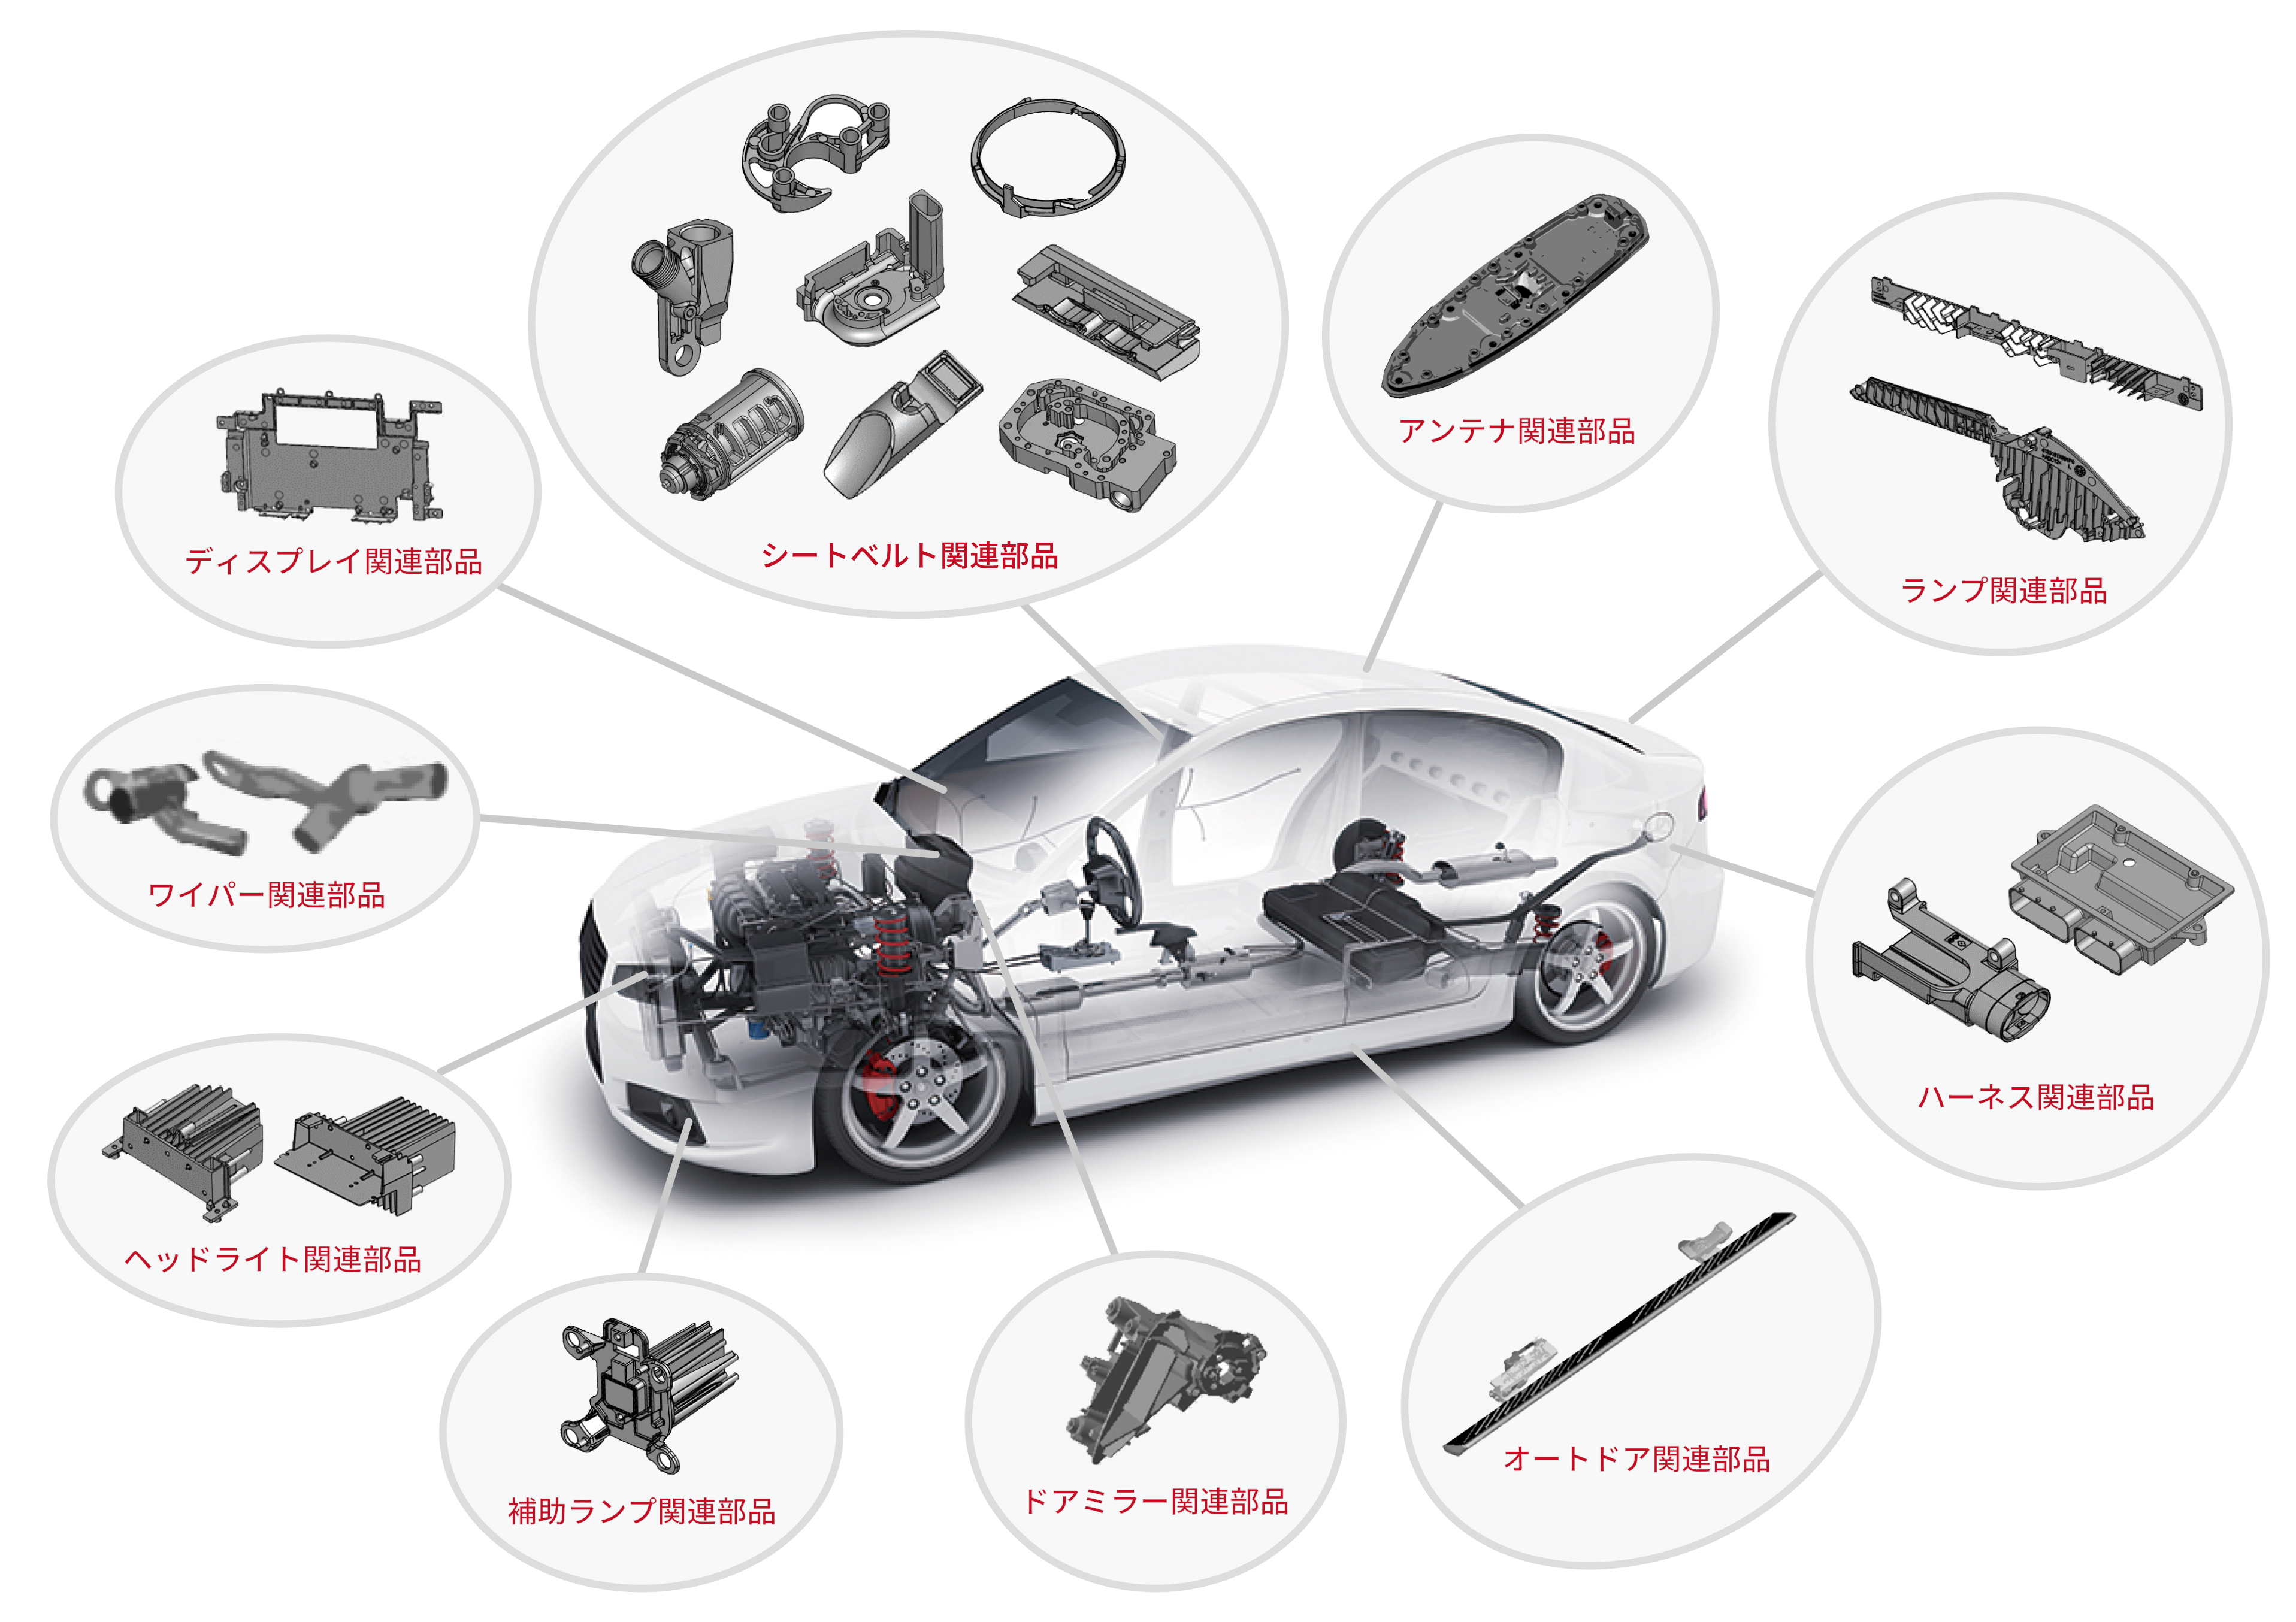
シャークフィンアンテナ
LEDライト用ヒートシンク
AM/FM・GPS・通信アンテ
ナをルーフ一体で収納
LEDの発熱を放散し、光量
と寿命の安定に寄与
5
1
7
3
リトラクター
シートベルトを巻き取り、衝突
時にロックして乗員を拘束
7
6
ワイパー機構
ドアミラー部品
モーターの回転をリンクへ伝
え、ワイパーを往復駆動
ミラーを支持し、格納・
角度調整機構を保持
8
9
PEGASUSの強み(既存事業基盤)
Front
Housing
● 精密アルミダイカストによる量産技術
● 自動車向け高品質・高信頼性のモノづくり
● 振動制御・放熱・機構部品の製造ノウハウ
Middle
Housing
● ダイカストから精密加工までの一貫生産体制
ディスプレイ部品
● グローバル生産拠点による安定供給力
表示パネルと基板を支持し、
振動や熱から保護
C.E.
Frame
液封式サイドマウント
ECU
エンジンを支持し、液体流動
とゴムで振動を吸収
スタートASSY
自動車の各機能を制御する
ための小型コンピューター
エンジンを始動し、クランキン
グ回転を伝達する電動ユニット
既存技術を活かし、EV向け電装筐体・熱マネジメント部品へ展開
15
2-3. オートモーティヴ事業概要
高精度な再現力と安定供給を支えるモノづくり力を強みに、
今後はコスト競争力強化、高付加価値品拡大、顧客接点の強化を進めていきます
PEGASUSのダイカストが選ばれる理由
① 顧客要求を高精度に再現(顧客図面を3D化し、試作段階から要求品質を満たす再現力)
② 製造ノウハウの蓄積・アパレルマシナリー事業で培ったモノづくり力
③ 長期供給を支える高度な品質管理に基づく安定した継続生産力
今後の環境変化
① 中国EVメーカー等における価格重視の調達姿勢が採算性に影響する可能性
② 顧客との物理的な距離がより重要になる
➢ 遠隔地からの供給では、新しい部品の相談や引き合いを獲得し難い
③ シートベルト以外の部品ニーズの高まり
今後の環境変化を踏まえた戦略
① 徹底したコスト競争力の強化(自動化・工程改善による原価低減)
② 品質への信頼を別部品の受注につなげる/取引製品の拡大・顧客当たりの売上を増加(高付加価値品の拡大)
➢ 「製品採用→品質への信頼→別製品の引き合い」という流れの強化
➢ シートベルト関連を起点にラインナップを広げる
③ 顧客に近接した生産拠点を展開
➢ メキシコやインド等でTier1・Tier2との接点を増やし、新しい部品ニーズを取り込む
16
3.現中期経営計画の振り返り
3-1. 目標値の達成状況見通し
外部環境の変化に加え、将来成長に向けた先行投資負担により、売上高・営業利
益・ROEはいずれも現中計目標を下回る見通しです
売上高未達要因
2023年度
(実績)
(目標)
(業績予想)
目標比
売上高
175 億円
300 億円
203 億円 ▲32.3 %
営業利益
0.38 億円
32 億円
1.3 億円 ▲95.9 %
アパレルマシナリー:
• ウクライナ情勢や米国関税措置の影響により、縫
製メーカーの投資意欲が減退し、2025年度以降
伸び悩んだ。
• 同業他社との協業についても、十分な進展が見ら
れなかった。
オートモーティヴ:
• 新興中国EVメーカー台頭による市場構造変化を
背景に価格競争が激化。中国メーカーの海外展開
拡大に伴い、ASEAN市場にも値下げ影響が波及。
営業利益未達要因
営業利益率
0.2 %
10.5 %
0.6 %
ROE
▲0.3 %
8.6 %
▲1.3 %
▲94.3 %
売上原価:
• アパレル:売上減少に伴う生産調整が継続し、原
価が高止まる傾向にある。
• オートモーティヴ:上記値下げ要求の激化、原材
料の高騰に伴う原価率アップ。
固定費:
• 賃金改定と中長期的な成長を見据えた戦略的人財
投資の推進による人件費増。
18
3-2.
現中期経営計画の振り返り|アパレルマシナリー事業
各施策は一定の進展が見られた一方、売上低迷下で生産体制拡充が利益に繋がらず、
低価格機種も展開国を拡大したものの、抜本的な売上拡大への寄与は限定的であった
テーマ
現中計での目標
無人縫製・省力機器
01
モーター一体型ミシン
次世代デジタル制御
新製品
開発
市場ニーズ対応
成果/現状認識
課題/示唆
研究開発・技術基盤は着実に進展
「開発する」から「売れる製品にする」へ
無人縫製、省力機器、モーター一体型ミシン、デジ
タル制御技術など、中長期的な競争力強化に向けた
研究開発を計画どおり推進。
市場ニーズに対応した仕様改善や、縫製品質向上に
向けた要素技術開発も進展した。
市場性・収益性を開発初期から検証し、事業化まで見据えてテ
ーマを選別
技術基盤は強化したが、売上・利益への貢献は限定的
顧客評価を仕様へ迅速に反映し、製品化・市場投入・販売拡大を
一体で推進
開発後の販売計画と収益目標を明確化し、新製品の売上・利益
貢献を実現
生産・供給体制の基盤を強化
設備拡充から「稼働率・収益性向上」へ
縫製要素技術
ベトナム工場の本格稼働・設備拡充
02
24時間生産システムの導入
中国との2大生産拠点体制
生産体制
拡充
新規加工設備・生産能力拡充
多品種小ロット生産体制
南米・アフリカ等の新市場開拓
03
販路
拡大
本中計の示唆
評価
ベトナム新工場の本格稼働。
24時間生産システムの導入については、生産減に
より投資効果が見込めず、増産タイミングを待つ。
国内工場再編や部品供給先の見直しも進め、中国・
ベトナムを軸とした生産能力と供給安定性の向上を
図った。
ベトナム工場の規模・コスト構造を最適化し、収益性の高い生産
体制を構築
需要に応じた生産配分で既存設備の有効活用を徹底し、稼働率
向上と投資回収を実現
一部設備の稼働率が低く、投資に見合う収益創出に課題
新市場・低価格帯への展開を推進
販売力の強化と新製品の市場浸透
既存機種のブラッシュアップ
南米を中心に新市場を開拓し、低価格戦略機を18
カ国へ展開。製品ラインナップの拡充にも取り組み
、市場ニーズに対応した提案力の向上を図った。
低価格戦略機の展開国を拡大し、現地ニーズに即した販売チャ
ネルを構築
品質と価格を両立した商品構成
販売協業の成果は限定的で、新製品の早期市場浸透が課題
JUKIとの販売協力体制
普及機種の戦略的投入
本中計では「収益性」「稼働率」「品質」を重視し、事業成果への転換を加速する。
アフリカ地域では、進出を進めるエジプトを足掛かりに、未開拓
国への展開を推進
評価順
19
3-2.
現中期経営計画の振り返り|オートモーティヴ事業
生産・技術・営業の基盤整備は進展したが、
中国メーカーの値下げ要求の激化により採算性の改善が図れなかった
テーマ
現中計での目標
成果/現状認識
課題/示唆
中国・メキシコ・ベトナムで生産基盤を強化
01
供給体制
構築
02
技術
開発
03
販路
拡大
本中計の示唆
生産設備の大幅拡充
EU地域への進出
製品ラインナップの拡充
自動化・省力化の積極推進
中国・メキシコで設備更新・増設を進め、生産能力を強化。
ベトナムではダイカスト設備の活用に向けた整備を推進した
。また、EU進出方針をインド市場へ転換し、現地市場・工
業団地の調査を開始した。
生産基盤の強化は進展したが、
多拠点での安定供給体制の確立は途上
高難度製品・自動化・製造技術を並行推進
真空・スクイズ等の鋳造法を取り入れ、高難度製品への対応
を検討。バリ取り・面取り工程の自動化による省力化と生産
効率向上を進め、自動外観検査や振動バレルの導入検討、金
型設計・製造技術の向上にも取り組んだ。
評価
拠点拡充と標準化を両輪で推進
メキシコ・ベトナムの生産設備を拡充し、供給能力を強化
滋賀工場のマザーライン設置により、品質・技術を標準化
インド法人を年度内に設立し、3年以内の工場立地を目指す
試作・量産化と技術基盤の強化
新鋳造法の検討を継続し、高難度製品への対応力を向上
ベトナムでバリ取り試作機の量産試運転を進め、自動外
観検査の対象品種を検討
金型設計・製造技術の向上
要素技術の開発は進展したが、
量産化・製品展開への移行は途上
金型発注先の見直しを進め、設計・製造技術を底上げ
3カ国4拠点の強みを活かした顧客
獲得
拠点連携により新規顧客を開拓
商談創出と原価上昇対応を強化
サプライチェーンの最適化
日系・非日系大手メーカーへのアプ
ローチ
3カ国4拠点で顧客情報を共有し、新規顧客獲得を推進。また
、自動車産業の集積地に工場を持つ強みを活かし、中国を中
心に大手自動車部品メーカーへの受注活動を進めた。
新規顧客の獲得は進展したが、
継続受注への転換と採算確保が課題
本中計では、各拠点の連携を強化し、設備・技術・商談を具体的な収益成果へ転換する。
拠点間の顧客情報共有を継続し、新規顧客開拓を加速
ベトナム・メキシコで増加する引き合いを新規受注へ転換
材料・燃料費高騰に対応し、採算性を確保
評価順
20
3-3. 過去10年間を振り返っての課題認識
過去10年では、新工場設立に伴い期待する収益が必ずしも計上できておらず、
有形固定資産回転率も低下しています
今後の投資判断の高度化に向け、その当時の投資判断の評価に加えて、
投資後のモニタリングを徹底します
中国南通工場稼働が影響
21
3-3. 過去10年間を振り返っての課題認識
グローバル生産網の拡充を進めてきた一方、ベトナム新工場の低稼働や中国南通工
場の減損が顕在化しました
両拠点を対象に、投資目的・現状・今後の対応を検証します
日本/滋賀
日本/滋賀県
工業用ミシン事業
オートモーティヴ事業
設立1968.10
高級機種、カスタマイズ製品を
生産するマザー工場
ISO9001:2015
中国/天津
設立2007.1
嶋本ダイカスト(株)と合弁会社設立
当社自動車部品事業創業の地
中国・欧州向けの自動車部品生産拠点
IATF16949:2016, VDA6.3, VDA6.5
中国/天津
減損実施(26/3期)
中国/南通
日本/徳島
日本/徳島県
設立1962.3
ミシンパーツ製造、加工機器の整備を実施
中国/天津
中国/天津
設立1985.5
生産及び研究開発機能を備えた
ミシン製造の主力工場
ISO9001:2015/14001:2015/45001:2018
設立2021.6
中国の自動車産業集積地に
近い生産拠点として設立
IATF16949:2016
中国/南通
メキシコ/ヌエボレオン
設立2016.2
北米向けの自動車部品生産拠点
工場規模を拡大中
IATF16949:2016
メキシコ/ヌエボレオン
低稼働率懸念
ベトナム/ハイズン
ベトナム/ハイズン
設立2008.1
第二のミシン生産主力工場
現在増産体制を構築中
ISO9001:2015 / ISO14001:2015
ベトナム/ドンナイ
設立2013.4
東南アジア地域、日本向けの自動車部品生産拠点
IATF16949:2016, VDA6.3, VDA6.5
ベトナム/ドンナイ
22
3-4. アパレルマシナリー事業の課題:ベトナム新工場
生産能力強化・中国一極集中回避のBCP対応としての基盤整備は完了しました
一方、操業度は約50%にとどまり、投資効率の改善が今後の焦点です
<新工場建設当初の目的>
• 中国への生産集中リスク
を回避することが大きな
目的
• 旧工場の1.5倍の面積の
新工場建設
• 中国工場と同等レベルの
生産能力確保
<新工場の現状>
操業度約50%
生産使用面積は
建物の半分程度
<今後の打ち手>
拠点最適化
保有資産を活かしながら再
編を推進
• 旧ベトナム工場は合弁会社が活
用し、賃貸収入を計上
• 中国・天津工場と連携して生産
体制を再編
• 今後の新規進出は経済性評価と
事後検証を徹底
次の焦点余剰スペースの活用と拠点間連携で稼働率を引き上げ、
投資判断の規律を強化する
23
3-5. オートモーティヴ事業の課題:中国南通工場
上海近郊の地理的優位性を期待しダイカスト中国第二工場として立ち上げましたが、
採算性の確保に課題が残りました
減損処理を実施し、立て直しを図っています
<南通工場建設当初の目的>
<南通工場の現状>
<今後の打ち手>
• 天津工場の生産ひっ迫に
よる第二工場の必要性
• 断続的ロックダウンで立
ち上げ遅延
• 生産品種の見直し、採算
改善
• 地理的利便性と産業集積、 • 売上拡大も損益分岐点未
達、赤字幅拡大
国家級開発区としての優
位性
• 天津に比べ環境規制によ
る製造コストアップ抑制
• 2025年度減損
処理実施
次の焦点 ダイカスト工場全体再編の中での南通工場の位置づけの
明確化
24
4.本中期経営計画
4-1. 本中期経営計画基本方針
「PEGASUSは、いつだって人のそばにある」
の想いを胸に、持続的な社会の発展に貢献し、
当社の中長期的な企業価値向上を目指していきます
資本効率の向上に向けて事業戦略と資本政策を構造的に
見直し、事業戦略・資本政策・ガバナンス改革を一体で
推進することで、次期中計におけるROE9%超・
PBR1倍超の達成につなげます。
本中計 を 、 ROE9 % 超・ PBR1 倍超 の 達成 に 向 け た
「改革期間」と位置付け、2029年度のROE目標を7.5%
とします。
26
4-1. 本中期経営計画基本方針
事業戦略
アパレルマシナリー事業
オートモーティヴ事業
1.収益性向上に向けた生産体制再編、原価
改善、在庫・売掛金管理強化
2.全方位ラインナップ強化・世界販売戦略
による売上拡大
3.自社工場から顧客縫製工場まで視野に入
れた抜本的自動化の促進
1.高付加価値へのシフトと生産拠点拡大に
よる持続的な売上成長と収益基盤強化
2.生産性・品質向上によるコストダウン
財務戦略
非財務戦略
1.資本コストの再設定を行い投下資本最小
化のためBSマネジメントを導入
2.従来の配当性向ではなく、BSマネジメ
ントに基づく株主還元
1.多種多様な人が安心して働ける環境の整
備かつ戦略遂行に資する人材への投資
2.ガバナンス体制の強化を通じた取締役会
の実効性向上
27
4-2. 本中期経営計画財務目標
次期中計(2032年度)においてROE9%、PBR1倍を達成いたします
2025年度
(実績)
(目標)
アパレル
オート
売上高
217 億円
300 億円
200 億円
100 億円
営業利益
9 億円
28 億円
18 億円
10 億円
9%
10%%
10
営業利益率
4.4 %
9%
9%
ROE
1.0 %
7 .5%
28
4-3.本中期経営計画基本方針事業戦略
|アパレルマシナリー事業
1.収益性向上に向けた生産体制再編、原価改善、在庫・売掛金管理強化(P30)
2.全方位ラインナップ強化・世界販売戦略による売上拡大 (P32)
3.自社工場から顧客縫製工場まで視野に入れた抜本的自動化の促進 (P37)
4-3. 本中期経営計画
基本方針事業戦略|アパレルマシナリー事業
1.収益性向上に向けた生産体制再編、原価改善、在庫・売掛金管理強化
生産体制再編・原価低減・CCC改善を通じ、収益性と資本効率の抜本的な向上
を目指します
本中計期間目標
責任者
重点指標
効率化重視の生産体制へのシフト
原価分析管理体制の構築・強化が図られていること
キャッシュコンバージョンサイクル(CCC)管理の強化
環境認識
外
部
自
社
• 中国同業が中低価格帯製品におい
てアジア圏で価格優位性を依然と
して維持している
• 中国同業の高級機種進出が始まり、
競合範囲が広がる
• 販売提携等による売上拡大を見越
した生産能力拡大が売上減少によ
り生産能力過剰に転じた
• 南アジアを中心に売掛金回収期間
の長期化傾向にある
• 原価低減活動におけるコストダウ
ンの定量的見える化ができていな
い
2025年度
11.8か月
2029年度
6.5か月
遂行責任者
重点施策
生産体制
再編
投資の
妥当性評
価
モノづく
り
力の
抜本的
強化
CCC
管理強化
事業本部長
Melvyn Blore
•
中国・ベトナム工場生産能力再編
(余剰生産能力の整理とフレキシブルな生産体制構築)
• 新たな生産候補地としてのインドの有用性の検討
• 投資に対する適正な経済性評価制度の導入
過去10年間を振り返っての課題認識の解決・再発防止
•
製販管理部
経営企画部
各製造法人社長
•
顧客に受け入れられる販売価格実現のための原価低減
(OEM活用強化・部材現地調達率アップ)
原価管理分析強化・コストダウン効果の見える化
製販管理部
経営企画部
各製造法人社長
•
•
•
•
•
販売・製造が一体となった過剰生産の抑止
滞留在庫管理強化
過度に長期化した売掛金回収期間の是正
売掛金回収期間短縮が図れる新規代理店との関係構築
代理店への工場直送取引の増加
販売部
製販管理部
各製造法人社長
30
4-3. 本中期経営計画
基本方針事業戦略|アパレルマシナリー事業
売上債権と棚卸資産の圧縮を中心にCCCを5.3か月短縮し、
運転資本から約27.9億円の営業キャッシュフロー創出を目指します
本中計期間目標
30/3 目標
26/3 実績
CCC
11.8か月
CCC
6.5か月
▲5.3か月
運転資本営業CF創出効果
▲約27.9億円
主要アクション
売上債権
棚卸資産
仕入債務
残高 45.8億円→ 42.9億円
回転期間 3.9か月→ 2.5か月
残高 108.6億円→ 83.6億円
回転期間 9.4か月→ 5.0か月
残高 18.3億円→ 18.3億円
回転期間 1.5か月→ 1.1か月
回収条件見直し
与信管理強化
滞留在庫処分
需要連動生産
品種数の絞り込み
在庫・生産を効率化
支払条件の適正化
31
4-3. 本中期経営計画基本方針事業戦略|アパレルマシナリー事業
2.全方位ラインナップ強化・世界販売戦略による売上拡大
本中計期間目標
重点指標
売上高
2025年度
138億円
環境認識
外
部
自
社
• 低価格機種市場向で、南米、南ア
ジア、アフリカで市場シェア拡大
の余地あり
• アジア圏を中心とした本縫いミシ
ン・低価格帯環縫いミシンは中国
同業の伸長著しい
• 南アジアから輸出されるアパレル
市場で、高性能機種に需要増
• 各国・地域特性に合わせたライン
ナップ戦略による売上拡大の必要
性(輸出向→High End, Middle
Class 内需向→Standard, 低価
格戦略機)
• 過度の価格競争を回避し、中国同
業と競合しないエリアへの販売攻
勢
2029年度
200億円
責任者
事業本部長
Melvyn Blore
重点施策
お客様へ
の
価値提案
力
強化
販売政策
• 大手アパレル企業につながる素材メーカーへの販売活動強
化により高性能機種の需要を取り込む
• 市場規模の大きいアジアで代理店網を拡充し販売を強化
• 低価格戦略機 KOP(Key Operational Product)の本格展開
によるブランド浸透・シェア拡大
重点地域:南米、インド、北アフリカ
全方位型営業強化
• 一点突破ではなく、全方位で、顧客ニーズに柔軟に対応で
きる社員の育成。本社社員、海外販社社員のレベル底上げ
• 元卸代理店だけでなくサブ代理店まできめ細かく網羅
• 顧客ニーズの開発への還流
遂行責任者
販売部
執行役員
各販売会社長
32
4-3. 本中期経営計画
基本方針事業戦略|アパレルマシナリー事業
KOPによる販売地域・顧客基盤の拡大、輸出縫製市場では高級機の拡販を進め、
地域別の成長機会を売上高 200億円につなげます( 2025年度売上実績 2029年度売上目標 )
中国・香港・台湾
欧州・アフリカ等
13.8億円
21.3億円
37.9億円
40.0億円
米州
10.0億円
20.1億円
日本その他アジア
南アジア
部品等
12.3億円
43.7億円
76.7億円
17.4億円
20億円
24.5億円
33
4-3. 本中期経営計画
基本方針事業戦略|アパレルマシナリー事業
HIGH ENDからKOPまで用途・顧客別の全方位ラインナップを整え、
付加価値と市場裾野の双方を拡大いたします
提供価値
対象顧客
価格比
HIGH END
MIDDLE
STANDARD
戦略機(KOP)
縫製工程の自動化・省力化
生産性向上と品質安定化
コストパフォーマンスと
信頼性
PEGASUS製品の
エントリーモデル
中堅縫製工場
一般縫製工場
3
2
地場縫製工場
(新興国市場)
1
中
小
小
大手アパレル向け
(輸出縫製)
8
売上・利益への役割
大
各クラス別
ミシンラインナップ
自動機:PHNシリーズ
扁平縫い:FW-Vシリーズ
扁平縫い:
W600PCシリーズ
オーバーロック
自動機:SOHシリーズ
オーバーロック:MX51
オーバーロック:
M900neoシリーズ
扁平縫い
34
4-3. 本中期経営計画
基本方針事業戦略|アパレルマシナリー事業
戦略機(KOP)に本縫いを加えることでさらなるシェア拡大を推進します
2023
オーバーロック
M32 M52
2024
2025
偏平縫いフラットベッド 偏平縫いシリンダーベッド
CW52
CW52
2026
本縫い
LM5、LM3
2027~
縫製現場をカバーする製品ラインナップ
縫製に必要な基本機種を網羅
本縫いラインナップ強化
提案力を高め
さらなるシェア拡大へ
35
4-3. 本中期経営計画
基本方針事業戦略|アパレルマシナリー事業
南米、アジア、アフリカで代理店を段階的に拡充し、
代理店(元卸)
2029年度にKOP売上9.5億円を目指します
Agent
販売(取引)
2029年度:
戦略機(KOP)売上高:9.5億円
●取引代理店
サブ代理店調査
製品説明
●取扱店
製品説明
個展開催
サンプル機
店頭展示
取扱店(小売)
リスク対応:
代理店教育とターゲット管理を徹底し、
既存顧客との自社内競合を防止
2027年度
南米
2028年度
ユーザー
2029年度
新規代理店開拓を推進
新規取扱店への製品PR
アジア
(インド)既存の代理店からの販売に加え、代理店網を拡充・取扱店への製品PRも実施していく
アフリカ 北アフリカ(エジプト等)で販売強化・取扱店への製品PR
西アフリカで代理店開拓
西アフリカで取扱店への製品PR
36
4-3. 本中期経営計画
基本方針事業戦略|アパレルマシナリー事業
3.自社工場から顧客縫製工場まで視野に入れた抜本的自動化の促進
本中計期間目標
重点指標
2025年度
2029年度
96億円
150億円
自動機・省力機年度売上
顧客縫製工場:無人縫製実現に向けたロードマップ提示
自社工場:合理化革新ライン(FMS)の実現
環境認識
外
部
自
社
• 輸出向けは機能素材、高品質、
ブランド価値重視→縫製難易度
の上昇
• 世界的な人手不足、技術継承困
難による省力化・自動化需要増
• 輸出向け製品の高品質化・縫製
難易度の上昇に対応する技術力
強化が必要
• 10年先を見据えたミシン産業
の在り方を先読みする必要性
全体売上の75%に引き上げ
全体売上の69%
責任者
事業本部長
Melvyn Blore
遂行責任者
重点施策
省力機
販売展開
強化
•
縫製企業への省力機販促活動強化
省力機器
開発強化
•
縫製企業の人手不足、技術継承を補う等市場の声に
応える省力機開発体制強化・ラインナップ拡大
無人縫製
の実現
•
上記省力機開発の延長線上に無人縫製をイメージし、
無人縫製実現に向けてのロードマップを明確にする。
FMSの
導入
•
合理化革新ライン(FMS(Flexible Manufacturing
System))の開発進捗管理強化
販売部
執行役員
各販売会社長
生産技術部
研究開発部
電気制御開発部
執行役員
各製造法人社長
37
4-3. 本中期経営計画
基本方針事業戦略|アパレルマシナリー事業
無人縫製の実現(長期構想)
現在の縫製工場(有人)
無人縫製工場の実現
1台のミシンに1人の工員
100台のミシンに1人の管理者
→生産量を増やすために長時間労働に陥りやすい
→脱・技能化による安定品質の実現
→繁閑差に対する柔軟性が低い
工場レベル
→省人化による生産性の最大化
輸出縫製市場開拓に
おける重要な武器
低価格競争・低コスト国への依存
生産地と消費地の近接による
ビジネスモデル・サプライチェーンの最適化
→人件費の安い立地で輸出縫製を行う
→リードタイムの長さ、政治リスク
→生産地の再配置や分散生産が進む
→産業の競争軸が変化
産業レベル
(価格競争から、スピード/カスタマイズ/サステナビリティへ)
労働環境・環境負荷に関する多くの課題
サステナブルな社会へ
→縫製=単純作業とみなされ、低賃金・長時間労働に
陥りやすい
→大量生産・過剰在庫による環境負荷
→技術力向上をはじめとした人的資本への積極投資
→トレーサビリティの向上
→必要なものを必要な分だけ生産
社会レベル
無人縫製の実現により、より良い社会・サステナブルな社会の発展に貢献
※無人縫製は2030年度以降を見据えた長期構想です。
本中計では、省力機器の拡販と要素技術・ロードマップの具体化を進めます。
38
4-3. 本中期経営計画
基本方針事業戦略|アパレルマシナリー事業
本中計期間中に、無人縫製実現に向けたSTEP2以降の技術ロードマップを
明確化します
無人縫製ラインのイメージ
MX セミデジタル制御ミシン
STEP1
基礎構築
(市場投入済)
STEP2
STEP3
STEP4
技術の進化実用化の準備無人縫製
の実現
取り組みの強化
工程の自動機の開発
上記6機種の投入
ラインナップの拡大と自動化の進化(自社開発)
デジタルミシンの開発
MX セミデジタル制御ミシン
セミデジタルミシンの進化機の開発
フルデジタルミシンの開発
自動搬送システムの開発
プロジェクトの立ち上げ
要素開発 / 実用化検証
自動搬送機器の開発
無人縫製ラインの実現
39
4-3. 本中期経営計画
基本方針事業戦略|アパレルマシナリー事業
本中計期間中に、FMS(Flexible Manufacturing System)実現に向けた
共通治具化・搬送自動化のロードマップを推進します
STEP2とSTEP3は、
同時並行で進行中
STEP1
各機種専用ライン
STEP3
自動搬送機製作
STEP2
共通治具製作
STEP4
FMSの実現
【将来】
・STEP1で構築した専用
ラインを進化させ、自動搬
送機を活用した複数機種対
応の生産システムを実現。
40
4-4.本中期経営計画基本方針事業戦略
|オートモーティヴ事業
1.高付加価値へのシフトと生産拠点拡大による持続的な売上成長と収益基盤強化(P42)
2.生産性・品質向上によるコストダウン (P49)
4-4. 本中期経営計画基本方針事業戦略|オートモーティヴ事業
1.高付加価値へのシフトと生産拠点拡大による持続的な売上成長と収益基盤強化
本中計期間目標
重点指標
年度売上
責任者
環境認識
外
部
自
社
2029年度
100億円
2025年度
83億円
• 中国自動車メーカーの成長鈍化と
価格競争激化
• 中南米が成長局面にあり、EV化は
限定的だが、内燃・ハイブリッド
は堅調
• 中国:シートベルトリトラクタ、
ライト系を中心に値下げ影響を吸
収し売上維持
• ベトナム:ダイカストマシン15台
体制で増設困難。価格競争を受け
難い付加価値品にシフト
• メキシコ:新規顧客開拓は順調で
あり、ワイパー・ミラー系等を売
上拡大
重点施策 •
•
•
高付加
価値品
への
シフト
生産拠点
拡大による
増産対応
•
事業本部長
美馬正道
値下げ影響の大きいシートベルトリトラクタ以外の商品
ラインナップ売上高の拡大
ベトナムは電装系・アンテナ生産に徐々にシフト
メキシコは同一国内の新規顧客獲得及び得意先との信頼
関係をより強化し高付加価値品シフトを加速
生産ラインナップ見直しによる中国南通工場の採算改善
遂行責任者
↓上記施策の結果、売上構成を以下目標とする↓
2026年度
•
2029年度
増減
各拠点社長
インドに新工場新設 シートベルトリトラクタから
生産開始(2029年度から)
42
4-4. 本中期経営計画基本方針事業戦略|オートモーティヴ事業
高付加価値の拡販により、シートベルト依存を低減し収益基盤を強化します
:高付加価値重点拡売品種
売上金額(億円)
2026年度
2029年度
増減
59.9
54.4
-5.5
ライト関連部品
9.0
11.2
+2.2
電装部品
8.8
10.0
+1.2
カメラ関連部品
0.3
0.2
-0.1
アンテナ関連部品
0.9
4.9
+3.9
ワイパー関連部品
1.9
3.3
+1.4
ドアミラー関連部品
1.6
3.3
+1.7
ダンパー関連部品
0.3
1.0
+0.7
ハーネス・オートドア関連部品
0.4
11.7
+11.3
二輪系部品
0.0
0.1
+0.1
シートベルト以外計
23.1
45.6
+22.5
総合計
83.0
100.0
+17.0
製品カテゴリー
シートベルト系
シートベルトリトラクタ
シートベルト以外
43
4-4. 本中期経営計画基本方針事業戦略|オートモーティヴ事業
既存顧客基盤と当社の技術を活用し、EV化による需要変化を
収益機会へ転換します
EV化による既存部品の変化( エンジンマウント技術を活かしたEVモーターマウントへの転換)
ICE~EV化でも影響小
ICE
EV
ICE / HEV
BEV化
スタータ不要
消滅
EV化で変化する
部品の一方で・・・
エンジンマウント
低周波振動を液封ゴムで吸収
残る機能
EV化
駆動ユニット支持
モーターマウントブラケット
高周波NVHと急峻なトルク反力に対応
スタータASSY
EV化
変わる要求高剛性・軽量化
ECUケースから放熱・電装筐体へ派生
派生
ECUケース
ADAS/通信ECU
小型BMS
小型DC-DC
小型OBC
共通技術:熱伝導・放熱フィン・気密面・薄肉化・精密加工
44
4-4. 本中期経営計画基本方針事業戦略|オートモーティヴ事業
既存顧客基盤と当社の技術を活用し、EV化による需要変化を
収益機会へ転換します
350t以下 ターゲット候補
EV車両代表搭載位置
※搭載位置は車種・システム構成により異なる
1
Electronic Control Unit
2
優先
3
2
5
3
Battery Management System
DC-DC Converter
優先
※ADAS/通信ECU
小型BMSケース
小型制御ユニット筐体
自動運転・通信機能を制御する電子ユニット筐体
分割型の電池監視筐体
電圧変換器筐体
バッテリー状態を監視・制御する管理システム筐体
高電圧を補機用定電圧へ変換する電源変換機筐体
小型DC-DCケース
4
1
4
On-Board Charger
5
Power Distribution Unit
PEGASUSの成長機会(EV拡張領域)
¥
※搭載位置は車種・システム構成により異なる
市場規模拡大
350t設備活用
利益率向上
EV化で搭載点数が増加
既存設備で参入可能
高付加価値領域へ展開
小型OBCケース
小型PDUケース
車載充電器の分割筐体
車載用電源分配ユニット (PDU)
外部電源から車両へ充電する車載充電器筐体
高電圧電力を各ユニットへ分配・保護する筐体
なぜ放熱部品か
既存設備を活かし、EV向け電装筐体・熱マネジメント市場へ展開
※ADAS : Advanced Driver Assistance Systems (先進運転支援システム)
なぜ放熱部品か
350t以下の基本目安
電子部品の高密度化で発熱が増加。アルミダイカストの熱伝導、薄肉フィン、気密一体化を競争力にできる。
製品投影面積:約150~220 cm² | 製品重量:概ね0.5~3 kg級 | 代表肉厚:概ね2~4 mm | 最終可否は湯道・金型・鋳造条件で判定
45
(補足)350トン以下の設備でできるアルミ部品の変化
ICE(内燃機関)から EV で増えるアルミダイカスト部品のシフト
ICE(内燃機関)
スロットルボディ
オイルポンプ部品
エンジンECUケース
センサーブラケット
EV(電動車)
350t以下クラスで狙える主なEV向けアルミダイカスト部品
傾向
インバーター
ケース
◎ 増加
電動オイル
ポンプケース
1
インバーターケース
2 OBCケース
(パワーエレクトロニクス)
(車載充電器)
ベルトテンショナー
ミッション小物部品
BMSケース
電動コンプレッサーケース
ADASカメラ
ケース
DC-DC
コンバーターケース
◎ 増加
電動コンプレッ
サーケース
◎ 増加
PDUケース
◎ 増加
×
2~8kg
重量
1~5kg
重量
2~6kg
オイル系部品
吸気系部品
駆動補機系部品
5 小型ヒートシンク
(放熱部品)
EV
重量
0.5~3kg
重量
0.2~2kg
サイズ 200~400mm
(対角長)
サイズ 150~350mm
サイズ 150~300mm
サイズ 100~250mm
サイズ 100~250mm
設備
設備
設備
設備
設備
250~500t
150~350t
200~400t
100~250t
特徴
特徴
特徴
特徴
高気密・高放熱性能が必要
複雑な流路・中空構造も可能
家電向けアルミケースに
近い構造
薄肉・高精度が求められる
ヒートポンプ車の普及で
大幅に増加
高気密・耐圧が要求
EV普及により大幅増加
多ポート・複雑流路に対応
共通要求
軽量化
高放熱
高気密・耐圧
ICE 時代からEV時代への用途シフト (350t以下で対応可能な領域)
エンジン周辺部品
冷媒マニホールド/
バルブボディ
○ 増加
(大型設備へ移行)
ICE
4
(ヒートポンプ用)
○ 増加
バッテリー
ケース
オイルパン
3
○ 増加
重量
オルタネーターケース
≤ 350t
350t以下のダイカスト設備で
量産可能な部品が大幅に増加
耐食性
80~250t
特徴
AI ECU・ADAS・インバーター
向け需要が急増
将来的に冷間鍛造も有望
高精度・安定品質
狙う順番(推奨ロードマップ)
350t以下設備 × EV部品のメリット
① 短期(~1年)
インバーター・OBCケース
● 既存設備を活用でき、追加投資を最小化
インバーターケース/OBCケース
BMS・PDU・DC-DCケース
● 部品点数の増加により受注機会が拡大
② 中期(1~3年)
電動コンプレッサー
● 熱マネジメント部品はEV普及で中長期的に成長
冷媒マニホールド・バルブ
● シートベルト部品からの事業転換が可能
ヒートシンク・各種ブラケット
● 高付加価値化により利益率の改善が期待
市場成長:大
参入しやすく、利益率も高い
電動コンプレッサーケース
市場成長:大
ヒートポンプ車の拡大で増加
③ 長期(3年~)
冷媒マニホールド・バルブ
小型ヒートシンク
市場成長:大
部品点数が多く継続的に増加
まとめ|350t以下のダイカスト設備でも、EV熱マネジメント部品を中心に多くの新規部品を量産可能!
シートベルト部品 → EV熱マネジメント部品へ
比較的小さな追加投資でEV市場に参入可能
46
(補足)EUC部品マップ(EVの電動補機・制御機器)
EUC:Electric Utility Components(車両の電力変換・制御・配電・通信・補機を担うユニット)
350トン以下のダイカスト設備で対応可能な有望アルミ部品と車両搭載位置
350トン以下のダイカスト設備で対応可能な有望アルミ部品と車両搭載位置
EUC部品の役割
電力変換
(AC/DC・DC/DC)
制御・通信
(ECU/BMS等)
電力配電
(分配・保護)
1 インバーターケース (モーター制御用)
8 電動コンプレッサーケース(ヒートポンプ用)
モーターを駆動する
•
AC DC変換ユニット
• 高出力・高放熱・高気密
冷媒を圧縮する電動式コンプ
• レッサー一体
• 冷却流路一体化が進む
重量(参考)
2~8 kg
サイズ(参考)
200~400 mm
• 軽量・高剛性・気密性
想定設備トン数
250~500 t
• ヒートポンプ車の普及で大幅増加
2 OBC(車載充電器)ケース
重量(参考)
2~6 kg
AC電源をDCに変換して
• バッテリーを充電
• 家電向けに近い構造で需要が拡大
サイズ(参考)
150~350 mm
• 高電圧を12V/48Vなどに変換
• 全EVに搭載(1台1~数個)
• 小型・高効率・高信頼性
4
サイズ(参考)
150~300 mm
重量(参考)
2~4 kg
サイズ(参考)
200~350 mm
5
想定設備トン数
200~350 t
BMSケース (バッテリーマネジメントシステム)
高気密・耐圧
リークレス設計
高信頼性・安全性
絶縁・耐振動・耐環境
6
ADAS ECU/ドメインECUケース (制御コンピュータ)
バッテリーの電圧・温度・
•
電流を監視・制御
• 通信・安全設計が重要
• 薄肉・軽量・放熱性が必要
重量(参考)
0.5~2 kg
サイズ(参考)
120~250 mm
想定設備トン数
80~250 t
EUC部品の特徴(共通要求事項)
高放熱性
冷却流路・フィン形状
•
冷媒マニホールド/バルブボディ
(ヒートポンプ・冷却回路)
•
センサーハウジング/ブラケット
(電流・温度・圧力センサー用)
• コネクター/端子台ケース高電圧用)
想定設備トン数
150~300 t
PDU(高電圧配電ユニット)ケース
高電圧電力を各ユニットへ分
•
配・保護
• 大型化・高機能化が進む
• バスバー・遮断器を内蔵
想定設備トン数
200~400 t
ヒートシンク/冷却プレート
• (インバーター・OBC・ECU用)
想定設備トン数
150~350 t
3 DC-DCコンバーターケース(高電圧→低電圧変換)
重量(参考)
1~4 kg
サイズ(参考)
150~300 mm
その他関連EUC部品(350t以下で対応可能)
• 薄肉・放熱・気密性が重要
重量(参考)
1~5 kg
熱マネジメント
(冷却)
軽量化
アルミダイカストの優位性
• ADASや車両制御の中枢
• 高放熱・EMC対策
• フィン形状が主流
重量(参考)
0.3~2 kg
サイズ(参考)
100~200 mm
想定設備トン数
80~250 t
7
通信モジュールケース(TCU/V2X等)
車車・路車通信やテレマ
•
ティクス用
• 小型・軽量・高周波特性
• EMCが重要
重量(参考)
0.2~1.5 kg
まとめ:350トン以下の設備で狙えるEUC部品の魅力
量産性・コスト競争力
薄肉・一体成形
多くの部品が1~6kg程度で350t以下設備に対応可能
EV普及に伴い搭載台数増 × 1台あたり搭載点数増で市場拡大
高機能・高付加価値で利益率向上が期待できる領域
シートベルト部品事業からの多角化・技術シナジー
サイズ(参考)
80~180 mm
想定設備トン数
80~250 t
想定受注ステップ(推奨)
1
2
3
OBC・DC-DCなど小型ケースから参入
PDU・BMS伴い中型ケースへ展開
インバーターケースなど高付加価値へ進出
47
4-4. 本中期経営計画基本方針事業戦略|オートモーティヴ事業
ダイカスト技術を基盤に、二輪、ロボット、航空機器など周辺分野への
展開可能性を検討いたします
航空・ドローン部品
自動車
ロボットアーム
バイク
48
4-4. 本中期経営計画基本方針事業戦略|オートモーティヴ事業
2.生産性・品質向上によるコストダウン
本中計期間目標
責任者
重点指標
累計コストダウン額
環境認識
外
部
自
社
• シートベルトリトラクタを中心に
中国自動車メーカーからの値下げ
圧力に拍車。
• 東南アジア市場にも中国自動車
OEMメーカー進出により値下げ影
響激化。
• 中国:自動化を軸にしたコストダウ
ンと技術力・品質力において最高水
準を維持し、値下げに対抗する。
• ベトナム:価格競争を受け難い付加
価値品を中心にコストダウン。
• メキシコ:ダイカストマシン14台に、
マシニングセンター3台増設。納入
不良など生産性の安定化に課題。
2029年度
5.8億円
重点施策
事業本部長
美馬正道
コストダウン推移(対値下額)
遂行責任者
•
アルミダイカスト個別溶解炉の抜本的な
工程改善
• ダイカスト用離型剤の水溶性から粉体へ
の変更
• 自動バリ取り機の本格導入
• AI外観検査導入による劇的な歩留まり改
コスト
善
競争力強化
(不良率改善による原価低減に加え納入不良
による損害賠償リスクのゼロ化)
• 品質・技術・工法標準化を目的としたマ
ザーラインの設置
• 南通工場の工程改善による採算改善
→過去10年間を振り返っての課題認識
各拠点社長
49
4-4. 本中期経営計画基本方針事業戦略|オートモーティヴ事業
個別溶解炉の導入により、年間約4,000万円のコスト削減と
CO2排出量削減を推進します
PEGASUSの場合(仮試算)
溶解量 :1,000kg/h
日当たり稼働時間:8h
稼働日:240日
台数:中国
7台 13,440t/年
メキシコ 7台 13,440t/年
ベトナム 4台 7,680 t /年
計
34,560 t /年
5,000t/年で107tCO2削減
34,560t/年で740tCO2削減
1tCO2削減あたり5.8万円削減
Total 740tCO2削減/年
4,292万円削減/年
50
4-4. 本中期経営計画基本方針事業戦略|オートモーティヴ事業
離型剤の粉体化により、原価低減・品質向上・環境負荷低減を図ります
【粉体の利点】
<コストダウン効果>
・金型寿命延命
・エアブロー等が不要になる為、サイクルタイムの削減に寄与
・使用量低減
・水溶性クリーナーによる簡単な清掃で対応可能
・水気の希釈不要
<品質改善>
・厳選された原材料が型全体に拡がる作用を手助けし、型の細部にまで秀逸な離型皮膜を形成
<環境面への配慮>
・顔料、シリコン非含有
・有害物質非含有
・生物分解性
・エアブロー等による騒音低減
・排水処理不要
・不燃性
・煙の発生が少ない
51
4-4. 本中期経営計画基本方針事業戦略|オートモーティヴ事業
バリ取り工程の自動化により、作業品質の均一とコスト削減を図ります
【自動バリ取り機導入の利点】
<コストダウン効果>
ヒトが作業した場合 :25日12時間稼働で生産能力
154KPCS/月
ヒトのほぼ倍:作業者6名減
自動バリ取り機の場合:24時間稼働で生産能力
309KPCS/月
<品質改善>
機械作業により、ヒトによる作業ムラが排除され品質が安定する
52
4-4. 本中期経営計画基本方針事業戦略|オートモーティヴ事業
AI外観検査の導入により、コスト削減に加え、検査品質の向上・
検査結果のデータ化・生産性の向上を図ります
検査品質の向上
目視検査では大変な微細不良を検出することができ、検査者による検査品
質のばらつきもなくす。
検査結果のデータ化、保存
全検査結果をデジタル保存することで、不良の傾向を分析することができ
る。どの生産工程に問題があるのかを検討でき、歩留まり改善につながる。
生産性の向上
疲労や集中力が低下することなく、24時間365日変わらない検査が可能。
さらに、検査工程を自動化することで、夜間の検査も可能になる。
53
5.重点戦略
5-1. 重点戦略 インドへの販売強化|アパレルマシナリー事業
人口大国の内需拡大に加え、世界のアパレル生産拠点が
インドへ移る可能性を取り込みます
① 市場の追い風
② 顧客の広がり
③ リスク対応
• 経済発展によりイ
ンド国内消費の広
がり(高品質への欲
求の高まり)
• インド国内消費/
輸出向け両面で日
系グローバルアパ
レル/欧米スポー
ツ/ファッション
ブランドが進出
• 為替、政治、地政学
• アパレル一大生産
地としてインド国
外への輸出機会増
→政治・地政学リスク
を踏まえて多拠点生産
で供給リスクを抑制
→縫製メーカー全体
で高精度・高機能・
省人機の需要拡大期
待
→きめ細かい代理店
戦略、販売支援体制
拡充の必要性
55
5-1. 重点戦略 インドへの販売強化|アパレルマシナリー事業
価格競争だけに頼らず、品質・省力化・販売網を武器にインド国内市場を攻略
また、インドを起点に中国メーカーとの競争構造を変え、グローバル市場での
主導権獲得も目指します
入口:低価格モデル
強み:高性能機種
KOP(低価格戦略機)のインド現地生産
で価格面の競争力を高め、中国系ミシ
ンからの置き換えを狙う。
日系・欧米ブランド向け製品を生産
する輸出縫製企業には、高品質・高
性能の自動機、省力機を提供する。
販売:代理店網
供給:現地化
主要代理店との関係を維持し、駐在員
事務所(ニューデリー・ルディア
ナ・バンガロール・ティルプール)
を販社化して販売力を高める。
部材調達の現地化を進め、現地パー
トナーのOEM活用によりコスト競争
力を強化。
廉価機の台数拡大と、高級機の付加価値確保を両立できる
56
5-1. 重点戦略 インドへの販売強化|アパレルマシナリー事業
国内需要とグローバル需要の双方を取り込み、インド市場での成長基盤を構築します
国内需要
国内需要
国内・グローバル
需要混合
グローバル需要
*三井住友銀行提供
57
5-1. 重点戦略 インドへの販売強化|アパレルマシナリー事業
インド販社を起点に南アジアの販売体制を再編し、成長市場に密着した
販売体制を構築します
<あるべき姿>
アパレルマシナリー事業南アジア販売拠点設立に伴う
販売拠点再編
シンガポール・マレーシア販売拠点管轄
• インドネシア/スマラン
• ベトナム/ホーチミン
• バングラデシュ/ナラヤンガンジ
• バングラデシュ/チッタゴン
• バングラデシュ/ダッカ
• スリランカ
南アジア販売拠点として手始めにインド販社設立
• インド/ルディアナ
• インド/ ニューデリー
• インド/バンガロール
• インド/ティルプール
58
5-1. 重点戦略 インドへの販売強化|アパレルマシナリー事業
将来的なインド直接販売体制の構築も視野に、販売機能を段階的に移管します
2026年度
販売会社
移管
バングラ
デシュ
・
スリラン
カ
インド
2027年度
2028年度
2029年度
2030年度
シンガポール→マレーシア
販社移管(駐在員事務所配属元)
駐在員事務所
シンガポール
→マレーシア移管
インド
法人設立
(オートと共
同で1社)
インド販社
(仲介販売※)
※ 仲介販売は売り手(PEGASUS)と買い手(得意先)をつなぐ役割で、仲介手数料をもって生業とする。
59
5-2. 重点戦略 インドへの本格進出|オートモーティヴ事業
世界の自動車メーカーの生産移転に伴い、インドのサプライチェーンへ
早期に参入します
前提:市場成長だけでなく、採用認定と供給体制の構築が事業化の鍵
成長の流れ
生産移転
→
現地参入
→
Tier0/Tier1
採用拡大
→
輸出向け需要
も獲得
① 市場機会
② 顧客候補
③ 外部環境
• 自動車メーカーが生産拠点
をインドへシフト
• インド国内の日系・韓国
系・インド系Tier0およ
びTier1
• インド同業の低価格戦略
• 現地サプライチェーンの一
端に参入
• 自動車・二輪共にイン
ド国内サプライチェーン
のみならず、国外輸出部
品へも広がる
• 中国EVメーカーの継続的な値下げ
圧力
→既存工場では太刀打ちできない価
格設定。インドの安価な労働力と
グループ内中古設備の活用など徹
底したコスト抑制による低価格戦
略に追随
• 既存工場の生産キャパシティオー
バー
→旺盛なインドにおける自動車サプ
ライチェーン需要が取り込めた際
に既存工場の生産キャパオーバー
が懸念される
• 為替、政治、地政学リスク
60
5-2. 重点戦略 インドへの本格進出|オートモーティヴ事業
小型ダイカストを扱う数少ないグローバル企業として、
価格競争を勝ち抜く事業基盤と顧客接点を拡大します
インドでの競争優位性を堅持
品質×価格
小型ダイカストを扱う数少ないグローバ
ル企業としての優位性(供給面・品質
面)・地場ダイカストメーカーとの差別
化を図る。
高い品質水準を維持しながら、地場ダ
イカストメーカーと競える価格を実現
する。
量産採用への入口
顧客接点を拡大
自動車メーカーのTier0・Tier1に入り
込み、サプライチェーンへの組み込み
を目指す。
日系・韓国系自動車メーカーに加え
インド系車両・二輪メーカーにも積極
的に接点を持つ。
価値提供の順序
部品提案
→
品質・価格評価
→
量産採用
品質優位を保ちながら、現地価格と量産要求に対応できるかがポイント
61
5-2. 重点戦略 インドへの本格進出|オートモーティヴ事業
主な自動車産業集積地を重点ターゲットとし、現地生産体制の構築と
顧客開拓を並行して進めていきます
*三井住友銀行提供
*三井住友銀行提供
62
5-2. 重点戦略 インドへの本格進出|オートモーティヴ事業
現地生産体制の構築によりインドの自動車サプライチェーンへ参入し、
高品質とコスト競争力を両立した事業基盤を確立してまいります
事業環境
重点市場としてのインド
• 中国自動車メーカーからの値下げ圧力が日に日
に強くなってきており、コスト競争力強化が切
迫した課題。
• 自動車メーカーが次の一大生産拠点としてイン
ドに工場を建設。自動車関連の巨大なサプライ
チェーンがインドに生まれてきている。
インドにおけるPEGASUSの戦略
現地生産体制の構築
•
•
•
•
早急な現地法人の立ち上げと土地・建物の確保
各自動車メーカーのインド内サプライチェーンへの参入
インド人主体の生産体制による圧倒的なコスト優位性の確保
環境に優しいダイカスト工場の建設
63
5-2. 重点戦略 インドへの本格進出|オートモーティヴ事業
2029年度のインド工場生産開始を視野に、2026年度の法人設立から
用地確保・建設を進めます
会社
設立・
用地
獲得
2026年度
2027年度
インド
法人設立
(アパレルと
共同で1社)
用地候補
検証・
選定・獲得
2028年度
2029年度
2030年度
工場
建設
インド工場建設着手
インド工場生産開始
64
6. PBR・ROE改善に向けた資本政策・株主還元
6-1. PBR・ROE改善に向けた資本政策
PBR改善を目指し、自己資本の圧縮、事業リスクの低減等に取り組んでいきます
リターンの強化
➢ アパレルマシナリー・オートモーティヴ共にラインナップ拡充による
売上拡大と採算性改善を図る
➢ 原価低減・生産性改善により事業リターンを高める
自己資本の
コントロール
➢ 自己資本の適正化により資本効率の向上を図る
➢ 財務健全性を維持しつつ自己資本比率を60%台まで低減する
ROE向上
具体的な株主還元施策は
後続ページで説明
PBR向上
期待成長率の
向上
➢ 成長戦略を明確にし、期待成長率の実現可能性の解像度を上げる
事業リスクの
低減
➢ 投資家との対話拡充をはじめとした情報開示の拡充
➢ サステナビリティ委員会及び取締役会での審議・リスク管理強化
➢ 事業の大半が海外主体であるため、グローバルガバナンス体制を強化
PER改善
66
6-2. キャッシュアロケーション・株主還元について
本中計でROE7.5%を達成するために、原則DOE6%以上の配当を実施し、
資本効率を高めます
• 3年後にROE7.5%を達成するための還元施策( DOEに換算して原則6%以上の配当)
を行っていく。
• 同時に自己資本比率60%台を目安に財務健全性維持の検証を行っていく。
※弊社は自己資本の中に為替換算調整勘定を91.5億円包含しており、これを除いた自己資本比率は
40%台の推移となる。企業存続のための財務安定性を確保するためには、為替換算調整勘定を
除いた自己資本比率40%台の維持が目安となる。
(億円)
【為替換算調整勘定】
海外子会社の財務諸表を日本円に換算して連結決算を行う際に
発生する為替レートの差額を調整するもの。
○海外子会社の財務諸表を円換算する際のレート
・資産・負債 → 決算日の為替レート
・資本金
→ 取得時の為替レート
・収益・費用 → 期中平均レート
資本金は、主に海外子会社設立時のレートで換算するため、
足元の円安により、実際の資本金より膨張した金額となる。
2025年度
流動資産
(うち現金及び預金)
PEGASUS B/S
306.2 負債合計
111.4
(105.2) 純資産合計
338.2
固定資産
143.4(うち為替換算調整勘定)
(91.5)
資産合計
449.6 負債純資産合計
449.6
67
6-3. B/Sマネジメント施策について
積極的な株主還元を実施しつつ、中長期的な成長に向けた投資を着実に推進します
計画(2027年度~2029年度)
有利子負債
38億円
戦略投資
56億円
棚卸削減
25億円
設備投資
41億円
実績(2024年度~2026年度)
3年間
営業CF
59億円
営業CF
75億円
設備投資
33億円
株主還元
26億円
海外余剰資
金の活用
41億円
株主還元
82億円
戦略投資
⚫新規重点エリア(インド)進出
⚫M&A(アパレル無人縫製に向けて)
成長投資・研究開発投資
⚫オートモーティヴ自動化合理化設備
⚫アパレル研究開発投資(AI無人縫製)
⚫更新設備投資
株主還元
⚫ 配当
原則DOE 6%以上
⚫ 自己株取得
68
7.事業戦略/資本政策を支えるESG戦略
7-1. G(ガバナンス):取締役会の実効性の向上について
本中計の達成に向け、執行状況を適切に監督できる取締役会体制を構築します
現状のコーポレート・ガバナンス体制図
新しい戦略を進める執行体制を監督するに
ふさわしい取締役会体制を目指す
株主総会
選任・解任
• 本中計で掲げた主要KPI・設備投資につい
て、四半期ごとに取締役会で進捗レビュー
• 計画からの乖離や投資効果未達が認められ
る場合は、是正策・撤退判断を含めて議論
• レビュー結果の要旨を四半期ごとに対外開
示し、市場との継続的な対話を実施
取締役会
会
計
監
査
人
(
監
査
法
人
)
(取締役6名 うち社外取締役3名)
会
計
監
査
指名・報酬
委員会
監視・監督
サステナビリ
ティ委員会
経営会議
内部監査室
監
査
監
査
役
会
監視・監督
各部署/グループ会社
• 新規参入案件に対する経済性指標等を駆使
したより慎重な議論展開
助言
顧問弁護士 (法律事務所)
監視・監督
コンプライアンス委員会
70
7-2. G(ガバナンス):実効的なガバナンス体制への転換
権限の分離や監督体制の見直しを行い、実効性の高いガバナンス体制を構築します
指名・報酬委員会の改革
• 指名・報酬委員を代表取締役社長から専務取締役に交代し、社長の権限の分離
社内取締役
社外取締役
現状
委員長
改革後
代表
取締役
社長
委員長
専務
取締役
企業価値向上に向けたコーポレートガバナンス体制の深化
• 監査役会設置会社、監査等委員設置会社、指名委員会等設置会社それぞれのメリット・
デメリットを精査し、ガバナンス強化につながる体制の構築
• 執行と監督の分離による実効性の向上
• 企業価値向上に向けたスキル・マトリクスの見直し
• 独立社外取締役比率50%超、女性役員比率20%以上目標
• 取締役経験者の顧問契約解除(2026年度実施済)
71
7-3. G(ガバナンス):資本市場との対話
市場との対話強化により、PEGASUSの成長性への理解促進を図ります
資本市場の視点を経営に取り入れ、更なる経営の高度化を目指します
主要IR施策
個人投資家向け
国内機関投資家向け
外国人投資家向け
役員向け
PEGASUS
社内
従業員向け
統合報告書の発行
•
•
•
•
•
•
インターネットファイナンス記事掲載頻度アップ
投資家向けYouTubeを活用した情報発信(予定)
株主優待の充実
個別面談(CEO/IR部門)の積極開催
決算説明会の充実(CFO/各事業責任者登壇)
IR Day企画・開催~企業と投資家双方の情報共有の場
•
既存外国人投資家との接点強化、海外機関投資家への情報発信強化
•
•
IR面談に対する議事録の翌日発行・情報発信
IR実績・市場の受け止めに対する定期報告の実施
•
社内IRの定期的実施:中期経営方針の浸透、決算概況説明、IR実績・市場の受け止めを分かりやすく説明す
る説明会実施
•
企業理念、価値創造プロセスを改めて見つめなおし、PEGASUSを取り巻くリスクと機会を再認識する
•
今回発行の中期経営計画をベースに、その延長線としての長期経営戦略を明確化して開示する
72
7-4. S(社会):人的資本戦略
本中計に紐づく人的資本戦略を推進し、経営課題の解決に必要な人材確保と
従業員エンゲージメントの向上を通じて、実行力の強化を目指します
•
本中計方針で打ち出した経営戦略を人的資本戦略と綿密に
結び付け、経営課題解決に向けた必要人材確保、実行方針
の完全遂行を実現します。
•
経営戦略を広く従業員に周知し、従業員に使命感を与え同
時にやりがいを抱いてもらいます。
•
従業員の使命感とやりがいの醸成のために、リーダーとな
る人材のスキルアップ強化と優秀な人材の外部からの確保
を継続的に行っていきます。
企業理念・経営基本方針・行動指針に沿った
文化・風土の醸成(グローバル)
経営戦略
経営戦略
やり
がい
使命感
人事評価・給与制度による成果主義の土台は
確立した(国内のみ)
必須
課題
2025年度制度設計・2026年度運用開始
グローバリズムの中での
リーダーの育成・強化
•
•
•
海外ローテーション人材のプーリング
サクセッションプランの明確化・体系化
社内暗黙知の形式知化、ノウハウの着実な伝承
73
7-4. S(社会):人的資本戦略
強みである豊富な海外人材を活かし、各地域での戦略実現に繋げていきます
グローバル人材の育成・活躍推進
◼ 海外事業の持続的成長を担うグローバル人材の育成状況および人材基盤の強化施策
➢ 10拠点中4拠点が現地拠点長(うち1拠点は兼務)
➢ 海外駐在経験者(26%)、海外出張経験者(61%)
➢ 外国籍新入社員の採用推進(毎年1名)
➢ グループ従業員に占める海外関連会社従業員比率(83%)
2
現地人材の登用と自立的な組織運営
◼ 現地人材の育成・登用
➢ 現地採用社員の管理職比率(10.9%)
◼ 日本のマザー工場を必要としない海外工場の自律的な組織運営
➢ アパレルマシナリー・オートモーティヴ両事業の全工場が日本の支援を必要と
していない
3
エンゲージメント向上と人材定着
◼ 人材の活躍・定着状況
➢ 現地社員・管理職の平均勤続年数(9.3年)
1
4
現地主導による価値創造事例
➢ 現地主導により、現地協力企業と共に低価格戦略機の設計・製造・販売のビジ
ネスモデルを構築
➢ 新事業である自動車向け小型ダイカスト製品の製造・販売を現地主導で実施
74
7-4. S(社会):人的資本戦略
従業員の自社株式保有を通じて、中長期的な企業価値向上への参画意識を高めます
持株会RS制度導入|「従業員の利益」と「企業価値向上」を連動
制度の仕組み
期待する効果
従業員の成長と定着を促し、戦略実行力と持続的な企業価値向上を支える
会社から従業員へ支給
1
特別奨励金
2
持株会へ拠出自己株式を活用して株式
を付与
3
譲渡制限
従業員
会社
株主
資産形成・当事者意識
を高め、中長期の成長
に参画
エンゲージメントと定
着を強化し、戦略実行
力を向上
従業員との価値共有を
通じて、持続的な企業
価値向上へ
中長期保有を促進
全従業員を対象とした自社株式報酬機能の拡充等により、持株会加入率(41.5%)
の最大化を図り従業員と株主の価値共有を拡大します。
同時に、ROE・資本効率への理解深化と、中長期的な企業価値向上に向けた当事者
意識の醸成につなげます。
従業員と株主の価値共有を促進
導入スケジュール
2026.09
2026.10-12
2027.01
2027.03
2027.春
制度設計を開始
制度設計・影響試算
制度導入を決定
従業員へ割当
制度運用を開始
※記載内容は現時点の予定であり、今後変更となる場合があります。
75
7-5. E(環境):環境負荷軽減
CO2削減目標:太陽光パネル設置、ダイカスト工法の環境負荷軽減
太陽光発電とダイカスト工法の改善によって、CO2排出量削減に取り組んで
いきます
2023
2024
SCOPE
2025
2026
2027
2028
2029
2029年度27%削減(2023年度比)
太陽光発電による削減
アパレルマシナリー事業
中国/天津工場
ダイカスト個別溶解炉
による削減
オートモーティヴ事業
ベトナム/ドンナイ工場
*うち太陽光発電による削減25%、個別溶解炉による削減2%
76
<本資料お取扱上のご注意>
本資料に記載されている業績見通し等の将来に関する記述は、当社が現時点における入手可能な情報及び将来の経済環境の予想等に基づき作成しており、
多分に不確定な要素を含んでおります。実際の業績は、今後様々な要因によって異なる結果となる可能性があります。
<お問い合わせ先>
株式会社PEGASUS (役職名)専務取締役執行役員管理本部長
〒553-0002 大阪市福島区鷺洲五丁目7番2号
(氏名) 岡田
義秀
(TEL) 06(6451)1351