株式会社ヒラノテクシード(6245 JP)リサーチアップデート 日本語サマリー 2026 年9月1日 Page | 1 HIRANO TECSEED CO., LTD (6245 JP) NIPPON INVESTMENT BESPOKE RESEARCH UK LTD 株式会社ヒラノテクシード (6245 JP) 第1四半期営業利益は下振れするもF Y 2…
株式会社ヒラノテクシード(6245 JP)リサーチアップデート 日本語サマリー 2026 年9月1日 Page | 1
HIRANO TECSEED CO., LTD (6245 JP)
NIPPON INVESTMENT BESPOKE RESEARCH UK LTD
株式会社ヒラノテクシード (6245 JP)
第1四半期営業利益は下振れするもF Y 2 6業績予想は据置き。EV関連以外の受注に回復の兆し。
エグゼクティブサマリー
➢ FY26第1四半期決算
ヒラノテクシードのFY26第1四半期決算は、売上高6,083 百万円(前年同期比43.3%減)、営業利益147 百万円(同82.0%減)
で着地し、営業利益率は2.4%(同5.2pt減・前四半期比4.6pt増)となった。売上高の落ち込みは、主に塗工機関連機器セグメントに
おいて、顧客の設備投資の見直しにより受注が底を打った前期の影響を受けたものである。塗工機関連機器セグメントにおいて売上高の多くを
占めていたEV向けリチウムイオン二次電池塗工装置及び関連する付帯工事が減少したことにより、セールスミックスも悪化した。また、生産量の
低下から売上総利益率は前年同期比2.4pt減の15.7%となった。
➢ FY26 業績見通し
同社はFY26の新年度を新たなCEOの任命と共にスタートした。FY26第1四半期の営業利益は上期目標の18.4%に留まったものの、同
社は上期目標の売上高13,000百万円(前年同期比28.4%減)、営業利益800百万円(同33.8%減)、および通期予想の売上
高25,000百万円(前期比22.6%減)、営業利益の1,500百万円⦅同6.2%減)を据え置いた。EV市場の世界的な先行き不透明
感は同社の当初の想定より長引く可能性があり、顧客の設備投資意欲の減退につながるため、同社は今後EV向けリチウムイオン二次電池塗
工装置受注のペースは停滞し塗工機関連機器セグメントの業績は弱含むと見ている。案件のキャンセルの影響は未確定であるが、EV用リチウ
ム電池関連の設備投資の縮小も予想されるため、今後EV 以外の分野および中国などの米国以外の地域で新規受注を獲得することが同社に
とって急務である。
➢ 増大する経営環境の不透明感
2023 年5 月の「長期ビジョン2030」、および2024 年5 月の中期経営計画(FY24-FY27)発表時と比べ事業環境が大きく変化したことを
踏まえ、同社は中期経営計画の成長戦略の見直しを行った。今後は、EV 需要に基づくリチウムイオン二次電池塗工装置を中心とした生産能
力向上重視の戦略から、各先端分野の薄膜新素材の開発に重点をおいたあらゆるニーズに対応できる同社本来の強みを生かした戦略へと転
換を図る。
➢ 株主還元
株主還元の配当金に関しては、DOE3.5%または配当性向60%のいずれか高い金額を目安に実施するという現行の方針を維持する。
ヒラノテクシード (6245 JP): 株価バリュエーション
時価総額 (百万円) 28,400 時価総額 (百万ドル) 177.5
22日平均売買代金 (百万円) 145 22日平均売買代金 (百万ドル) 0.9
株価パフォーマンス (%) 6245 TOPIX 業績予想 (百万円, %)
FY24
FY25 FY26 CE
株価 (¥, 2026年8月28日終値)
1,845 4,146.71
売上高 48,355 32,285 25,000
3mo (5月28日終値比)
-0.5 6.3
営業利益 1,681 1,599 1,500
6mo (2026年2月28日終値比)
-2.1 6.4
営業利益率 [OPM ] (%) 3.5 5.0 6.0
YTD (2026年1月5日終値比)
-3.1 50.4
EBITDA 2,531 2,448 2,350*
1yr
13.5 34.3
EPS (¥) 59.90 86.79 72.69
5yrs
-31.4 112.7
財務レバレッジ (X) 1.6 1.4 1.4*
一株当たり指標
6245 TOPIX
ネット D/E レシオ (X) -0.2 -0.2 -0.2*
EPS (¥, FY26 CE)
72.69
234.51
フリーキャッシュフロー -871 3,864 1,500*
DPS (¥, FY26 CE)
84.00
0.94
株主還元概要 FY24
FY25 FY26 CE
BPS (¥, FY26 EST*)
2,591.33
N/A
配当金 (¥)
90.00 84.00 84.00
FCFPS (¥, FY26 EST*)
97.44
N/A
配当性向 (%)
150.20 96.80 115.60
予想PER (x)
25.38
17.66
配当利回り (%)
N/A N/A 6.27
PBR (x)
0.71
1.85
DOE (%)
3.6 3.3 3.2*
PCFR (x)
18.93
N/A
自己株比率 (%)
N/A 1.6 N/A
EV/EBITDA (x)
9.09
N/A
ROE (%)
2.4 3.4 2.8
Source: Nippon-IBR based on data on Bloomberg and Toyo Keizai / * Nippon-IBR estimates
株式会社ヒラノテクシード(6245 JP)リサーチアップデート 日本語サマリー 2026 年9月1日 Page | 2
HIRANO TECSEED CO., LTD (6245 JP)
NIPPON INVESTMENT BESPOKE RESEARCH UK LTD
FY26第1四半期決算概要
ヒラノテクシードのFY26第1四半期決算は、売上高6,083 百万円(前年同期比43.3%減)、営業利益147 百万円(同82.0%減)で着地
し、営業利益率は2.4%(同5.2pt減・前四半期比4.6pt増)となった。売上高の落ち込みは、主に塗工機関連機器セグメントにおいて、顧客の
設備投資の見直しにより受注が底を打った前期の影響を受けたものである。塗工機関連機器セグメントにおいて売上高の多くを占めていたEV向けリ
チウムイオン二次電池塗工装置及び関連する付帯工事が減少したことにより、セールスミックスも悪化した。また、生産量の低下から売上総利益率は
2.4pt減の15.7%となった。
長引くEV市場の低迷を受け、顧客はリチウムイオン二次電池関連のさらなる投資に慎重になっている。その結果、機械受注が減少し塗工機関連機
器セグメントの売上を圧迫した。FY25第3 四半期には、複数の案件において総額7,229 百万円のキャンセルが発生し、受注残高が減少した。受
注残高の消化は進捗したものの、EV関連以外の市場からの新規受注は限られている。ただ、好調なAIおよびDX関連の需要を背景に、電子材
料・電子部品(MLCC - 積層セラミックコンデンサー、ガラスクロス等)の製造装置のニーズが高まっており、化工機関連機器セグメントにおける引き合
いが増加している。
ヒラノテクシード (6245 JP): 業績サマリー
(百万円)
FY24 FY25 FY26
Q1
上期 通期
Q1
上期 通期
Q1 YoY (%) QoQ (%)
売上高
12,099 24,388 48,355 10,719 18,157 32,285 6,083 -43.3 -8.0
売上総利益
1,476 3,433 6,522 1,942 3,243 5,639 953 -50.9 4.2
GPM (%)
12.2 14.1 13.5 18.1 17.9 17.5 15.7 -2.4ppt +1.8ppt
SG&A
1,184 2,409 4,840 1,121 2,033 4,040 805 -28.1 -24.1
SG&A/Sales (%)
9.8 9.9 10.0 10.5 11.2 12.5 13.2 +2.8ppt -2.8ppt
営業利益
292 1,024 1,681 821 1,209 1,599 147 -82.0 -201.1
OPM (%)
2.4 4.2 3.5 7.7 6.7 5.0 2.4 -5.2ppt +4.6ppt
経常利益
427 1,201 1,894 900 1,275 1,706 220 -75.5 -263.8
RPM (%)
3.5 4.9 3.9 8.4 7.0 5.3 3.6 -4.8ppt +5.7ppt
当期純利益*
328 867 905 641 901 1,313 163 -74.5 -413.3
EPS (¥)
21.75 57.37 59.91 42.40 59.59 86.79 10.78 -74.6 -411.6
Source: Nippon-IBR based on Hirano Tecseed's Earnings results materials
*親会社株主に帰属する当期純利益
同社が注力している受注残の消化は以下のとおりほぼ順調に進捗している。
FY24 第4四半期 47,560百万円
FY25 第1四半期 40,183百万円 / 同第2四半期 36,800百万円 / 同第3四半期 30,359百万円 / 同第4四半期 31,650百万円
FY26第1四半期 32,672百万円
上記受注残のうち、EV用リチウムイオン二次電池向け電極塗工装置を含むエネルギー関連の受注残は、以下の通り減少している。
FY24第4四半期 30,771百万円(全体の64.7%)
FY25第1四半期 23,668百万円(全体の58.9%)/ 同第2四半期 20,240百万円(全体の55.0%)/同第3四半期12,326百万円
(全体の40.6% )/ 同第4四半期 11,394百万円(全体の36.0%)
FY26第1四半期 8,201百万円(前年同期比65.4%減・前四半期比28.0%減)
FY26 第1四半期の受注高は、7,105百万円(前年同期比2.1倍・前四半期比10.1%減)に留まり、中期経営計画の売上目標(FY27 まで
に30,000 百万円)達成に必要な月平均受注高2,500 百万円をわずかに下回った。しかしMLCC(積層セラミックコンデンサー)やガラスクロスな
どの電子材料・部品の製造装置を含む電子材料および他の用途の受注においては、いずれも需要が急速に増加している。FY26第1四半期の電子
材料関連の受注は、2,473百万円(同20.5倍・同39.0%増)となり、その他の用途関連の受注は3,410百万円(同6.5倍・同0.1%増)とな
った。
株式会社ヒラノテクシード(6245 JP)リサーチアップデート 日本語サマリー 2026 年9月1日 Page | 3
HIRANO TECSEED CO., LTD (6245 JP)
NIPPON INVESTMENT BESPOKE RESEARCH UK LTD
セグメント別業績
塗工機関連機器
北米におけるリチウムイオン二次電池関連の設備投資の急速な縮小により、塗工機関連機器セグメントのFY26第1四半期の売上高は4,673百
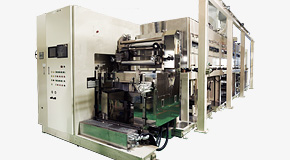
万円(前年同期比50.2%減)、営業利益は、355百万円(同68.0%減)となった。同セグメントの主力製品はリチウムイオン二次電池向け電極
塗工装置である。米国におけるEV 用リチウムイオン二次電池関連の設備投資意欲の減退を背景に、セグメントの海外売上は前年同期比54.7%
減の3,680 百万円に減少した。国内売上もディスプレイ関連の塗工装置の受注動向が底打ちしたことを受け、前年同期比で21.5%減の992 百万
円となった。セグメント営業利益率は、減収およびセールスミックスの悪化を要因に前年同期比4.2pt減の7.6%(前四半期比3.5pt増)となり、売
上総利益は前年同期比1,059百万円減となった。売上総利益は減少したことにより、販売手数料などの販売管理費の減少で一部相殺されたもの
の、営業利益は前年同期比で756百万円悪化した。
同社はこれまで受注残を消化し利益を実現して来たが、今後は受注を拡大することが経営陣の優先事項となる。特にリチウムイオン二次電池市場に
資源を集中して来た結果、競合他社に市場シェアを奪われたディスプレイ関連製品の受注拡大が急務である。第1四半期のセグメント受注高は前
年同期比63.2%減の1,013百万円となった。同受注残は17,247百万円(3月26日時点から17.5%減)となり、同社はセグメント受注残の消
化に引き続き注力している。
低迷するEV市場の現状を踏まえ、同社は従来の機械販売から、部品販売や既設機械のメンテナンスを含むアフターサービスの提供に軸足を移した。
アフターサービス事業の売上総利益率は30-40%となっており、保全技術者の稼働率の向上にも繋がる。また、同社は競合に奪われたディスプレイ市
場のシェアを奪回することにも注力する。
化工機関連機器
化工機関連機器セグメントのFY26第1四半期決算は、売上高1,130 百万円(前年同期比10.8%増)、営業利益182 百万円(同71.7%
増)、うち国内売上は312百万円(同47.2%減)、海外売上は818百万円(同91.1%増)となった。前期からの増収は、主にAIサーバー向
けのMLCC、セラミック、ガラスクロスなどの製造装置や、電子材料用途の成膜装置等の産業資材の売上が伸びたことによる。また、営業利益が前年
同期比で76百万円(71.7%増)となり、セグメント営業利益率は前年同期比で5.7pt増の16.1%(前四半期比1.7pt減)に改善した。増益
要因は、1)売上高増加に伴う売上総利益の改善(前年同期比95百万円増)、2)販売管理費の減少(同19百万円減)、である。同社は
MLCC および透明ポリイミドフィルムを成膜装置のターゲット市場としてシェアの拡大を図っており、さらなる受注の獲得に引き続き注力する。
ヒラノテクシード (6245): セグメント別財務サマリー (四半期)
(百万円)
FY24 FY25 FY26
Q1 Q2 Q3 Q4 Q1 Q2 Q3 Q4 Q1 YoY (%) QoQ (%)
塗工機関
連機器
売上高
10,332 10,297 13,305 8,085 9,392 5,659 5,408 4,888 4,673 -50.2 -4.4
営業利益
584 780 1,090 87 1,112 557 683 201 355 -68.0 77.0
OPM (%) 5.7 7.6 8.2 1.1 11.9 9.9 12.6 4.1 7.6 -4.2ppt +3.5ppt
化工機関
連機器
売上高
1,260 1,681 849 855 1,020 1,288 1,757 1,410 1,130 10.8 -19.8
営業利益
-10 254 -62 112 106 291 313 251 182 71.7 -27.4
OPM (%) -0.8 15.1 -7.4 13.1 10.4 22.6 17.8 17.8 16.1 +5.7ppt -1.7ppt
その他・
調整
売上高
506 310 429 442 307 489 349 312 278 -9.4 -10.9
営業利益
67 81 101 21 27 -21 -4 -183 -1 N/A N/A
OPM (%) 13.3 26.3 23.6 4.9 8.9 -4.5 -1.3 -58.9 -0.7 -9.6ppt +58.2ppt
連結合計
売上高
12,099 12,289 14,584 9,382 10,719 7,438 7,516 6,611 6,083 -43.3 -8.0
営業利益
292 732 805 -149 821 387 536 -146 147 -82.0 N/A
OPM (%) 2.4 6.0 5.5 -1.6 7.7 5.2 7.1 -2.2 2.4 -5.2ppt +4.5ppt
Source: Nippon-IBR based on Hirano Tecseed's Earnings results materials / *Total OP = Total segment OP deducted by HQ costs
株式会社ヒラノテクシード(6245 JP)リサーチアップデート 日本語サマリー 2026 年9月1日 Page | 4
HIRANO TECSEED CO., LTD (6245 JP)
NIPPON INVESTMENT BESPOKE RESEARCH UK LTD
ヒラノテクシード (6245): セグメント別財務サマリー(累計)
(百万円)
FY24 FY25 FY26
Q1 1H Q3 FY Q1 1H Q3 FY Q1 YoY (%)
塗工機関
連機器
売上高
10,332 20,629 33,935 42,020 9,392 15,051 20,460 25,348 4,673 -50.2
営業利益
584 1,364 2,455 2,543 1,112 1,670 2,353 2,554 355 -68.0
OPM (%) 5.7 6.6 7.2 6.1 11.9 11.10 11.50 10.1 7.6 -4.2ppt
化工機関
連機器
売上高
1,260 2,941 3,790 4,645 1,020 2,309 4,067 5,478 1,130 10.8
営業利益
-10 244 181 293 106 397 710 962 182 71.7
OPM (%) -0.8 8.3 4.8 6.3 10.4 17.2 17.5 17.6 16.1 +5.7ppt
その他・
調整
売上高
506 817 1,246 1,688 307 796 1,146 1,458 278 -9.4
営業利益
67 149 250 271 27 5 0 -183 -1 N/A
OPM (%) 13.3 18.2 20.1 16.1 8.9 0.7 0.1 -12.6 -0.7 -9.6ppt
連結合計
売上高
12,099 24,388 38,972 48,355 10,719 18,157 25,673 32,285 6,083 -43.3
営業利益
292 1,024 1,830 1,681 821 1,209 1,745 1,599 147 -82.0
OPM (%) 2.4 4.2 4.7 3.5 7.7 6.7 6.8 5.0 2.4 -5.2ppt
Source: Nippon-IBR based on Hirano Tecseed's Earnings results materials / *Total OP = Total segment OP deducted by HQ costs
ヒラノテクシード (6245): セグメント別生産、受注及び販売の実績 (四半期)
(百万円)
FY24 FY25 FY26
Q1 Q2 Q3 Q4 Q1 Q2 Q3 Q4 Q1 YoY (%) QoQ(%)
塗工機関連
機器
売上高
10,332 10,297 13,305 8,085 9,392 5,659 5,408 4,888 4,673 -50.2 -4.4
生産実績
9,049 8,806 11,400 7,326 7,691 4,747 4,373 4,182 4,032 -47.6 -3.6
受注高
5,555 10,570 4,721 5,749 2,754 2,674 3,964 3,757 1,013 -63.2 -73.0
受注残高
50,983 51,256 42,671 40,335 33,698 30,713 22,038 20,907 17,247 N/A -17.5
化工機関連
機器
売上高
1,260 1,681 849 855 1,020 1,288 1,757 1,410 1,130 10.8 -19.8
生産実績
1,182 1,332 832 670 860 946 1,360 1,076 875 1.8 -18.7
受注高
1,299 420 1,721 1,686 309 1,079 4,063 3,743 5,602 1,710.1 49.7
受注残高
6,088 4,828 5,700 6,531 5,820 5,611 7,917 10,250 14,721 N/A 43.6
その他・調整
売上高
506 310 429 442 307 489 349 312 278 -9.4 -10.9
生産実績
391 193 280 367 224 444 301 436 221 -1.6 -49.4
受注高
355 365 295 366 279 300 277 401 489 75.3 21.8
受注残高
847 902 768 692 664 474 402 491 703 N/A 43.0
連結合計
売上高
12,099 12,289 14,584 9,382 10,719 7,438 7,516 6,611 6,083 -43.3 -8.0
生産実績
10,622 10,331 12,513 8,364 8,776 6,137 6,035 5,696 5,129 -41.6 -10.0
受注高
7,210 11,356 6,738 7,801 3,343 4,054 8,305 7,902 7,105 112.5 -10.1
受注残高
57,919 56,987 49,141 47,559 40,183 36,799 30,358 31,649 32,672 N/A 3.2
Source: Nippon-IBR based on Hirano Tecseed's Earnings results materials
株式会社ヒラノテクシード(6245 JP)リサーチアップデート 日本語サマリー 2026 年9月1日 Page | 5
HIRANO TECSEED CO., LTD (6245 JP)
NIPPON INVESTMENT BESPOKE RESEARCH UK LTD
ヒラノテクシード (6245): セグメント別生産、受注及び販売の実績 (累計)
(百万円)
FY24 FY25 FY26
Q1 1H Q3 FY Q1 1H Q3 FY Q1 YoY (%)
塗工機関連
機器
売上高
10,332 20,629 33,935 42,020 9,392 15,051 20,460 25,348 4,673 -50.2
生産実績
9,049 17,855 29,255 36,581 7,691 12,438 16,812 20,995 4,032 -47.6
受注高
5,555 16,126 20,847 26,596 2,754 5,428 9,393 13,150 1,013 -63.2
受注残高
50,983 51,256 42,671 40,335 33,698 30,713 22,038 20,907 17,247 -17.5*
化工機関連
機器
売上高
1,260 2,941 3,790 4,645 1,020 2,309 4,067 5,478 1,130 10.8
生産実績
1,182 2,514 3,347 4,018 860 1,806 3,167 4,244 875 1.8
受注高
1,299 1,719 3,441 5,127 309 1,389 5,453 9,196 5,602 1,710.1
受注残高
6,088 4,828 5,700 6,531 5,820 5,611 7,917 10,250 14,721 43.6*
その他・調整
売上高
506 817 1,246 1,688 307 796 1,146 1,458 278 -9.4
生産実績
391 584 865 1,233 224 668 969 1,406 221 -1.6
受注高
355 721 1,016 1,382 279 579 856 1,258 489 75.3
受注残高
847 902 768 692 664 474 402 491 703 43.0*
連結合計
売上高
12,099 24,388 38,972 48,355 10,719 18,157 25,673 32,285 6,083 -43.3
生産実績
10,622 20,954 33,468 41,833 8,776 14,914 20,950 26,646 5,129 -41.6
受注高
7,210 18,567 25,305 33,106 3,343 7,397 15,702 23,605 7,105 112.5
受注残高
57,919 56,987 49,141 47,559 40,183 36,799 30,358 31,649 32,672 3.2*
Source: Nippon-IBR based on Hirano Tecseed's Earnings results materials
*changes from the end of the previous fiscal year
FY26 業績予想
FY26第1四半期の売上高は上期目標の46.8%を達成した一方、営業利益の進捗率は18.4%に留まった。しかし同社は上期目標の売上高
13,000百万円(前年同期比28.4%減)、営業利益800百万円(同33.8%減)、および通期予想の売上高25,000百万円(前期比22.6%
減)、営業利益の1,500百万円⦅同6.2%減)を据え置きとした。想定より長期化が予想されるEV 市場の世界的な先行き不透明感を背景に、
EV用リチウムイオン二次電池の価格は急落し、顧客の設備投資意欲はさらに減退している。それに伴い、今後EV向けリチウムイオン二次電池塗工
装置の関連機器の受注は停滞し、塗工機関連機器セグメントの業績は弱含むと同社は見ている。EV 用リチウムイオン電池関連の設備投資の縮小
を視野に、今後EV 以外の分野および中国などの米国以外の地域で新規受注を獲得することが同社にとって急務である。
リチウムイオン二次電池を含むエネルギー市場では、塗工機の用途は蓄電池にまで拡大しつつある。しかし蓄電池の生産施設は、EV用電池のそれよ
りはるかに小規模である。塗工機関連機器セグメントでは、以下の2つの分野を注力対象としている。
- ディスプレイ用光学フィルム向け塗工機関連機器市場
- ペロブスカイト(特定の結晶構造を持つ光吸収活性層を備えた高効率太陽電池デバイス)向け塗工機関連機器市場
化工機関連機器セグメントでは、AI関連およびDX関連の設備投資が引き続き堅調となり受注を牽引すると同社は見ている。
株主還元では、FY26の年間配当は一株当たり84円(前期より横ばい)を予定し、これにより配当性向は115.6%(前期比18.8pt増)となる。
株式会社ヒラノテクシード(6245 JP)リサーチアップデート 日本語サマリー 2026 年9月1日 Page | 6
HIRANO TECSEED CO., LTD (6245 JP)
NIPPON INVESTMENT BESPOKE RESEARCH UK LTD
ヒラノテクシード (6245 JP): 業績サマリー及びガイダンス
(百万円)
FY25
FY26 (予)
上期 通期 上期(予)
YoY (%)
通期(予)
YoY (%)
売上高
18,157 32,285 13,000 -28.4 25,000 -22.6
売上総利益
3,243 5,639 N/A N/A N/A N/A
GPM (%)
17.9 17.5 N/A N/A N/A N/A
SG&A
2,033 4,040 N/A N/A N/A N/A
SG&A/Sales (%)
11.2 12.5 N/A N/A N/A N/A
営業利益
1,209 1,599 800 -33.8 1,500 -6.2
OPM (%)
6.7 5.0 6.2 -0.5ppt 6.0 +1.0ppt
経常利益
1,275 1,706 900 -29.4 1,600 -6.3
RPM (%)
7.0 5.3 6.9 -0.1ppt 6.4 +1.1ppt
当期純利益*
901 1,313 600 -33.4 1,100 -16.3
EPS (¥)
59.59 86.79 39.65 -33.5 72.69 -16.2
Source: Nippon-IBR based on Hirano Tecseed's Earnings results materials
*親会社株主に帰属する当期純利益
株式会社ヒラノテクシード(6245 JP)リサーチアップデート 日本語サマリー 2026 年9月1日 Page | 7
HIRANO TECSEED CO., LTD (6245 JP)
NIPPON INVESTMENT BESPOKE RESEARCH UK LTD
GENERAL DISCLAIMER AND COPYRIGHT
This report has been commissioned by Hirano Tecseed Co., Ltd. (the Sponsor) and prepared and issued by Nippon
Investment Bespoke Research UK Ltd (Nippon-IBR), in consideration of a fee payable by the Sponsor. Fees are paid on
delivery of the report in cash without recourse. Nippon-IBR may seek additional fees for the provision of follow-up
research reports and associated IR services for the client but does not get remunerated for any investment banking
services. We never take payment in stock, options, or warrants for any of our services.
Accuracy of content: All information used in the publication of this report has been compiled from publicly available
sources that are believed to be reliable, however Nippon-IBR does not guarantee the accuracy or completeness of this
report and has not sought for this information to be independently verified. Opinions contained in this report
represent those of the Nippon-IBR analyst at the time of publication. Forward-looking information or statements in
this report contain information that is based on assumptions, forecasts of future results, estimates of amounts not yet
determinable, and therefore involve known and unknown risks, uncertainties and other factors which may cause the
actual results, performance, or achievements of their subject matter to be materially different from current
expectations.
Exclusion of Liability: To the fullest extent allowed by law, Nippon-IBR shall not be liable for any direct, indirect, or
consequential losses, loss of profits, damages, costs, or expenses incurred or suffered by you arising out or in
connection with the access to, use of or reliance on any information contained on this note.
No personalised advice: The information that we provide should not be construed in any manner whatsoever as,
personalised advice. Also, the information provided by us should not be construed by any subscriber or prospective
subscriber as Nippon-IBR’s solicitation to effect, or attempt to effect, any transaction in a security. The securities
described in the report may not be eligible for sale in all jurisdictions or to certain categories of investors.
Investment in securities mentioned: Nippon-IBR has a restrictive policy relating to personal dealing and conflicts of
interest. It does not conduct any investment business and, accordingly, does not itself hold any positions in the
securities mentioned in this report. However, the respective directors, officers, employees, and contractors of Nippon-
IBR may have a position in any or related securities mentioned in this report, subject to its policies on personal dealing
and conflicts of interest.
Copyright: Copyright 2026 Nippon Investment Bespoke Research UK Ltd.
For further enquiry, please contact:
Nippon Investment Bespoke Research UK Ltd
118 Pall Mall
London SW1Y 5EA
TEL: +44 (0)20 7993 2583
Email : [email protected]
Nippon Investment Bespoke Research UK Ltd (formerly known as NIB Research UK Ltd.) is registered in England and Wales (9100028) and is
authorised and regulated by the Financial Conduct Authority <FRN: 928332>.