|
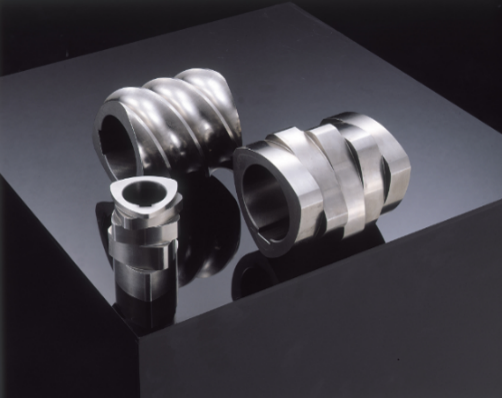
Fuji Die Co., Ltd. manufactures and sells wear-resistant tools and cemented carbide chips using tungsten carbide and cobalt-based alloys. The company operates in a single business segment focused on precision tools and dies for plastic deformation processes, serving industries including transportation machinery, steel, non-ferrous metals, beverage cans, electrical and electronic components, and industrial machinery. Key products include dies and plugs for wire and pipe drawing, automotive component dies, can-making dies, cemented carbide chips, and tools for high-pressure applications such as synthetic diamond production. The company also produces steel tools, ceramic products, and copper-tungsten alloy electrodes. Fuji Die maintains a vertically integrated production system covering powder mixing, sintering, machining, and inspection, with manufacturing facilities in Japan, Thailand, and Indonesia. Sales operations are conducted through domestic offices and international locations in China, Thailand, Indonesia, Malaysia, and India. The company provides customized solutions for multi-variety, small-batch production, supported by technical service staff and R&D capabilities in powder metallurgy and precision machining. Summarised from the annual report, fiscal year ended Mar 2026 |
Industry Specialty Industrial Machinery | Homepage fujidie.co.jp |
| Sector Industrials | IR page fujidie.co.jp | |
|
Tags
cemented carbide, wear-resistant tools, dies, plugs, can-making dies, automotive dies, powder metallurgy, precision machining, industrial tools, metal forming, FUJILLOY INDIA PRIVATE LIMITED
|
Press page fujidie.co.jp/ir/news |
Metrics
| Valuation | |
|---|---|
| Market cap | ¥ 20.06B |
| Market cap (USD) | $ 125.376M |
| P/E | 11.93 |
| PEG | — |
| P/BV | 0.95 |
| P/S | 0.99 |
| P/OCF | -27.63 |
| P/FCF | -12.30 |
| Dividend yield | 4.0% |
| Turnover / mcap | — |
| Returns | |
|---|---|
| ROE | 2.8% |
| ROI | 2.8% |
| ROIC | 2.6% |
| Profit margin | 3.3% |
| Growth | |
|---|---|
| Revenue growing | Yes |
| Profits growing | No |
| Revenue up 3y | No |
| Revenue up 5y | No |
| Earnings growth 3y (net profit CAGR) | -23.7% |
| Quality | |
|---|---|
| Profitable | Yes |
| Margin expanding | No |
| Buying back stock | No |
| Diluting (TTM) | No |
| Debt/Equity | — |
| Podcast bulls (TTM) | Sign up |
| Podcast bears (TTM) | Sign up |
| Podcast sentiment (TTM) | Sign up |
| Podcast sentiment % (TTM) | Sign up |
| News sentiment (TTM) | 11 |
| Quality score | -33.3% |
| Insiders | |
|---|---|
| Buys, 1w | Sign up |
| Buys, 1m | Sign up |
| Buys, 1y | Sign up |
| Sells, 1w | Sign up |
| Sells, 1m | Sign up |
| Sells, 1y | Sign up |
Sign up to see this company's insider trades
| Figure | FY 2026 | FY 2025 | FY 2024 | FY 2023 | FY 2022 | FY 2021 | FY 2020 | FY 2019 | FY 2018 | FY 2017 | FY 2016 | FY 2015 | FY 2014 | FY 2013 |
|---|---|---|---|---|---|---|---|---|---|---|---|---|---|---|
| Revenue | 17.446B | 16.595B | 16.678B | 17.179B | 16.874B | 14.247B | 17.426B | 18.356B | 17.99B | 16.648B | 16.06B | 16.251B | 15.041B | 14.637B |
| Net profit | 573M | 426M | 709M | 1.292B | 790M | 468M | 625M | 950M | 932M | 855M | 732M | 767M | 732M | 578M |
| Free cash flow | 245M | 1.18B | 207M | -560M | 1.646B | 1.052B | 1.083B | -297M | 599M | 419M | 390M | — | — | — |
Filed figures
Lines the statements and their notes report beside the headline figures, read from the filings' XBRL as filed (no restatement applied), with figures computed from one filing's own lines. Cash-flow lines carry their cash direction: an outflow is negative. Each period links to its filing; a figure's period, report date and tag are in its tooltip.
| Figure | Mar 2017 | Mar 2018 | Mar 2019 | Mar 2020 | Mar 2021 | Mar 2022 | Mar 2023 | Mar 2024 | Mar 2025 | Mar 2026 |
|---|---|---|---|---|---|---|---|---|---|---|
| Balance sheet detail | ||||||||||
| Trade receivables (JPY) | 4.77B | 5.22B | 5.05B | 4.35B | 3.92B | 4.39B | 4.5B | 4.15B | 3.48B | 3.57B |
| ↳ YoY growth | +9.4% | +9.5% | -3.4% | -13.9% | -9.7% | +12.0% | +2.4% | -7.7% | -16.2% | +2.6% |
| ↳ 5y CAGR | -2.1% | -1.6% | -2.9% | -3.8% | -4.4% | -1.9% | ||||
| Borrowings, current (JPY) | 455M | 420M | 51M | 42M | 30M | 31M | 33M | 35M | 28M | 22M |
| Borrowings, non-current (JPY) | 108M | 60M | 13M | 2M | — | — | — | — | — | — |
| Lease liabilities (JPY) | 52M | 39M | 17M | 43M | 33M | 36M | 54M | 64M | 40M | 32M |
| Cash and deposits (JPY) | 5.68B | 5.73B | 4.57B | 5.15B | 5.58B | 6.8B | 6.57B | 6.38B | 6.95B | 7.13B |
| Intangible assets (JPY) | 142M | 147M | 124M | 121M | 101M | 108M | 85M | 235M | 258M | 263M |
| Net debt (borrowings + leases - cash) (JPY) | -5.07B | -5.21B | -4.49B | -5.07B | -5.51B | -6.73B | -6.49B | -6.28B | -6.88B | -7.08B |
| Cash flow detail | ||||||||||
| Operating cash flow (JPY) | 2.29B | 2.23B | 925M | 2.55B | 1.48B | 2.01B | 775M | 2.05B | 1.8B | 1.16B |
| Purchases of property, plant and equipment (JPY) | -1.78B | -1.61B | -1.19B | -1.42B | -409M | -318M | -1.33B | -1.72B | -620M | -829M |
| Purchases of intangible assets (JPY) | -88M | -27M | -36M | -47M | -22M | -45M | -6M | -125M | -93M | -85M |
| Change in receivables (cash effect) (JPY) | -415M | -444M | 160M | 707M | 414M | -446M | -80M | 365M | 699M | -55M |
| Change in inventories (cash effect) (JPY) | 320M | -386M | -704M | 418M | 323M | -415M | -468M | 201M | -11M | -682M |
| Change in payables (cash effect) (JPY) | 276M | 527M | -71M | -593M | -386M | 497M | -176M | -128M | -304M | 464M |
| Dividends paid (cash effect) (JPY) | -440M | -440M | -459M | -480M | -479M | -435M | -435M | -634M | -634M | -794M |
| Share buybacks (cash effect) (JPY) | — | 0.00 | — | — | -129M | 0.00 | — | — | — | -310M |
| Interest paid (cash effect) (JPY) | -16M | -11M | -8M | -4M | -3M | -4M | -3M | -4M | -4M | -3M |
| Income taxes paid (cash effect) (JPY) | -78M | -468M | -495M | -207M | -425M | -198M | -498M | -271M | -341M | -128M |
| Operating cash flow before change in receivables (JPY) | 2.7B | 2.68B | 765M | 1.84B | 1.07B | 2.46B | 855M | 1.69B | 1.1B | 1.21B |
| Free cash flow (OCF - PPE - intangibles) (JPY) | 419M | 599M | -297M | 1.08B | 1.05B | 1.65B | -560M | 207M | 1.09B | 245M |
| Income detail | ||||||||||
| Research and development expense (JPY) | 263M | 269M | 277M | 280M | 244M | 265M | 288M | 314M | 290M | 260M |
| ↳ 5y CAGR | -2.3% | +0.2% | +1.4% | +2.5% | +0.7% | +1.3% | ||||
| Total comprehensive income (JPY) | 899M | 1B | 811M | 700M | 480M | 899M | 1.5B | 865M | 712M | 766M |
| Comprehensive income to owners (JPY) | 899M | 1B | 811M | 700M | 480M | 899M | 1.5B | 865M | 712M | 766M |
| Provision for credit losses (JPY) | 0.00 | 0.00 | 0.00 | 0.00 | 0.00 | 0.00 | 0.00 | 0.00 | 0.00 | 0.00 |
| Credit cost ratio (credit losses / average receivables) (%) | 0.0% | 0.0% | 0.0% | 0.0% | 0.0% | 0.0% | 0.0% | 0.0% | 0.0% | 0.0% |
| Reported | Jun 23, 2017 | Jun 22, 2018 | Jun 21, 2019 | Jun 23, 2020 | Jun 23, 2021 | Jun 24, 2022 | Jun 27, 2023 | Jun 25, 2024 | Jun 24, 2025 | Jun 19, 2026 |
Sign up to see institutional holdings
Sign UpPodcast Mentions
Sign up to see podcast mentions and sentiment
Sign UpTimely disclosures published on TDnet, newest first, titles as filed in Japanese. The link opens the disclosure on TDnet. Filings with EDINET (periodic reports, extraordinary reports, offerings, holding and buy-back reports), newest first, titles as filed in Japanese. The link opens the filing on EDINET. Press releases from the company's own website, newest first.
おかやまテクノロジー展(OTEX)の概要
| 展示会名 | おかやまテクノロジー展(OTEX)2026 ~精鋭企業と出会う技術展示商談会~ バナーから公式ページにジャンプします |
| 会期 | 【リアル展】2026年11月11日(水)10:00~17:002025年11月12日(木)10:00~16:30 【オンライン展】2026年10月30日(金)~12月18日(金) |
| 会場 | 【リアル展】 コンベックス岡山(岡山県岡山市北区大内田675) 大展示場 ブース番号81 【オンライン展】 おかやまテクノロジー展(OTEX)2026公式ホームページ内 |
※リアル展、オンライン展の登録はこちら から
出展製品
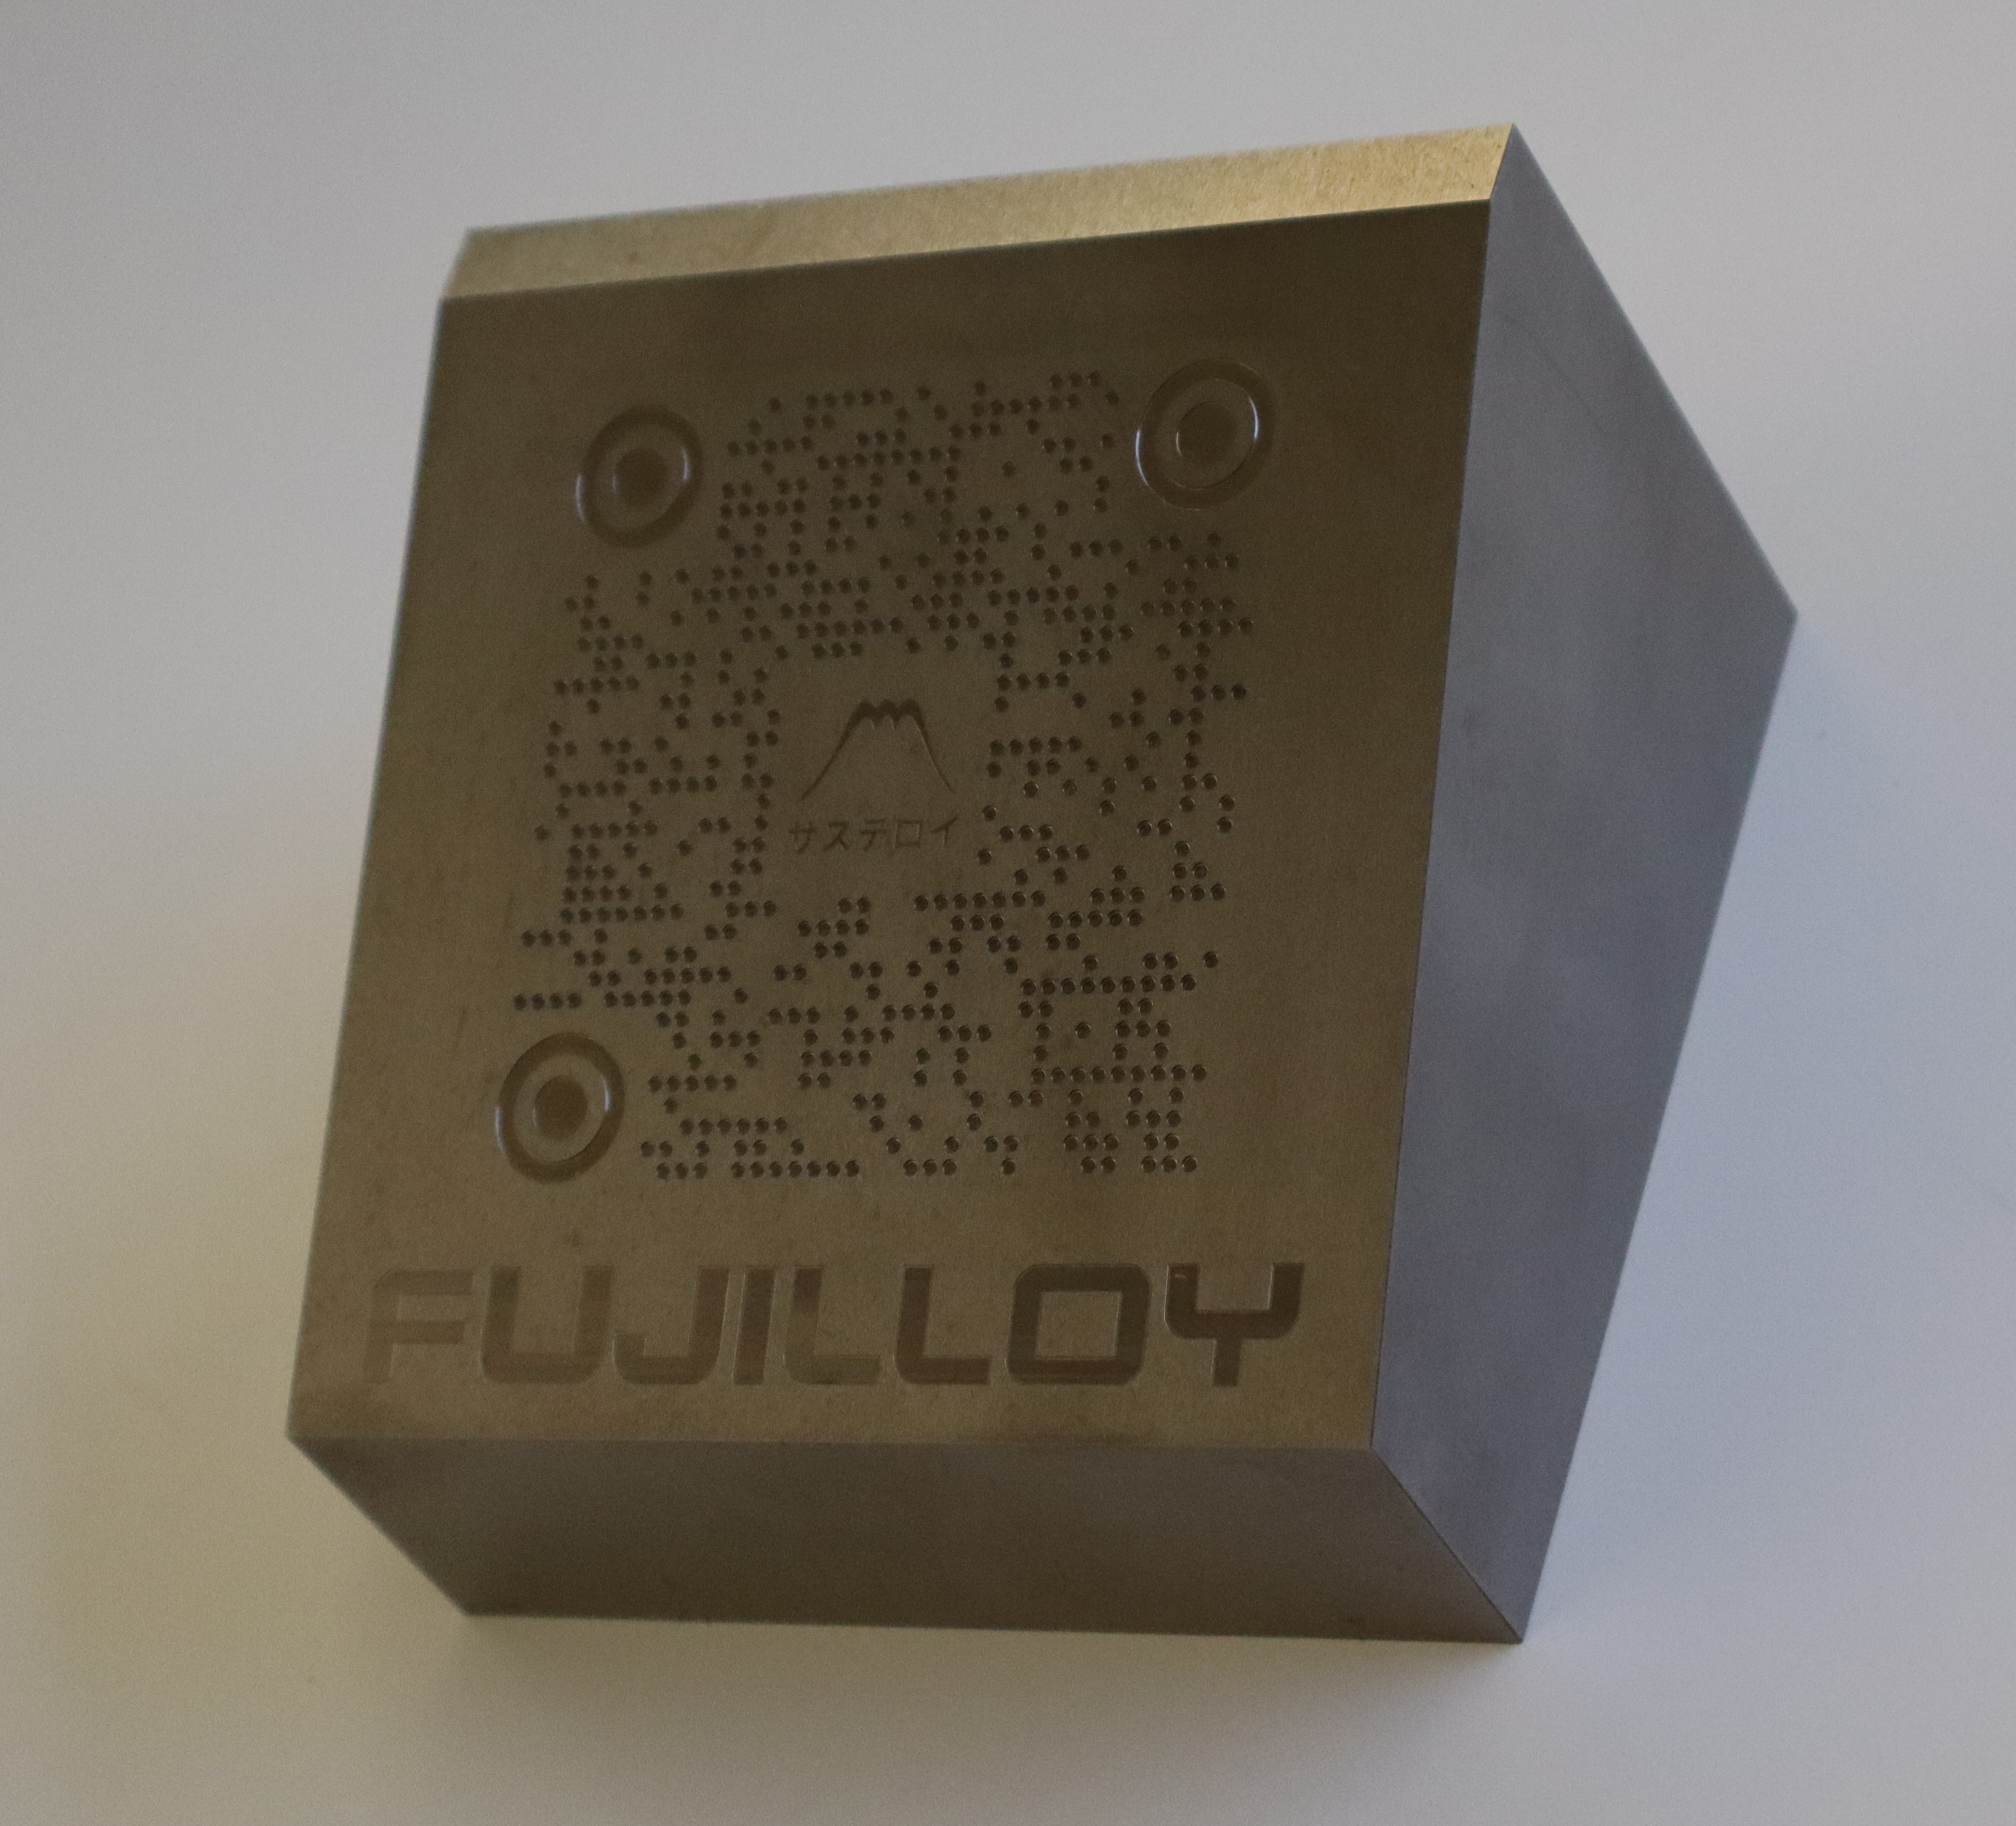
省タングステンで軽量な硬質材料サステロイ STN30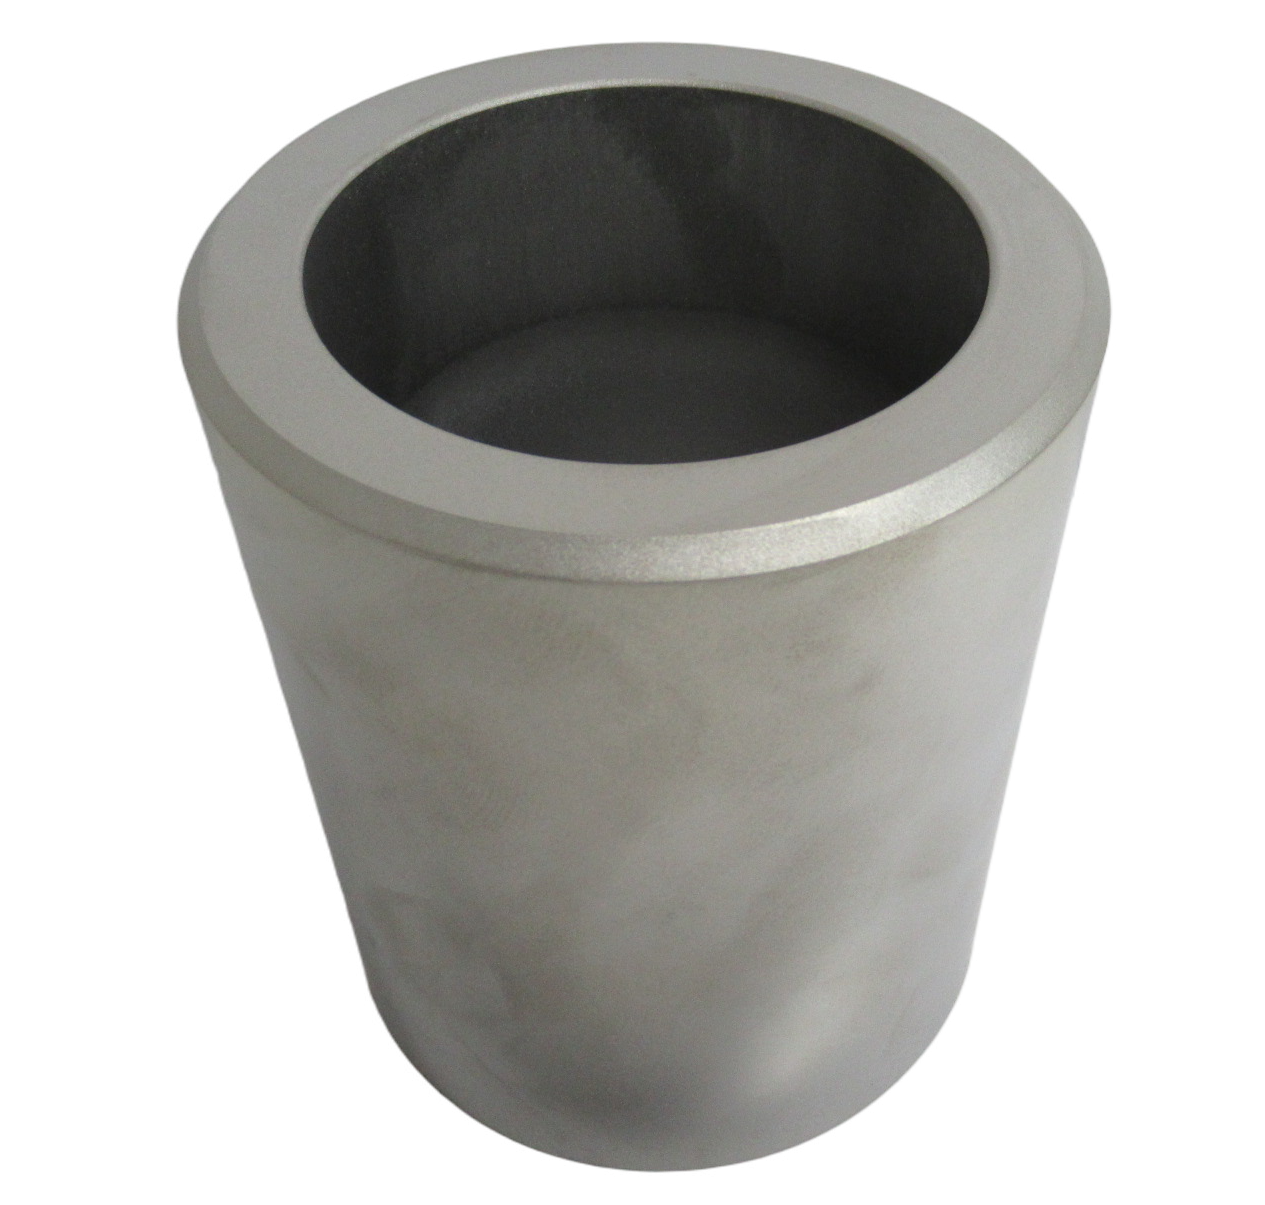 |
高熱膨張低比重硬質合金フジロイ TRシリーズ 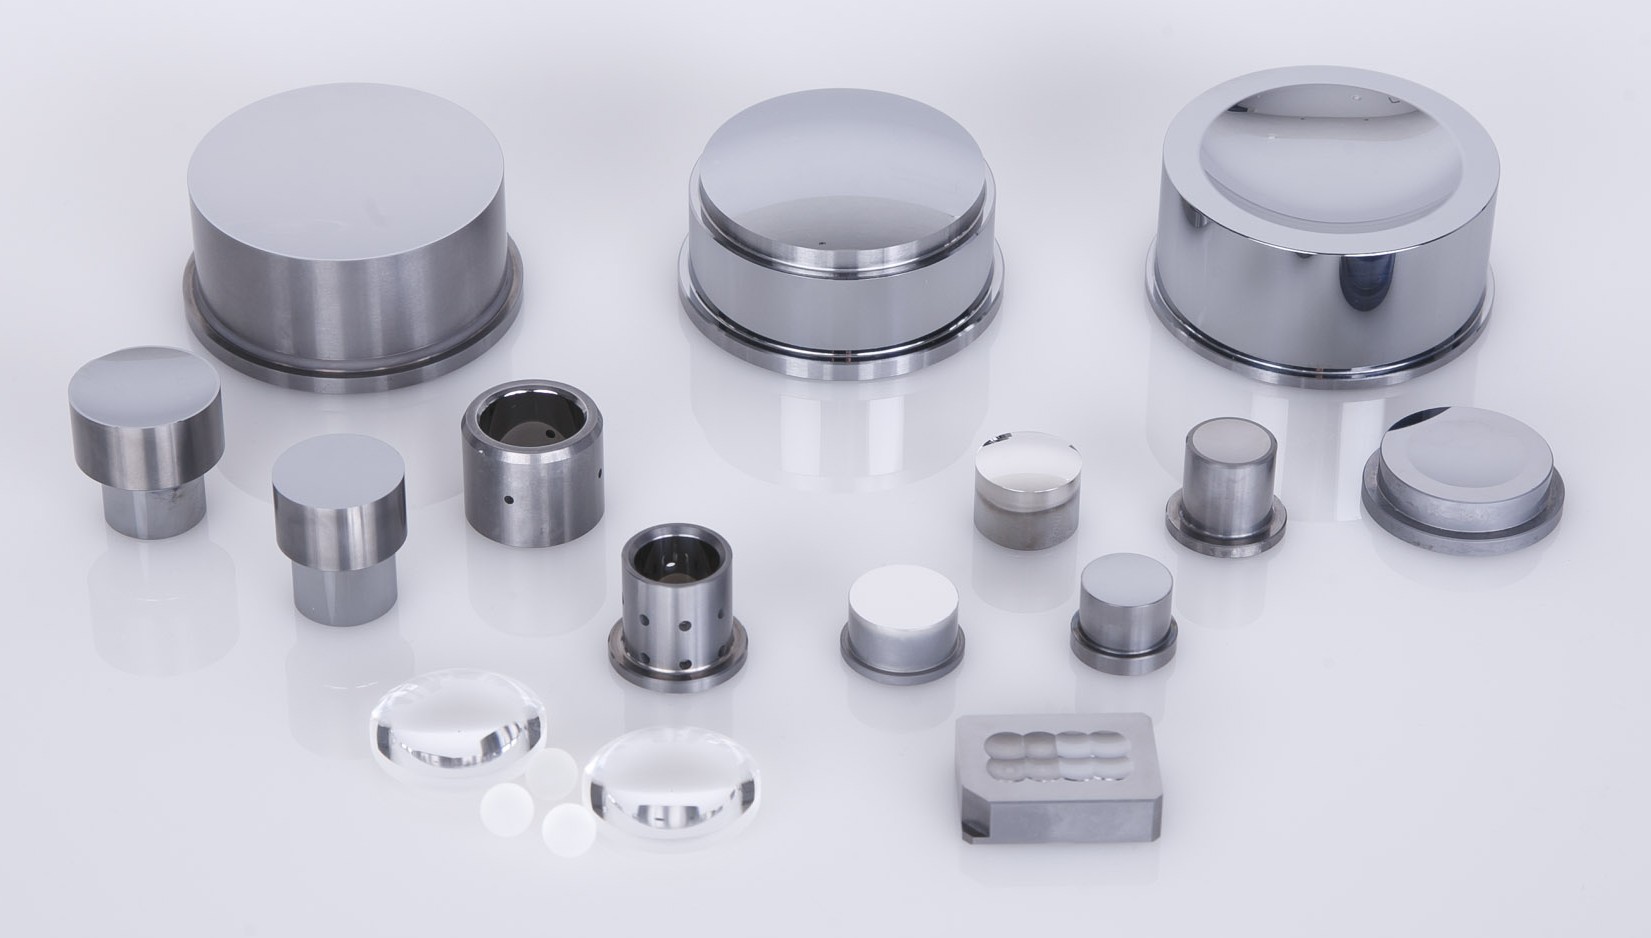 |
電気化学反応用 高性能電極PME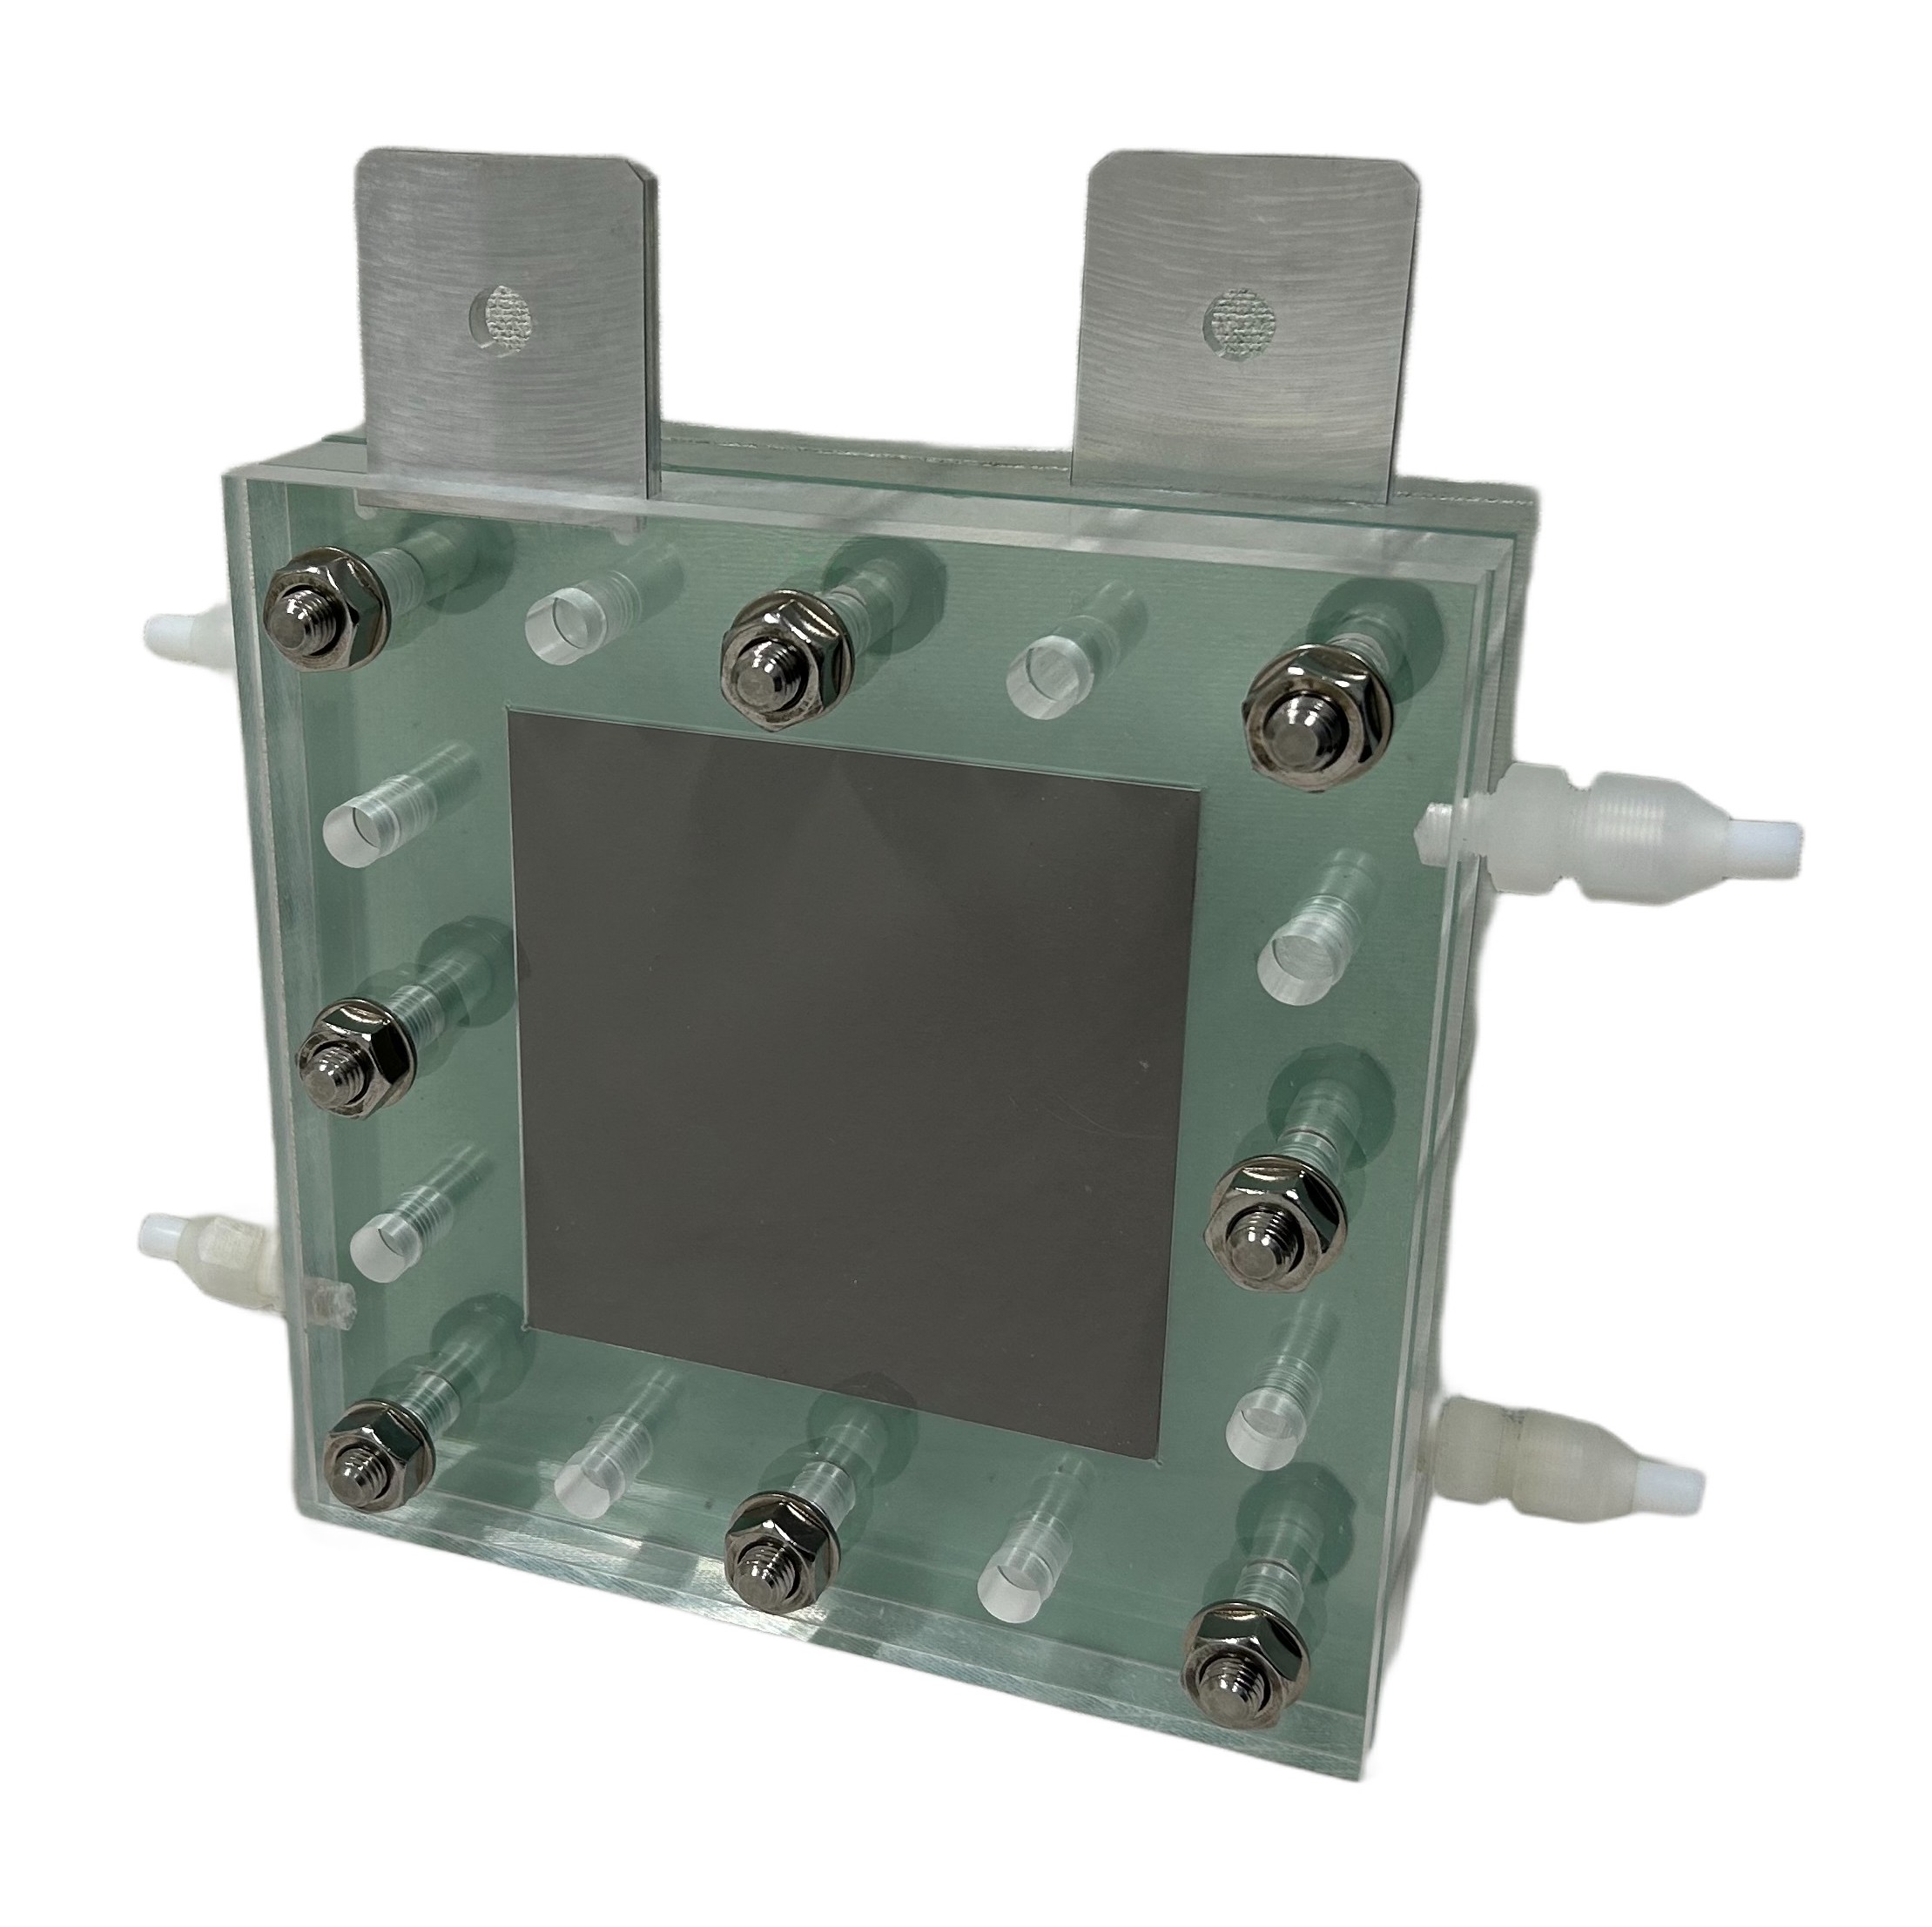 |
 |
 |
 |
Copyright Fuji Die Co., Ltd. All Rights Reserved.

Prompts
Click prompts to add them under the company line, click again to take one out, then copy the result into your AI chat. Shared by Asian Century Stocks and Uncovered Thai Stocks. Thank you.
ETFs Holding Fuji Die Co., Ltd.
Exchange-traded funds whose newest published daily portfolio holds one of the company's listings, largest weight first.