2026年3月期 (2025 年 4月1日〜2026 年 3月31日) ビジネスレポート 目次 3 日進工具グループの主なマイルストーン 5 当社のグループネットワーク 7 日進工具グループの価値創造プロセス 9 「新しいをつくる」~社会の発展に貢献するエンドミル~ 11 トップメッセージ…
2026年3月期
(2025 年 4月1日〜2026 年 3月31日)
ビジネスレポート
目次
3
日進工具グループの主なマイルストーン
5
当社のグループネットワーク
7
日進工具グループの価値創造プロセス
9
「新しいをつくる」~社会の発展に貢献するエンドミル~
11 トップメッセージ
15 事業の現場から
ブランドステートメント
15
製品開発とものづくり現場の変遷
18
技術年表
19
日進工具のものづくりの強みを考える
経営理念
21
新製品開発強化に向けた挑戦
23
日進工具とグループ会社ジーテックの営業体制
日進工具は
25
営業部東部グループのご紹介
26
香港現地法人のご紹介
27
ユーザー様の声:株式会社ナカニシ
SOFT(技術)
・HARD(機械)
・HEART(心)
いつの時代も、私たちの根底にあるのは、
「日本のものづくりを支える」誇りです。
超硬小径エンドミルのリーディングカンパニーとして、
お客様や社会のニーズに応える高付加価値製品を生み出すこと。
を創ります。
29 財務・非財務ハイライト
人と地球に優しい
31 財政状態及び経営成績の分析
33 コーポレート・ガバナンス
SOFT
製品を開発し
社会に貢献します。
技術
最先端のその先を行く技術と品質、
サービスを、未来へ、世界へ。
私たち日進工具は、無限に広がるものづくりの夢と
可能性を切り拓きます。
役員紹介
35
コーポレート・ガバナンスの体制
38 ESGトピックス
自らが打ち立てた技術水準に絶えず挑戦し、
時代を先取る革新的なソリューションを創造していくこと。
33
機械
HARD
心
HEART
免責事項
38
サステナビリティ
39
管理部門の業務とNSグループのDNAを考える
見通しに関する注意事項
41
生産部のものづくりへのこだわり
このレポートは、当社の計画・戦略・業績などに関する将来の見通しを含んでいます。
43
経営体制の変遷を振り返る
この見通しは、現時点において入手可能な情報から得られた判断に基づいています。
45 トピックス:展示会レポート
46 Webコンテンツのご紹介
47 会社概要/株式の状況/株主メモ
実際の業績は、様々なリスクや不確実性の影響を受けるものであり、
これらの見通し
とは大きく異なる結果となる場合があることをご承知おきください。
HISTORY
日進工具グループの主なマイルストーン
売上高(百万円)
12,000
※各年3月末(2001年までは8月末)に終了した期
※2002年は7ヶ月決算ですが、12ヶ月分に換算しています。
2016年、日進工具株式会社は 「つくる」の先をつくる というブランドステートメントを掲げ、
経常利益(百万円)
3,000
新たな一歩を踏み出しました。このステートメントには、1954年の創業以来、日本のもの
づくりとともに歩み、その進化を傍らで支えてきた私たちの矜持と、超硬小径エンドミルの
革新に挑み、Made in Japanの次なる未来をユーザーの皆様とともに切り拓いていくという
10,000
2,500
私たちの揺るがぬ決意が込められています。
日進工具のユーザー様は、寸分の誤差さえ許されない精密・微細加工の最先端分野で、日夜
8,000
2,000
様々な製品や部品の開発・製造に取り組んでいます。エレクトロニクスのダウンサイジング化を
受けて、電子部品やデバイスの超小型化・高集積化・薄型化が進み、ものづくりの現場に求め
られる技術要件は一層高度になっています。
6,000
1,500
日進工具は超硬小径エンドミルに特化した企業として、さらなる精度や耐久性の向上に挑戦
し、ユーザー様のニーズや期待に応えることはもちろん、絶えず自らの技術水準を高め、時代の
4,000
1,000
先端を行く技術・製品を創造してまいります。
500
2,000
売上高
経常利益
0
0
オイルショック
1954
1972
1977
バブル経済崩壊
1978
1979
リーマンショック
1980 1981 1982 1983 1984 1985 1986 1987 1988 1989 1990 1991 1992 1993 1994 1995 1996 1997 1998 1999
コロナ禍
東日本大震災
-500
2000 2001 2002 2003 2004 2005 2006 2007 2008 2009 2010 2011 2012 2013 2014 2015 2016 2017 2018 2019 2020 2021 2022 2023 2024 2025 2026
日進工具の歩み
1954年
1977年
1990年
1999年
2004年
2011年
2017年
2021年
日進工具製作所を創業
海外への輸出開始(台湾向け)
連結子会社(株)
ジーテックを設立
ISO14001認証取得
(株)牧野工業を完全子会社化
1979年
1991年
東京都品川区に
(有)日進工具製作所を設立
(株)
日進工具製作所に組織変更
日進工具(株)に商号変更
ジャスダック証券取引所に
株式を上場
東京証券取引所市場第二部に
市場変更後、第一部銘柄に指定
NS TOOL USA, INC.設立
1961年
(有)サトウツール((株)新潟日進)に
資本参加
2018年
ISO9001認証取得
日進工具香港有限公司設立
2009年
2002年
(株)日進エンジニアリングを
設立
2016年
東京証券取引所プライム市場へ
移行
1994年
小径エンドミルに特化を宣言
2001年
(株)
ジーテック、
(有)サトウツール
((株)新潟日進)
を完全子会社化
2013年
本社、東京営業所を移転
2022年
2025年
CI
(コーポレート・アイデンティティ)
を刷新
東京証券取引所
スタンダード市場に市場変更
(株)日進エンジニアリングが
(株)新潟日進を吸収合併
開発・生産・営業活動の沿革
1972年
1980年
1993年
1998年
2006年
2009年
2016年
ネジレ角50度の自社ブランド
『パワーエンドミル』
を発売
超硬ソリッドエンドミルで
金型業界に本格参入
仙台工場第1期工事完成
仙台工場第3期工事完成
生産部門、開発部門を仙台工場に
集約
第1回「NSプライベートショー」
開催
加工センターを新設
仙台工場第5期工事完成
自社開発工具研削盤「TGM」
1号機完成
2011年
2020年
仙台工場が東日本大震災から
1ヶ月で復旧
第3回
「NS TOOLプライベートショー」
2020開催
1989年
2001年
藤沢工場を新設し、
3生産拠点体制を確立
1994年
仙台工場第2期工事完成
ロロマティック社(スイス)製
CNC研削盤を日本に初輸入
仙台工場隣接地に
開発センターを開設
オールラウンド免震®構造を
持つ開発センター開設
2003年
工具研削盤「TGM」
自社開発プロジェクト発足
CBNエンドミルを発売
2020年(続き)
仙台在庫センター開設
(株)日進エンジニアリング
新潟工場で小径エンドミル
生産開始
2023年
第1回
「精密微細5軸セミナー」
開催
仙台工場第4期工事完成
2008年
第2回「NSプライベートショー」
開催
3
4
NETWORK
当社のグループネットワーク
A
日進工具株式会社本社・東京営業所
株式会社ジーテック
B
〒140-0014
東京都品川区大井1-28-1
住友不動産大井町駅前ビル6F
日進工具本社・東京営業所
TEL:03-3774-2459
FAX:03-3774-2460
URL:https://www.ns-tool.com
ジーテック
TEL:03-3774-8801
FAX:03-3774-8802
事業内容
切削工具の販売、在庫センター
日進工具株式会社
仙台工場・開発センター
B
日進工具香港有限公司
蘇州事務所
仙台工場・開発センター
C
日進工具香港有限公司
深圳代表処
仙台営業所
仙台工場
開発センター
事業内容
M
広東省深圳市羅湖区人民南路2008号
嘉里中心大廈1221室
TEL: 0755 2265 2275
FAX:0755 2265 2275
〒981-3408
宮城県黒川郡大和町
松坂平2-7-2
TEL:022-341-7028
FAX:022-341-7038
L
I
株式会社
日進エンジニアリング
新潟工場
D
〒981-3408
宮城県黒川郡大和町松坂平2-11
TEL:022-344-2201
FAX:022-344-2212
江蘇省蘇州市工業園区星港街199号
東方之門大廈北樓22樓
TEL : 0512 6866 2275
H
長野営業所
株式会社
日進エンジニアリング
本社工場
〒390-0811
長野県松本市中央1-17-16
松本中央ビル7F
TEL:0263-88-2451
FAX:0263-88-2452
N
NS TOOL USA, INC.
J
切削工具の開発・製造、在庫センタ―
株式会社牧野工業
A
G
本社・東京営業所
F
福岡営業所
〒812-0016
福岡県福岡市博多区博多駅南2-9-11
三共福岡ビル8F
TEL:092-260-8550
FAX:092-481-3378
H
株式会社日進エンジニアリング
本社工場
本社工場
〒981-3408
宮城県黒川郡大和町松坂平2-7-2
TEL:022-344-3805
FAX:022-344-3105
URL:https://www.ns-eg.com
事業内容
切削工具のコーティング加工、再研磨
5
I
新潟工場
事業内容
切削工具の製造
株式会社ジーテック
大阪営業所
名古屋営業所
〒550-0001
大阪府大阪市西区土佐堀2-2-4
土佐堀ダイビル9F
TEL:06-6534-4621
FAX:06-6534-4530
〒453-0801
愛知県名古屋市中村区太閤3-1-18
名古屋KSビル12F
TEL:052-414-6110
FAX:052-414-6120
株式会社日進エンジニアリング
新潟工場
〒946-0075
新潟県魚沼市吉田252
TEL:025-792-1927
FAX:025-792-2414
E
J
株式会社牧野工業
本社工場
〒961-0835
福島県白河市白坂鶴子山103-1
TEL:0248-21-8971
FAX:0248-21-8972
URL:https://makino-kg.co.jp
事業内容
工具ケースを主力としたプラスチック
成形品の開発・製造・販売
K
日進工具香港有限公司
K
日進工具香港有限公司
本社
香港九龍尖沙咀亞士厘道33號
九龍中心大廈10樓1001-02
TEL: 852 2736 8686
FAX:852 2736 0070
URL:https://www.ns-tool.com.cn
事業内容
切削工具の販売、在庫センタ―
N
NS TOOL USA, INC.
本社
2265 Star Ct., Building #3,
Rochester Hills, Michigan 48309
TEL: 248 829 1960
URL:https://us.ns-tool.com/en
事業内容
切削工具の販売、在庫センタ―
6
VALUE
日進工具グループの価値創造プロセス
〜ものづくりの夢と可能性を切り拓く〜
当社グループは、日本のものづくりが最も得意とする電子部品や精密部品の製造に
欠かせない精密・微細加工技術を支えるため、他社の追随を許さない技術と品質と
サービスに挑戦し、持続的な付加価値の創造に取り組んでまいりました。
付加価値創造資本
スキルと経験に
基づく提案営業
技術サポート
「つくる」の先をつくる
販売
小径特化の専門集団として、超硬小径エンドミルの分野では国内トップシェアを
誇り、高い利益率の確保と徹底した無借金経営を貫いております。
開発センタ−
(オールラウンド免震®)
日進工具グループ(2026年3月期)
小径工具に特化
94 億円
20 億円
14 億円
売上高
(小径比率80.4%)
経常利益
当期純利益
健全な財務基盤
総資産
自己資本
自己資本比率
現金及び預金
マイクロエッジ
シリーズ
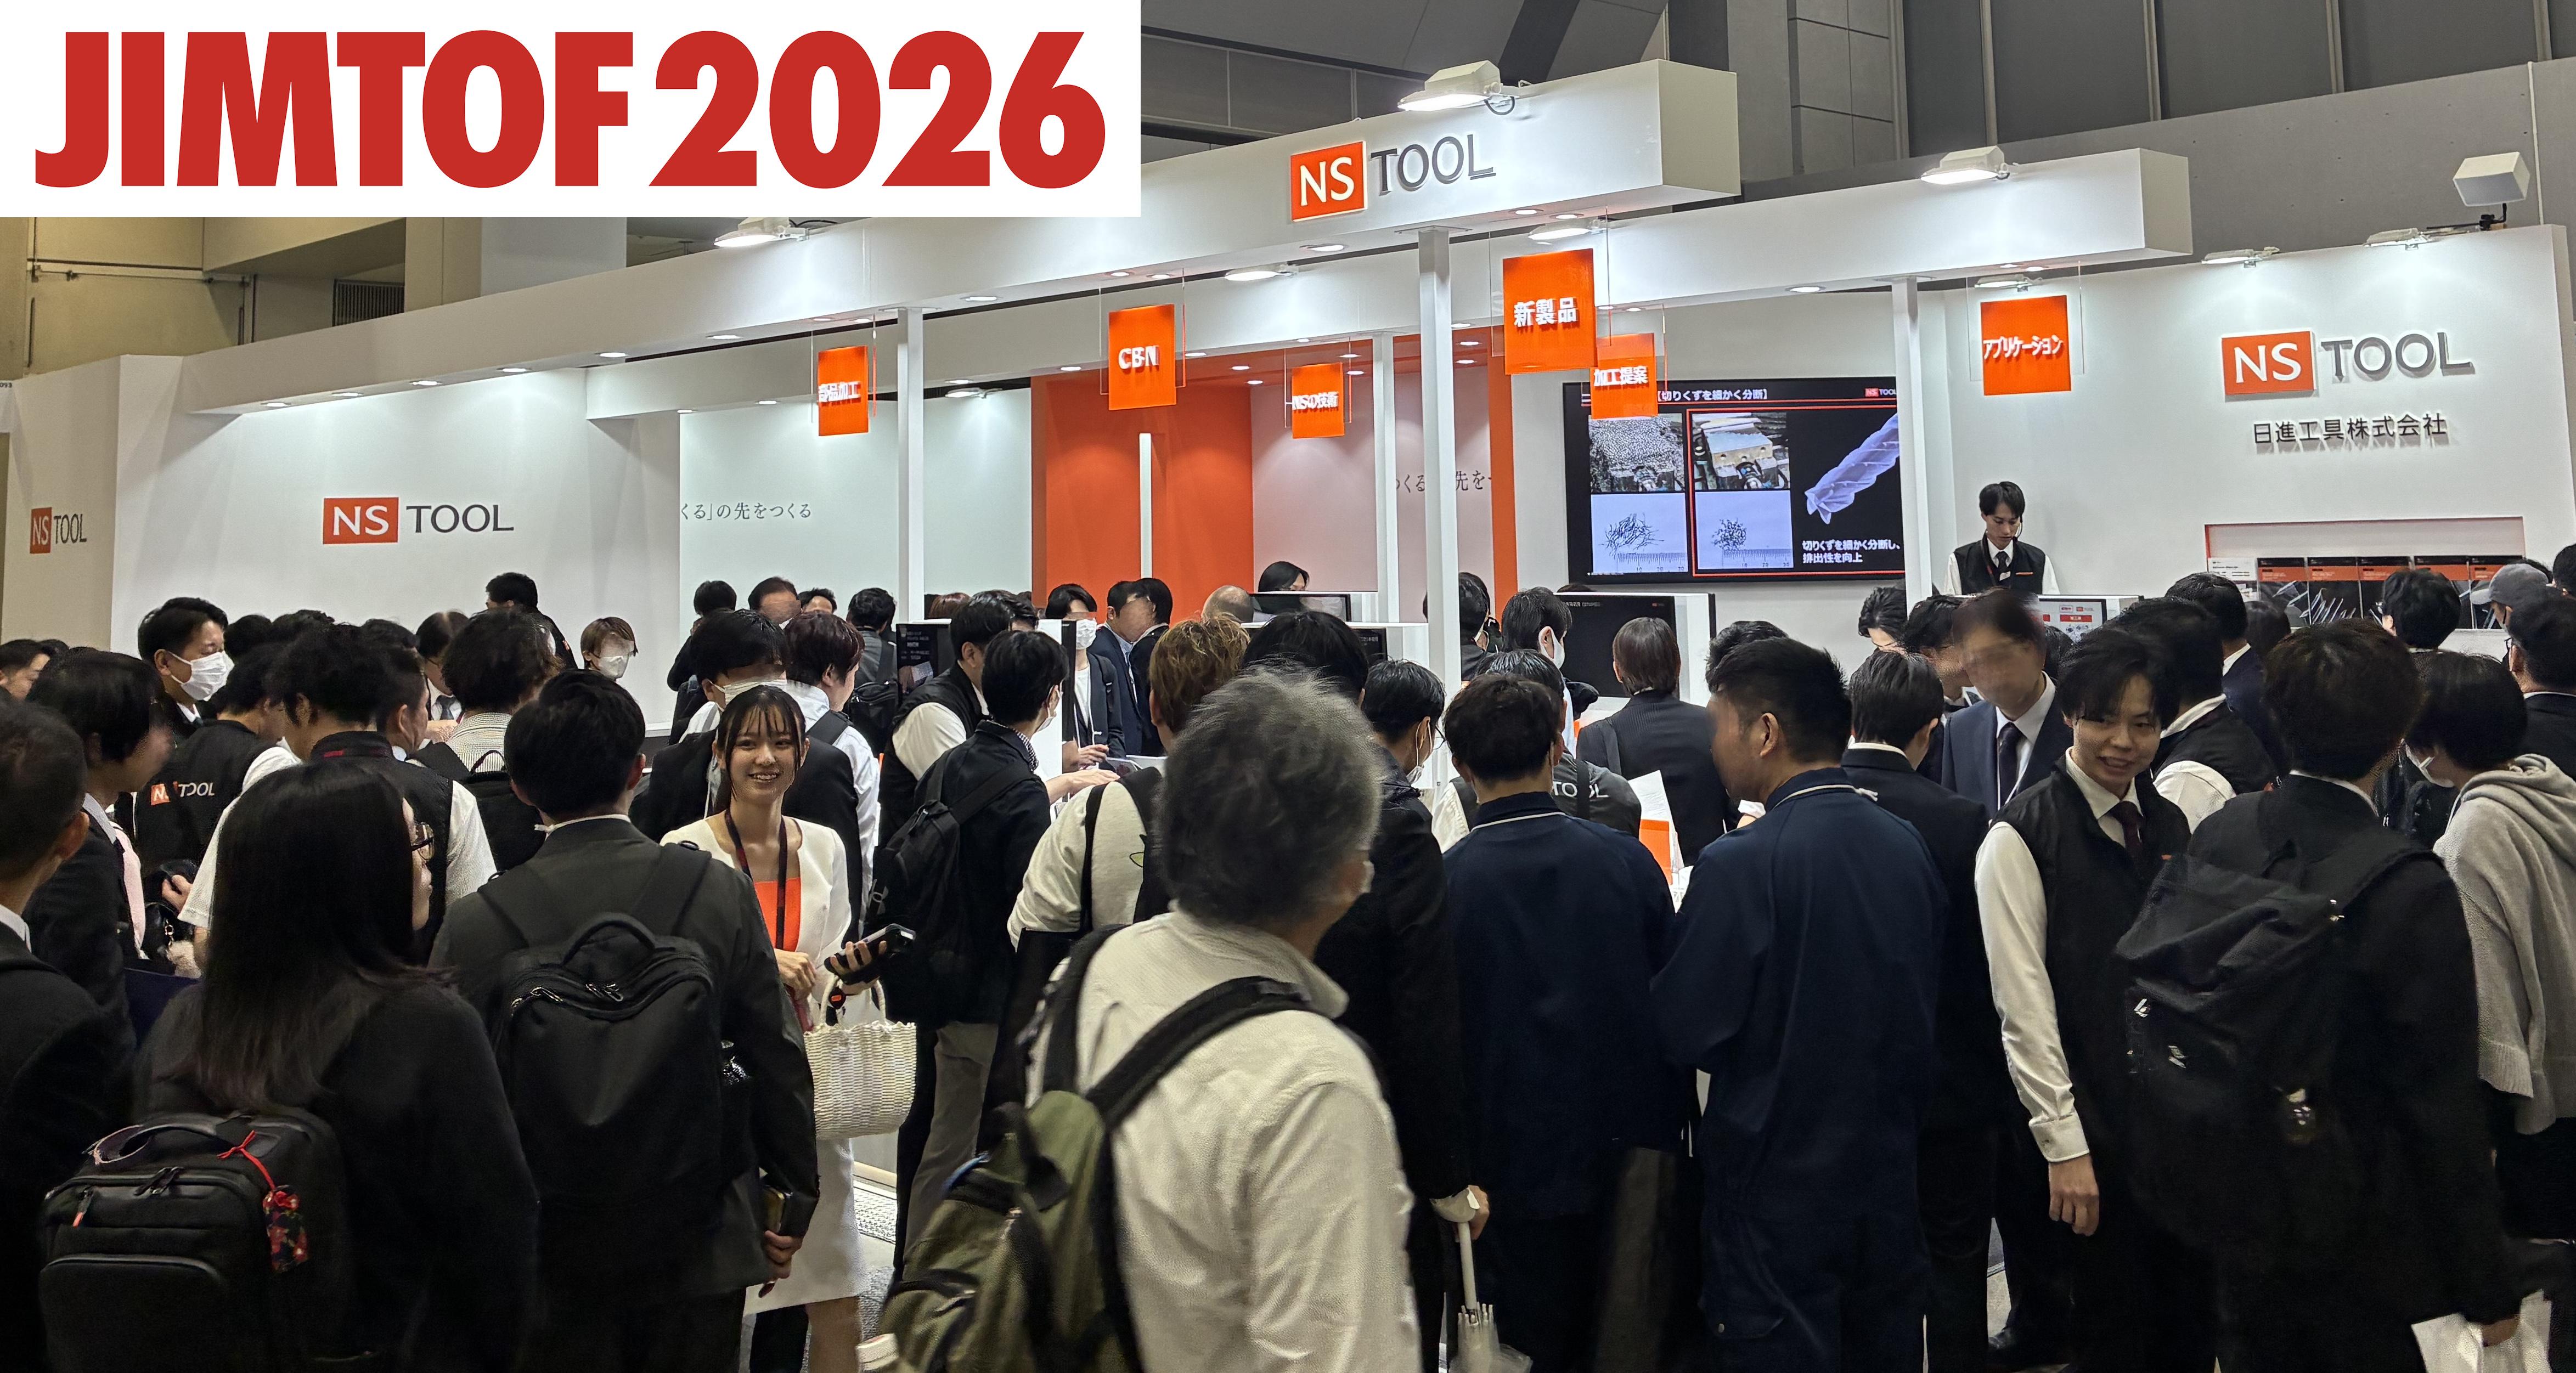
展示会の様子
当社製品『マイクロエッジ』
と
加工した髪の毛
195 億円
176 億円
90.1 %
95 億円
CBN
シリーズ
特化した開発体制
部品加工
小径工具の精鋭集団
従業員
(うち開発要員)
精密・微細加工に
金型加工
ユーザー様
364 名
部品の事例
33 名
ロングネック
シリーズ
開発会議
開発
金型の事例
豊富で優れた製品群
素材×形状×コーティング=
11,119 種類
エンドミル講習会
保有知的財産
セミナー
46 件
取得特許等
PCDシリーズ
受賞履歴
経済産業省
グローバルニッチトップ企業100選
モノづくり日本会議・日刊工業新聞社
超 モノづくり部品大賞受賞12回
ニュースダイジェスト社
NDマーケティング大賞
7
2008
2011
2019
2012
2020
2014
2021
2015
2022
2016
2023
2022
安全、環境、
災害対策に配慮した
工場棟
安定した品質を
確認する
刃径測定装置
2024
2014
経済産業省ほか
ものづくり日本大賞受賞2回
日本機械工具工業会
環境特別賞
2020
検査工程
2005
2013
自社開発機「TGM」※を
中核とした柔軟かつ
効率的な生産体制
生産
安定した品質と
高い生産性を
両立した自社開発機
「TGM」※
※TGM(Tool Grinding Machine)
:工具研削盤
8
ENDMILL
「新しいをつくる」〜社会の発展に貢献するエンドミル〜
エンドミルとは
工作機械に取り付け、材料を削ります
エンドミルは、工作機械に取り付け、鋼材・ステンレス・アルミなどを削る工具です。
穴、溝、平面、3次元曲面など、多岐にわたる切削加工が可能で、金型や部品などの加工に使われています。
日進工具の主要製品である刃径6mm以下の小径エンドミルは、精密・微細加工に強みを持ち、
金型加工
大手メーカーから中小メーカーに至るまで、5,000社を超えるユーザー様にご利用いただいています。
エンドミルの外観
工作機械の外観
加工の様子
小径エンドミルによる加工はこんなところで役立っています。
部品加工
パソコン
テレビ
精密機器
オーディオ
半導体製造装置
ロボット
測定器
磁気ディスク
顕微鏡
ゲーム機器
事務機器
化粧品ボトル
バイク
電気自動車・燃料電池車
望遠鏡
人工関節
LED(発光ダイオード)
ペットボトル
製缶
高圧水素タンク
メガネ
タブレット端末
スマートフォン
カメラ
貴金属
コネクタ
リチウムイオン電池
メモリーカード
時計
コンデンサ
バッテリー
ヘッドライト
MRI
内視鏡
カメラ
釣り具
FC スタック
LED
樹脂ケース
バックライト
コネクタ
X線装置
モーター
自転車
センサー
パワーコントロール
ユニット(PCU)
9
10
トップメッセージ
市場環境の変化が加速する中、日進工具グループは精密・微細加工技術を核に、価値創造の幅を着実に広げて
きました。2026年3月期をどのように位置づけ、次の成長に向けて何を見据えるのか。足元の成果と今後の
全社一丸で環境変化を機会に変え、
開発・生産・営業の連携で価値創造サイクルを
強化してまいります
取り組みについて、代表取締役社長の後藤弘治に聞きました。
予測困難な状況下での
事業活動の振り返り
への戦略的シフトでカバーするという施策を講じてまいり
ました。上期業績が落ち込んだことから、期中に業績予想
を見直すに至りましたが、最終的には厳しい外部環境の中
2026年3月期(以下、
「当期」)は、期初から米国の関税
でも、前期比で増収増益を確保することができました。予測
政策変更の影響を起点に世界経済の不確実性が高まり、
困難な環境だからこそ、市場の動きに即座に対応できる
需要の先行きが読みづらい事業環境でのスタートとなり
機動力が競争優位につながったと考えています。
ました。自動車メーカー各社が生産拠点の最適配置を見
直す必要に迫られ、新車開発が約半年にわたり全面的に
停止するといった状況の下、国内金型メーカーの受注は著
しく減少しました。その結果、2025年4月以降の超硬エン
ドミル生産金額は大きく落ち込み、2025年暦年では前年
アジャイル型開発体制への転換で
新製品開発を加速
比4.6%減となり、当社収益にも大きな影響が生じました。
当期における大きな成果の一つが、新製品開発のアプ
一方で、AIやデータセンター関連など、社会のデジタル
ローチを根本から見直したことです。従来は「完璧な製品
化やAI化を背景に中長期で拡大が見込まれる分野では、
を出す」ことを重視するあまり、慎重な検討を重ねていた
確かな投資が継続しており、当社製品に対する需要も堅調
ため、年間3、4つの新製品の投入にとどまっていました
に推移しました。さらに、秋口からは高市政権が打ち出し
が、市場の変化スピードが加速する中、
この方法では機会
た17の戦略分野への重点投資、特に防衛関連分野での設
損失が大きいと判断し「まず市場に出してフィードバックを
備投資が本格化しました。航空・宇宙産業も、
コロナ禍後の
得る」アジャイル型開発への転換を進めました。この転換
需要回復を背景に、引き続き堅調な推移を見せています。
において重要だったのは、営業部門と開発部門が責任を
代表取締役社長
こうした市場環境の下、当社グループでは、開発・生産・
共有する体制の構築です。従来は「開発がつくったものを
後藤弘治
営業が一体となり、事業現場の情報を素早く共有すると
営業が売る」という分業体制でしたが、現在は営業部門が
ともに、注力分野を明確にし、金型市場の低迷を成長分野
開発段階から関与し、市場ニーズを直接反映する製品開発
超硬エンドミル生産金額の四半期推移
(億円)
150
138
140
2022年3Q
コロナ禍からの
回復サイクルの
ピーク
130
120
120
117
2024年1Q
自動車メーカー5社による
型式指定不正問題の
顕在化
110
2025年2Q
米国関税政策による影響の
顕在化
100
90
0
2021
1Q
2022
1Q
2023
1Q
2024
1Q
2025
1Q
出所:経済産業省機械統計(常用従業者30人以上の事業所を対象)
11
12
トップメッセージ
を進めています。この体制により、目標としている年間10
製品を上回る12製品(14型番)
を市場投入することができ
ました。
供給責任を果たすための
調達・生産体制の強化
単位:百万円
実績
2025年3月期
2026年3月期
前期比増減率
売上高
9,431
9,494
0.7%
営業利益
1,767
1,959
10.9%
経常利益
1,779
2,011
13.0%
した。2027年3月期はさらなる高騰が予想され、超硬工具
当期純利益
1,264
1,442
14.0%
ため、開発スピードが飛躍的に向上しました。
また、新製品
業界は深刻な供給不安に直面しています。
タングステンは
研究開発費
427
455
6.5%
の増加は、お客様との接点拡大、代理店・販売店との関係
超硬工具の主原料であり、その約8割を中国に依存して
強化にもつながり、市場ニーズの把握精度も高まってい
いる業界構造において、この問題について強い危機感を
設備投資額
111
486
337.6%
ます。市場からのフィードバックを即座に製品改良に反映
持っています。
減価償却費
644
605
–6.1%
EPS
50.80
58.38
14.9%
1株当たり配当金
30.00
30.00
-
配当性向
59.1%
51.4%
-
開発スピードの向上を支えたのが、自社開発の「TOOL
近年、原材料の供給不安や価格変動は、業界全体の重要
Watcher(ツールウォッチャー)」という測定機です。従来、
課題です。特に、2025年春以降、中国がタングステンなど
工具の性能試験は人が付きっきりで行う必要があり、時間
戦略物資の対日輸出を段階的に制限し、超硬エンドミル
と人手がかかっていました。
「TOOL Watcher」は、
このプ
の原材料であるタングステン価格は1年で7倍に高騰しま
ロセスを24時間自動化し、無人で切削評価を実施できる
できる体制は、当社の競争力を確実に高めています。今後
工具メーカーにとって、安定供給は価値そのものです。
も、この「速く出して、速く改善する」サイクルを継続して
適切なタイミングで製品を供給できなければ、ユーザー
まいります。
様の生産活動に影響を与えてしまいます。だからこそ当社
は、調達・生産・出荷の各プロセスを平時から点検し、複数
営業戦略の高度化と
海外展開の戦略見直し
※2027年3月期業績予想は現時点で開示しておりません。
の選択肢を持ちながら供給責任を果たせる体制づくりを
進めてまいりました。
特に従来から在庫を重視する経営を続けており、製品在
2027年3月期の経営方針
ステークホルダーの皆様へ
庫で数か月分、素材在庫も十分に確保しており、今後半年
2027年3月期のスローガンは「全社一丸で考動し、成果
当期は、自動車金型市場が大きく落ち込む中でも、成長
営業面では、約1年前から定例の営業戦略会議を開始
は安定供給が可能な体制を維持しています。これは、
リー
に繋げよう!」です。当期は、
「まず動く」ことに重点を置き、
分野への戦略的シフトと新製品開発体制の刷新により、
し、国内・海外の部門長が連携して市場展開を推進する
マンショック時の教訓を活かした経営判断です。当時、在庫
新製品開発のスピードアップ、営業戦略会議の定例化など、
増収増益を達成することができました。
これは、開発・生産・
体制を整えました。この会議の特徴は、新製品を「出しっ
を保有していたことで、市場回復時に即座に対応でき、
シェ
新たな体制を確立しましたが、2027年3月期はその2期目
営業の各部門が一体となってPDCAサイクルを回し始めた
ぱなし」にしないことです。必ず販売実績、お客様の評価、
アを拡大できました。
この経験から、一定水準の在庫は「リ
として
「考えて行動し、確実に成果を出す」ステージに進んで
成果です。
現場での使われ方をレビューし、売れない場合は原因を
スク」ではなく
「競争力の源泉」と位置づけています。
まいります。
分析して改良するか撤退するかを判断する、PDCAサイクル
2027年3月期は、原材料価格の高騰や地政学リスク、
競合他社の中には、すでに欠品が発生し出荷できなく
新製品開発は引き続き年間10製品以上を目標とします
為替変動など、引き続き予測困難な経営環境が続くことが
なっているケースもみられますので、既存ユーザー様への
が、もう一つ意識しているのが、当社らしさを体現する「新
見込まれます。
しかしながら、当社グループは豊富な在庫、
市場分析の精度も向上させています。例えば、金型市場
安定供給を最優先としつつ、当社製品への切り替え需要を
規性の高い製品」を継続的に生み出すことです。市場から
小径工具への特化という競争優位性、そして新たなもの
の低迷が明確になった時点で、半導体製造装置や航空・
しっかり捉えるとともに、新規ユーザー様の獲得にも積極
すぐに理解される製品もあれば、時間をかけて価値が伝
づくり体制を武器に、むしろこの環境を成長の好機と捉えて
宇宙、医療機器といった成長分野への資源配分を迅速に
的に取り組んでまいります。
わる製品もあります。短期の数字だけでなく、技術ブランド
います。
を徹底しています。
実施するとともに、防衛関連の設備投資情報をいち早く
さらに、需要が急変しやすい局面では、受注や出荷の動き
の確立や新市場の開拓につながるテーマにも挑み続ける
全社一丸となった組織力で、変化を恐れず、新製品開発
キャッチし、営業活動を展開しました。機動的な戦略転換
を注意深く観察し、供給の偏りや急激な変動がないかを
ことが、長期的な企業価値の源泉になると考えています。
と営業活動を両輪に、かつ高品質・高効率のものづくりを
が、厳しい環境下での増収増益を支えたと認識しています。
日々確認することも欠かせません。異常があれば早期に
営業面では、機械メーカーとのコラボレーションを再強化
もって現場起点の改善を積み上げ、着実に前進してまいり
海外展開では、従来から約20カ国への輸出を続けてき
検知し、関係部門が連携して運用を調整する――こうした
いたします。新規設備投資の情報を早期に入手し、その導
ます。
ステークホルダーの皆様におかれましては、引き続き
ましたが、
「広く薄く」から「重点の明確化」へと舵を切って
地道な管理の積み重ねが、お客様への安定供給を支える
入先企業へのアプローチの迅速化を図ります。設備と工具
当社グループへのご理解とご支援を賜りますよう、お願い
います。限られた人員・資源で成果を最大化するには、勝ち
基盤になると考えています。
をセットで提案することで、お客様の立ち上げをスムーズ
申し上げます。
筋のある地域と用途に集中し、現地の市場特性に合わせ
13
2026年3月期実績
にし、当社工具の採用率を高めてまいります。
た提案力を磨く必要があります。アジアでは回復の兆しが
海外では、インドへの本格参入に加え、従来手薄だった
見える地域がある一方、サプライチェーン再編の流れも
地域での現地人材採用を進めます。その際、
まずは日本で
続いています。中でもインドは、産業の厚みが増しており
当社の企業文化を学んでから現地に配置する方針です。
中長期の成長余地が大きい市場です。当社としてもパート
当社の品質へのこだわり、
お客様第一主義を体得した人材
ナーとの連携を強め、確実に存在感を高めていきたいと
が現地で活動することで、グローバルな一体感の醸成を
考えています。
図ってまいります。
14
事業の現場から
製品開発とものづくり現場の変遷
し続ける感性を磨くことが重要です。現在は「いち早く市場
今日、今日より明日」と一歩ずつ進歩する「日進」の精神を重んじてきました。その歩みである、エンドミル製品の進化と、それを
に製品を出す」ことをテーマに、年間10件以上の新製品開
NSらしいものづくりを考える際、
「自動化」と
「無人化」を
支えるものづくり現場の変遷を代表取締役副社長の後藤隆司に聞きました。
発に取り組んでいます。
まずは開発件数で勝負し、
スピード
明確に区別する必要があります。自動化とは、人がやらなく
感ある開発の習慣を身につけることから始めています。
てもよい作業を機械化することです。ただし、人が全くいな
※�金型や部品の深い溝、狭い隙間、突起状の構造(リブ)
を加工するために、首下が長く
くてよいわけではありません。一方、無人化は、一度装置を
刃先が細い形状をした専用の切削工具
失敗を恐れず、
日進工具らしい挑戦に取り組み、
10年、20年先のものづくりを支える
基盤を構築してまいります
「NSらしい製品開発」を支える
ものづくり現場
設定すれば人の手を全く必要としない状態を言います。
当社の事業特性上、
すべての工程を無人化することは不
可能ですし、私はそうすべきとは考えていません。
アイテム
数が多く、さらに注文が少数ロットの場合は、完全自動化
エンドミルをつくるだけなら、既存の設備で充分でしょう。
は現実的ではありません。むしろ重要なのは、
どの作業を
しかしながら、私たちが目指すものづくりを実現するには、
自動化・無人化し、
どの作業に人が関わるべきかを見極める
世の中にない設備が必要になることもあります。そんな時、
ことです。一定の生産量がある製品は無人化ラインで対応
代表取締役副社長(生産・開発担当)
私たちは設備を自分たちでつくるしかありません。
自社単独
し、多品種少量製品には人が柔軟に対応する。この使い
後藤隆司
でできないのであれば、協力会社の方々と一緒に開発する。
分けが、当社のものづくりの基本です。
この姿勢が、当社のものづくりを進化させてきました。
最大の転換点は、測定機の内製化です。20年以上前から
すべてを自動化しようとすると、必ず失敗します。過去の
経験から学んだことは、
「絞る」ことの重要性です。小径に
始めたこの取り組みは、失敗の連続でした。最初の3回は、
特化したからこそ、今の日進工具があります。あれもこれも
など、印象的なネーミングとともに独創的な製品を送り
あれこれ欲張りすぎて失敗しました。
この失敗を通じ、刃径
と手を広げれば、どれも中途半端になります。DXやAIの
出してきました。2005年には、刃径10μm(1/100mm)
測定に特化した測定機の開発に成功しました。他社との
活用についても、同じ考え方を展開しています。
入社後、私が一貫して大切にしてきたのは、
「他社にない
の超微細加工用工具「マイクロエッジ」を世に出しました。
共同開発で生まれたこの測定機が、現在、自社開発の工具
一度にすべてを導入するのではなく、効果が見込める
ものをつくる」という姿勢です。
これを私たちは「NS(日進
市場には早すぎたかもしれませんが「さすがは日進工具」
研削盤「TGM」に設置している測定機の原型となりました。
業務から小さくスタートし、成功事例を積み重ねながら横
工具)
らしい製品開発」と呼んでいます。売れる、売れない
と言われる製品となりました。CBNエンドミル「そろばん
2008年頃に1台の測定機が完成したのですが、非常に
展開していく。大手企業のように専門人材が豊富にいる
は後で考える。
まずは、技術力の向上につながることを実践
玉」や、PCDエンドミル「ツルツル」もその形状や特徴から
精度が高く、需要が集中したため、
「TGM」を5台並べて1台
わけでは ありませんから、時間はか かりますが 、着実に
する。
この精神は、途切れさせてはいけないと考えています。
生まれたニックネームで、ユーザーの皆様に親しまれて
の測定機で管理する生産ラインを構築しました。
しかし、
進めることが、当社には合ったやり方だと認識しています。
います。これらは、
「工具メーカーの常識を変える」を追求
測定待ちが発生し、
タイムリーに測定ができないため、1台
自動化が進みすぎると、柔軟な対応ができなくなるリスク
した結果、誕生した製品です。
1台に測定機を取り付ける方針に転換しました。
もあります。人が経験を積む機会と自動化・無人化導入の
経営理念に込めた想いと
製品開発の歩み
当社の製品開発の歴史を振り返ると、創業期のパワー
エンドミルに始まり、1986年にはリブエンドミルという
当時珍しい製品を開発しました ※ 。この当時、高速スピン
一方で、会社の規模が大きくなると、費用対効果ばかりが
予算の制約がありましたが、外部の協力も得ながら、徐々
ドルメーカーと協業し、スピンドルと工具をセットにした
重視されがちです。市場ニーズに応えることも大切ですが、
に「TGM」への測定機設置を進めました。
これにより、現在
提案を行っていました。これが金型業界での細溝加工を
「NSらしさ」を追求する開発も並行して進めなければなり
では、検査工程に係る時間が大幅に短縮されています。
さら
可能にし、当社の基盤を築いたと言えます。
ません。現業に追われる中で、
そのバランスをどう取るのか。
に「TGM」に蓄積されたデータを活用した補正技術により、
常にアンテナを張り巡らし、
何か面白いものはないかを探索
ほぼリアルタイムでの品質管理が可能になりました。
その後も「びっくりエンドミル」
「かたぶつエンドミル」
この測定機開発を支えてくれたのは、ベンチャー企業の
製品開発の歴史
リブエンドミル
1986年
発売
15
NSらしいものづくりの進化の方向性
日進工具のものづくりは「他社にないものをつくる」ことへの挑戦の歴史です。1954年の創業以来、当社は一貫して「昨日より
びっくりエンドミル
1990年
発売
かたぶつエンドミル
1990年
発売
CBNエンドミル
(そろばん玉)
マイクロエッジ
2003年
発売
2005年
発売
PCDエンドミル
(ツルツル)
2013年
発売
バランスを取りながら、次世代のものづくり体制を構築
したいと考えています。
現在の課題認識と
今後の重点施策の方向性
技術者でした。小さな会社ながらも、技術力は確かでした。
最優先課題は、一層の原価低減です。原材料価格が異常
小規模でも信頼できるパートナーと組むことの重要性を、
なペースで上昇しています。
原料の枯渇も深刻で、
リサイクル
この経験から学びました。
の重要性が増しています。例えば、主要な材料である超硬
測定機の内製化のほか、重要な取り組みとして「小径へ
合金(炭化タングステン)のリサイクル回収価格は、数年前
の特化」が挙げられます。1994年の小径特化宣言を発する
の1キロ当たり数千円から現在は1万円以上になっており、
前は、当社も太径エンドミル(6mm超)
を手掛けていました
今後さらに上昇する見込みです。
が、小径に集中する決断を下しました。既存のユーザー様
こうした状況下、当社グループが推進する小集団活動で
への対応があるため、現在も太径エンドミルの生産は継続
ある「オレンジFC活動」をさらに強化してまいります。その
しています。
とはいえ、太径工具は、設備投資も大きく、素材
際、最も大切にしたい取り組みが、
「チャレンジできる環境
単価も高いため、なかなか利益を出せません。売上規模を
づくり」であり、
「失敗を恐れず挑戦する人づくり」です。もの
追うのか、利益率を重視するのか。
この問いに対する答え
づくりの現場にとって、失敗を恐れて何もしないことは極め
は、
まだ完全には出せていませんが、原材料の高騰が続く
て危険です。
次世代を支える環境づくり・人づくりを実践する
現在、
この問題にも正面から向き合う必要があるかもしれ
ため、失敗したら減点ではなく、加点する評価制度が必要
ません。
だと考えています。ただし、評価の仕組みづくりは難しい
16
事業の現場から | 製品開発とものづくり現場の変遷
課題ですので、
まずは現場レベルで、
「失敗できる環境」を
考えています。
「こうします」と語ることよりも、実際に行動
整えることから始めます。2027年3月期は、
そのための仕組
し、結果を出すことこそが、
ステークホルダーの皆様の期待
みづくりがものづくり現場の幹部の課題と設定しています。
にお応えすることだと思うからです。
開発スピードの向上も継続課題です。また、ユーザー様
コロナ禍以前、当社グループは勢いある成長を実現して
に測定技術を提案する部署の強化も視野に入れています。
きました。過去数年にわたり、国内外の事業環境の大きな
現在は自社での活用を優先していますが、将来的にはこの
変化に直面し、成長の勢いが一時的に止まりましたが、再び
技術を外部にも提供し、ユーザー様のものづくりの一層の
勢いが戻る時が来ると思います。失敗を恐れずに挑戦し、
進化に貢献したいと考えています。ものづくり現場のメン
その経験から学び、成長する。
この繰り返しが、当社の次の
バーには「今年の漢字」として「挑」を掲げました。2025年
10年、20年を支える力になると確信しています。
は「進」でしたが、2026年は挑戦の年です。やってみること
からしか、答えは生まれません。実行あるのみです。
正直に申し上げて、現在は目の前の課題に真剣に取り
組むことで精一杯ですが、それこそが誠実な姿勢だと私は
日進工具の“いま”を支えるものづくりの歩み
● 製造インフラ関連 ● 製品開発関連
1970年代
● 米ユニゾン製NC機を日本初導入
→「パワーエンドミルの日進」が定着
1980年代
1982
●『超硬ソリッドエンドミル パワーエンドミル』発売
1985
自動車金型業界に参入
● 米国航空機業界で使われていた米ホフマン製CNC万能工具研削盤を日本初導入
1986
と、変えるべき仕組みや文化の見極めが重要だと考えて
施策に取り組んでまいります。ステークホルダーの皆様に
1972
●ハ
� イス
(高速度鋼)
を使った不等分割3枚刃で初の自社ブランド『パワーエンドミル』で金型業界に参入
変化の時代だからこそ、変わらぬものづくりへの情熱
います。その両立を目指し、グループが一丸となって重点
ステークホルダーの皆様へのメッセージ
技術年表
● 独ワルター製CNC万能工具研削盤を導入
●プラスチック金型用として、業界初のリブ溝加工向けに『NHR-2 超硬ソリッド深リブエンドミル』発売
1990年代
1994
小径特化宣言(当社はエンドミル刃径6mm以下を「小径」と定義)
● 超硬小径エンドミル製造機のスイス大手、
ロロマティック社製CNC研削盤を日本初導入
は、当社グループの挑戦を温かく見守っていただければ
幸いです。取り組みの成果を必ずお見せする強い覚悟で、
1996
● 超硬小径エンドミル製造用オリジナルCNC研削盤「マサムネ」導入
「NSらしいものづくり」に挑み続けます。
1997
●『無限コーティングシリーズ』超硬エンドミル発売(TiAlN被膜を使った耐摩耗性と潤滑性に優れたオリジナルコーティング)
2003
ハイスエンドミル『パワーエンドミル』の生産終了
2000年代
●�『CBNスーパーフィニッシュボールエンドミル』発売
2026年3月期はスピード感ある製品開発を推進し、
14型番の新製品投入(うち、規格追加4型番)
を行いました。※画像は一部抜粋
(高精度金型向けとしてcBNを採用した小径エンドミルを世界で初めて標準化)
●『無限コーティングパワーZエンドミル』発売(ノンステップで突込みから溝への連続加工が可能)
2005
● 超微細加工用工具『マイクロエッジ』発売(スクエアエンドミルでφ0.01までを世界で初めて標準化)
2006
● 工具研削盤「TGM」を自社開発(微細工具の量産用CNC工具研削盤で工具の測定から搬送などを自動化、無人運転を可能に)
2007
●コーティング内製化に着手、製品収納ケースを業界初の内製化、CBN小径エンドミル等の再研磨事業開始
●『無限コーティングプレミアム高硬度用2枚刃ボールエンドミル』発売
(無限コーティングを進化させ、高硬度材の直彫り加工でも工具寿命が飛躍的にアップ)
2010年代
2020年代
2008
●『マイクロドリルシリーズ』発売(ドリルでφ0.01までを世界で初めて標準化)
2012
●『NS-MicroCAM』発売(工具メーカーが考えた精密・微細加工に特化したCAD/CAMシステム)
2013
●『PCDボールエンドミル』発売(焼き入れ鋼の表面を鏡面のような仕上げ面に)
2018
●『銅電極加工用DLCコーティング ボール/ラジアス/スクエア ロングネックエンドミル』発売
2019
●『高能率“Z”エンドミルシリーズ』発売(特殊形状を採用し、ステンレス材や炭素鋼に特化した高能率加工を実現)
2020
●『無限コーティングプレミアムPlus』発売(多重積層コーティングを開発し、70HRCまで切削可能に)
●『CBN4枚刃ラジアスエンドミル』発売(切削抵抗を軽減させる新刃形状を採用し、加工精度と速度が向上)
2021
●『5軸加工用ボールエンドミル』発売
2022
●『PCDボールエンドミル』規格拡大(ラインアップにR1.5~3を追加)
2023
●『アルミ用高能率ラジアスエンドミル』発売(3枚刃3倍刃長)
●『無限コーティングプレミアム高能率レンズ形3枚刃エンドミル』発売
2024
●『MPXコーティングSUS420用ロングネックボールエンドミル』発売
(耐熱性と硬度の高い新コーティングを開発し、SUS420J2に特化した長寿命化を実現)
2025
●『CBN3枚刃ロングネックボールエンドミル』発売(多刃化によりさらに長寿命で高能率な加工が可能に)
●『銅電極加工用ニック付き3枚刃スクエアエンドミル』発売(切り屑を細かく分断、切削抵抗が激減し加工能率が向上)
●『樹脂加工用3枚刃右刃左ねじれスクエアエンドミル』発売 (左ねじれの効果により側面加工のバリを極端に抑制)
17
18
16
事業の現場から
日進工具のものづくりの強みを考える
社内外の視点を通して、日進工具のものづくりの本質を考える
エンドミル一筋の後藤副社長と、総合工具メーカーで幅広い経験を積んだ斉藤社外取締役。スピード感ある意思決定、測定
技術の内製化、そして「NS(日進工具)
らしい製品開発」への想い。日進工具のものづくりの強みや今後取り組むべき課題
など、異なる視点を持つ二人が日進工具のものづくりについて意見を交わします。
ものづくりに知見を持つ
社外取締役を迎えて
クを活用して、海外展開をサポートしていただきたいです。
後藤斉藤社外取締役は、月1回の取締役会で、開発部門の
斉藤 これからの開発テーマについて申し上げれば、日進
提案に対して「痛いところ」を突いてくださいます。私たち
工具らしい 製品、すなわち他社が 持っておらず、用途も
は大手メーカーと違い、厳格なルーティンに則るのでは
ユーザー様が「どうやって使うの? 」と思うような工具を
なく、各人のセンスで開発を進めてきた部分もあったのです
テーマにしてみてもいい のではないでしょうか 。新しい
が、その過程で生じるチェックの甘さを指摘してくださって
加工方法を提案するような製品ですね。
います。
後藤 それこそが、昔から私たちが重視している「NSらしい
も強化したいと考えています。斉藤社外取締役のネットワー
さらに、斉藤社外取締役は工具メーカーの中でも、総合
工具」です。開発する製品が全てそうである必要はありま
メーカーで幅広い製品を扱ってこられました。当社は小径
せんが、NSらしい製品開発は継続していく必要があります。
という非常に狭いマーケットに特化していますので、違う
売れる、
売れないではなく、
そういう製品こそが当社のファン
視点からのチェックが良い刺激になっていると感じてい
をつくると確信しています。また、小径工具メーカーとし
ます。もちろん、大手メーカーの良い手法は学びたいです
て、刃径6mm以下の工具ならば何でもできる技術の確立
が、全てを真似る必要はないと考えています。むしろ、大手
を目指しています。
メーカーが絶対にできないことを手掛けるべきですし、それ
こそが当社の強みだと考えています。
決定のスピードの速さです。前職では決裁を受けるために
ステークホルダーの皆様への
メッセージ
時間がかかりましたが、日進工具では月1回の取締役会で
斉藤日進工具の製品を使うと、皆さんがハッピーになる。
様々な事項が決まっていきます。開発から市場投入までの
これが、私が最も重視するメッセージです。
日進工具の工具
スピードは大きな強みだと思います。商品管理がしっかり
を使うと機嫌よく働ける状況がつくれるということですね。
行えていれば、売れない商品は追いかけずに、いち早く次
ハッピーな仕事ができると、自分自身も気持ちよく働ける
の製品開発に移行する――そのようなアジャイルな製品
し、周囲の人々にも良い影響を与えます。日進工具の製品
斉藤日進工具の取締役会に参加して驚いたのは、意思
社外取締役
代表取締役副社長(生産・開発担当)
開発は私も非常に好きなやり方です。大手メーカーでは、
がその一助になれば、非常に嬉しいことだと思います。
斉藤貴宣
後藤隆司
製品化までのスピードがどうしても遅くなり、そのような
後藤私にとっては、
「日進工具の工具じゃなきゃダメ」と
開発体制を組むことは困難です。
言っていただける製品を提供し続けることが最も大事な
社外取締役就任の経緯と
日進工具の印象
ことです。売上成長も重要ですが、そういうユーザー様、
いる。総合工具メーカーでは見られない、小径エンドミル
斉藤 2024年11月末に前職の三菱マテリアル株式会社
を選択定年退職しました。65歳まで働ける環境でしたが、
斉藤何よりも、PRが必要だと感じています。日進工具の
入って良かったと、
ご自分のお子さんに言っていただける
元気なうちに後任に席を譲り、自分の経験を活かせる場を
製品がどれだけ世の中の根幹を担う最終製品に使われて
ようになれば、それが当社のDNAとして次世代にも受け
求めたいと考えました。前職では製品開発、生産技術、海外
いるかをご存じの方が少なすぎると感じています。金型が
継がれます。従業員のお子さんが全員入社したいと思って
営業、マーケティングと幅広い業務に携わってきました。
なければ最終製品はつくれない。半導体や医療機器など、
くれるような会社を目指していきたいと考えています。
過去のビジネスで日進工具と関わらせていただいた経緯が
あらゆる領域の製造において、日進工具の小径エンドミル
あり、後藤副社長をはじめ、経営陣とも面識がありました。
は不可欠です。この事実をもっと外部に発信すべきだと
いくつかの選択肢の中で、最も価値観が合うと感じた会社
思います。加えて、大学や工業高校、専門学校との連携を
が日進工具でした。
深め、学生の方々に工場見学の機会を提供することも重要
特化だからこその設備投資だと感じました。
初めて仙台工場を訪問した時は、率直に驚きました。
にしたいのは、自分の子供を日進工具に入れたいと思って
いただける会社にすることです。親が勧めてくれた会社に
だと感じています。
後藤髪の毛に文字を彫る技術は2005年に始まり、
すでに
既知のものづくり現場と比較しても、生産ラインやシステム
19
日進工具のファンを増やしていきたいです。もう一つ大切
市場環境の変化と
日進工具が今やるべきこと
が格段に進んでいました。作業帽が不要な安全環境、協働
後藤工具に詳しい方に工場を見ていただくと、
「当社が
20年以上が経ちますが、いまだにこの技術・製品を知ら
ロボットの導入など、私たちが将来構想として描いていた
一歩先を行っている」という感覚を持つことが 多かった
ない 方々が 多くいらっしゃいます。大手メーカーの工具
スマートファクトリーの半分がすでに実現されていました。
ですね。ただ、そこに満足せず「もっと、もっと先に」を追求
担当の方でさえ、当社のサンプル品を見て「こんなことが
特に印象的だったのは、測定機を自社開発していること
してきたのが現在の工場につながっています。設備も一度
できるんだ」と驚かれることがあります。おっしゃる通り、
でした。ものづくりの根幹となる測定技術を内製化し、
さら
に揃えたわけではなく、1年に1台ずつ、その時点で最良の
PRの仕方をもっと工夫する必要がありますね。
に開発センターには名だたるメーカーの工作機械が並んで
機械を選んで導入していきました。
また、販売金額の約35%を占める海外市場への取り組み
20
事業の現場から
新製品開発強化に向けた挑戦
開発と営業の連携が生み出す新たな価値
市場環境の変化が激しさを増す中、当社は新製品開発から発売までのスピードを加速し、積極的な製品投入を進めています。
その背景には、開発部と営業部の連携深化があります。開発現場を率いる部長の遠藤と、営業と技術をつなぐ営業支援グループ
長の黒澤が、現場の変革と目指すべき組織の姿について語り合いました。
情報を蓄積し、次につなげる仕組み
組織面では、開発部と営業部が同じ方向を向き、情報を
遠藤新製品を多く出すからこそ、
「何が良くて、何が課題
循環させることで、価値創造のスピードはさらに高まります。
だったのか」を正しく判断できる仕組みが不可欠です。営業
これからも組織全体が一丸となって、新たな市場開拓に
現場で得られた評価が、次の開発にどう活かされるのか。
挑戦し続けたいと考えています。
その流れが見えなければ、改善のスピードは上がりません。
黒澤営業支援グループとしても、情報の一元化は重要な
テーマです。営業担当者がどの資料を使い、
どんな反応が
あったのか。その情報を個人の経験で終わらせず、組織の
グローバルに市場を見る
視点の強化とこれから
知として蓄積し、判断に資する情報として管理・運用して
黒澤海外市場では、工具単体ではなく、加工方法や考え方
いく必要があります。成功事例だけでなく、うまくいかな
まで含めた提案が求められる場面が増えています。また、
かったケースも含めて共有し、次の判断につなげる仕組み
同じ加工であっても使用される機械や工具寿命に対する
を構築していきたいと考えています。
考え方、生産性とコストの優先順位は国や地域によって
大きく異なります。日本国内で培った技術をそのまま展開
相互で理解する現場交流
遠藤開発と営業で技術を共有するために、営業技術課の
するのではなく、現地のニーズに合わせた形で提供する。
そのためにも、開発部、国内営業部、海外営業部の連携を
さらに強めていく必要があると考えています。
メンバーを一定期間、開発現場で受け入れる取り組みを
行っています。
単なる見学や研修ではなく、
開発の一員として
同じスピード感で仕事をしてもらうことを重視しています。
営業部営業支援グループ グループ長
開発部部長
黒澤淳一
遠藤孝政
入社後、仙台工場で開発業務に従事し、開発グループ長として製品開発の最前線
入社後、一貫して製品開発に携わり、数多くの新製品開発を主導。切削工具の
を経験。2023年に営業部に異動。営業支援グループ長として、開発現場での
評価技術に精通し、評価プロセスの自動化・効率化を推進。現在は開発部長
豊富な経験を活かし、技術と営業の架け橋となる。営業技術課、営業企画課、
として、年間10件以上の新製品開発という積極的な目標達成を牽引。技術者
営業業務課を統括し、技術データの作成、
カタログ等の制作、製品の在庫管理
育成にも注力し、次世代の開発人材の育成に取り組む。
まで幅広く対応。
ありません。なぜそうなったのかを考え、次にどう活かすか
まで掘り下げます。
このスピードや考え方を体感してもらう
ことで、営業技術との相互理解が生まれてきました。結果
として、検証の依頼や報告もスムーズになり、全体の効率
が上がっています。
遠藤国内市場だけを見ていると、競争の全体像を見誤る
新製品を「出し続ける」ための開発改革
開発データを「伝わる形」に変える
遠藤近年、開発部には新製品をより多く、迅速に市場に
黒澤営業支援グループの役割は、開発部が生み出した
求められる価値も変わってきます。国内や海外を問わず、
投入することが 求 められるようになっています。多様な
技術や製品情報を、
ユーザー様の視点に立ち、わかりやすく
市場の確かな情報を捉え、それを開発に反映していくこと
ニーズに対し完成度を高めてから発売する従来のやり方
整理し、営業が自信を持って説明できる形にすることだと
が、今後ますます重要になると感じています。
ではなく、
コンセプトを絞りユーザーニーズに特化した製品
考えています。開発が作成する技術データは非常に専門的
黒澤 かつては、製品を紹介すれば自然と販売につながる
をまず市場に出し、ユーザー様の反応を見ながら改善して
です。そのまま提示しても、必ずしもユーザー様に伝わる
時代もありました。
しかし今は、加工のプロであるユーザー
いく方針に合わせて、開発を進めています。
とは限りません。そこで、製品の特長や加工のポイントを
様が、プロだからこその課題を抱えていらっしゃいます。
わかりやすく説明し、資料や動画、Webコンテンツとして
製品の特長やユーザー様にとってのメリットを説明する
当然、開発件数が多くなりますから、業務の効率化を図り
ながらPDCAサイクルを回す必要があります。そこで特に
21
開発の仕事は「削れた」
「削れない」で終わるものでは
展開しています。
可能性があります。海外市場では加工環境や文化も異なり、
黒澤短期間であっても営業技術課のメンバーが開発現場
ことはもちろんですが、ユーザー様の課題に対して、どの
大きなテーマとなるのが 、切削評価の効率化です。従来
ワークサンプルが「できました」という結果だけでなく、
を経験することで、切削検証の手法と結果に対する分析や
ような加工提案ができるのかというところまで踏み込ま
時間がかかっていた評価の無人化を進めることで、夜間や
「なぜできるのか 」
「どうすれば 再現できるのか 」までを
考察力が向上します。
また、開発部が製品開発を行う際に
なければ、選んでいただけない時代です。ユーザー様に
休日も含めて無人で評価を繰り返すことが可能となり、切削
含めて伝えることが重要です。そこまで踏み込むことで、
何を重視し、
どのような課題意識や背景のもとで工具設計
当社を選んでいただくために、エンドミルだけでなく、工作
評価の回転率は大きく向上しています。
この仕組みがなけれ
初めて加工提案としての価値が生まれ、ユーザー様の信頼
や切削検証を進めているのかを理解できます。その結果、
機械、CAD/CAM、周辺機器などの知識・知見を身につけ
ば、現在の開発件数には到底対応できなかったと思います。
につながると考えています。
ユーザー様に対しても、根拠を伴った説得力のある提案を
ていく必要があると感じています。
遠藤開発部でも自社のWebスタジオを活用し、製品に
することで、信頼性の向上につながると考えます。
関する動画の制作・配信を行っています。ユーザー様はもち
遠藤理屈を理解し、設計できる技術者を数多く育てていく
としては非常に恵まれたインフラを持っています。
この強み
ろん、エンドミルに馴染みのない一般の方にも理解しや
ことが重要です。
また、背景を理解し、次を考えられる人材
を最大限に活かし、最先端の加工技術提案を行うことで、
すいような構成にすることで、当社の小径工具が世の中の
を育成することで、将来の競争力につなげたいと考えてい
「日進工具でなければならない」と言っていただける存在
ものづくりを支えていることを広く伝えています。
ます。
を目指してまいります。
当社は、設備や測定機、
ソフトウェアなど、工具メーカー
22
事業の現場から
日進工具とグループ会社ジーテックの営業体制
補完し合う2つの営業力が当社グループの競争力を支えています
精密切削工具市場の競争が激化する中、戦略的に2つの営業組織を有する当社グループ。当社営業部が代理店・販売店との
関係強化を通じて既存市場を深耕する一方、
グループ会社のジーテックは直接対応が必要な顧客への機動的なアプローチを
担っています。国内営業における両社の連携について、それぞれの責任者に聞きました。
しきれない商流を補完する役割を担っています。具体的に
のためには、組織として動く体制が不可欠です。過去は属人
は、半導体関連や医療機器の用途など、機密性が高く直接
的な強みで勝てましたが、現在は組織力で戦っている競合
取引が求められる分野での対応が中心です。
また、既存の
に対抗しなければなりません。営業担当者一人ひとりの
商流では取りこぼしてしまう可能性のある案件を、確実に
技術力を底上げし、どの担当者が対応しても同じ品質の
拾い上げる機能も果たしています。
提案ができる体制を目指します。
宮﨑 ジーテックは、深掘りした情報の収集が可能な部隊
加えて、営業担当者には、既存顧客の深掘りだけでなく、
です。
メーカー営業では限界がある細かなニーズの把握
新たな用途市場の開拓も求められます。
技術力を身につけ、
や、立ち上がりの早いユーザー様との密接な関係を活かし、
お客様に対して誠実にレスポンスできる人材を育成して
市場動向や試作情報をいち早く入手できます。半導体関連
いきます。また、代理店・販売店との関係をより強固にし、
など重点施策領域への対応でも、その機動力が活きます。
彼らが日進工具の製品を積極的に推奨してくれる環境を
例えば、新規プロジェクトの初期段階から関わり、試作段階
つくることも重要です。そのためには、製品力だけでなく、
での課題を把握して製品開発にフィードバックする。この
情報提供やサポート体制の充実も必要です。
サイクルが回ることで、
グループ全体の競争力が高まって
服部 ジーテックでは、全社員がお客様を向き、素早く行動
います。
する文化を徹底してまいります。営業担当者だけでなく業務
担当者も現場のお役に立てる組織を目指し、価格競争に
埋もれない「頼られる会社」になりたいと考えています。
お客様が困ったときに真っ先に声を掛けてもらえる存在で
あり続けることが目標です。
日進工具株式会社
日進工具株式会社執行役員
執行役員営業部長
株式会社ジーテック 代表取締役社長
宮﨑英輔
服部剛
2003年、当社入社。営業担当として東部エリアを担当し、携帯電話やデジタル
カメラ向け精密金型市場を中心に、大手メーカーとの取引を通じて技術営業の
キャリアを築く。その後、営業リーダーとして、代理店・販売店との関係構築と
戦略的アカウント開発で実績を積み、2025年6月より現職。
2005年、日進工具入社。静岡エリアの営業を担当し、自動車部品メーカー主体
の営業からキャリアをスタート。その後、名古屋営業所に10年間在籍し、精密
金型だけでなく部品加工向けの特殊工具対応を経験。
グループの直販子会社
である株式会社ジーテックに出向後、2025年6月より現職。
宮﨑執行役員に就任し、考えるべき内容が 格段に増え
ました。外部からは「日進工具が思い切った人事をした」と
みられ、責任の重さを痛感しています。2年目となる2027
年3月期は、主要商流との関係強化に注力し、
グループ長、
両組織は競合関係ではなく、完全に補完関係にあります。
営業所長、営業担当者が働きやすい基盤をつくりたいと
日進工具は代理店・販売店との関係強化と既存顧客の
考えています。現場が力を発揮できる環境整備が、私の最
深耕、ジーテックは直接対応が必要な領域と新規情報の
優先課題と捉えています。
市場環境の変化と競合状況を振り返る
宮﨑市場環境に関して言うと、国内の競争相手は従来から
獲得。
この役割分担が明確であればあるほど、
グループ全体
宮﨑入社当時、東部エリアは、
ガラケーやデジカメ向けの
変わらないものの、
コロナ禍前後から一部メーカーの攻勢
の営業力が高まります。お客様にとっても、状況に応じて
精密金型市場が中心でした。大手メーカーの仕事が多く、
が顕著になりました。日進工具の売れ筋製品に対して次々
最適な窓口を選べるメリットがあると確信しています。
日進工具の製品優位性と安定供給体制により、営業活動
と新製品をぶつけてくる頻度が上がり、価格戦略で市場
服部 ジーテックは、ユーザー様に最も近い立場として得た
がしやすい環境でした。市場全体も拡大傾向にあり、小径
シェアを取りにくる姿勢が鮮明で、こちらも対応を急いで
情報を日進工具と素早く共有し、製品開発や営業戦略に
工具の需要は入社時の約2倍に成長しました。特に印象的
います。
活かすための情報ハブとして機能すべきだと考えています。
な変化が、R面取りと言われるフィレットのサイズの微細化
服部競合各社の本気度が変わりました。以前は相当品が
営業の現場で「こういう工具があったら」というユーザー
です。当時はR0.5が 主流でしたが 、現在はR0.1未満が
あっても本腰を入れていなかったとの認識でしたが、明確
様の声を拾い、それを製品化につなげる。その実現に向け
標準となり、技術要求水準が格段に上がっています。
に「この市場を取る」という姿勢で、製品戦略・価格戦略を
ては、かつての日進工具が持っていた、現場の声を素早く
服部私は静岡県を担当し、自動車部品関係に近い領域
展開してきています。特に極小径工具領域では、
かつて日進
製品化する体制の再構築が鍵だと考えています。日進工具
からキャリアをスタートしました。その後、名古屋営業所に
工具の独壇場だった分野にも競合製品が入り込み、標準
の営業部門のみならず、開発部門との連携も密にし、情報
10年間在籍し、金型だけでなく部品加工向けの特殊品対
化が進んでいます。
共有のスピードを上げることで、市場ニーズと製品開発の
タイムラグを最小化したいと考えています。
応も経験しました。名古屋では高硬度鋼の直彫り化という
大きな技術トレンドを目の当たりにしました。従来は焼入
23
執行役員としての1年とこれからの抱負
服部 ジーテックの社長として、
経営の難しさを実感した1年
でした。経営者は、ヒト・モノ・カネをどう動かすか 、その
れ前に加工していた工程が、焼入れ後の被削材を直彫り
日進工具営業部とジーテックの役割
加工する方式に変わり、工具への要求が一変したのです。
服部市場への安定供給を実現するため、日進工具は代理
これからの成長戦略と課題認識
この変化に対応できたことが、日進工具の強みを再認識
店・販売店という商流を選択し、それが成長の基盤となり
宮﨑今後の成長に向けては、
「日進工具に依頼すれば失敗
に注力してまいります。
お客様、
日進工具、
ジーテックを含め
する契機になりました。
ました。他方ジーテックは、
日進工具の既存商流ではカバー
しない」という信頼を再構築することが必須です。その実現
た商流の全てが成長できる仕組みをつくりたいですね。
優先順位と覚悟が問われます。今後は、お客様との接点で
得た情報を日進工具に展開し、三方よしの関係を築くこと
24
事業の現場から
営業部東部グループのご紹介
事業の現場から
香港現地法人のご紹介
東日本を3つの営業所で管轄する営業部東部グループ。今回は東京営業所を除く、仙台と長野営業所の所長に、
日進工具グループの海外売上高のうち、売上規模が最大のエリアである中国市場を管轄する
それぞれの管轄エリアの市場動向や流通網改善に向けた取り組みの状況に加え、今後の展望について聞きました。
日進工具香港有限公司(以下、NSHK)の2名に話を聞きました。
営業部東部グループ
営業部東部グループ
日進工具香港有限公司
日進工具香港有限公司
長野営業所所長
仙台営業所所長
董事副総経理
副総経理
鵜飼雅之
市川芳典
李騰明 (Tommy Li)
胡格 (Gerrad Huge)
2011年中途入社。東京営業所で
営業技術研修後、仙台営業所、
ジーテックを経て、
2021年に長野
営業所に異動。2022年より現職。
2006年に新卒入社後、工場研修
を経て、営業技術、営業、開発に
携わる。ものづくり現場と技術に
精通し、2025年より現職。
切削工具の輸入商社などを経て、
2013年にNSHKに設立と同時
に入社し、事業立ち上げに参画。
2018年より現職。
日本のコネクタメーカーを経て、
2013年に日進工具に入社。海外
営業部にて主に中華圏を担当し
たのち、2020年よりNSHK深圳
代表処 の 責任者として赴任し、
現在に至る。
各営業所の管轄エリアと市場動向
鵜飼代理店・販売店に対する販売目標の情報共有を見直
市川東部グループは、静岡を一部含む関東甲信越から
し、定期的な訪問と報告で数値目標を再認識していただく
NSHKは中華圏の拡販を目的に、日進工具グループ初
深圳代表処は、2015年にNSHKの出張所として開設
東北までの幅広いエリアを管轄し、仙台営業所は東北6県
取り組みを進めています。また、同行PRや製品勉強会の
の海外子会社として設立され、中国本土への製品供給と
され、中国本土のお客様向けの技術サポートを中心に活動
を担当しています。東北エリアは半導体関連工場が集積
回数を増やし、販売店営業担当が当社の製品を理解し、
現地在庫の管理を行っています。私は金型業界や切削工具
しています。人員の増強や2021年の蘇州事務所の開設を
する地域ですが、直近では半導体分野がやや減速傾向に
売りやすい環境づくりに注力しています。地理的に移動
の輸入商社での勤務経験はありましたが、会社の設立に
経て、現在は3名体制となっています。エリアごとに担当を
ある一方、電子部品やコネクタ、スイッチ関連、車載向け
距離が長く、全てのユーザー様を網羅できないため、
メール
携わったことは初めてでした。NSHK本社は私を含め2名
分け、中国のユーザー様を開拓する現地代理店や販売店
部品などは徐々に動き始めており、分野ごとに明確な濃淡
配信も活用しています。
で立ち上げましたが、日進工具の経営陣や海外営業部の
の支援を行い、
また日進工具の工具に関する技術サポート
継続的なサポートもあり、無事運営を安定させることが
を提供しています。
がみられます。市場環境の大きな変化としては、
メーカー
各社において品質保証部門の関与が増加しており、量産
NSHK立ち上げから今日に至るまで
深圳代表処の役割と中国市場での歩み
できました。2025年で設立から13年目を迎え、その間事業
私は2013年に日進工具に入社してから海外営業部で
の拡大に伴い、人員の増強や在庫スペースの拡張を実施
中華圏での営業活動に従事し、2020年から深圳代表処で
市川「最小労力・最大効率」で成果を出す営業スタイルの
してきました。各社員がお互いにサポートをしながら日々
責任者として全体の統括を行っています。NSHK設立から
新製品立ち上げ時や新規案件の初期段階から入り込む
確立を目指してまいります。仕組み化、知識の活用、販売店
の業務を行う体制を構築しており、その間2019年の雨傘
コロナ禍までの間、中国経済とともに工具市場が発展する
営業活動へシフトしてきました。
との役割分担により、効率的に売上を伸ばし、正当に評価
運動や2020年のコロナ禍、2023年のチャイナショック
中で、日進工具の中国事業を大きく伸ばすことができた
鵜飼長野営業所は長野県と新潟県の2県を担当していま
される、また適切な業務時間の中で成果を出せる営業の
など様々な難局がありましたが、全員で乗り切ることができ
のは、
とても貴重な経験でした。
す。両県とも全国の中でも金型生産が盛んなエリアであり、
姿を示すことで、部下の成長意欲を引き出したいと考えて
ました。
工具需要は高く、重要な市場と認識しています。長野県は
います。育成面では、案件ごとの資料活用指導や切削条件
中国市場においても、日進工具の充実した製品バリエー
東北信エリアが金型・部品加工、中南信エリアは諏訪の
を自ら算出させるトレーニングを通じて「考えて提案できる
ションは強みではありますが、半導体や電子部品関連市場
プンでダイナミックな環境が特徴です。昨今は中国系工具
精密加工の流れを受けた部品加工が主流で、外径6mm
営業」を増やしてまいります。
には対応しきれていない多様な製品ニーズがあり、新たな
メーカーの台頭もあり、競争環境が厳しくなっていますが、
以下の精密工具の需要が高いという特徴があります。一方、
鵜飼 2026年3月期は多くの新製品を投入した結果、ユー
製品開発につなげられるチャンスがあると考えています。
日進工具の高い製品力は依然として大きな強みであり、
新潟県は航空機部品や工作機械部品の加工も多く、外径
ザー様から「次は何が出る?」と期待される場面が増えま
さらなるバリエーションの拡大やより高性能な工具を展開
特にボールエンドミルはユーザー様から非常に高い評価
6mm超の工具の需要が高いという特徴があります。
した。興味が高まっているこのタイミングで、ユーザー様の
するためにも、日進工具との連携を強化してまいります。
を得ています。我々はこの巨大市場で、引き続き製品力で
部品における工具切替時の承認プロセスが厳格化してきて
新たな営業スタイルの確立に向けて
います。
これに対応するため、量産途中での切替ではなく、
要望を把握し、売れる製品開発へつなげていくことが営業
流通網改善への取り組み
市川仙台営業所では「自社営業が売る」から「販売店に
中国の工具市場は、数多くの製造会社からの大きな需要
を背景に、世界中のブランドが熾烈な競争を続けるオー
勝負をしてまいります。
の役割だと認識しています。地域ごとのセミナーやユーザー
講習会を通じて課題を解決し、市場ニーズを理解すること
で、当社の成長に貢献してまいります。
売ってもらう」スタイルへの転換を推進しています。広域な
東北エリアでは自社営業だけではカバレッジに限界がある
ため、販売店への定期訪問や短期目標の共有、各種キャン
ペーンなど、販売店が能動的に当社の工具をユーザー様
に提案したくなる仕組みづくりに取り組んでいます。
25
NSHK本社の社員の皆さん
深圳代表処の社員の皆さん
26
事業の現場から
ユーザー様の声
後藤当社では、
「在庫を切らさない」ことを徹底していま
ともに、世界19拠点に自社営業網を展開しました。そして
す。約200型番、1万サイズを常時在庫し、全国どこへでも
2013年、
グローバルNo.1を実現することができました。
翌日配送が可能な体制を構築しています。ユーザー様の
後藤工場を拝見して、ベアリングを内製されていることに
ものづくりが止まってしまっては意味がないと考えるから
驚きました。ベアリングは御社製品の心臓部ですよね。
です。ところで、現在御社には当社の標準品を多く使って
中西 10年ほど前から専用機を開発して内製化に着手しま
いただいていますが、今後に向けて、新素材対応など、
ご要
した。ベアリングでスピンドルの形状がほぼ決まってしまう
望をお聞かせいただけますか?
ため、自社で設計できることは大きなアドバンテージです。
中西直近の事例で言うと、医療市場向けのステンレス用
特に歯科用途では「いかに小さくするか」が重要で、設計の
工具がありますね。
すでに対応していただいており、
とても
自由度が格段に向上しました。先代の決断で、社外からベア
助かっています。医療用途の需要は今後も伸長する見込み
リング研磨機の技術者を招聘しました。ベアリングはノウ
ですので、継続的な対応をお願いしたいです。そして何より
ハウの塊ですから、専門家なしでの内製化は不可能でした。
も重要なのは、
「QCD(品質、
コスト、納期)」です。中国メー
グローバルニッチトップメーカーに聞く、
日本のものづくりの未来
超高速回転技術をコア技術とし、歯科用ハンドピースで世界シェアNo.1を誇る株式会社ナカニシ(東証スタンダード 7716)。
当社と20年以上にわたるパートナーシップを築く同社の、
グローバルニッチトップ企業に向けた戦略的取り組みや日本の
ものづくり企業が世界で勝ち続けるための条件などついて、当社社長の後藤弘治が中西英一社長に伺いました。
カーの価格競争は厳しさを増しています。
より良い工具を
より安く提供していただくことが 、当社の競争力維持に
日本のものづくりが世界で勝つために
不可欠です。
中西大切なポイントが3点あると思います。第一に「自社
後藤 コストという点では、当社は長寿命化に継続的に取り
の強みを研ぎ澄ますこと」です。日本のものづくりの強さは
組んでいます。例えば2枚刃を4枚刃にするだけで、加工
「こだわり」にあります。競合が追いつけないレベルまで
速度は2倍、寿命も2倍になります。0.1mm径でも4枚刃
技術を研ぎ澄ますことが重要です。当社も歯科用ハンド
仕様を展開していますので、ぜひご活用ください。当社は
ピースという一点に特化し、世界No.1の地位を築きました。
10年以上前に0.01mm径の工具を発表したわけですが、
第二に「お客様への寄り添い」です。日本企業の「おもて
最近になってようやく、0.05mm、0.03mm径の工具を
なし精神」、"closer to the customer"の姿勢は、
海外メー
ユーザー様に使っていただけるようになりました。
カーとの大きな差別化要因です。当社の海外営業スタッフ
も、競合よりはるかに顧客に寄り添う姿勢を徹底しており、
最高の加工が実現します。技術面でも、経営トップ同士の
これが高いリピート率につながっています。
関係でも、非常にユニークで親和性の高いパートナーシップ
そして第三に「最新技術の積極活用」です。当社も積極的
だと感じています。
特にここ数年で、当社製品の生産工程で使用する切削
開発では、従来3ヶ月かかっていた作業が1時間で完了する
工具はほぼ 御社製品に統一されました。採用理由は明
ケースも出てきました。
こうした効率化を早期に普及させる
社長執行役員
確です。第一に「製品ラインナップの豊富さ」が挙げられ
ことが競争力の鍵です。
中西英一氏
ます。当社がメインで使用する1~5mm径のエンドミルが
株式会社ナカニシ
代表取締役
0.05mm刻みで揃っています。第二に「コーティング技術」
最後に、技術面でも、カルチャー面でも非常に似ている
御社は、
お互いに切磋琢磨できる理想的なパートナーです。
です。当社が多用するステンレスやチタンの切削に最適な
グローバルNo.1に向けた挑戦
コーティングがなされています。第三に「価格の妥当性と
後藤本日改めて御社のものづくり現場を拝見しました。
ですね。
対応力」。
「ねじ」加工を行うための特注のスレッドミルも
一言で言うと、
とんでもなくすごい会社だなと感じます。
後藤現在当社は、新製品開発を加速しています。
「失敗を
柔軟に製作していただきました。
そして最後に「デリバリー」
中西私こそ、御社の仙台工場を訪問するたびに刺激を
恐れず、
まず市場に出す」方針に転換し、年間10製品以上
です。在庫切れがなく、必要な時に必ず入手できる体制は
受けます。御社の「石川塾」制度も、工場でお話を伺って
の投入を目指しています。経営トップとして私自身が一切
御社の大きな強みだと認識しています。
良い仕組みと感じたので、すぐに当社でも導入しました。
のリスクを取る一方、現場のスタッフには大いにチャレンジ
私が社長に就任した2000年当時、当社は歯科用ハンド
してほしいと促しています。
このように、ニッチトップなもの
後藤御社には20年以上の長きにわたりお付き合いをいた
ピースでグローバル第5位で、上位4社はドイツ、スイス、
づくり企業としてのチャレンジを一層進めてまいります。
だき、本当に感謝しています。
お互い前社長の時代に、御社
オーストリアの老舗メーカーでした。そこで、
「Nakanishi
最後に、御社はお取引先を超えた、技術的にも戦略的
のスピンドル製品と当社の工具を一緒に販売しようという
Reborn Plan」を策定し、
グローバルNo.1になるという目
にも相互補完できる重要なパートナーです。御社の微細化
協業に取り組んだことから、お付き合いが始まりました。
標を掲げ、大きく5つの変革を実行してきました。すなわ
ニーズに当社の超微細工具技術が応え、御社の高速回転
1990年に株式会社ナカニシに入社、2000年に代表取締役社長に就任。社長
就任後すぐに「Nakanishi Reborn Plan」を策定してグローバルマーケットに
照準を合わせ、成長戦略・ブランディングを展開。2013年には歯科用ハンド
ピースで世界シェアNo.1へと成長させた。2017年に新本社R&Dセンター
「RD1」を竣工。卓越した「回転技術」を核に、歯科医療機器のみならず、外科
医療機器や産業用スピンドル分野への展開や、徹底した内製化を推進する経営
手腕で、
グローバルな精密機器メーカーとしての地位を確立。
日進工具との長年のパートナーシップ
今後とも、両社でより良い製品を世界に送り出していきたい
中西人的なつながりは約25年前に遡ります。御社の小径
日進工具株式会社
ち、製品力の強化、販売力の強化、アフターサービス体制
技術が当社工具の性能を最大限に引き出す。
今後も、
お互い
エンドミルを本格採用したのが約20年前です。当社は回転
代表取締役社長
の構築、生産力・品質力の向上、そしてブランド力の向上で
の強みを活かしながら、
ともに挑戦し続けてまいりましょう。
す。家電業界の総崩れ期に優秀な技術者を大量採用すると
本日は貴重なお時間をありがとうございました。
させる側、御社は先端工具をつくる側。両輪が揃って初めて
27
にAIを活用し、開発スピードが劇的に向上しています。製品
後藤弘治
28
財務・非財務ハイライト(日進工具株式会社及び連結子会社)
(単位:百万円)
17年3月期
18年3月期
19年3月期
20年3月期
21年3月期
22年3月期
23年3月期
24年3月期
25年3月期
26年3月期
25/26増減率
8,825
9,767
10,476
9,531
8,100
9,524
9,656
9,040
9,431
9,494
0.7%
損益状況(会計年度)
売上高
製品別 エンドミル(6mm以下)
6,377
7,390
7,832
7,310
6,338
7,449
7,483
7,153
7,539
7,635
1.3%
エンドミル(6mm超)
1,033
1,095
1,152
945
739
909
891
785
798
799
0.1%
エンドミル(その他)
788
577
697
614
478
488
536
438
430
365
-15.2%
その他製品
626
704
793
660
543
677
744
662
662
694
4.8%
小径比率
72.3%
75.7%
74.8%
76.7%
78.3%
78.2%
77.5%
79.1%
79.9%
80.4%
—
2,167
2,553
2,898
2,916
2,495
2,954
3,112
2,716
3,143
3,283
4.4%
24.6%
26.1%
27.7%
30.6%
30.8%
31.0%
32.2%
30.1%
33.3%
34.6%
—
売上総利益
4,823
5,528
5,929
5,224
4,137
4,891
5,115
4,942
4,983
5,261
5.6%
販売費及び一般管理費
2,810
2,833
3,049
3,005
2,624
2,780
3,007
3,075
3,215
3,301
2.7%
営業利益
2,013
2,695
2,879
2,219
1,512
2,111
2,108
1,867
1,767
1,959
10.9%
経常利益
2,026
2,733
2,894
2,231
1,712
2,156
2,131
1,908
1,779
2,011
13.0%
親会社株主に帰属する当期純利益
1,420
1,903
1,970
1,545
1,214
1,522
1,475
1,320
1,264
1,442
14.0%
営業活動によるキャッシュ・フロー
1,894
2,910
1,868
1,908
2,526
2,261
1,614
1,834
2,011
2,138
6.3%
投資活動によるキャッシュ・フロー
-787
-657
-1,383
-1,769
-187
-348
-1,137
-575
-392
-380
-3.2%
フリー・キャッシュ・フロー
1,107
2,252
485
138
2,338
1,912
477
1,259
1,618
1,758
8.6%
財務活動によるキャッシュ・フロー
-499
-562
-563
-562
-438
-763
-560
-883
-684
-2,055
200.4%
海外売上高
※1
海外売上高比率
キャッシュ・フロー状況(会計年度)
財政状況(会計年度末)
総資産
12,517
14,467
15,381
16,017
16,936
17,874
18,857
19,241
19,941
19,595
-1.7%
現金及び預金
4,659
6,325
6,209
5,784
7,674
8,543
8,497
8,893
9,868
9,567
-3.0%
棚卸資産
1,592
1,745
2,056
2,201
1,758
1,840
2,320
2,381
2,308
2,350
1.8%
10,652
11,993
13,400
14,383
15,162
15,944
16,929
17,441
18,086
17,520
-3.1%
親会社株主に帰属する当期純利益(円)
56.81
76.12
78.80
61.81
48.55
60.89
59.16
53.03
50.80
58.38
14.9%
純資産額(円)
426.55
479.94
535.74
574.81
605.44
640.58
680.51
705.25
731.24
751.94
2.8%
配当金額(円)
20.00
22.50
22.50
22.50
17.50
22.50
22.50
27.50
30.00
30.00
—
配当性向
35.2%
29.6%
28.6%
36.4%
36.0%
37.0%
38.0%
51.9%
59.1%
51.4%
—
54.7%
56.6%
56.6%
54.8%
51.1%
51.4%
53.0%
54.7%
52.8%
55.4%
—
23.0%
28.0%
27.6%
23.4%
21.1%
22.6%
22.1%
21.1%
18.9%
21.2%
—
株主資本
1株当たり情報
※2
財務データ
売上高総利益率
売上高経常利益率
1人当たり付加価値額 (千円)
※3
15,705
17,299
18,004
16,329
14,033
15,878
16,065
15,433
15,139
15,709
3.8%
総資産当期純利益率(ROA)
11.9%
14.1%
13.2%
9.8%
7.4%
8.7%
8.0%
6.9%
6.5%
7.3%
—
自己資本当期純利益率(ROE)
14.0%
16.8%
15.5%
11.1%
8.2%
9.8%
9.0%
7.7%
7.1%
8.0%
—
自己資本比率
85.2%
83.0%
87.1%
89.7%
89.4%
89.2%
90.1%
91.1%
91.4%
90.1%
—
研究開発費
366
330
296
364
388
428
422
409
427
455
6.5%
設備投資額
774
663
1,268
1,755
462
659
686
563
111
486
337.6%
減価償却費
632
625
629
698
707
692
669
627
644
605
-6.1%
従業員数
322
338
343
338
339
348
352
350
358
364
1.7%
取締役数
9
8
7
8
9
9
9
10
10
10
—
独立取締役比率
33.3%
37.5%
28.6%
37.5%
33.3%
33.3%
33.3%
40.0%
40.0%
50.0%
—
社外取締役比率
33.3%
37.5%
28.6%
37.5%
33.3%
33.3%
33.3%
40.0%
40.0%
50.0%
—
女性取締役比率
22.2%
25.0%
28.6%
25.0%
22.2%
22.2%
22.2%
30.0%
30.0%
30.0%
—
非財務データ
※1 海外売上高には国内の輸出商社経由分も含んでおります。
※2 2021年4月1日付で実施した株式分割(1:2)の影響を考慮しております。
※3 1人当たり付加価値額=(営業利益+人件費(労務費含む)+減価償却費)/従業員数
29
30
財政状態及び経営成績の分析
した。自動車関連は、米国関税問題の影響を受け、上期は
2.7%増の3,301百万円となりました。
により同564百万円減の17,851百万円となりました。
低調となりましたが 、下期にかけHV車を中心に回復が
この結果、2026年3月期の業績は、売上高の増加及び
キャッシュ・フローにつきましては、営業活動によるキャッ
みられました。海外では、中華圏(中国、香港、台湾)を含む
売上原価の減少により、営業利益は前期比10.9%増の
シュ・フローは、税金等調整前当期純利益2,014百万円に
アジアを中心に自動車や光学、
データセンター関連向けが
1,959百万円、経常利益は同13.0%増の2,011百万円、
減価償却費や法人税等支払等による資金増減を反映して
取締役経営企画室長
好調に推移しました。
この結果、超硬エンドミル市場が縮小
親会社株主に帰属する当期純利益は同14.0%増の1,442
+2,138百万円(前期比6.3%増)
となりました。投資活動
兼財務経理部長
する事業環境下においても、2026年3月期の連結売上高
百万円となりました。なお、KPIとして売上高経常利益率
によるキャッシュ・フローは、固定資産の取得による支出を
は、前期比0.7%増の9,494百万円となりました。
20%を目標としておりますが、2026年3月期の売上高経
反映して–380百万円(同3.2%減)となり、財務活動に
製品区分別の売上高では、
「エンドミル(6mm以下)」が
常利益率は前期比2.3ポイント増の21.2%となりました。
よるキャッシュ・フローは、自己株式の取得及び配当金の
前期比1.3%増の7,635百万円となり、小径(刃径6mm
中華圏を含むアジア地域向けの販売が好調に推移したこ
支払により–2,055百万円(同200.4%増)
となりました。
以下)比率は同0.5ポイント上昇し80.4%と、過去最高の
とから売上が増加し、さらに原材料費や労務費は増加し
これらの結果と換算差異により、連結ベースでの現金及び
比率となりました。
たものの原価低減により製造原価が抑えられたことから
現金同等物は、前期末より300百万円減少し9,467百万円
地域別では、国内売上高が自動車関連の需要低迷が影
売上高経常利益率が上昇しました。もう一つの目標である
となりました。
▶2
� 026年3月期連結決算概要につきましては、P11-14
響し、前期比1.2%減の6,210百万円となりました。海外
ROE10%につきましては、2026年3月期は増益に加え、
「トップメッセージ」をご参照ください。
は中華圏やタイ、
インド、ベトナムなどのアジア地域が好調
資本効率改善のため総額13億円超の自己株式の取得を
だったことにより、海外売上高全体では同4.4%増加して
実施した結果、ROEは8.0%となり、目標を下回ったもの
2026年3月期の景況感は全体として緩やかな回復基調
3,283百万円となり、この結果、海外売上高比率は同1.3
の前期比0.9ポイントの改善となりました。持続的成長と
で推移しました。国内の超硬工具市場の2025年(暦年)
ポイント上昇し34.6%となりました。販売面では、積極的
収益力の強化に向け諸施策を推進してまいります。
生産実績も前年実績を若干上回りましたが、当社グループ
な新製品の投入施策を推進しました。また、生産面では、
配慮し、業績動向や配当性向等を総合的に勘案したうえで、
の主要製品である超硬エンドミルの市場はこの数年縮小
売上増加に伴う増産による量産効果に加えて、小集団改善
中期的な事業遂行に必要な手元流動性を維持することを
が続いております。特に2025年の国内生産実績は国内
活動(オレンジFC活動)を中心とした取り組みにより、原
金型需要の低迷を背景に前年を大きく下回りました。
価低減を実現しました。
この結果、2026年3月期における
2026年3月期末における財政状態につきましては、主
2026年3月期の1株当たり配当につきましては、中間
当社グループの事業では、国内の主要需要先のうちAI
売上総利益は前期比5.6%増の5,261百万円となり、売
に自己株式の取得による現預金の減少により、資産合計
配当金15.0円、期末配当金15.0円、合計30.0円とさせて
やデータセンター分野の活況により、半導体関連では製造
上総利益率は同2.6ポイント上昇し55.4%となりました。
は前期末比346百万円減の19,595百万円となりました。
いただきました。2027年3月期の配当予想につきまして
装置から検査工程に至るまで幅広く需要が活発になり、
経費の面では、主に広告宣伝費と展示会費が減少した一
また、負債合計は未払法人税等の増加等により同217百
は、現時点では未定であり、通期業績予想と同時に公表する
電子部品・デバイス関連についても概ね堅調に推移しま
方で、賃上げによる人件費上昇等により、販管費は前期比
万円増の1,743百万円、純資産合計は自己株式の取得等
予定です。
超硬工具と超硬エンドミル生産金額推移(暦年)
売上高の推移(国内・海外)
連結営業利益の増減分析
1株当たり配当金と配当性向の推移
日進工具株式会社
戸田覚
2026年3月期連結業績レビュー
超硬工具
国内売上高
超硬エンドミル
海外売上高
エンドミル比率
( )売上比率:%
(億円)
2026年3月期財政状態等
17.6%
17.8%
(百万円)
3,053
2,917
2,799
1株当たり期末配当金
1株当たり記念配当金(中間配当)
配当性向
215
9,656
9,524
3,112
(32.2)
3,143
(33.3)
3,283
(34.6)
51.9%
1,767
76
国内売上
減少
販管費
増加
売上原価
減少
37.0%
38.0%
海外売上
増加
12.5
12.5
6,570
(69.0)
509
2021年
537
2022年
520
2023年
518
2024年
6,544
(67.8)
6,323
(69.9)
6,287
(66.7)
6,210
(65.4)
2023年
3月期
2024年
3月期
2025年
3月期
2026年
3月期
15.0
(未定)
2.5
(前年同期比10.9%増)
10.0
2022年
3月期
15.0
12.5
192 百万円増益
469
2025年
51.4% (未定)
1,959
139
2,716
(30.1)
59.1%
(円)
85
9,494
9,431
9,040
2,954
(31.0)
2,958
2,910
配当につきましては安定性・継続性に加え資本効率にも
1株当たり中間配当金
17.8%
15.9%
株主の皆様に対する利益還元は重要な経営課題であり、
前提に、成長に応じた分配を行ってまいります。
(百万円)
18.2%
株主還元施策について
営業利益
2025年3月期
営業利益
2026年3月期
2022年
3月期
10.0
2023年
3月期
12.5
2024年
3月期
15.0
2025年
3月期
15.0
2026年
3月期
2027年
3月期
(予定)
出所:経済産業省生産動態統計
31
32
コーポレート・ガバナンス(2026年3月31日現在)
役員紹介
取締役
代表取締役社長
後藤弘治
代表取締役副社長
後藤隆司
常務取締役
足立有子
取締役
戸田覚
社外取締役
斉藤貴宣
1986年 4月
1988年 10月
1992年 4月
1995年 1月
2011年 4月
2013年 1月
2013年 4月
2016年 10月
2021年 4月
2021年 11月
当社入社
取締役総括グループ次長
常務取締役
専務取締役営業統括
代表取締役副社長営業統括
日進工具香港有限公司董事長(現任)
当社代表取締役社長
当社代表取締役社長営業担当(現任)
株式会社ジーテック 代表取締役(現任)
NS TOOL USA, INC. President/CEO(現任)
1984年 4月
1988年 10月
2002年 1月
2009年 4月
2010年 4月
2011年 4月
2013年 4月
2016年 4月
2016年 10月
2021年 1月
2024年 4月
当社入社
取締役生産本部次長
常務取締役生産・開発統括
株式会社日進エンジニアリング 代表取締役社長
株式会社ジーテック 代表取締役社長
当社専務取締役生産・開発統括
当社代表取締役副社長
株式会社日進エンジニアリング 代表取締役(現任)
当社代表取締役副社長生産・開発担当(現任)
株式会社牧野工業代表取締役社長
株式会社牧野工業代表取締役(現任)
1978年 4月
1985年 4月
2001年 9月
2002年 2月
2003年 6月
2005年 4月
2015年 11月
2016年 10月
2017年 4月
2020年 9月
2021年 1月
AIU保険会社入社
当社入社
取締役総務部長
取締役総務部長株式会社ジーテック 代表取締役社長
当社取締役株式会社ジーテック 代表取締役社長
当社常務取締役(情報統括責任者)
株式会社牧野工業代表取締役社長
当社常務取締役総務・管理担当(情報統括責任者) (現任)
株式会社牧野工業代表取締役会長
株式会社牧野工業代表取締役会長兼社長
株式会社牧野工業代表取締役会長(現任)
取締役
(監査等委員)
田島寛
社外取締役
(監査等委員)
藤崎直子
社外取締役
(監査等委員)
平賀敏秋
1984年 4月株式会社東海銀行(現株式会社三菱UFJ銀行)入行
2006年 10月同横浜支社法人営業第一部長
2009年 10月 �三菱UFJ証券株式会社
(現三菱UFJモルガン・スタンレー証券株式会社)出向
2010年 4月税理士登録(千葉県税理士会)
2014年 6月三菱UFJモルガン・スタンレー証券株式会社事業法人第五部長
2020年 4月当社入社
2020年 6月取締役社長室長
2021年 2月取締役管理部長
2021年 7月取締役経営企画室長兼財務経理部長(現任)
社外取締役
(監査等委員)
笹本憲一
1982年 4月三菱金属株式会社(現三菱マテリアル株式会社)入社
1988年 4月 MMC Hartmetall GmbH出向
2004年 6月三菱マテリアル株式会社超硬製品事業部 マーケティング部
2013年 4月 �MMC Hardmetal (Thailand) Co.,LTD.出向
同 テクニカルセンター長
2015年 11月 �三菱マテリアル株式会社開発本部加工技術センター
副センター長
2021年 4月 �三菱マテリアル株式会社戦略本部 マーケティング部
製品戦略室室長
2025年 6月当社社外取締役(現任)
社外取締役
(監査等委員)
中野秀代
1985年 4月 �ユニバーサル証券株式会社
(現三菱UFJモルガン・スタンレー証券株式会社)入社
2005年 3月当社入社経営企画室長
2010年 4月管理部長
2010年 6月取締役管理部長
2012年 6月執行役員管理部長
2018年 4月執行役員経営企画室長
2021年 6月取締役(常勤監査等委員)
(現任)
1968年 4月
1977年 10月
2000年 12月
2004年 12月
2007年 10月
2009年 12月
2010年 10月
2016年 6月
株式会社住友銀行(現株式会社三井住友銀行)入行
株式会社日本マイクロニクス入社
同社取締役経理部長
同社常務取締役管理本部経理部長
同社常務取締役管理本部長
同社専務取締役管理本部長
同社専務取締役企画管理本部長
当社社外取締役(監査等委員)
(現任)
1999年 4月弁護士登録(東京弁護士会)
2007年 10月北村・平賀法律事務所設立 パートナー(現任)
2009年 3月株式会社MS&Consulting 社外監査役
2014年 4月 ポラリス・キャピタル・グループ株式会社社外取締役
2016年 6月当社社外取締役(監査等委員)
(現任)
2016年 6月 �ヒューマン・アソシエイツ・ホールディングス株式会社
(現 MBK Wellness Holdings株式会社)社外監査役
2019年 6月同社社外取締役(監査等委員)
2022年 4月 リグロース・キャピタル・マネジメント株式会社監査役(現任)
2022年 6月 ポラリス・キャピタル・グループ株式会社監査役(現任)
1980年 6月
1998年 9月
2007年 7月
2010年 6月
2014年 9月
2016年 9月
2016年 10月
2018年 6月
2019年 6月
2019年 6月
2020年 9月
監査法人中央会計事務所入所
同監査法人代表社員
監査法人A&Aパートナーズ 代表社員
株式会社東葛ホールディングス 社外監査役
日本社宅サービス株式会社(現 サンネクスタグループ株式会社)社外監査役
監査法人A&Aパートナーズ退所
公認会計士笹本憲一事務所開設同事務所代表(現任)
株式会社東葛ホールディングス 社外監査役
当社社外取締役(監査等委員)
(現任)
株式会社東葛ホールディングス 社外取締役(監査等委員)
サンネクスタグループ株式会社社外取締役(監査等委員)
(現任)
1991年 11月
1993年 10月
2000年 1月
2004年 3月
2020年 3月
2021年 6月
2022年 6月
2023年 6月
2026年 3月
シティトラスト信託銀行株式会社 ヴァイスプレジデント
同社シニアポートフォリオマネージャー兼個人運用部ヘッド
ファンネックス・アセット・マネジメント株式会社取締役運用部長
株式会社トリアス設立代表取締役社長(現任)
株式会社アウトソーシング 社外取締役
ホーチキ株式会社社外取締役(現任)
第一工業製薬株式会社社外取締役(現任)
当社社外取締役(監査等委員)
(現任)
JUKI株式会社社外取締役(現任)
執行役員
33
上席執行役員仙台工場長
上席執行役員総務部長
執行役員生産担当
執行役員営業部長
執行役員営業担当
岡田浩一
小林雅人
後藤勇二
宮﨑英輔
服部剛
34
コーポレート・ガバナンス
監査等委員会設置会社
コーポレート・ガバナンスの体制
当社は、経営の効率性、透明性を向上させ、株主をはじめとしたステークホルダーの立場に立って継続的、
安定的に企業価値を高めることをコーポレート・ガバナンスの基本的指針としております。
詳細は、当社Webサイト「コーポレート・ガバナンス」をご参照ください。
監査等委員会は5名(常勤監査等委員1名、非常勤監査
が 、各統制プロセスの整備状況及び 運用状況の評価を
等委員4名、
うち社外取締役4名)
で構成され、経営上の意思
実施するとともに、適時に監査法人との調整を行い、改善
決定及び執行に関しての監視を行っております。監査等
すべき点については改善を図っております。
委員は取締役会等重要な会議に出席し必要な意見を述べる
ほか、監査等委員のうち1名が常勤となり、決裁された稟議
書、帳票及び契約書等を検閲し各部門長等へヒアリングを
体制図(2026年3月31日現在)
株主総会
報告
報告
牽制(選任・解任)
報告
会計監査人
(監査法人)
監査
取締役
監査等委員会
連携
( 監査等委員を除く)
独立社外取締役会議
報告
報告
報告・付議
報告・付議
報告
諮問
指名・報酬委員会
(任意の諮問機関)
内部監査室
連携
選定・解職・監督
社長
報告
監査
強化し、監査の実効性確保に努めております。
社外取締役に期待される役割としては、自らは業務執行
提言・報告
ガバナンス体制の現状
当社における意思決定及び業務執行のプロセスは次の
答申
連携
当社の社外取締役は5名であります。
を行わず客観的に他の取締役の業務執行状況をチェック
提言
取締役会
社外取締役
実施するとともに、内部監査部門と会計監査人との連携を
牽制(選任・解任)
牽制(選任・解任)
監査
対応としては、常務取締役を委員長とする内部統制委員会
通りです。
することであります。社外取締役の選任については、会社
経営に高い見識を持ち、あるいは、監査機能発揮に必要な
専門分野における高い実績を有し、会社との関係、代表
重要な経営課題等は、取締役会に諮られます。なお、取締
取締役その他の取締役、執行役員及び主要な使用人との
役会の議案については、可能な限り資料の事前提供を実施
関係等を勘案して、独立性に問題がなく、取締役会及び
する等、業務執行の適正性や効率性の向上に努めており
監査等委員会等への出席が可能である候補者から決定
ます。取締役会の実効性評価も定期的に実施し、運営内容
いたします。
また、当社は独立役員の資格を満たす社外役員
の改善に努めております。取締役会に諮られた議案は、
を全て独立役員として指定しております。
十分な審議を尽くし、必要な場合には条件を付す等修正を
行い承認又は否決されます。なお、取締役(監査等委員で
報告
し、取締役会を通じて業務執行が適切に行われるように
なお、全ての独立社外取締役から構成される独立社外取
締役会議を設置しております。
ある取締役を除く)の候補者案と報酬案については、指名・
内部監査
部門長会議
内部統制委員会
(分科会:サステナビリティ委員会)
(リスク管理)
指示・評価
顧問弁護士
評価・指導
助言
総務部門
財務経理部門
生産部門
コンプライアンス
担当取締役
各担当取締役
コンプライアンス推進
開発部門
指示・統率
営業部門
体制の一覧表(2026年3月31日現在)
35
機関設計の形態
監査等委員会設置会社
監査等委員でない取締役人数(うち社外取締役)
5名(1名)
監査等委員である取締役人数(うち独立社外取締役)
5名(4名)
取締役の任期
1年(監査等委員は2年)
取締役へのインセンティブ付与
譲渡制限付株式報酬制度(監査等委員は除く)、
業績連動賞与(監査等委員は除く)、役員持株会制度
業務執行体制
執行役員制度(現在5名)
任意の委員会の設置状況
指名・報酬委員会(社外取締役3名、社内取締役1名の4名で構成)
会計監査人
そうせい監査法人
報酬委員会へ諮問し、同委員会からの答申を受けたうえで
選任理由
決議いたします。
藤崎直子氏は、上場会社の取締役としての幅広い見識と
承認された議案については、各業務を担当する部門の長
豊富な経験を有しているほか、財務及び会計に関する相当
が業務執行の責任を負い、取締役会において担当業務の
程度の知見を有しております。
執行状況についての報告を行います。
なお、社内にサステナ
平賀敏秋氏は、弁護士としての高度な専門的知識及び経験
ビリティ委員会を設置し、気候変動や人的資本の問題を
に加え、他社の社外取締役としての実績を有しております。
含む自社のサステナビリティ
(社会と共存しつつ持続的
笹本憲一氏は 、公認会計士としての 高度な専門的知識
成長を目指すこと)について、定期的に取締役会に報告、
及び経験に加え、他社の社外取締役としての実績を有して
議案提出を行うこととしております。
おります。
取締役は各部門の長からの報告を受け、業務執行状況に
中野秀代氏は、資産運用会社での投資判断やIR・PR支援
ついての監督を実施しております。なお、取締役会は通常
会社での経営助言に関する豊富な経験に加え、他社の社外
1ヶ月に1回開催されますが、必要な場合には臨時に開催
取締役としての実績を有しております。
されます。
斉藤貴宣氏は、長年に亘る切削工具分野における製品開
発、技術サポート及びマーケティングに従事し、高度な専門
内部統制システム・リスク管理体制の
整備の状況
的知見・国際経験を有しております。
5氏の経験・知見等に基づき、当社の業務執行に関する
当社では内部統制システム・リスク管理体制の構築に
意思決定において、妥当性及び適法性の見地から適切な
当たり、統制及び管理が機能する組織の構築を行うととも
助言・提言をいただくことで、当社の経営体制をさらに強化
に、稟議制度の実施、社内規程等ルールに基づいた業務
できると判断したことから、5氏を社外取締役に選任いたし
運営の遂行を実践しております。また、業務執行から独立
ました。
また、5氏は当社の主要株主、主要な取引先の業務
した内部監査室が、国内外の子会社を含めた全部署に対し
執行者の出身ではなく、当社が定める独立役員の独立性
内部監査を実施し、社長及び取締役会・監査等委員会に
判断基準を満たしていることから、独立役員として適格で
報告・答申等を行っております。内部統制報告制度への
あると判断しております。
36
コーポレート・ガバナンス
マテリアリティKPIの進捗達成状況
取締役の専門性と経験
当社グループのサステナビリティ戦略はISO規格(品質
特に経験を有する分野・専門性を期待する分野
取締役氏名
監査等委員
後藤弘治
指名・報酬
委員会
●
経営全般
営業
マーケティング
開発・生産
テクノロジー
●
●
●
後藤隆司
●
●
●
足立有子
●
●
戸田覚
国際性
財務・経理
斉藤貴宣
●
●
藤崎直子
●
●
●
●
●
●
●
笹本憲一
●
●
●
中野秀代
●
●
●
●
●
●
●
及び環境マネジメントシステム)の活動と連動し、各部門
●
達成状況は以下の通りであります。
不可欠な要素として選定した6つの「マテリアリティ」の
※ �KPI=Key Performance Indicator:スケジュール化、数値化された
重要な事業目標
各項目と関連付けることで、
「マテリアリティKPI ※」として
マテリアリティ
●
●
●
●
●
●
●
●
●
●
●
2 人権の尊重
3 地域・社会への貢献
4 従業員の働きがい
5 �取引先との
パートナーシップ
役員報酬等(2026年3月期)
当社の取締役(監査等委員である取締役を除く)の報酬
業績連動報酬については、短期的インセンティブとして、
は、企業価値の持続的な向上を図るインセンティブとして
期末における連結営業利益見込額に、係数を乗じて計算
十分に機能するよう株主利益と連動した報酬体系とし、
された総額につき、指名・報酬委員会において個人別貢献
個々の取締役の報酬の決定に際しては各職責を踏まえた
度を勘案した支給案を策定したうえで、取締役会に諮られ
適正な水準とすることを基本方針としております。
決議しております。譲渡制限付株式報酬については、中長期
取締役(監査等委員である取締役を除く)及び執行役員
2026年3月期における主要な「マテリアリティKPI」と
のISO活動目標を、自社の持続的成長と社会との共存に
1 環境問題への対応
●
●
●
具体的な目標に落とし込んで策定しております。
●
●
平賀敏秋
法務・組織
ESG
コンプライアンス サステナビリティ
●
●
田島寛
サステナビリティ
ESGトピックス
的インセンティブとして、退任までの譲渡制限を付した当社
6 災害等の危機管理
テーマを推進する主たる部門
マテリアリティKPI
開発
生産
販売
○
1
高機能製品の開発/製造/販売によるユーザーの環境負荷軽減
○
△
2
生産効率・業務効率改善による自社CO2排出量削減
○
○
3
1本当たりの生産に使用する電力の削減
4
自社CO2排出量の迅速かつ正確な把握
1
原材料であるタングステン、
コバルトのトレーサビリティ確保
○
1
仙台地域における献血、清掃、交通安全等のボランティア活動への
参加、地域スポーツの支援
○
2 「しながわ子ども食堂」へ東北地方の食材を寄付する活動を継続
○
1
従業員育成制度の充実
2
従業員研修制度の充実
管理
子会社
◎
○
○
△
○
○
○
○
○
○
○
○
○
○
○
3 「くるみん」取得のための活動
○
○
○
○
○
4
社内勉強会の充実
1
国内販売パートナー企業との連携強化
○
2
海外販売パートナー企業との連携強化
◎
1
工程内製化による自社生産体制の強化
2
新潟工場での生産強化による地域分散の推進
△
○
◎ 計画を上回る進捗
○
○ ほぼ計画通り進捗
△ 計画を下回る進捗
気候変動に関する指標
当社グループではGHGプロトコルスタンダードに基づ
2025年3月期の温室効果ガス総排出量は2024年3月
いて、スコープ1・2・3の温室効果ガス排出量を算定して
期に 比 べ 設備投資額が 増加したことから1 2 , 8 2 0トン
連動報酬等(金銭報酬)及び株式報酬等(非金銭報酬)に
おります。2026年3月期の当社グループ全体でのスコープ
と、2024年3月期対比805トン増加しております。当社
より構成しております。
1・2合計排出量は、生産量の増加に伴い 電力を中心と
グループでは従前より電力使用量の削減目標を設定して
監査等委員である取締役の報酬は、客観的かつ独立した
した消費エネルギー量が増加したため、前期比184トン
省エネに取り組んでおり、スコープ1・2の排出量削減に
立場から取締役(監査等委員である取締役を除く)の職務
増加し、4,191トンとなりました。
またスコープ3を含めた
継続的に取り組んでまいります。
の報酬は、固定報酬としての基本報酬(金銭報酬)、業績
株式を割り当てております。
の執行を監査するというその役割を考慮し、固定報酬として
スコープ3
の基本報酬(金銭報酬)のみを支払うこととしております。
川上工程
役員報酬(2026年3月期)
役員区分
取締役(監査等委員を除く)
(うち社外取締役)
取締役(監査等委員)
(うち社外取締役)
報酬等の総額
(百万円)
報酬等の種類別の総額(百万円)
固定報酬
業績連動報酬等
役員退職慰労金
対象となる
役員の員数(名)
287
(10)
171
(6)
87
(1)
-
(-)
28
(3)
5
(1)
63
(36)
60
(36)
-
(-)
2
(-)
-
(-)
6
(4)
(注)
�1.
上記表には、2025年6月24日開催の第64回定時株主総会終結の時をもって退任した取締役
(監査等委員)
1名を含んでおります。
2.
取締役の報酬等の総額には、使用人兼務取締役の使用人分給与は含まれておりません。
37
非金銭報酬等
原材料、資本財、
輸送、通勤出張等
前期と前々期の比較
スコープ1
スコープ2
燃料の燃焼
ガソリン
重油等
事業者自らによる
温室効果ガスの直接排出量
電力の使用
スコープ3
川下工程
他社から供給された
電気の使用による間接排出量
スコープ1
スコープ2
小計
2025年 3月期
97t
3,910t
4,007t
2026年 3月期
95t
4,096t
4,191t
増減
-2t
+186t
+184t
製品の出荷、使用、廃棄等
2024年3月期
2025年3月期
増減
スコープ3排出量
7,496t
8,813t
+1,317t
スコープ1・2・3総排出量
12,015t
12,820t
+805t
38
ESGトピックス
管理部門の業務とNSグループのDNAを考える
齋藤経理課内で行われる会議では、一人ひとりの業務内
回答できるように日々学び、挑戦し吸収することを意識し
容の共有や日々のコミュニケーションを大切にしており、
ながら取り組んでいます。挑戦することで新たなスキルや
こうしたことが普段から発言しやすい環境や協力しやすい
知識を獲得し、それを相手に共有することが自分自身の成
環境を生み、
仕事を進めるうえでの安心感やモチベーション
長にもつながるのだと、経理という仕事を通じて強く感じ
につながっています。
るようになりました。
また、社内で「お菓子交流会」という取り組みがあり、普段
関わることの少ない他部署の社員と交流する機会が設け
られています。社員の声が届きやすい環境があり、人との
これからのチャレンジについて
関わりを大切にしている企業文化に、当社の原点となって
内山現在、
担当している新入社員研修では、
当社の歴史や、
いる「人」を軸に考える社是・経営理念を強く感じます。
当社が大切にしてきた考え方を自分自身で理解して伝える
と同時に、時代の変化に合わせて学びの形を見直していく
事業活動を支える縁の下の力持ち
としての管理部門の役割
常務取締役
ことも求められます。研修を単に「受ける場」ではなく、
「自
分で考え、今後の行動につなげる場」にしていくことが社
員、そして会社全体の成長につながると考えます。社員一人
足立総務会議では「私たちはサービス部門であり、お客
ひとりが成長できる場として研修の質を高めていきたいと
様である社員の皆さんが不自由なく働ける環境をつくって
考えています。
欲しい」と常々お願いしています。
また、地方のお客様を訪
齋藤知識やスキルを高め、担当している業務の幅を広げ
問する際には、できるだけ営業所に立ち寄り、現場の社員
ていきたいと考えています。現在、TCFD開示のための温室
管理部経理課
総務部総務課
(2022年4月入社)
(2022年4月入社)
総務・管理担当
とコミュニケーションを図りながら、総務としてどのような
効果ガス排出量算出を行っていますが、
お金を管理する日常
齋藤友稀
内山優菜
(情報統括責任者)
情報発信をすれば、社員全員に対して平等に会社としての
業務とはまた異なった業務であることから、経理という仕事
取り組みが伝わるかを模索しています。
は専門性が高く、仕事の幅をどんどん広げていける職種
足立有子
「明楽創」実現の土台をつくる
だと感じました。今後も積極的に様々なチャレンジを行い、
さらに専門性を高めながら、幅広い業務に携わっていき
たいと考えています。
超硬小径エンドミルの分野で国内トップシェアを誇る切削工具メーカーとして成長を続けてきた当社。それを支える「明楽創」
実現のための土台づくりを担う管理部門。当部門を統括する常務取締役の足立有子と若手社員2名が集い、自らの役割と
それに対する想い、さらに現状の取り組みと今後の取り組みについて語り合いました。
39
社是「明楽創」と経営理念に
込められた想い
込められています。
足立社是である「明楽創(明るく、楽しく、創造をしよう。)」
も、ものづくりメーカーとしての本質を表しています。
ソフト
は、前社長の後藤勇氏が「現状の町工場ではいい人材も
開発、自社製の機械や装置開発を手掛けても、必ずしもそ
内山管理部門の役割は、会社の本業である製造・販売に
経営理念の「SOFT(技術)
・HARD(機械)
・HEART(心)」
採れない。
どうしたら社員が働きがいを感じてくれるだろ
れだけで良いものができるわけではなく、やはり最後は人
携わる社員が安心して業務に専念できる環境を整え、会社
う」と考え抜いた末に生まれました。明るく楽しくクリエイ
の心が大事だということでHEARTを入れました。社是や経
の力が最大限発揮される土台を支えることだと認識して
ティブに仕事をすることが、ものをつくり、販売し、お客様
営理念に込められた想いを役職員全員で共有しています。
います。そのため、社員の小さな声や困りごとに常に目を
足立本社では仕事の専門性が高く、なかなか人事異動が
とともに利益を分かち合うことにつながるという信念が
内山総務課はものづくりに直接携わる部署ではありま
向け、何かを伝える時は、相手が動きやすいように内容を
できない側面がありますが、2026年3月期に全社員に向
せんが、
メーカーとして良い製品を生み出すためには、社是
整理し、難しい言葉を少しでも身近な言葉に置き換えるな
けて仕事のスキルアップやチャレンジしてみたい仕事の希
の通り社員が明るく楽しく働くことができる環境があって
ど、伝わる工夫をして情報を伝えることを心掛けています。
望を聞くための「人事異動の希望アンケート」を実施し、
こそだと感じています。総務課としても、当社グループ社員
こうした取り組みが長く働ける環境づくり、そして社是や
面談を希望すると回答した社員との面談も実施しました。
全員が同じ方向を向いて働けるように、入社時研修の際に
経営理念を実現するための基盤につながるという意識を
「なりたい自分になる」ための後押しができればと考え、
会社が掲げている社是や経営理念をしっかりと伝えるよう
持ちながら取り組んでいます。
積極的に自己啓発のための支援制度なども検討していま
に努めています。
齋藤管理部門は直接利益を生む部署ではありませんが、
す。少子高齢化の進展による労働力人口の減少がますます
明るく楽しく働く社員一人ひとりが 持っている想いや
日々触れている数字の面から会社を支え、貢献できると感
進む中、機械に任せられる仕事には投資をして
(自動化の
知見を結集することが、革新的なアイデアの発明につな
じています。他部署の社員から数字についての質問を受
推進)、それにより時間を創出できた社員には新たな仕事
がると考えています。そのための場づくりが総務課の責務
けたりする機会が多いからこそ、仕事上でのコミュニケー
にチャレンジして欲しいと考えています。
だと捉えています。
ションを特に大切にしています。聞かれたことにしっかりと
40
ESGトピックス
生産部のものづくりへのこだわり
何もしないことを恐れろ」という意識を共有し、小集団改善
影響します。成果はすぐには見えませんが、最近では砥石
活動「オレンジFC活動」を日常に根づいた取り組みにして
スペックの見直しによって歩留まりが改善するなど、少し
いきたいと考えています。
ずつ手応えも出てきました。高精度と量産性をどう両立
※ �シャンクとは、工作機械の主軸(チャック・ホルダー)に差し込んで固定する切削工具
させるかは大きな課題ですが、
ここを乗り越えることができ
の「柄(軸)」の部分です。
れば、当社の強みはさらに際立つと考えています。
シャンク
刃径
シャンク径
人材育成に関する各人の取り組み
髙橋管理者として意識しているのは「まずやってみる」文化
を根づかせること。できない理由を探すより、まず試す。
その結果が失敗でも、次の改善につながる経験になります。
小集団改善活動「オレンジFC活動」は改善活動であると
同時に、人材育成の場でもあります。改善テーマに取り
シャンク精度・刃径精度へのこだわり
重ねが、現場全体の底力を高めています。
野村製造1課は、製品加工の前段階にあたる段付け(粗
野村見えない部分にこだわることが、最終的にはお客様
取り)加工とシャンク加工を担っています。ここでバラツキ
の信頼につながります。
カタログに記載された規格以上の
精度を社内基準として追求する。日々の会話や改善活動を
仙台工場
仙台工場
仙台工場
があれば、後工程でどれだけ努力をしても高精度は実現
生産部製造グループ
生産部製造グループ
生産部
生産部製造グループ
製造4課課長
グループ長兼製造1課課長
部長
製造2課課長
できません。だからこそ、
まずシャンクを高精度化すること
通じて、その意味を現場に伝えています。
伊藤洋介
野村祐一
髙橋章義
佐々木有香
が最重要だと考えてきました。設備の高精度化に加え、加工
佐々木若手社員が多い職場では、
「やるしかない」という
条件や管理方法を一つひとつ見直してきた結果、歩留まり
状況を、どう前向きな挑戦に変えるかが重要だと感じて
2001年当社入社。生産部で製造
2 0 0 0 年当社入社。製品設計、
2005年当社入社後、生産部門で
2002年当社入社後、数々のもの
に携わり、生産技術課に異動し、
製造、工務、品質保証 など生産
製造に携わり、品質保証課に異
づくり現場を経験。サブリーダー
は大きく向上しています。ただし、目標の達成に到達点は
います。なぜ必要なのか、達成すると何が変わるのか。その
職を経て、2023年4月より現職。
なく、常に通過点だと捉えています。高精度化は終わりの
説明を重ねることで、少しずつ前向きな姿勢が根づいて
ない取り組みとの覚悟を持って、日々向き合っています。
きました。
佐々木製造2課では、TGMを用いた刃径精度の高精度
伊藤 CBNやPCDの工程は難易度が高い分、小さな成功
化に取り組んでいます。私が課長に就任した当初に比べ、
体験が次の挑戦への原動力になります。改善が数字として
歩留まりが数%ほど改善しています。測定機の自動補正
見えたときはしっかり共有し、評価する。その積み重ねが、
機能に頼るだけでなく、現場で補正プログラムを見直し、
粘り強さにつながっています。
仙台工場
その後同課長を務める。2022年
部内で延べ9回の部署異動を経
動、その 後生産部門 の 課長、グ
4月より現職。
て、2022年4月より現職。
ループ長を経て2022年4月より
現職。
「高精度化」を磨き続ける生産現場の取り組み
41
組む中で、考える力、試す力、やり抜く力が育まれ、その積み
当社仙台工場の生産部では、
「高精度化」を単なる技術課題ではなく、ものづくりの思想として捉え、長年にわたり磨き続けて
適切なタイミングで適切な補正が入るように工夫してい
きました。自社開発した自動測定機を起点とする改善サイクル、小集団改善活動など、見えない部分にこだわり続ける現場を
ます。加工順序を変える、補正のタイミングを調整する。
率いるリーダー4名に、ものづくりへのこだわりについて聞きました。
こうした一見地味な改善の積み重ねが、結果につながって
「NS(日進工具)
らしさ」を未来へつなぐ
います。若手社員が多い職場だからこそ、なぜ高精度が
髙橋 NSらしさとは、ものづくり行動指針に掲げる「究極
受け継がれてきた
「高精度化」という思想
「公差0」を掲げ続ける理由とは
必要なのか、その意味を丁寧に伝えることを心掛けてい
のものづくり」だと思っています。高精度化に限らず、
コスト
ます。納得したうえで取り組むことが、仕事を「やらされる」
改善や自動化など、
すべてにチャレンジしていく。その土台
髙橋 チャレンジの方向性として、生産部では「公差0を目
から「自分ごと」への切り替えにつながると考えています。
をつくるのが小集団改善活動「オレンジFC活動」であり、
髙橋高精度化は生産部の重要課題として、長年にわたり
指す」を方針に掲げています。
シャンク 精度は0.001mm
取り組んできたものです。私が部長になってから新たに
レンジ、製品の刃径は0.002mmレンジを目標に、歩留まり
始めた施策ではなく、先輩方から受け継いできた挑戦の
100%を目指し続けています。
この考えの根底にあるのが、
cBN/PCDという最難関領域への挑戦
延長線上に、今の取り組みがあります。だからこそ高精度
後藤副社長の「2倍1/2」という言葉です。
すなわち、品質・
伊藤製造4課では、cBNやPCDといった非常に硬い素材
続けることで、技術も人も成長してきました。自動化が進む
化は、単なる技術テーマではなく、生産部に根づいた思想
精度は2倍、コスト・公差は1/2を目指すというものです。
を扱っています。CBN/PCD製品は、当社の中核ラインで
時代だからこそ、人が考え、付加価値を生み出す意味はよ
挑戦できる人材を育て体制を整えることが、私たち管理者
※
の責任です。私たちは、先輩から受け取ったバトンを次世代
へ渡す役割を担っています。
「公差0」という理想を掲げ
だと考えています。成果が色濃く表れ始めたきっかけは、
毎年、実績に対してさらに品質・精度2倍を目標に掲げる
あり、高付加価値製品の代表です。超硬よりもはるかに
り大きくなっていると感じます。機械の性能に甘んじるの
自社で開発した自動測定機の導入でした。
この自動測定の
ことで、着実にレベルを引き上げてきました。
スタート当初
硬い素材を安定して加工するには、加工機の繰り返し精度
ではなく、そのアウトプットを超える価値をどう生み出す
仕組みが、安定したバラツキの無い製品を生産する根幹と
は比較的容易に達成できた目標も、近年は非常に難易度
や砥石の研削精度など、極めて高い技術が求められます
か。それを問い続ける姿勢こそが、NSらしさです。挑戦を
なっています。測定データから課題を抽出し、改善への糸口
が高くなっています。
しかし、
「公差0」を目指し続けること
ので、加工条件の探索そのものが仕事と言っても過言では
諦めず、失敗から学び、次へつなぐ。その姿を現場で体現
を見つけ、解決につなげていく。その一連の活動が、当社
で、目標達成への光は必ず見えてくると考えています。改善
ありません。砥石の成形方法、クーラント(切削油)管理、
し、言葉と行動で次の世代へ伝えていく。そうした取り組み
グループの小集団改善活動である「オレンジFC活動」です。
の停滞は衰退です。
「チャレンジして失敗を恐れるよりも、
機械の経年変化への対応など、複合的な要因が 結果に
が、日進工具の未来につながると信じています。
42
ESGトピックス
経営体制の変遷を振り返る
平賀人財育成については、指名・報酬委員会でも重視して
については慎重な考え方を持っています。
います。上場企業として持続的に成長していくためには、
平賀経営ビジョンが明確であれば、個別の判断において
現場を知るプロパー人財が経営の中核を担う姿を示すこと
も一貫性が保たれます。取締役会においても、結論だけで
が不可欠です。執行役員制度はその第一歩ですが、その先
なく、その背景や考え方を共有することが重要だと思い
に取締役という到達点が見えているかどうかで、社員の
ます。ビジョンを言語化し、共有し続けることは、今後ます
受け止め方は大きく変わります。自分も将来、経営に参画
ます重要になると感じています。
できるという実感が、組織全体のモチベーションを高める
藤崎特に若い世代を考える場合、目先の数字や数値目標
ことにつながると考えています。
以上に、その先にある会社の姿が重要だと思います。
どの
藤崎人財は座学だけでは育ちません。自ら考え、判断し、
ような価値を社会に提供し、どのような存在を目指すの
その結果を受け止める経験の積み重ねが重要です。若い
か。経営がビジョンを言葉として繰り返し発信することで、
世代が「この会社でどこまで成長できるのか」ということを
組織全体のベクトルが揃っていきます。
ビジョンの共有は、
具体的にイメージできるかどうかが、組織の将来を左右
成長戦略を支える重要な基盤だと考えています。
します。経営層が自らの経験や考えを言語化し、意図を
もって仕事を任せることが、
次の経営人財の育成につながる
と考えます。
人を中心に据えた持続的成長に向けて
平賀 この10年で、日進工具は確実に進化してきました。
代表取締役社長
社外取締役(監査等委員)
社外取締役(監査等委員)
後藤弘治
藤崎直子
平賀敏秋
次の10年に向けた経営を考える
ガバナンスが整い、人財育成への視点が明確になった今、
次の成長ステージに進むための土台は整っています。
これ
藤崎国内と海外、営業と製造では、同じ会社にいながら
からの10年が、
さらに持続的で魅力ある企業へと進化する
見える景色が大きく異なります。その違いを理解し合うこと
期間になることを期待しています。
が、組織力の向上につながります。実際に現場を経験する
藤崎社員一人ひとりが、自分の仕事の意味や将来像を
ことで、他部門への理解が深まり、
より建設的な議論が可能
語れる会社は、結果として強い会社になります。そのため
になります。計画的な人財育成として、組織横断的な経験
には、経営理念や価値観を繰り返し、丁寧に伝え続けること
を積ませることは非常に重要だと思います。
が欠かせません。人を大切にする姿勢が、企業価値の向上
創業期の家族経営の時代から株式上場を経て社会の公器に、そして次の成長段階へ。経営体制の整備、
ガバナンスの高度化、
平賀多様な経験を積んだ人財が増えることで、経営層に
につながると考えています。
人財育成と事業戦略の進化は、いかに連動してきたのか。後藤社長、そして長らく当社の経営を見つめてきた2人の社外取締役
上がってくる議論の質も変わってきます。現場感覚と経営
後藤私も、最終的に会社を成長させるのは人だと考えて
が当社のこれまでの変化と次の10年に向けた未来像について語り合いました。
視点を併せ持つ人財が育てば、意思決定のスピードと精度
います。設備や技術は重要ですが、それを活かすのも、継承
はさらに高まるでしょう。組織の壁を越えた人財育成は、将
していくのも人です。”
「つくる」の先をつくる”という当社
来のガバナンス強化にも直結するテーマだと考えています。
のステートメントには、人づくりも含まれています。次の10
経営体制の進化とガバナンスの定着
平賀社外取締役の立場から率直に意見を申し上げられる
後藤 お二人のおっしゃる通りです。従来当社は、専門性を
年に向けて、この考えをさらに深め、組織としての成長に
後藤当社は長年、オーナー経営として意思決定の速さを
環境が整っていることは、
日進工具の大きな特長です。
ガバ
重視した人財配置を行ってきました。その結果、各部門に
つなげていきたいと考えています。
また同時に、”
「つくる」
強みに成長してきました。その一方で、上場企業として求め
ナンスは経営を縛るものではなく、経営の質を高めるため
高い専門性を持つ人財が育っています。一方で、部門を越え
の先をつくる”新たな市場を開拓し、世の中にない新しい
られる統治の仕組みや説明責任については、後から整えて
の基盤です。指名・報酬の考え方や意思決定プロセスが
て会社全体を俯瞰する視点を持つ人財が不足しているとも
工具をその市場に提供することで、持続的な成長を実現
きた部分も少なくありません。社外取締役の皆様にご参画
整理されたことで、社内外に対する説明力が向上し、経営
言えます。今後は、意図的なローテーションや役割変更を
してきたいと考えています。社外取締役のお二人、貴重な
いただいたことで、経営の意思決定を個人の判断から組織
に対する信頼性も着実に高まっていると感じています。
通じて、
全体最適の視点を持つ人財を育てていく必要があり
ご意見をありがとうございました。
としての判断へと移行させる意識が明確になりました。経営
を「見える化」することの重要性を、実感をもって理解できる
43
組織の壁を越えた人財の育成
ます。これは短期的な効率よりも、長期的な
ようになってきたと感じています。
次世代への継承と経営人財の育成
藤崎私が社外取締役に就任した当初は、ガバナンスが
後藤私の経営における最大のテーマは、次の世代にいか
「制度として存在している」段階にとどまっている印象が
にバトンを渡していくかにあります。私自身、創業期から
成長を優先する経営判断だと考えています。
経営ビジョン共有の在り方
ありました。ただ、重要なのは制度の有無ではなく、それが
成長期、そして上場というプロセスを経験してきましたが、
後藤私は中期経営計画を、単なる数値目標
実際に機能しているかどうかです。取締役会での指摘が
その経験を若い世代と十分に共有できていたかというと、
ではなく、会社がどこに向かうかを示す経営
翌年には確実に改善されている様子を見て、この会社に
必ずしもそうでない部分があったと感じています。工場建設
の羅針盤だと考えています。内部で十分に議
は変化を受け入れる柔軟性と実行力があると感じました。
などの大型投資の経営判断は、頻繁に経験できるもので
論を尽くし、方向性を共有したうえで、実行力
現在では、経営課題について本質的な議論ができる場に
はありません。だからこそ、中堅層や若手を意識的に巻き
を高めていく。その積み重ねが結果につな
進化してきていると感じています。
込み、経験させる場面をつくる必要があると考えています。
がると考えていますが、外部への情報開示
44
トピックス
展示会レポート
Webコンテンツのご紹介
「EMO Hannover 2025」出展
当社では様々なコンテンツを活用して、
製品やものづくりに関する情報を発信しております。
ぜひご覧ください。
オウンドメディア
「未来」の先をつくる
毎週金曜日更新
「読んでみたらおもしろい」
「読んで役にたった」そう思っていただけるものづくり業界で感じるお役立ちサイトです。
流行の話題や日常生活におけるトピックなどをものづくりと絡めるなど、様々な視点で記事をお届けしております。
記事の一例
2026.03.19
2026.01.23
製造業ですすむサブスク化とは?
次世代ビジネスモデルの可能性
設備保全のコストを最小化!
予知保全を実現するAI技術
CO2排出量を「売買」
する?
カーボンクレジットとは
#サブスク
#AI #設備保全
#カーボンクレジット
動画
/ @ns̲tool
NS̲Web̲Studio
なんとか重工
当社製品を用いた加工
によりどのような効果
が 得られるのか 、当社
開発部の社員がわかり
やすく解説
をしており
ます。
精密・微細加工動画
2025年9月22~26日にドイツ・ハノーファーで開催
ことにより、ユーザー様それぞれの目的に沿った製品を
された世界最大級の工作機械見本市「EMO Hannover
提案しやすい展示を行いました。
また、製品の展示だけでは
2025」に出展いたしました。EMOは1975年に初回開催
なく、高精度かつ安定した高品質な製品を提供する当社
されて以来、今回が50周年の節目となり、約1,600社が
のものづくりへのこだわりを紹介するコーナーを特設し、
出展、約8万人が来場しました。
自社で開発した工具研削盤「TGM」での生産体制を説明
キットを展示し、当社製品の品質に対する信頼性を高め、
展示会の様子や新製品など、
コーポレートサイトの利便性が向上しました。
「当社製品だからこそできる、ユーザー様の安定した生産
最新情報を発信しております。
当社は前回の「EMO Hannover 2023」に続き、会場中
来場者対応では、世界各地域の営業担当が参加すると
心付近のメイン通路に面した人通りの多い好立地にブース
ともに、現地代理店営業担当の協力を受け、欧州だけで
を設営することができました。工具メーカーとしての出展数
なく世界各国からの来場者に対応できる多言語体制を
が少ない中、集客力の高い大手メーカーの大型ブースと
整えました。各国市場の課題に対して具体的な回答・フォ
隣接する位置であり、足を止める来場者に対して効果的な
ローを行うことができ、当社及び当社製品への信頼性向上
製品PRを実施、集客数・商談件数ともに成果を上げること
にもつながりました。
展示ブースでは、新製品のコーナーを設けるとともに、
加工内容に合わせたソリューション別に製品を展示する
45
本展示会は、製品のPRにとどまらず、欧州最大市場の
ドイツをはじめとした欧州全体における当社のブランド力
レ ン ズ 形 エ ンド ミ ル
『MLFH330』ほか、実
際に当社製品を使用し
て高硬度加工を行って
いただきま
した。
ものづくり太郎チャンネル
当社製品の特長や従来品との比較、加工の
様子など、コンパクトにまとめております。
NEWS
への寄与」を効果的にアピールすることができました。
ができました。
Φ0.1mm以下のエンドミル
『マイクロエッジ』開発秘話
SNS
するパネルを設置しました。
さらに、
工具の基準となるシャン
ク精度へのこだわりを体験してもらうシャンク精度体験
2026.02.13
『加工のポイント』
を定期的に更新
新規製品検索システムを公開
実例をもとに、工具の特性や加工
条件など様々な観点から、
どのよう
な点に留意すれば、理想の加工に
近づけるかをトークも交えて、わか
りやすく記載しております。
【被削材・加工用途・加工工程・
工具形状】といった複数条件か
ら、より直感的 な 操
作で最適な工具を
絞り込むことができ
るようになりました。
X(旧Twitter)
@ns̲tool
Facebook
を高める機会となりました。
46
会社概要/株式の状況
株主メモ
(2026年3月31日現在)
会社概要
株式の状況
商号
日進工具株式会社
発行可能株式総数
38,400,000株
URL
https://www.ns-tool.com
発行済株式総数
25,035,034株
代表者
後藤弘治
株主数
本社
東京都品川区大井一丁目28番1号
住友不動産大井町駅前ビル6F
創業
1954年12月
資本金
455,330,523円
従業員数
364名(連結)
事業内容
切削工具の製造販売
生産品目
金型及び部品加工向けの超硬エンドミル
取引銀行
三菱UFJ銀行、みずほ銀行
グループ会社
株式会社ジーテック
株式会社日進エンジニアリング
株式会社牧野工業
日進工具香港有限公司
NS TOOL USA, INC.
上場証券取引所
東京証券取引所 スタンダード市場
大株主
所有者別株式数分布状況
9.94%
株主総会
- 定時株主総会:毎年6月に開催
- 臨時株主総会:必要あるときに随時開催
株主名簿管理人
特別口座の口座管理機関
東京都千代田区丸の内一丁目4番5号
三菱UFJ信託銀行株式会社
同事務取扱場所
東京都千代田区丸の内一丁目4番5号
三菱UFJ信託銀行株式会社証券代行部
10名
2,489,000株
東京都府中市日鋼町1番地1
三菱UFJ信託銀行株式会社証券代行部
6.20%
0.70%
1名
1,552,963株
24名
176,158株
自己名義株式
金融商品取引業者
同連絡先・郵送先
0120-232-711(通話料無料)
【郵送先】
〒137-8081 新東京郵便局私書箱第29号
三菱UFJ信託銀行株式会社
公告方法
持株比率
(%)※2
株式会社エムワイコーポレーション※3
2,497
10.63
株式会社ソルプティ
2,435
10.37
NORTHERN TRUST CO.(AVFC) RE FIDELITY FUNDS
(常任代理人香港上海銀行東京支店)
2,092
8.91
日本マスタートラスト信託銀行株式会社(信託口)
1,864
7.94
株式会社ティ・アイロード※3
1,847
7.87
後藤弘治
788
3.36
BANK LOMBARD ODIER AND CO LTD GENEVA
(常任代理人株式会社三菱UFJ銀行)
783
3.34
後藤隆司
778
3.31
後藤勇二
661
2.82
日進工具従業員持株会
449
1.92
※3
毎年4月1日から翌年3月31日まで
金融機関
持株数
(千株)※1
株主名
13,768名
事業年度
証券代行部
電子公告の方法により行います。ただし、事故その他やむを得ない事由によって
電子公告による公告ができない場合は、日本経済新聞に掲載します。
(1) �株主様の住所変更、買取請求その他各種お手続きにつきましては、原則、口座を開設されている口座管理機関(証券会社等)で承ることとなっております。口座を開設されている
証券会社等にお問合せください。株主名簿管理人(三菱UFJ信託銀行)
ではお取り扱いできませんのでご注意ください。
(2) �特別口座に記録された株式に関する各種お手続きにつきましては、三菱UFJ信託銀行が口座管理機関となっておりますので、上記特別口座の口座管理機関(三菱UFJ信託銀行)に
お問合せください。なお、三菱UFJ信託銀行全国各支店にてもお取次ぎいたします。
(3)未受領の配当金につきましては、三菱UFJ信託銀行本支店でお支払いいたします。
34.76%
16.95%
13,509名
8,702,423株
107名
4,242,847株
個人・その他
外国法人等
31.44%
その他の法人
117名
7,871,643株
※1 千株未満は、切り捨てて表示しております。
※2 持株比率は、自己株式(1,552,963株)
を控除して計算しております。
※3 �株式会社エムワイコーポレーション、株式会社ソルプティ、株式会社ティ・アイロードは
それぞれ後藤弘治、後藤隆司、後藤勇二の資産管理会社です。
株価・出来高・TOPIXの推移
(千株)
(Index)
200
400
300
出来高
日進工具
TOPIX
150
200
100
100
50
0
0
2023年
4月3日
2024年
4月1日
2025年
4月1日
2026年
3月31日
日進工具とTOPIXの値は、2023年4月3日の終値データを100としております。
47
お問合せ先
〒140-0014
TEL
03-6423-1135
東京都品川区大井一丁目28番1号
FAX
03-6423-1186
住友不動産大井町駅前ビル6F
E-mail [email protected]
48
新任取締役選任のご報告
2026年6月24日開催の第65回定時株主総会の決議により、
以下の新任取締役を選任いたしましたので、
ご報告申し上げます。
新任取締役選任の理由
製造業において総務担当、経営戦略担当常務、取締役副社長を長年
務め、産学官連携の推進に関与するなど幅広い経営知識と見識を
有しており、当社の業務執行に関する意思決定及び監督において、
妥当性及び適法性の見地から適切な助言・提言をいただくことを期待
し、社外取締役として選任いたしました。
社外取締役監査等委員
小倉乃里子
新任取締役の略歴
氏名
(生年月日)
略歴
1978年 3月 オグラ工業株式会社(現 オグラ金属株式会社)入社
1994年 4月同社総務部教育・人事担当部長
1997年 4月厚生労働省関東職業能力開発大学校運営推進委員(現任)
お
ぐら
の
り
こ
小倉乃里子
(1955年6月18日生)
2006年 6月 �オグラ金属株式会社・オーエムシー株式会社常務取締役
2009年 6月 ��同社取締役副社長
2023年 4月 �あしかが産学官連携センター会長(現任)
2024年 6月 �オーエムシー株式会社取締役副社長(現任)
2024年 6月 �オグラ金属株式会社相談役(現任)
2025年 4月 �栃木県生産性本部経営品質アワード表彰審査委員
新任取締役選任のご報告
2026年6月24日開催の第65回定時株主総会の決議により、
以下の新任取締役を選任いたしましたので、
ご報告申し上げます。
新任取締役選任の理由
弁護士として企業法務をはじめとする高度な専門的知識及び経験に
基づき、直接会社経営に関与した経験はないものの、当社の業務
執行に関する意思決定及び監督において、妥当性及び適法性の見地
から適切な助言・提言をいただくことを期待し、社外取締役として
選任いたしました。
社外取締役監査等委員
平賀真紀
新任取締役の略歴
氏名
(生年月日)
ひら
が
ま
き
平賀真紀
(1973年4月27日生)
略歴
2002年 11月司法試験合格
2004年 10月弁護士登録、長谷川俊明法律事務所入所
2010年 4月平賀法律事務所開設(現任)
【ご参考】2026年6月24日以降の役員体制
取締役
後藤弘治
取締役監査等委員
田島寛
取締役
後藤隆司
社外取締役監査等委員
笹本憲一
取締役
足立有子
社外取締役監査等委員
中野秀代
取締役
戸田覚
社外取締役監査等委員
小倉乃里子
社外取締役
斉藤貴宣
社外取締役監査等委員
平賀真紀