変更報告書(特例対象株券等)(JPモルガン・アセット・マネジメント株式会社)
Bull 0
Bear 0
Routine
6027
Fiscal year ends March
Quarters are offset from the calendar — Q1 is Apr–Jun
|
Bengo4.com, Inc. operates in the professional support and cloud signing sectors, providing digital services for legal and tax professionals as well as corporate contract management. The company runs the legal consultation portal Benidog and the tax consultation portal Zeirishi Dot Com, offering profile creation, search functions, and anonymous Q&A services for lawyers and tax accountants. It provides business support tools including the case law database Hanrei Hisho, the legal book subscription service Benidog Library, the digital document organization tool Bengyou Kakumei, and the AI agent Legal Brain Agent. For corporate legal departments, the company offers the Business Royers portal, which includes the Business Royers Library subscription and compliance training services. Additionally, Bengo4.com provides the CloudSign contract management platform, enabling users to execute contracts digitally. The company also generates revenue through advertising on its web properties and success fees from tax accountant referrals. Summarised from the annual report, fiscal year ended Mar 2026 |
Industry Internet Content & Information | Homepage bengo4.com |
| Sector Communication Services | IR page bengo4.com | |
|
Tags
legal tech, tax services, contract management, case law database, legal book subscription, ai legal agent, digital document management, professional networking, online consultation, compliance training, Benidog, Zeirishi Dot Com, Hanrei Hisho, Benidog Library, Bengyou Kakumei, Legal Brain Agent, Business Royers, Business Royers Library, Business Royers Compliance, CloudSign
|
Press page — |
Metrics
| Valuation | |
|---|---|
| Market cap | ¥ 115.481B |
| Market cap (USD) | $ 721.767M |
| P/E | 65.77 |
| PEG | 2.34 |
| P/BV | 14.36 |
| P/S | 6.27 |
| P/OCF | 54.42 |
| P/FCF | 99.88 |
| Dividend yield | — |
| Turnover / mcap | — |
| Returns | |
|---|---|
| ROE | 23.9% |
| ROI | 16.2% |
| ROIC | 18.0% |
| Profit margin | 9.3% |
| Growth | |
|---|---|
| Revenue growing | Yes |
| Profits growing | Yes |
| Revenue up 3y | Yes |
| Revenue up 5y | Yes |
| Earnings growth 3y (net profit CAGR) | 28.2% |
| Quality | |
|---|---|
| Profitable | Yes |
| Margin expanding | Yes |
| Buying back stock | No |
| Diluting (TTM) | Yes |
| Debt/Equity | — |
| Podcast bulls (TTM) | Sign up |
| Podcast bears (TTM) | Sign up |
| Podcast sentiment (TTM) | Sign up |
| Podcast sentiment % (TTM) | Sign up |
| News sentiment (TTM) | 0 |
| Quality score | 29.4% |
| Insiders | |
|---|---|
| Buys, 1w | Sign up |
| Buys, 1m | Sign up |
| Buys, 1y | Sign up |
| Sells, 1w | Sign up |
| Sells, 1m | Sign up |
| Sells, 1y | Sign up |
Sign up to see this company's insider trades
| Figure | FY 2026 | FY 2025 | FY 2024 | FY 2023 | FY 2022 | FY 2021 | FY 2020 | FY 2019 | FY 2018 | FY 2017 | FY 2016 | FY 2015 | FY 2014 | FY 2013 |
|---|---|---|---|---|---|---|---|---|---|---|---|---|---|---|
| Revenue | 16.288B | 14.072B | 11.324B | 8.711B | 6.877B | 5.318B | 4.133B | 3.133B | 2.319B | 1.657B | 1.115B | 690.281M | 291.389M | 159.556M |
| Net profit | 1.51B | 1.049B | 837.671M | 717.402M | 702.278M | 64.661M | 260.253M | 333.224M | 323.346M | 257.835M | 179.043M | 112.609M | 13.408M | -16.088M |
| Free cash flow | 724.906M | 684.591M | 452.116M | -3.109M | 738.448M | 285.847M | -88.909M | 153.397M | 258.629M | 144.374M | 203.611M | — | — | — |
| Figure | FY 2026 | FY 2025 | FY 2024 | FY 2023 | FY 2022 | FY 2021 | FY 2020 | FY 2019 | FY 2018 | FY 2017 | FY 2016 | FY 2015 | FY 2014 | FY 2013 |
|---|---|---|---|---|---|---|---|---|---|---|---|---|---|---|
| Share price | 2.814K | 2.741K | 3.395K | 2.409K | 3.945K | 8.696K | 4.224K | 4.389K | 2.031K | 836.61 | 804.38 | 905.3 | — | — |
| Price performance 12m | 0.03 | -0.19 | 0.41 | -0.39 | -0.55 | 1.06 | -0.04 | 1.16 | 1.43 | 0.04 | -0.11 | — | — | — |
Filed figures
Lines the statements and their notes report beside the headline figures, read from the filings' XBRL as filed (no restatement applied), with figures computed from one filing's own lines. Cash-flow lines carry their cash direction: an outflow is negative. Each period links to its filing; a figure's period, report date and tag are in its tooltip.
| Figure | Mar 2017 | Mar 2018 | Mar 2019 | Mar 2020 | Mar 2021 | Mar 2022 | Mar 2023 | Mar 2024 | Mar 2025 | Mar 2026 |
|---|---|---|---|---|---|---|---|---|---|---|
| Balance sheet detail | ||||||||||
| Trade receivables (JPY) | 231M | 308M | 456M | 610M | 774M | 1.02B | 1.3B | 1.8B | 2.07B | 2.47B |
| ↳ YoY growth | +46.5% | +33.6% | +48.0% | +33.7% | +27.0% | +31.1% | +28.2% | +37.9% | +15.3% | +19.3% |
| ↳ 5y CAGR | +37.5% | +34.5% | +33.4% | +31.5% | +27.7% | +26.1% | ||||
| Other receivables (JPY) | 410,000 | 745,000 | 808,000 | 1.93M | 8.79M | 9.48M | 23.1M | — | — | — |
| Borrowings, current (JPY) | — | — | — | — | — | — | — | 509M | 735M | 881M |
| Borrowings, non-current (JPY) | — | — | — | — | — | — | — | 2.24B | 1.75B | 1.85B |
| Cash and deposits (JPY) | 974M | 1.26B | 1.4B | 1.2B | 1.46B | 1.68B | 1.65B | 3.47B | 4.17B | 5.2B |
| Intangible assets (JPY) | 87.9M | 150M | 187M | 272M | 397M | 572M | 772M | 3.39B | 3.54B | 3.53B |
| Net debt (borrowings + leases - cash) (JPY) | — | — | — | — | — | — | — | -723M | -1.68B | -2.47B |
| Cash flow detail | ||||||||||
| Operating cash flow (JPY) | 236M | 394M | 299M | 142M | 570M | 1.16B | 458M | 1.16B | 1.37B | 1.62B |
| Purchases of property, plant and equipment (JPY) | -24.8M | -11M | -20.4M | -30.9M | -13.2M | -26.3M | -7.41M | -67.3M | -17.1M | -48M |
| Purchases of intangible assets (JPY) | -66.8M | -124M | -126M | -200M | -271M | -391M | -454M | -641M | -667M | -847M |
| Change in receivables (cash effect) (JPY) | -73.2M | -77.4M | -148M | -154M | -165M | -241M | -286M | -418M | -273M | -400M |
| Change in inventories (cash effect) (JPY) | 136,000 | -250,000 | -691,000 | 886,000 | -1.04M | -304,000 | 358,000 | — | — | — |
| Share buybacks (cash effect) (JPY) | -85.3M | — | -121,000 | -154,000 | — | -501M | -127,000 | -220,000 | -598,000 | — |
| Interest paid (cash effect) (JPY) | — | — | — | — | — | — | — | -3.38M | -14.4M | -20.7M |
| Income taxes paid (cash effect) (JPY) | -147M | -177M | -220M | -182M | -124M | -52.5M | -676M | -395M | -560M | -753M |
| Share-based compensation (JPY) | — | — | — | — | — | — | 22.1M | 37.5M | -2.27M | 52.8M |
| Operating cash flow before change in receivables (JPY) | 309M | 471M | 447M | 296M | 735M | 1.4B | 745M | 1.58B | 1.64B | 2.02B |
| Free cash flow (OCF - PPE - intangibles) (JPY) | 144M | 259M | 153M | -88.9M | 286M | 738M | -3.11M | 452M | 685M | 725M |
| Income detail | ||||||||||
| Total comprehensive income (JPY) | — | — | — | — | — | — | — | 838M | 1.05B | 1.51B |
| Comprehensive income to owners (JPY) | — | — | — | — | — | — | — | 838M | 1.05B | 1.51B |
| Provision for credit losses (JPY) | 1.99M | 282,000 | 6.92M | 6.12M | 5.67M | 18.4M | 22.8M | 15.8M | 23.6M | 48.6M |
| Credit cost ratio (credit losses / average receivables) (%) | 1.0% | 0.1% | 1.8% | 1.1% | 0.8% | 2.0% | 1.9% | 1.0% | 1.2% | 2.1% |
| Segments | ||||||||||
| Cloud Sign Business · Segment revenue (JPY) | — | — | — | — | — | — | — | — | 6.97B | 8.76B |
| ↳ YoY growth | +25.6% | |||||||||
| Cloud Sign Business · Segment operating income (JPY) | — | — | — | — | — | — | — | — | 1.99B | 2.97B |
| IT Solutions · Segment revenue (JPY) | — | — | — | — | — | — | — | 6.87B | 9.19B | — |
| ↳ YoY growth | +33.8% | |||||||||
| IT Solutions · Segment operating income (JPY) | — | — | — | — | — | — | — | 1.48B | 2.21B | — |
| Media · Segment revenue (JPY) | — | — | — | — | — | — | — | 4.45B | 4.88B | — |
| ↳ YoY growth | +9.7% | |||||||||
| Media · Segment operating income (JPY) | — | — | — | — | — | — | — | 1.43B | 1.3B | — |
| Professional Support Business · Segment revenue (JPY) | — | — | — | — | — | — | — | — | 7.1B | 7.53B |
| ↳ YoY growth | +6.1% | |||||||||
| Professional Support Business · Segment operating income (JPY) | — | — | — | — | — | — | — | — | 1.53B | 1.87B |
| Reported | Jun 26, 2017 | Jun 25, 2018 | Jul 1, 2019 | Jun 29, 2020 | Jun 28, 2021 | Jun 27, 2022 | Jun 23, 2023 | Jun 21, 2024 | Jun 22, 2026 | Jun 22, 2026 |
Sign up to see institutional holdings
Sign UpPodcast Mentions
Sign up to see podcast mentions and sentiment
Sign UpTimely disclosures published on TDnet, newest first, titles as filed in Japanese. The link opens the disclosure on TDnet. Filings with EDINET (periodic reports, extraordinary reports, offerings, holding and buy-back reports), newest first, titles as filed in Japanese. The link opens the filing on EDINET. Press releases from the company's own website, newest first.


 記事のタイトルとURLをコピー済み










 「あなたの息子ひき出します!」の上映が最初に始まった映画館「シネスイッチ銀座」は10月25日で閉館した(2026年10月9日、東京都中央区で、弁護士ドットコムニュース撮影)
 映画のワンシーン(©️スタンダードフィルム2026)
 深川栄洋監督(2026年10月21日、東京都港区で、弁護士ドットコム撮影)


 記者会見する原告の女性(2026年11月6日、東京・霞が関の司法記者クラブで、弁護士ドットコムニュース撮影)
 生まれた赤ちゃんと一緒に写真に収まる原告の女性と男性医師(原告提供。一部にモザイク加工をしています)
 原告の女性と被告の男性医師がやり取りしていたLINE(原告提供。一部にモザイク加工をしています)
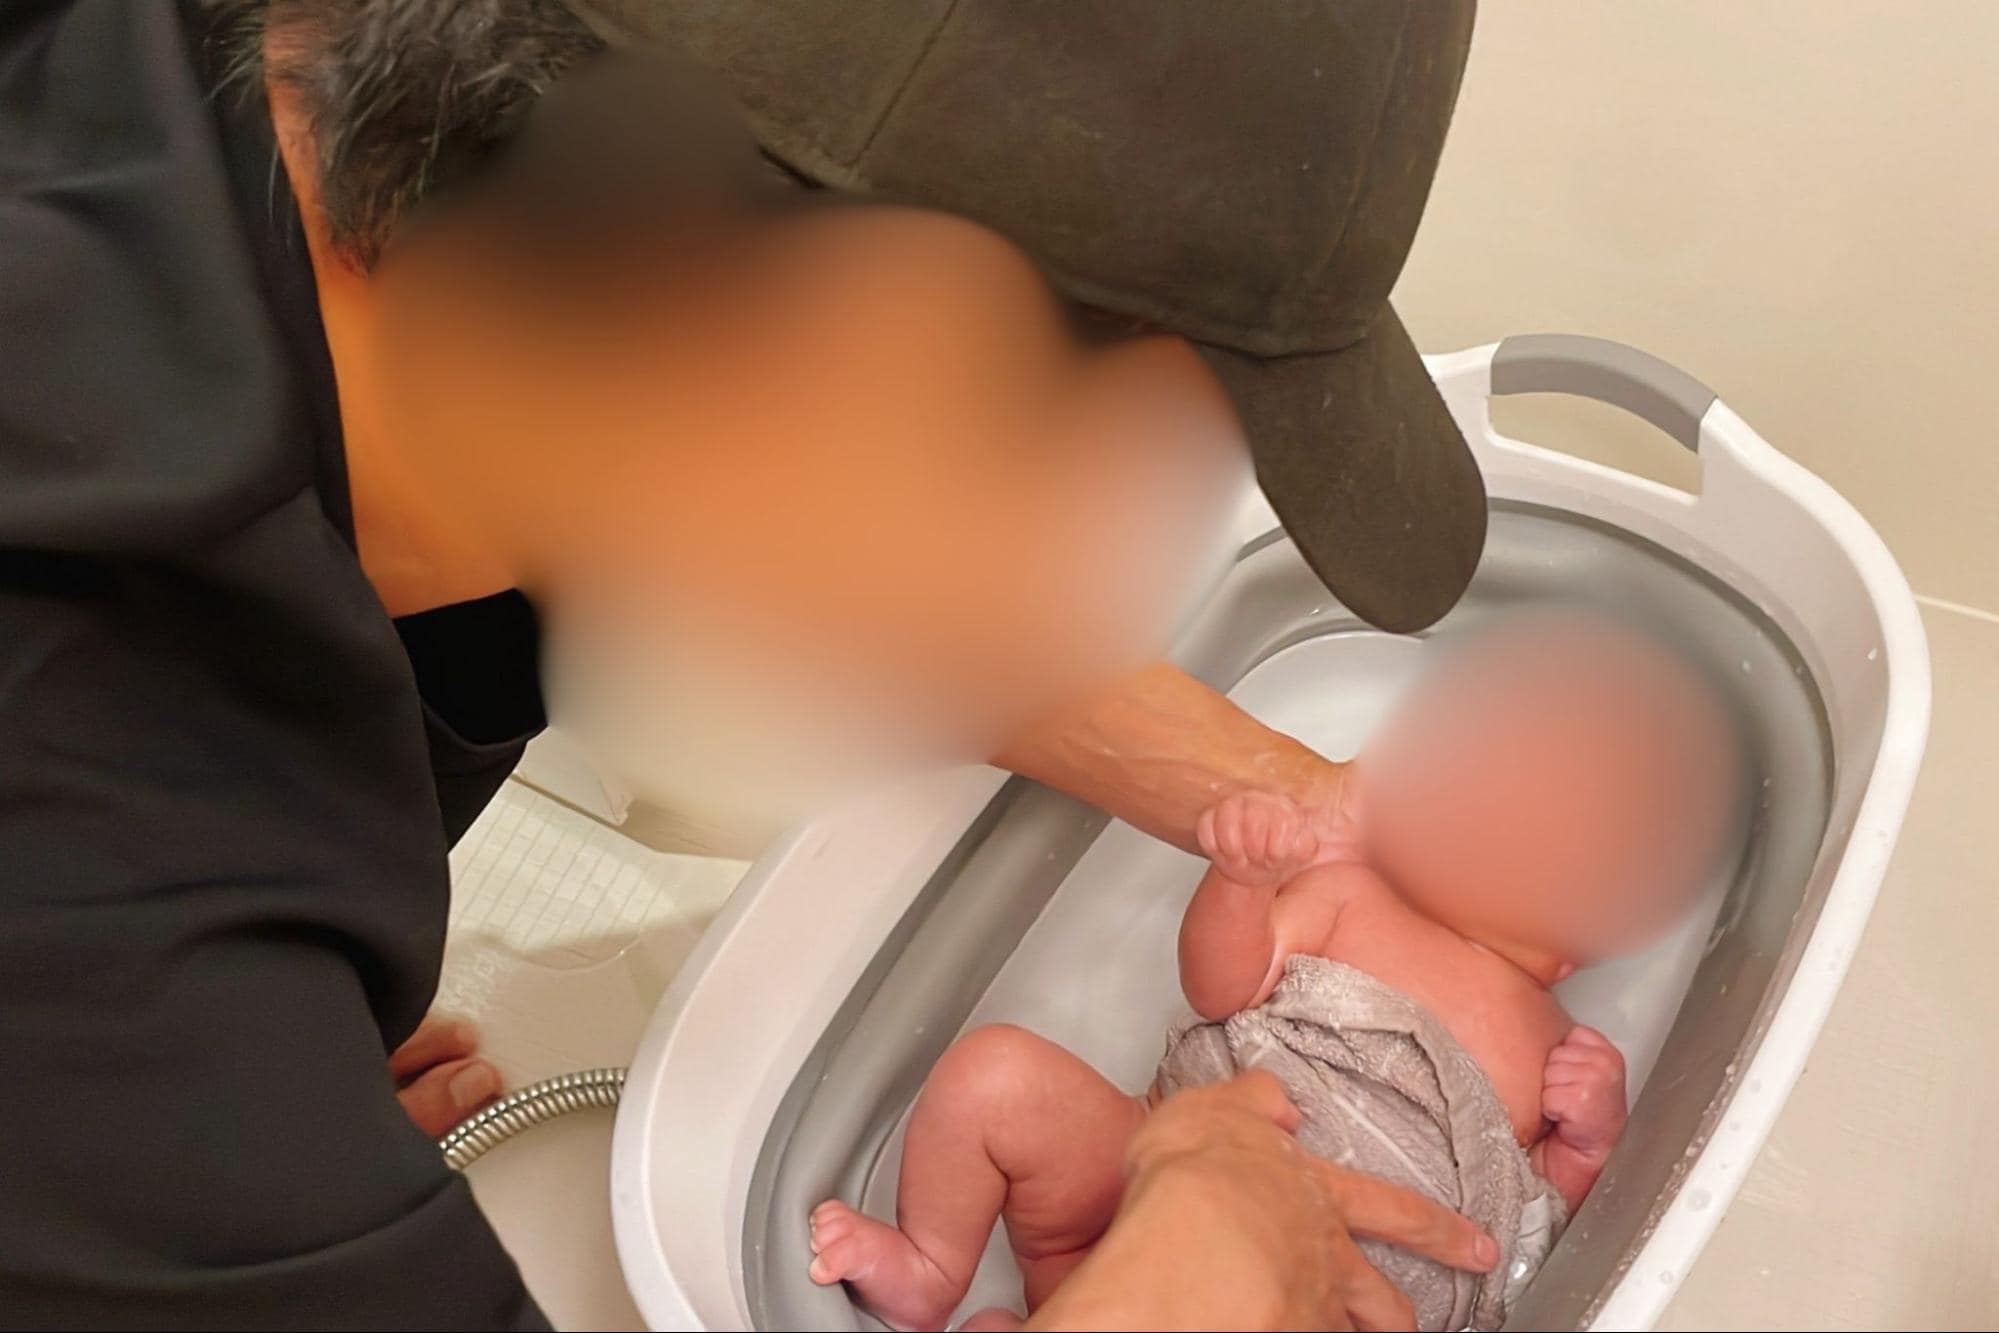 被告の男性医師は生まれた赤ちゃんの沐浴をしたという(原告提供。一部にモザイク加工をしています)
















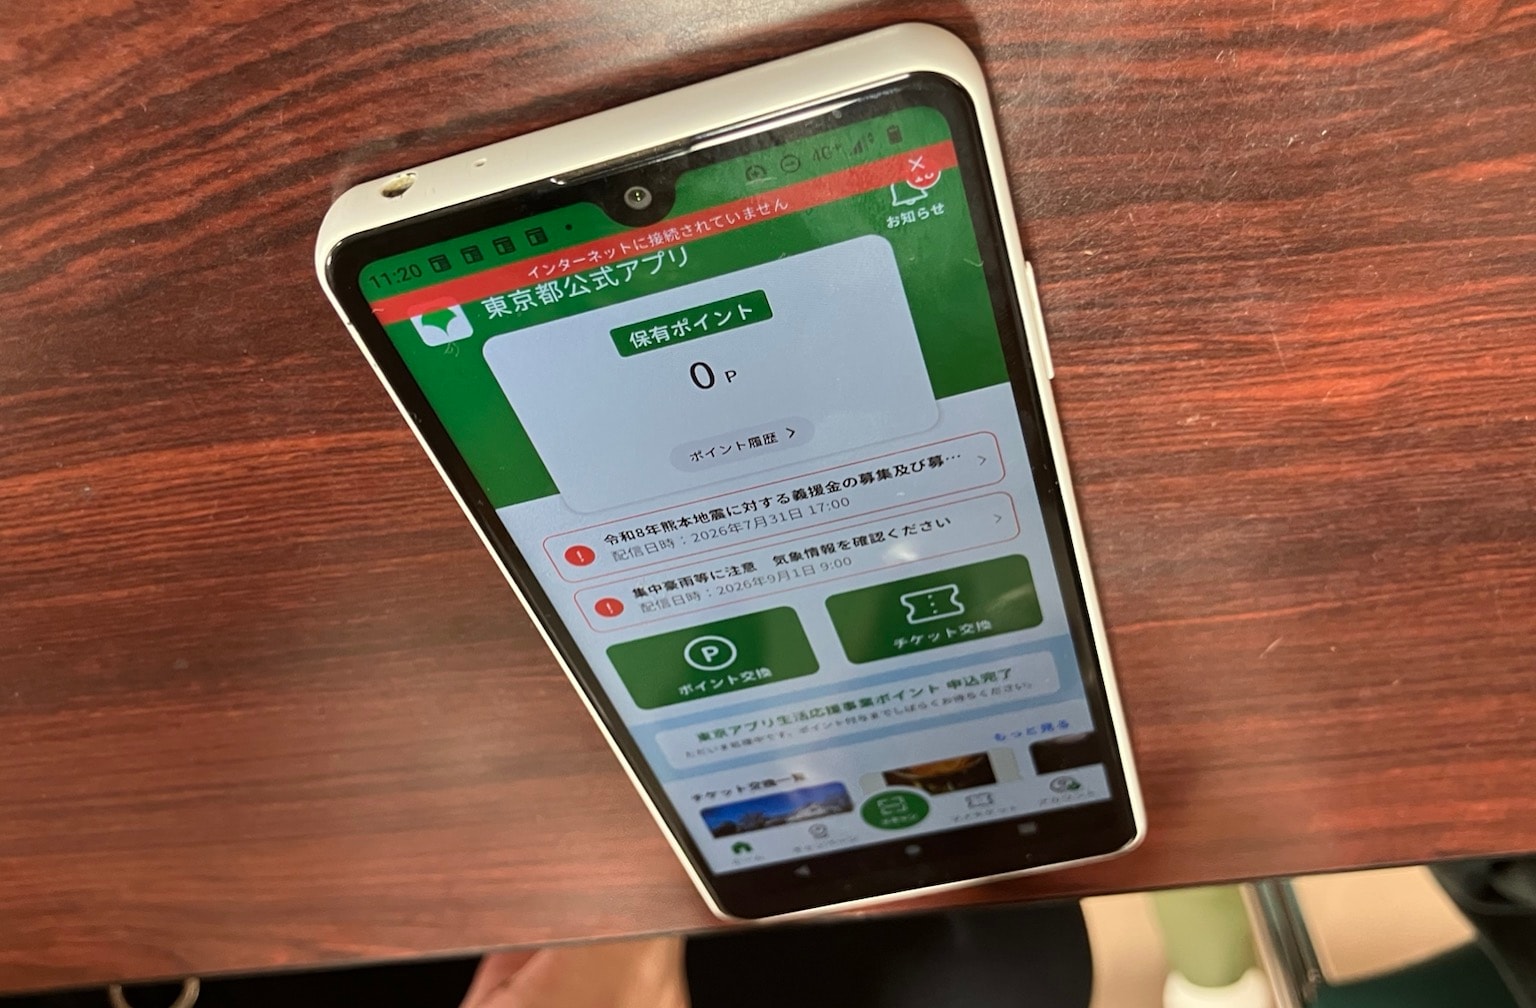 「東京アプリ」の画面(2026年9月2日、東京都江戸川区で、弁護士ドットコムニュース撮影)
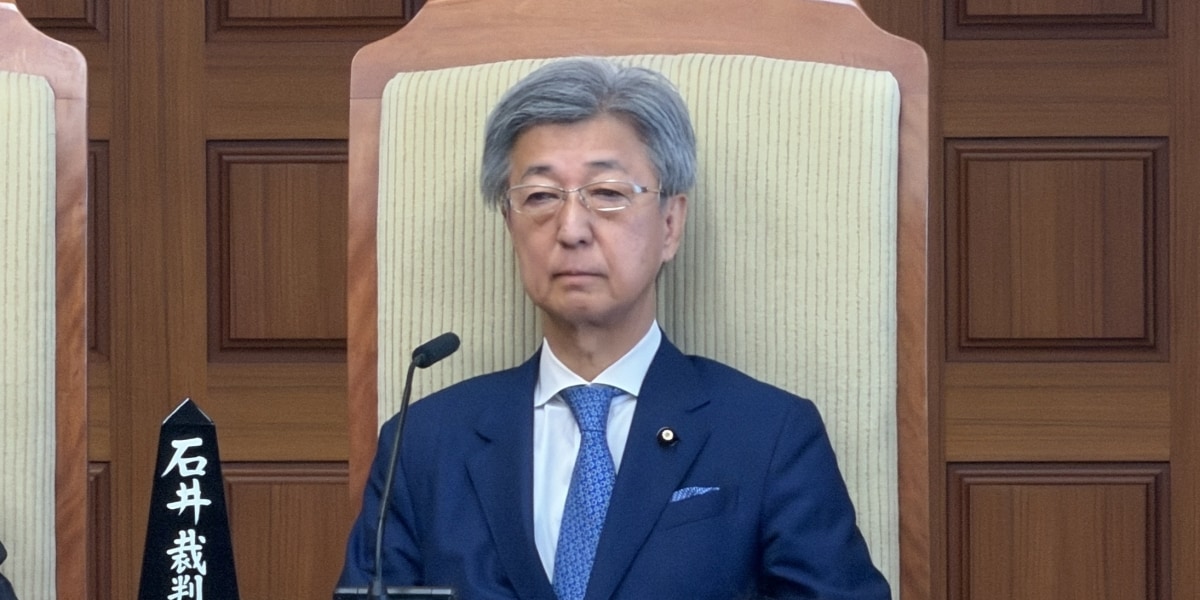
 弾劾裁判所
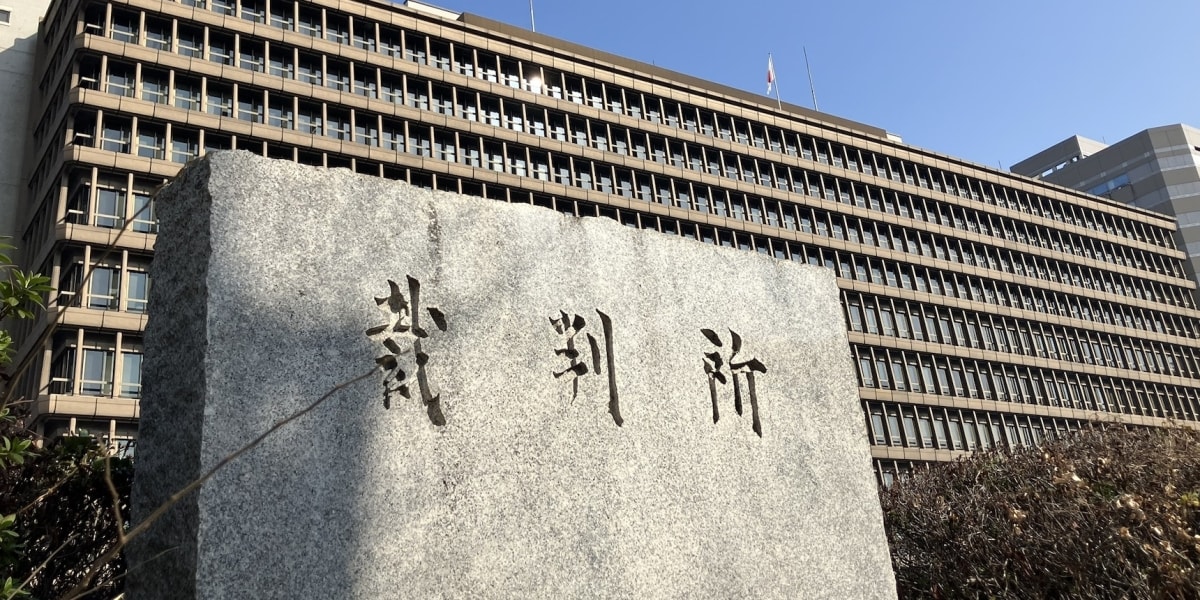
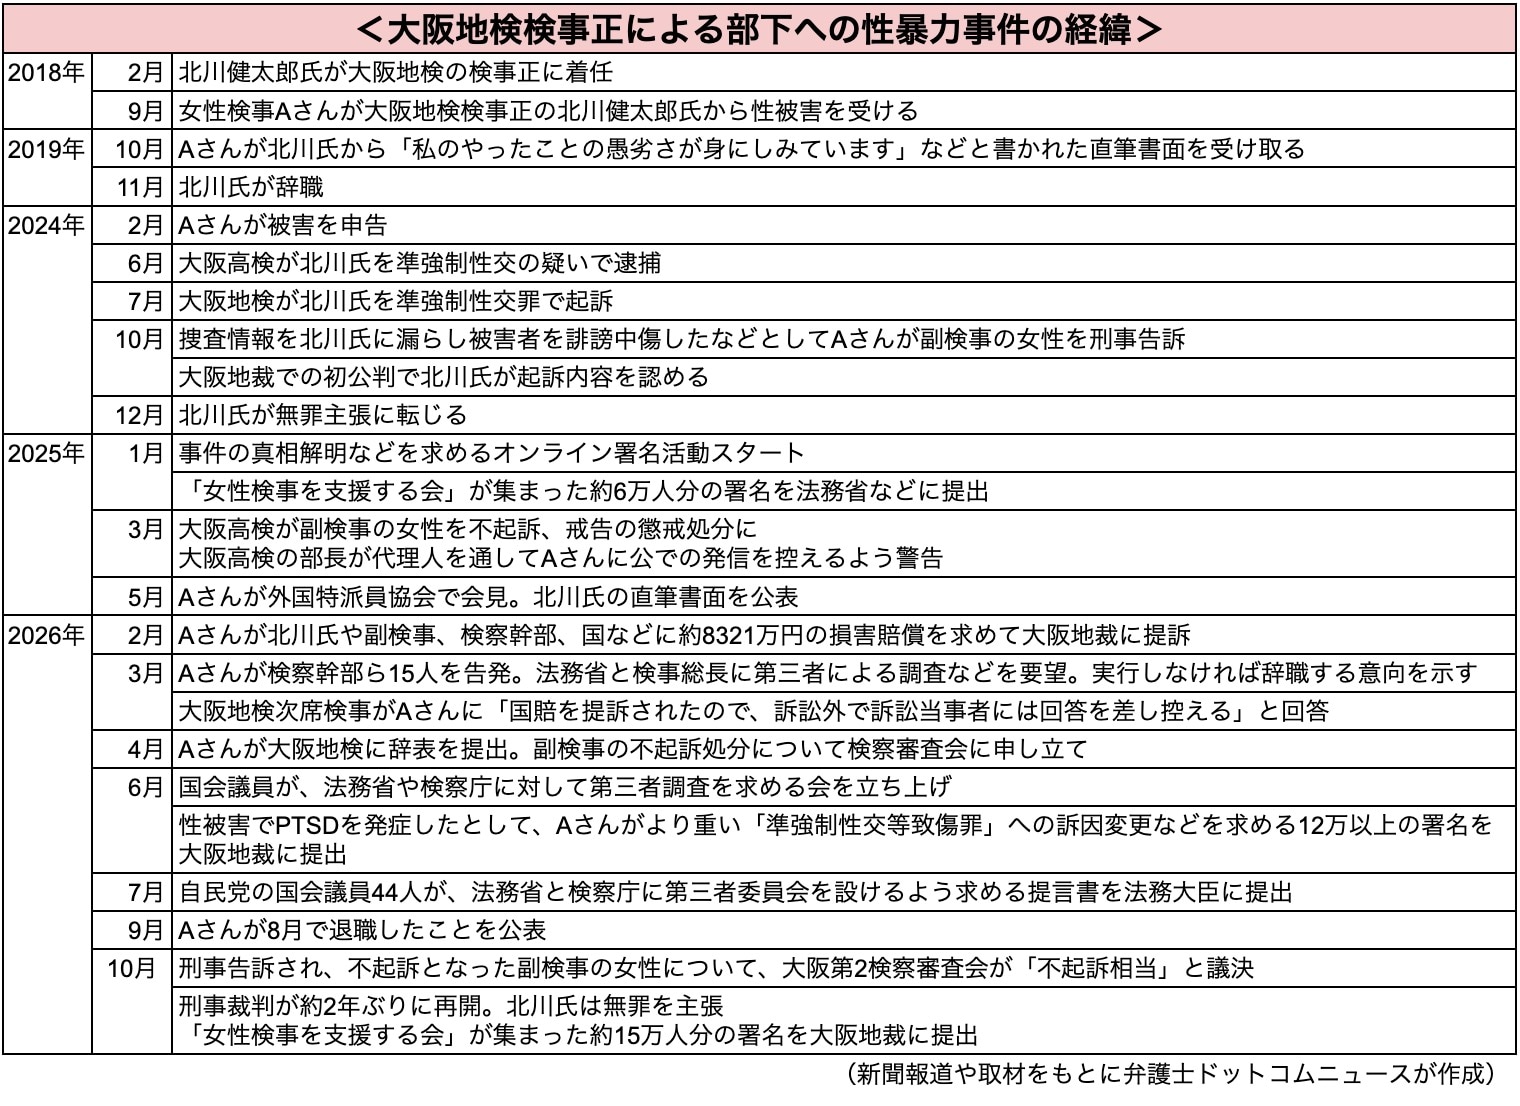 大阪地検トップによる性犯罪事件の経緯(弁護士ドットコムニュース作成)
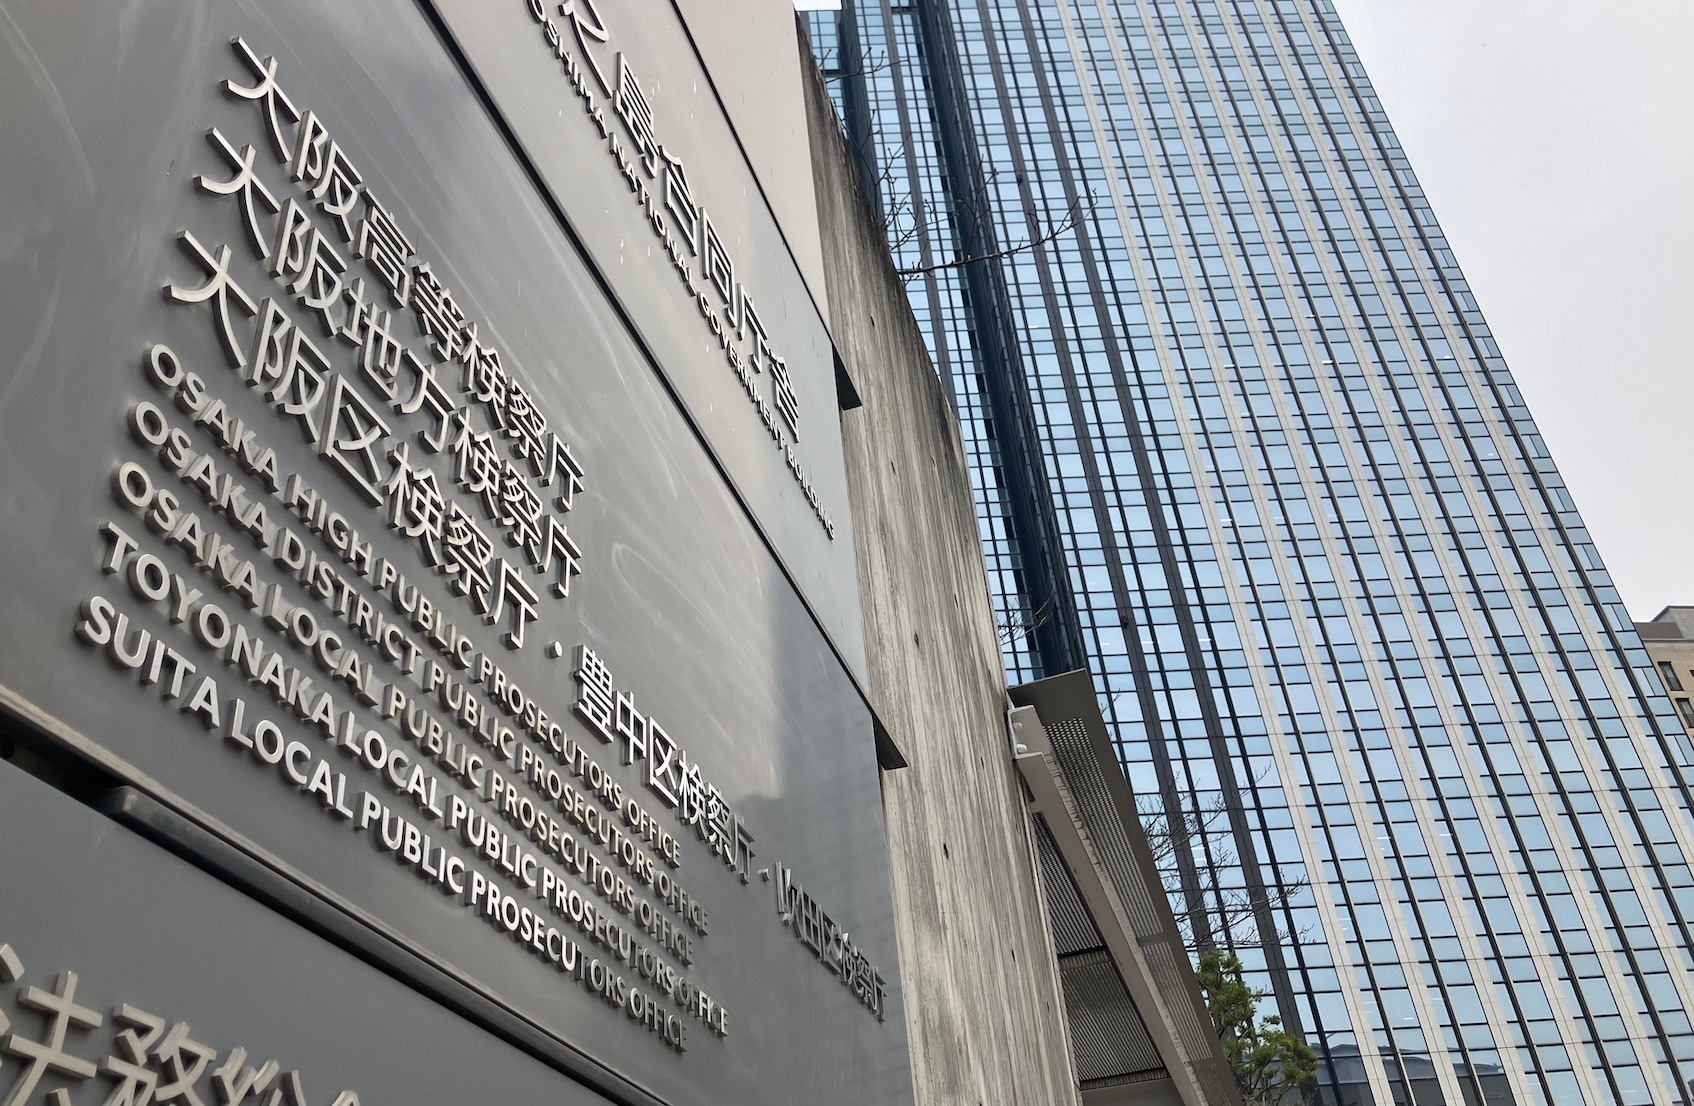 大阪地検や大阪高検が入る庁舎(弁護士ドットコムニュース撮影)

 元検事の女性の代理人を務める奥村弁護士(2026年10月27日、大阪市北区で、弁護士ドットコムニュース撮影)
Prompts
Click prompts to add them under the company line, click again to take one out, then copy the result into your AI chat. Shared by Asian Century Stocks and Uncovered Thai Stocks. Thank you.
Bengo4.com, Inc. (ticker 6027), listed in Japan.
Copied
ETFs Holding Bengo4.com, Inc.
Exchange-traded funds whose newest published daily portfolio holds one of the company's listings, largest weight first.