自己株券買付状況報告書(法24条の6第1項に基づくもの)
Bull 1
Bear 0
Capital return
5851
|
Ryobi Limited is a manufacturing group comprising the parent company and multiple subsidiaries. The company operates through three main business segments: die-casting, building hardware, and printing machinery. In the die-casting segment, it manufactures and sells die-cast products and aluminum castings. The building hardware segment focuses on door closers, hinges, and other architectural metal fittings. The printing machinery segment produces offset printing presses and related peripheral equipment. Key subsidiaries include Ryobi Mirasaka, Ryobi Mitsugi, Tokyo Light Alloy Works, Ikuno, Toyoei Kogyo, Fuji Kogyo, Ryobi Die Casting (USA), Inc., RDCM S. de R.L. de C.V., Ryobi Aluminum Casting (UK) Limited, Ryobi Die Casting (Dalian) Co., Ltd., Ryobi Die Casting (Changzhou) Co., Ltd., Ryobi Die Casting (Thailand) Co., Ltd., Ryobi (Shanghai) Trading Co., Ltd., Ryobi Building Technology (Dalian) Co., Ltd., and Ryobi MHI Graphic Technology. The group also includes subsidiaries engaged in insurance agency and golf course operations. Summarised from the annual report, fiscal year ended Dec 2025 |
Industry Building Products & Equipment | Homepage ryobi-group.co.jp |
| Sector Industrials | IR page ryobi-group.co.jp | |
|
Tags
die-casting, aluminum castings, door closers, hinges, architectural hardware, offset printing presses, printing machinery, Ryobi Mirasaka, Ryobi Mitsugi, Tokyo Light Alloy Works, Ikuno, Toyoei Kogyo, Fuji Kogyo, Ryobi Die Casting (USA) Inc., RDCM S. de R.L. de C.V., Ryobi Aluminum Casting (UK) Limited, Ryobi Die Casting (Dalian) Co. Ltd., Ryobi Die Casting (Changzhou) Co. Ltd., Ryobi Die Casting (Thailand) Co. Ltd., Ryobi (Shanghai) Trading Co. Ltd., Ryobi Building Technology (Dalian) Co. Ltd., Ryobi MHI Graphic Technology, Asahi Sangyo, Ryobi Development
|
Press page ryobi-group.co.jp/news |
Metrics
| Valuation | |
|---|---|
| Market cap | ¥ 85.695B |
| Market cap (USD) | $ 535.598M |
| P/E | 8.09 |
| PEG | 0.25 |
| P/BV | 0.44 |
| P/S | 0.26 |
| P/OCF | 6.17 |
| P/FCF | -12.83 |
| Dividend yield | 3.7% |
| Turnover / mcap | — |
| Returns | |
|---|---|
| ROE | 6.1% |
| ROI | 4.4% |
| ROIC | 3.7% |
| Profit margin | 3.6% |
| Growth | |
|---|---|
| Revenue growing | Yes |
| Profits growing | Yes |
| Revenue up 3y | Yes |
| Revenue up 5y | Yes |
| Earnings growth 3y (net profit CAGR) | 32.7% |
| Quality | |
|---|---|
| Profitable | Yes |
| Margin expanding | No |
| Buying back stock | Yes |
| Diluting (TTM) | No |
| Debt/Equity | — |
| Podcast bulls (TTM) | Sign up |
| Podcast bears (TTM) | Sign up |
| Podcast sentiment (TTM) | Sign up |
| Podcast sentiment % (TTM) | Sign up |
| News sentiment (TTM) | 11 |
| Quality score | 38.9% |
| Insiders | |
|---|---|
| Buys, 1w | Sign up |
| Buys, 1m | Sign up |
| Buys, 1y | Sign up |
| Sells, 1w | Sign up |
| Sells, 1m | Sign up |
| Sells, 1y | Sign up |
Sign up to see this company's insider trades
| Figure | FY 2025 | FY 2024 | FY 2023 | FY 2022 | FY 2021 | FY 2020 | FY 2019 | FY 2018 | FY 2017 | FY 2016 | FY 2015 | FY 2014 | FY 2013 |
|---|---|---|---|---|---|---|---|---|---|---|---|---|---|
| Revenue | 309.111B | 293.314B | 282.693B | 249.521B | 198.073B | 170.973B | 220.519B | 216.187B | 240.502B | 241.251B | 254.508B | 199.697B | 166.566B |
| Net profit | 11.182B | 6.935B | 10.115B | 4.784B | -4.397B | -697M | 4.913B | 8.588B | 8.348B | 8.348B | 9.305B | 4.132B | 2.009B |
| Free cash flow | -6.678B | 15.092B | 9.683B | -92M | 3.049B | -8.496B | 5.74B | 9.056B | 2.549B | — | — | — | — |
| Figure | FY 2025 | FY 2024 | FY 2023 | FY 2022 | FY 2021 | FY 2020 | FY 2019 | FY 2018 | FY 2017 | FY 2016 | FY 2015 | FY 2014 | FY 2013 |
|---|---|---|---|---|---|---|---|---|---|---|---|---|---|
| Share price | 2.74K | 2.271K | 2.658K | 1.146K | 1.016K | 1.251K | 1.956K | 2.629K | 484.51 | 2.423K | 2.217K | 1.572K | 225.91 |
| Price performance 12m | 0.21 | -0.15 | 1.32 | 0.13 | -0.19 | -0.36 | -0.26 | -0.06 | -0.78 | 0.09 | 0.41 | 5.96 | — |
Filed figures
Lines the statements and their notes report beside the headline figures, read from the filings' XBRL as filed (no restatement applied), with figures computed from one filing's own lines. Cash-flow lines carry their cash direction: an outflow is negative. Each period links to its filing; a figure's period, report date and tag are in its tooltip.
| Figure | Mar 2017 | Mar 2018 | Dec 2018 | Dec 2019 | Dec 2020 | Dec 2021 | Dec 2022 | Dec 2023 | Dec 2024 | Dec 2025 |
|---|---|---|---|---|---|---|---|---|---|---|
| Balance sheet detail | ||||||||||
| Trade receivables (JPY) | 57.5B | 63.2B | 58.4B | 41.2B | 40.2B | 44.3B | 117B | 129B | 119B | 131B |
| ↳ YoY growth | +4.5% | +9.9% | -29.4% | -2.5% | +10.4% | +163.2% | +10.2% | -7.4% | +10.0% | |
| ↳ 5y CAGR | +17.1% | +23.7% | +26.7% | |||||||
| Borrowings, current (JPY) | 50.2B | 38.3B | 32.3B | 32.5B | 37.3B | 51B | 46.5B | 46.2B | 40.7B | 38.1B |
| Borrowings, non-current (JPY) | 23.9B | 32B | 29.7B | 29.4B | 35.2B | 22.8B | 27.9B | 24B | 21.3B | 36.7B |
| Bonds payable (JPY) | 6.9B | 8.4B | 8.4B | 8.4B | 6.1B | 1.5B | — | — | — | — |
| Cash and deposits (JPY) | 17.4B | 23.2B | 20.8B | 22.5B | 26.6B | 28.5B | 27.3B | 27.6B | 29.3B | 31.2B |
| Intangible assets (JPY) | 3.01B | 3.05B | 3.5B | 3.72B | 3.48B | 3.16B | 2.8B | 2.62B | 3.15B | 2.67B |
| Net debt (borrowings + leases - cash) (JPY) | 56.8B | 47.2B | 41.1B | 39.4B | 45.9B | 45.2B | 47B | 42.6B | 32.7B | 43.6B |
| Cash flow detail | ||||||||||
| Operating cash flow (JPY) | 18.6B | 23.6B | 24.7B | 30.3B | 11.8B | 14.9B | 16.8B | 26B | 29.2B | 13.9B |
| Purchases of property, plant and equipment (JPY) | -16B | -18.4B | -15.6B | -24.6B | -20.3B | -11.9B | -16.9B | -16.3B | -14.1B | -20.6B |
| Change in receivables (cash effect) (JPY) | -3.92B | -8.23B | 4.55B | 16.2B | 819M | -2.52B | -12B | -4.36B | 7.38B | -5.29B |
| Change in inventories (cash effect) (JPY) | -2.77B | -1.71B | -3.63B | 1.66B | 3.38B | -9.21B | -1.54B | -2.77B | -3.49B | 4.39B |
| Change in payables (cash effect) (JPY) | 357M | 7.54B | -662M | -9.48B | -6.48B | 11.9B | 4.07B | 3.64B | -3.18B | -12.4B |
| Dividends paid (cash effect) (JPY) | -1.62B | -1.62B | -2.26B | -2.27B | -1.14B | -328M | -973M | -1.94B | -2.83B | -2.99B |
| Share buybacks (cash effect) (JPY) | 0.00 | -1M | 0.00 | 0.00 | 0.00 | 0.00 | 0.00 | 0.00 | 0.00 | -1.5B |
| Interest paid (cash effect) (JPY) | -1.38B | -1.16B | -1.14B | -1.02B | -958M | -904M | -1.01B | -1.2B | -1.6B | -1.37B |
| Income taxes paid (cash effect) (JPY) | -3.36B | -2.06B | -2.61B | -835M | -1.34B | -773M | -835M | -1.77B | -3.23B | -6.36B |
| Operating cash flow before change in receivables (JPY) | 22.5B | 31.8B | 20.1B | 14.1B | 11B | 17.4B | 28.8B | 30.4B | 21.8B | 19.2B |
| Free cash flow (OCF - PPE - intangibles) (JPY) | 2.55B | 5.2B | 9.06B | 5.74B | -8.5B | 3.05B | -92M | 9.68B | 15.1B | -6.68B |
| Income detail | ||||||||||
| Research and development expense (JPY) | 2.05B | 1.93B | 1.16B | 1.51B | 1.36B | 1.15B | 1.14B | 1.29B | 1.29B | 1.86B |
| ↳ 5y CAGR | +2.3% | -3.1% | +6.5% | |||||||
| Total comprehensive income (JPY) | 6.94B | 10B | 3.17B | 5.7B | -2.45B | 6.13B | 12.2B | 19B | 19.2B | 17.1B |
| Comprehensive income to owners (JPY) | 6.16B | 9.46B | 2.89B | 5.39B | -2.25B | 6.09B | 11.8B | 18.4B | 18.8B | 16.6B |
| Provision for credit losses (JPY) | -24M | -4M | 219M | -211M | -14M | -6M | 2M | 4M | -2M | -78M |
| Credit cost ratio (credit losses / average receivables) (%) | 0.0% | 0.0% | — | 0.4% | 0.0% | 0.0% | 0.0% | 0.0% | 0.0% | 0.1% |
| Reported | Jun 23, 2017 | Jun 22, 2018 | Mar 28, 2019 | Mar 27, 2020 | Mar 26, 2021 | Mar 29, 2022 | Mar 29, 2023 | Mar 27, 2024 | Mar 26, 2025 | Mar 25, 2026 |
Sign up to see institutional holdings
Sign UpPodcast Mentions
Sign up to see podcast mentions and sentiment
Sign UpTimely disclosures published on TDnet, newest first, titles as filed in Japanese. The link opens the disclosure on TDnet. Filings with EDINET (periodic reports, extraordinary reports, offerings, holding and buy-back reports), newest first, titles as filed in Japanese. The link opens the filing on EDINET. Press releases from the company's own website, newest first.
2026年12月期 第3四半期決算短信〔日本基準〕(連結)
Bull 0
Bear 1
Results
「2026 日本ダイカスト会議・展示会(j-dec 2026)」への出展について
Bull 1
Bear 0
Product/operations
リョービ株式会社は、2026年11月12日(木)から14日(土)までパシフィコ横浜で開催される「2026 日本ダイカスト会議・展示会(j-dec 2026)」に出展します。2年に1度開催される本展は、ダイカストに関する最先端の技術や情報が集結する日本唯一の展示会として、最新の生産設備やシステム、サービスなどが幅広く紹介されます。
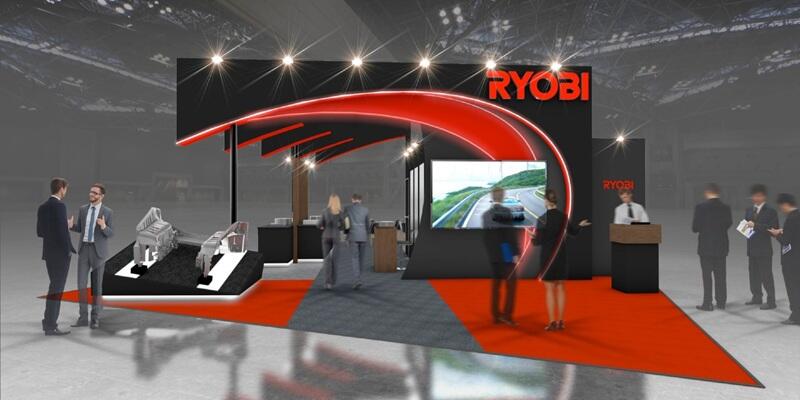
展示ブースイメージ
アルミダイカストで「クルマを軽く」
リョービは社会のさまざまな負荷を軽減していきたいという思いを込めて、「セカイヲ軽クスルカンパニー」をテーマに掲げています。主力のダイカスト事業では、軽量で耐久性に優れたアルミダイカスト製品を自動車メーカー各社に供給し、自動車の軽量化に貢献しています。
本展では、電動車向けに開発した製品やボディ・シャシーの量産品などを多数展示します。また、2025年3月に稼働を開始した「ギガキャスト」による試作サービス(設計、試作金型、試作品)についても実例を交えて紹介します。リョービは、自動車のアルミ化・軽量化と部品点数の削減を実現するアルミダイカストで、「クルマを軽く」するための新しい可能性をご提案いたします。
皆様のご来場を心よりお待ちしております。
主な展示内容
- 超大型ダイカストマシンの導入と「ギガキャスト」による試作サービス、開発サポートの紹介
- 新地金に迫る材料特性を実現したアルミ二次合金の開発(サンプル:ステアリングナックル)
- 接合技術の紹介(レーザ溶接、FSW、他)
- 軽量化ニーズに応えるボディ・シャシー関連製品
ご入場には、展示会公式サイトにて「事前来場登録」が必要です。詳しくは公式サイト をご覧ください。
展示会概要
| 展示会名 | 2026 日本ダイカスト会議・展示会(略称:j-dec 2026) |
| 開催日時 | 2026年11月12日(木)~14日(土) 9:00~17:00(12日は9:30開場、14日は13:00閉場) |
| 会場 | パシフィコ横浜 展示ホールC・D 神奈川県横浜市西区みなとみらい1-1-1 |
| 主催 | 一般社団法人 日本ダイカスト協会 |
| 入場料 | 無料(事前来場登録制) https://j-dec.pregis.jp/ja |
| 来場登録 | ご入場には「事前来場登録」が必要です。必ず公式サイトにて登録を済ませてご来場ください。 登録がない場合は入場できません。 |
| 当社ブース | No. F-30 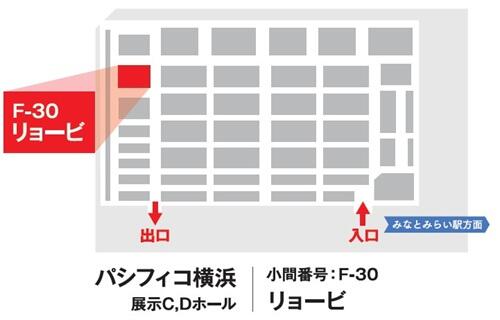 |
 セカイヲ軽クスルカンパニー
 適正な取引の推進
 採用情報
Copyright © 2017 Ryobi Limited. All Rights Reserved.
無断複製・転載等を禁止します。




Prompts
Click prompts to add them under the company line, click again to take one out, then copy the result into your AI chat. Shared by Asian Century Stocks and Uncovered Thai Stocks. Thank you.
Ryobi Limited (ticker 5851), listed in Japan.
Copied
ETFs Holding Ryobi Limited
Exchange-traded funds whose newest published daily portfolio holds one of the company's listings, largest weight first.
| ETF | Weight in ETF | Shares | Market value | As of |
|---|---|---|---|---|
| DISV | 0.06% | 189,000 | $ 3.033M | Nov 12, 2026 |
| AVDV | 0.05% | 632,100 | $ 10.153M | Nov 16, 2026 |
| DFIS | 0.02% | 64,200 | $ 1.03M | Nov 12, 2026 |
| DXIV | 0.01% | 2,100 | $ 33.7K | Nov 12, 2026 |
| AVDS | 0.01% | 2,800 | $ 44.976K | Nov 16, 2026 |
| DFIC | 0.00% | 42,400 | $ 680.415K | Nov 12, 2026 |
| DFAX | 0.00% | 23,001 | $ 369.109K | Nov 12, 2026 |
| DFAI | 0.00% | 17,600 | $ 282.437K | Nov 12, 2026 |
| AVDE | 0.00% | 25,900 | $ 416.029K | Nov 16, 2026 |