|
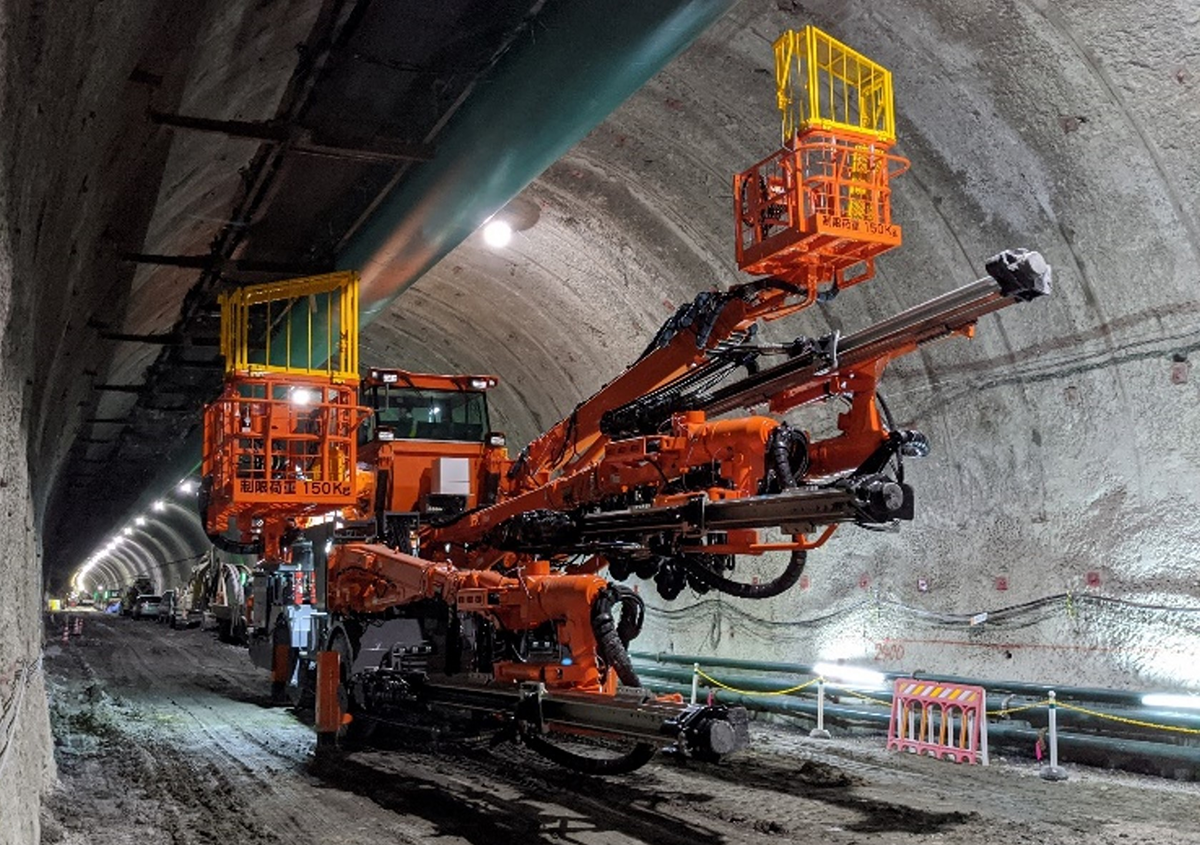
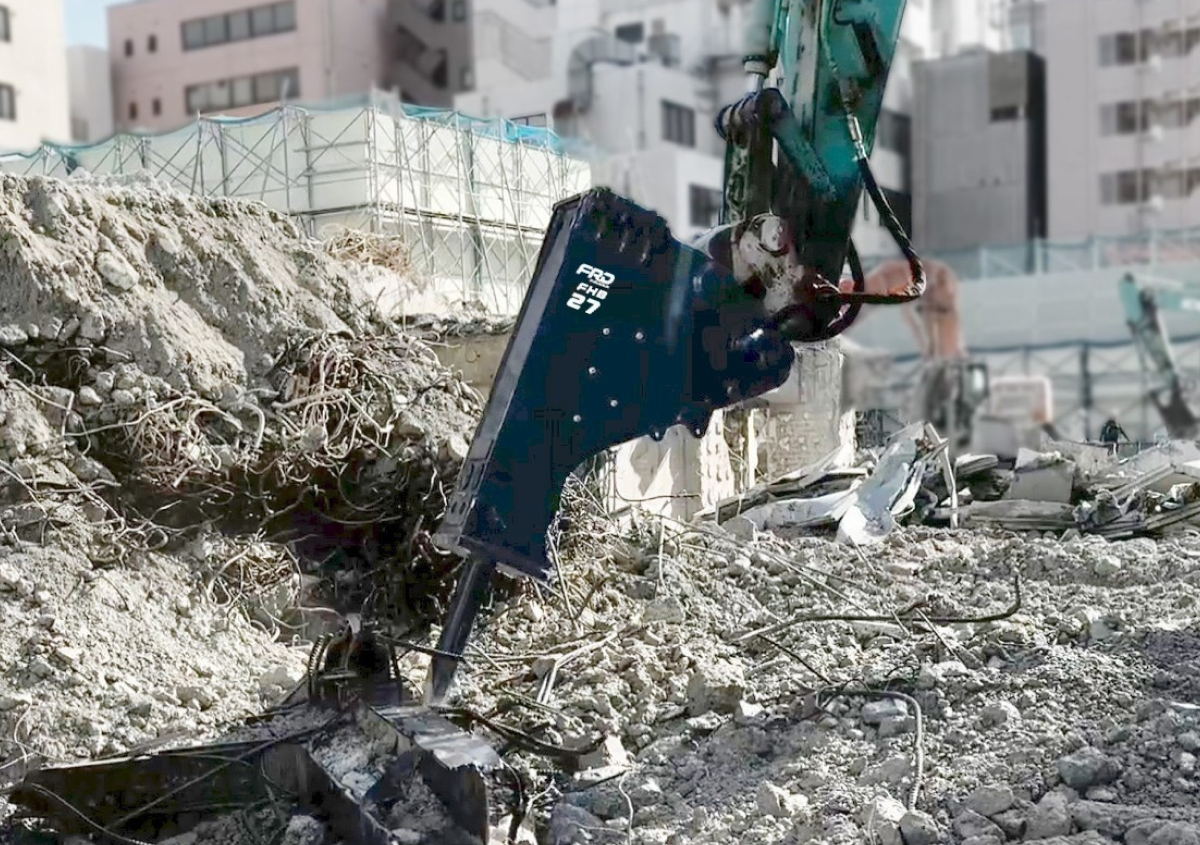
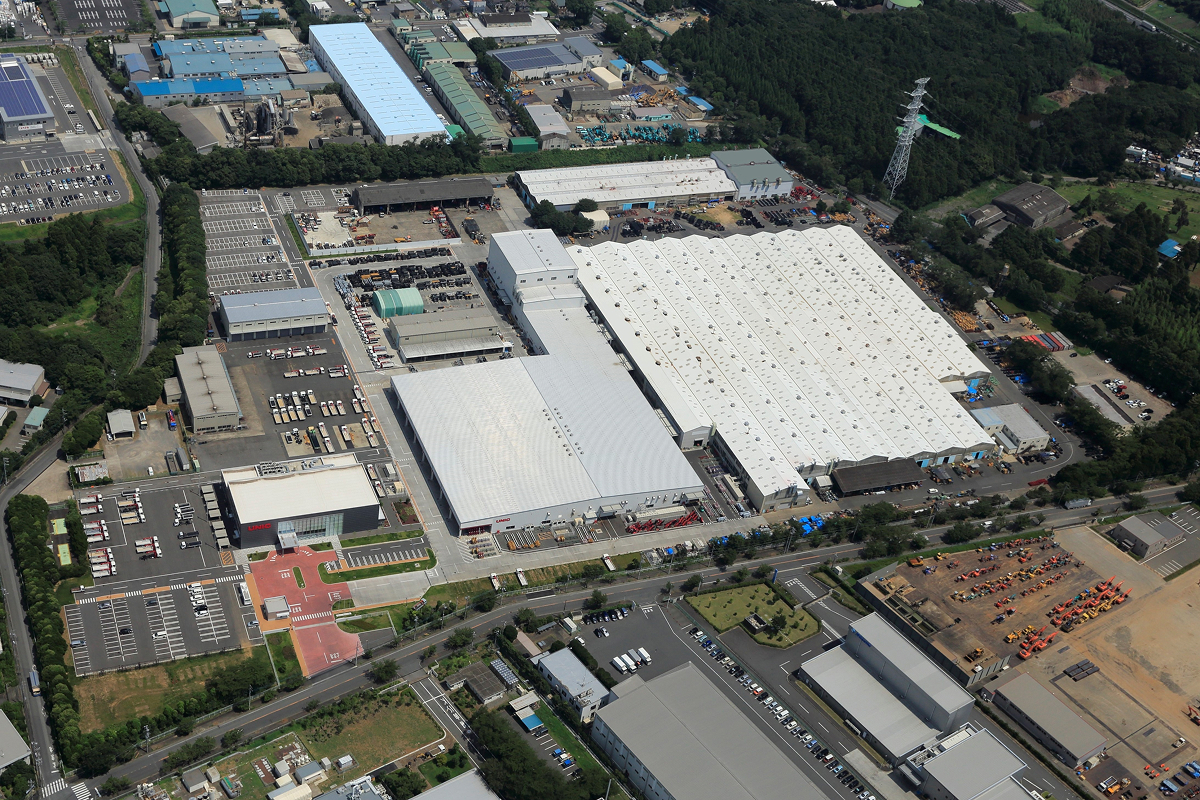
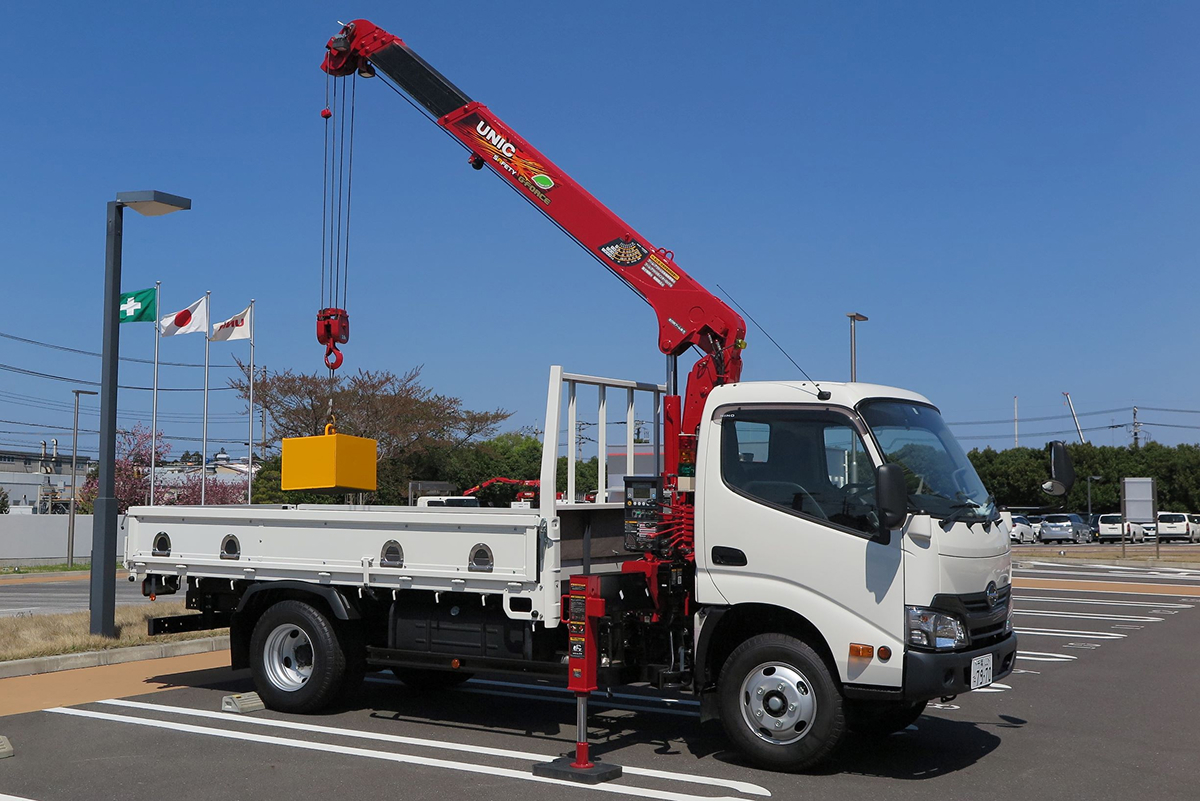
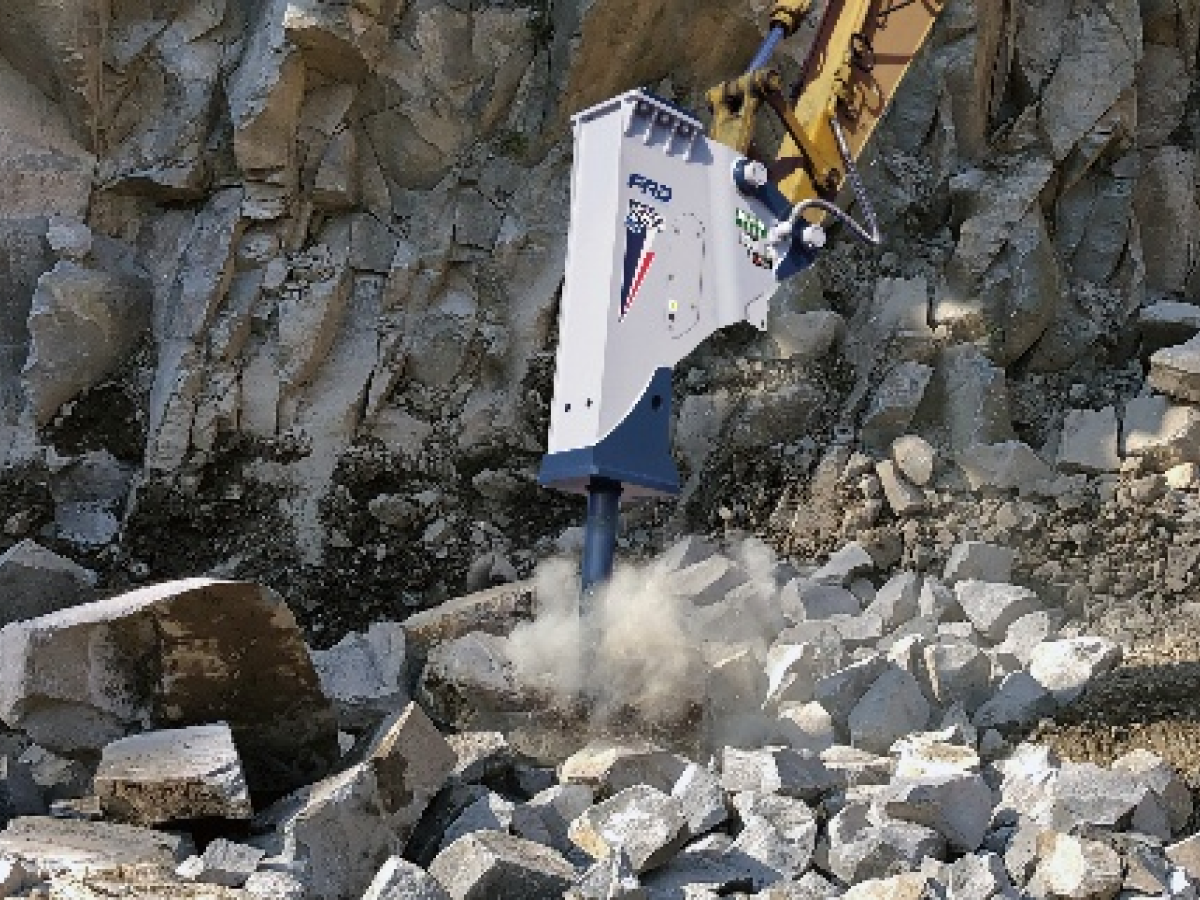
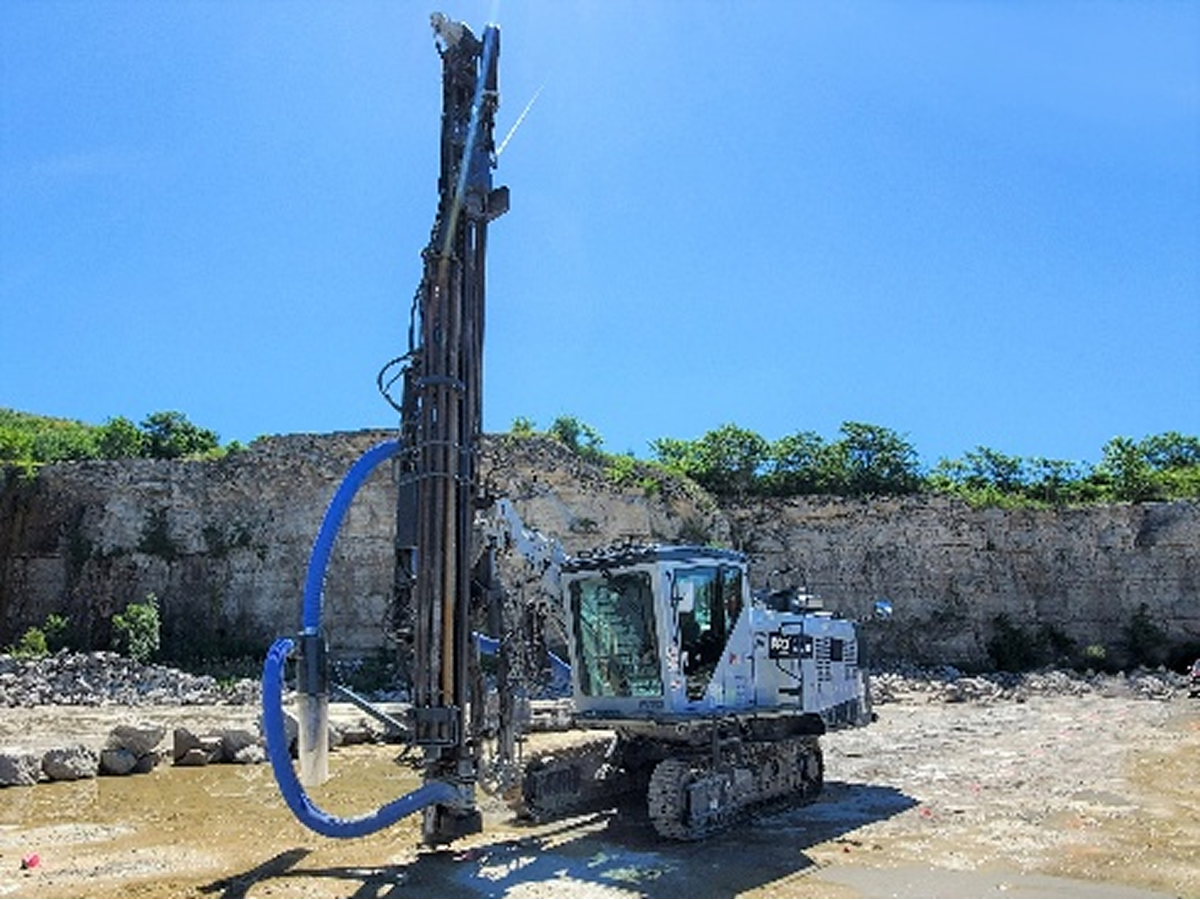
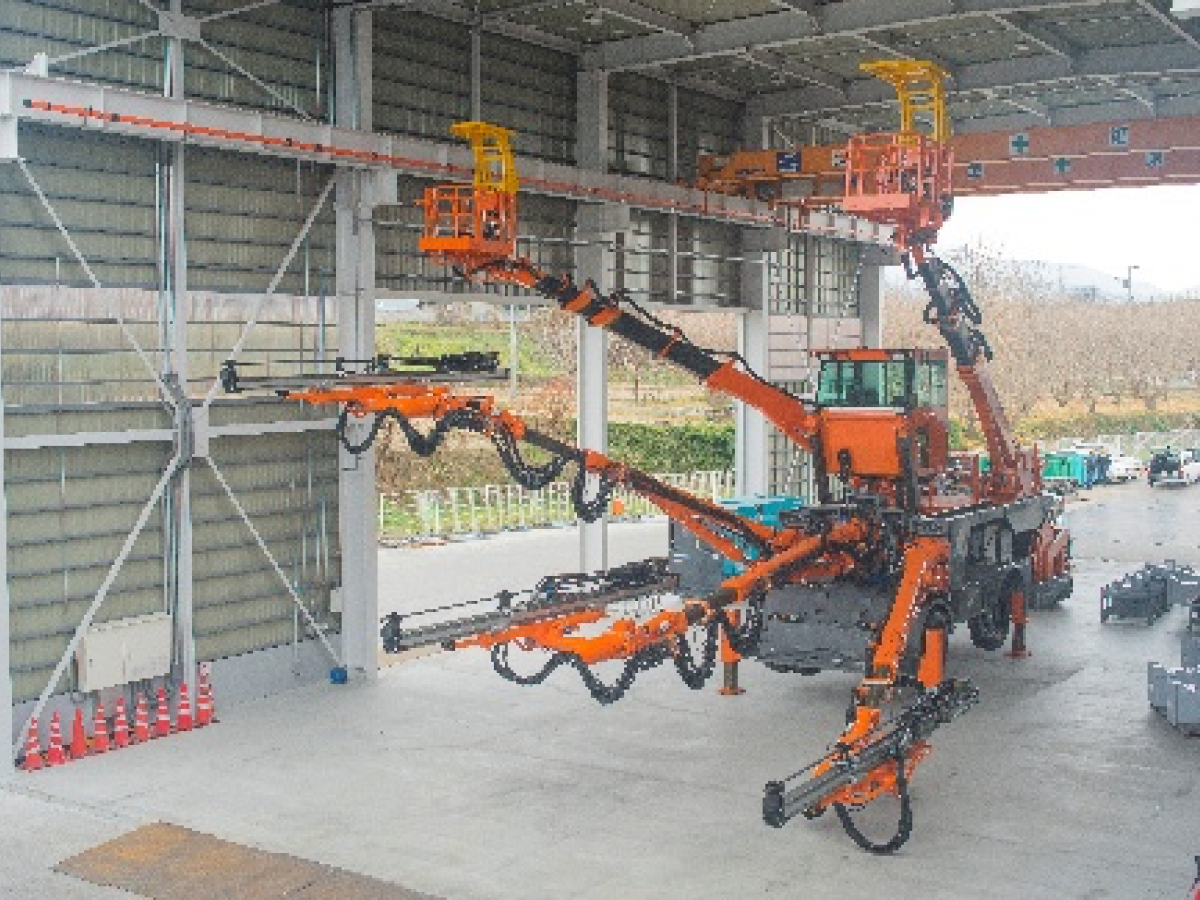
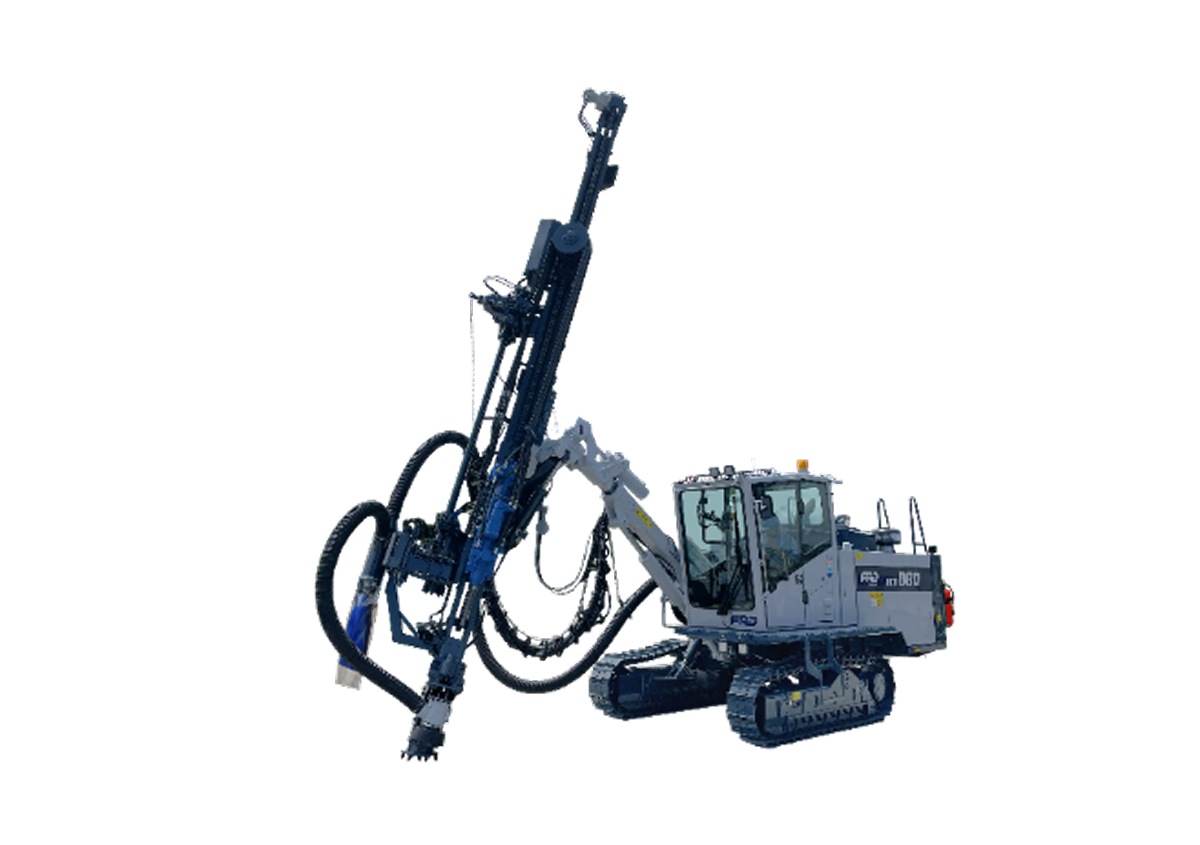
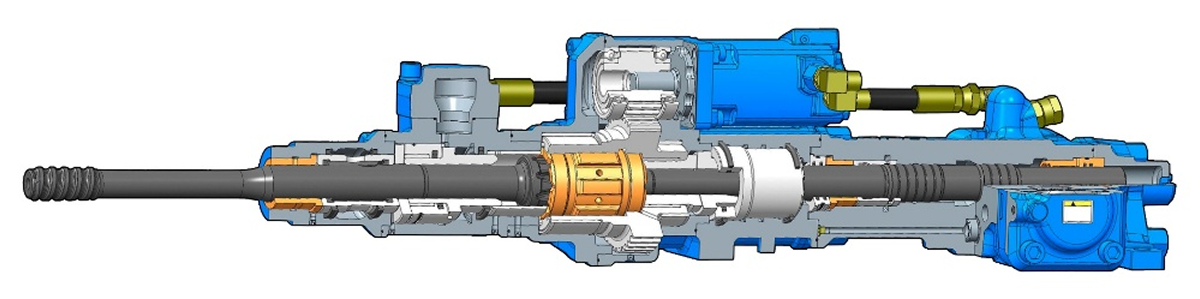
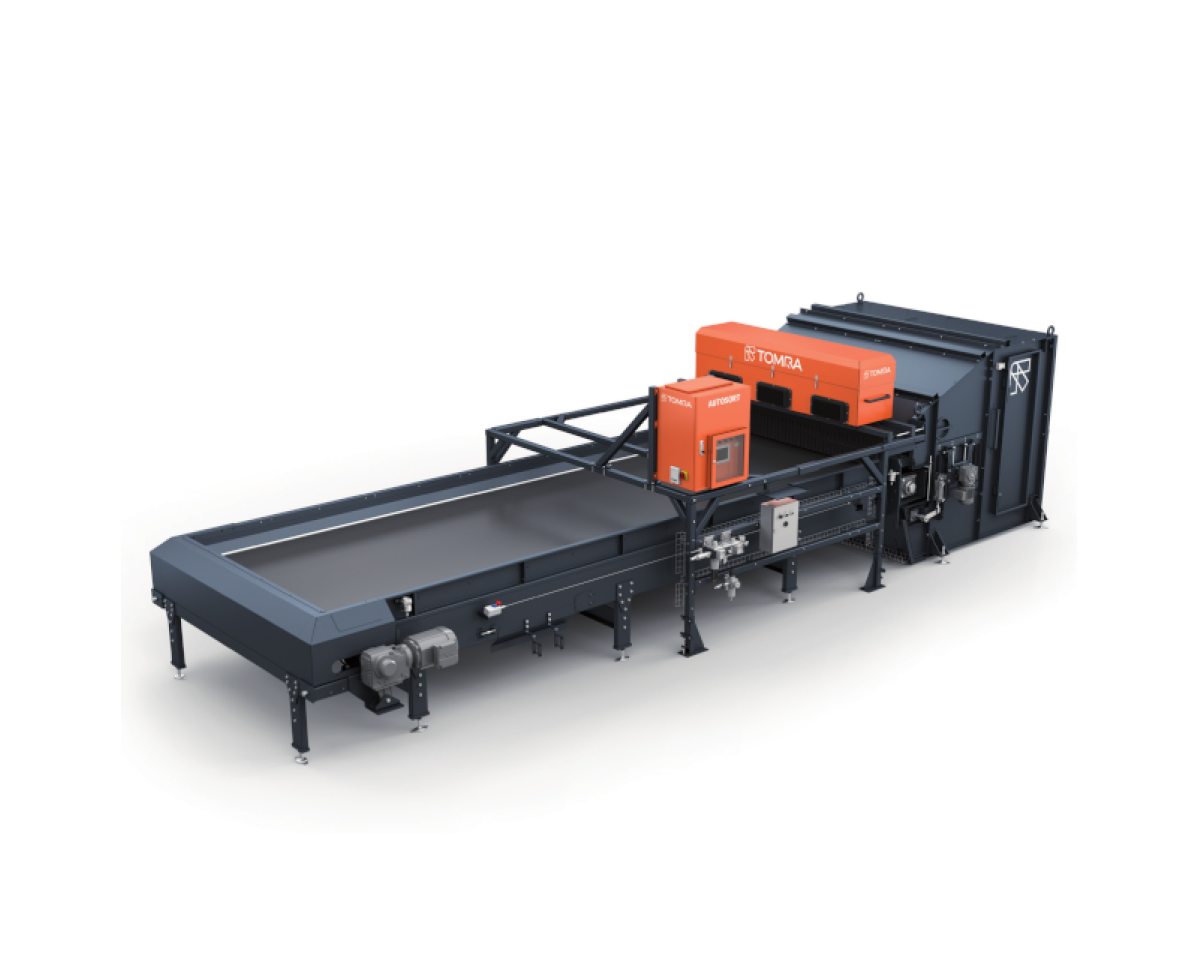
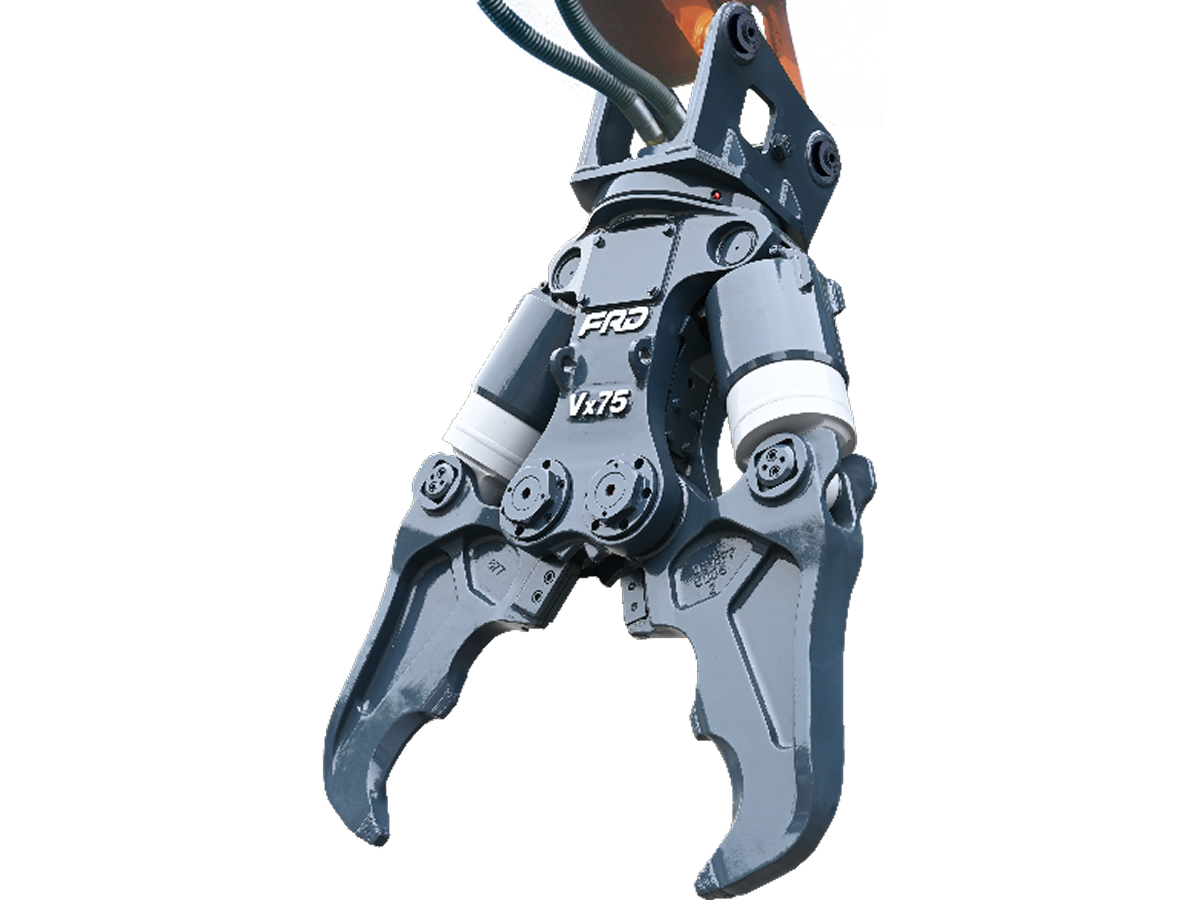
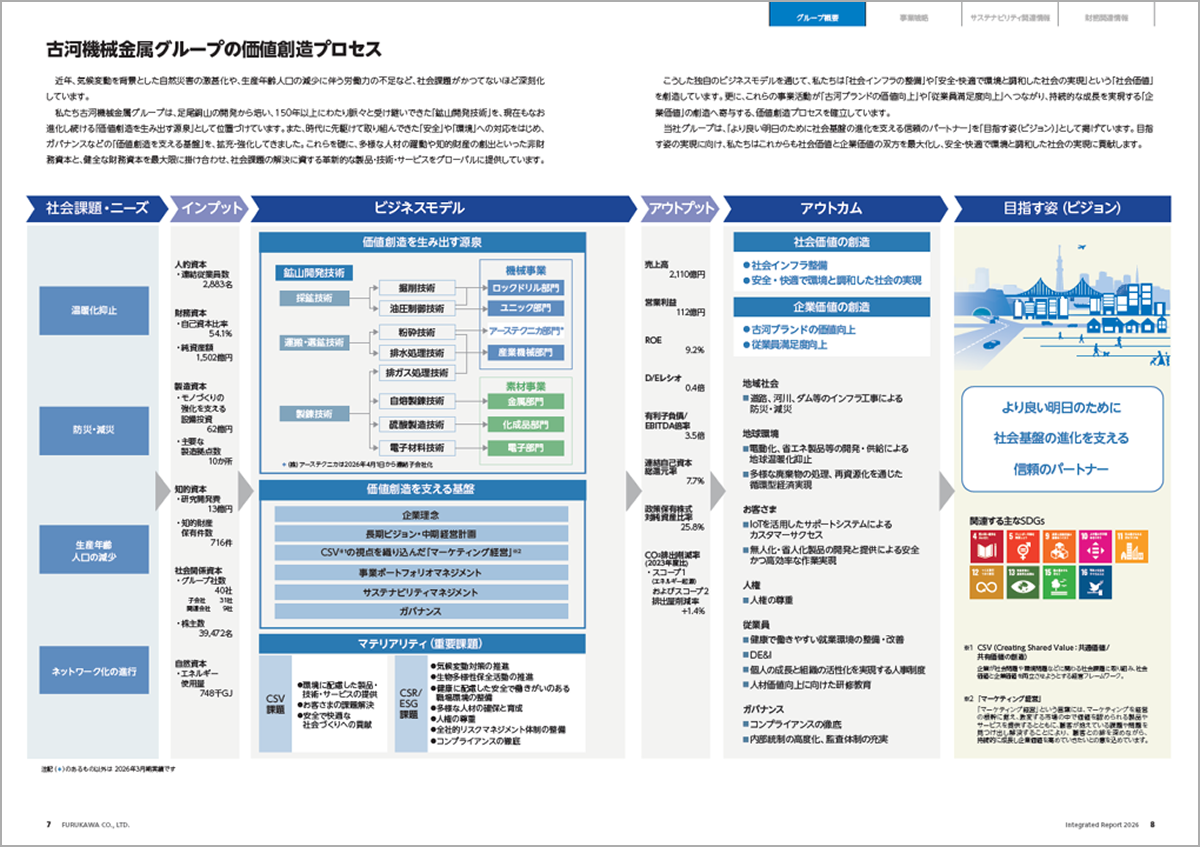
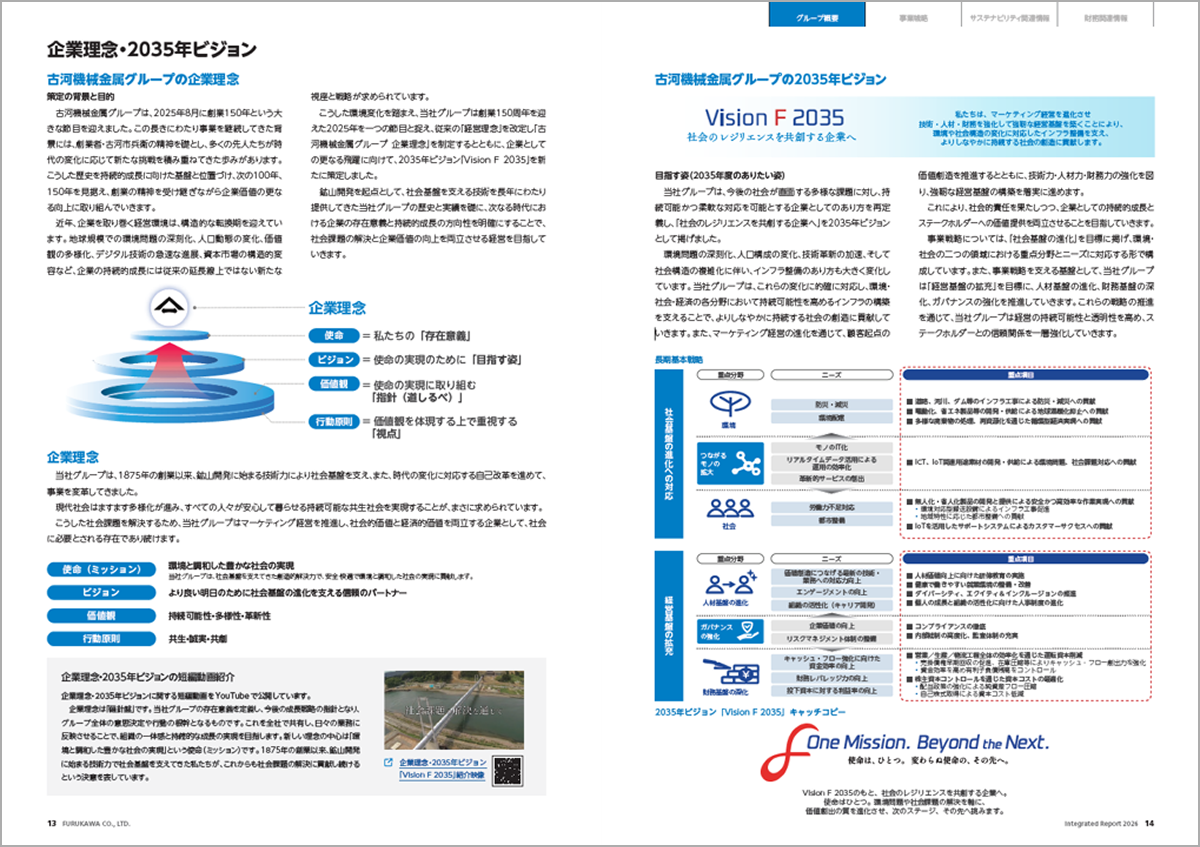
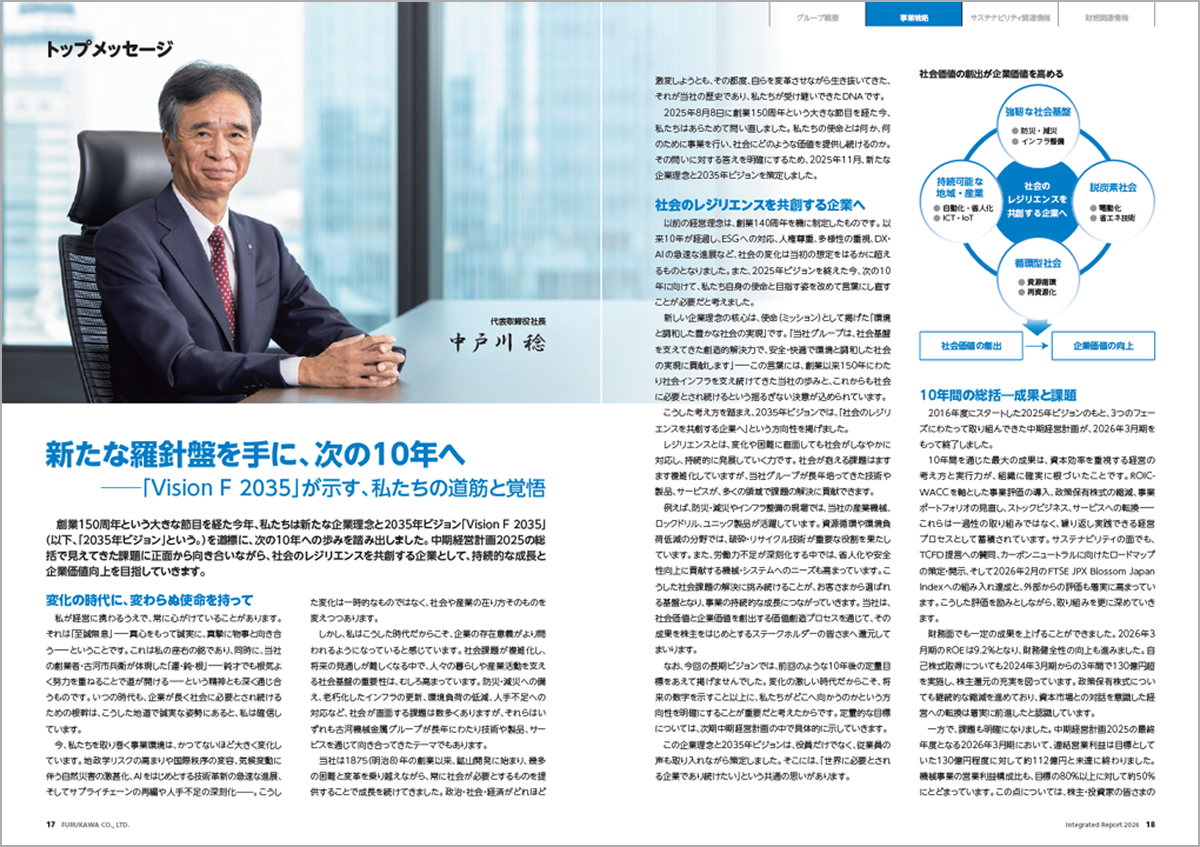
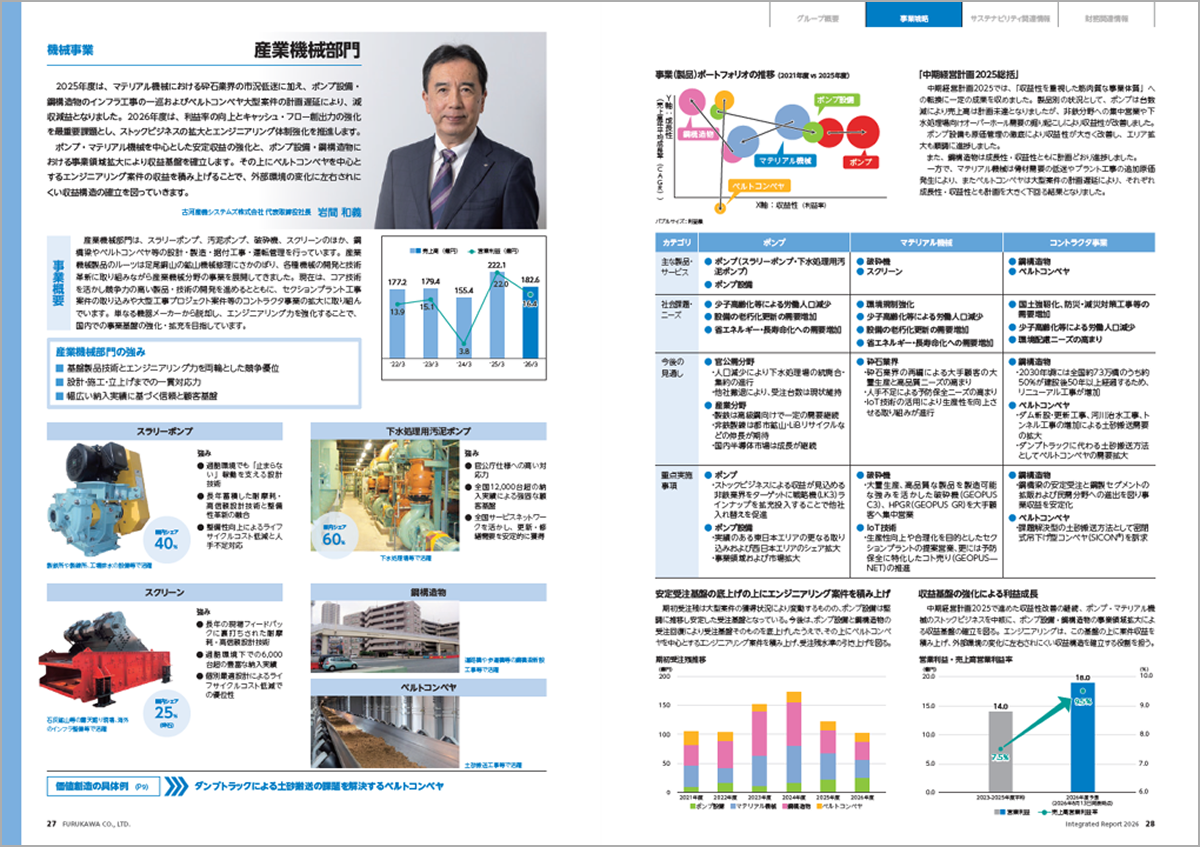
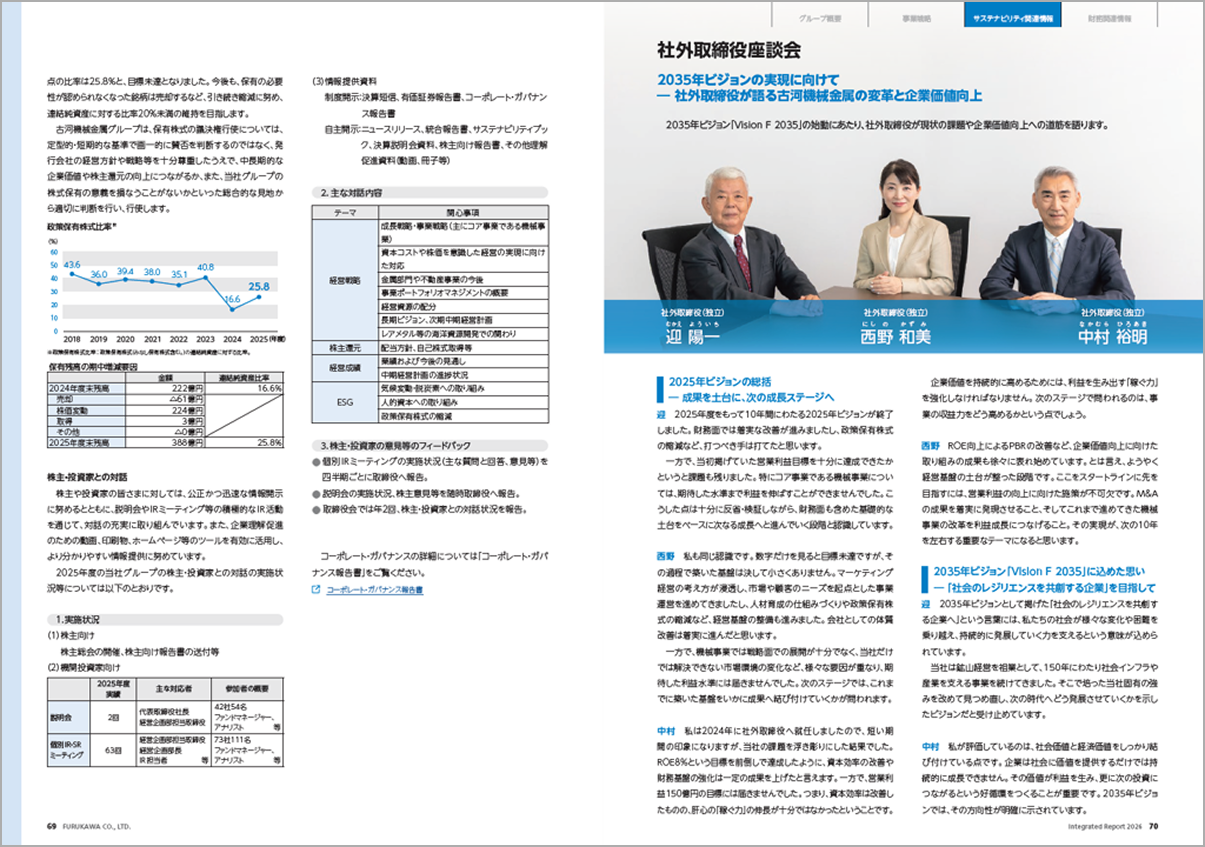
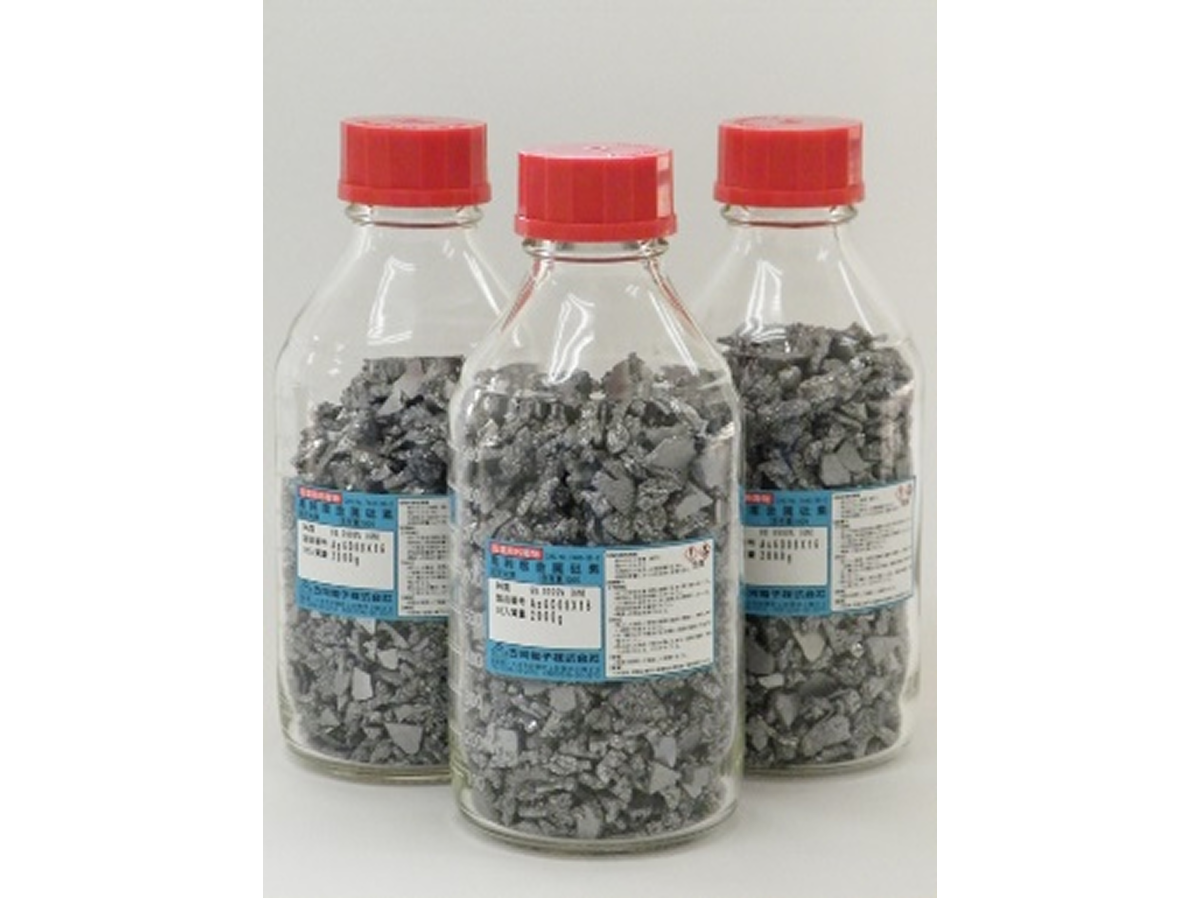
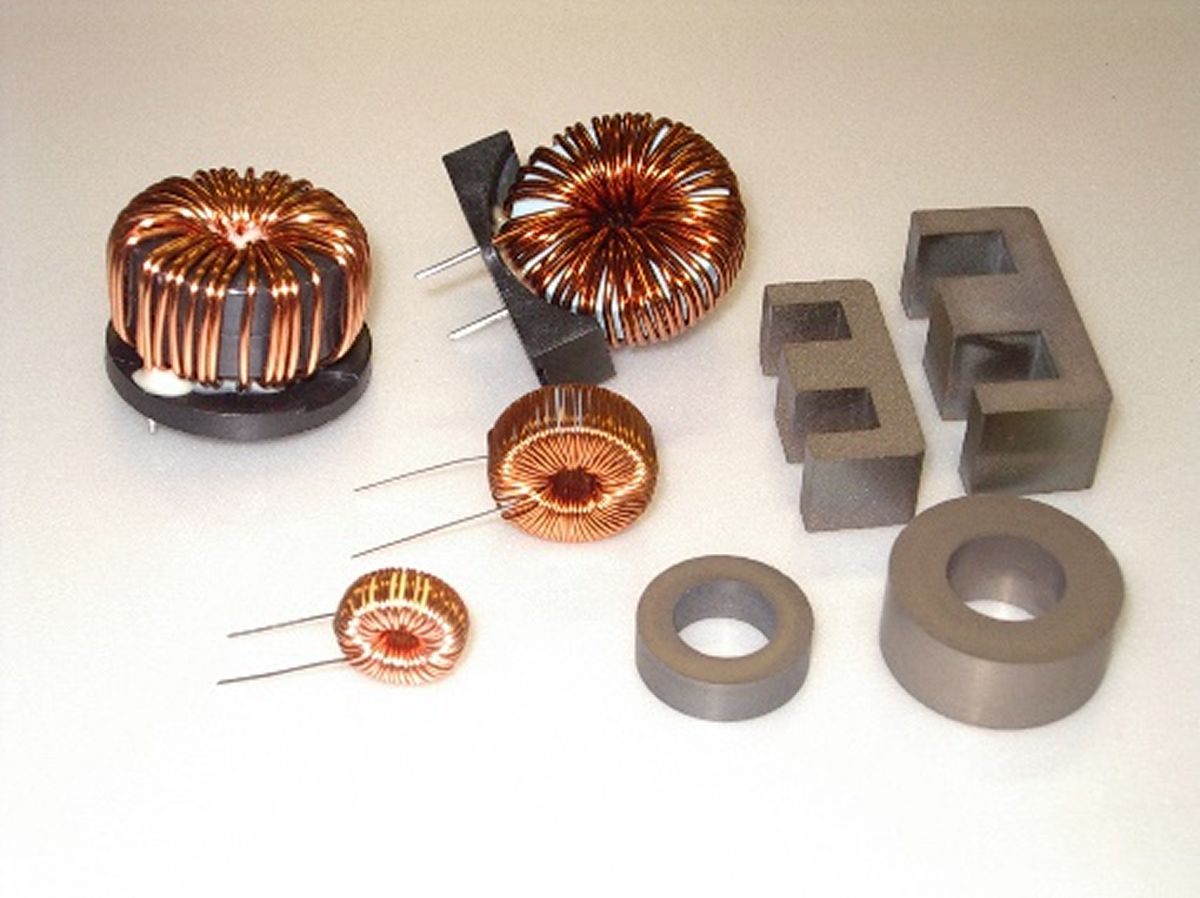
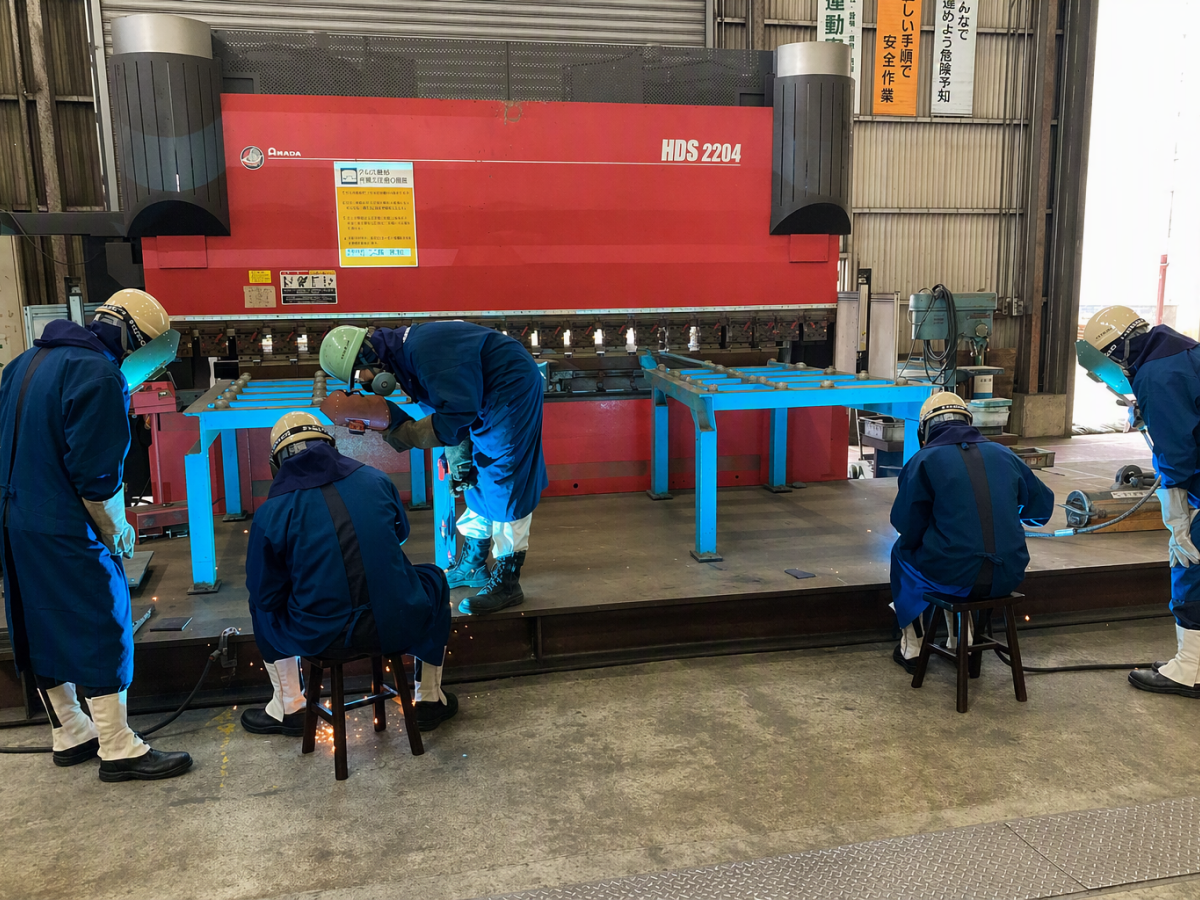
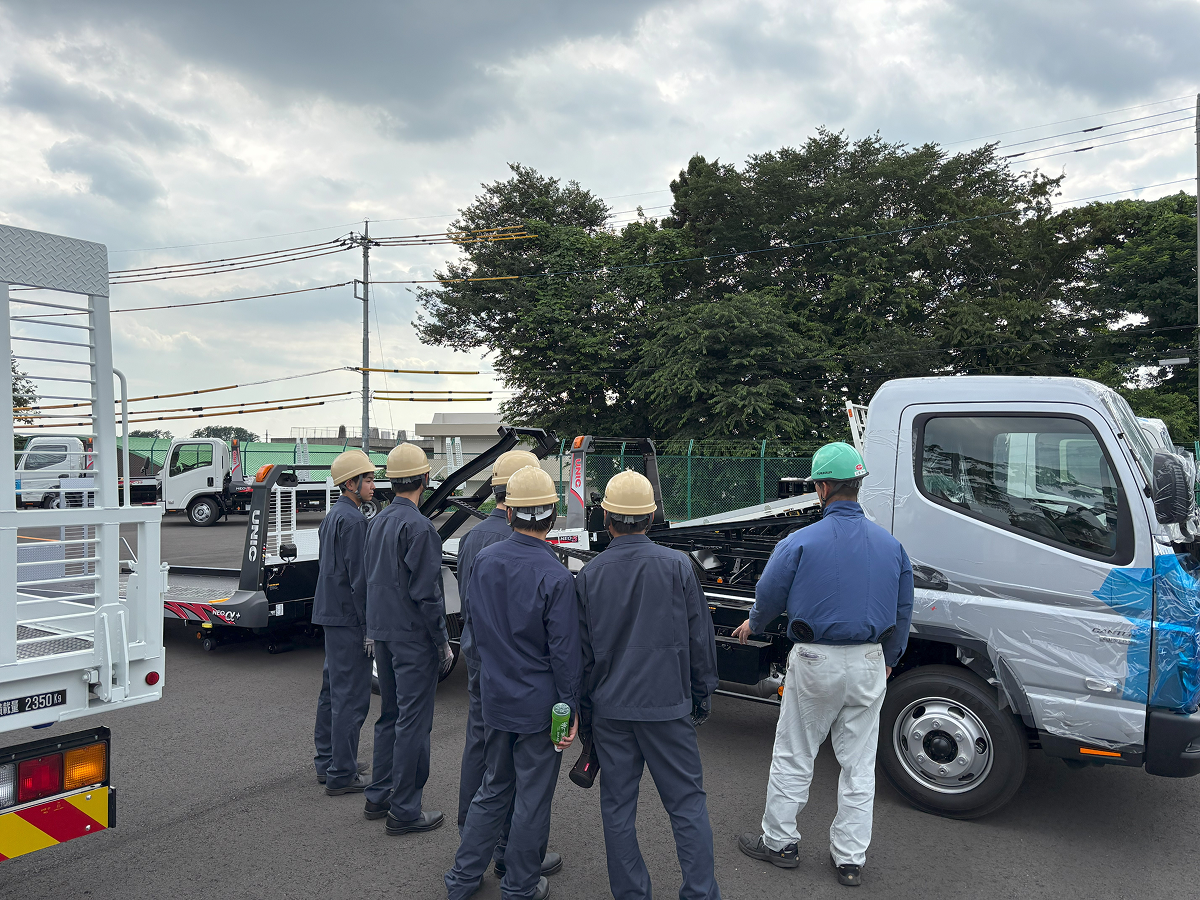
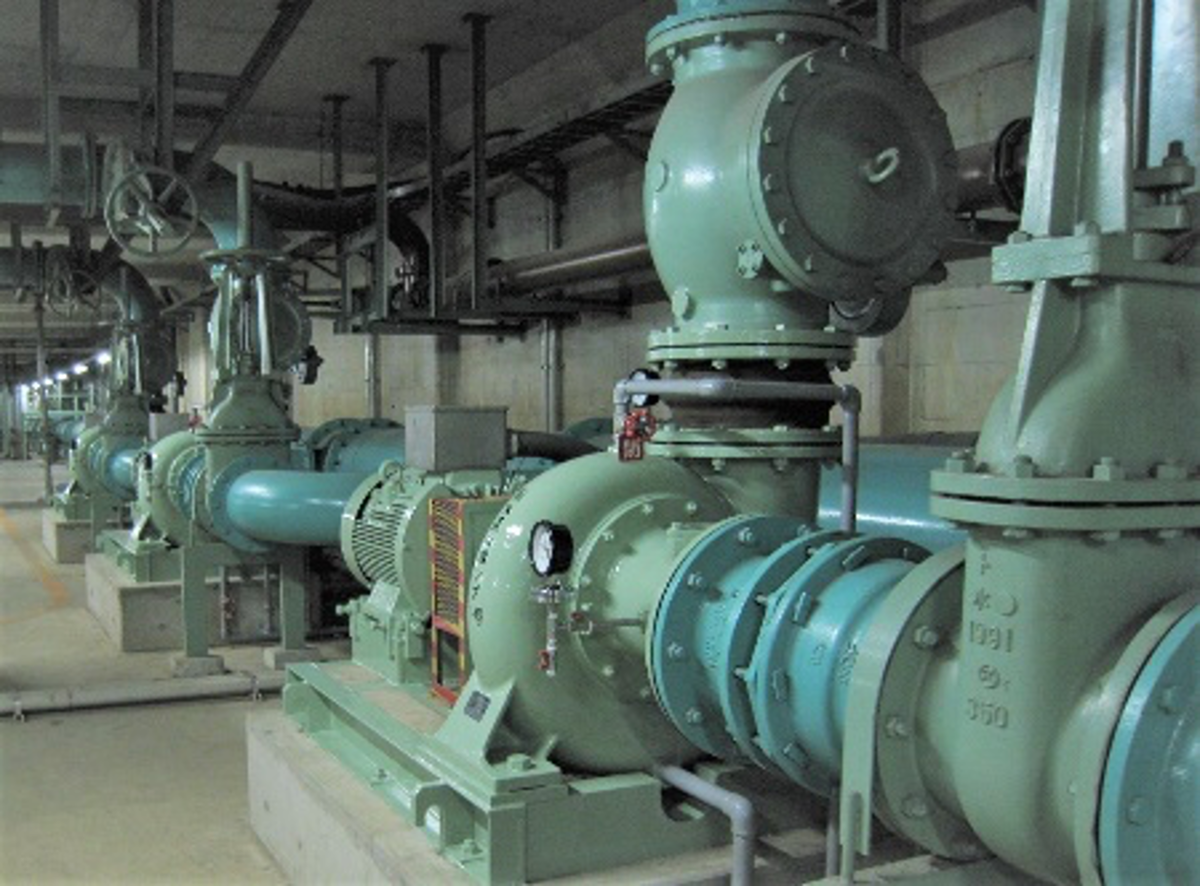
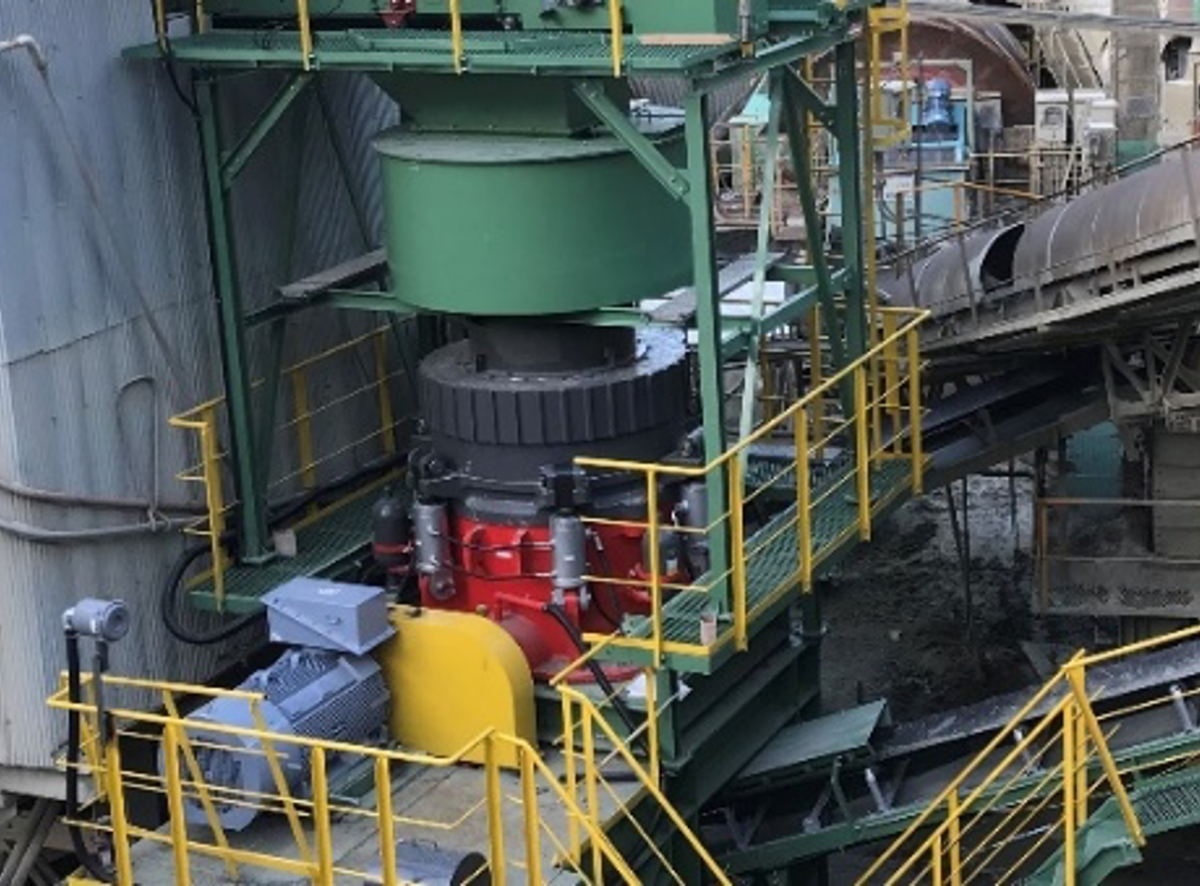
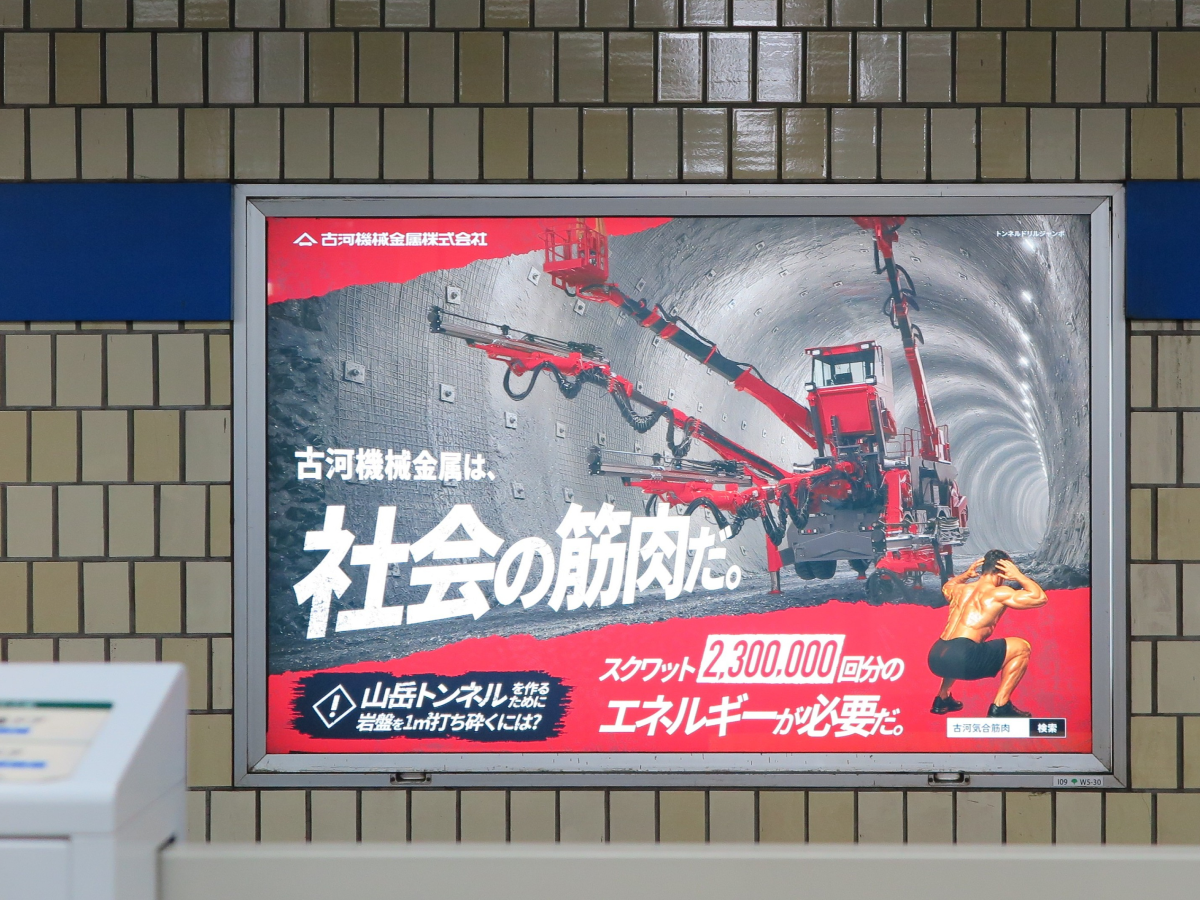
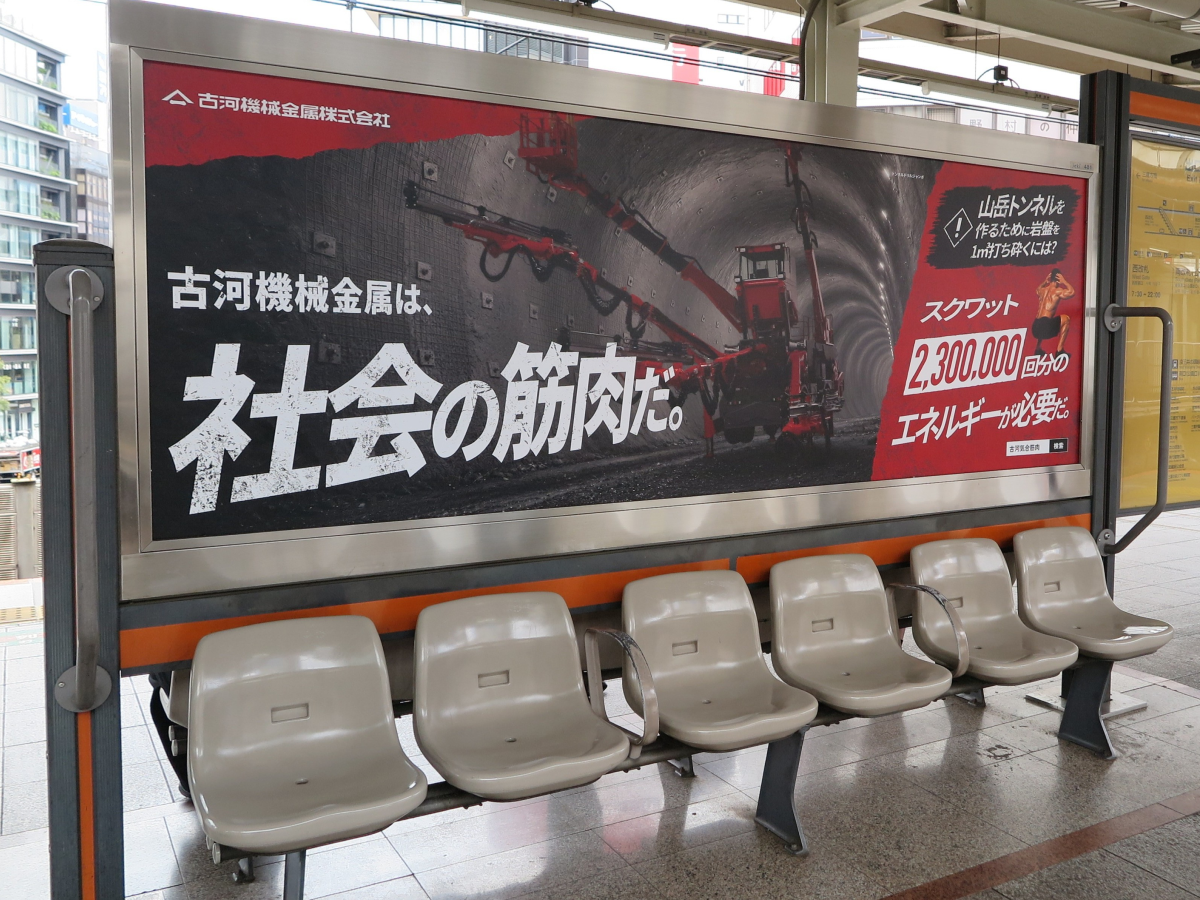
Furukawa Co., Ltd. is a diversified industrial group operating through seven main business segments. The Machinery business comprises the Industrial Machinery, Rock Drill, and Unique segments, manufacturing pumps, crushers, belt conveyors, hydraulic breakers, tunneling equipment, and various crane types including mini crawler and ocean cranes. The Materials business includes the Metals, Electronics, and Chemicals segments, supplying copper, gold, silver, high-purity metals, ceramics, and chemical products such as sulfuric acid and titanium dioxide. The group also engages in real estate leasing and trading, as well as transportation and casting services. Key subsidiaries include Furukawa San-Ki Systems, Furukawa Rock Drill, Furukawa Unique, Furukawa Metal Resource, Furukawa Electronics, and Furukawa Chemicals. Summarised from the annual report, fiscal year ended Mar 2026 |
Industry Conglomerates | Homepage furukawakk.co.jp |
| Sector Industrials | IR page furukawakk.co.jp | |
|
Tags
industrial machinery, hydraulic breakers, cranes, copper smelting, gold production, high-purity metals, ceramics, chemicals, real estate, transportation, Furukawa San-Ki Systems, Furukawa Rock Drill, Furukawa Unique, Furukawa Metal Resource, Furukawa Electronics, Furukawa Chemicals, Nihon-Hibi Joint Smelting, Furukawa Transport, Furukawa C&F
|
Press page furukawakk.co.jp/ashio/news |
Metrics
| Valuation | |
|---|---|
| Market cap | ¥ 130.182B |
| Market cap (USD) | $ 813.648M |
| P/E | 7.45 |
| PEG | 0.27 |
| P/BV | 0.80 |
| P/S | 0.54 |
| P/OCF | 51.05 |
| P/FCF | -49.52 |
| Dividend yield | 2.0% |
| Turnover / mcap | — |
| Returns | |
|---|---|
| ROE | 9.0% |
| ROI | 6.3% |
| ROIC | 3.9% |
| Profit margin | 6.1% |
| Growth | |
|---|---|
| Revenue growing | Yes |
| Profits growing | No |
| Revenue up 3y | No |
| Revenue up 5y | No |
| Earnings growth 3y (net profit CAGR) | 27.2% |
| Quality | |
|---|---|
| Profitable | Yes |
| Margin expanding | Yes |
| Buying back stock | Yes |
| Diluting (TTM) | No |
| Debt/Equity | — |
| Podcast bulls (TTM) | Sign up |
| Podcast bears (TTM) | Sign up |
| Podcast sentiment (TTM) | Sign up |
| Podcast sentiment % (TTM) | Sign up |
| News sentiment (TTM) | 0 |
| Quality score | 0% |
| Insiders | |
|---|---|
| Buys, 1w | Sign up |
| Buys, 1m | Sign up |
| Buys, 1y | Sign up |
| Sells, 1w | Sign up |
| Sells, 1m | Sign up |
| Sells, 1y | Sign up |
Sign up to see this company's insider trades
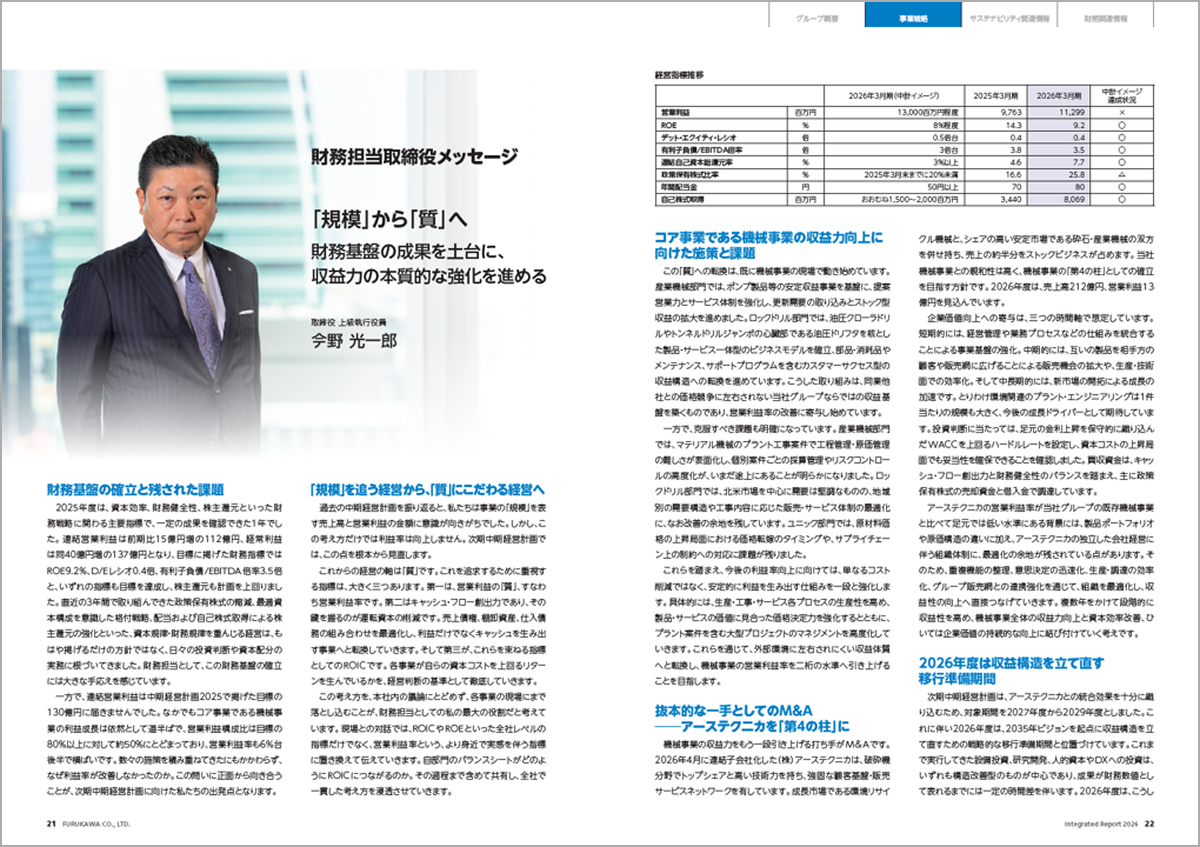
| Figure | FY 2026 | FY 2025 | FY 2024 | FY 2023 | FY 2022 | FY 2021 | FY 2020 | FY 2019 | FY 2018 | FY 2017 | FY 2016 | FY 2015 | FY 2014 | FY 2013 |
|---|---|---|---|---|---|---|---|---|---|---|---|---|---|---|
| Revenue | 211.081B | 201.216B | 188.255B | 214.19B | 199.097B | 159.702B | 165.215B | 174.116B | 167.695B | 149.829B | 161.799B | 172.544B | 163.026B | 165.539B |
| Net profit | 12.777B | 18.619B | 16.097B | 6.211B | 6.477B | 7.468B | 4.431B | 4.654B | 4.774B | 4.254B | 5.056B | 9.793B | 3.976B | 2.976B |
| Free cash flow | -1.459B | -7.659B | 4.087B | 2.787B | 3.261B | 2.639B | 2.28B | 7.026B | 25M | 6.007B | 5.077B | — | — | — |
| Figure | FY 2026 | FY 2025 | FY 2024 | FY 2023 | FY 2022 | FY 2021 | FY 2020 | FY 2019 | FY 2018 | FY 2017 | FY 2016 | FY 2015 | FY 2014 | FY 2013 |
|---|---|---|---|---|---|---|---|---|---|---|---|---|---|---|
| Share price | 4.255K | 2.088K | 1.811K | 1.276K | 1.289K | 1.336K | 1.06K | 1.393K | 1.985K | 205.01 | 1.66K | 2.12K | 1.859K | 109.01 |
| Price performance 12m | 1.04 | 0.15 | 0.42 | -0.01 | -0.04 | 0.26 | -0.24 | -0.3 | 8.68 | -0.88 | -0.22 | 0.14 | 16.06 | — |
Filed figures
Lines the statements and their notes report beside the headline figures, read from the filings' XBRL as filed (no restatement applied), with figures computed from one filing's own lines. Cash-flow lines carry their cash direction: an outflow is negative. Each period links to its filing; a figure's period, report date and tag are in its tooltip.
| Figure | Mar 2017 | Mar 2018 | Mar 2019 | Mar 2020 | Mar 2021 | Mar 2022 | Mar 2023 | Mar 2024 | Mar 2025 | Mar 2026 |
|---|---|---|---|---|---|---|---|---|---|---|
| Balance sheet detail | ||||||||||
| Trade receivables (JPY) | 26.8B | 31.3B | 30.7B | 30.7B | 28B | 55.2B | 68.8B | 58.1B | 59.9B | 48.8B |
| ↳ YoY growth | +8.3% | +17.1% | -2.1% | 0.0% | -8.6% | +97.1% | +24.6% | -15.6% | +3.3% | -18.6% |
| ↳ 5y CAGR | +2.6% | +15.6% | +17.0% | +13.6% | +14.4% | +11.7% | ||||
| Other receivables (JPY) | — | — | — | — | — | — | — | — | 1.32B | 11B |
| Borrowings, current (JPY) | 23B | 36B | 17.2B | 11.6B | 10.6B | 13.5B | 16.6B | 6.56B | 4.31B | 11B |
| Borrowings, non-current (JPY) | 50.5B | 37.4B | 55.4B | 58.8B | 59.1B | 52.2B | 46.2B | 51.8B | 51.7B | 46.3B |
| Bonds payable (JPY) | — | — | — | — | — | — | — | 5B | 5B | 5B |
| Lease liabilities (JPY) | 827M | 814M | 662M | 663M | 612M | 490M | 573M | 907M | 1.17B | 1.5B |
| Cash and deposits (JPY) | 13.2B | 10.2B | 14.3B | 12.6B | 17.7B | 14.5B | 13.6B | 18.5B | 24.8B | 21B |
| Intangible assets (JPY) | 186M | 227M | 257M | 361M | 341M | 376M | 317M | 342M | 329M | 357M |
| Net debt (borrowings + leases - cash) (JPY) | 61.1B | 63.9B | 58.9B | 58.4B | 52.5B | 51.7B | 49.8B | 40.8B | 32.4B | 37.8B |
| Cash flow detail | ||||||||||
| Operating cash flow (JPY) | 9.82B | 5.35B | 11.8B | 8.4B | 6.04B | 8.77B | 6.15B | 10.5B | 5M | 3.41B |
| Purchases of property, plant and equipment (JPY) | -3.81B | -5.33B | -4.76B | -6.12B | -3.4B | -5.51B | -3.36B | -6.41B | -7.66B | -4.87B |
| Change in receivables (cash effect) (JPY) | -2.25B | -4.49B | 470M | -16M | 2.55B | 345M | -6.8B | 5.37B | -2.81B | 8.99B |
| Change in inventories (cash effect) (JPY) | 347M | -7.98B | 2.22B | 207M | 645M | -10.3B | 3.22B | -314M | -2.43B | -1.44B |
| Change in payables (cash effect) (JPY) | 1.36B | 559M | 1.72B | -5.08B | -1.26B | 5.96B | -2.14B | 1.11B | -4.45B | -3.65B |
| Dividends paid (cash effect) (JPY) | -2.02B | -2.02B | -2.02B | -1.98B | -1.96B | -1.95B | -1.94B | -1.9B | -3.13B | -2.4B |
| Share buybacks (cash effect) (JPY) | — | -1M | -1.21B | -420M | -165M | -334M | -888M | -1.62B | -3.44B | -8.07B |
| Interest paid (cash effect) (JPY) | -699M | -559M | -575M | -512M | -462M | -429M | -494M | -503M | -537M | -557M |
| Income taxes paid (cash effect) (JPY) | -1.85B | -1.74B | -1.66B | -2.16B | -1.86B | -2.48B | -3.4B | -4.12B | -5.46B | -6.08B |
| Operating cash flow before change in receivables (JPY) | 12.1B | 9.84B | 11.3B | 8.42B | 3.49B | 8.42B | 12.9B | 5.13B | 2.82B | -5.58B |
| Free cash flow (OCF - PPE - intangibles) (JPY) | 6.01B | 25M | 7.03B | 2.28B | 2.64B | 3.26B | 2.79B | 4.09B | -7.66B | -1.46B |
| Income detail | ||||||||||
| Research and development expense (JPY) | 2.46B | 2.29B | 1.5B | 1.18B | 1.16B | 1.34B | 1.51B | 1.31B | 1.29B | 1.39B |
| ↳ 5y CAGR | -15.4% | -11.5% | -8.0% | -2.7% | +1.8% | +3.6% | ||||
| Total comprehensive income (JPY) | 13.4B | 9.55B | -3.39B | -60M | 18.5B | 8.02B | 8.83B | 30.8B | 7.69B | 26.8B |
| Comprehensive income to owners (JPY) | 13.2B | 9.38B | -3.57B | -275M | 18.4B | 7.77B | 8.52B | 30.5B | 7.44B | 26.6B |
| Provision for credit losses (JPY) | 0.00 | 3M | 17M | 28M | 4M | 16M | 10M | — | — | — |
| Credit cost ratio (credit losses / average receivables) (%) | 0.0% | 0.0% | 0.1% | 0.1% | 0.0% | 0.0% | 0.0% | — | — | — |
| Reported | Jun 29, 2017 | Jun 27, 2019 | Jun 27, 2019 | Jun 26, 2020 | Jun 29, 2022 | Jun 29, 2022 | Jun 29, 2023 | Jun 27, 2024 | Jun 24, 2026 | Jun 24, 2026 |
Sign up to see institutional holdings
Sign UpPodcast Mentions
Sign up to see podcast mentions and sentiment
Sign UpTimely disclosures published on TDnet, newest first, titles as filed in Japanese. The link opens the disclosure on TDnet. Filings with EDINET (periodic reports, extraordinary reports, offerings, holding and buy-back reports), newest first, titles as filed in Japanese. The link opens the filing on EDINET. Press releases from the company's own website, newest first.
2026年10月29日
■サマリー
・古河ユニックが公式ECサイト「UNIC ONLINE SHOP」をオープン。
・ブームステッカーやアクリルキーホルダー、プルバックカー、キャラクターグッズなどを販売。
・マグネット式安全用品や「UNIC」立体エンブレムなどの実用品も展開し、今後も新商品を順次追加。
当社(本社:東京都千代田区、社長:中戸川 稔)グループの中核事業会社で、ユニック部門を担う古河ユニック株式会社(本社:東京都千代田区、社長:菅野 悌二)は、公式ECサイト「UNIC ONLINE SHOP」をオープンしました。
同ショップでは、現場で役立つ実用アイテムからユニック製品をモチーフにしたグッズや公式キャラクターグッズなど、公式ショップならではの商品を取り揃えています。今後も順次、新商品を追加していく予定です。

「UNIC ONLINE SHOP」
「UNIC ONLINE SHOP」について
歴代ユニック製品のブームステッカーやユニックキャリアの鳥居をモチーフにしたアクリルキーホルダー、プルバックカー、ぬいぐるみなどの公式キャラクターグッズを取り扱っています。
このほか、クレーンに取り付け可能なマグネット式安全用品や「UNIC」立体エンブレムなど、実用性とユニックらしさを備えた商品を展開しています。
今後も新商品を順次追加し、ラインナップの充実を図ります。なお、商品の販売は日本国内に限ります。
【古河ユニック公式ECサイト「UNIC ONLINE SHOP」】
https://furukawaunic.shop-pro.jp/
【関連URL】
https://www.furukawaunic.co.jp/topics/uniconlineshop/
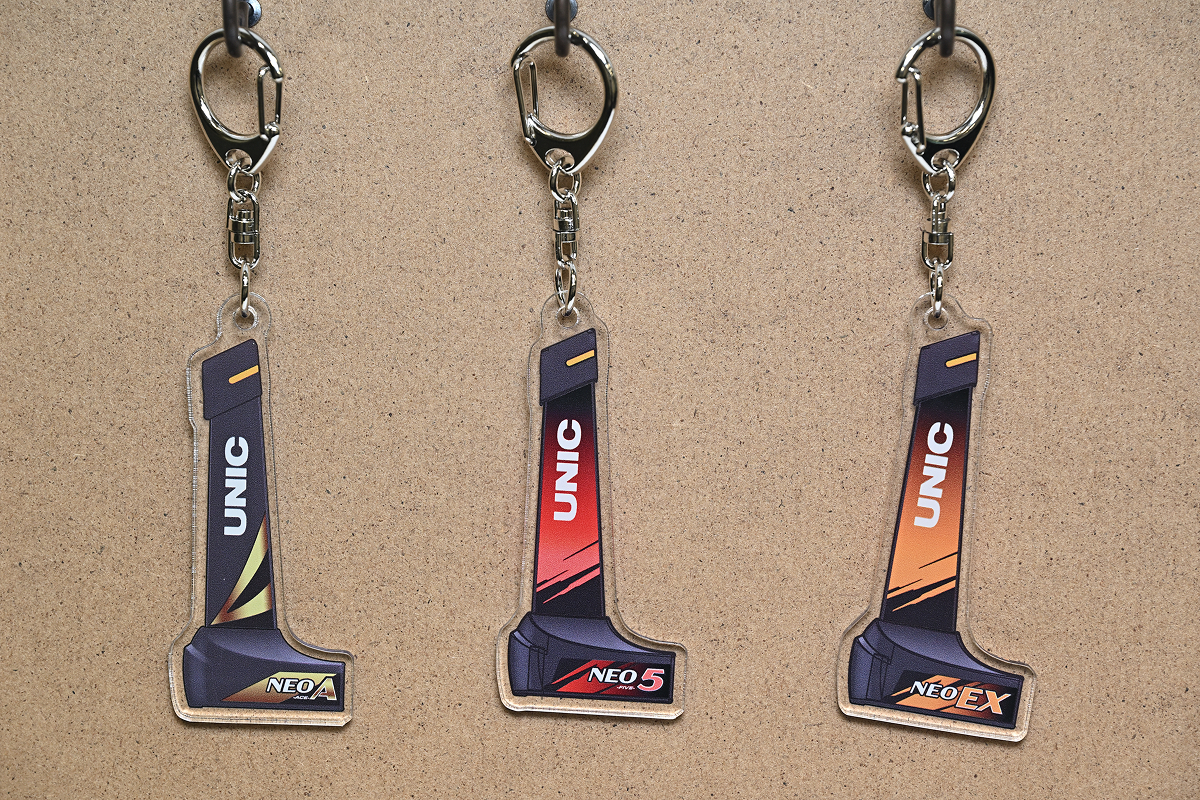
アクリルキーホルダー

「UNIC」立体エンブレム
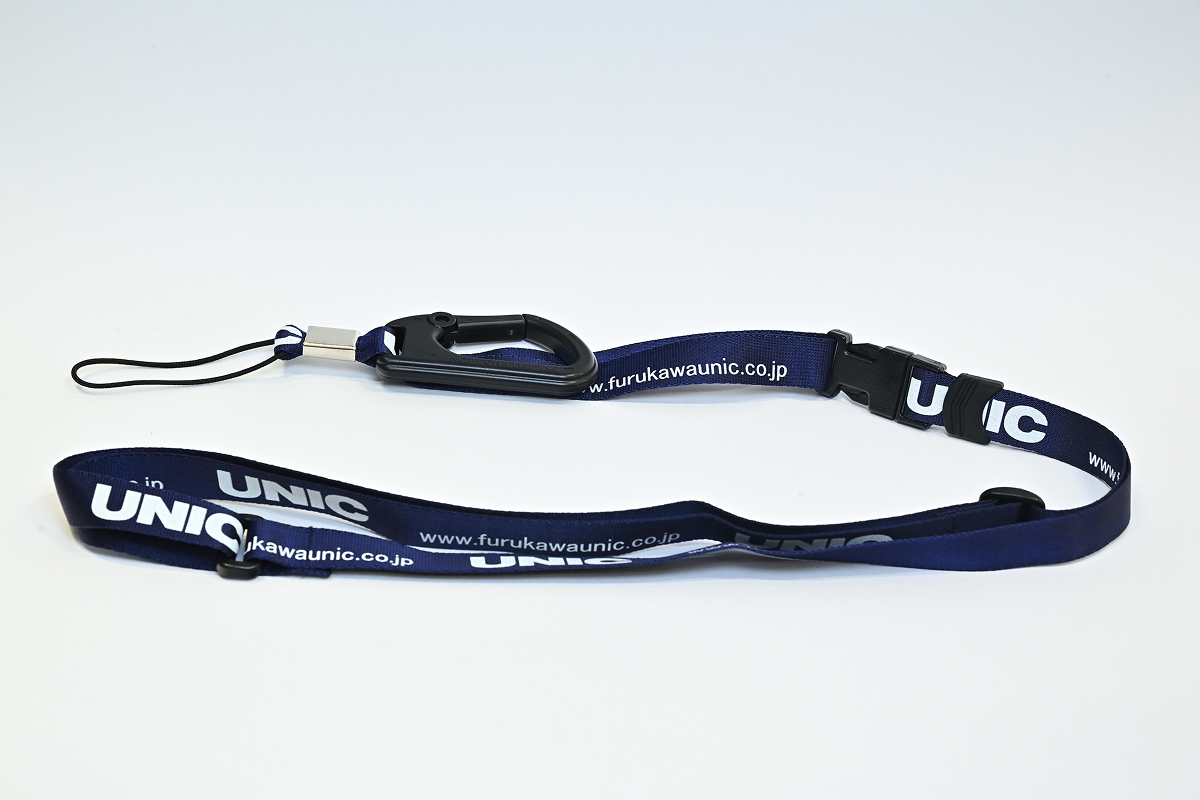
ネックストラップ
お問い合わせ先:お知らせに関して
古河機械金属株式会社 経営企画部広報・IR課
お問い合わせ先:オンラインショップに関して
古河ユニック株式会社 営業企画部営業企画課
-
ユニック部門:公式ECサイト「UNIC ONLINE SHOP」をオープン ~公式キャラクターグッズや現場で役立つ実用アイテムを販売~
Copyright© FURUKAWA CO.,LTD All Rights Reserved.
クッキー(Cookie)について
当サイトの利便性向上、サイト改善のためのサイト閲覧状況の統計的な把握などに利用するため、当サイト上でのクッキー(Cookie)の使用に同意ください。
サイトのご利用にあたって







Prompts
Click prompts to add them under the company line, click again to take one out, then copy the result into your AI chat. Shared by Asian Century Stocks and Uncovered Thai Stocks. Thank you.
ETFs Holding Furukawa Co., Ltd.
Exchange-traded funds whose newest published daily portfolio holds one of the company's listings, largest weight first.
| ETF | Weight in ETF | Shares | Market value | As of |
|---|---|---|---|---|
| ORR | 0.19% | 38,289 | $ 710K | Nov 18, 2026 |
| DISV | 0.08% | 184,247 | $ 3.912M | Nov 12, 2026 |
| DFIS | 0.03% | 83,300 | $ 1.769M | Nov 12, 2026 |
| DXIV | 0.02% | 2,300 | $ 48.834K | Nov 12, 2026 |
| AVDV | 0.02% | 248,900 | $ 4.679M | Nov 16, 2026 |
| AVDS | 0.01% | 2,500 | $ 46.994K | Nov 16, 2026 |
| DFIC | 0.01% | 49,400 | $ 1.049M | Nov 12, 2026 |
| DFSI | 0.01% | 3,200 | $ 67.942K | Nov 12, 2026 |
| DFAX | 0.00% | 24,400 | $ 518.061K | Nov 12, 2026 |
| DFAI | 0.00% | 18,700 | $ 397.039K | Nov 12, 2026 |
| AVDE | 0.00% | 25,100 | $ 471.823K | Nov 16, 2026 |