大量保有報告書(特例対象株券等)(ブラックロック・ジャパン株式会社)
Bull 0
Bear 0
Routine
Fiscal year ends March
Quarters are offset from the calendar — Q1 is Apr–Jun
|
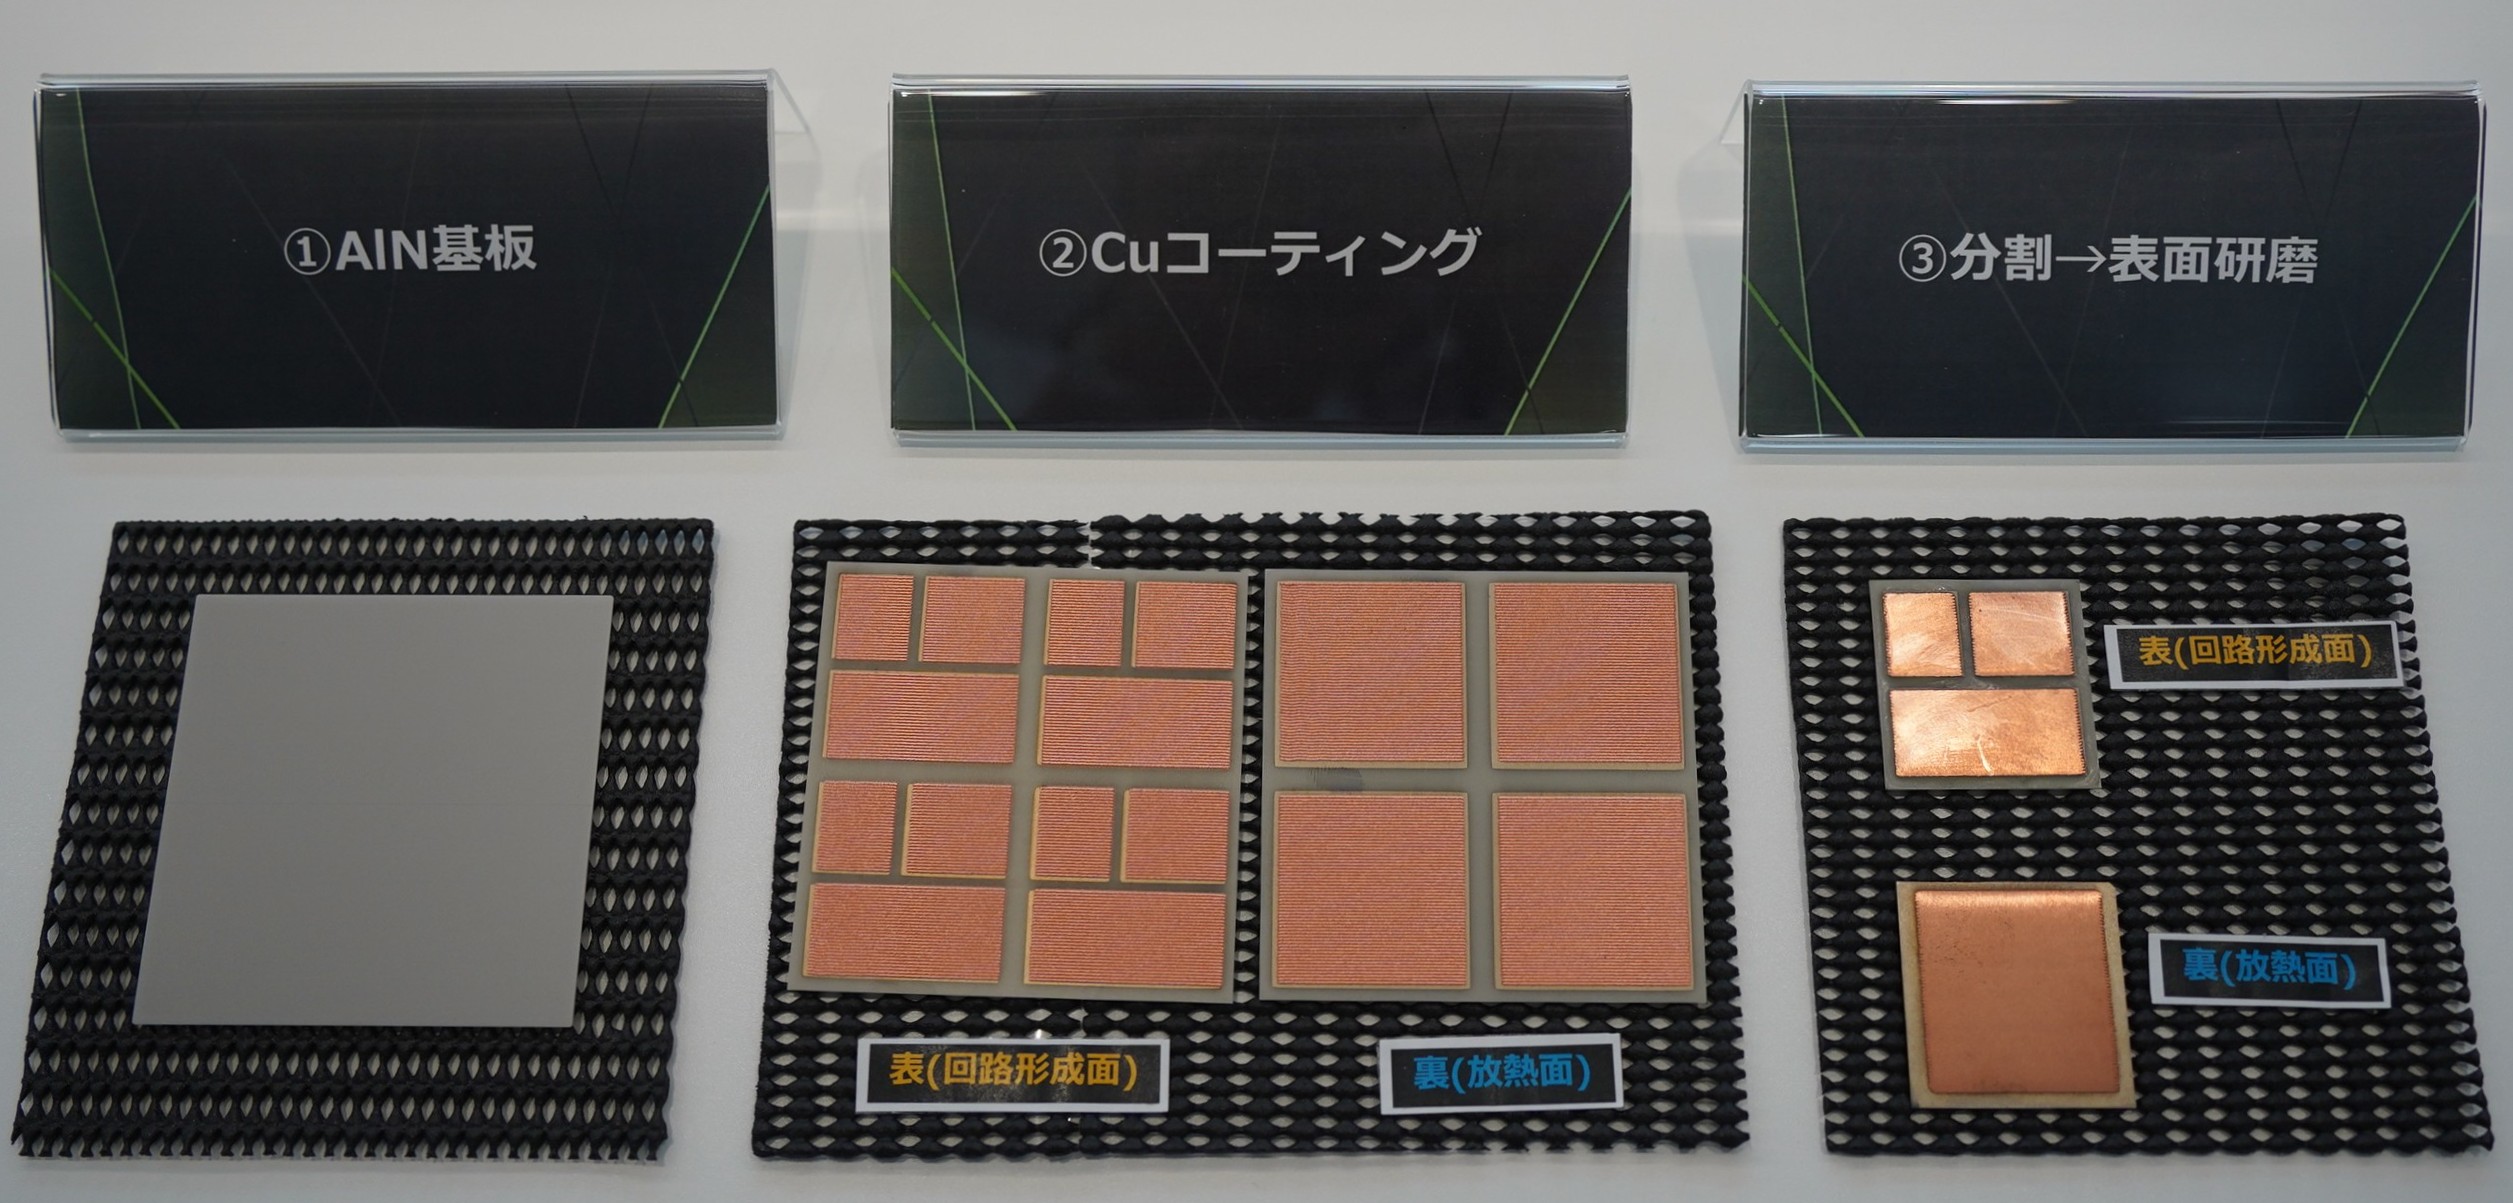
Dowa Holdings Co., Ltd. is a diversified industrial group operating through five main business segments: Environment & Recycling, Smelting, Electronic Materials, Metal Processing, and Heat Treatment. The Environment & Recycling segment handles waste treatment, soil purification, resource recycling, and logistics. The Smelting segment produces and sells gold, silver, copper, lead, zinc, indium, platinum, palladium, rhodium, tin, antimony, and sulfuric acid. The Electronic Materials segment manufactures high-purity metals, compound semiconductor wafers, LEDs, conductive materials, battery materials, magnetic materials, and reduced iron powder. The Metal Processing segment produces copper, brass, and copper alloy sheets, bars, and circuit boards, and provides plating services. The Heat Treatment segment performs heat and surface treatment of metal materials, primarily for automotive parts, and manufactures and maintains heat treatment equipment. The group also engages in real estate leasing, plant construction, civil engineering, and technical development support. Key subsidiaries include DOWA Eco System, DOWA Metals & Mining, DOWA Electronics, DOWA Metaltech, and DOWA Thermotech. Summarised from the annual report, fiscal year ended Mar 2026 |
Industry Other Industrial Metals & Mining | Homepage hd.dowa.co.jp |
| Sector Basic Materials | IR page hd.dowa.co.jp/ja/index.html | |
|
Tags
waste management, soil remediation, resource recycling, precious metals smelting, base metals smelting, semiconductor wafers, leds, battery materials, copper processing, brass manufacturing, circuit boards, plating services, DOWA Eco System, Eco System Hanagawa, Eco System Recycling, Act B Recycling, Eco Recycling, Green Phil Komagane, Eco System Okayama, Eco System Sanyo, E and E Solutions, Geo Technos, Eco System Chiba, Melt Tech, Melt Tech Iwaki, Eco System Akita, Eco System Komagane, Aso Smart Eco Company, Eco System Japan, DOWA Tsuun, Okayama Mine Oil, Bio Diesel Okayama, Kitaaki Environmental Service, Eastern Seaboard Environmental Complex, Bangpoo Environmental Complex, Waste Management Siam, Modern Asia Environmental Holdings, PT Prasadha Pamunah Limbah Industri, Suzhou Dowa Resource Comprehensive Utilization, Golden Dowa Eco-System Myanmar, PT DOWA ECO SYSTEM INDONESIA, DOWA Metals & Mining, Akita Smelting, Komagane Smelting, Nippon PGM, Hajima Kousan, NIPPON PGM EUROPE, DOWA METALS & MINING ALASKA, DOWA METALS & MINING THAILAND, DOWA METALS & MINING AMERICA, NPGM KOREA, NPGM USA, DOWA Electronics, DOWA High Tech, DOWA Semiconductor Akita, DOWA IP Creation, DOWA F Tech, DOWA Electronics Okayama, DOWA Metaltech, DOWA Metal, DOWA Metanics, Toyokaze Trading, DOWA Power Device, Shin Nippon Brass, Dowa Metal Materials Shanghai, DOWA METALTECH THAILAND, Dowa New Materials Shanghai, Dowa Li Precision Parts, DOWA METALTECH MEXICO, Dowa Metal Technology Nantong, DOWA METALTECH CHONBURI, DOWA Thermotech
|
Press page hd.dowa.co.jp/ja/ir/news |
Metrics
| Valuation | |
|---|---|
| Market cap | ¥ 543.521B |
| Market cap (USD) | $ 3.397B |
| P/E | 5.73 |
| PEG | 0.16 |
| P/BV | 1.09 |
| P/S | 0.59 |
| P/OCF | 106.85 |
| P/FCF | -19.03 |
| Dividend yield | 4.2% |
| Turnover / mcap | — |
| Returns | |
|---|---|
| ROE | 14.0% |
| ROI | 11.8% |
| ROIC | 5.3% |
| Profit margin | 8.4% |
| Growth | |
|---|---|
| Revenue growing | Yes |
| Profits growing | Yes |
| Revenue up 3y | No |
| Revenue up 5y | No |
| Earnings growth 3y (net profit CAGR) | 35.6% |
| Quality | |
|---|---|
| Profitable | Yes |
| Margin expanding | No |
| Buying back stock | No |
| Diluting (TTM) | No |
| Debt/Equity | — |
| Podcast bulls (TTM) | Sign up |
| Podcast bears (TTM) | Sign up |
| Podcast sentiment (TTM) | Sign up |
| Podcast sentiment % (TTM) | Sign up |
| News sentiment (TTM) | 16 |
| Quality score | 16.7% |
| Insiders | |
|---|---|
| Buys, 1w | Sign up |
| Buys, 1m | Sign up |
| Buys, 1y | Sign up |
| Sells, 1w | Sign up |
| Sells, 1m | Sign up |
| Sells, 1y | Sign up |
Sign up to see this company's insider trades
| Figure | FY 2026 | FY 2025 | FY 2024 | FY 2023 | FY 2022 | FY 2021 | FY 2020 | FY 2019 | FY 2018 | FY 2017 | FY 2016 | FY 2015 | FY 2014 | FY 2013 |
|---|---|---|---|---|---|---|---|---|---|---|---|---|---|---|
| Revenue | 745.41B | 678.672B | 717.194B | 780.06B | 831.794B | 588.003B | 485.13B | 452.928B | 454.754B | 410.503B | 406.598B | 464.219B | 443.985B | 419.39B |
| Net profit | 62.458B | 27.128B | 27.853B | 25.041B | 51.012B | 21.824B | 17.395B | 14.986B | 24.693B | 26.169B | 21.826B | 26.543B | 23.31B | 15.213B |
| Free cash flow | -29.935B | -34.35B | 80.273B | 17.649B | 28.132B | -38.11B | 19.872B | 14.16B | -12.555B | 4.125B | 25.839B | — | — | — |
| Figure | FY 2026 | FY 2025 | FY 2024 | FY 2023 | FY 2022 | FY 2021 | FY 2020 | FY 2019 | FY 2018 | FY 2017 | FY 2016 | FY 2015 | FY 2014 | FY 2013 |
|---|---|---|---|---|---|---|---|---|---|---|---|---|---|---|
| Share price | 8.784K | 4.629K | 5.329K | 4.245K | 5.608K | 4.617K | 2.83K | 3.639K | 3.809K | 802.1 | 3.134K | 5.14K | 4.309K | 736.3 |
| Price performance 12m | 0.9 | -0.13 | 0.26 | -0.24 | 0.21 | 0.63 | -0.22 | -0.04 | 3.75 | -0.74 | -0.39 | 0.19 | 4.85 | — |
Filed figures
Lines the statements and their notes report beside the headline figures, read from the filings' XBRL as filed (no restatement applied), with figures computed from one filing's own lines. Cash-flow lines carry their cash direction: an outflow is negative. Each period links to its filing; a figure's period, report date and tag are in its tooltip.
| Figure | Mar 2017 | Mar 2018 | Mar 2019 | Mar 2020 | Mar 2021 | Mar 2022 | Mar 2023 | Mar 2024 | Mar 2025 | Mar 2026 |
|---|---|---|---|---|---|---|---|---|---|---|
| Balance sheet detail | ||||||||||
| Trade receivables (JPY) | 80.2B | 87.6B | 84.4B | 75.1B | 84.1B | 198B | 179B | 171B | 184B | 210B |
| ↳ YoY growth | +28.9% | +9.3% | -3.7% | -11.0% | +12.0% | +135.2% | -9.5% | -4.6% | +7.5% | +14.4% |
| ↳ 5y CAGR | +6.2% | +19.8% | +15.4% | +15.1% | +19.6% | +20.1% | ||||
| Borrowings, current (JPY) | 51B | 69.4B | 75.9B | 64.1B | 88.1B | 60.9B | 72B | 45.4B | 59B | 56.3B |
| Borrowings, non-current (JPY) | 28.9B | 40.4B | 59.4B | 70B | 65.8B | 70.7B | 52.8B | 30.5B | 22.3B | 34.4B |
| Bonds payable (JPY) | 10B | 10B | 20B | 20B | 20B | 30B | 30B | 20B | 10B | 20B |
| Cash and deposits (JPY) | 15.6B | 16.9B | 20.1B | 31.7B | 18.3B | 36.8B | 38.8B | 75.1B | 43.6B | 51.2B |
| Intangible assets (JPY) | 9.95B | 9.01B | 7.71B | 7.5B | 7.99B | 9.47B | 11.1B | 10.2B | 8.91B | 7.56B |
| Net debt (borrowings + leases - cash) (JPY) | 64.3B | 92.9B | 115B | 102B | 136B | 94.8B | 85.9B | 844M | 37.7B | 39.5B |
| Cash flow detail | ||||||||||
| Operating cash flow (JPY) | 29.4B | 11.1B | 37.6B | 55.1B | -3.09B | 59.9B | 50.7B | 119B | 12.8B | 5.24B |
| Purchases of property, plant and equipment (JPY) | -25.3B | -23.7B | -23.4B | -35.2B | -33.5B | -28.9B | -29.7B | -36.4B | -45.9B | -34.6B |
| Purchases of intangible assets (JPY) | -700M | -356M | -288M | -885M | -1.54B | -2.83B | -3.38B | -1.91B | -1.32B | -572M |
| Change in receivables (cash effect) (JPY) | -18.2B | -7.31B | 2.44B | 8.55B | -9.15B | -15.4B | 10.4B | 4.95B | -5.35B | -12.2B |
| Change in inventories (cash effect) (JPY) | -12.7B | -23.9B | -13.5B | 4.36B | -89.5B | -23B | 10.1B | 61.9B | -52.7B | -81.4B |
| Change in payables (cash effect) (JPY) | 5.72B | 2.65B | 5.88B | -8.38B | 20.7B | 6.44B | -12.3B | -1.3B | -3.62B | 19.5B |
| Dividends paid (cash effect) (JPY) | -5.41B | -5.41B | -5.41B | -5.41B | -5.41B | -5.71B | -7.81B | -7.81B | -7.82B | -9.02B |
| Share buybacks (cash effect) (JPY) | -2M | -5M | -1M | -1M | -1M | -1M | 0.00 | 0.00 | 0.00 | -9.99B |
| Interest paid (cash effect) (JPY) | -800M | -532M | -864M | -1.35B | -1.01B | -716M | -528M | -391M | -905M | -1.08B |
| Income taxes paid (cash effect) (JPY) | -6B | -12.5B | -7.9B | -5.44B | -14.5B | -15B | -31.4B | -7.04B | -11.2B | -13B |
| Operating cash flow before change in receivables (JPY) | 47.6B | 18.4B | 35.1B | 46.6B | 6.06B | 75.3B | 40.3B | 114B | 18.2B | 17.4B |
| Free cash flow (OCF - PPE - intangibles) (JPY) | 3.43B | -12.9B | 13.9B | 19B | -38.1B | 28.1B | 17.6B | 80.3B | -34.4B | -29.9B |
| Income detail | ||||||||||
| Research and development expense (JPY) | 4.83B | 4.87B | 5.17B | 5.55B | 5.78B | 5.89B | 8.57B | 10.5B | 8.97B | 8.45B |
| ↳ 5y CAGR | +4.9% | +4.0% | +11.9% | +15.2% | +10.1% | +7.9% | ||||
| Total comprehensive income (JPY) | 30.1B | 25.6B | 5.02B | 18.3B | 25.3B | 60.2B | 44.5B | 38.9B | 34.9B | 78.8B |
| Comprehensive income to owners (JPY) | 29.9B | 25.1B | 4.97B | 17B | 21.9B | 54.3B | 40B | 37.1B | 34.1B | 76.6B |
| Reported | Jun 27, 2017 | Jun 26, 2018 | Jun 25, 2019 | Jul 15, 2020 | Jun 24, 2021 | Jun 24, 2022 | Jun 29, 2023 | Jun 25, 2024 | Jun 24, 2025 | Jun 23, 2026 |
Sign up to see institutional holdings
Sign UpPodcast Mentions
Sign up to see podcast mentions and sentiment
Sign UpTimely disclosures published on TDnet, newest first, titles as filed in Japanese. The link opens the disclosure on TDnet. Filings with EDINET (periodic reports, extraordinary reports, offerings, holding and buy-back reports), newest first, titles as filed in Japanese. The link opens the filing on EDINET. Press releases from the company's own website, newest first.








Prompts
Click prompts to add them under the company line, click again to take one out, then copy the result into your AI chat. Shared by Asian Century Stocks and Uncovered Thai Stocks. Thank you.
Dowa Holdings Co., Ltd. (ticker 5714), listed in Japan.
Copied
ETFs Holding Dowa Holdings Co., Ltd.
Exchange-traded funds whose newest published daily portfolio holds one of the company's listings, largest weight first.
| ETF | Weight in ETF | Shares | Market value | As of |
|---|---|---|---|---|
| DFIS | 0.12% | 133,100 | $ 7.169M | Nov 12, 2026 |
| DISV | 0.12% | 112,900 | $ 6.081M | Nov 12, 2026 |
| AVDV | 0.07% | 278,800 | $ 13.845M | Nov 16, 2026 |
| DFIC | 0.04% | 113,200 | $ 6.098M | Nov 12, 2026 |
| DFAX | 0.03% | 56,300 | $ 3.033M | Nov 12, 2026 |
| DFSI | 0.02% | 5,300 | $ 285.484K | Nov 12, 2026 |
| AVDE | 0.02% | 67,700 | $ 3.362M | Nov 16, 2026 |
| DXIV | 0.02% | 800 | $ 43.092K | Nov 12, 2026 |
| DFAI | 0.01% | 46,900 | $ 2.526M | Nov 12, 2026 |