コーポレートガバナンス CORPORATE GOVERNANCE Sumitomo Metal Mining Co.,Ltd. 最終更新日:2026年10月28日 住友金属鉱山株式会社 代表取締役社長松本伸弘 問合せ先:03-3436-7705 証券コード:5713 https://www.smm.co.jp/…
コーポレートガバナンス
CORPORATE GOVERNANCE
Sumitomo Metal Mining Co.,Ltd.
最終更新日:2026年10月28日
住友金属鉱山株式会社
代表取締役社長松本伸弘
問合せ先:03-3436-7705
証券コード:5713
https://www.smm.co.jp/
当社のコーポレート・ガバナンスの状況は以下のとおりです。
Ⅰコーポレート・ガバナンスに関する基本的な考え方及び資本構成、企業属性その他の基本情報
1.基本的な考え方
「コーポレートガバナンスに関する基本方針」「2.基本的な考え方」において、当社のコーポレートガバナンスに関する基本的な考え方を定め、以
下の当社ウェブサイトに公表しております。
(コーポレートガバナンスに関する基本方針)
(URL)https://www.smm.co.jp/ir/management/governance/
【コーポレートガバナンス・コードの各原則を実施しない理由】
全ての原則について、2021年6月に改訂されたコーポレートガバナンス・コードに基づき記載しております。
【補充原則4−1−3:最高経営責任者等の後継者計画(プランニング)の取締役会の関与】
当社では、最高経営責任者(取締役社長)の後継者計画は、経営理念や経営計画を踏まえて適切に策定し、実施されています。
社長の後継者候補に関しては、執行役員でない取締役会長1名、独立社外取締役4名で構成するガバナンス委員会(委員長:取締役石井妙子)
において、次期社長を育成する環境や方法、候補者等について審議する機会を設けています。具体的な社長の後継者の選定にあたっては、社長
の推薦する候補者をガバナンス委員会に諮り、候補者が取締役社長に相応しい資質、知識、経験、能力、見識等を有するか助言を得たうえで、社
長が最終案を取締役会に提案し、取締役会において審議のうえ最終決定しています。
また、将来的な社長候補者のプールとなる執行役員候補者の選定にあたっては、社長が、各執行役員からの推薦を踏まえ、経営が向き合う課題
解決のための最善の布陣について、ガバナンス委員会に諮り、その助言を参考に最終案を作成し取締役会に提案しています。これを受け、取締
役会において審議のうえ最終決定しています。
【コーポレートガバナンス・コードの各原則に基づく開示】
全ての原則について、2021年6月に改訂されたコーポレートガバナンス・コードに基づき記載しております。
【原則1−4:政策保有株式】
当社は、事業戦略を進めるうえで、中長期的に事業基盤の強化につながると判断される場合、株式を政策的に保有することがあります。現状保有
している政策保有株式については、毎年取締役会において、その保有目的や保有に伴う便益が資本コストに見合うものであるか等について検証
を行っています。検証の結果、資本コストに見合わなくなった銘柄や、最近の事業の変化等によって事業関連性が希薄になってきたと判断される
銘柄等、保有意義に乏しいと判断された銘柄については縮減を前提とした具体的検討を進めることとしています。また、当社の株式を政策保有株
式として保有している会社から当社株式の売却等の意向が示された場合に、取引の縮減を示唆することなどにより、当該売却等を妨げることはあ
りません。
政策保有株式の議決権行使については、発行会社の業績等の経営状況を踏まえたうえで、各議案が発行会社の中長期的な企業価値・株主利益
の向上につながるか、当社の企業価値・株主利益にどのような影響を与えるか等を総合的に勘案し、各議案への賛否を判断します。当社は、各
議案への賛否を判断するため、必要に応じて各議案の内容等について発行会社と対話を行います。また、発行会社に重大な不祥事があった場合
や一定期間連続で赤字である場合などには慎重な判断を行います。
取締役会による検証は、直近では2026年6月の定時取締役会において当社が保有している全ての政策保有株式について実施しました。
2025年度は政策保有株式5銘柄について全株式を、3銘柄について一部株式を売却しました。この結果、2026年3月末時点で当社が保有している
上場政策保有株式は32銘柄(みなし保有株式を含む)でした。
保有銘柄の詳細は、当社の有価証券報告書をご覧ください。
なお、中期経営計画2027において、政策保有株式について、2028年3月末までにPTVI(※)株式を除き連結純資産比率10%以下を目指して縮減を
進めていくこととしており、2028年度以降はPTVI株式を含み連結純資産比率10%以下を目指すこととしています。
※PT Vale Indonesia Tbk(PTVI):インドネシア共和国における重要な事業基盤であり、また、製錬事業で使用するニッケル原料の主要調達先。 20
20年に同国の内資化政策により、当社保有株式の一部を譲渡したことで持分法適用会社から除外した。
「中期経営計画2027」
(URL)https://www.smm.co.jp/ir/management/plan/
【原則1−7:関連当事者間の取引】
当社および株主共同の利益を損なうことのないよう、取締役および監査役と会社間の取引については、取締役会の事前の承認を得ます。また、当
該取引の有無を調査のうえ、半期ごとに取締役会に報告します。
主要な株主との取引が発生する場合には、取締役と会社間の取引と同様の基準で対応します。なお、主要な株主とは、当社の議決権を10%以上
保有する株主とします。
【補充原則2−4−1:中核人材の登用等における多様性の確保】
1.多様性確保についての考え方
当社グループは、経営理念において「人間尊重を基本とし、その尊厳と価値を認めること」を掲げ、それを実現するための役員・従業員の具体的な
行動基準をまとめた「SMMグループ行動基準」において、「多様性を受け入れ、人格・人権を尊重する」ことを定めています。また、「住友金属鉱山
グループ人権方針」では、雇用や就業の場面における人種、宗教、性別、年齢、性的指向、障害の有無、国籍などによる差別、ハラスメントやいじ
めを認めないことを定めています。また、2025年3月に公表した重要課題のひとつに「人的資本経営」を掲げ、その「2030年のありたい姿」として、
「多様な人材が集い、成長し活躍できる企業」を目指しています。
DE&I(ダイバーシティ・エクイティ&インクルージョン)も人的資本経営を進めるうえで重要な要素の一つです。従業員一人ひとりが持つ視点や考え
方は様々であり、多様なメンバーがお互いを認め、信じ、自身の強みを活かしながら、公平な機会のもとで協働する企業風土を築くことが必要で
す。性別・国籍・年齢といった属性の多様化に加えて、能力や経験の多様化を進めることで、新しいアイデアを生み出し、組織の柔軟性と競争力を
向上させ、新たな価値創造により、変革の原動力とします。
これらの考え方のもと、当社では、人的資本経営の観点から、組織と人を長期的視点で成長させる仕組みは維持しつつ、多様な人材を受け入れ、
多様な価値観を活かし、企業価値向上を図るため、2023年7月に総合職社員を対象に職務等級制度を柱とした人事制度改正を行いました。これ
までの安心感・安定感に加え、社員一人ひとりが自律的に学び成長し続け、挑戦・変革・成長を可能にします。
2.多様性確保の自主的かつ測定可能な目標および達成の状況
1)女性管理職社員
当社は、重要課題「人的資本経営」における「2030年のありたい姿」である「多様な人材が集い、成長し活躍できる企業」の実現に向け、女性活躍
推進に努めており、管理職社員への登用、国内拠点のみならず海外拠点への派遣等、女性の活躍の場を拡大させております。また、当社は、女
性の職業生活における活躍の推進に関する法律に基づく一般事業主行動計画において、2027年度末までに女性管理職社員比率を5%以上とす
ることを目標としております。2026年10月1日時点での女性管理職社員数は29名であり、管理職社員全体の3.3%となります。さらに、重要課題「人
的資本経営」におけるKPIとして、2030年までに女性管理職社員数を50名(※女性管理職社員比率として7%に相当)以上とすることを目標としてお
り、性別に関わらず活躍できる環境づくりを進め、成長戦略を推進するべく中長期的な視点から必要な施策を講じております。
<具体的な取組み事例>
・ライフステージに応じた両立支援策の実施
・管理職登用前の女性社員を対象とした女性リーダー育成のための研修への派遣
・女性管理職社員(課長クラス)を対象とした上位管理職育成研修への派遣
・育児休業から復職した女性社員のキャリア形成を支援するための面談
このような取組みが評価され、当社はより高い水準で子育て支援に取り組む企業として厚生労働大臣より「プラチナくるみん認定」を受けました。
2)キャリア採用
当社は、キャリア採用を通じ、特定の専門性やスキルを持った人材を確保することに加え、異なる環境で培われた多様な知見や視点が加わること
で自由闊達な組織風土の醸成がさらに促進されるよう取り組んでおります。2025年度には25名の総合職のキャリア採用を行いました。引き続き成
長戦略の実現に向け、キャリア採用を実施してまいります。
3)グローバル採用
国籍を問わない人材採用を継続しており、2026年10月1日時点で14名の外国人が在籍しています。事業領域の拡大、海外新規事業の機会創出に
伴い、グローバルに活躍できる人材を登用しております。魅力ある職場づくりに向けた具体的な取組みとして、外国人社員が抱えている課題を把
握するためのアンケートと、希望者を対象にした面談、上司へのフィードバックと課題ヒアリングを実施しています。また、全従業員がグローバル人
材の活躍を知るとともに、誰もが活躍できる職場環境の整備の重要性に対する社内の意識を高めています。
4)障害者採用
障害のある方が誇り・やりがい・働く喜びを持つことができるよう全社を上げて環境整備に取り組んでおります。具体的な取組みとして、2019年度
から各事業所近隣の特別支援学校からの職場体験を継続的に受け入れ、就業体験を通じて職場や仕事の理解を深めることにより、安心して当社
に入社していただけるよう努めております。また、2026年度は障害のある大学生のインターンシップを実施し、専門性や特性を活かせる職場での
採用を積極的に行っています。入社後は、定着支援として人事担当者と定期的に面談を行い、仕事への不安や困りごとの解消、必要に応じたサ
ポートを行っています。また、合理的配慮の観点からも、職場におけるさまざまな環境整備を行っています。
3.多様性確保に向けた人材育成方針、社内環境整備方針、その状況
当社グループでは、人的資本経営における「2030年のありたい姿」に「多様な人材が集い、成長し活躍できる企業」を掲げ、自由闊達な風土のも
と、安全で安心な職場環境を提供し、一人ひとりが生き生きとその能力を発揮できるよう努めています。また、従業員の自律的な成長を促し、やり
がいを持って働ける環境づくりに取り組んでまいります。
従業員一人ひとりの自律的な成長が、当社グループ全体の持続的な成長につながるとの考えのもと、新たなビジネスモデルの構築や変化する事
業環境に対応するため、従業員一人ひとりに能力向上の機会を提供し、成長戦略を確実に実行できる人材を育成しています。具体的な取組み状
況は、以下のとおりです。
・総合職3年育成体系ならびにキャリア採用者研修
・次世代経営層育成のための各種施策(役員塾、次世代経営幹部育成研修など)
・自己啓発支援および推奨
・自律的な成長を促進するための諸施策(1on1ミーティング等)
・キャリアプラン研修
また、経営理念に掲げる「人間尊重」の考え方を基盤として、従業員一人ひとりの多様な価値観を尊重し、多様な人材が持っている能力を存分に
発揮できる職場環境を整備しています。具体的には、2024年度より毎年エンゲージメントサーベイを実施し、その結果を踏まえたアクションプランを
職場単位で策定ならびに実行することで、従業員のエンゲージメント向上のためのPDCAを回しています。
さらに、多様な人材が活躍できる職場づくりの取組みとして、当社グループ全体での人権研修、ハラスメント防止教育、LGBTに関する理解促進を
目的とした研修、入社した社員や新任拠点長を対象にDE&Iの必要性について理解を深めてもらうための教育等を行っており、実施後のアンケート
を通じてその効果を確認しております。2021年より「ワークライフ支援デスク」を新設し、人権・ハラスメントのほか、職場の人間関係や育児、介護と
の両立、キャリアに関する相談などを幅広く受け、その解決のための支援を行っております。2025年度は22件の相談に対応しました。また、2024年
12月にDE&I宣言を行い、DE&Iの目的・意義を経営のトップメッセージとして公表いたしました。
各考え方、方針および取組みの詳細につきましては、当社のウェブサイトをご覧ください。
(URL)https://www.smm.co.jp/sustainability/management/human̲capital/
【原則2−6:企業年金のアセットオーナーとしての機能発揮】
当社は、資産運用委員会を設置し、企業年金の適切な運用および管理を行う体制を整えております。資産運用委員会では、運用基本方針や政策
的資産構成割合の策定・見直し、運用受託機関の評価などについて、年金運用責任者である当社社長に対して意見を述べることとしています。ま
た、資産運用委員会では、その事務局員を年金関係のセミナーへ出席させる等事務局員の専門性を高めることに努めています。
【原則3−1:情報開示の充実】
(i)経営理念、経営戦略
「SMMグループ経営理念」およびその原点である「住友の事業精神」、経営理念に基づき当社がめざすべき姿を示す「SMMグループ経営ビジョ
ン」、経営理念を実現するための役員・社員の行動基準である「SMMグループ行動基準」を以下の当社ウェブサイトに公表しております。
(SMMグループ経営理念)
(URL)https://www.smm.co.jp/corp̲info/philosophy/principle/
(住友の事業精神)
(URL)https://www.smm.co.jp/corp̲info/philosophy/sumitomo/
(SMMグループ経営ビジョン)
(URL)https://www.smm.co.jp/corp̲info/philosophy/vision/
(SMMグループ行動基準)
(URL)https://www.smm.co.jp/corp̲info/philosophy/conduct/
また、2025-2027年度の経営戦略である「中期経営計画2027」につきましても以下の当社ウェブサイトに公表しております。
(URL)https://www.smm.co.jp/ir/management/plan/
(ii)コーポレートガバナンスに関する基本的な考え方
コーポレートガバナンスに関する基本的な考え方を含む基本方針を「コーポレートガバナンスに関する基本方針」としてまとめ、以下の当社ウェブ
サイトにて公表しております。
(URL)https://www.smm.co.jp/ir/management/governance/
(iii)取締役および経営陣幹部の報酬の基本方針と手続
取締役(執行役員を兼務する者も含む)の個人別の報酬等の内容についての決定に関する方針は以下のとおりです。
1.基本方針
当社の取締役の報酬は、当社グループの持続的な成長と中長期的な企業価値の向上ならびに経営基盤の強化、維持に資するインセンティブとし
て十分機能するよう、当社の事業構造を踏まえ、中長期の目標達成のためにモチベ―ションが上がるよう設計した、業績と連動した報酬制度とす
る。個々の取締役の報酬の決定に際しては、公平性を期すために、あらかじめ決められた計算式に則って報酬額を導き出すこととしており、各職
責を踏まえた適正な水準とすることを基本方針とする。
具体的には、取締役(代表権のない取締役会長および社外取締役を除く)の報酬は、基本報酬、賞与および株式報酬とする。基本報酬は、固定報
酬(業績連動報酬等および非金銭報酬等のいずれでもないもの)および業績連動報酬等により構成し、賞与および株式報酬は業績連動報酬等と
する。代表権のない取締役会長および社外取締役の報酬は、基本報酬のみとし、賞与および株式報酬は支給しない。
基本報酬は、個人ごとの年額を算出し月割りで毎月支給し、賞与は、定時株主総会で承認を得た後に年1回支給し、株式報酬は譲渡制限付株式
とし、賞与支給が決定した後に年1回株式を付与する。
2.基本報酬について
1)代表取締役社長の報酬等の決定に関する方針
代表取締役社長の基本報酬は、固定報酬および業績連動報酬等により構成する。
固定報酬の額は、国内同業企業および当社と同規模の国内製造業企業の報酬水準を参考に設定した算定基礎額(「固定報酬算定基礎額」とい
います。)に、あらかじめ定められた職位別係数を乗じた額とする。
業績連動報酬等は、企業経営の評価という意味合いで前年度の親会社の所有者に帰属する当期利益および安全成績の目標値ならびにESGに
関する指標に対する達成度合いに応じて算定された額を支給する。
2)代表取締役会長の報酬等の決定に関する方針
代表取締役会長の基本報酬は、固定報酬および業績連動報酬等により構成する。
固定報酬の額は、固定報酬算定基礎額に、あらかじめ定められた職位別係数を乗じた額とする。
業績連動報酬等は、企業経営の評価という意味合いで前年度の親会社の所有者に帰属する当期利益の目標値およびESGに関する指標に対す
る達成度合いに応じて算定された額を支給する。
3)代表権のない取締役会長および社外取締役の報酬等の決定に関する方針
代表権のない取締役会長および社外取締役の基本報酬は、固定報酬により構成する。
固定報酬の額は、固定報酬算定基礎額に、あらかじめ定められた職位別係数を乗じた額とする。
また、代表権のない取締役会長または社外取締役が取締役会の議長を兼務する場合は、上記の基本報酬に加え、あらかじめ定められた固定報
酬を加算して支給する。
4)役付執行役員(副社長、専務執行役員および常務執行役員)を兼務する取締役の報酬等の決定に関する方針
役付執行役員を兼務する取締役の基本報酬は、固定報酬および業績連動報酬等により構成する。
固定報酬の額は、固定報酬算定基礎額に、あらかじめ定められた職位別係数を乗じた額とする。業績連動報酬等は、職責、部門業績、個人別業
績評価およびESGに関する指標に対する達成度合い等を勘案して支給額を決定する。
また、副社長または専務執行役員を兼務する代表取締役および常務執行役員を兼務する取締役には、上記の基本報酬に加え、職責等を勘案の
うえ、あらかじめ定められた固定報酬を加算して支給する。かかる固定報酬額は基本報酬額の1割を超えないものとする。
5)執行役員(役付執行役員を除く)を兼務する取締役の報酬等の決定に関する方針
執行役員を兼務する取締役の基本報酬は、その全額を職責等を勘案のうえ、あらかじめ定められた固定報酬とする。ただし、別に執行役員として
の基本報酬を使用人分給与として支給する。
3.賞与について
取締役賞与は、代表権のない取締役会長および社外取締役を除く取締役に支給するものとし、当該期の業績について取締役に対して報いるもの
として、親会社の所有者に帰属する当期利益が一定の額以上となった場合には、当該期にかかる定時株主総会に提案して審議する。
代表取締役社長、代表取締役会長および執行役員を兼務する取締役の賞与額は、当該期の親会社の所有者に帰属する当期利益の目標値に対
する達成度合いに応じて算定した基準額に、職位別係数を乗じること等によって算定した額の総額とする。
個人別の具体的な支給額は、各取締役の個人別業績評価およびESGに関する指標に対する達成度合い等を反映して決定する。
4.株式報酬について
株式報酬は、代表権のない取締役会長および社外取締役を除く取締役に支給するものとし、当該期の業績について取締役に対して報いるものと
して、賞与支給決定を条件に取締役会に提案し、株式付与を決定する。
代表取締役社長、代表取締役会長および執行役員を兼務する取締役の株式報酬は、賞与支給額決定と同様の決定方法とする。
5.固定報酬と業績連動報酬等に関わる割合の決定方針について
各取締役における固定報酬と業績連動報酬等の割合は、上記各報酬の算定方法に従って決定されるが、執行役員でない取締役会長および独立
社外取締役で構成するガバナンス委員会に諮問し、助言を得たうえで、報酬全体として企業価値向上のための適切なインセンティブとなるように
決定する。なお、親会社の所有者に帰属する当期利益が定められた水準に満たない場合は、賞与および株式報酬を支給しないこととする。
6.取締役の個人別の報酬等の内容についての決定の第三者への委任に関する事項
個人別の報酬額については、取締役会決議に基づき、代表取締役社長がその具体的内容の決定について委任を受けるものとし、その権限の内
容は、取締役の基本報酬および賞与の額ならびに株式報酬の決定とする。具体的な手続としては、取締役会の委任を受けた代表取締役社長が
各取締役の具体的な報酬額を、ガバナンス委員会に諮問し、助言を得たうえで決定する。決定に際しては、秘書室が稟議書を作成し代表取締役
社長が決裁する。結果については、ガバナンス委員会の委員である取締役会長が確認し、また監査役も確認する。
(iv)取締役候補者の指名および経営陣幹部の選解任の手続、監査役候補者の指名の手続
取締役候補者の指名にあたっては、社長が、当社が持続可能な発展をするうえで現在および今後の経営が向き合うべき課題(経済、環境および
人々(人権を含む)に与えるプラスまたはマイナスのインパクトなどを含む)を解決するための最善の布陣について、候補者の知識、経験、能力、
見識等を総合的に勘案し、執行役員でない取締役会長および株主をはじめとするステークホルダーに代わって経営陣を監督する独立社外取締役
で構成するガバナンス委員会において助言を得たうえで、適任者を取締役会に提案します。取締役会は、提案を受け審議し、候補者を決定しま
す。
執行役員候補者の選定にあたっては、社長が、各執行役員からの推薦を踏まえ、候補者の知識、経験、能力、見識等を総合的に勘案し、取締役
候補者と同様の手続きを経て決定します。
なお、ガバナンス委員会において、次期社長を育成する環境や方法、候補者等について審議する機会を設けます。また、執行役員に不正・不当ま
たは背信的な行為があった場合など、著しく適格性に欠ける場合には、ガバナンス委員会において助言を得たうえで、取締役会の決議により解任
できることとしています。
監査役候補者の指名にあたっては、社長が候補者の資質、財務・会計・法務に関する知識を含む知識、経験、能力、見識等について総合的に勘
案し、監査役会の事前の承認を得たうえで、適任者を取締役会に提案し取締役会において決定する方針とします。
取締役(執行役員である取締役を含みます。)候補者または監査役候補者の指名の理由は、株主総会参考書類に記載します。
(v)取締役・監査役候補者の指名または経営陣幹部の選解任に係る個々の指名または選解任の理由
第101期定時株主総会(2026年6月25日開催)における取締役候補者の指名の理由は、第101期定時株主総会参考書類に記載のとおりでありま
す。なお、当該参考書類は、以下の当社ウェブサイトに公表しております。
(URL)https://www.smm.co.jp/ir/stock/meeting/
【補充原則3−1−3:サステナビリティについての取組み等の情報開示】
1.サステナビリティについての取組み
当社グループは経営理念において「地球および社会との共存」を謳っており、事業精神が示す信頼関係構築、維持の手段を示すとともに、明るく
活力ある企業の実現として「人間尊重」を掲げています。これは、特に鉱山運営においては、目的の天然資源が存在する場所で採掘活動を行う必
要があり、またその事業は一般に数十年といった長期間にわたることから、操業地域における様々なステークホルダーとの信頼関係の構築・維持
が事業継続の大前提となるためです。
そして、「地球および社会との共存」と「人間尊重」を通じて目指すサステナビリティへの取組姿勢を定めたものが「住友金属鉱山グループサステナ
ビリティ方針」であり、社会の持続的発展への貢献を経営課題として明確に位置付けるとともに、貢献の持続性の担保と貢献度の向上を目的とし
て自社の持続的な成長も併せて定めています。
このサステナビリティ方針の実現に向けて2020年に策定した重要課題(マテリアリティ)を見直し、新たに重要課題と各重要課題に対応する「2030
年のありたい姿」を改正しました。「住友金属鉱山グループサステナビリティ方針」および重要課題と「2030年のありたい姿」は以下のサステナビリ
ティサイトにて公表しております。
(URL)https://www.smm.co.jp/sustainability/
当社におけるサステナビリティに関する具体的な取組みについては、サステナビリティサイトをご覧ください。なお、同サイトは、すべてのステークホ
ルダーの皆様との対話のツールとして、当社が所属する国際金属・鉱業評議会(ICMM)の「Mining Principles」に則り「GRIスタンダード」の開示要求
項目を参照して作成しています。
2.人的資本への投資
当社は、重要課題「人的資本経営」における「2030年のありたい姿」である「多様な人材が集い、成長し活躍できる企業」を実現するために、多様性
確保に向けた人材育成や健康経営の推進など、人材への積極的な投資等に取り組んでいます。
人的資本の活用に向けた具体的な取組みについては、上記「【補充原則2−4−1:中核人材の登用等における多様性の確保】」に記載している
ほか、サステナビリティサイトにおいても開示しております。
3.知的財産への投資
当社は、資源、製錬および材料をコアビジネスとして選択と集中を進めるなか、研究開発においても研究開発費の重点配分を行っています。重要
課題「非鉄金属の安定供給とサーキュラーエコノミーへの貢献」においては、資源、製錬、材料の3部門連携を推進し、リチウム精製、電池リサイク
ル、新製錬技術等のプロセス開発を継続するとともに、重要課題「カーボンニュートラル社会への貢献」においては、温室効果ガス(GHG)排出を抑
制できる製品として電池正極材、当社独自技術による近赤外線吸収材料の開発も継続し取り組んでおります。
研究開発の主要な取組みや成果、投入した研究開発費等については、統合報告書および有価証券報告書において開示しています。
4.気候変動が当社の事業・収益に与える影響
当社は長期ビジョン達成に向けた重要課題に「カーボンニュートラル社会への貢献」をあげ、それに対するありたい姿である「カーボンニュートラル
実現に向けて、温室効果ガス(GHG)排出量削減とともに低炭素貢献技術の開発に積極的に取り組む企業」として取組みを強化しています。具体
的には、2023年12月にカーボンニュートラルに向けた中間目標とロードマップを策定したほか、気候変動が当社の事業・収益に与える影響につい
て、1.5℃と4.0℃の二つのシナリオ分析を実施しております。
また、気候関連のリスクと機会について、TCFD提言に沿い、企業の経営・運営における中核的要素の4項目(ガバナンス、戦略、リスク管理、指標
と目標)の視点から整理し、サステナビリティサイトにおいて各項目の情報開示を行っています。
なお、カーボンニュートラルに向けた中間目標とロードマップについては、サステナビリティサイトで公表しております。
【補充原則4−1−1:取締役会の経営陣に対する委任の範囲の概要】
当社では、法令および定款に従い、取締役会から経営陣に対して、業務執行の決定を委ねております。
具体的には、取締役会は、取締役会において定めた取締役会規程に基づき、株主総会、取締役・執行役員、経営方針・経営計画、リスクマネジメ
ント、サステナビリティ、組織・人事、プロジェクトなどに関する重要な事項について決議することとしており、この規程で定めた基準に該当しない事
項については、同じく取締役会において定めた諸規程に基づき、社長や執行役員などにその決定を委ねております。
【補充原則4−2−2:サステナビリティを巡る取組みに関する基本的な方針の策定ならびに経営資源の配分および事業ポートフォリオに関する戦
略の実行の監督】
当社は、取締役会での議論を経て、サステナビリティの取組みに関する基本的な方針として、「住友金属鉱山グループサステナビリティ方針」にお
いて、社会の持続的発展に貢献する経営課題に取り組み、事業の持続的な成長と企業価値の向上を図ることを掲げております。また、サステナビ
リティ方針の実現に向けて重点的に取り組む個別課題を「重要課題」として、重要課題への取組みを通じて目指す2030年時点の社会からの評価
を「2030年のありたい姿」として定め、それぞれ公表しております。
また当社グループは、社長を委員長とするサステナビリティ委員会を中心にサステナビリティ活動を推進しており、以下の事項を審議内容としてい
ます。
・サステナビリティ方針、重要課題(マテリアリティ)の改廃案
・サステナビリティ推進活動のロードマップおよびKPI
・サステナビリティ推進活動に関する定期的な評価および是正措置
・サステナビリティ推進活動に関する情報共有、重要な課題・施策の説明、認識の共有化
・その他サステナビリティ推進活動に関する重要事項
経営資源の配分および事業ポートフォリオに関する戦略の実行の監督については、下記【補充原則5−2−1:事業ポートフォリオに関する基本的
な方針の策定および見直しの状況】に基づき実施しております。
【原則4−8:独立社外取締役の有効な活用】
当社は、取締役のうち3分の1以上を独立した社外取締役として選任しております。後記「3.現状のコーポレート・ガバナンス体制を選択している
理由」に記載のとおり、資源・製錬・材料の3事業をコアビジネスと位置付けております。これらの事業はいずれも非鉄金属に関わる事業であり相
互に有機的な関連を持っており、多様な経営課題について意思決定を行い、当社の事業を成長させていくには、社内出身の取締役と独立社外取
締役がそれぞれ一定割合存する現在の取締役会の構成が最適であると考えています。当社の事業や社内の状況をよく理解する者と、株主をはじ
めとするステークホルダーの視点からの意見を述べる独立社外取締役とが、多様な視点で充実した審議を行うことが当社や当社の株主その他の
ステークホルダーの最善の利益に資すると考えております。
【原則4−9:独立社外取締役の独立性判断基準】
「コーポレートガバナンスに関する基本方針」「6−3−3独立性の基準」において、独立性判断基準を定め、以下の当社ウェブサイトで公表してお
ります。
(URL)https://www.smm.co.jp/ir/management/governance̲policy/
【補充原則4−10−1:指名委員会・報酬委員会の指名や報酬などの検討への適切な関与・助言】
当社は監査役会設置会社であり、取締役のうち3分の1以上を独立した社外取締役として選任しております。取締役および執行役員の指名や報
酬の決定をはじめとするコーポレートガバナンス上の重要な事項について、社長に対して客観的な立場から助言を行う、任意の委員会であるガバ
ナンス委員会を設置しています。これにより、経営の透明性を高め、コーポレートガバナンスの強化を図っています。詳細については後記「Ⅱ経営
上の意思決定、執行及び監督に係る経営管理組織その他のコーポレート・ガバナンス体制の状況 1.機関構成・組織運営等に係る事項【取締役
関係】指名委員会又は報酬委員会に相当する任意の委員会の有無」に記載のとおりです。
【補充原則4−11−1:取締役会の全体としての知識・経験・能力のバランス、多様性および規模に関する考え方】
取締役会は、当社事業の各分野に精通した当社出身者に加え、社内出身者とは異なる知識、経験、能力、見識等を有する社外有識者を招聘する
ことにより、多様性を持った構成とします。「Ⅱ.3.現状のコーポレート・ガバナンス体制を選択している理由」に記載している「取締役会のあるべき
姿」を踏まえ、取締役および監査役のスキル・マトリックスを後記の添付資料に記載のとおり作成しております。各スキル項目は、長期ビジョンの達
成や、各重要課題に対応する「2030年のありたい姿」の実現のために必要なものを中心に取締役会での議論を経て選定されております。当社取
締役会に求められる知識、経験、能力、見識等は、経営戦略や外部環境の変化に応じて変わり得るため、今後も必要な知識、経験、能力、見識
等について取締役会で議論し、必要に応じてスキル・マトリックスを更新します。取締役会の規模については、取締役会の機動性を確保し活発な
議論を行ううえで適切な人数とします。また、取締役のうち3分の1以上を独立した社外取締役として選任し、より透明性の高い経営をめざします。
【補充原則4−11−2:取締役・監査役の兼任状況】
取締役・監査役の兼任状況は、事業報告および株主総会参考書類に記載のとおりであります。なお、事業報告および株主総会参考書類は、以下
の当社ウェブサイトに公表しております。
(URL)https://www.smm.co.jp/ir/stock/meeting/
【補充原則4−11−3:取締役会全体の実効性についての分析・評価とその結果】
当社取締役会は、適切な業務執行の決定および監督機能の向上の観点から取締役会の実効性を分析・評価しております。なお、実効性の分析・
評価の基礎となる、「取締役会のあるべき姿」については、下記「Ⅱ.3.現状のコーポレート・ガバナンス体制を選択している理由」に記載のとおり
です。
2025年度における取締役会の実効性について、分析・評価を行いましたので、その結果の概要を以下のとおり開示します。
1.分析・評価のプロセス
取締役会は、外部評価者(法律事務所)の協力を得て、昨年度の課題や社内取締役、社外取締役、社内監査役および社外監査役に関するカテ
ゴリーごとの相互評価も含めた、取締役および監査役に対する質問票を作成しアンケートを実施しております。回答内容の集計およびその分析も
外部評価者に委託しております。取締役会は、回答内容の集計結果、外部評価者による評価および2016年度に確認した「取締役会のあるべき姿
(意思決定機能を重視した取締役会を志向していく)」に基づき、2026年2月の定時取締役会において取締役会の実効性について審議し、その評
価と今後の対応について確認しました。
1)質問票
対象者 :全取締役(8名)および全監査役(4名)
回答方式:無記名(全46問)
評価項目:①取締役会の監督機能、②取締役会の役割・機能・規模・構成、③取締役・監査役の役割、④取締役会の運営状況、⑤過年度の指
摘への対応、⑥自己評価、⑦投資家・株主との関係、⑧ガバナンス委員会の運営状況
2.分析・評価結果の概要
1)質問票への回答および外部評価者の分析・評価結果は以下のとおりです。
① 取締役会の実効性に関わる大半の項目において高評価の回答が示されており、概ね取締役会は実効的に機能していると評価できます。
② アンケートにおいては、個々の役員が高評価としなかった項目についてその理由を記載できるようにしていますが、現在の体制・運営や従
前の取組みについて一定の評価をした上で、現状をより良くするための意見が多く、その内容も、毎年の実効性評価を経てより具体的なものとな
りました。
2)質問票への回答および外部評価者の分析・評価結果を踏まえ、以下の各事項について取締役会において審議を行いました。
① 取締役会のモニタリング機能の充実・向上や意思決定の迅速化を志向すべき等の意見があり、2026年度においては、2025年度より取り組
んでいる取締役会のあるべき姿の見直しを含めた議論をさらに充実させることを確認しました。
② 取締役会に共有された投資家・株主の評価・意見の分析と対応の議論を一層充実させるとともに、当社の情報発信の在り方も議論すべきと
の意見があり、今後、情報発信の在り方も含め、資本市場での当社の評価向上に必要な対応を取締役会において議論することを確認しました。
③ その他の事項として、取締役会運営の更なる改善(討議事項の充実、事前説明の有効活用、資料提供の早期化等)や、取締役会のあるべ
き姿の見直し等を踏まえた取締役会事務局の体制強化等について確認しました。
3.今後の対応
当社取締役会は、上記事項について今後継続的に取り組むことにより取締役会の実効性をさらに高めていくことを確認しました。
<監査役監査および監査役会の実効性についての分析・評価とその結果>
当社の監査役会は、監査役監査および監査役会の実効性を確認し、向上させることを目的として、その実効性の分析と評価を行っています。20
25年度における結果の概要は以下のとおりです。
1.評価プロセス
外部専門家(アンダーソン・毛利・友常法律事務所外国法共同事業)に独立・客観的な立場からの分析・評価を委託し、a.全監査役に対するアン
ケート(28の評価項目)、b.全監査役に対する個別インタビュー、c.外部専門家の評価結果および指摘事項を踏まえた監査役会での議論を実施し
ました。
2.分析・評価結果の概要(総評)
外部専門家からは、以下の点を含む監査活動に鑑み、「充実した監査活動が行われている」との総評を受けました。これも踏まえ、監査役会としま
しても、監査役会は有効に機能しており、監査役監査は実効性を有していると評価しました。
・各監査役が、取締役会等の重要会議への出席、代表取締役を含む執行側へのヒアリング、各拠点・関係会社への往査を中心に監査を行うと
ともに、経営層・部門長・各往査先等に対し、必要な意見表明、指摘を行っている。特に、社外監査役も、これらの往査等に常勤の監査役と同様に
参加しており、他社の社外監査役に比べても相応の負担のもとで監査活動に従事している。
・監査にあたり、監査役の独任性の観点から社外監査役を含む各監査役がそれぞれ各拠点・関係会社を自らの目で見て、現地の責任者等と
直接コミュニケーションをとることを重視している。
・ 2024年度に引き続き、監査役会とは別に監査役ミーティングを開催し、2025年度からはその日程や主要議題を事前に案内するようにしつつ、
自由な意見交換を実施するなど、監査役会の実効性向上に向けて可能な改善に取り組んでいる。
3.課題および課題に対する今後の主な取組事項
外部専門家からは、上記総評を前提としつつ、監査活動の一層の充実を図る観点から、課題の指摘がありました。それを踏まえ、監査役会とし
て今後取り組んでいくことを確認した主な課題およびその取組事項は以下のとおりです。その他の諸課題についても引き続き検討していきます。
1)監査活動および監査役間の情報共有・連携に関する事項
往査に当たり、社外監査役の往査拠点への理解を促すため、参考にすべき過去の往査資料等を選定のうえ共有し、事前閲覧を促す時期・方
法を揃えるなど、往査前の情報共有に係る対応の徹底を検討する。
2)不正・不祥事が発生した場合の対応体制に関する事項
現状においても、不正・不祥事が発生した場合に監査役会として執行側に要求すべき事項を議論のうえ、執行側に必要に応じて意見を述べ
ているが、今後想定される不正・不祥事や対応の優先度についても、監査役間で議論のうえ準備しておくことを検討する。
3)監査計画・個別重点監査事象の設定に関する事項
往査の更なる充実のため、1拠点あたりの往査時間を増加させる。また、拠点の事業上の重要性やリスクについて監査役間で意見交換をし
たうえで、リスクの度合いに応じた重点的な往査計画の策定および期中における状況変化に応じた往査先の変更などを検討する。
監査役および監査役会は、今後とも監査活動の実効性の向上を図り、当社グループの経営基盤の強化および企業価値の向上に貢献すべく努
めてまいります。
【補充原則4−14−2:取締役・監査役に対するトレーニングの方針】
取締役および監査役の研修は、個々人の自己研鑽を基本としますが、自己研鑽に資するよう、トレーニングの機会の提供・斡旋やその費用の支
援を行います。
具体的には、新任の取締役、監査役および執行役員に対しては、就任時に役員の法的責任、コンプライアンスおよび法律知識に関する研修を実
施します。また、取締役、監査役および執行役員その他を対象として、種々の社内研修を開催し、弁護士その他の社外有識者による講演等を通じ
て時宜に応じた情報の収集がなされるように努めます。そのほか、社外セミナーの紹介等、トレーニング機会に関する情報を提供します。
上記を含め、取締役・監査役および執行役員のトレーニングに要する費用は、当社が全額を負担します。
【原則5−1:株主との建設的な対話に関する方針】
当社は、株主・投資家の皆様のご理解とご支援をいただくことは、会社の持続的成長と中長期的な企業価値向上のために不可欠であると考えま
す。そのため、中長期的な企業価値向上の観点から株主・投資家の皆様との建設的な対話に向け、当社へのご理解を深めていただくべく次のと
おりIR活動を展開します。
(i)株主・投資家の皆様との対話および情報開示は、社長が統括し、広報IR部所管執行役員を担当役員とします。
(ii)開示すべき情報か否かは、情報開示の責任者(広報IR部長)が判断を行います。
(iii)開示資料の作成にあたっては、広報IR部が各事業部部門をはじめ、サステナビリティ推進部門、法務部門等関係部門と連携を取り、公平・適
時・適切な開示を行います。
(iv)機関投資家および証券アナリストを対象に開催する決算説明会や事業説明会、国内外の投資家との面談等には、社長や事業本部長、IR担当
役員、社外取締役を含む取締役が合理的な範囲で出席して説明し、社長による決算や経営戦略に関する説明会を開催するほか、個人投資家を
対象とした説明会を開催するなど、当社事業に対する理解を深めていただくための施策を実施します。また、当社ウェブサイトに個人投資家向け
のコーナーを設け、IR情報のわかりやすい開示に努めます。
(v)株主・投資家の皆様とのコミュニケーションを通じてもたらされるご意見・ご要望は、定期的に経営陣や取締役会にフィードバックし、当社の経営
に生かします。
(vi) 決算発表の準備期間中に株価に影響を与える情報の漏洩を防ぎ、公平性を確保するため、年間および各四半期決算発表の前、概ね2週間
を「沈黙期間」として設定し、決算に関するコメントや質問への回答を控えます。また、社内稟議書には情報開示に関する事項を記載して、情報管
理について確認するほか、株主・投資家の皆様との対話にあたっては担当部門がインサイダー情報の開示およびフェア・ディスクロージャー・ルー
ルに基づき未公表の重要情報の選択的開示を行わないことを徹底します。またもし、未公表の重要情報が選択的に開示されたと認識した場合
は、原則として速やかに当該情報を開示します。
当社はIR活動や株主との建設的な対話の充実を図るため、定期的に株主名簿について、株主分布状況を把握するとともに、実質株主の判明調
査を実施しております。
【株主との対話の実施状況等】
当社は、上記【原則5−1:株主との建設的な対話に関する方針】に記載の基本方針に基づき、株主・機関投資家との対話を実施していますが、20
25年度の実施状況については、下記「 Ⅲ.2.IRに関する活動状況」に記載のとおりです。
株主・機関投資家との対話においては「銅・ニッケルの需給・市況と価格の動向」「鉱山開発プロジェクトの進捗」「車載用正極材事業の動向」「資本
コストや株価を意識した経営」「カーボンニュートラルへの取組み状況」「株主還元方針」等に株主・機関投資家の関心が集まりました。
【補充原則5−2−1:事業ポートフォリオに関する基本的な方針の策定および見直しの状況】
事業単位(連結ベース)ごとに、ROCE(使用資本利益率)を指標として事業ポートフォリオを管理します。1中期経営計画期間において基準値を下
回った場合、「継続可否を確認する事業」と位置づけ、その後の2年間において事業の継続性確認と改善および変革を行い、その翌年度に最終的
な判断をすることを原則とし、取締役会はその状況を定期的に監督することとします。中期経営計画2027においてはROCEの基準値を6.5%として
います。
【資本コストや株価を意識した経営の実現に向けた対応】
記載内容
取組みの開示(アップデート)
英文開示の有無
有り
アップデート日付
2026年3月23日
該当項目に関する説明
資本コストや株価を意識した経営の実現に向けた対応については、当社ウェブサイト上の「中期経営計画2027」において開示しておりましたが、そ
の一部である「財務戦略の基本方針」および「株主還元方針」については、資本構成の最適化と資本効率の向上、より適切な株主還元の観点か
ら、以下のとおり変更することを2026年2月9日付で公表しております。
本変更は、2026年3月期から適用します。
・財務戦略の基本方針(変更後)
財務健全性の観点から、連結自己資本比率(親会社所有者帰属持分比率)を50%超とし、また、資本コストを意識した経営を推進するため、その
適正水準を55%と位置づけ、株主還元等を強化し2028年3月期までに58%とすることを目指す。
・株主還元方針(変更後)
1.剰余金の配当は、原則連結配当性向35%以上とし、連結自己資本比率が当社の適正水準とする55%を上回る間は、下限指標をDOE3.5%(※)
とする。
※DOE=年間配当総額÷株主資本(算定に用いる株主資本は確定値である前期末のものを採用するとともに、親会社の所有者に帰属する連結
純資産からその他の資本の構成要素を除外する。)
2.株主還元は、剰余金の配当を中核としつつ、当社の業績及び財務状況を踏まえ、投資機会や資本水準を総合的に勘案したうえで、自己株式
の取得などを含め機動的に実施する。
「中期経営計画2027」
(URL)https://www.smm.co.jp/ir/management/plan/
「財務戦略の基本方針、株主還元方針の変更及び配当予想の修正に関するお知らせ」
(URL)https://www.smm.co.jp/news/release/uploaded̲files/260209̲3̲JP.pdf
2.資本構成
外国人株式保有比率
30%以上
【大株主の状況】
氏名又は名称
所有株式数(株)
割合(%)
日本マスタートラスト信託銀行株式会社 (信託口)
46,388,390
17.28
株式会社日本カストディ銀行 (信託口)
16,551,070
6.16
STATE STREET BANK AND TRUST COMPANY 505001
13,386,241
4.99
トヨタ自動車株式会社
11,058,000
4.12
BNYM AS AGT/CLTS NON TREATY JASDEC
5,808,284
2.16
住友生命保険相互会社
3,737,000
1.39
JP MORGAN CHASE BANK 385781
3,655,796
1.36
THE CHASE MANHATTAN BANK, N.A. LONDONSECS LENDING OMNIBUS ACCOUNT
3,294,692
1.23
日本生命保険相互会社
3,109,932
1.16
JPモルガン証券株式会社
2,962,282
1.10
支配株主(親会社を除く)の有無
―――
親会社の有無
なし
補足説明
1.資本構成は、2026年9月30日現在の状況を記載しております。
2.当社は、自己株式20,260,969株を保有しております。
3.企業属性
上場取引所及び市場区分
東京 プライム
決算期
3月
業種
非鉄金属
直前事業年度末における(連結)従業員
数
1000人以上
直前事業年度における(連結)売上高
1兆円以上
直前事業年度末における連結子会社数
50社以上100社未満
4.支配株主との取引等を行う際における少数株主の保護の方策に関する指針
―――
5.その他コーポレート・ガバナンスに重要な影響を与えうる特別な事情
国内の金融商品取引所に上場している子会社はありません。
Ⅱ経営上の意思決定、執行及び監督に係る経営管理組織その他のコーポレート・ガバナンス体制の状況
1.機関構成・組織運営等に係る事項
組織形態
監査役設置会社
【取締役関係】
定款上の取締役の員数
10 名
定款上の取締役の任期
1年
取締役会の議長
会長(社長を兼任している場合を除く)
取締役の人数
8名
社外取締役の選任状況
選任している
社外取締役の人数
4名
社外取締役のうち独立役員に指定され
ている人数
4名
会社との関係(1)
氏名
属性
石井妙子
弁護士
木下学
他の会社の出身者
竹内光二
他の会社の出身者
サワキ ニコラ ミシェール
他の会社の出身者
a
b
c
d
会社との関係(※)
e f
g h
※ 会社との関係についての選択項目
※ 本人が各項目に「現在・最近」において該当している場合は「○」、「過去」に該当している場合は「△」
※ 近親者が各項目に「現在・最近」において該当している場合は「●」、「過去」に該当している場合は「▲」
a
上場会社又はその子会社の業務執行者
b
上場会社の親会社の業務執行者又は非業務執行取締役
c
上場会社の兄弟会社の業務執行者
d
上場会社を主要な取引先とする者又はその業務執行者
e
上場会社の主要な取引先又はその業務執行者
f
上場会社から役員報酬以外に多額の金銭その他の財産を得ているコンサルタント、会計専門家、法律専門家
g
上場会社の主要株主(当該主要株主が法人である場合には、当該法人の業務執行者)
h
上場会社の取引先(d、e及びfのいずれにも該当しないもの)の業務執行者(本人のみ)
i
社外役員の相互就任の関係にある先の業務執行者(本人のみ)
j
上場会社が寄付を行っている先の業務執行者(本人のみ)
k
その他
△
i
j
k
会社との関係(2)
氏名
石井妙子
木下学
独立
役員
適合項目に関する補足説明
選任の理由
石井妙子氏は、弁護士として特に労働分野を
はじめとする豊富な専門知識と経験を有してお
ります。同氏には、当社グループの持続的な成
長と中長期的な企業価値の向上を図るため、
ご自身の経験等を背景に特にコンプライアンス
や人事・労務関連分野に関して助言をいただ
き、取締役会の意思決定に参加していただくこ
とによりその質が高まることを期待しておりま
す。また、独立した客観的な立場から、取締役
会を通じて経営に対するチェック機能を発揮し
ていただくとともに、ガバナンス委員会の委員と
して、取締役および執行役員の指名や報酬等
の意思決定に際し助言を行うことを通じて株主
をはじめとするステークホルダーに代わって経
営陣を監督していただきたいと考えておりま
す。これらにより、取締役会の意思決定の質の
さらなる向上を実現し、あわせて監督機能が充
実されることを期待しております。同氏には当
社の社外取締役およびガバナンス委員会の委
員長として、上記の役割を果たしていただいて
いるため、社外取締役に選任しております。ま
た、一般株主と利益相反の生じるおそれがない
と判断し、独立役員として指定しております。
○
―
○
木下学氏は、日本電気株式会社にて執行役員
副社長等の職責を担い、会社経営およびデジ
タルビジネスに関する豊富な知識と経験を有し
ております。同氏には、当社グループの持続的
な成長と中長期的な企業価値の向上を図るた
め、ご自身の経験等を背景に特に事業環境の
変化が著しい材料事業やデジタル分野に関し
木下学氏は、当社の取引先である日本電 て助言をいただき、取締役会の意思決定に参
気株式会社の執行役員副社長等を務め 加していただくことを期待しております。また、
ておりました。
独立した客観的な立場から、取締役会を通じて
2026年3月期において、当社の同社に対経営に対するチェック機能を発揮していただくと
する売上高はありません。また、当社は同 ともに、ガバナンス委員会の委員として、取締
役および執行役員の指名や報酬等の意思決
社との間で設備・ソフト仕入れおよび保
守・リース等に関する取引がありますが、定に際し助言を行うことを通じて株主をはじめと
当社の同社に対する支払額は241百万円 するステークホルダーに代わって経営陣を監督
であり、同社(単体)の売上高に対する割 していただきたいと考えております。これらによ
り、取締役会の意思決定の質のさらなる向上を
合は0.0%です。
実現し、あわせて監督機能が充実されることを
期待しております。同氏には当社の社外取締
役およびガバナンス委員会の委員として、上記
の役割を果たしていただいているため、社外取
締役に選任しております。また、一般株主と利
益相反の生じるおそれがないと判断し、独立役
員として指定しております。
―
竹内光二氏は、味の素グループの半導体パッ
ケージ基板用材料の研究開発に長年にわたっ
て携わったほか、電子材料事業での実務経験
を有し、また、その主要子会社では取締役副社
長等の職責を担うなど、会社経営および機能
性材料に関わる事業に関する豊富な経験と知
識を有しております。同氏には、当社グループ
の持続的な成長と中長期的な企業価値の向上
を図るため、ご自身の経験等を背景に、とりわ
け研究開発や材料事業に関して助言をいただ
き、取締役会の意思決定に参加いただくことを
期待しております。また、独立した客観的な立
場から、取締役会を通じて経営に対するチェッ
ク機能を発揮していただくとともに、ガバナンス
委員会の委員として、取締役および執行役員
の指名や報酬等の意思決定に際し助言を行う
ことを通じて株主をはじめとするステークホル
ダーに代わって経営陣を監督していただきたい
と考えておリます。これらにより、取締役会の意
思決定の質のさらなる向上を実現し、あわせて
監督機能が充実されることを期待しておりま
す。同氏には当社の社外取締役およびガバナ
ンス委員会の委員として、上記の役割を果たし
ていただいているため、社外取締役に選任して
おります。また、一般株主と利益相反の生じる
おそれがないと判断し、独立役員として指定し
ております。
○
―
サワキ ニコラ ミシェール氏は、国内外の監査
法人における長年にわたる監査の経験および
会計に関する豊富な知識を有しております。同
氏には、当社グループの持続的な成長と中長
期的な企業価値の向上を図るため、ご自身の
経験等を背景に、特に財務・会計関連分野に
関して助言をいただき、取締役会の意思決定
に参加していただくことを期待しております。ま
た、独立した客観的な立場から、取締役会を通
じて経営に対するチェック機能を発揮していた
だくとともに、ガバナンス委員会の委員として、
取締役および執行役員の指名や報酬等の意
思決定に際し助言を行うことを通じて株主をは
じめとするステークホルダーに代わって経営陣
を監督していただきたいと考えております。これ
らにより、取締役会の意思決定の質のさらなる
向上を実現し、あわせて監督機能が充実され
ることを期待しております。同氏には当社の社
外取締役およびガバナンス委員会の委員とし
て、上記の役割を果たしていただいているた
め、社外取締役に選任しております。また、一
般株主と利益相反の生じるおそれがないと判
断し、独立役員として指定しております。
指名委員会又は報酬委員会に相当する
任意の委員会の有無
あり
竹内光二
○
サワキ ニコラ ミシェール
任意の委員会の設置状況、委員構成、委員長(議長)の属性
委員会の名称
全委員(名)
常勤委員
(名)
指名委員会に相当
する任意の委員会
ガバナンス委員会
5
0
1
4
0
0
社外取
締役
報酬委員会に相当
する任意の委員会
ガバナンス委員会
5
0
1
4
0
0
社外取
締役
補足説明
社内取締役社外取締役社外有識者
委員長(議
その他(名)
(名)
(名)
(名)
長)
1.委員会の構成および独立性に関する考え方
ガバナンス委員会は、執行役員でない取締役会長および独立社外取締役全員から構成します(取締役会長を置かない場合は、独立社外取締役
のみで構成します。)。当社は、取締役の員数の3分の1以上を独立社外取締役とすることとしているため、ガバナンス委員会の委員の過半数は
独立社外取締役です。なお、委員長は原則として独立社外取締役の中から定めます。
2.委員の氏名
社外取締役石井妙子 (委員長)
社外取締役木下学
社外取締役竹内光二
社外取締役 サワキ ニコラ ミシェール
取締役会長野崎明
3.委員会の権限および役割
ガバナンス委員会は、次の事項について助言を行います。
1)取締役、代表取締役、経営執行役および執行役員の指名および解任
2)取締役および経営執行役の報酬および賞与の決定
3)前各号のほかコーポレートガバナンス上の重要事項
4.活動状況
2025年度は7回(指名1回、報酬3回、ガバナンスその他3回)開催し、全ての回に開催当時の委員全員が出席しました。
【監査役関係】
監査役会の設置の有無
設置している
定款上の監査役の員数
5名
監査役の人数
4名
監査役、会計監査人、内部監査部門の連携状況
内部監査部門である監査部は、当社グループ全体を対象として業務執行の監査を定期的に行っています。
監査部は、監査役および監査役会に対しては監査計画の説明をはじめ、適宜情報を提供しています。一方、監査役も、監査役会で決定した監査
計画を監査部に提供し、監査部の監査に立ち会うことがあるほか、執行役員や部門長に対する内部監査結果の報告会に同席しており、2025年度
は18回出席しました。会計監査人は現在、有限責任あずさ監査法人が務めており、独立監査人として会計監査および内部統制監査を実施してい
ます。会計監査人と監査役の間でも、監査役が監査計画を会計監査人に提供し、会計監査人から監査計画の説明、四半期レビュー報告および監
査結果の報告を受けるなど連携を図っています。
社外監査役の選任状況
選任している
社外監査役の人数
2名
社外監査役のうち独立役員に指定され
ている人数
2名
会社との関係(1)
氏名
属性
若松昭司
公認会計士
家田嗣也
他の会社の出身者
a
b
c
d
※ 会社との関係についての選択項目
※ 本人が各項目に「現在・最近」において該当している場合は「○」、「過去」に該当している場合は「△」
※ 近親者が各項目に「現在・最近」において該当している場合は「●」、「過去」に該当している場合は「▲」
a
上場会社又はその子会社の業務執行者
b
上場会社又はその子会社の非業務執行取締役又は会計参与
c
上場会社の親会社の業務執行者又は非業務執行取締役
d
上場会社の親会社の監査役
e
上場会社の兄弟会社の業務執行者
f
上場会社を主要な取引先とする者又はその業務執行者
会社との関係(※)
e f g h i j
△
k
l
m
g
h
i
j
k
l
m
上場会社の主要な取引先又はその業務執行者
上場会社から役員報酬以外に多額の金銭その他の財産を得ているコンサルタント、会計専門家、法律専門家
上場会社の主要株主(当該主要株主が法人である場合には、当該法人の業務執行者)
上場会社の取引先(f、g及びhのいずれにも該当しないもの)の業務執行者(本人のみ)
社外役員の相互就任の関係にある先の業務執行者(本人のみ)
上場会社が寄付を行っている先の業務執行者(本人のみ)
その他
会社との関係(2)
氏名
若松昭司
家田嗣也
独立
役員
適合項目に関する補足説明
選任の理由
若松昭司氏は、監査法人における長年にわた
る監査の経験および会計に関する豊富な知識
を有しております。同氏には、当社グループの
経営の健全性の確保および中長期的な企業価
値の向上を図るため、常勤の監査役と十分な
連携を行いながら、ご自身の知見、経験等に基
づき、特に会計分野で実効的な監査を行ってい
ただくことを期待しております。また、監査の一
環として取締役会をはじめとする重要な会議に
参加し、意思決定の過程において、独立した客
観的な立場から、提案内容の適法性のみなら
ず、妥当性を含め、積極的に忌憚のない意見
を述べていただくことを期待しております。同氏
には上記の役割を果たしていただいているた
め、社外監査役に選任しております。また、一
般株主と利益相反の生じるおそれがないと判
断し、独立役員として指定しております。
○
―
○
家田嗣也氏は、金融機関における長年にわた
る豊富な経験と会社経営に関する知見を有し
家田嗣也氏は、当社の特定関係事業者 ております。同氏には、当社グループの経営の
(主要な取引先)である株式会社国際協力健全性の確保および中長期的な企業価値の向
銀行の執行役員西日本総代表を2015年6 上を図るため、常勤の監査役と十分な連携を
月まで務めておりました。
行いながら、金融分野を中心とするご自身の知
2026年3月期における当社(単体)の同行見、経験等に基づき、実効的な監査を行ってい
からの借入残高は120,724百万円であり、 ただくことを期待しております。また、監査の一
当社(単体)の総資産に対する割合は5.0 環として取締役会をはじめとする重要な会議に
参加し、意思決定の過程において、独立した客
%です。
なお、2015年7月に同氏が同行を退職して 観的な立場から、提案内容の適法性のみなら
から満10年が経過しており、当社の少数 ず、妥当性を含め、積極的に忌憚のない意見
株主の利益という観点から、同氏の独立 を述べていただくことを期待しております。同氏
性に影響はないと当社は判断しておりま には上記の役割を果たしていただいているた
め、社外監査役に選任しております。また、一
す。
般株主と利益相反の生じるおそれがないと判
断し、独立役員として指定しております。
【独立役員関係】
独立役員の人数
6名
その他独立役員に関する事項
当社の社外取締役および社外監査役は、株式会社東京証券取引所が定める独立性基準および当社が定める独立性基準に照らし独立性を有し
ており、社外取締役および社外監査役全員を株主と利益相反の生じるおそれのない独立役員として届け出ております。なお、当社は、「コーポレー
トガバナンスに関する基本方針」「6−3−3独立性の基準」において独立性基準を定め、以下の当社ウェブサイトで公表しております。
(URL)https://www.smm.co.jp/ir/management/governance̲policy/
【インセンティブ関係】
取締役へのインセンティブ付与に関する
施策の実施状況
業績連動報酬制度の導入、その他
該当項目に関する補足説明
当社の取締役(代表権のない取締役会長および社外取締役を除く)の報酬は毎年の業績に連動しております。業績連動報酬にかかる業績指標
の内容、当該指標の選定の理由、金額の決定方法等については「Ⅱ経営上の意思決定、執行及び監督に係る経営管理組織その他のコーポレー
ト・ガバナンス体制の状況 1.機関構成・組織運営等に係る事項【取締役報酬関係】報酬の額又はその算定方法の決定方針の開示内容」に記載
のとおりです。
また当社は、当社の取締役(代表権のない取締役会長および社外取締役を除く)に当社の企業価値の持続的な向上を図るインセンティブを与える
とともに、株主の皆様との一層の価値共有を進めることを目的として、2025年6月26日開催の第100期定時株主総会において、対象取締役に対し、
新たに譲渡制限付株式報酬制度を導入いたしました。
本制度に基づく対象取締役に対する譲渡制限付株式付与のための報酬等の総額は、本制度の目的を踏まえ相当と考えられる金額として年額30
百万円以内としており、また、これにより発行または処分される当社の普通株式の総数は、年1.5万株以内としております。
ストックオプションの付与対象者
該当項目に関する補足説明
―――
【取締役報酬関係】
(個別の取締役報酬の)開示状況
一部のものだけ個別開示
該当項目に関する補足説明
連結報酬等の総額が1億円以上の者は、有価証券報告書において個別開示を行っています。有価証券報告書、事業報告は、当社ウェブサイトに
も掲載し、公衆の縦覧に供しています。
役員区分ごとの報酬等の総額、報酬等の種類別の総額および対象となる役員の員数は、以下のとおりです。
1) 取締役(社外取締役を除く)
・報酬等の総額 411百万円
・報酬等の種類別の総額固定報酬207百万円業績連動報酬等のうち、金銭報酬184百万円非金銭報酬等20百万円
・対象となる役員の員数 5名
2) 監査役(社外監査役を除く)
・報酬等の総額 70百万円
・報酬等の種類別の総額固定報酬70百万円
・対象となる役員の員数 3名
3) 社外取締役
・報酬等の総額 56百万円
・報酬等の種類別の総額固定報酬56百万円
・対象となる役員の員数 4名
4) 社外監査役
・報酬等の総額 25百万円
・報酬等の種類別の総額固定報酬25百万円
・対象となる役員の員数 2名
報酬の額又はその算定方法の決定方針
の有無
あり
報酬の額又はその算定方法の決定方針の開示内容
1.取締役の個人別の報酬等の内容についての決定に関する方針
上記Ⅰコーポレート・ガバナンスに関する基本的な考え方及び資本構成、企業属性その他の基本情報 1.基本的な考え方【コーポレートガバナ
ンス・コードの各原則に基づく開示】【原則3−1:情報開示の充実】「(ⅲ)取締役および経営陣幹部の報酬の基本方針と手続」に記載のとおりで
す。
2.業績連動報酬等に関する事項
1)業績指標の内容
業績指標は、「連結業績(親会社の所有者に帰属する当期利益および税引前当期利益)」、「部門業績(ROCE(使用資本利益率)、フリーキャッ
シュ・フローおよびセグメント利益)」、「中長期的な経営戦略に沿って設定される個人目標の到達度」および「安全成績(労働災害の件数)」等に加
えて、2025年度からは「環境(GHG排出量(スコープ1、2)削減率等)」、「社会(エンゲージメントスコア等)」、「オペレーショナル・ガバナンス(重大
なコンプライアンス違反の件数)」、「ESG第三者機関からの評価(業界水準との比較)」の4つの要素から構成されるESG指標を採用しています。
2)選定の理由
当該指標を選択した理由は、連結業績(親会社の所有者に帰属する当期利益および税引前当期利益)については、企業経営の評価指標としてお
り長期ビジョンにおいて会社が到達すべき利益目標としているためです。部門業績については、効率性、キャッシュ・フローおよび利益の絶対額と
いう3つの基準でバランスよく評価するためです。中長期的な経営戦略に沿って設定される個人目標の到達度については、持続的な企業価値向
上の実現のためには、中長期的な視点で着実に計画を遂行していく必要があるためです。安全成績については、鉱山業および製錬業を含む製造
業を営む企業として、安全の確保を経営の基本と考えているためです。ESG指標については、企業の持続的成長と中長期的な企業価値向上のた
めには、環境・社会・ガバナンス(ESG)を重視した経営の推進が必要不可欠と考えるためです。
3)業績連動報酬等の金額の決定方法
業績連動報酬等の額は、職位別業績連動報酬等の額に個人別業績反映額を加えて算定します。
①職位別業績連動報酬等の額の算定方法
親会社の所有者に帰属する当期利益から基準報酬の算定基礎額を算定し、これに職位別係数を乗じて各職位別の業績連動報酬等の額を算定
します。基本報酬に係る職位別業績連動報酬等の額は、前期の親会社の所有者に帰属する当期利益を用いて算定し、賞与に係る職位別業績連
動報酬等の額は、当期の親会社の所有者に帰属する当期利益を用いて算定します。
基本報酬に係る職位別業績連動報酬等の額=前期の親会社の所有者に帰属する当期利益×職位別係数×業績に連動しない一定の係数
賞与に係る職位別業績連動報酬等の額=当期の親会社の所有者に帰属する当期利益×職位別係数×業績に連動しない一定の係数
②個人別業績反映額の算定方法
代表取締役社長の基本報酬に係る個人別業績反映額については、前期の「全社業績の公表予想値達成度」、「安全成績の達成度」および「ESG
指標の達成度」を4:1:1として合計点を算出します。合計点からあらかじめ定められた係数表(本表において税引前当期利益を考慮)により90%
から160%までの範囲で個人別業績評価係数を定め個人別業績反映額を算定します。
代表取締役会長の基本報酬に係る個人別業績反映額については、前期の「全社業績の公表予想値達成度」および「ESG指標の達成度」を4:1と
して合計点を算出し、上記と同様に個人別業績反映額を算定します。
役付執行役員(副社長、専務執行役員および常務執行役員)を兼務する取締役の基本報酬に係る個人別業績反映額については、それぞれ前期
の「部門業績の前期比較」、「部門業績の公表予想値達成度」、「中長期的な経営戦略に沿って設定される個人目標の到達度」、「安全成績の達成
度」および「ESG指標の達成度」を点数化したうえで、2:4:4:1:1の重み付けをして合計点を算出し、合計点からあらかじめ定められた係数表に
より、90%から130%までの範囲で、上記と同様に個人別業績反映額を算定します。
代表取締役社長の賞与に係る個人別業績反映額については、当期の「全社業績の公表予想値達成度」、「安全成績の達成度」および「ESG指標
の達成度」を4:1:1として合計点を算出し、上記の基本報酬と同様に個人別業績反映額を算定します。代表取締役会長の賞与に係る個人別業
績反映額については、当期の「全社業績の公表予想値達成度」および「ESG指標の達成度」を4:1として合計点を算出し、上記の基本報酬と同様
に個人別業績反映額を算定します。執行役員を兼務する取締役の賞与に係る個人別業績反映額については、それぞれ当期の「部門業績の前期
比較」、「部門業績の公表予想値達成度」、「個人目標の到達度」、「安全成績の達成度」および「ESG指標の達成度」に2:4:4:1:1の重み付けを
して合計点を算出し、上記の基本報酬と同様に個人別業績反映額を算定します。
基本報酬に係る個人別業績反映額=職位別の基本報酬×業績に連動しない一定の係数×個人別業績評価係数
賞与に係る個人別業績反映額=職位別の賞与額×業績に連動しない一定の係数×個人別業績評価係数
譲渡制限付株式報酬に係る業績連動等の額または数の算定方法は賞与と同様となります。
③目標値および実績値
なお、当事業年度に係る取締役の業績連動報酬等(基本報酬)は、前事業年度の業績に連動して支給しております。前事業年度における業績連
動報酬等に係る指標の目標は、連結業績(親会社の所有者に帰属する当期利益)は56,000百万円、連結業績(税引前当期利益)は91,000百万
円、部門業績(セグメント利益)の資源セグメント利益は84,000百万円、製錬セグメント利益は18,000百万円(以上、2024年5月公表予想値)、安全
成績(2024年暦年の当社グループの国内社員の労働災害の件数)は重篤災害(休業3か月を超える災害)が0件、全災害が7件以下でした。これら
の指標の実績については、連結業績(親会社の所有者に帰属する当期利益)は16,487百万円、連結業績(税引前当期利益)は31,383百万円、部
門業績(セグメント利益)の資源セグメント利益は101,836百万円、製錬セグメント利益は△7,147百万円、安全成績(2024年暦年の当社グループの
国内社員の労働災害の件数)は重篤災害が3件、全災害が22件でした。
当事業年度に係る取締役の業績連動報酬等(賞与および譲渡制限付株式報酬)は、当事業年度の業績に連動して支給します。当事業年度にお
ける業績連動報酬等に係る指標の目標は、連結業績(親会社の所有者に帰属する当期利益)は58,000百万円、連結業績(税引前当期利益)は10
0,000百万円、部門業績(セグメント利益)の資源セグメント利益は97,000百万円、製錬セグメント利益は△5,000百万円(以上、2025年5月公表予想
値)、安全成績(2025年暦年の当社グループの国内社員の労働災害の件数)は重篤災害(休業50日以上の災害)が0件、休業4日以上災害(腰
痛・熱中症は除く)が2件以下、ESG指標はGHG排出量(スコープ1、2)削減率等の達成状況(環境)、エンゲージメントスコア目標値等の達成状況
(社会)、重大なコンプライアンス違反件数0件(オペレーショナル・ガバナンス)、ESG第三者機関からの業界最高水準の評価でした。これらの指標
の実績については、連結業績(親会社の所有者に帰属する当期利益)は176,290百万円、連結業績(税引前当期利益)は255,680百万円、部門業
績(セグメント利益)の資源セグメント利益は167,831百万円、製錬セグメント利益は91,593百万円、安全成績(2025年暦年の当社グループの国内
社員の労働災害の件数)は重篤災害が1件、休業4日以上災害が3件、ESG指標は環境が達成、社会が未達、オペレーショナル・ガバナンスが達
成、ESG第三者機関の評価が未達でした。
3.非金銭報酬等に関する事項
1) 譲渡制限付株式報酬制度の概要
当社は、当社の取締役(代表権のない取締役会長および社外取締役を除き、以下「対象取締役」といいます。)を対象に、当社の企業価値の持続
的な向上を図るインセンティブを与えるとともに、株主の皆様との一層の価値共有を進めることを目的として、譲渡制限付株式報酬制度(以下「本
制度」といいます。)を導入しています。
当社の各事業年度を対象期間(以下「対象期間」といいます。)とするとともに、対象期間中の業績指標およびその目標値が決定され、当該目標値
の達成度に応じて算定される額の報酬額の一定割合に相当する数の当社の普通株式が対象取締役に付与されます。
本制度に基づき対象取締役に付与される当社の普通株式には一定の譲渡制限を付すものとし、また、本制度において採用する業績指標は、利
益の状況を示す指標、安全成績(労働災害の件数)その他の当社の経営方針を踏まえて決定される指標といたします。
対象期間の終了後、本制度に基づく株式の付与を行う場合、対象取締役が以下の要件を満たしたときに、当社は対象取締役に対して当社の普通
株式を付与します。
・当社の取締役会において定める一定の非違行為等がなかったこと
・その他本制度の趣旨を達成するために必要なものとして当社の取締役会が定める要件を充足すること
また、本制度に基づく譲渡制限付株式の付与にあたっては、当社と対象取締役との間で、以下の内容を含む譲渡制限付株式割当契約(以下「本
割当契約」といいます。)を締結するものといたします(ただし、対象期間の終了後、株式付与前に対象取締役が当社の取締役その他当社の取締
役会で定める地位を退任または退職した場合は、本割当契約に基づく譲渡制限を付さずに当社の普通株式を付与します。)。
①対象取締役は、本割当契約により割当てを受けた当社の普通株式(以下「本割当株式」といいます。)について、本割当株式の付与日から当該
対象取締役が当社の取締役その他当社の取締役会で定める地位を退任または退職する日までの期間(以下「譲渡制限期間」といいます。)、譲
渡、担保権の設定その他の処分をしてはならない(以下「譲渡制限」といいます。)。
②当社は、本割当株式の全部について、譲渡制限期間が満了した時点をもって譲渡制限を解除する。
③当社は、譲渡制限期間中に、対象取締役が法令または本割当契約の違反その他当社が本割当株式を無償取得することが相当である事由とし
て当社の取締役会で定める事由に該当した場合、本割当株式を当然に無償で取得する。
④上記①の定めにかかわらず、当社は、譲渡制限期間中に、当社が消滅会社となる合併契約、当社が完全子会社となる株式交換契約または株
式移転計画その他の組織再編等に関する事項が当社の株主総会(ただし、当該組織再編等に関して当社の株主総会による承認を要さない場合
においては、当社の取締役会)で承認された場合には、当社の取締役会の決議により、本割当株式の全部について、当該組織再編等の効力発生
日に先立ち、譲渡制限を解除する。
2)株式報酬額の総額および株式数の上限
本制度に基づく対象取締役に対する株式報酬付与のための報酬額の総額は、年額30百万円以内といたします。各取締役への具体的な配分およ
びその時期については、取締役会の決議に基づき決定することといたします。
また、これにより発行または処分される当社の普通株式の総数は年1.5万株以内(※)とします。
※ 本制度が導入された日以降、当社の普通株式の株式分割(当社の普通株式の無償割当てを含む。)または株式併合が行われた場合、その他
譲渡制限付株式として発行または処分される当社の普通株式の総数の調整が必要な事由が生じた場合には、当該総数を合理的な範囲で調整し
ます。
3)払込方法
対象取締役は、当社の取締役会決議に基づき、①取締役の報酬等として金銭の払込みもしくは現物出資財産の給付を要せずに、または②本制
度に基づき対象取締役に対して支給される金銭報酬債権の全部を現物出資財産として給付し、当社の普通株式について発行または処分を受け
るものといたします。
4)その他
執行役員およびこれに準じる者に対し、本制度と同様の制度に基づき、譲渡制限付株式を付与することとしています。
【社外取締役(社外監査役)のサポート体制】
1.当社では、社外取締役および社外監査役の役割・機能について以下のとおりと考えております。
1)社外取締役の役割・機能
社外取締役には、アドバイザリー機能とモニタリング機能の2つを期待しています。
アドバイザリー機能に関しては、当社グループの持続的な成長と中長期的な企業価値の向上を図るため、自らの経験等を背景に当社の従来の考
え方や枠組みにとらわれることなく助言および判断いただき、取締役会の意思決定の質が高まることを期待しています。
モニタリング機能に関しては、独立した客観的な立場から、取締役会を通じて経営に対するチェック機能を発揮していただくとともに、ガバナンス委
員会の委員として、取締役の指名や報酬等の意思決定に際し助言を行うことを通じて株主をはじめとするステークホルダーに代わって経営陣を監
督していただきたいと考えています。
2)社外監査役の役割・機能
社外監査役には、経営の健全性の確保および中長期的な企業価値の向上を図るため、常勤の監査役と十分な連携を行いながら、自らの財務・会
計・法務をはじめとする専門分野の知見、経験等に基づき、実効的な監査を行っていただくことを期待しています。
また、監査の一環として取締役会をはじめとする重要な会議に参加し、意思決定の過程において、独立した客観的な立場から、提案内容の適法
性のみならず、妥当性を含め、積極的に忌憚のない意見を述べていただくことを期待しています。
3)社外取締役・監査役連絡会
社外取締役および社外監査役は、監査部による取締役会での内部監査計画および前年度の内部監査の概要の報告を受けるほか、監査部、監
査役および会計監査人並びに内部統制部門から必要に応じて報告を受けるとともに、定期的に実施する監査役との意見交換の機会を通じて相
互連携を図っております。
2.社外役員が上記の役割や責務を実効的に果たすため、以下のとおり必要な支援を実施します。
1)取締役会の審議の充実のため、取締役会の付議資料等を事前に配付するとともに、社外役員に対し、取締役会の議題の事前説明を実施しま
す。
2)社外役員の事業に対する理解を深めるため、社外役員が当社グループの拠点を視察する機会を設定します。また、大型プロジェクトなど社外
役員が関心を持つテーマを取り上げ、説明する機会を設定します。
3)情報の共有を図るとともに外部者による客観的な視点を経営に反映するため、社外役員のみを構成員とする社外役員協議会および社外役員
と経営トップが直接に意見を交換できる会合を開催します。
なお、取締役会事務局として事務局員2名(兼務)、監査役会事務局として事務局員3名(本務者1名、兼務者2名) を置いており、これらの事務局
員により社外取締役または社外監査役に対するサポートがそれぞれ行われております。
【代表取締役社長等を退任した者の状況】
元代表取締役社長等である相談役・顧問等の氏名等
氏名
―
役職・地位
―
勤務形態・条件
(常勤・非常勤、報酬有無等)
業務内容
―
元代表取締役社長等である相談役・顧問等の合計人数
―
社長等退任日
―――
任期
―
0名
その他の事項
当社は、2021年6月25日をもって相談役制度を廃止しました。
2.業務執行、監査・監督、指名、報酬決定等の機能に係る事項(現状のコーポレート・ガバナンス体制の概要)
当社のガバナンスは、経営における執行と監視・監督のそれぞれの機能が十分発揮されるシステムとして、監査役会設置会社および執行役員制
度を採用し、取締役会による「意思決定・監督」と、社長および執行役員による「業務執行」、そして監査役および会計監査人による「監査」という3
区分の組織体制により運営します。また、経営の透明性を高め、コーポレートガバナンス強化を図るため、ガバナンス委員会を設置します。
取締役会は、会社法に定める事項その他の重要な業務執行の決定等を通じて意思決定を行うとともに、代表取締役や執行役員による職務執行
をはじめとする経営全般に対する監督機能を担っております。
取締役会は、法令および定款に従い業務執行の決定を代表取締役や執行役員に委ねており、権限と責任を明確化しています。
代表取締役や執行役員による業務執行の決定は、稟議制度等を通じて審査し決裁を行うことを基本とし、審議を必要とする経営上の重要事項に
ついては経営会議を開催し、多角的な視点から合理的な経営判断と慎重な意思決定を行うシステムとしています。また、社会の持続的発展に貢
献する経営課題に取り組み、事業の持続的な成長と企業価値の向上を図るべく、サステナビリティ推進活動、コンプライアンス活動、当社固有のリ
スクマネジメント活動および内部統制に取り組んでいます。
各監査役は、他の監査役、内部監査部門および会計監査人と情報交換を行う等、必要に応じて連携し、法令、監査役会が定めた監査役会規程、
監査役監査基準、監査の方針、監査計画等に従い、取締役の職務執行等の監査を行っています。
当社の企業統治の体制の具体的な整備状況は次のとおりです。
1.意思決定・監督
1) 取締役・取締役会
取締役の員数は定款で10名以内と定めており、任期は1年としております。
また、取締役会は、当社事業の各分野に精通した当社出身者に加え、社内出身者とは異なる知識、経験、能力、見識等を有する社外有識者を招
聘することにより、多様性を持った構成としております。さらに、より透明性の高い経営をめざし、取締役のうち3分の1以上を独立した社外取締役
とする方針としており、2026年6月25日に開催した第101期定時株主総会においても、取締役8名のうち、経営者としての経験を持つ者を含む4名
を独立した社外取締役として選任しています。なお、取締役の選任にあたって性別、国籍の多様性は必須の条件ではなく、あくまで人物本位で選
任しております。
重要な業務執行の決定等および代表取締役や執行役員による職務執行をはじめとする経営全般に対する監督を担う取締役会においては、法令
または定款に定める事項のほか、当社の重要な業務執行に関する事項を決定することとしており、その付議基準は社内規程である「取締役会規
程」等によって明確にしております。具体的には、会社法の定めに基づき、一定規模以上の財産の処分および譲受け、借入、投資の実施等の個
別案件について決議しているほか、取締役会の実効性評価を受けて実施している「重要な経営課題や方針等に関する審議」を行うことができるよ
うにしております。また、2021年度の取締役会の実効性評価において、取締役会によるモニタリングの強化に資するべく取締役会付議事項や報告
事項の見直しが必要であるとの意見を確認したため、マネジメント・モデルを原則としながらモニタリング機能をも充実させるべく、2022年10月、取
締役会付議基準の金額基準や付議項目等の全面的な見直しを行いました。取締役会のマネジメント機能を損なうことのないよう留意して付議項
目の絞込みを行い、各議案に対する審議時間をさらに確保することで、社外取締役を中心としたモニタリング機能のより一層の強化を図っており
ます。
また、取締役会における議論のより一層の充実の観点から、2022年度の取締役会の実効性評価における意見を踏まえ、2023年7月1日付で決議
事項および報告事項に加え、新たに討議事項を設けました。経営戦略や重要な経営課題などの中長期的な視点での議論を実施しております。
定時取締役会は毎月1回開催するほか、臨時取締役会の開催により機動的な意思決定をなし得る体制を整えております。2025年度は16回開催
し、2026年3月31日時点で在任している個々の役員の出席状況は以下のとおりです。
取締役野崎明 16/16回(100%) 取締役会16回(定時12回、臨時4回)の全てに出席
取締役松本伸弘 16/16回(100%) 取締役会16回(定時12回、臨時4回)の全てに出席
取締役竹林優 16/16回(100%) 取締役会16回(定時12回、臨時4回)の全てに出席
取締役吉田浩 16/16回(100%) 取締役会16回(定時12回、臨時4回)の全てに出席
取締役石井妙子 16/16回(100%) 取締役会16回(定時12回、臨時4回)の全てに出席
取締役木下学 16/16回(100%) 取締役会16回(定時12回、臨時4回)の全てに出席
取締役竹内光二 16/16回(100%) 取締役会16回(定時12回、臨時4回)の全てに出席
取締役 サワキ・ニコラ・ミシェール 11/11回(100%)取締役就任後、取締役会11回(定時9回、臨時2回)の全てに出席
監査役野沢剛志 16/16回(100%) 取締役会16回(定時12回、臨時4回)の全てに出席
監査役松下博彦 11/11回(100%) 監査役就任後、取締役会11回(定時9回、臨時2回)の全てに出席
監査役若松昭司 16/16回(100%) 取締役会16回(定時12回、臨時4回)の全てに出席
監査役家田嗣也 16/16回(100%) 取締役会16回(定時12回、臨時4回)の全てに出席
なお、取締役会で決議または報告された事項は執行役員会議で報告され、情報の共有化がなされております。
2)ガバナンス委員会
経営の透明性を高め、コーポレートガバナンスの強化を図るため、ガバナンス委員会を設けます。ガバナンス委員会は、執行役員でない取締役会
長および独立社外取締役で構成(取締役会長を置かない場合は独立社外取締役のみで構成)され、取締役、執行役員等の指名や報酬などの
コーポレートガバナンス上の重要事項について、社長に対して客観的な立場から助言を行います。
2.業務執行
1)取締役会からの権限の委任
取締役会は、法令および定款に従い、社長や執行役員に対して業務執行の決定を委ねるとともに、社長や執行役員の職務執行の状況を監督し
ます。
2)執行役員制度
当社は、定款の規定に基づき、執行役員制度を採用しております。
執行役員に対しては、権限と責任の明確化と大幅な権限委譲を行い、執行機能を強化しております。
現在、執行役員は、22名(うち取締役兼務者3名)で構成され、事業部門長、本社部室長等、重要な職位の委嘱を受け、固有の権限を付与され
て、その業務を執行しております。また、執行役員は、業務執行の状況について、毎月1回執行役員会議において報告することとしております。
執行役員の報酬についても、取締役と同様に、業績連動報酬制度(譲渡制限付株式報酬制度を含む)を導入しております。なお、具体的報酬額の
決定にあたっては、ガバナンス委員会において助言を得ることとしております。
3)経営会議
経営会議は、社長および専務執行役員その他関係執行役員等を構成メンバーとしており、取締役会長、社外取締役および監査役も出席すること
ができます。
経営会議は、取締役会決議事項および社長決裁に該当する重要事項のうち慎重な審議が必要な事項について、広い観点から審議を行い、取締
役会への上程の可否を決定するとともに、社長による決裁を支援する機能を果たしております。
4)サステナビリティ委員会
当社は、社会および環境に関する活動をサステナビリティ推進活動として体系化し、当社グループに展開しております。本活動を推進するために、
サステナビリティ委員会を設置しております。サステナビリティ委員会は、社長および経営企画部所管執行役員等を構成メンバーとしており、取締
役会長、社外取締役および監査役も出席することができます。サステナビリティ委員会の下にサステナビリティ部会、マネジメントシステム分科会、
企業価値向上戦略会議、DX推進委員会およびカーボンニュートラル推進委員会を設置しております。
5)内部統制委員会
当社は、内部統制システムの構築を推進するとともに、その有効性を定期的に評価することによって、その維持改善を図ることを目的として、内部
統制委員会を設置しています。内部統制委員会は、社長および監査部所管執行役員等を構成メンバーとしており、監査役も出席することができま
す。
6)内部監査
業務執行の監査監督について、内部監査を目的とする監査部を設置しております。内部監査は当社グループ全体を対象とし、監査部長以下で定
期的に内部監査を実施しております。監査部は、年度の内部監査計画および前年度の内部監査の概要(重大な問題が発見された場合はその対
応を含む。)を取締役会に定期的に報告するなど、適宜情報の提供を行っているほか、監査部の執行役員等に対する内部監査の結果報告には
監査役も同席しております。
3.監査
1)監査役・監査役会
監査役数は定款で5名以内と定めております。現在、監査役は4名(常勤の監査役2名および非常勤の監査役(社外監査役)2名)で構成されてい
ます。当社においては、この監査役の構成は、監査役会の適切な運営を行ううえで適切な人数であると判断しております。
当社出身の常勤の監査役は、社内の情報を的確かつタイムリーに収集し、これに基づき的確な監査を実施する一方で、独立社外監査役は、様々
な専門知識や多角的な視点を生かした監査を実施することとしております。
監査役は、監査役会で決定した監査計画に従い、取締役の職務の執行等を監査しております。常勤の監査役は、監査方針および計画の案を策
定し、取締役会等の重要な会議への出席、重要な決裁書類等の閲覧、代表取締役等へのヒアリング、事務所、工場、関係会社等への往査を行っ
ております。当社の社外監査役は、常勤の監査役と同様、取締役会等重要な会議等に出席するほか、常勤の監査役と共に往査を行っておりま
す。また、監査役が往査した事業所や関係会社についての監査報告書は、代表取締役等にも供覧されております。
監査役会は定時取締役会の開催日にあわせて、毎月1回取締役会前に開催するほか、必要に応じて随時開催しております。2025年度は19回開
催し、2026年3月31日時点で在任している個々の監査役の出席状況は以下のとおりです。
監査役野沢剛志 19/19回(100%) 監査役会19回の全てに出席
監査役松下博彦 12/13回(92%) 監査役就任後、監査役会13回のうち12回に出席
監査役若松昭司 19/19回(100%) 監査役会19回の全てに出席
監査役家田嗣也 19/19回(100%) 監査役会19回の全てに出席
なお、監査役のうち社外監査役若松昭司は、公認会計士および税理士の資格を有しており、財務および会計に関する相当程度の知見を有してお
ります。
2)会計監査人
第101期(2026年3月期)事業年度における当社の会計監査人の名称、業務を執行した公認会計士の氏名、会計監査業務に係る補助者の構成は
次のとおりであります。
1)会計監査人の名称
有限責任 あずさ監査法人
2)業務を執行した公認会計士の氏名
指定有限責任社員業務執行社員杉崎友泰、八鍬賢也、手嶋健一
3)会計監査業務に係る補助者の構成
公認会計士22名、その他46名
4.責任限定契約の締結
当社は、社外取締役および社外監査役との間で責任限度額を1,000万円または法令に定める最低責任限度額のいずれか高い額とする会社法第4
27条第1項に規定する契約(責任限定契約)を締結しております。
3.現状のコーポレート・ガバナンス体制を選択している理由
当社のコーポレートガバナンスに関する基本的な考え方や枠組みをまとめた「コーポレートガバナンスに関する基本方針」のとおり、当社のガバ
ナンスは、業務執行とこれに対する監視・監督のそれぞれの機能が十分に発揮されるシステムとして、監査役会設置会社および執行役員制度を
採用し、取締役会による「意思決定・監督」、社長および執行役員による「業務執行」、そして監査役および会計監査人による「監査」という3区分の
組織体制により運営されています。
当社は、資源・製錬・材料の3事業をコアビジネスと位置付け、長期ビジョンとして「『世界の非鉄リーダー』を目指す」を掲げています。これらの事
業はいずれも非鉄金属に関わる事業であり相互に有機的な関連を持ち、多様な経営課題に対して取締役会が自ら意思決定を行える事業内容と
規模であると考えています。また、現在強化を図っている3事業間の連携という面でも、各事業に強い独立性を与えて独自の意思決定を認めるよ
りも、取締役会自らが総合的に意思決定を行うことが会社の成長をより促すことにつながると考えています。そのため、執行全体を事後的に監督
するモニタリング・モデルではなく、マネジメント・モデルを原則として採ることが当社のガバナンスとして適していると考えています。
また、当社グループの事業の特性上、経営基盤(特にコンプライアンス、安全、環境)の強化が重要であり、監査役が取締役や執行役員などに対
して忌憚なく課題を指摘できる体制を整えておく必要があると考えます。この点から、独任制という権限の保障された監査役が、4年間にわたり安
定して監査機能を発揮することが期待できる監査役会設置会社の機関設計を採用しています。なお、監査役には取締役会の決定事項に関する招
集権および取締役会の議決権がなく、その結果として取締役の解任提案を取締役会に対してすることができないことが監査役会設置会社の課題
であると認識しています。この課題に対しては、複数(3分の1以上)の社外取締役を設置し、ガバナンス委員会委員に就任いただき、ガバナンス
委員会において取締役および執行役員等の選解任を取り扱うことにより課題を乗り越えるべく取り組んでいます。
Ⅲ株主その他の利害関係者に関する施策の実施状況
1.株主総会の活性化及び議決権行使の円滑化に向けての取組み状況
補足説明
株主総会招集通知の早期発送
株主が株主総会の議案を十分に審議できるよう、毎年招集通知の早期発送および開示
に努めております。
第101期定時株主総会においても、招集通知の発送に先立ち、2026年5月28日に東京証
券取引所および当社ウェブサイトにて開示しております。
なお、当社は株主総会開催日の3週間前までに株主総会招集通知を発送しております。
第101期定時株主総会の招集通知は、2026年6月3日に発送いたしました。
集中日を回避した株主総会の設定
第101期定時株主総会は、2026年6月25日(木)に開催いたしました。
電磁的方法による議決権の行使
2008年6月26日開催の第83期定時株主総会から、電磁的方法(インターネット等)により、
議決権を行使することができることとしております。
議決権電子行使プラットフォームへの参
加その他機関投資家の議決権行使環境
向上に向けた取組み
2008年6月26日開催の第83期定時株主総会から、機関投資家向け議決権電子行使プ
ラットフォームにより、議決権を行使することができることとしております。
招集通知(要約)の英文での提供
和文の招集通知等の開示の翌日である2026年5月29日に東京証券取引所および当社の
ウェブサイトに英文を開示しております。
その他
招集通知等の株主総会関連資料は、当社ウェブサイトにも掲載しております。
また、株主に対する情報開示の充実という観点から、株主総会の議事の様子をライブ配
信しております。
2.IRに関する活動状況
補足説明
代表者
自身に
よる説
明の有
無
ディスクロージャーポリシーの作成・公表
当社は、株主・投資家の皆様からの信頼と適切な評価を得るため、証券取引
所の規則や金融商品取引法等の諸法令で開示が定められている項目はもと
より、株主・投資家の皆さまにとって有用と思われる情報の自主的・積極的な
開示に努めています。
IRポリシーを定め、当社ウェブサイトに掲載しております。
https://www.smm.co.jp/ir/policy/
アナリスト・機関投資家向けに定期的説
明会を開催
1)四半期決算毎に決算説明会を開催しています。
2)原則、本決算および第2四半期決算発表時の年2回、経営戦略説明会を開
催しています。
3)中期経営計画等の重要な発表を行ったときに説明会を開催しています。
4)事業理解促進のため、拠点見学会も適宜開催しています。
5)個別の事業等に関して、説明会を随時開催しています。2025年度は社外取
締役ミーティング、機能性材料事業説明会を開催しました。
6)スモールミーティングや1on1の対話については、2025年度は約260回程度
開催しました。
7)機関投資家の皆様との対話につきましても、取締役が合理的な範囲で前向
きに関与するよう努めております。
8)IR担当部所は、経営戦略部門や各事業部門をはじめ、サステナビリティ推
進部門、法務部門等と連携を取りながら、株主・投資家の皆様との建設的な対
話を促進するために必要な情報収集や情報発信を行っております。
あり
海外投資家向けに定期的説明会を開催
・代表取締役やその他役員、IR部門が海外投資家訪問を毎年実施しているほ
か、北米や欧州およびアジアの機関投資家との個別ミーティングを随時実施し
ています。
・証券会社主催の各種カンファレンスに参加しています。
あり
IR資料のホームページ掲載
当社ウェブサイトにて、決算情報、決算情報以外の適時開示資料、有価証券
報告書・四半期報告書、決算説明会資料、各種カンファレンス時の資料、統合
報告書、サステナビリティ情報、株式情報、株主総会の招集通知、事業報告、
決議結果、株主通信、その他報道発表資料等のIR資料を掲載しております。
https://www.smm.co.jp/ir/
IRに関する部署(担当者)の設置
広報IR部を設置しております。
その他
・個人投資家にむけては、証券会社等において説明会を開催しております(202
5年度実施状況(1回実施))。
・個人投資家の皆様にも当社に興味をもっていただくべく、企業PRの充実や当
社ウェブサイトの改善に取り組んでおります。また、個人株主からのお電話等
によるお問い合わせ等をいただきました場合は丁寧に対応しております。
3.ステークホルダーの立場の尊重に係る取組み状況
補足説明
社内規程等によりステークホルダーの立
場の尊重について規定
当社は、SMMグループ経営理念、SMMグループ経営ビジョンおよび住友金属鉱山グルー
プサステナビリティ方針を通じて、ステークホルダーへの責任を果たすとともに、持続可能
な社会形成に向けて積極的に取り組むことを掲げております。
その一環として、当社は株主等へ適切な情報開示を行うことを目標としております。
環境保全活動、CSR活動等の実施
当社は、2008年10月1日をもって、社会および環境に関する従来からの活動をサステナビ
リティ推進活動として体系化し、全グループに展開することといたしました。当社は、「住友
金属鉱山グループサステナビリティ方針」において、社会の持続的発展に貢献する経営課
題に取り組み、事業の持続的な成長と企業価値の向上を図ることを掲げています。
当社グループのサステナビリティ推進活動の目的は「地球および社会との共存」です。「地
球との共存」に関しては、地球の有限性があらためて認識されているなか、健全な地球が
あってこその企業活動であることを強く認識した事業活動を行ってまいります。「社会との共
存」に関しては、ステークホルダーとの対話や関わり等を通じ、当社の企業価値の向上に
生かす取組みを行ってまいります。
サステナビリティ推進活動の推進にあたり、社長を委員長とするサステナビリティ委員会を
設置するとともに、下部機構として、サステナビリティ部会、マネジメントシステム分科会、企
業価値向上戦略会議、DX推進委員会およびカーボンニュートラル推進委員会を設置して
おります。サステナビリティ部会は、重要課題と「2030年のありたい姿」の実現に取り組む
組織です。マネジメントシステム分科会は、リスクマネジメント、コンプライアンス、品質およ
び責任ある鉱物調達とサプライチェーンに関連する課題に取り組む組織です。企業価値向
上戦略会議は、当社グループにおける事業の持続的成長を実現し企業価値を向上させる
ことに取り組む組織です。DX推進委員会およびカーボンニュートラル推進委員会は、SMM
グループ経営理念、SMMグループ経営ビジョンおよび重要課題と「2030年のありたい姿」に
基づいて、DXおよびカーボンニュートラルの実現に取り組む組織です。
なお、サステナビリティ推進活動、SDGs・ESG対応などについて一層の強化を図るため、2
022年4月よりサステナビリティ推進体制の再編を行ったことに伴い、2019年4月に設置した
CSR部を「サステナビリティ推進部」と改称しました。
当社グループのサステナビリティ推進活動の取組状況については、従来は年1回発行する
統合報告書に記載しておりましたが、2023年度からはこれに加え、サステナビリティに関す
る情報開示を拡大および充実するために、新たにサステナビリティに関する情報を年1回
発信しています。2025年10月からは従来のPDF形式のサステナビリティレポートからESG
データブックとサステナビリティサイトによる公表へと変更いたしました。
ESGデータブックとサステナビリティサイトおよび統合報告書については、当社ウェブサイト
にて公表しております。
ステークホルダーに対する情報提供に
係る方針等の策定
当社は、IRポリシーを定め、当社ウェブサイトに掲載しております。
https://www.smm.co.jp/ir/policy/
その他
DE&Iの取組みについて
「世界の非鉄リーダー」を目指す当社にとって、DE&Iの重要性が増しており、全社を上げて
取組みを進めております。2012年7月に女性活躍支援グループ、その後の2015年10月に
は、人材開発部(現人事部)内にダイバーシティ推進室を設置し、2025年4月にDE&I協創
室となりました。
これまで、多様な人材が能力を発揮できる環境づくりや人権尊重を基本とした活動を実施
してまいりました。
今後も、女性、外国人、性的マイノリティ、障害者に関する取組みに加えて、ライフステージ
に応じた支援策として、仕事と育児、介護、治療との両立に課題を抱える従業員への制度
周知と職場への教育、役員や従業員を対象とした人権研修、ハラスメント防止教育などの
諸施策を推進してまいります。
Ⅳ内部統制システム等に関する事項
1.内部統制システムに関する基本的な考え方及びその整備状況
1.基本方針
当社グループ(当社を含む。以下同様)の持続的な成長を確保するために、内部統制の構築は経営上最も重要な課題の一つです。項目2以下
に掲げる事項について、当社グループの役員(執行役員を含む。以下同様)および従業員それぞれの役割と責任が明確にされ全員参加で取り組
む体制を構築するとともに、それらが適時適切に見直され、不断の改善が図られる体制の構築に努めます。
2.当社の取締役および使用人の職務の執行が法令および定款に適合することを確保するための体制 (会社法第362条第4項第6号、会社法施
行規則第100条第1項第4号)
1)役員および従業員の行動基準として制定している「SMMグループ行動基準」を役員は率先垂範し、従業員に対して周知教育することにより、
適法で健全な職務の執行が行われる企業風土の醸成に努めております。
2)取締役会規程により、取締役会の付議事項および報告事項が会社法に適合する体制を構築しております。また、経営上の重要な事項につい
ては、本社等権限基準規程、経営会議規程、決裁規程等に基づき、会議体または稟議書により、専門的見地から適法性も含め多角的に検討して
おります。
3)役員および従業員の職務の執行状況について、監査部による内部監査を定期および不定期に実施しております。監査部は、年度の内部監査
計画および前年度の内部監査の概要(重大な問題が発見された場合はその対応状況を含む。)を取締役会に定期的に報告しております。
4)役員および従業員の職務の執行が法令、定款等に違反し、当該違反等が放置され、または対応されないことを防止するために内部通報制度
を設けております。
3.当社の取締役の職務の執行に係る情報の保存および管理に関する体制 (会社法施行規則第100条第1項第1号)
株主総会議事録、取締役会議事録、稟議書その他役員の職務の執行に係る情報は、法令および文書規程、決裁規程等に従い、適切に保存
し、管理しております。
4.当社の損失の危険の管理に関する規程その他の体制 (会社法施行規則第100条第1項第2号)
リスクマネジメントについては、リスクマネジメント基本規程を定め、以下の枠組で全社リスクマネジメントを体系的に取り組みます。その取組みに
際しては、経営層を含む推進組織を設置するとともに、社長が最高責任者としてリスクマネジメント全体を統括し、全社的かつ組織的な活動を行っ
ております。
1)成長戦略・事業戦略の遂行に伴う経営・事業リスクおよび組織横断的リスクは、会議体による検討のうえ、中長期的な方針や方向性を定めて
対応する。
2)品質、環境、コンプライアンス等の個別のリスクについては、本社部室等や当該リスクを所管する部所等が社内規程等を定め、構築したリスク
管理体制に基づき対応する。
3)危機的事態が発生した場合は、社内規程等に基づき危機管理体制に移行し対応する。
5.当社の取締役の職務の執行が効率的に行われることを確保するための体制 (会社法施行規則第100条第1項第3号)
1)執行役員制度により、権限と責任の明確化と大幅な権限委譲を行い、執行機能の強化を図っております。具体的には、執行役員は、事業部門
長、本社部室長等、重要な職位の委嘱を受け、本社等権限基準規程等に基づき固有の権限を付与されて、その業務を執行しております。
2)中期経営計画、予算制度等により、当社グループにおける適切な経営資源の配分を行っております。また、業績管理制度により、当社グループ
における経営計画の進捗を管理するとともに、業績評価が経営層等の報酬に反映される体制を構築しております。
6.当社および子会社から成る企業集団における業務の適正を確保するための体制 (会社法施行規則第100条第1項第5号)
1)子会社の取締役等の職務の執行に係る事項の当社への報告に関する体制 (会社法施行規則第100条第1項第5号イ)
子会社において経営上重要な事項を決定する場合は、社内規程等に基づき、当社へ事前協議等が行われる体制を構築しております。また、業績
については定期的に、業務上重要な事項が発生した場合は都度、当社に報告が行われる体制を構築しております。
2)子会社の損失の危険の管理に関する規程その他の体制(会社法施行規則第100条第1項第5号ロ)
リスクマネジメント基本規程により、各事業や地域等の特性にあわせて、子会社におけるリスクマネジメントの推進および監視を行う体制を構築し
ております。
3)子会社の取締役等の職務の執行が効率的に行われることを確保するための体制 (会社法施行規則第100条第1項第5号ハ)
a.中期経営計画、予算制度等により、子会社に対し当社グループの経営方針を示すとともに、子会社の経営計画および予算の策定に関与しうる
体制を構築しております。
b.当社から子会社に対し役員を派遣し、子会社の経営上重要な事項の意思決定等に関与しうる体制を構築しております。
4)子会社の取締役等および使用人の職務の執行が法令および定款に適合することを確保するための体制 (会社法施行規則第100条第1項第5
号ニ)
a.原則として全ての子会社に適用される「SMMグループ行動基準」を定め、子会社の役員が「SMMグループ行動基準」を率先垂範し、当該子会
社の従業員に対して周知教育することにより、各社において適法で健全な職務の執行が行われる企業風土の醸成に努める体制を構築しておりま
す。
b.子会社における業務の執行状況について、当社監査部による内部監査を定期および不定期に実施しております。当社監査部は、子会社に対
する年度の内部監査計画および前年度の内部監査の概要(重大な問題が発見された場合はその対応状況を含む。)を取締役会に定期的に報告
しております。
c.子会社の役員および従業員の職務の執行が法令、定款等に違反し、当該違反等が放置され、または対応されないことを防止するために内部
通報制度を設けております。
7.監査役がその職務を補助すべき使用人を置くことを求めた場合における当該使用人に関する事項 (会社法施行規則第100条第3項第1号)
監査役の職務を補助すべき使用人として監査役会の事務局員を配置しております。当該事務局員の員数、求められる資質、勤務体制等につい
ては、監査役と協議を行い決定しております。
8.7の使用人の取締役からの独立性および当該使用人に対する指示の実効性の確保に関する事項 (会社法施行規則第100条第3項第2号お
よび第3号)
1)監査役会の事務局員の人事異動を行う場合は、事前に監査役と協議しております。
2)監査役会の事務局員が監査役の指揮命令に従わず、監査役が交代等を求めた場合は、真摯に対応します。
9.当社の取締役および使用人ならびに子会社の取締役、監査役および使用人が当社の監査役に報告をするための体制 (会社法施行規則第1
00条第3項第4号)
1)取締役会規程その他の社内規程において取締役会報告事項を定め、会社法等により当社の監査役へ報告を要する事項が確実に報告される
体制を構築しております。
2)当社グループ内において違法行為等が発生した場合、コンプライアンス基本規程に基づき、当社の常勤の監査役に報告しております。
3)内部通報制度の利用状況について、内部通報に関する規程に基づき、当社の常勤の監査役に報告する体制を構築しております。
4)当社監査部による当社グループの業務の執行状況に関する内部監査の結果を当社の監査役全員に報告しております。
10.9の報告をした者が当該報告をしたことを理由として不利な取扱いを受けないことを確保するための体制 (会社法施行規則第100条第3項第
5号)
内部通報制度の利用者に対し、当該制度の利用を理由として不利な取扱いを行うことを禁止する旨を内部通報に関する規程等に明記しており
ます。
11.監査役の職務の執行について生ずる費用の前払または償還の手続その他の当該職務の執行について生ずる費用または債務の処理に係る
方針に関する事項 (会社法施行規則第100条第3項第6号)
監査役がその職務の執行について、当社に対して費用の前払または償還等の請求をした場合、会社法に基づき、当該費用または債務を処理し
ております。
12.その他監査役の監査が実効的に行われることを確保するための体制 (会社法施行規則第100条第3項第7号)
1)経営会議、経営情報連絡会など経営上重要な会議の開催にあたっては、社内規程等に基づき、監査役が出席する機会を設けております。
2)社長が決裁する稟議書は、常勤の監査役に供覧しております。ただし、常勤の監査役が特に指定するものを除きます。
2.反社会的勢力排除に向けた基本的な考え方及びその整備状況
1.基本的な考え方
当社およびグループ会社の役員および従業員の行動基準として「SMMグループ行動基準」を制定し、次のとおり反社会的勢力との関係
遮断を内外に表明しております。
<SMMグループ行動基準>
15.反社会的勢力との関係遮断
反社会的勢力を断固として排除し、一切関係を持ちません
2.反社会的勢力排除に向けた整備状況
当社およびグループ会社は「SMMグループ行動基準」を遵守するとともに、反社会的勢力との関係遮断のために「不当要求対応マニ
ュアル」を策定しております。具体的な社内体制の整備状況、実施施策は次のとおりです。
1)反社会的勢力との関係遮断の基本方針を定着させるため、「SMMグループ行動基準」に関して社員採用時の研修、その他教育研修
などの機会を通じ、当社およびグループ会社の役員および従業員に周知しております。
2)反社会的勢力による不当要求もしくは、その端緒と判断される事態が発生した場合は、「不当要求対応マニュアル」に基づき総務部
長を統括責任者として、組織的に対応します。
3)当社およびグループ会社は、反社会的勢力との関係遮断のため、警察署などの専門機関へ情報を提供し、助言を得るなど緊密な連
携関係を構築しております。また、顧問弁護士事務所から法的な助言を得られる体制を構築しております。
4)暴力追放運動推進センターなどの講習会や研修会に積極的に参加し、最新情報の取得に努めています。
Ⅴその他
1.買収への対応方針の導入の有無
買収への対応方針の導入の有無
なし
該当項目に関する補足説明
当社の財務および事業の方針の決定を支配する者の在り方に関する基本方針について
基本方針の内容の概要
当社は、株式の大量買付であっても、当社の企業価値・株主共同の利益に資するものであれば、これを否定するものではありません。また、特
定の者による当社株式の大量取得行為に関する提案があった場合、それを受け入れるか否かは、最終的には株主の皆様のご意思に委ねられる
べきものと考えております。
しかしながら、株式の大量取得行為の中には、当社の企業価値・株主共同の利益を毀損するものもあります。
当社の企業価値・株主共同の利益を損なう大量取得行為を行う者は、当社の財務および事業の方針の決定を支配する者として不適切であり、
このような者による大量取得行為に対しては、必要かつ相当な対抗措置を採ることにより、当社の企業価値ひいては株主共同の利益を確保する
必要があると考えております。
以上の観点から、当社においては、従前、当社の株式について大量取得行為が行われる場合の対応策を導入しておりました。
しかしながら、昨今我が国においては、取締役会の賛同を得ずに開始される株式の大量取得行為に対しては、実際に特定の者により大量取得
行為に関する提案が行われた段階で、具体的な買収者の性質や当該提案の内容、当該大量取得行為の目的・態様・条件、その他の具体的事実
関係を踏まえて対抗措置等の対応策の必要性について株主の皆様の意思を確認する事例が増加しております。このような近時の動向および機
関投資家との対話状況を踏まえ、当社は、2022年に、具体的な買収者が登場していない段階で、一般的な目的での買収への対応方針(買収防衛
策)の更新を行わないことといたしました。当社としては、実際に特定の者が出現し、当社株式の大量取得行為に関する提案等が行われた時点
で、必要に応じて、適切な対応策について株主の皆様にお諮りすることが望ましいと判断しております。
当社は、長期ビジョンで掲げた「世界の非鉄リーダー」を目指す基本戦略のもと、中期経営計画を推進することにより、当社の企業価値向上およ
び株主共同の利益の確保・向上に取り組むとともに、当社株式の大量取得行為が行われる場合には、大量買付を行う者に対し、株主の皆様がそ
の是非を適切に判断するために必要かつ十分な時間と情報の提供を求め、独立性を有する社外役員の意見を尊重したうえで、金融商品取引法、
会社法その他関係法令の許容する範囲内において、その時々において適宜適切な措置を講じてまいります。
2.その他コーポレート・ガバナンス体制等に関する事項
会社情報の適時開示に係る社内体制
1)経営理念および行動基準
当社は、当社の目指すべきところを定めた「SMMグループ経営理念」および経営理念を達成するための役員・社員の行動規範である「SMMグ
ループ行動基準」を2003年12月に制定し、2004年4月から実施しています。なお、SMMグループ行動基準は、経営環境の変化に合わせて、2
008年10月、2015年4月および2022年10月に内容の見直しを行い、現在に至っています。SMMグループ経営理念では、「ステークホルダー
への責任を果たす」ことを掲げており、適切な情報開示を行うことを、当社の「あるべき姿」としています。
また、SMMグループ行動基準では、「コンプライアンス−法やルールの遵守」として、国内外の法・ルール・社会常識を守ることを定めていま
す。
2)社内規程に基づく体制
経営理念および行動基準を受けて、当社では公平・適時・適切な情報開示を行うため、「報道機関等および投資家等に対する情報発信に関する
規程」および「インサイダー取引防止および情報管理に関する規程」において、内部情報の管理について定めています。
具体的には、いわゆる決定事実に関する情報、発生事実に関する情報および決算に関する情報(以下、「重要事実」という)の取り扱いについ
て、以下のとおりとしています。(a.は「インサイダー取引防止および情報管理に関する規程」、bおよびcは「報道機関等および投資家等に対する情
報発信に関する規程」において定めている。)
a.当社または当社の子会社において重要事実が発生し、または発生が予測されるときは、その重要事実を所管する部門(子会社についてはその
子会社を所管する部門)の長から、法務部長にその旨を報告する。
b.法務部長は、報告された重要事実について、適時開示事項に該当するか否かを判断し、情報取扱責任者である広報IR部長に対し通知する。
c.広報IR部長は、東京証券取引所等の定める規則に従って開示する。
3)稟議制度を通じた適時開示に関する審査
当社では業務の意思決定にあたり、稟議制度を通じた審査、決裁を行うことを基本としています。この意思決定の過程において回付される稟議
書において、事態に応じ適時開示に関する審査を行うこととなっています。
会社情報の適時開示に係る社内体制の模式図
当社における
子会社における
決定事実・発生事実
決定事実・発生事実
決算に関する情報
社内各部門の長
子会社
経理部長
子会社を所管する
社内各部門の長
報告
報告
法務部長
通知
広報IR部長(情報取扱責任者)
通知
証券取引所(情報開示)
報告
*適時開示の
該否の判断
【当社コーポレートガバナンスの枠組み】
株
主
総
会
意思決定・監督
取
監査
締
役
会計監査人
監査役会
会
連携
ガバナンス委員会
報告
業務執行
社
監査役全員への報告
長
内部統制委員会
執行役員
経営会議
業務執行部門
監査部
サステナビリティ委員会
サ
ス
テ
ナ
ビ
リ
テ
ィ
部
会
マ
ネ
ジ
メ
ン
ト
シ
ス
テ
ム
分
科
会
企
業
価
値
向
上
戦
略
会
議
D
X
推
進
委
員
会
カ
ー
ボ
ン
ニ
ュ
ー
ト
ラ
ル
推
進
委
員
会
取締役会のスキル・マトリックス
区
分
取締役および監査役がそれぞれ取締役会に特に貢献できると考える知識、経験、能力等
氏名
野崎
企業経営
国際性
事業戦略・
エンジニアリング・
マーケティング
IT/DX
研究開発・生産
財務・会計
人事・人材開発
サステナビリティ・
ESG
明
○
○
○
松本伸弘
○
○
○
○
○
○
竹林
優
○
○
○
○
○
○
取
三宅泰弘
○
○
○
締
石井妙子
役
木下
学
内部統制
○
○
○
○
○
竹内光二
サワキ ニコラ
法務・
コンプライアンス・
○
○
○
○
○
○
○
○
ミシェール
監
査
役
松下博彦
○
佐々木和仁
○
若松昭司
○
家田嗣也
○
○
○
○
○
○
○
注1.当社は、上記「Ⅱ.3.現状のコーポレート・ガバナンス体制を選択している理由」を踏まえ、取締役および監査役のスキル・マトリックスを作成しております。
各スキル項目は、長期ビジョンの達成や、各重要課題に対応する「2030年のありたい姿」の実現のために必要なものを中心に取締役会での議論を経て選定されてお
ります。当社取締役会に求められる知識、経験、能力、見識等は、経営戦略や外部環境の変化に応じて変わり得るため、今後も必要な知識、経験、能力、見識等につ
いて取締役会で議論し、必要に応じてスキル・マトリックスを更新します。
注2.取締役候補者の指名および監査役候補者の指名の方針および手続については、上記「Ⅰ.コーポレート・ガバナンスに関する基本的な考え方及び資本構成、企業属性
その他の基本情報【コーポレートガバナンス・コードの各原則に基づく開示】【原則3-1:情報開示の充実】(iv) 取締役候補者の指名および経営陣幹部の選解任
の方針と手続、監査役候補者の指名の方針と手続」をご参照ください。
注3.取締役および監査役がそれぞれ取締役会に特に貢献できると考える項目に〇をつけています。なお、以下のとおり充足の目安を定めております。
項目
充足の目安
・上場企業およびこれに準じる企業等での経営者(代表権のある取締役)としての経験
企業経営
・当社の「取締役会のあるべき姿」のうち、
「経営基盤の強化」に資する知見、経験
・当該[経営]領域に関するコンサルタント・学識研究者等
・重要な取引先・提携先を海外に有する部門の担当役員等としての経験
国際性
・海外関係会社その他の外国会社における役員経験、業務経験、駐在の経験/官公庁の海外拠点における活動経験
・経営企画に関する部門の担当役員等としての経験
・コアビジネス(資源、製錬、材料)の担当役員等としての経験
事業戦略・
・事業部門における M&A、事業投資に関する担当役員等としての経験
マーケティング
・金融機関・投資銀行・専門ファームにおける実務責任者としての経験
・関係会社(事業会社)の社長およびこれに準じる役員としての経験
・市場開拓・営業・販売・サプライチェーン管理に関する部門の担当役員等としての経験
・生産技術またはエンジニアリングに関する部門(事業部門内を含む。
)の担当役員等・統括責任者等としての経験/当該[生産技術またはエンジニ
エンジニアリング・ アリング]分野に関係する国際資格の保有
IT/DX
・事業部門における大型設備投資のプロジェクトマネジメントの統括責任者等としての経験
・IT/DX に関する部門の担当役員等としての経験
・研究開発に関する部門(事業部門内を含む。
)の担当役員等・統括責任者等としての経験
・製造に関する部門の統括責任者等としての経験
研究開発・生産
・品質・安全・環境統括部門に関する部門(事業部門内を含む。
)の担当役員等・統括責任者等としての経験
・ISO 等の品質・安全・環境に関連した公的認証機関の審査員資格などの保有
・財務管理・資金調達・経理領域に関する部門の担当役員等としての経験
財務・会計
・金融機関における融資実務責任者等としての経験/会計事務所等での業務経験
・公認会計士・税理士の資格の保有
・人事・人材開発(労務・DE&I 推進を含む。
)に関する部門の担当役員等としての経験/他社における指名または報酬委員会等のメンバーの経験/当
人事・人材開発該[人事・人材開発]領域に関するコンサルタント・学識研究者・弁護士等としての経験
・全社、事業部門または大規模拠点における人事・人材開発の統括責任者等としての経験
・サステナビリティ(カーボンニュートラル、サーキュラーエコノミー、ネイチャーポジティブへの取組みを含む。
)または ESG に関する部門また
サステナビリティ・ は ESG の各主要分野に関する部門の担当役員等としての経験/外部評価機関等での勤務経験
ESG
・当該[サステナビリティ・ESG]領域に関するコンサルタント・学識研究者・弁護士等としての経験
・株主・投資家、地域社会、地域住民との対話責任者の経験
・法務、コンプライアンス推進または内部監査に関する部門の担当役員等としての経験/企業(関係会社を含む。
)における監査役としての経験
法務・
・法曹関連(裁判官・検事・弁護士)の資格の保有/公認会計士・税理士・公認内部監査人・公認不正検査士の資格の保有/当該[法務、コンプライ
コンプライアンス・ アンス推進、内部監査]領域に関する学識研究者
内部統制
・規制当局での規制業務に係る勤務経験
・全社、事業部門または大規模拠点におけるコンプライアンスの統括責任者等としての経験
※「担当役員等」とは、担当役員・本部長・部長およびこれに準じる上級管理職または実務責任者をいいます。
※「統括責任者等」とは、統括責任者およびこれに準じる上級管理職または実務責任者をいいます。




 式典で進水する高速船「はくすい」
 四阪製錬所の位置

 クラバー・コミュニティ病院外観
 引き渡し記念式典

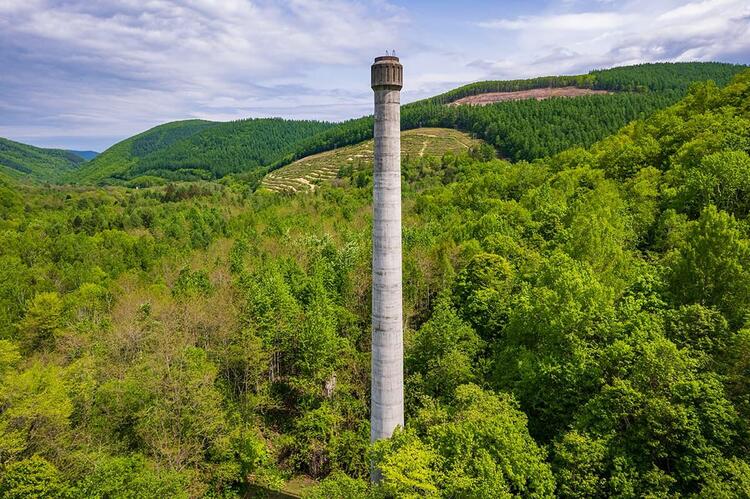 解体前の「大煙突」(2024年5月撮影)