|
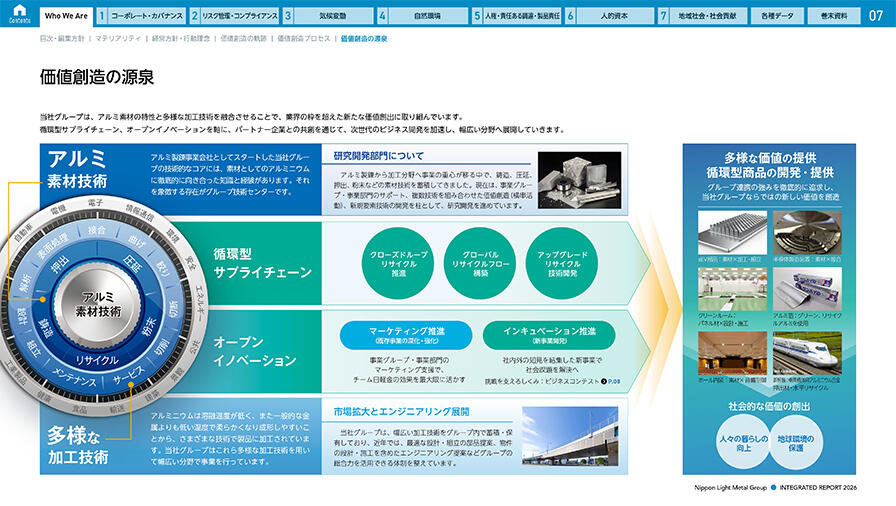
Nippon Light Metal Holdings Company, Ltd. is a pure holding company that oversees a group of subsidiaries and affiliates engaged in the aluminum industry. The group operates across four business segments: alumina and chemicals, aluminum ingots, sheet and extruded products, and processed products and related services. Key activities include the manufacture and sale of alumina, aluminum hydroxide, various chemicals, aluminum alloys, aluminum sheets, and extruded products. The processed products segment covers industrial parts, landscape-related products, panels for refrigerators and freezers, and transportation-related items, alongside services in transportation, information processing, and insurance agency. The foil and powder products segment produces aluminum foil and powder products. Major subsidiaries include Nippon Light Metal Co., Ltd., Toyo Aluminium Co., Ltd., Nippon Full Half Co., Ltd., and Nippon Light Metal Engineering Co., Ltd. The group serves customers across various fields related to aluminum and operates in markets including Japan, India, Thailand, the United States, and China. Summarised from the annual report, fiscal year ended Mar 2026 |
Industry Aluminum | Homepage nikkeikinholdings.co.jp |
| Sector Basic Materials | IR page nikkeikinholdings.co.jp/ir | |
|
Tags
alumina, aluminum alloys, aluminum sheet, extruded products, aluminum foil, powder products, industrial parts, refrigerator panels, transportation products, chemicals, Nippon Light Metal Co. Ltd., Nippon Electrode Co. Ltd., Nikkei MC Aluminum Co. Ltd., Nikkei CMR Aluminium India Private Limited, Nikkei MC Aluminium Thailand Company Limited, Nikkei MC Aluminum America Inc., Aluminium Wire Co. Ltd., Ihara Nikkei Chemical Industry Co. Ltd., CMR NLM Eco Aluminium Private Limited, CMR Nikkei India Private Limited, T.S.T. Nikkei Metals S. de R. L. de C. V., Nikkei Industry Co. Ltd., Riken Light Metal Industry Co. Ltd., Nikkei Siam Aluminium Limited, Toyo Rika Gakuen Co. Ltd., Nikkei Kin Act Co. Ltd., Nikkei Keizai Co. Ltd., Shenzhen Huajia Aluminum Industry Co. Ltd., Nikkei Kin Processing Development Holdings Co. Ltd., Nikkei Panel System Co. Ltd., NLM Ecal Co. Ltd., Nippon Full Half Co. Ltd., Full Half Mahajak Company Limited, Nikkei Kin ALMO Co. Ltd., Nippon Light Metal Georgia Inc., Huajia Light Metal (Suzhou) Precision Parts Co. Ltd., Nikkei Matsuo Co. Ltd., Nippon Light Metal North America Inc., Shandong Conglin Fuluhaofu Automobile Co. Ltd., Nikkei Engineering Co. Ltd., Nikkei Logistics Co. Ltd., Nikkei Information System Co. Ltd., Toho Earth Tech Co. Ltd., Toyo Aluminium Co. Ltd., Zhaoqing Toyo Aluminium Industry Co. Ltd., Hunan Ningxiang Jiweixin Metal Powder Co. Ltd., Toyal America Inc., Toyal MMP India Private Limited, Toyal Europe S.A.S., Toyo Aluminum Eco Products Co. Ltd., Subam Toyal Packaging Industries Private Limited, Sanya Aluminium Co. Ltd.
|
Press page — |
Metrics
| Valuation | |
|---|---|
| Market cap | ¥ 178.356B |
| Market cap (USD) | $ 1.115B |
| P/E | 8.19 |
| PEG | 0.28 |
| P/BV | 0.64 |
| P/S | 0.28 |
| P/OCF | 9.94 |
| P/FCF | -22.41 |
| Dividend yield | 2.8% |
| Turnover / mcap | — |
| Returns | |
|---|---|
| ROE | 6.0% |
| ROI | 3.7% |
| ROIC | 4.1% |
| Profit margin | 2.7% |
| Growth | |
|---|---|
| Revenue growing | Yes |
| Profits growing | Yes |
| Revenue up 3y | Yes |
| Revenue up 5y | Yes |
| Earnings growth 3y (net profit CAGR) | 29.4% |
| Quality | |
|---|---|
| Profitable | Yes |
| Margin expanding | Yes |
| Buying back stock | No |
| Diluting (TTM) | No |
| Debt/Equity | — |
| Podcast bulls (TTM) | Sign up |
| Podcast bears (TTM) | Sign up |
| Podcast sentiment (TTM) | Sign up |
| Podcast sentiment % (TTM) | Sign up |
| News sentiment (TTM) | 0 |
| Quality score | 27.8% |
| Insiders | |
|---|---|
| Buys, 1w | Sign up |
| Buys, 1m | Sign up |
| Buys, 1y | Sign up |
| Sells, 1w | Sign up |
| Sells, 1m | Sign up |
| Sells, 1y | Sign up |
Sign up to see this company's insider trades
| Figure | FY 2026 | FY 2025 | FY 2024 | FY 2023 | FY 2022 | FY 2021 | FY 2020 | FY 2019 | FY 2018 | FY 2017 | FY 2016 | FY 2015 | FY 2014 | FY 2013 |
|---|---|---|---|---|---|---|---|---|---|---|---|---|---|---|
| Revenue | 585.473B | 550.18B | 523.715B | 516.954B | 486.579B | 432.568B | 465.946B | 500.451B | 481.439B | 448.381B | 464.405B | 431.477B | 402.829B | 371.887B |
| Net profit | 15.59B | 12.375B | 9.037B | 7.203B | 16.759B | 3.366B | 7.476B | 20.56B | 18.012B | 19.52B | 15.533B | 9.645B | 5.128B | 3.355B |
| Free cash flow | 3.65B | -9.608B | 14.112B | -17.713B | -19.363B | 15.258B | 18.92B | 11.009B | 6.473B | 19.449B | 18.689B | — | — | — |
| Figure | FY 2026 | FY 2025 | FY 2024 | FY 2023 | FY 2022 | FY 2021 | FY 2020 | FY 2019 | FY 2018 | FY 2017 | FY 2016 | FY 2015 | FY 2014 | FY 2013 |
|---|---|---|---|---|---|---|---|---|---|---|---|---|---|---|
| Share price | 2.776K | 1.52K | 1.819K | 1.462K | 1.714K | 2.213K | 169.02 | 242.99 | 285.04 | 245.11 | 185.04 | 177.95 | 135.02 | 105.01 |
| Price performance 12m | 0.83 | -0.16 | 0.24 | -0.15 | -0.23 | 12.09 | -0.3 | -0.15 | 0.16 | 0.32 | 0.04 | 0.32 | 0.29 | — |
Filed figures
Lines the statements and their notes report beside the headline figures, read from the filings' XBRL as filed (no restatement applied), with figures computed from one filing's own lines. Cash-flow lines carry their cash direction: an outflow is negative. Each period links to its filing; a figure's period, report date and tag are in its tooltip.
| Figure | Mar 2017 | Mar 2018 | Mar 2019 | Mar 2020 | Mar 2021 | Mar 2022 | Mar 2023 | Mar 2024 | Mar 2025 | Mar 2026 |
|---|---|---|---|---|---|---|---|---|---|---|
| Balance sheet detail | ||||||||||
| Trade receivables (JPY) | 136B | 155B | 153B | 133B | 134B | 258B | 265B | 276B | 263B | 268B |
| ↳ YoY growth | +0.4% | +13.9% | -1.4% | -12.9% | +0.6% | +92.6% | +2.9% | +4.0% | -4.5% | +1.9% |
| ↳ 5y CAGR | -0.2% | +13.6% | +11.4% | +12.5% | +14.6% | +14.9% | ||||
| Borrowings, current (JPY) | 81.9B | 75.5B | 69.9B | 62.7B | 62.7B | 78.2B | 93.2B | 92.8B | 82.3B | 54.8B |
| Borrowings, non-current (JPY) | 67.9B | 64.5B | 69.7B | 70B | 83.6B | 77.2B | 70.4B | 63.3B | 86.5B | 111B |
| Bonds payable (JPY) | 673M | 637M | 666M | 653M | 664M | 734M | 801M | 908M | 897M | 959M |
| Cash and deposits (JPY) | 36.3B | 30.7B | 33.4B | 36.3B | 61.2B | 45.2B | 31.3B | 35.2B | 34.7B | 33.1B |
| Intangible assets (JPY) | 3.19B | 3.19B | 5.55B | 5.87B | 7.07B | 12.4B | 12.2B | 12B | 11.2B | 10.4B |
| Net debt (borrowings + leases - cash) (JPY) | 113B | 109B | 106B | 96.3B | 85B | 110B | 132B | 121B | 134B | 133B |
| Cash flow detail | ||||||||||
| Operating cash flow (JPY) | 36.5B | 25.9B | 34.6B | 48.7B | 41.9B | 1.49B | 695M | 38B | 12.1B | 25.6B |
| Purchases of property, plant and equipment (JPY) | -17B | -19.4B | -22.3B | -28.3B | -24.2B | -18.6B | -16.5B | -22B | -20B | -20.2B |
| Purchases of intangible assets (JPY) | — | -933M | -1.37B | -1.49B | -2.44B | -2.2B | -1.89B | -1.89B | -1.63B | -1.82B |
| Change in receivables (cash effect) (JPY) | -1.07B | -18.3B | 3.81B | 18.9B | -290M | -8.76B | -5.92B | -4.88B | 6.28B | -1.15B |
| Change in inventories (cash effect) (JPY) | 476M | -7.08B | -4.19B | 4.87B | 1.71B | -22.6B | -4.19B | 1.29B | -9.3B | -4.13B |
| Change in payables (cash effect) (JPY) | -478M | 10.6B | -3.72B | -10.4B | 673M | 4.01B | -2.2B | 4.2B | -12.1B | -4.14B |
| Dividends paid (cash effect) (JPY) | -4.91B | -5.58B | -4.97B | -5.59B | -3.12B | -6.5B | -5.26B | -1.24B | -3.73B | -4.66B |
| Interest paid (cash effect) (JPY) | -1.75B | -1.35B | -1.35B | -1.17B | -1.06B | -1.12B | -1.3B | -1.36B | -1.83B | -2.25B |
| Income taxes paid (cash effect) (JPY) | -6.99B | -5.54B | -4.53B | -7.43B | -4.76B | -6.3B | -8.92B | -777M | -5.02B | -6.63B |
| Operating cash flow before change in receivables (JPY) | 37.6B | 44.2B | 30.8B | 29.8B | 42.2B | 10.3B | 6.61B | 42.9B | 5.78B | 26.8B |
| Free cash flow (OCF - PPE - intangibles) (JPY) | 19.4B | 6.47B | 11B | 18.9B | 15.3B | -19.4B | -17.7B | 14.1B | -9.61B | 3.65B |
| Income detail | ||||||||||
| Research and development expense (JPY) | 4.94B | 5.18B | 5.45B | 5.87B | 5.94B | 6.44B | 6.39B | 6.26B | 5.86B | 6.79B |
| ↳ 5y CAGR | +4.4% | +5.5% | +4.3% | +2.8% | 0.0% | +2.7% | ||||
| Total comprehensive income (JPY) | 19.8B | 21.9B | 19.7B | 6.14B | 9.78B | 20.1B | 6.67B | 18.9B | 16.7B | 22.2B |
| Comprehensive income to owners (JPY) | 19.3B | 19.8B | 18.4B | 4.51B | 7.59B | 18.9B | 8.1B | 17.1B | 15.4B | 19.6B |
| Reported | Jun 27, 2017 | Jun 25, 2019 | Jun 25, 2019 | Jun 24, 2020 | Jun 25, 2021 | Jun 24, 2022 | Jun 27, 2023 | Jun 25, 2024 | Jun 23, 2025 | Jun 22, 2026 |
Sign up to see institutional holdings
Sign UpPodcast Mentions
Sign up to see podcast mentions and sentiment
Sign UpTimely disclosures published on TDnet, newest first, titles as filed in Japanese. The link opens the disclosure on TDnet. Filings with EDINET (periodic reports, extraordinary reports, offerings, holding and buy-back reports), newest first, titles as filed in Japanese. The link opens the filing on EDINET. Press releases from the company's own website, newest first.
日本軽金属ホールディングス株式会社 「2027 年3月期中間期決算説明会」質疑応答要旨メモ ・日時:2026 年 11 月2日(月)16 時~16 時 50 分 ・説明者:代表取締役社長
朝来野修一
取締役副社長執行役員松平弘之 執行役員経営管理統括室長一色浩一 経営管理統括室経理担当天谷勝裕 Q1. アルミ地金市況上昇に伴う値差(益)実現による損益影響はどれくらいか? A1. 上期の損益影響額は(決算説明会資料 P5「26 年度中間期決算経常利益変化要因」 にある)地金収支による影響+44 億円がこれにあたる。主な内訳はメタル事業グル ープに含まれるアルミ地金調達部門での影響が約+25 億円、軽圧事業グループでの 影響が約+15 億円である。その過半は第1四半期に発現したものである。 Q2. 下期での影響額はどれくらいか? A2. ほぼ無いとの見方である。 Q3. 26 年度上期と下期のセグメント別の営業利益変化の要因は? A3. 上期に発現のアルミ地金市況上昇に伴う値差(益)について下期での発現は無いと みていることから、アルミナ・化成品、地金セグメントで約 25 億円、板、押出セグ メントで約 15 億円の営業利益が減る見え方になる。一方でアルミナ・化成品、地金 セグメントの二次合金部門(メタル事業グループ)の業績が比較的好調である。第1 四半期決算後において、上期約 60 億円・下期約 15 億円、通期営業利益予想約 75 億 円としていたのに対し、今回、上期約 65 億円・下期約 25 億円、通期営業利益予想 約 90 億円としている。因みに(決算説明会資料 P5「26 年度中間期決算経常利益 変化要因」にある)販売増減の影響額+80 億円のうち、二次合金部門(メタル事業 グループ)の影響額は約+50 億円(通期における影響額もほぼ同額)であるが、こ のうち、35 億円程度は米国等での相場環境等の事業環境良化による増益という捉え 方をしている。 Q4. アルミ地金市況関連以外での利益変化の要因は? A4. アルミナ・化成品、地金セグメント 化成品事業グループは下期での販売価格改定の影響発現を織り込み。 板、押出製品セグメント 板部門は半導体製造装置向け厚板やLIBケース向け板材の需要は堅調な推移 を見込むも、注文に対ししっかり作りきれるかが経営の課題と認識。押出部門は 1
トラック架装向け需要が旺盛の一方で他の商材が翌期に受注がずれ込むことを 織り込み、前回第1四半期決算後の利益予想より若干下方修正。 加工製品、関連事業セグメント 輸送機器事業グループ(トラック架装日本フルハーフ)は上期(特に第1四半 期を中心に)の非常に厳しい状況から下期は需要をしっかりこなせば通期で 20 億円弱の利益が出せる前提。エンジニアリング事業グループの断熱パネル(日軽 パネルシステム)は下期型の利益構造であることから、上期ゼロ・下期 20 億円 強のバランス。自動車部品事業グループ(日軽金ALMO)は海外事業のマイナ スを若干上回る利益水準を国内事業で稼いでいる状況。 箔、粉末製品セグメント パウダー・ペースト部門の窒化アルミの需要が引き続き好調に推移。 Q5. 自己株式の取得決定について、当社の株主還元基準である総還元性向 40%程度を意 識したものと認識している。一方で 26 年度業績にはアルミ地金市況上昇に伴う値差 (益)などの一過性によるものが+70~80 億円前後あるように見えるが、これが来 期 27 年度になくなった場合には基本的に配当額を据え置き、自己株式の取得の部分 で調整するのか、といった株主還元の配分の仕方についての考え方は? A5. 今期 26 年度業績には実力プラスαが含まれているのはご認識のとおりである。来期 27 年度の業績については各事業の業績を今期並にしっかりと持ち上げることを進め るとともに、 「26 中計」にあるプロセス変革の施策も同時並行で進め、少なくとも今 期並の業績水準を確保するための努力をし続ける。 Q6. 一過性と認識している部分+70~80 億円の内訳は上期に発現のアルミ地金市況上昇 に伴う値差(益)が約+45 億円、二次合金部門(メタル事業グループ)での販売価 格とコストとのスプレッドによる影響が約+35 億円と思われるが、下期はこれらの 要素の利益影響額をどう想定しているか? A6. アルミ地金市況上昇に伴う値差(益)は下期での発現は無い前提。一方で二次合金 部門(メタル事業グループ)でのスプレッドは販売価格へのコスト上昇分の転嫁を含 む経営努力によるもの。加えて下期以降の二次合金事業は好調な需要の推移を前提 に業績予想をしている。 Q7. 持分法適用関連会社の株式の一部譲渡の実施に至った経緯は?また「26 中計」のプ ロセス変革にあるグループ統合戦略にかかわる本件以外の施策が今後出されるの か? A7. 本日 11 月2日に開示したとおり、東洋アルミニウム(箔事業グループ)が保有する 韓国の上場会社である三亜アルミニウムの株式の一部を譲渡するもの。現状、両社で の事業シナジーがそれほど無い中で、事業・資産の選択と集中をしっかり図っていく 2
ことを念頭に、最終的な目標として保有全株式の売却という選択肢もある中で、先ず は持分法適用関連会社の対象から外れる水準まで株式を売却した。 Q8. 「26 中計」の財務目標として「経常利益 300 億円超の安定収益基盤」を掲げている が、来期 27 年度においても経常利益 300 億円を超えるというのは視野に入ったと いう感触を得ているか? A8. 各事業グループの事業環境そのものは概ね好調に推移していると認識している。一 部、エンジニアリング事業グループの断熱パネルのクリーンルーム向けの足元の需 要は弱含みであるが、半導体生産工場の能力増強の期待感もあり、悲観的な状況とは 考えていない。よって好調な事業環境をどれだけ自分達のものにできるかが1つ目 のポイントと捉えている。もう1つは「26 中計」にあるプロセス変革の施策として の低収益事業への対応をどれだけ早期に事業の選択と集中によって行い、利益拡大 へ図っていくことが来年にかけてやるべきことと認識をしている。この2つのポイ ントの実行の結果として、300 億円超の利益としていきたい。 Q9. (決算説明会資料 P5「26 年度中間期決算経常利益変化要因」にある)販売増減影 響+80 億円のうち、二次合金部門(メタル事業グループ)での影響が+50 億円と の説明があったが、この中に中東情勢による代替需要の影響は含まれているのか? A9. 含まれている。ただ、足元においては中東からの供給ルートがそれなりに確保され つつあることでリスクが低減していることから、代替需要も収束に向かう状況と捉 えている。 Q10. 中国・米国における自動車部品事業の中期的な展望について、どう捉えているか? A10. お客様である日系自動車メーカー各社様に販売させていただく前提の事業である中 で、当社販売も回復していかない厳しい状況にある。当社グループとして、黒字化の 可否・方策も含めた多面的に検討を進めているところである。
2026 年 11 月 4 日 各位 理研軽金属工業株式会社
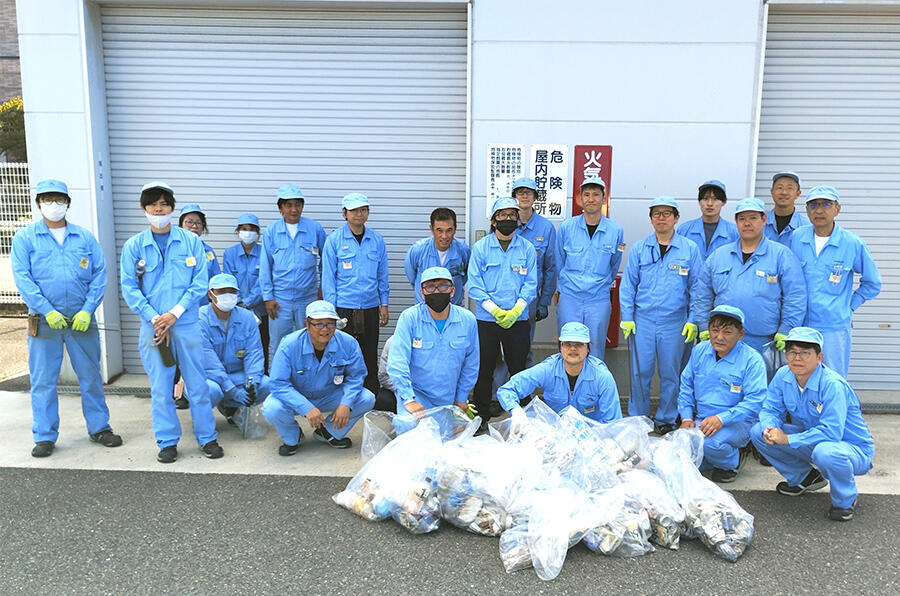
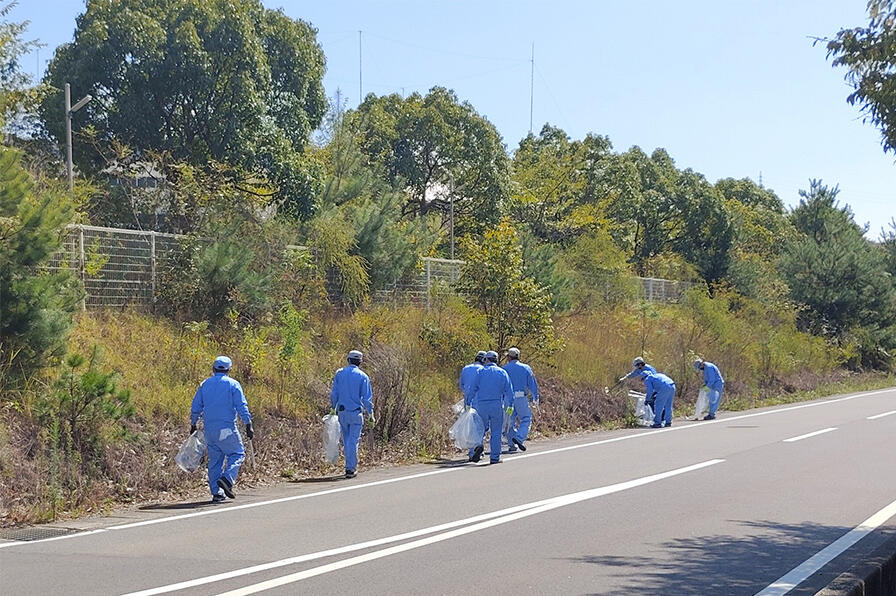
「三保松原の下草刈り・松葉かき」に参加しました
アルミニウム製品の加工から販売までを一貫で行う、理研軽金属工業株式会社(静 岡県静岡市駿河区、社⻑/福富俊輔)は、2026 年 10 月 17 日(土)静岡市環境保全 推進協力会の活動「三保松原の下草刈り・松葉かき」に参加しました。 三保の環境を守り、次世代に豊かな地球を継承するため、今後も引き継ぎ活動に参 加していきます。 ▼松葉かき
理研軽金属工業㈱ホームページ:https://www.rikenkeikinzoku.co.jp 【理研軽金属工業株式会社】 本社:〒422-8530 静岡県静岡市駿河区曲金 3-2-1 代表:代表取締役社⻑福富俊輔 TEL:054-281-1111 / FAX:054-282-0654 URL:https://www.rikenkeikinzoku.co.jp 事業内容:アルミ製品(スパンドレル・ルーバー・庇 etc)の生産・開発・販売。



Prompts
Click prompts to add them under the company line, click again to take one out, then copy the result into your AI chat. Shared by Asian Century Stocks and Uncovered Thai Stocks. Thank you.
ETFs Holding Nippon Light Metal Holdings Company, Ltd.
Exchange-traded funds whose newest published daily portfolio holds one of the company's listings, largest weight first.
| ETF | Weight in ETF | Shares | Market value | As of |
|---|---|---|---|---|
| DISV | 0.16% | 503,700 | $ 8.152M | Nov 12, 2026 |
| AVDV | 0.13% | 1,652,810 | $ 25.74M | Nov 16, 2026 |
| DFIS | 0.05% | 174,500 | $ 2.824M | Nov 12, 2026 |
| AVDS | 0.04% | 9,500 | $ 147.945K | Nov 16, 2026 |
| DXIV | 0.03% | 4,500 | $ 72.833K | Nov 12, 2026 |
| AVDE | 0.02% | 293,520 | $ 4.571M | Nov 16, 2026 |
| DFSI | 0.01% | 10,600 | $ 171.562K | Nov 12, 2026 |
| DFIC | 0.01% | 126,900 | $ 2.054M | Nov 12, 2026 |
| DFAX | 0.01% | 60,571 | $ 980.349K | Nov 12, 2026 |
| DFAI | 0.00% | 48,600 | $ 786.597K | Nov 12, 2026 |