自己株券買付状況報告書(法24条の6第1項に基づくもの)
Bull 1
Bear 0
Routine
5602
Fiscal year ends March
Quarters are offset from the calendar — Q1 is Apr–Jun
|
Kurimoto, Ltd. is a manufacturer of infrastructure and industrial equipment, operating through three main business segments: lifelines, mechanical systems, and industrial construction materials. The company produces ductile iron pipes, steel pipes, valves, and sanitary piping, with key subsidiaries including Kurimoto Trading, Yamatogawa, and Hokkaido Pipe. It also manufactures cast iron and cast steel products through Japan Casting, and provides chemical and pharmaceutical machinery via Yashima Chemical Machinery. Kurimoto develops carbon fiber reinforced plastic (CFRP) components and forming systems at its Kurimoto Composite Center, serving the aerospace, automotive, and medical sectors. The group offers water supply pipeline design, construction, and management services through Kurimoto Pipe Engineering, and asphalt crushing plants through Sankyo Machinery. Kurimoto USA and Readco Kurimoto handle industrial machinery installation and sales in the United States. Founded in 1909, the company supplies products for social infrastructure and industrial equipment expansion. Summarised from the annual report, fiscal year ended Mar 2026 |
Industry Building Products & Equipment | Homepage kurimoto.co.jp |
| Sector Industrials | IR page corp.kurimoto.co.jp/ir | |
|
Tags
ductile iron pipes, steel pipes, valves, sanitary piping, cast iron products, chemical machinery, cfrp components, water supply systems, asphalt crushing plants, industrial machinery, Kurimoto Trading, Yamatogawa, Hokkaido Pipe, Japan Casting, Motoyama Seisakusho, Keyastech, Yashima Chemical Machinery, Japan Kaiser, Kurimoto Business Associates, Kurimoto Polymer, Zentech, Kurimoto Pipe Engineering, Sankyo Machinery, Tsukasa Industrial, Kurimoto USA Inc., Readco Kurimoto LLC, Kurikou Co. Ltd., Kurito (Shanghai) Trading Co. Ltd., Kurimoto Composite Center
|
Press page corp.kurimoto.co.jp/news |
Metrics
| Valuation | |
|---|---|
| Market cap | ¥ 102.964B |
| Market cap (USD) | $ 645.15M |
| P/E | 14.70 |
| PEG | 1.19 |
| P/BV | 1.09 |
| P/S | 0.80 |
| P/OCF | 17.87 |
| P/FCF | -29.54 |
| Dividend yield | 10.7% |
| Turnover / mcap | — |
| Returns | |
|---|---|
| ROE | 7.3% |
| ROI | 5.8% |
| ROIC | 4.8% |
| Profit margin | 5.2% |
| Growth | |
|---|---|
| Revenue growing | Yes |
| Profits growing | No |
| Revenue up 3y | Yes |
| Revenue up 5y | No |
| Earnings growth 3y (net profit CAGR) | 12.3% |
| Quality | |
|---|---|
| Profitable | Yes |
| Margin expanding | Yes |
| Buying back stock | No |
| Diluting (TTM) | No |
| Debt/Equity | — |
| Podcast bulls (TTM) | Sign up |
| Podcast bears (TTM) | Sign up |
| Podcast sentiment (TTM) | Sign up |
| Podcast sentiment % (TTM) | Sign up |
| News sentiment (TTM) | 20 |
| Quality score | 5.6% |
| Insiders | |
|---|---|
| Buys, 1w | Sign up |
| Buys, 1m | Sign up |
| Buys, 1y | Sign up |
| Sells, 1w | Sign up |
| Sells, 1m | Sign up |
| Sells, 1y | Sign up |
Sign up to see this company's insider trades
| Figure | FY 2026 | FY 2025 | FY 2024 | FY 2023 | FY 2022 | FY 2021 | FY 2020 | FY 2019 | FY 2018 | FY 2017 | FY 2016 | FY 2015 | FY 2014 | FY 2013 |
|---|---|---|---|---|---|---|---|---|---|---|---|---|---|---|
| Revenue | 128.126B | 126.669B | 125.925B | 124.827B | 105.954B | 116.596B | 109.904B | 108.786B | 107.122B | 101.647B | 101.964B | 98.394B | 103.664B | 98.175B |
| Net profit | 6.701B | 6.905B | 5.47B | 4.727B | 2.917B | 3.174B | 2.773B | 2.075B | 2.4B | 4.103B | 2.194B | 1.598B | 3.747B | 2.898B |
| Free cash flow | 843M | -5.686B | 7.898B | 2.685B | 325M | 1.637B | 1.313B | 1.668B | 7.44B | 4.481B | 434M | — | — | — |
| Figure | FY 2026 | FY 2025 | FY 2024 | FY 2023 | FY 2022 | FY 2021 | FY 2020 | FY 2019 | FY 2018 | FY 2017 | FY 2016 | FY 2015 | FY 2014 | FY 2013 |
|---|---|---|---|---|---|---|---|---|---|---|---|---|---|---|
| Share price | 1.522K | 4.551K | 4.066K | 2.02K | 1.572K | 1.746K | 1.891K | 1.454K | 2.029K | 2.187K | 1.543K | 229.1 | 227.05 | 306.89 |
| Price performance 12m | -0.67 | 0.12 | 1.01 | 0.28 | -0.1 | -0.08 | 0.3 | -0.28 | -0.07 | 0.42 | 5.73 | 0.01 | -0.26 | — |
Filed figures
Lines the statements and their notes report beside the headline figures, read from the filings' XBRL as filed (no restatement applied), with figures computed from one filing's own lines. Cash-flow lines carry their cash direction: an outflow is negative. Each period links to its filing; a figure's period, report date and tag are in its tooltip.
| Figure | Mar 2017 | Mar 2018 | Mar 2019 | Mar 2020 | Mar 2021 | Mar 2022 | Mar 2023 | Mar 2024 | Mar 2025 | Mar 2026 |
|---|---|---|---|---|---|---|---|---|---|---|
| Balance sheet detail | ||||||||||
| Trade receivables (JPY) | 40.7B | 41.4B | 46.3B | 41.2B | 43.2B | 76B | 81.8B | 81.9B | 82.2B | 70.7B |
| ↳ YoY growth | +1.9% | +1.8% | +11.9% | -11.0% | +4.8% | +76.0% | +7.6% | +0.1% | +0.4% | -13.9% |
| ↳ 5y CAGR | +1.6% | +13.3% | +14.6% | +12.1% | +14.8% | +10.4% | ||||
| Borrowings, current (JPY) | 30.1B | 23.4B | 22.4B | 23B | 21B | 23.5B | 20.5B | 13B | 18.7B | 15B |
| Borrowings, non-current (JPY) | 18M | 4.96B | 2.88B | 705M | 1.74B | 714M | 118M | 1.13B | 570M | 7.1B |
| Lease liabilities (JPY) | 91M | 91M | 59M | 103M | 123M | 101M | 895M | 936M | 1.11B | 1.06B |
| Cash and deposits (JPY) | 18.3B | 23.2B | 21.6B | 20.4B | 20.4B | 21.4B | 20.3B | 19.4B | 15.7B | 18.5B |
| Intangible assets (JPY) | 680M | 749M | 745M | 1.4B | 1.85B | 1.77B | 1.44B | 1.18B | 1.08B | 840M |
| Net debt (borrowings + leases - cash) (JPY) | 11.9B | 5.28B | 3.74B | 3.47B | 2.43B | 2.93B | 1.23B | -4.33B | 4.69B | 4.63B |
| Cash flow detail | ||||||||||
| Operating cash flow (JPY) | 6.88B | 9.52B | 4.14B | 5.55B | 5.91B | 2.81B | 5.06B | 10.3B | -2.34B | 7.11B |
| Purchases of property, plant and equipment (JPY) | -2.4B | -2.08B | -2.47B | -4.24B | -4.27B | -2.49B | -2.38B | -2.38B | -3.35B | -6.27B |
| Change in receivables (cash effect) (JPY) | -744M | -184M | -3.19B | 6.1B | -3.94B | 88M | -6.93B | -82M | -1.25B | 4.41B |
| Change in inventories (cash effect) (JPY) | 80M | -142M | 321M | -3.26B | 4.02B | -4.06B | 587M | -2.02B | -493M | 1.74B |
| Change in payables (cash effect) (JPY) | 696M | 4.05B | 865M | -4.64B | -867M | 1.71B | 693M | 4.71B | -9.86B | -5.01B |
| Dividends paid (cash effect) (JPY) | -509M | -690M | -816M | -754M | -733M | -915M | -915M | -1.21B | -2.72B | -3.95B |
| Share buybacks (cash effect) (JPY) | -794M | -1M | 0.00 | -700M | 0.00 | 0.00 | 0.00 | -700M | -1M | -1M |
| Interest paid (cash effect) (JPY) | -310M | -264M | -170M | -144M | -150M | -153M | -152M | -141M | -234M | -256M |
| Income taxes paid (cash effect) (JPY) | -769M | -783M | -361M | -701M | -1.69B | -964M | -766M | -3.12B | -2.32B | -2.79B |
| Operating cash flow before change in receivables (JPY) | 7.63B | 9.71B | 7.33B | -550M | 9.85B | 2.73B | 12B | 10.4B | -1.09B | 2.7B |
| Free cash flow (OCF - PPE - intangibles) (JPY) | 4.48B | 7.44B | 1.67B | 1.31B | 1.64B | 325M | 2.69B | 7.9B | -5.69B | 843M |
| Income detail | ||||||||||
| Research and development expense (JPY) | 1.55B | 1.52B | 1.42B | 1.59B | 1.8B | 1.53B | 1.6B | 1.67B | 1.93B | 2.01B |
| ↳ 5y CAGR | +4.0% | -0.2% | +1.1% | +3.3% | +4.0% | +2.2% | ||||
| Total comprehensive income (JPY) | 8.59B | 3.24B | 494M | 1.24B | 6.97B | 3.44B | 6.27B | 11.7B | 8.78B | 10.7B |
| Comprehensive income to owners (JPY) | 8.55B | 3.2B | 437M | 1.27B | 6.79B | 3.28B | 6.17B | 11.6B | 8.67B | 10.6B |
| Provision for credit losses (JPY) | 19M | 11M | -6M | 6M | -41M | 42M | 4M | -82M | -6M | 201M |
| Credit cost ratio (credit losses / average receivables) (%) | 0.0% | 0.0% | 0.0% | 0.0% | 0.1% | 0.1% | 0.0% | 0.1% | 0.0% | 0.3% |
| Segments | ||||||||||
| Lifeline Business · Segment revenue (JPY) | — | — | — | — | 56.3B | 57.6B | 61B | 64.6B | 62.3B | 66.1B |
| ↳ YoY growth | +2.4% | +5.9% | +5.8% | -3.4% | +6.0% | |||||
| Lifeline Business · Segment operating income (JPY) | — | — | — | — | 3.09B | 3.02B | 3.68B | 4.49B | 4.03B | 4.73B |
| Reported | Jun 30, 2017 | Jun 29, 2018 | Jun 27, 2019 | Jun 26, 2020 | Jun 29, 2022 | Jun 29, 2022 | Jun 29, 2023 | Jun 27, 2024 | Jun 25, 2025 | Jun 24, 2026 |
Sign up to see institutional holdings
Sign UpPodcast Mentions
Sign up to see podcast mentions and sentiment
Sign UpTimely disclosures published on TDnet, newest first, titles as filed in Japanese. The link opens the disclosure on TDnet. Filings with EDINET (periodic reports, extraordinary reports, offerings, holding and buy-back reports), newest first, titles as filed in Japanese. The link opens the filing on EDINET. Press releases from the company's own website, newest first.
自己株式の取得状況および取得終了ならびに自己株式の消却に関するお知らせ
Bull 3
Bear 0
Capital return
2027年3月期第2四半期(中間期)決算短信〔日本基準〕(連結)
Bull 2
Bear 0
Results



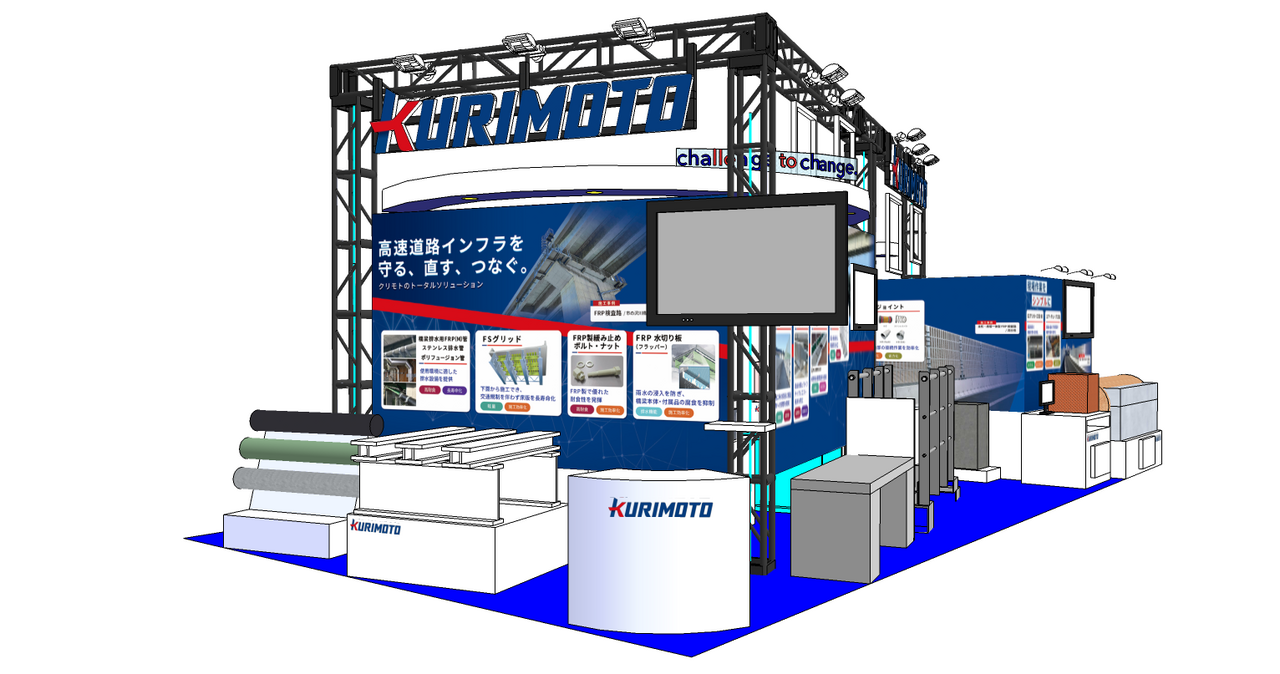 ブースイメージ
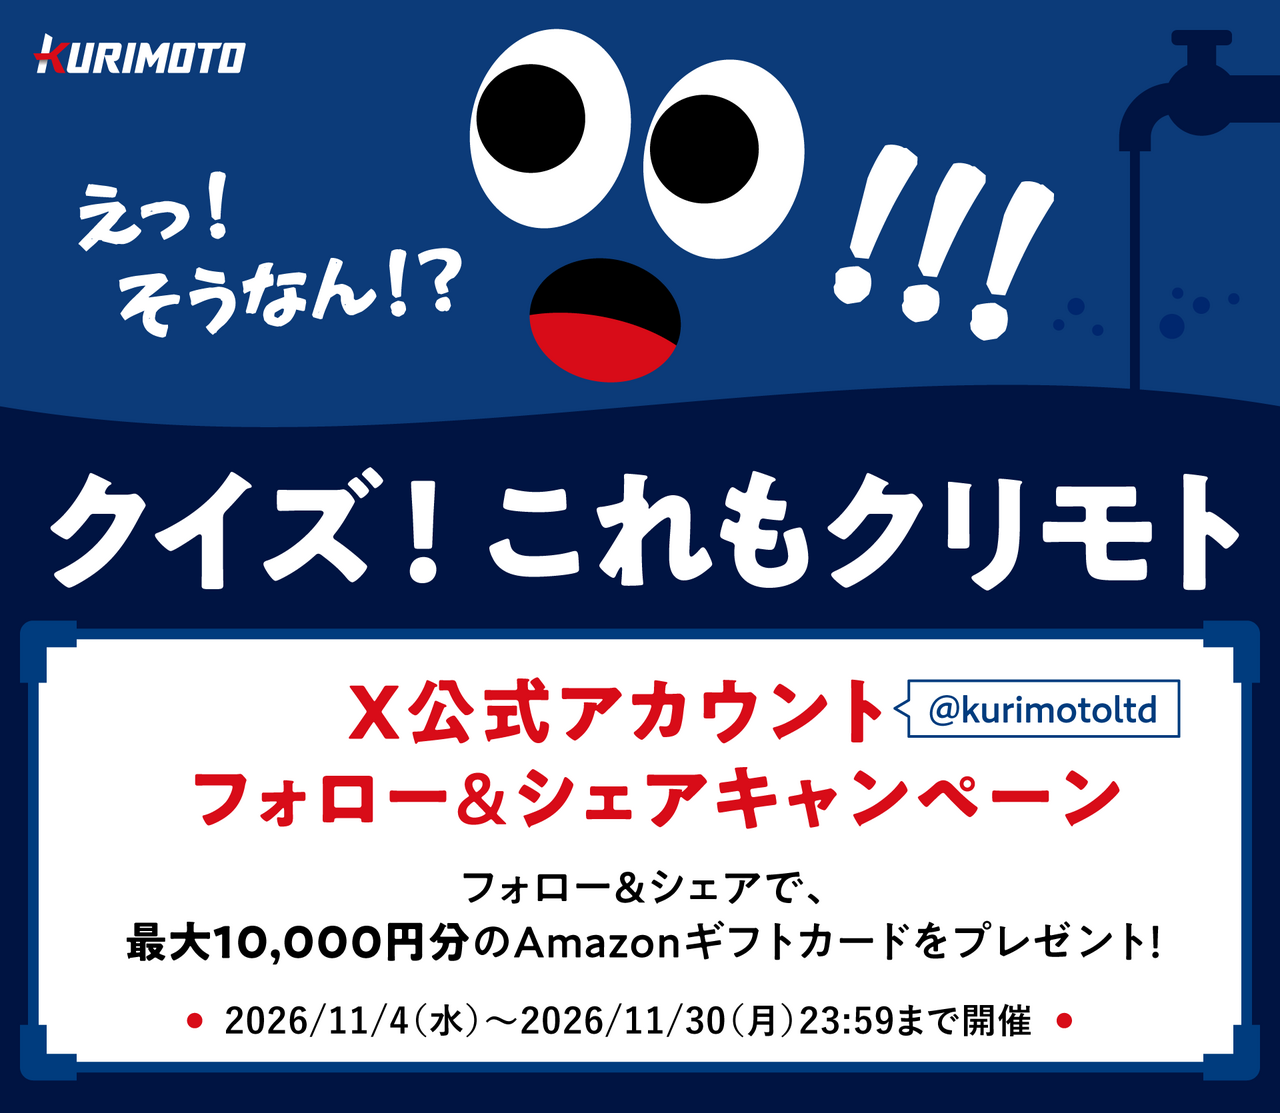
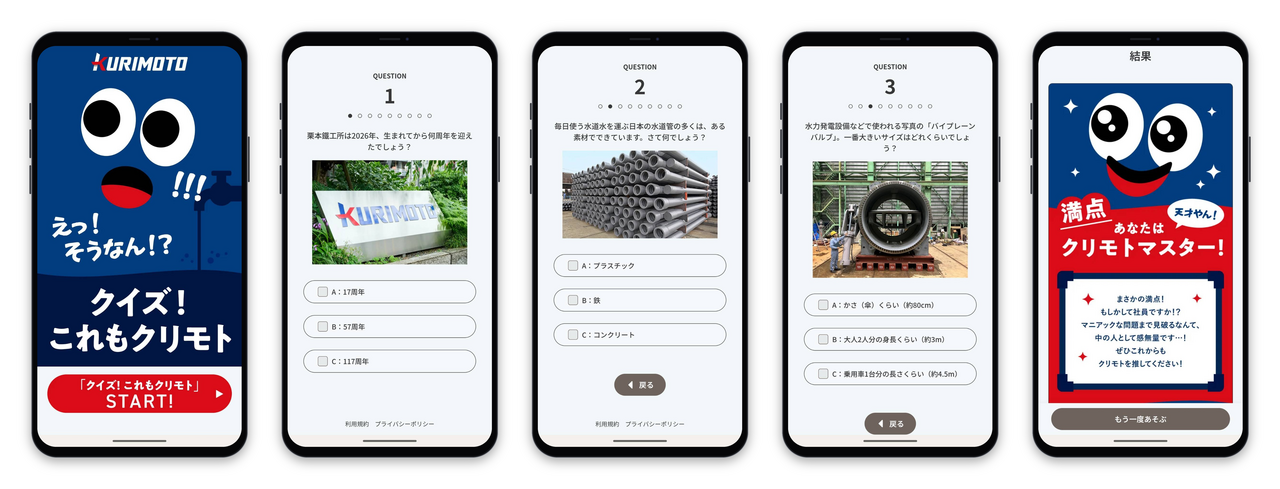
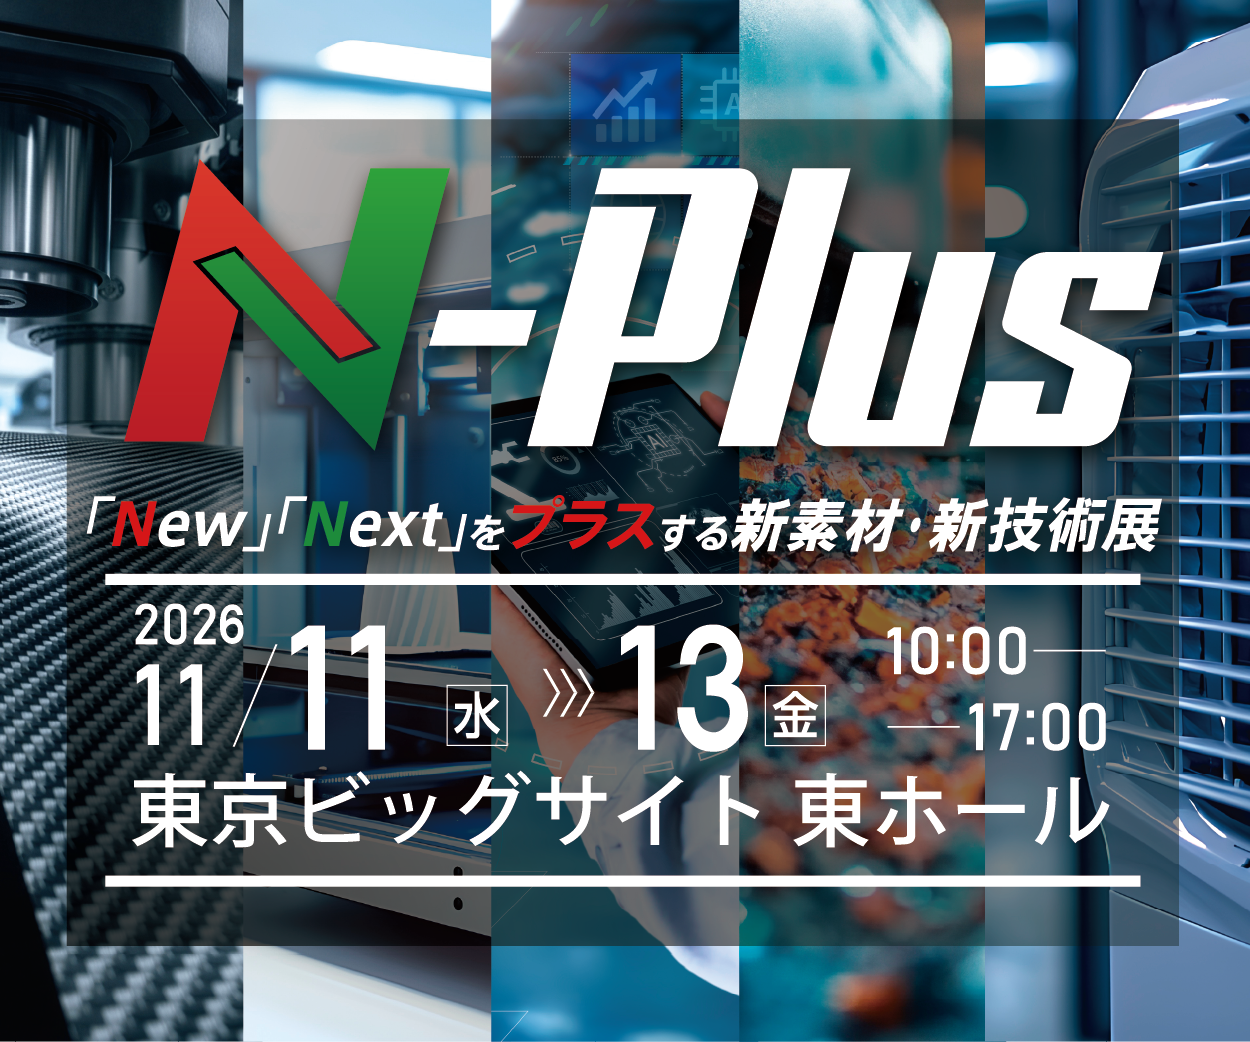
 会社案内
 経営方針
 クリモトをもっと知る
 事業領域


 クリモト技報
 コンポジットプロジェクト室
 技術開発室

 基本情報
 株主・株式情報
 財務情報
 IRライブラリー

 クリモトグループの
 環境
 社会
 ガバナンス
 サステナビリティデータ


 JA





Prompts
Click prompts to add them under the company line, click again to take one out, then copy the result into your AI chat. Shared by Asian Century Stocks and Uncovered Thai Stocks. Thank you.
Kurimoto, Ltd. (ticker 5602), listed in Japan.
Copied
ETFs Holding Kurimoto, Ltd.
Exchange-traded funds whose newest published daily portfolio holds one of the company's listings, largest weight first.
| ETF | Weight in ETF | Shares | Market value | As of |
|---|---|---|---|---|
| DFIS | 0.02% | 149,100 | $ 1.358M | Nov 12, 2026 |
| DISV | 0.02% | 84,800 | $ 772.163K | Nov 12, 2026 |
| DXIV | 0.01% | 2,900 | $ 26.407K | Nov 12, 2026 |
| AVDS | 0.01% | 2,500 | $ 22.396K | Nov 16, 2026 |
| DFIC | 0.01% | 97,400 | $ 886.894K | Nov 12, 2026 |
| DFSI | 0.00% | 5,900 | $ 53.724K | Nov 12, 2026 |
| DFAX | 0.00% | 46,400 | $ 422.504K | Nov 12, 2026 |
| DFAI | 0.00% | 33,300 | $ 303.22K | Nov 12, 2026 |