|
Noritake Co., Limited is a diversified manufacturer operating through four main business segments: industrial equipment, ceramic materials, engineering, and tableware. In industrial equipment, the company produces grinding wheels, diamond tools, and abrasive cloth paper, with manufacturing and sales handled by subsidiaries including Japan Regibon Co., Ltd. and Zenno Noritake Co., Ltd. The ceramic materials segment involves the production of electronic pastes, ceramic cores, fluorescent display tubes, and ceramic raw materials, supported by subsidiaries such as PT. Noritake Indonesia, Noritake Ise Co., Ltd., and Kyoritsu Materials Co., Ltd. The engineering segment focuses on industrial furnaces and static mixers, manufactured by Noritake TCF Co., Ltd. and Chen Hsing Co., Ltd. The tableware segment produces porcelain and ceramic tableware, with manufacturing support from Noritake Lanka Porcelain (Private) Limited. The group serves domestic and international markets, with overseas sales conducted through Noritake U.S.A., Inc. and other subsidiaries. Related company Kuraray Noritake Dental Co., Ltd. manufactures dental products, while Noritake no Mori Co., Ltd. provides service operations. Summarised from the annual report, fiscal year ended Mar 2026 |
Industry Specialty Chemicals | Homepage noritake.co.jp |
| Sector Basic Materials | IR page noritake.co.jp | |
|
Tags
industrial equipment, ceramic materials, engineering, tableware, grinding wheels, diamond tools, electronic pastes, ceramic cores, fluorescent display tubes, industrial furnaces, static mixers, dental products, Japan Regibon Co. Ltd., Zenno Noritake Co. Ltd., Noritake U.S.A. Inc., PT. Noritake Indonesia, Noritake Ise Co. Ltd., Kyoritsu Materials Co. Ltd., Kuraray Noritake Dental Co. Ltd., Noritake TCF Co. Ltd., Chen Hsing Co. Ltd., Noritake Machine Techno Co. Ltd., Noritake Lanka Porcelain (Private) Limited, Noritake no Mori Co. Ltd.
|
Press page noritake.co.jp/news |
Metrics
| Valuation | |
|---|---|
| Market cap | ¥ 203.188B |
| Market cap (USD) | $ 1.27B |
| P/E | 17.61 |
| PEG | 1.44 |
| P/BV | 1.15 |
| P/S | 1.32 |
| P/OCF | 12.98 |
| P/FCF | — |
| Dividend yield | 5.0% |
| Turnover / mcap | — |
| Returns | |
|---|---|
| ROE | 8.9% |
| ROI | 7.8% |
| ROIC | 4.5% |
| Profit margin | 9.9% |
| Growth | |
|---|---|
| Revenue growing | Yes |
| Profits growing | Yes |
| Revenue up 3y | No |
| Revenue up 5y | No |
| Earnings growth 3y (net profit CAGR) | 12.3% |
| Quality | |
|---|---|
| Profitable | Yes |
| Margin expanding | Yes |
| Buying back stock | No |
| Diluting (TTM) | — |
| Debt/Equity | — |
| Podcast bulls (TTM) | Sign up |
| Podcast bears (TTM) | Sign up |
| Podcast sentiment (TTM) | Sign up |
| Podcast sentiment % (TTM) | Sign up |
| News sentiment (TTM) | 3 |
| Quality score | 18.8% |
| Insiders | |
|---|---|
| Buys, 1w | Sign up |
| Buys, 1m | Sign up |
| Buys, 1y | Sign up |
| Sells, 1w | Sign up |
| Sells, 1m | Sign up |
| Sells, 1y | Sign up |
Sign up to see this company's insider trades
| Figure | FY 2026 | FY 2025 | FY 2024 | FY 2023 | FY 2022 | FY 2021 | FY 2020 | FY 2019 | FY 2018 | FY 2017 | FY 2016 | FY 2015 | FY 2014 | FY 2013 |
|---|---|---|---|---|---|---|---|---|---|---|---|---|---|---|
| Revenue | 142.908B | 138.182B | 137.912B | 139.494B | 127.641B | 107B | 120.611B | 125.802B | 117.928B | 108.808B | 109.631B | 99.038B | 88.687B | 90.235B |
| Net profit | 14.178B | 12.939B | 11.48B | 10.024B | 9.068B | 2.806B | 3.415B | 9.707B | 13.432B | 4.107B | 4.412B | 2.059B | 1.313B | 1.644B |
| Free cash flow | -4.072B | -4.795B | 16.723B | -5.571B | 8.014B | -527M | 1.114B | 2.908B | 5.335B | 5.746B | 1.4B | — | — | — |
| Figure | FY 2026 | FY 2025 | FY 2024 | FY 2023 | FY 2022 | FY 2021 | FY 2020 | FY 2019 | FY 2018 | FY 2017 | FY 2016 | FY 2015 | FY 2014 | FY 2013 |
|---|---|---|---|---|---|---|---|---|---|---|---|---|---|---|
| Share price | 3.108K | 3.503K | 4.283K | 4.583K | 4.454K | 3.546K | 3.439K | 5.285K | 4.607K | 2.857K | 2.548K | 282.05 | 260.83 | 230.32 |
| Price performance 12m | -0.11 | -0.18 | -0.07 | 0.03 | 0.26 | 0.03 | -0.35 | 0.15 | 0.61 | 0.12 | 8.03 | 0.08 | 0.13 | — |
Filed figures
Lines the statements and their notes report beside the headline figures, read from the filings' XBRL as filed (no restatement applied), with figures computed from one filing's own lines. Cash-flow lines carry their cash direction: an outflow is negative. Each period links to its filing; a figure's period, report date and tag are in its tooltip.
| Figure | Mar 2017 | Mar 2018 | Mar 2019 | Mar 2020 | Mar 2021 | Mar 2022 | Mar 2023 | Mar 2024 | Mar 2025 | Mar 2026 |
|---|---|---|---|---|---|---|---|---|---|---|
| Balance sheet detail | ||||||||||
| Trade receivables (JPY) | 30.4B | 34.8B | 35.5B | 31.3B | 30.7B | 62.6B | 77.7B | 66.9B | 62.8B | 69.4B |
| ↳ YoY growth | -1.5% | +14.5% | +2.1% | -11.7% | -1.9% | +103.8% | +24.0% | -13.8% | -6.2% | +10.6% |
| ↳ 5y CAGR | -0.1% | +15.6% | +17.4% | +13.5% | +14.9% | +17.7% | ||||
| Borrowings, current (JPY) | 10.1B | 12.8B | 3.8B | 4.19B | 6.99B | 6.5B | 12.5B | 2.61B | 6.09B | 13.2B |
| Borrowings, non-current (JPY) | 13B | 320M | 975M | 915M | 905M | — | — | — | — | — |
| Cash and deposits (JPY) | 11.3B | 18.5B | 14.1B | 12.6B | 12.3B | 14.2B | 14.6B | 21.3B | 16.6B | 19.6B |
| Intangible assets (JPY) | 1.07B | 1.11B | 1.19B | 1.18B | 1.42B | 1.59B | 1.93B | 1.94B | 2.33B | 2.68B |
| Net debt (borrowings + leases - cash) (JPY) | 11.9B | -5.37B | -9.3B | -7.48B | -4.37B | -7.67B | -2.15B | -18.7B | -10.5B | -6.42B |
| Cash flow detail | ||||||||||
| Operating cash flow (JPY) | 9.13B | 9.68B | 8.24B | 8.23B | 5.9B | 12.8B | -213M | 22B | 2.02B | 10B |
| Purchases of property, plant and equipment (JPY) | -3.38B | -4.35B | -5.33B | -7.12B | -6.43B | -4.82B | -5.36B | -5.31B | -6.81B | -14.1B |
| Change in receivables (cash effect) (JPY) | 326M | -4.33B | -200M | 4.16B | 508M | -2.62B | -7B | 5.34B | 2.1B | -2.88B |
| Change in inventories (cash effect) (JPY) | -692M | -1.28B | -3.02B | -1.03B | 2.02B | -2.61B | -5.9B | -5.44B | -191M | -796M |
| Change in payables (cash effect) (JPY) | 1.12B | 4.74B | 1.79B | -3.7B | -2.59B | 3.26B | 1.19B | 2.26B | -7.86B | -265M |
| Dividends paid (cash effect) (JPY) | -869M | -877M | -1.17B | -1.46B | -1.17B | -1.46B | -2.5B | -3.46B | -3.81B | -4.25B |
| Share buybacks (cash effect) (JPY) | -607M | -60M | -11M | -248M | -4M | -3M | -274M | -6M | -2.5B | -4.15B |
| Interest paid (cash effect) (JPY) | -75M | -59M | -41M | -20M | -26M | -25M | -26M | -20M | -32M | -132M |
| Income taxes paid (cash effect) (JPY) | -1.09B | -1.05B | -3.62B | -2.5B | -1.19B | -1.51B | -3.41B | -2.45B | -5.77B | -4.18B |
| Operating cash flow before change in receivables (JPY) | 8.8B | 14B | 8.44B | 4.07B | 5.4B | 15.5B | 6.79B | 16.7B | -86M | 12.9B |
| Free cash flow (OCF - PPE - intangibles) (JPY) | 5.75B | 5.34B | 2.91B | 1.11B | -527M | 8.01B | -5.57B | 16.7B | -4.8B | -4.07B |
| Income detail | ||||||||||
| Research and development expense (JPY) | 2.44B | 2.49B | 2.55B | 2.57B | 2.29B | 2.32B | 2.38B | 2.31B | 2.22B | 2.37B |
| ↳ 5y CAGR | -3.9% | -1.0% | -0.9% | -2.0% | -2.9% | +0.6% | ||||
| Total comprehensive income (JPY) | 8.29B | 16.9B | 5.51B | -1.17B | 11.4B | 8.81B | 12.2B | 22.3B | 9.17B | 25.2B |
| Comprehensive income to owners (JPY) | 8.06B | 16.6B | 5.3B | -1.4B | 11.4B | 8.73B | 12.1B | 22.2B | 9.14B | 25.1B |
| Provision for credit losses (JPY) | 10M | 0.00 | 15M | 33M | -1M | 90M | 98M | -164M | 10M | -16M |
| Credit cost ratio (credit losses / average receivables) (%) | 0.0% | 0.0% | 0.0% | 0.1% | 0.0% | 0.2% | 0.1% | 0.2% | 0.0% | 0.0% |
| Reported | Jun 29, 2017 | Jun 26, 2018 | Jun 25, 2019 | Jun 26, 2020 | Jun 25, 2021 | Jun 28, 2022 | Jun 23, 2023 | Jun 24, 2024 | Jun 23, 2025 | Jun 22, 2026 |
Sign up to see institutional holdings
Sign UpPodcast Mentions
Sign up to see podcast mentions and sentiment
Sign UpTimely disclosures published on TDnet, newest first, titles as filed in Japanese. The link opens the disclosure on TDnet. Filings with EDINET (periodic reports, extraordinary reports, offerings, holding and buy-back reports), newest first, titles as filed in Japanese. The link opens the filing on EDINET. Press releases from the company's own website, newest first.
NEWS
ニュース
2026年11月6日
ノリタケ株式会社
イオンモール Nagoya Noritake Garden
ノリタケの森×イオンモール Nagoya Noritake Garden共同イベント
「Christmas Memories」 開催のお知らせ
11月7日(土)~12月25日(金)
ノリタケの森とイオンモール Nagoya Noritake Gardenは、2026年11月7日(土)から12月25日(金)まで、クリスマスイベント「Christmas Memories」を共同で開催します。
本イベントは、地域の賑わいの創出を目的として開催しているもので、今回で5回目を迎えます。ノリタケの森の開業25周年とイオンモール Nagoya Noritake Gardenの開業5周年という節目となる今年は、来場者に笑顔と思い出が生まれる空間をこれからも提供していきたいとの思いを込め、「想いを結び、未来へつなぐクリスマス」をテーマに開催します。会場には、「想いを結ぶ」を表現するリボンをモチーフにした装飾を施し、来場者の思い出や地域の皆さまとのつながりを表します。

※画像はイメージです。
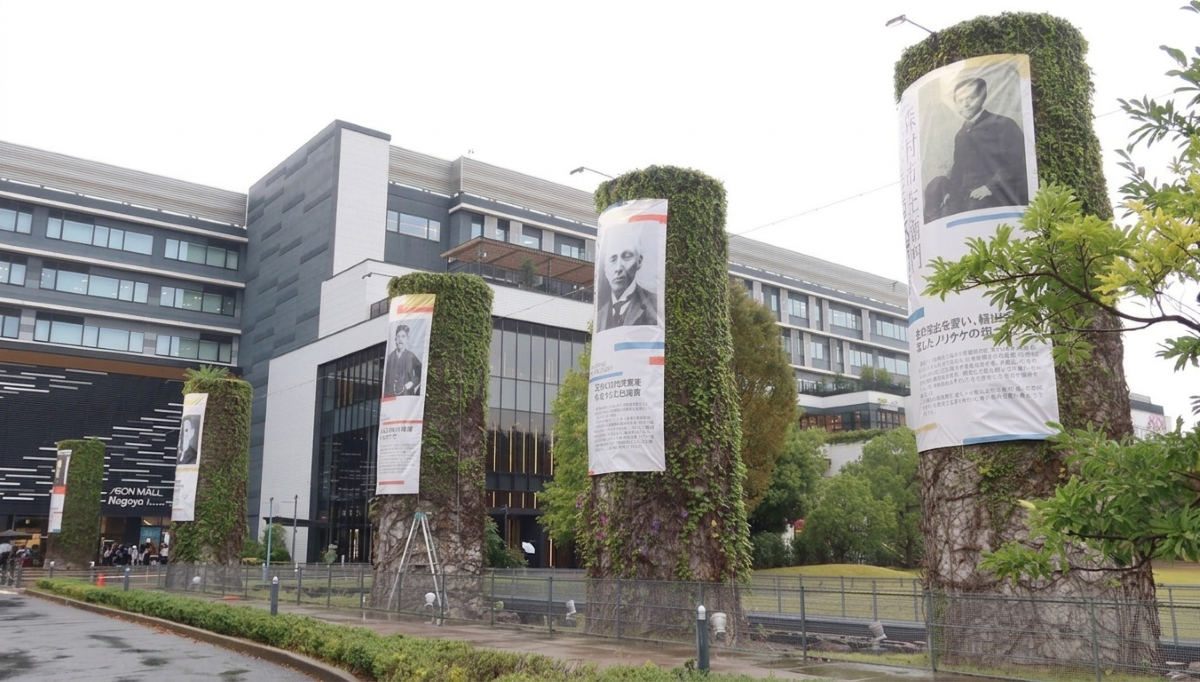
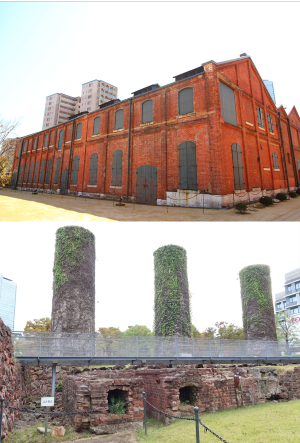
今回は新たに、せせらぎ沿いのメタセコイヤの木を、クリスマスツリーに見立てて装飾します。日没後はイルミネーションが灯り、足元にはサンタクロースの映像も映し出されます。さらに、メタセコイヤへと続く通路にもツリー型のライトを設置し、幻想的な空間を演出します。
また、赤レンガ棟北側ひろばには、高さ約4メートルのクリスマスツリーをはじめ、サンタクロースやリボンをあしらったクリスマスハウス、アーチトンネルなどが登場。噴水ひろば周辺には、ソリやリースのフォトスポットを設置し、夜間のイルミネーションだけでなく、昼間からクリスマスの雰囲気を楽しめるのも、大きな魅力です。
ぜひ、ご家族やご友人同士でご来場ください。
ノリタケの森×イオンモール Nagoya Noritake garden
「Christmas Memories」開催概要
-

※画像はイメージです。
-
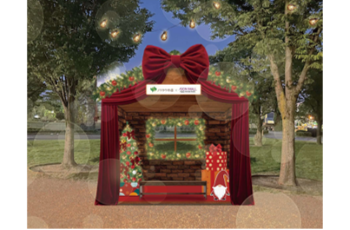
※画像はイメージです。
・開催日:11月7日(土)~12月25日(金) ※荒天時は臨時休園する場合がございます
・開催時間:9:00~21:00 ※イルミネーション点灯時間 16:30~21:00 (球数:約3万球)
・開催場所:ノリタケの森 屋外
・入園料:無料
イベントに関するお問い合わせ先
ノリタケの森 TEL:052-561-7142
このページを印刷する
PICKUP
ピックアップ



サイトマップ

© 2026 NORITAKE CO., LIMITED




Prompts
Click prompts to add them under the company line, click again to take one out, then copy the result into your AI chat. Shared by Asian Century Stocks and Uncovered Thai Stocks. Thank you.
ETFs Holding Noritake Co., Limited
Exchange-traded funds whose newest published daily portfolio holds one of the company's listings, largest weight first.
| ETF | Weight in ETF | Shares | Market value | As of |
|---|---|---|---|---|
| DISV | 0.05% | 129,000 | $ 2.461M | Nov 12, 2026 |
| AVDS | 0.03% | 6,100 | $ 111.006K | Nov 16, 2026 |
| DFIS | 0.02% | 56,600 | $ 1.08M | Nov 12, 2026 |
| DXIV | 0.01% | 1,300 | $ 24.797K | Nov 12, 2026 |
| DFIC | 0.01% | 55,400 | $ 1.057M | Nov 12, 2026 |
| DFAX | 0.01% | 33,800 | $ 644.715K | Nov 12, 2026 |
| DFSI | 0.00% | 2,500 | $ 47.686K | Nov 12, 2026 |
| DFAI | 0.00% | 25,600 | $ 488.305K | Nov 12, 2026 |
| AVDE | 0.00% | 45,600 | $ 829.817K | Nov 16, 2026 |