訂正発行登録書
Bull 0
Bear 0
Routine
5201
|
AGC Inc. is a diversified materials and technology company operating across five primary business segments. Its Building Glass segment produces architectural flat glass and processed glass, including insulated, tempered, and laminated varieties. The Automotive segment supplies automotive glass and cover glass for vehicle displays. The Electronics & Display segment manufactures glass substrates for LCD and OLED displays, specialty display glass, semiconductor components, and optical parts. The Chemicals segment produces essential chemicals such as caustic soda, vinyl chloride resin, and urethane raw materials, alongside performance chemicals including fluorine products and iodine compounds. The Life Science segment offers contract development and manufacturing services for synthetic pharmaceuticals, agrochemicals, and biopharmaceuticals, as well as intermediates and active pharmaceutical ingredients. The group also provides ceramics products, logistics, and financial services. Summarised from the annual report, fiscal year ended Dec 2025 |
Industry Specialty Chemicals | Homepage agc.com |
| Sector Basic Materials | IR page agc.com | |
|
Tags
building glass, automotive glass, display glass substrates, semiconductor materials, fluorine chemicals, caustic soda, vinyl chloride resin, pharmaceutical cdmo, agrochemicals, ceramics
|
Press page agc.com/ir/news/index.html |
Metrics
| Valuation | |
|---|---|
| Market cap | ¥ 1.222T |
| Market cap (USD) | $ 7.635B |
| P/E | 18.88 |
| PEG | — |
| P/BV | 0.72 |
| P/S | 0.55 |
| P/OCF | 4.45 |
| P/FCF | 18.81 |
| Dividend yield | 3.7% |
| Turnover / mcap | — |
| Returns | |
|---|---|
| ROE | 4.1% |
| ROI | 4.0% |
| ROIC | 4.7% |
| Profit margin | 3.4% |
| Growth | |
|---|---|
| Revenue growing | No |
| Profits growing | Yes |
| Revenue up 3y | No |
| Revenue up 5y | No |
| Earnings growth 3y (net profit CAGR) | — |
| Quality | |
|---|---|
| Profitable | Yes |
| Margin expanding | No |
| Buying back stock | No |
| Diluting (TTM) | No |
| Debt/Equity | — |
| Podcast bulls (TTM) | Sign up |
| Podcast bears (TTM) | Sign up |
| Podcast sentiment (TTM) | Sign up |
| Podcast sentiment % (TTM) | Sign up |
| News sentiment (TTM) | 22 |
| Quality score | -5.3% |
| Insiders | |
|---|---|
| Buys, 1w | Sign up |
| Buys, 1m | Sign up |
| Buys, 1y | Sign up |
| Sells, 1w | Sign up |
| Sells, 1m | Sign up |
| Sells, 1y | Sign up |
Sign up to see this company's insider trades
| Figure | FY 2025 | FY 2024 | FY 2023 | FY 2022 | FY 2021 | FY 2020 | FY 2019 | FY 2018 | FY 2017 | FY 2016 | FY 2015 | FY 2014 | FY 2013 | FY 2012 |
|---|---|---|---|---|---|---|---|---|---|---|---|---|---|---|
| Revenue | 2.059T | 2.068T | 2.019T | 2.036T | 1.697T | 1.412T | 1.518T | 1.523T | 1.464T | 1.283T | 1.326T | 1.348T | 1.32T | 1.19T |
| Net profit | 69.162B | -94.042B | 65.798B | -3.152B | 123.84B | 32.715B | 44.434B | 89.593B | 69.225B | 47.438B | 42.906B | 15.913B | 10.333B | 43.79B |
| Free cash flow | 64.931B | 42.456B | -985M | -6.775B | 116.141B | 33.923B | -6.022B | — | — | — | — | — | — | — |
| Figure | FY 2025 | FY 2024 | FY 2023 | FY 2022 | FY 2021 | FY 2020 | FY 2019 | FY 2018 | FY 2017 | FY 2016 | FY 2015 | FY 2014 | FY 2013 | FY 2012 |
|---|---|---|---|---|---|---|---|---|---|---|---|---|---|---|
| Share price | 5.193K | 5.235K | 5.235K | 4.394K | 5.49K | 3.6K | 3.93K | 3.431K | 4.879K | 795.95 | 696.03 | 589.08 | 654.01 | 626.08 |
| Price performance 12m | -0.01 | 0 | 0.19 | -0.2 | 0.53 | -0.08 | 0.15 | -0.3 | 5.13 | 0.14 | 0.18 | -0.1 | 0.04 | — |
Filed figures
Lines the statements and their notes report beside the headline figures, read from the filings' XBRL as filed (no restatement applied), with figures computed from one filing's own lines. Cash-flow lines carry their cash direction: an outflow is negative. Each period links to its filing; a figure's period, report date and tag are in its tooltip.
| Figure | Dec 2016 | Dec 2017 | Dec 2018 | Dec 2019 | Dec 2020 | Dec 2021 | Dec 2022 | Dec 2023 | Dec 2024 | Dec 2025 |
|---|---|---|---|---|---|---|---|---|---|---|
| Balance sheet detail | ||||||||||
| Trade receivables (JPY) | — | — | 260B | 264B | 266B | 295B | 316B | 339B | 332B | 324B |
| ↳ YoY growth | +1.5% | +0.8% | +10.9% | +7.0% | +7.3% | -1.9% | -2.4% | |||
| ↳ 5y CAGR | +5.4% | +4.7% | +4.0% | |||||||
| Cash and deposits (JPY) | 147B | 126B | 124B | 114B | 236B | 196B | 210B | 146B | 108B | 94.7B |
| Intangible assets (JPY) | — | — | 56.6B | 70B | 72.7B | 69.9B | 71.3B | 72.1B | 52.3B | 55.4B |
| Cash flow detail | ||||||||||
| Operating cash flow (JPY) | 204B | 204B | 189B | 192B | 225B | 327B | 217B | 213B | 285B | 274B |
| Purchases of property, plant and equipment (JPY) | — | — | -211B | -198B | -191B | -211B | -224B | -214B | -242B | -210B |
| Change in receivables (cash effect) (JPY) | — | — | -4.97B | -2.98B | -3.33B | -18.3B | -4.18B | -8.71B | 13.9B | 17.3B |
| Change in inventories (cash effect) (JPY) | — | — | -24.7B | -9.08B | 11.7B | -48.6B | -84.1B | -88M | 7.94B | 4.5B |
| Change in payables (cash effect) (JPY) | — | — | 2.75B | -4.52B | -605M | 36.2B | 2.86B | -19.2B | -12.4B | 210M |
| Dividends paid (cash effect) (JPY) | — | — | -24.9B | -26.6B | -26.6B | -31B | -52.2B | -46B | -44.6B | -44.6B |
| Share buybacks (cash effect) (JPY) | — | — | -21.5B | -15M | -13M | -586M | -342M | -50B | -1.26B | -15M |
| Interest paid (cash effect) (JPY) | — | — | -9.07B | -13.1B | -7.79B | -6.57B | -8.54B | -17.7B | -16.9B | -14.6B |
| Operating cash flow before change in receivables (JPY) | — | — | 194B | 195B | 229B | 345B | 221B | 221B | 271B | 257B |
| Free cash flow (OCF - PPE - intangibles) (JPY) | — | — | -22.1B | -6.02B | 33.9B | 116B | -6.78B | -985M | 42.5B | 64.9B |
| Income detail | ||||||||||
| Research and development expense (JPY) | — | — | — | 47.5B | 46.4B | 49.4B | 52.3B | 57.3B | 61.8B | 60.3B |
| ↳ 5y CAGR | +5.4% | +5.4% | ||||||||
| Total comprehensive income (JPY) | — | — | 15.9B | 60.5B | -3.31B | 275B | 160B | 182B | 70.9B | 108B |
| Comprehensive income to owners (JPY) | 21.5B | 135B | 6.63B | 48.2B | -6.43B | 231B | 116B | 152B | 34.2B | 93.6B |
| Segments | ||||||||||
| Automotive · Segment operating income (JPY) | — | — | — | — | — | — | -9.82B | 21.8B | 13.9B | 29.3B |
| Glass · Segment operating income (JPY) | — | — | — | — | — | — | 32.7B | 32.8B | 16.4B | 17.3B |
| Lifescience · Segment operating income (JPY) | — | — | — | — | — | — | 16.9B | -12.4B | -21.2B | -22.3B |
| Reported | Mar 30, 2017 | Mar 29, 2018 | Mar 27, 2020 | Mar 27, 2020 | Mar 30, 2021 | Mar 30, 2022 | Mar 28, 2024 | Mar 28, 2024 | Mar 28, 2025 | Mar 24, 2026 |
Sign up to see institutional holdings
Sign UpPodcast Mentions
Sign up to see podcast mentions and sentiment
Sign UpTimely disclosures published on TDnet, newest first, titles as filed in Japanese. The link opens the disclosure on TDnet. Filings with EDINET (periodic reports, extraordinary reports, offerings, holding and buy-back reports), newest first, titles as filed in Japanese. The link opens the filing on EDINET. Press releases from the company's own website, newest first.
臨時報告書(第19条第2項第9号)
Bull 0
Bear 0
Routine
Subject:
Bull 1
Bear 0
Product/operations
News Release
2026 年 11 月 6 日
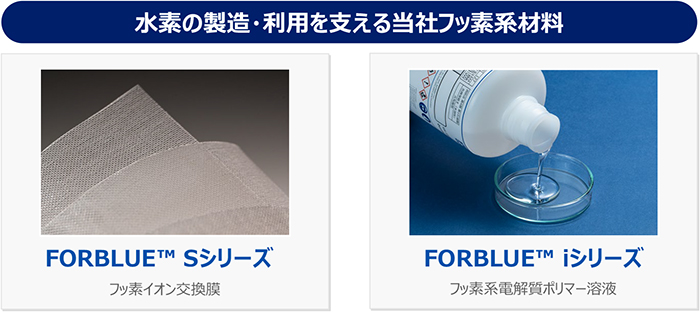
AGC、COP31 ジャパン・パビリオンに 水素社会を支える材料とフッ素資源循環の取り組みを出展 AGC(AGC 株式会社、本社︓東京、社長︓平井良典)は、2026 年 11 月 9 日~20 日にトルコ共和国アンタル ヤで開催される、国連気候変動枠組条約第 31 回締約国会議(COP31)において、環境省が主催するジャパン・パ ビリオンに、水素の製造・利用を支えるフッ素系材料「FORBLUE™ S シリーズ」「FORBLUE™ i シリーズ」と、フッ素資 源の循環に向けた取り組みを展示します。
水素社会を支える材料
水素はCO2 の排出削減に貢献する次世代エネルギーとして期待されており、その普及には製造から輸送・貯蔵、利 用に至るサプライチェーンの構築が不可欠とされています。世界各国で水素活用に向けた検討が進む中、当社グループ は水素を「つくる」「つかう」を材料の面から支えています。 当社は水素を「つくる」分野において、フッ素系イオン交換膜「FORBLUE™ Sシリーズ」とフッ素系電解質ポリマー溶液 「FORBLUE™ iシリーズ」を提供しています。「FORBLUE™ Sシリーズ」は、水素を製造する水電解装置の膜材料であ り、世界トップレベルの電圧性能とバリア性能を有することが特徴です。こうした性能により、電圧性能は水素製造時の 消費電力低減に、バリア性能は水電解装置の安全運転に貢献します。2017 年より試験販売を行っています。 また、「FORBLUE™ iシリーズ」は、トヨタ自動車本社工場の水素パーク内に設置された 5MW級PEM型水電解装 置の実証機で電極材料として採用されており、現在、実用性の確認が進められています。 水素を「つかう」分野では、フッ素系電解質ポリマー溶液「FORBLUE™ iシリーズ」が、水素を電気エネルギーに変換し て走行する燃料電池車の電極材料として、トヨタ自動車の「第 2 世代MIRAI」に採用されています。
【本件に関するお問い合わせ先】 AGC 株式会社広報・IR 部
お問い合わせフォーム
News Release
フッ素資源循環の取り組み
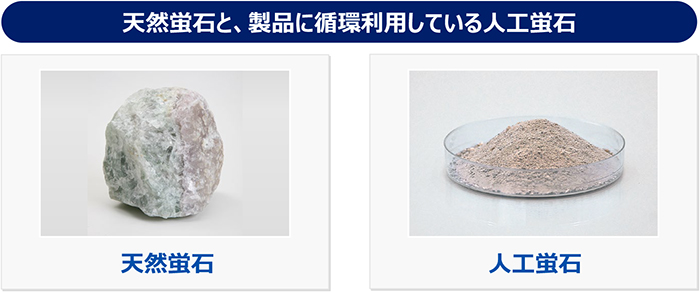
当社は、フッ素化学製品の出発原料であるフッ素資源の循環利用にも取り組んでいます。自社工場から発生する廃 棄物に含まれるフッ素を回収・再資源化するとともに、半導体産業などで生じるフッ素を再資源化した人工蛍石を調達 し、フッ素化学製品の原料として活用しています。さらに、使用済みとなったFORBLUE™製品の回収・リサイクルに向け た検討も進めています。 AGCグループは、中期経営計画 AGC plus-2026 のもと、「サステナビリティ経営の深化」を主要戦略の一つに掲 げています。COP31 ジャパン・パビリオンでの展示機会を通じて、水素社会を支える当社製品と、その原料となるフッ素 資源の循環に向けた取り組みを発信し、持続可能な社会の実現に向け貢献していきます。 <ご参考>
COP31 JAPAN PAVILION公式サイト︓https://www.copjapan.go.jp/cop31/
フッ素資源循環に関する特設ページ︓ https://www.agc-chemicals.com/jp/ja/company/vision/innovationstory/vol02/index.html
【本件に関するお問い合わせ先】 AGC 株式会社広報・IR 部
お問い合わせフォーム


 ](
 ](


 |
 |
 |
 |
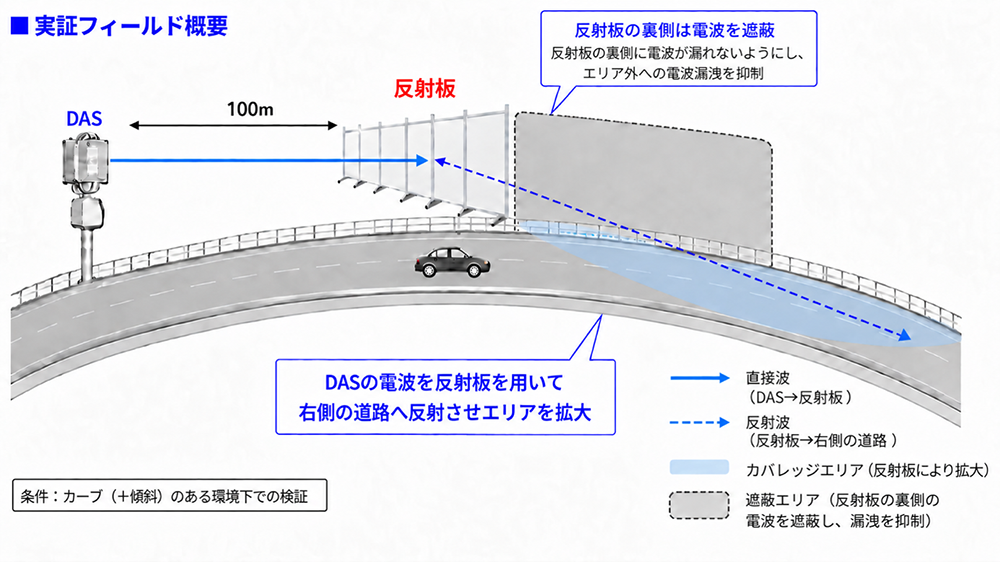 実証フィールドの概要
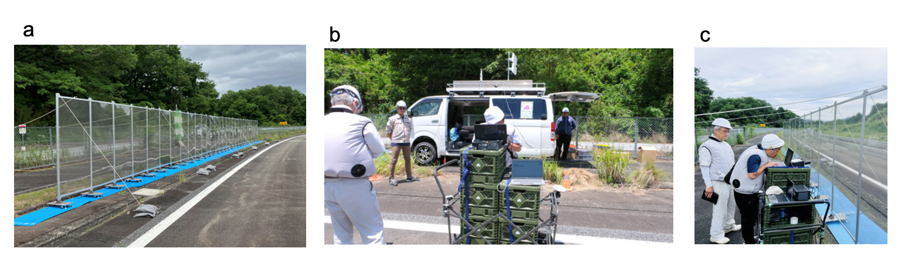 高速道路におけるDASおよび電波反射板を用いた実証実験の様子
Prompts
Click prompts to add them under the company line, click again to take one out, then copy the result into your AI chat. Shared by Asian Century Stocks and Uncovered Thai Stocks. Thank you.
AGC Inc. (ticker 5201), listed in Japan.
Copied
ETFs Holding AGC Inc.
Exchange-traded funds whose newest published daily portfolio holds one of the company's listings, largest weight first.
| ETF | Weight in ETF | Shares | Market value | As of |
|---|---|---|---|---|
| AIVI | 0.71% | 9,700 | $ 415.693K | Jun 30, 2026 |
| DWMF | 0.29% | 2,300 | $ 98.566K | Jun 30, 2026 |
| DFIV | 0.15% | 1,076,831 | $ 34.332M | Nov 12, 2026 |
| AVIV | 0.12% | 84,700 | $ 2.561M | Nov 16, 2026 |
| AVDE | 0.07% | 422,300 | $ 12.769M | Nov 16, 2026 |
| DFAI | 0.03% | 166,569 | $ 5.311M | Nov 12, 2026 |
| DFIC | 0.02% | 104,900 | $ 3.344M | Nov 12, 2026 |
| DFAX | 0.02% | 68,300 | $ 2.178M | Nov 12, 2026 |
| DXIV | 0.02% | 1,300 | $ 41.447K | Nov 12, 2026 |