|
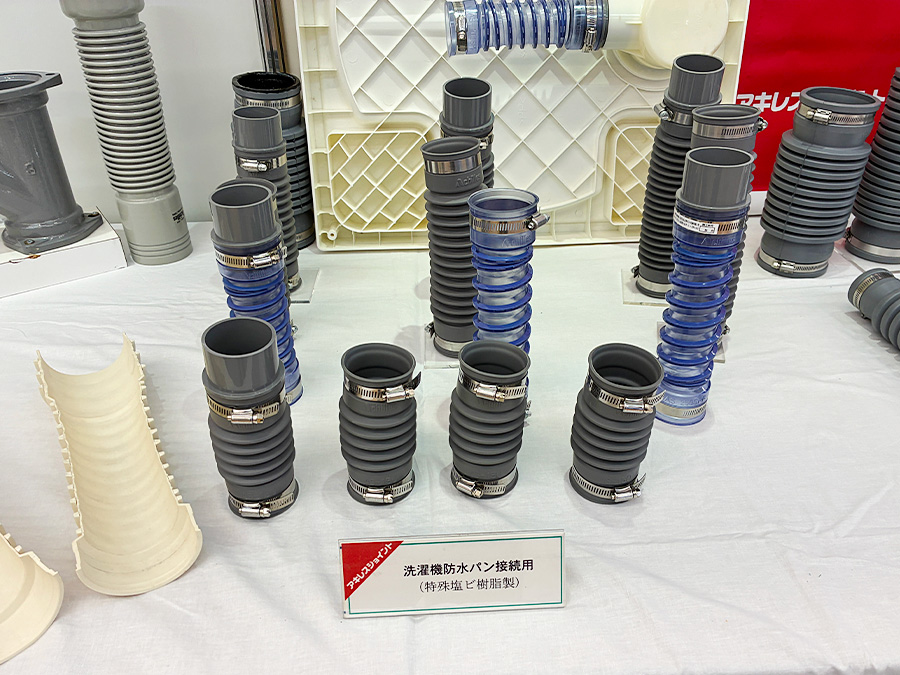
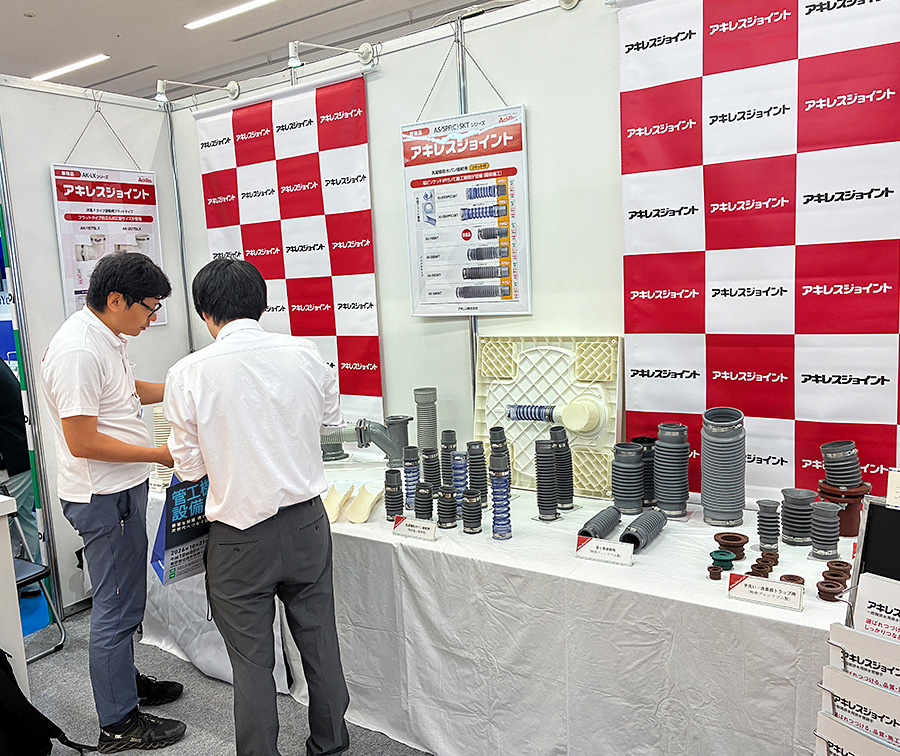
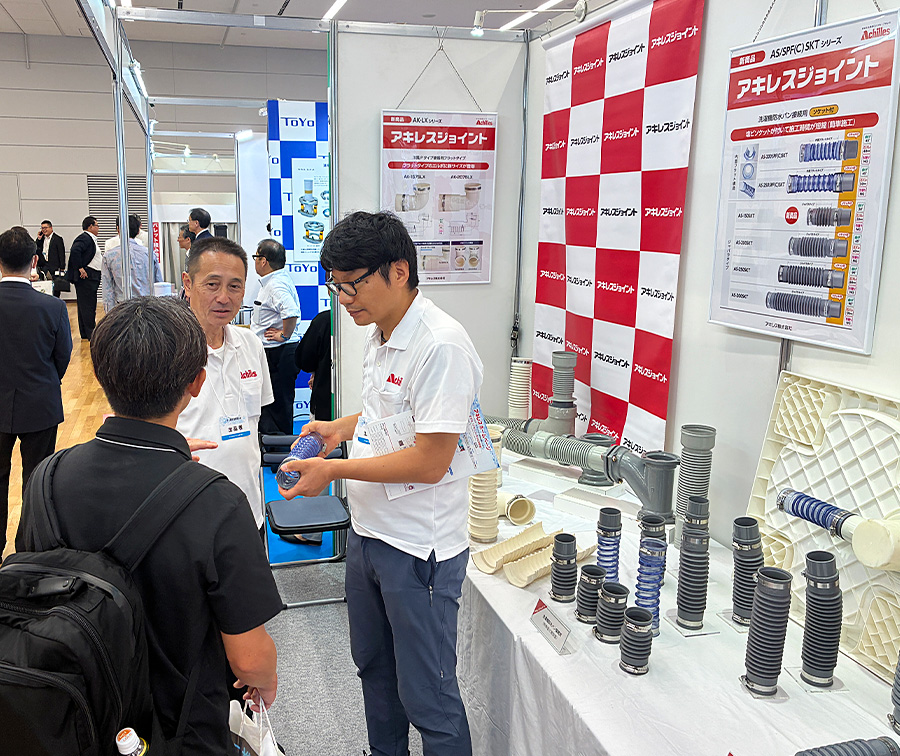
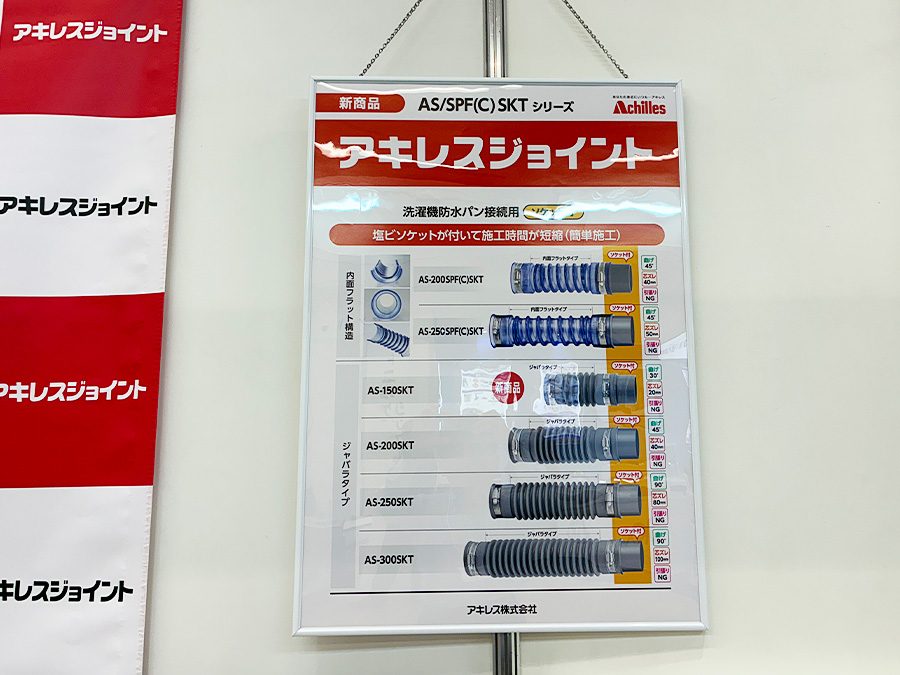
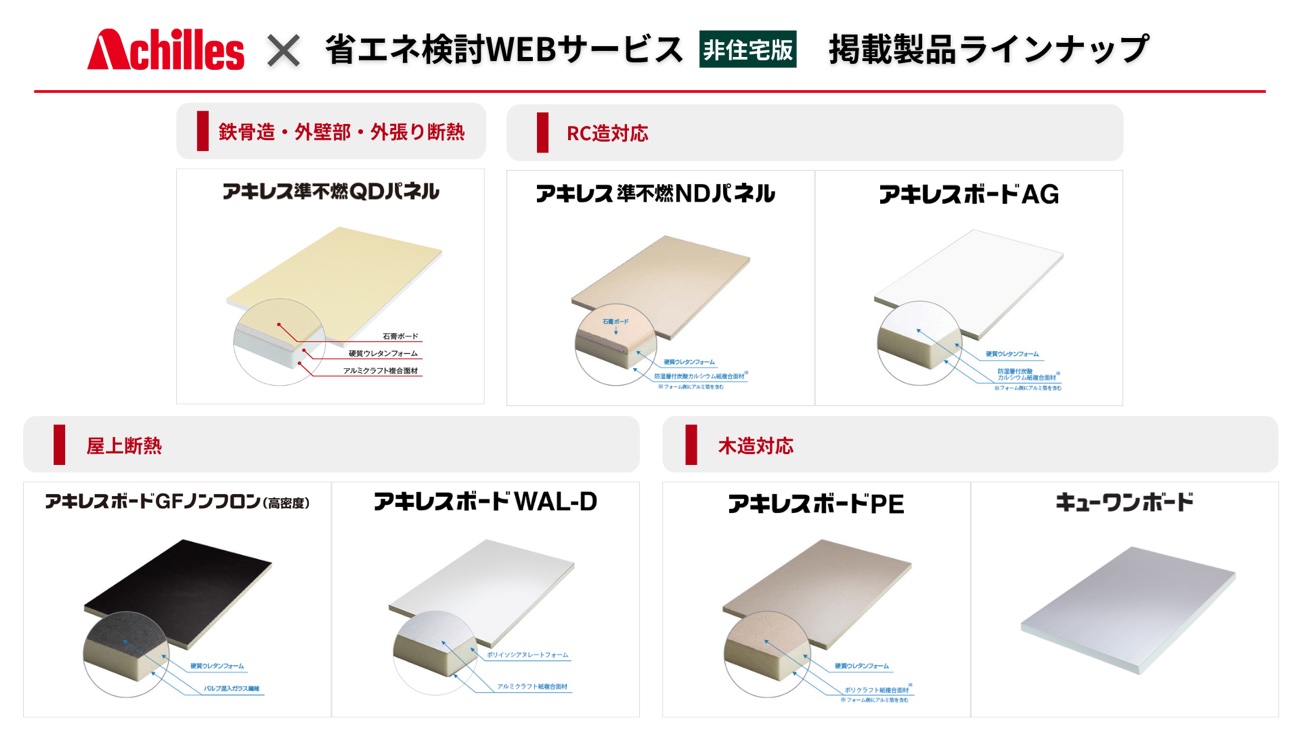
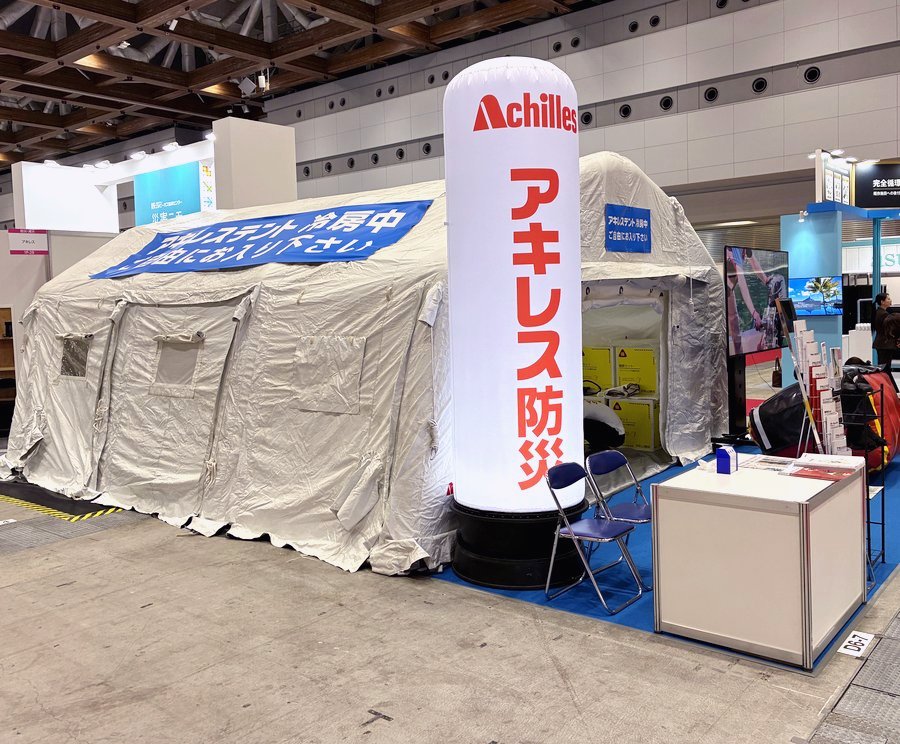
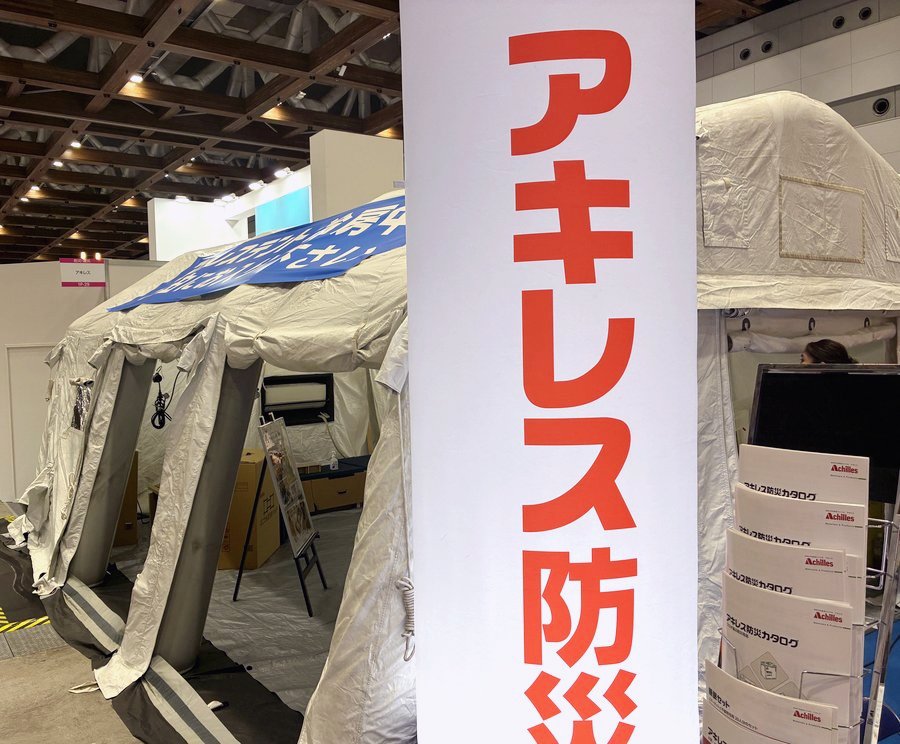
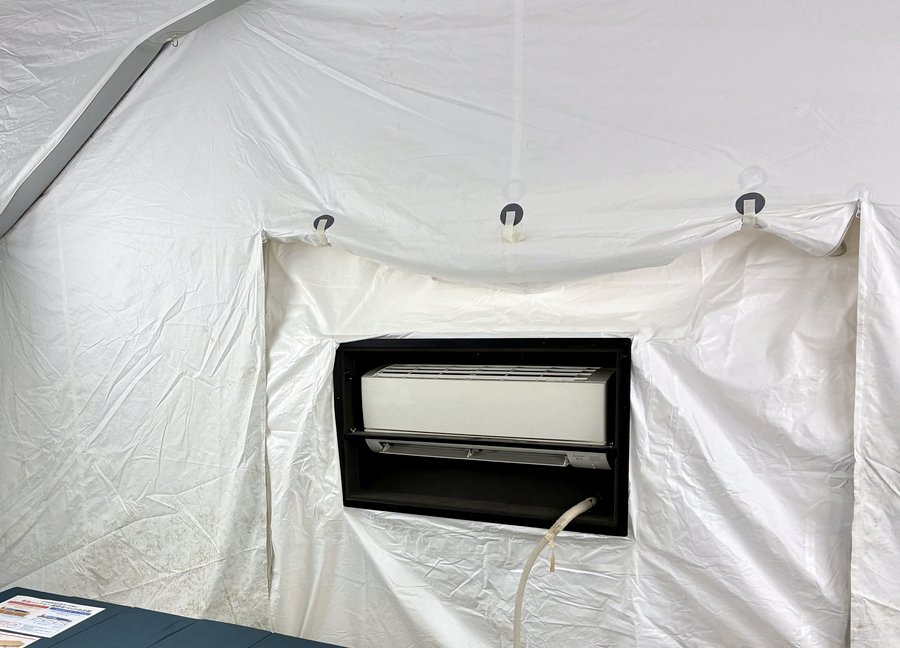
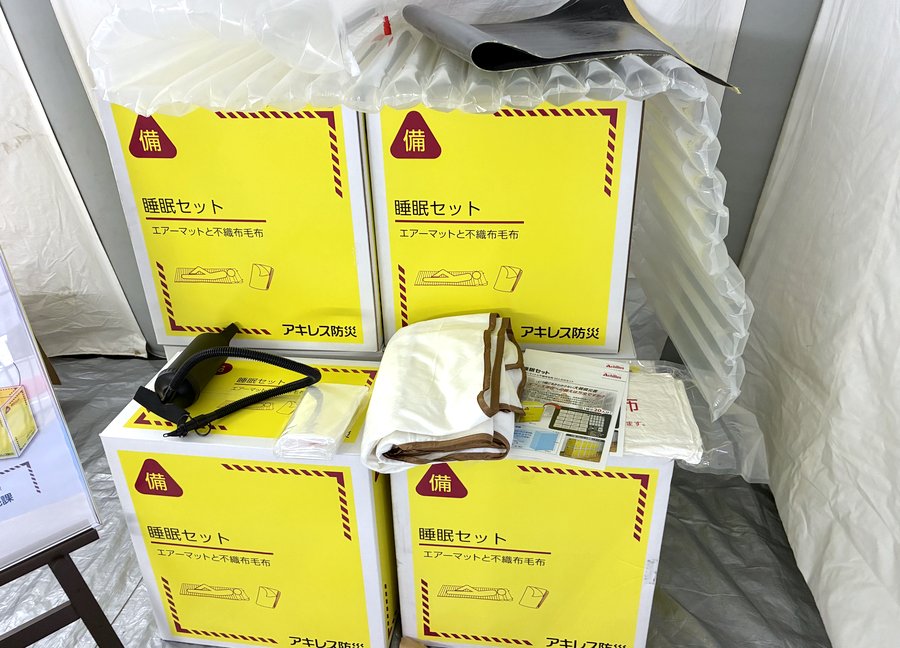
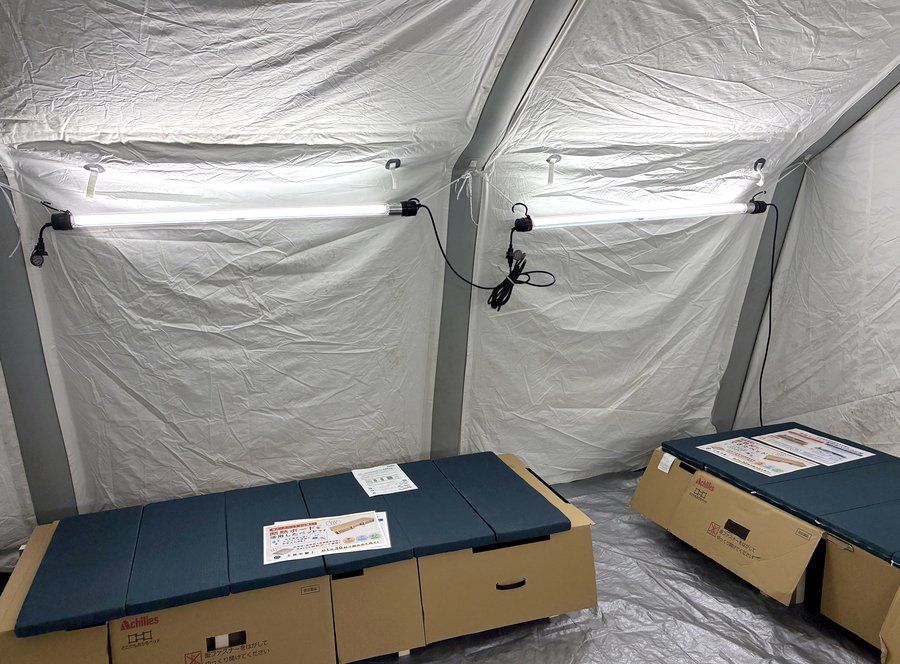
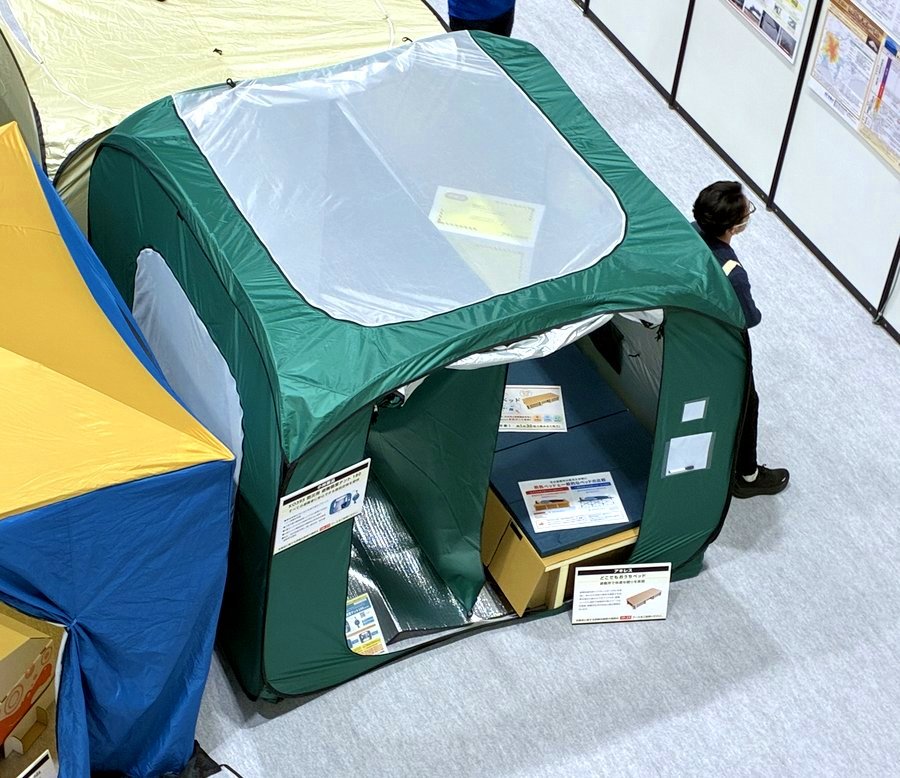
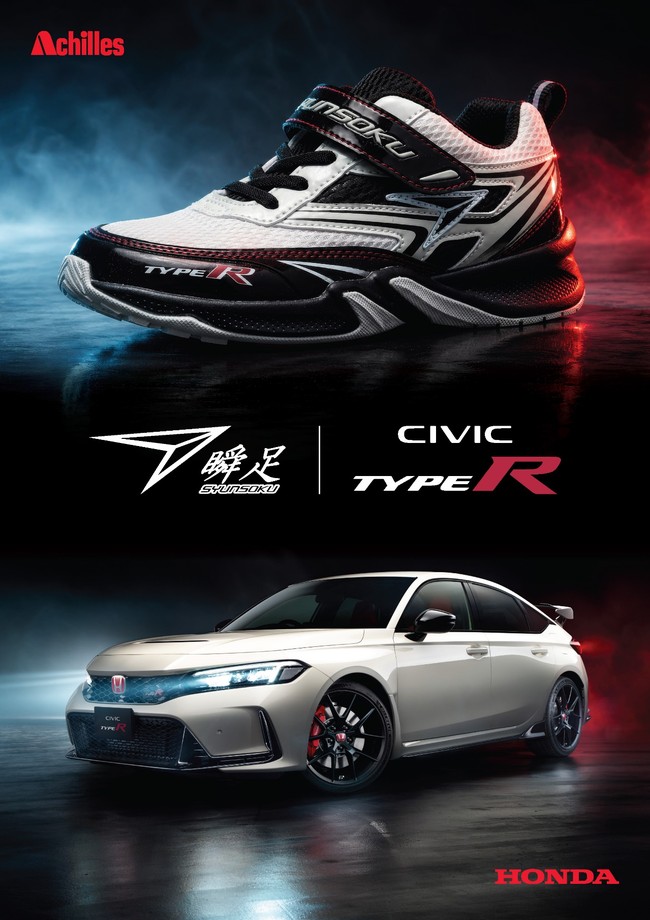
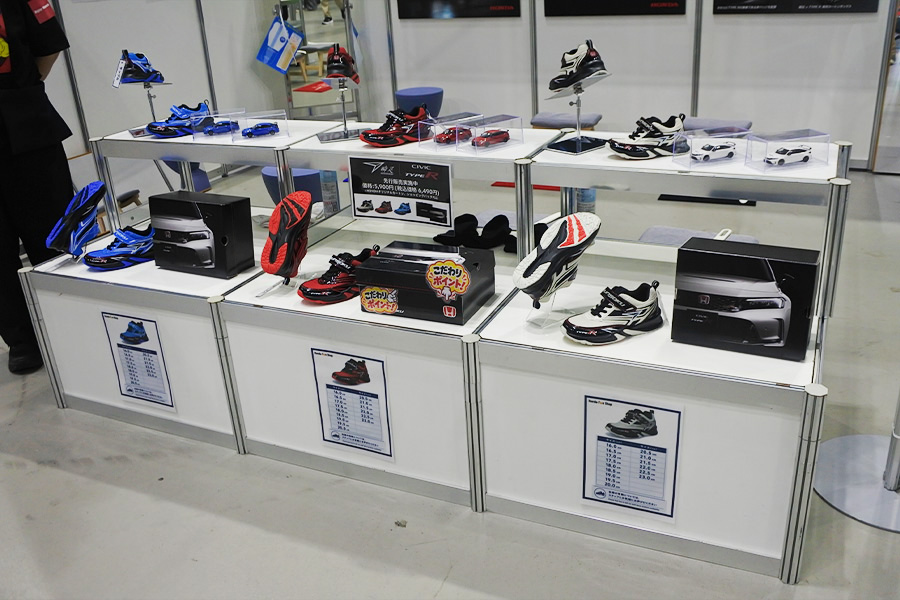
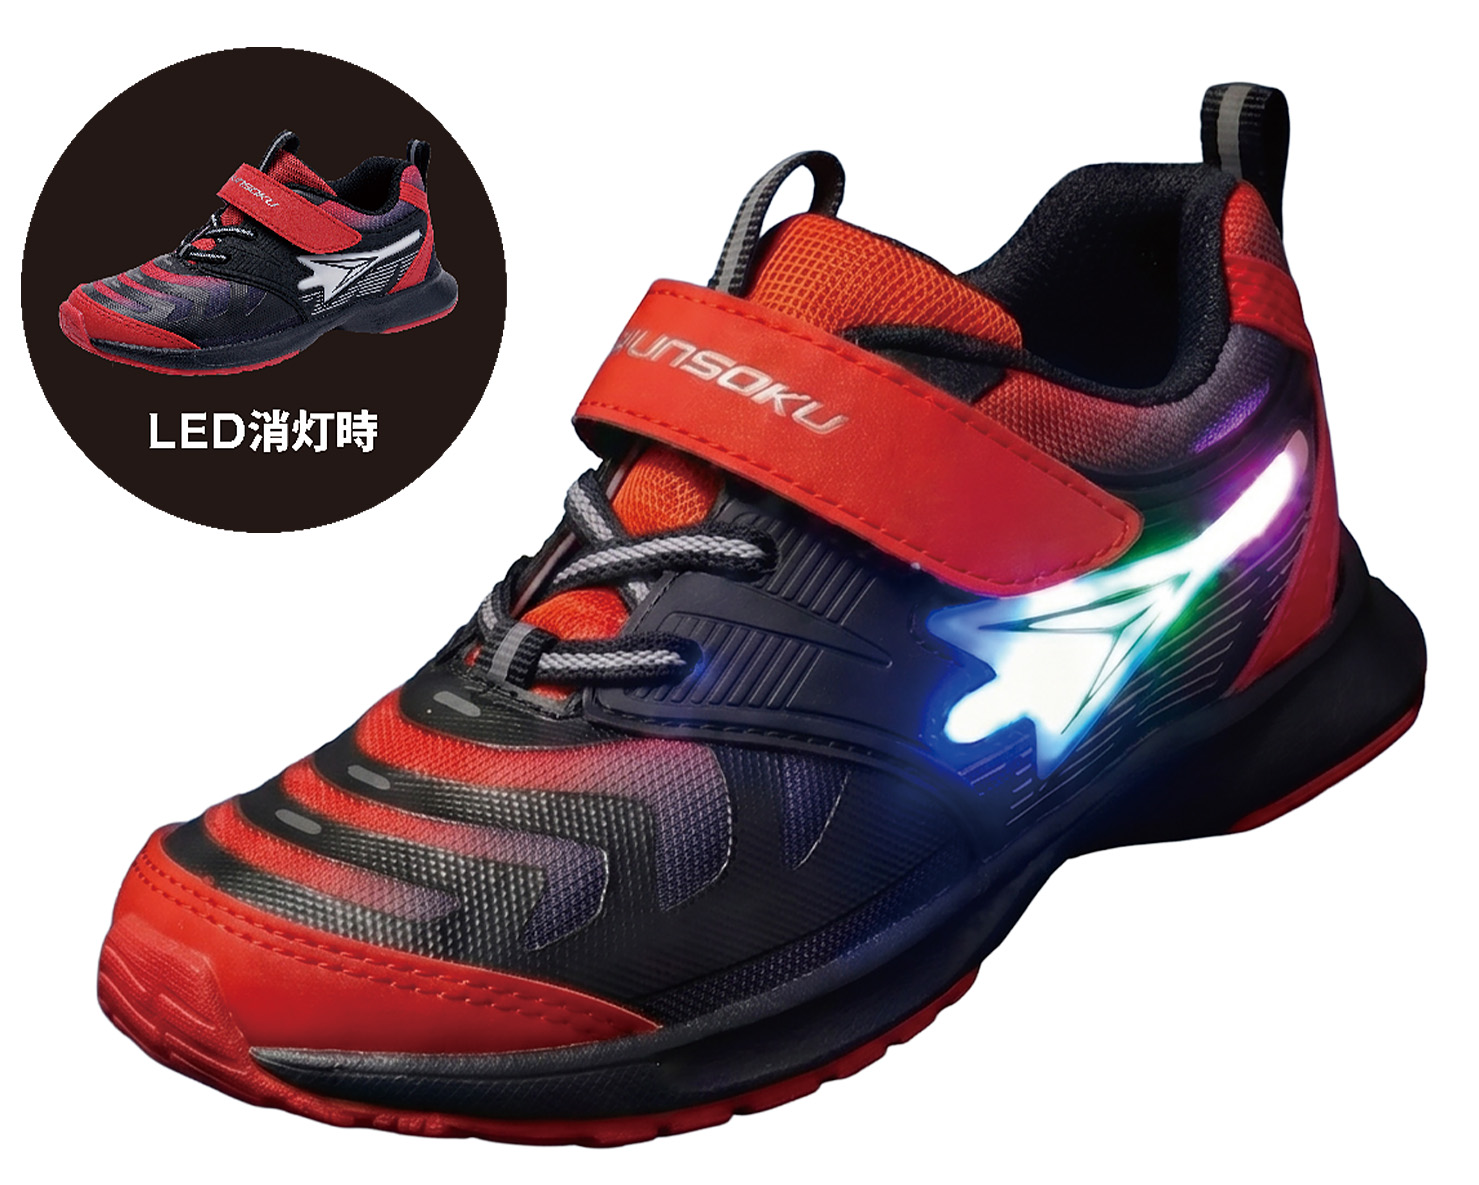
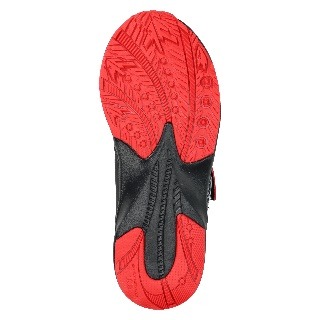
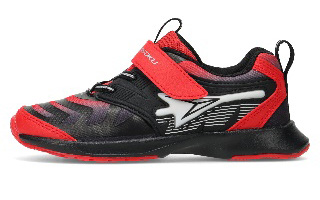
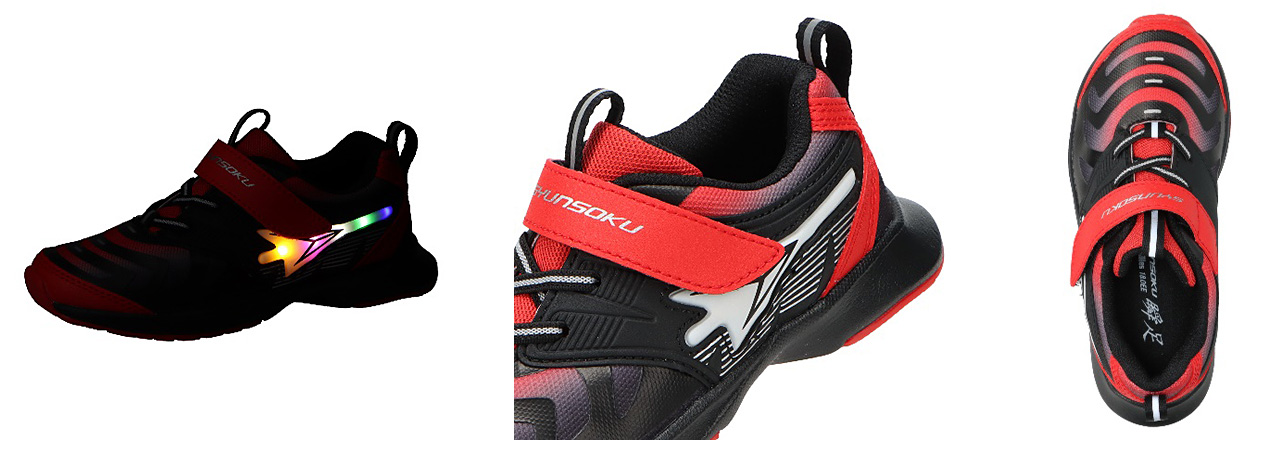
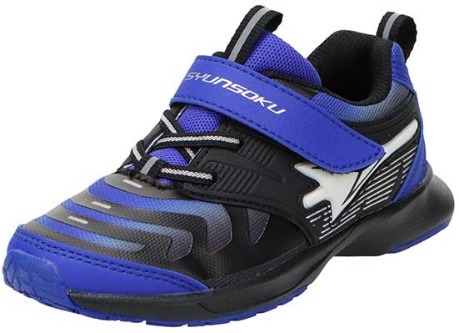
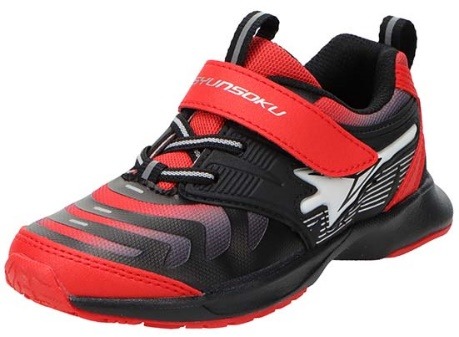
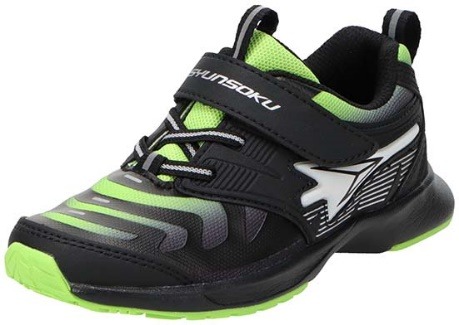
Achilles Corporation is a Japanese manufacturer specializing in plastic processing, footwear, and industrial materials. The company operates through three main segments: the First Business Division, which produces automotive interior materials, synthetic leather, films, urethane products, and industrial materials for electronics, mobility, and medical sectors; the Second Business Division, which supplies insulation materials, construction supplies, and disaster prevention products; and the Shoes Business Unit, which manufactures footwear. Key products include the Shunpuku children's shoe line, the Solvo leather shoe brand, and the Freabell mattress. The company serves customers in the automotive, construction, electronics, and consumer goods markets, with operations in Japan, China, the United States, and Latin America. Notable subsidiaries include Achilles Coretech, Achilles Vinestar, and Achilles Retail. The company traces its origins to 1907, evolving from a textile manufacturer into a chemical and plastic products producer, and was formally established as Kokka Chemical Industry Co., Ltd. in 1947. Achilles Corporation maintains a partnership with Tohatsu America for business collaboration. Summarised from the annual report, fiscal year ended Mar 2026 |
Industry Specialty Chemicals | Homepage achilles.jp |
| Sector Basic Materials | IR page achilles.jp/ir | |
|
Tags
plastic processing, synthetic leather, functional films, automotive materials, insulation materials, disaster prevention, footwear, urethane, industrial materials, medical materials, Achilles Coretech, Achilles Vinestar, Kanto Achilles Airron, Osaka Achilles Airron, Sansen Kousan, Achilles Welder, ACHILLES USA INC., Eishin Technology Co. Ltd., Achilles (Shanghai) International Trading Co. Ltd., Achilles Advanced Technology Co. Ltd., Achilles (Foshan) New Materials Co. Ltd., Kunshan Achilles New Materials Technology Co. Ltd., Tohoku Achilles, Achilles Retail, ACHILLES HONG KONG CO. LTD., ACHILLES KOHKOKU LATIN AMERICA S.A. DE C.V., Shunpuku, Solvo, Freabell, Kabe Stry II
|
Press page achilles.jp/news |
Metrics
| Valuation | |
|---|---|
| Market cap | ¥ 27.451B |
| Market cap (USD) | $ 172M |
| P/E | 7.33 |
| PEG | — |
| P/BV | 0.60 |
| P/S | 0.32 |
| P/OCF | 7.58 |
| P/FCF | 35.37 |
| Dividend yield | 2.1% |
| Turnover / mcap | — |
| Returns | |
|---|---|
| ROE | 5.1% |
| ROI | 3.5% |
| ROIC | 3.5% |
| Profit margin | 2.6% |
| Growth | |
|---|---|
| Revenue growing | Yes |
| Profits growing | Yes |
| Revenue up 3y | No |
| Revenue up 5y | No |
| Earnings growth 3y (net profit CAGR) | — |
| Quality | |
|---|---|
| Profitable | Yes |
| Margin expanding | Yes |
| Buying back stock | Yes |
| Diluting (TTM) | No |
| Debt/Equity | — |
| Podcast bulls (TTM) | Sign up |
| Podcast bears (TTM) | Sign up |
| Podcast sentiment (TTM) | Sign up |
| Podcast sentiment % (TTM) | Sign up |
| News sentiment (TTM) | 10 |
| Quality score | 0% |
| Insiders | |
|---|---|
| Buys, 1w | Sign up |
| Buys, 1m | Sign up |
| Buys, 1y | Sign up |
| Sells, 1w | Sign up |
| Sells, 1m | Sign up |
| Sells, 1y | Sign up |
Sign up to see this company's insider trades
| Figure | FY 2026 | FY 2025 | FY 2024 | FY 2023 | FY 2022 | FY 2021 | FY 2020 | FY 2019 | FY 2018 | FY 2017 | FY 2016 | FY 2015 | FY 2014 | FY 2013 |
|---|---|---|---|---|---|---|---|---|---|---|---|---|---|---|
| Revenue | 81.802B | 79.093B | 78.607B | 82.917B | 75.953B | 73.617B | 80.225B | 85.705B | 87.91B | 86.937B | 88.344B | 89.056B | 88.006B | 81.598B |
| Net profit | 2.116B | 427M | -8.21B | -1.204B | 1.525B | 3.215B | 1.895B | 338M | 2.284B | 1.974B | 2.543B | 1.287B | 1.734B | 1.423B |
| Free cash flow | -238M | -1.107B | -2.371B | -5.91B | -1.406B | -733M | 2.86B | -1.001B | 408M | 3.185B | -233M | — | — | — |
| Figure | FY 2026 | FY 2025 | FY 2024 | FY 2023 | FY 2022 | FY 2021 | FY 2020 | FY 2019 | FY 2018 | FY 2017 | FY 2016 | FY 2015 | FY 2014 | FY 2013 |
|---|---|---|---|---|---|---|---|---|---|---|---|---|---|---|
| Share price | 1.316K | 1.413K | — | 1.265K | 1.265K | 1.48K | 1.757K | 1.909K | 2.183K | 1.681K | 1.437K | 150.34 | 142.92 | 136.22 |
| Price performance 12m | -0.07 | — | — | 0 | -0.15 | -0.16 | -0.08 | -0.13 | 0.3 | 0.17 | 8.56 | 0.05 | 0.05 | — |
Filed figures
Lines the statements and their notes report beside the headline figures, read from the filings' XBRL as filed (no restatement applied), with figures computed from one filing's own lines. Cash-flow lines carry their cash direction: an outflow is negative. Each period links to its filing; a figure's period, report date and tag are in its tooltip.
| Figure | Mar 2017 | Mar 2018 | Mar 2019 | Mar 2020 | Mar 2021 | Mar 2022 | Mar 2023 | Mar 2024 | Mar 2025 | Mar 2026 |
|---|---|---|---|---|---|---|---|---|---|---|
| Balance sheet detail | ||||||||||
| Trade receivables (JPY) | 27.8B | 26.8B | 26.2B | 22.1B | 22.1B | 21.9B | 23.7B | 22.4B | 21.7B | 21.7B |
| ↳ YoY growth | -0.7% | -3.3% | -2.5% | -15.6% | +0.3% | -1.0% | +8.2% | -5.5% | -3.2% | +0.1% |
| ↳ 5y CAGR | -4.6% | -4.6% | -2.5% | -3.0% | -0.3% | -0.4% | ||||
| Borrowings, current (JPY) | 2.23B | 2.23B | 2.23B | 5.22B | 2.65B | 2.2B | 3.6B | 4.4B | 10.2B | 6.9B |
| Borrowings, non-current (JPY) | 3B | 3B | 3B | — | 2.55B | 3B | 7.5B | 10.3B | 4.5B | 10.3B |
| Cash and deposits (JPY) | 9.95B | 8.66B | 5.21B | 7.01B | 8.13B | 7.59B | 6.89B | 6.85B | 7.72B | 9.75B |
| Intangible assets (JPY) | 434M | 433M | 297M | 331M | 304M | 400M | 393M | 398M | 274M | 361M |
| Net debt (borrowings + leases - cash) (JPY) | -4.72B | -3.42B | 19M | -1.79B | -2.93B | -2.39B | 4.21B | 7.8B | 6.93B | 7.4B |
| Cash flow detail | ||||||||||
| Operating cash flow (JPY) | 6.3B | 4.67B | 3.54B | 7.55B | 4.51B | 4.71B | -1.07B | 1.88B | 2.69B | 2.64B |
| Purchases of property, plant and equipment (JPY) | -3.11B | -4.26B | -4.54B | -4.69B | -5.24B | -6.11B | -4.84B | -4.25B | -3.79B | -2.88B |
| Change in receivables (cash effect) (JPY) | -3M | 951M | 559M | 4.05B | -117M | 207M | -1.55B | 1.51B | 915M | -13M |
| Change in inventories (cash effect) (JPY) | 637M | -452M | -446M | -59M | 471M | -937M | -2.97B | 647M | 2.04B | 889M |
| Change in payables (cash effect) (JPY) | 1.24B | 405M | -356M | -1.69B | -501M | 1.86B | 1.79B | -2.74B | -2.17B | -3.89B |
| Dividends paid (cash effect) (JPY) | -732M | -881M | -674M | -637M | -628M | -785M | -625M | -604M | -286M | -273M |
| Share buybacks (cash effect) (JPY) | -1.07B | -1.64B | -1.99B | -433M | -2M | -75M | -726M | -1.19B | -959M | -1M |
| Interest paid (cash effect) (JPY) | -35M | -34M | -34M | -40M | -35M | -31M | -48M | -59M | -137M | -157M |
| Income taxes paid (cash effect) (JPY) | -567M | -1.04B | -703M | -223M | -535M | -550M | -625M | -369M | -222M | -649M |
| Operating cash flow before change in receivables (JPY) | 6.3B | 3.72B | 2.98B | 3.5B | 4.63B | 4.5B | 474M | 365M | 1.77B | 2.65B |
| Free cash flow (OCF - PPE - intangibles) (JPY) | 3.19B | 408M | -1B | 2.86B | -733M | -1.41B | -5.91B | -2.37B | -1.11B | -238M |
| Income detail | ||||||||||
| Research and development expense (JPY) | 1.51B | 1.5B | 1.44B | 1.46B | 1.42B | 1.36B | 1.26B | 1.23B | 1.13B | 1.06B |
| ↳ 5y CAGR | -0.9% | -2.1% | -3.5% | -3.2% | -5.0% | -5.6% | ||||
| Total comprehensive income (JPY) | 3.1B | 2.74B | -630M | 660M | 5.66B | 2.25B | -169M | -4.87B | 1.03B | 4.22B |
| Comprehensive income to owners (JPY) | 3.1B | 2.74B | -630M | 660M | 5.66B | 2.25B | -169M | -4.87B | 1.03B | 4.22B |
| Provision for credit losses (JPY) | 142M | -36M | -17M | -25M | 2M | 30M | -15M | 19M | -9M | 79M |
| Credit cost ratio (credit losses / average receivables) (%) | 0.5% | 0.1% | 0.1% | 0.1% | 0.0% | 0.1% | 0.1% | 0.1% | 0.0% | 0.4% |
| Reported | Jun 29, 2017 | Jun 28, 2018 | Jun 27, 2019 | Jun 26, 2020 | Jun 29, 2021 | Jun 29, 2022 | Jun 29, 2023 | Jun 27, 2024 | Jun 27, 2025 | Jun 25, 2026 |
Sign up to see institutional holdings
Sign UpPodcast Mentions
Sign up to see podcast mentions and sentiment
Sign UpTimely disclosures published on TDnet, newest first, titles as filed in Japanese. The link opens the disclosure on TDnet. Filings with EDINET (periodic reports, extraordinary reports, offerings, holding and buy-back reports), newest first, titles as filed in Japanese. The link opens the filing on EDINET. Press releases from the company's own website, newest first.


 トップメッセージ
 企業理念
 コーポレートガバナンス
 コンプライアンス
 会社概要
 沿革
 役員一覧
 事業紹介
 国内拠点
 海外拠点
 グローバル展開
 マーケット
 人材開発
 会社案内
 企業広告
 株主・投資家の
 個人投資家の皆様へ
 IRライブラリー
 財務ハイライト
 株主情報
 株式に関するQ&A
 株価情報
 IRカレンダー
 ディスクロージャーポリシー
 電子公告
 IRニュース一覧
 ステークホルダーの皆様へ
 企業理念・各方針・価値創造モデル
 TCFD提言に基づく情報開示
 Environment
 Social
 Governance
 アキレスレポート PDFダウンロード
 トップメッセージ
 研究開発方針
 基幹(コア)技術
 技術コラボレーション
 開発ストーリー
 素材・技術紹介
 研究開発推進への取り組み
 新卒採用情報
 キャリア採用情報









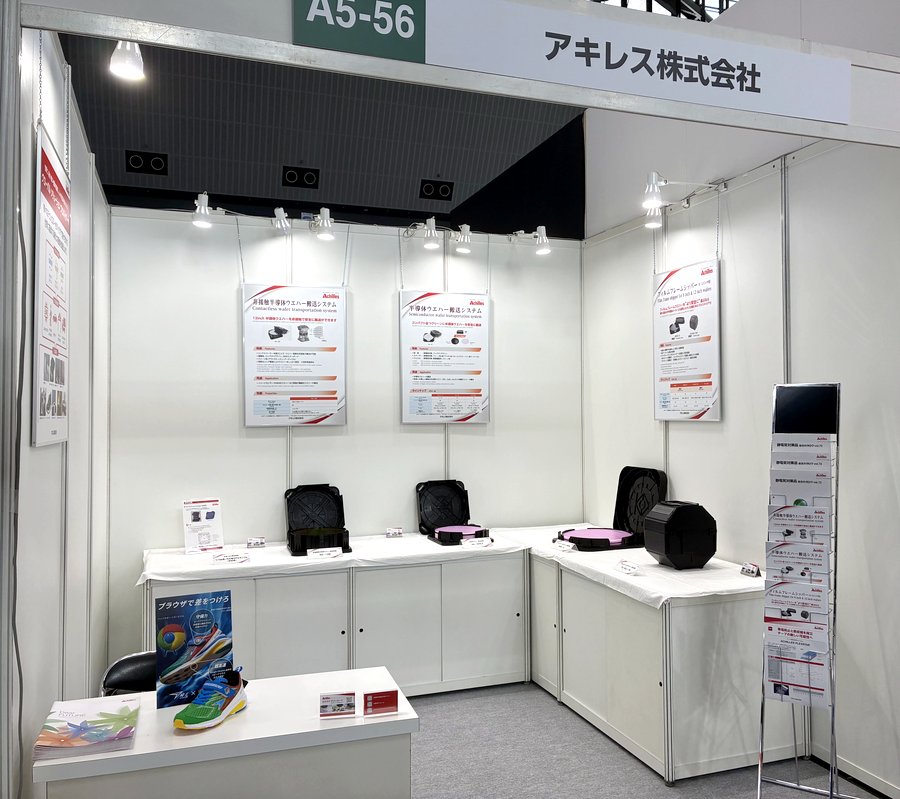
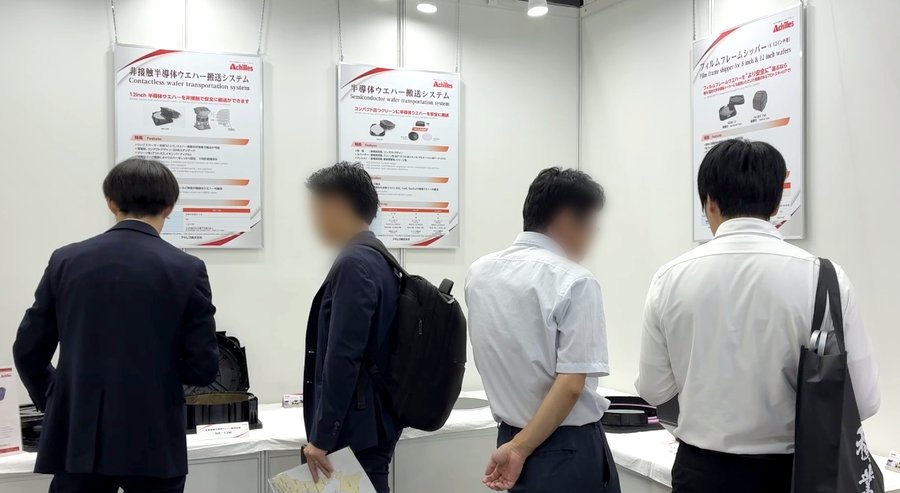
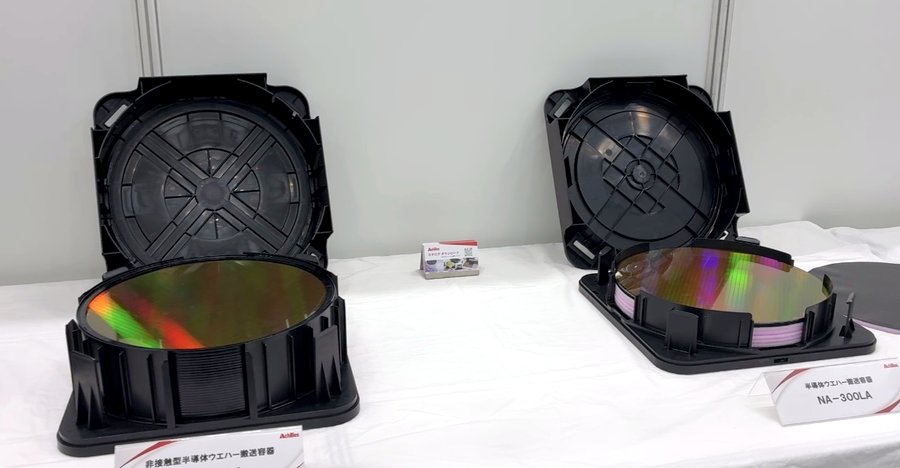
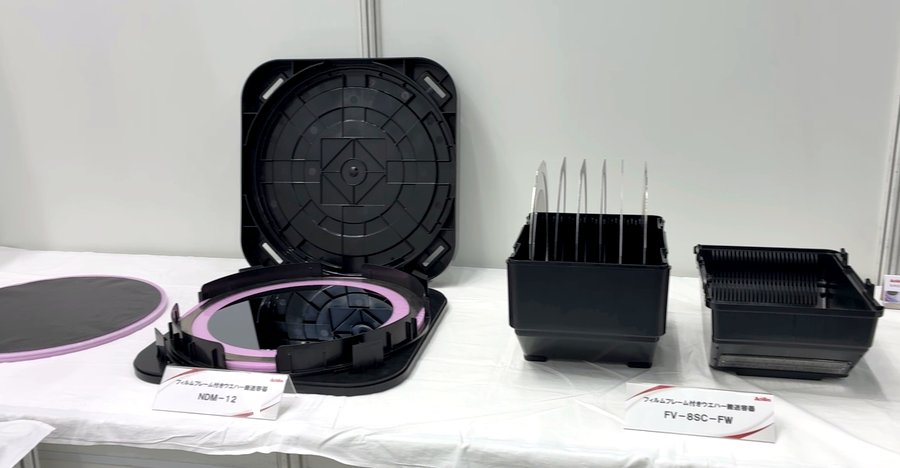
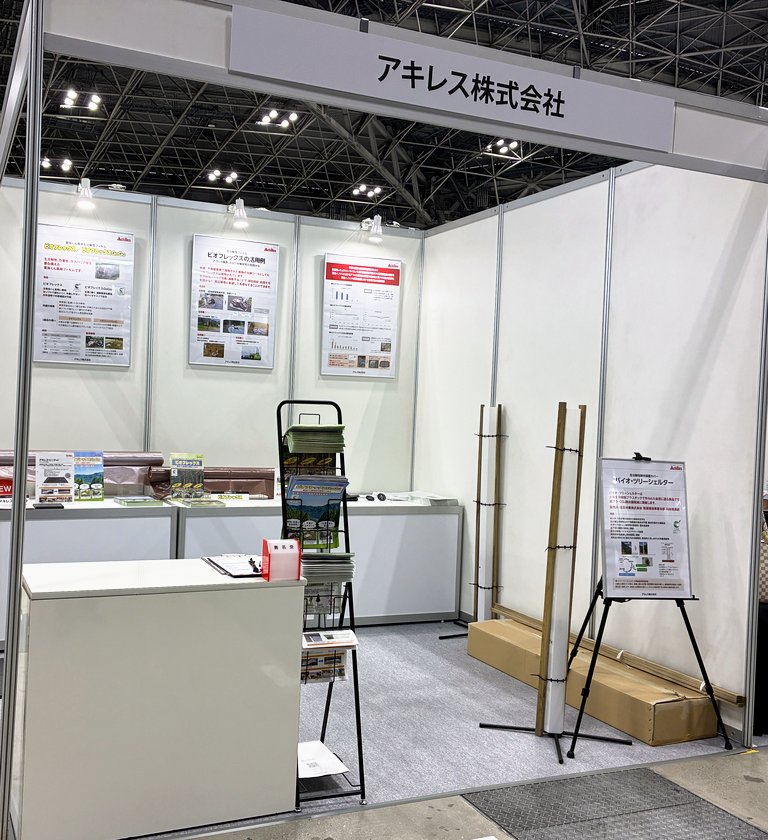
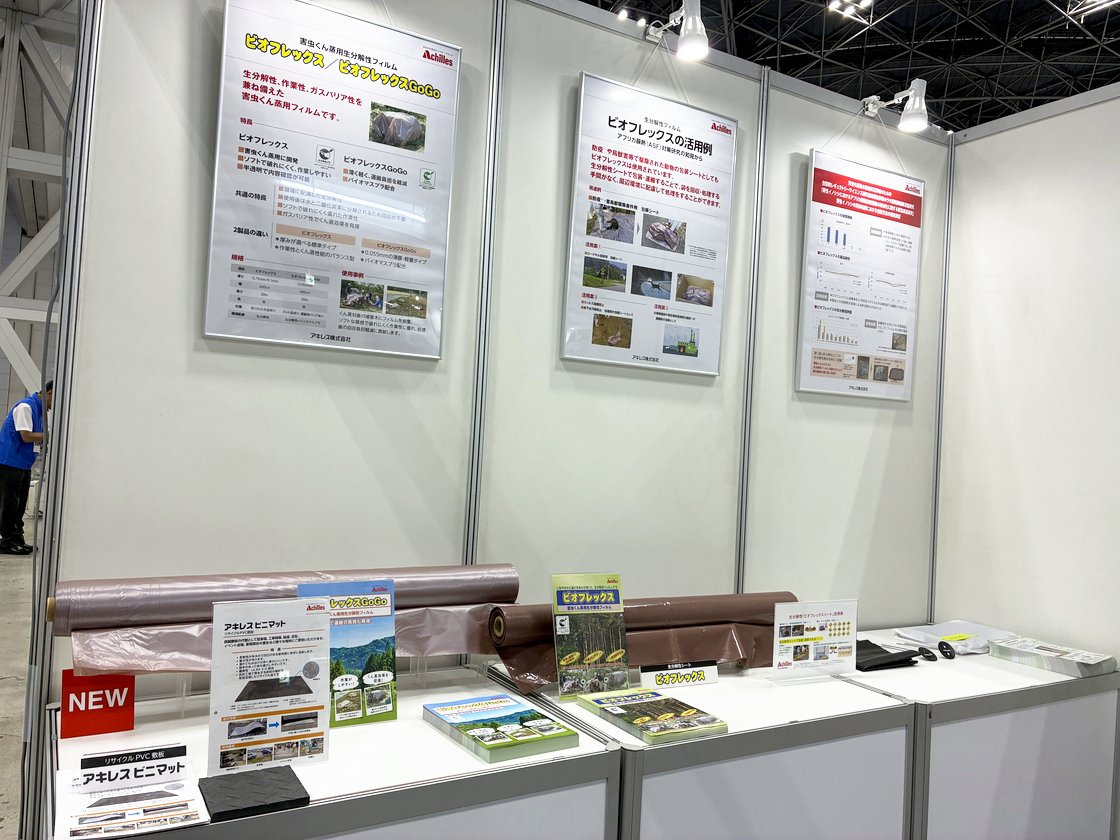
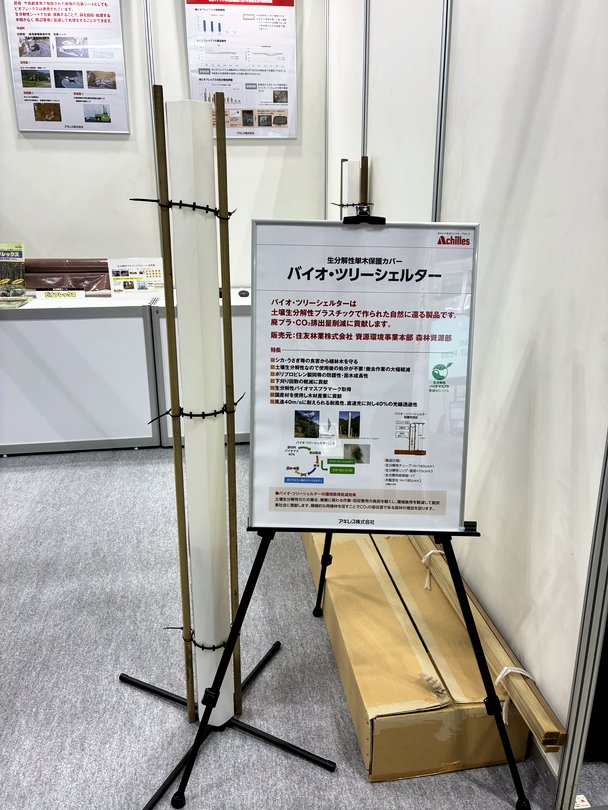
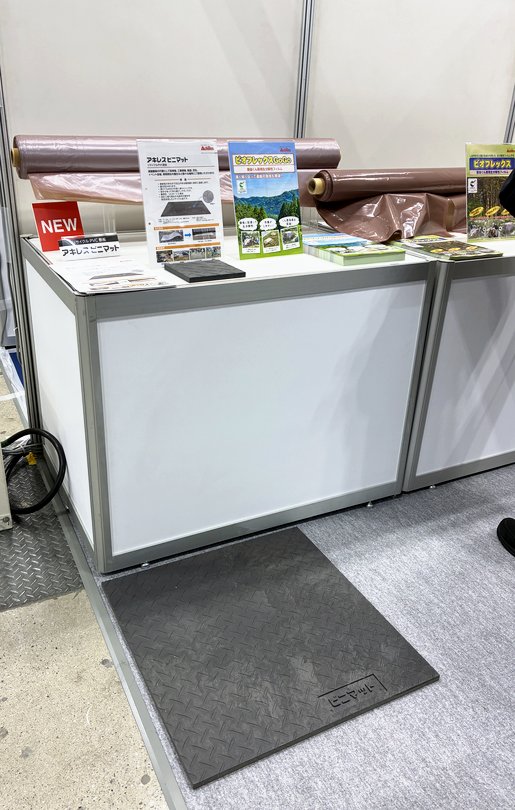



Prompts
Click prompts to add them under the company line, click again to take one out, then copy the result into your AI chat. Shared by Asian Century Stocks and Uncovered Thai Stocks. Thank you.
ETFs Holding Achilles Corporation
Exchange-traded funds whose newest published daily portfolio holds one of the company's listings, largest weight first.
| ETF | Weight in ETF | Shares | Market value | As of |
|---|---|---|---|---|
| DISV | 0.01% | 39,918 | $ 552.461K | Nov 12, 2026 |
| DFIS | 0.01% | 23,400 | $ 323.854K | Nov 12, 2026 |
| DFIC | 0.00% | 20,900 | $ 289.254K | Nov 12, 2026 |
| DFAX | 0.00% | 11,400 | $ 157.775K | Nov 12, 2026 |
| DFAI | 0.00% | 1,300 | $ 17.992K | Nov 12, 2026 |
| AVDV | 0.00% | 35,500 | $ 417.177K | Nov 16, 2026 |
| AVDS | 0.00% | 1,400 | $ 16.452K | Nov 16, 2026 |