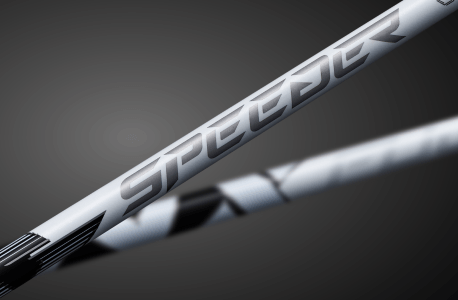
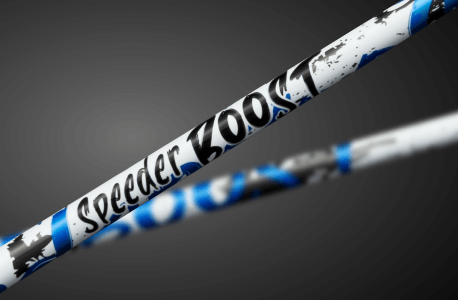
EDINET提出書類 藤倉コンポジット株式会社(E01094) 有価証券報告書 【表紙】 【提出書類】 有価証券報告書 【根拠条文】 金融商品取引法第24条第1項 【提出先】 関東財務局長 【提出日】 2026年6月24日 【事業年度】 第147期(自 【会社名】…
EDINET提出書類
藤倉コンポジット株式会社(E01094)
有価証券報告書
【表紙】
【提出書類】
有価証券報告書
【根拠条文】
金融商品取引法第24条第1項
【提出先】
関東財務局長
【提出日】
2026年6月24日
【事業年度】
第147期(自
【会社名】
藤倉コンポジット株式会社
【英訳名】
FUJIKURA COMPOSITES Inc.
【代表者の役職氏名】
代表取締役社長執行役員
【本店の所在の場所】
東京都品川区西五反田八丁目4番13号五反田JPビルディング
【電話番号】
03(5747)9444(大代表)
【事務連絡者氏名】
取締役執行役員
【最寄りの連絡場所】
東京都品川区西五反田八丁目4番13号五反田JPビルディング
【電話番号】
03(5747)9444(大代表)
【事務連絡者氏名】
取締役執行役員
【縦覧に供する場所】
株式会社東京証券取引所
2025年4月1日
至
森田
2026年3月31日)
管理本部統括
健司
管理本部統括
樋口
樋口
昭康
昭康
(東京都中央区日本橋兜町2番1号)
藤倉コンポジット株式会社大阪支店
(大阪市北区小松原町2番4号大阪富国生命ビル)
1/97
EDINET提出書類
藤倉コンポジット株式会社(E01094)
有価証券報告書
第一部【企業情報】
第1 【企業の概況】
1 【主要な経営指標等の推移】
(1) 連結経営指標等
回次
第143期
第144期
第145期
第146期
第147期
決算年月
2022年3月
2023年3月
2024年3月
2025年3月
2026年3月
売上高
(千円)
36,444,521
40,691,418
37,669,782
40,611,211
40,238,809
経常利益
(千円)
4,644,299
5,125,514
3,873,527
4,855,098
5,104,379
親会社株主に帰属する
当期純利益
(千円)
3,929,314
3,934,243
3,232,322
3,735,814
3,987,481
包括利益
(千円)
5,096,147
4,752,297
4,433,169
4,974,610
6,146,412
純資産額
(千円)
27,473,087
33,342,035
36,499,059
34,433,837
38,604,612
総資産額
(千円)
37,750,859
40,374,152
44,075,883
47,827,974
50,690,143
1株当たり純資産額
(円)
1,304.24
1,439.99
1,576.47
1,797.42
2,051.42
1株当たり当期純利益
(円)
174.64
180.42
139.61
190.46
208.61
潜在株式調整後1株
当たり当期純利益
(円)
―
―
―
―
―
自己資本比率
(%)
72.8
82.6
82.8
72.0
76.2
自己資本利益率
(%)
14.3
11.8
8.9
10.8
10.3
株価収益率
(倍)
4.2
6.1
10.3
7.3
11.4
(千円)
4,766,942
2,418,137
5,265,226
6,876,870
5,738,655
(千円)
△418,976
△857,245
△1,057,233
△3,170,214
△1,901,923
(千円)
△3,772,489
△1,731,918
△1,378,821
△3,449,483
△2,898,298
(千円)
6,905,294
7,228,636
10,228,991
10,877,895
11,879,001
2,611
2,459
2,307
2,315
2,252
[339]
[323]
[281]
[290]
[257]
営業活動による
キャッシュ・フロー
投資活動による
キャッシュ・フロー
財務活動による
キャッシュ・フロー
現金及び現金同等物
の期末残高
従業員数
[外、平均臨時雇用者
数]
(注) 1
2
(人)
潜在株式調整後1株当たり当期純利益については、第143期から第145期までは希薄化効果を有している潜在
株式が存在しないため、第146期及び第147期は潜在株式が存在しないため記載しておりません。
在外子会社の収益及び費用は、従来、各社の決算日の直物為替相場により円貨に換算しておりましたが、第
147期より期中平均為替相場により円貨に換算する方法に変更しております。当会計方針の変更は遡及適用
され、第143期から第146期は遡及適用後の数値となっております。
2/97
EDINET提出書類
藤倉コンポジット株式会社(E01094)
有価証券報告書
(2) 提出会社の経営指標等
回次
第143期
第144期
第145期
第146期
第147期
決算年月
2022年3月
2023年3月
2024年3月
2025年3月
2026年3月
売上高
(千円)
23,476,924
24,786,458
23,138,487
24,119,714
23,797,590
経常利益
(千円)
2,721,860
4,239,953
2,708,538
2,654,465
4,371,075
当期純利益
(千円)
2,121,479
3,654,146
2,740,661
2,606,550
4,245,219
資本金
(千円)
3,804,298
3,804,298
3,804,298
3,804,298
3,804,298
発行済株式総数
(株)
23,446,209
23,446,209
23,446,209
23,446,209
20,074,968
純資産額
(千円)
20,877,925
25,693,635
27,536,924
23,092,401
27,071,109
総資産額
(千円)
29,588,928
31,685,364
34,411,929
35,271,130
37,495,552
1株当たり純資産額
(円)
991.05
1,109.64
1,189.38
1,205.40
1,438.54
1株当たり配当額
(内1株当たり
中間配当額)
26.00
40.00
70.00
64.00
76.00
(円)
(10.00)
(20.00)
(35.00)
(32.00)
(33.00)
1株当たり当期純利益
(円)
94.29
167.57
118.37
132.89
222.10
潜在株式調整後1株
当たり当期純利益
(円)
―
―
―
―
―
自己資本比率
(%)
70.5
81.1
80.0
65.5
72.2
自己資本利益率
(%)
10.2
14.2
10.0
11.3
15.7
株価収益率
(倍)
7.7
6.5
12.2
10.4
10.7
配当性向
(%)
27.6
23.9
59.1
48.2
34.2
737
757
766
759
743
[306]
[291]
[254]
[241]
[225]
従業員数
[外、平均臨時雇用者
数]
株主総利回り
(比較指標:TOPIX(東証
株価指数))
(人)
(%)
(%)
123.5
191.1
259.2
261.0
436.7
(102.0)
(107.9)
(152.5)
(150.2)
(202.2)
最高株価
(円)
979
1,135
1,512
1,628
2,750
最低株価
(円)
462
648
851
1,028
1,164
(注) 1
第147期の1株当たり配当額76円のうち、期末配当額43円については、2026年6月25日開催予定の定時株主
総会の決議事項となっております。
2 潜在株式調整後1株当たり当期純利益については、第143期から第145期までは希薄化効果を有している潜在
株式が存在しないため、第146期及び第147期は潜在株式が存在しないため記載しておりません。
3 最高株価及び最低株価は、2022年4月3日以前は東京証券取引所市場第一部におけるものであり、2022年4
月4日以降は東京証券取引所プライム市場におけるものであります。
3/97
EDINET提出書類
藤倉コンポジット株式会社(E01094)
有価証券報告書
2 【沿革】
1901年10月
1910年3月
松本留吉により、藤倉電線護謨合名会社を創立、電線事業と引布事業により、電線、ゴム引布防
水布の製造を開始。
電線部門とゴム部門を分離、藤倉合名会社防水布製造所を設立。
1917年6月
東京府荏原郡大崎町(現東京都品川区)に五反田工場を開設。
1920年4月
1948年10月
株式会社に改め藤倉工業株式会社を設立。軟式飛行船やパラシュート、飛行機用タイヤ等の製造
を手掛ける。
藤倉ゴム工業株式会社に商号変更。
1949年5月
東京証券取引所に上場。
1949年12月
自動車用タイヤチューブの製造販売を開始。
1952年11月
軽登山靴『キャラバンシューズ』を開発。
1953年2月
藤栄運輸株式会社(現連結子会社)を設立。
1955年6月
救命いかだ、救命胴衣の製造販売を開始。
1959年4月
大阪営業所(現大阪支店)を開設。
1962年1月
埼玉県大宮市(現さいたま市大宮区)に大宮工場を開設。
1964年3月
五反田工場を閉鎖。
1969年4月
福島県原町市(現南相馬市)に原町工場を開設。
1971年9月
埼玉県岩槻市(現さいたま市岩槻区)に岩槻工場を開設。
1972年10月
茨城県勝田市(現ひたちなか市)に勝田出張所(現勝田営業所)を開設。
1973年11月
船舶の大型化に伴い垂直降下式乗込装置(シューター)を開発。
1974年5月
炭素繊維を使用したゴルフ用カーボンシャフト『Flyrun』(初のオリジナルブランド)を発売。
1991年4月
株式会社キャラバン(現連結子会社)を設立。
1994年7月
米国カリフォルニア州ビスタ市にFujikura Composite America,Inc.(現連結子会社)を設立。
1995年1月
フジクラゴルフクラブ相談室を開設。
1996年4月
中国浙江省杭州市に杭州藤倉橡膠有限公司(現連結子会社)を設立。
1996年5月
2000年11月
スポーツ用品事業部(現ACP事業部営業部)を東京都世田谷区へ移設。
ゴルフ用カーボンシャフト『Fit on!-11 SPEEDER』を発売。スピーダーシリーズの先駆けとな
る。
名古屋営業所を開設。
2002年9月
ベトナムハイフォン市にFUJIKURA COMPOSITES HAIPHONG,INC.(現連結子会社)を設立。
2006年5月
米国オハイオ州のIER Fujikura,Inc.(現連結子会社)を子会社化。
2010年11月
福島県南相馬市に小高工場を開設。
2011年1月
岩槻工場内にエンジニアリングセンターを開設。
2011年2月
中国浙江省安吉経済開発区に安吉藤倉橡膠有限公司(現連結子会社)を設立。
2011年3月
2011年9月
大宮工場の事業を岩槻工場、小高工場に集約。大宮工場を閉鎖。
東日本大震災で原町工場、小高工場に甚大な被害を受ける。
本社事業所及びスポーツ用品営業部(現ACP事業部営業部)を東京都江東区へ移転。
2012年3月
韓国ソウル市にFujikura Composites Korea,Co.,Ltd.を設立。
2012年4月
埼玉県加須市に加須工場を開設。
2016年9月
被災企業としての経験を活かし、非常用マグネシウム空気電池『Watt Satt』を発売。
2017年4月
FUJIKURA COMPOSITES HAIPHONG,INC.に検査棟を開設。
2019年4月
藤倉コンポジット株式会社に商号変更。
2020年4月
原町工場にLIM棟を開設。
2022年6月
有限会社テクノロジーサービスを子会社化。
2024年9月
東日本大震災で被災した、小高工場を再稼働。
2024年11月
本社事業所を東京都品川区西五反田へ移転。
2026年3月
茨城県ひたちなか市の勝田営業所を閉鎖。
4/97
EDINET提出書類
藤倉コンポジット株式会社(E01094)
有価証券報告書
3 【事業の内容】
当社グループは、当社、子会社16社、関連会社1社で構成され、産業用資材、引布加工品及びスポーツ用品の製造
販売を主な内容とした事業活動を展開しています。当社グループの事業に係わる位置付け及びセグメントとの関連は
次のとおりです。
産業用資材
引布加工品
スポーツ用品
その他
当社、連結子会社杭州藤倉橡膠有限公司、連結子会社安吉藤倉橡膠有限公司、連結子会
社IER Fujikura,Inc.及び連結子会社FUJIKURA COMPOSITES HAIPHONG,INC.が製造販売して
おります。また、製造工程の一部については、非連結子会社2社が担っております。当社
グループの製品の一部は、非連結子会社1社を通じて販売しております。
・・・・製造工程の一部については、連結子会社FUJIKURA COMPOSITES HAIPHONG,INC.及び非連
結子会社1社が担っております。
・・・・ ゴルフ用カーボンシャフトについては、当社及び非連結子会社1社で販売しておりま
す。また、海外においては連結子会社FUJIKURA COMPOSITES HAIPHONG,INC.にて一部を製
造し、連結子会社Fujikura Composite America,Inc.が販売しております。アウトドア用
品については、連結子会社株式会社キャラバンで仕入販売しております。
・・・・物流部門において製品等の輸送及び保管については、主として連結子会社藤栄運輸株式
会社及び非連結子会社1社が行っております。
・・・・
事業の系統図は次のとおりです。
2026年3月31日現在
5/97
EDINET提出書類
藤倉コンポジット株式会社(E01094)
有価証券報告書
4 【関係会社の状況】
名称
住所
資本金又は
出資金
(百万円)
主要な事業
の内容
議決権の所有
(又は被所有)
割合(%)
関係内容
(連結子会社)
㈱キャラバン
東京都豊島区
156
スポーツ用品
100
当社が資金援助しております。
役員の兼任1名があります。
藤栄運輸㈱
さいたま市
岩槻区
10
その他
100
当社製品の一部を輸送しておりま
す。
当社が土地建物の一部を賃貸して
おります。
Fujikura Composite
America,Inc.
*1
アメリカ
カリフォルニア州
4,000
千米ドル
スポーツ用品
100
当社スポーツ用品製品の一部を販
売しております。
杭州藤倉橡膠有限公司
*1
中国
浙江省
40,036
千元
産業用資材
100
当社産業用資材製品の一部を製造
しております。
FUJIKURA COMPOSITES
HAIPHONG,INC.
ベトナム
ハイフォン市
2,947
千米ドル
産業用資材
引布加工品
スポーツ用品
100
当社産業用資材製品、引布加工品
製品及びスポーツ用品製品の一部
を製造しております。
当社が資金援助しております。
IER Fujikura,Inc.
*1
アメリカ
オハイオ州
3,800
千米ドル
産業用資材
100
当社産業用資材製品の一部を販売
しております。
安吉藤倉橡膠有限公司
*1
中国
浙江省
96,370
千元
産業用資材
100
当社産業用資材製品の一部を製造
しております。
(注) 1
2
3
連結子会社の「主要な事業の内容」欄には、セグメントの名称を記載しております。
*1は特定子会社に該当しております。
FUJIKURA GRAPHICS,INC.につきましては、清算したため、連結の範囲から除外しております。
6/97
EDINET提出書類
藤倉コンポジット株式会社(E01094)
有価証券報告書
第2 【事業の状況】
1 【経営方針、経営環境及び対処すべき課題等】
文中の将来に関する事項は、当連結会計年度末現在において、当社グループが判断したものであります。
当社グループは、多様なステークホルダーとの適切かつ継続的な協力関係の下で、豊かな社会の実現に向けて貢献し
ていくことを経営理念、事業理念の中に謳い、当社グループの経済的及び社会的な企業価値を中長期にわたって安定的
に向上させることをめざし、企業価値の安定的、かつ着実な成長を示す指標として、売上高営業利益率(連結)10%以
上、自己資本比率(連結)60%以上、ROE(連結)10%以上を指標とさせていただきます。
そして、事業等のリスクの発現による経営戦略に対する悪影響を最小限に留めるため、当社グループでは、次のよう
な課題に取組んでまいります。
①
PBR1倍超の達成
資本コストや株価を意識した経営の推進において、目標であるPBR1倍超を目指し、稼ぐ力の強化・新成長戦
略・新株主還元方針・投資家とのコミュニケーション向上の各種施策を実行し、企業価値の最大化に取組み、2026
年3月末現在においてはPBR1倍超を達成しておりますが、今後も維持継続できるよう、取組みを加速させます。
②
事業の多様化
収益の源泉である事業を多様化し、収益構造を強化するため、当社は、次に掲げる対応をより一層加速して進め
てまいります。
イ.事業ポートフォリオの最適化を図り、資本コストを意識した経営により、当社グループ及び事業の収益力を
より向上させ、収益基盤を確固たるものとします。
ロ.長年培ってきた品質や技術の向上、生産方式の見直し等に積極的に取組み、日本市場だけでなく世界市場で
の収益力をより強化してまいります。
③
急速な技術革新への対応
2024年4月に先進技術戦略室を社長直轄として設置し、新規分野への投資として積極的に資金配分を実施・検討
し、2025年7月にスタートアップ企業と資本業務提携を締結しました。現在も事業ポートフォリオの変革に取り組
み、将来のシナジー効果創出のためのM&Aや、スタートアップ・大学研究機関との提携などを幅広く検討しており、
従来の技術開発機能に加えテーマ発掘、評価選定のための技術企画の機能を確立し、イノベーション創出により社
会課題を解決してまいります。
④
為替動向への対応
海外子会社貸付を外貨建てとする等、為替管理を強化するとともに、海外子会社の業績の重要性が増しており、
今後もその重要性が増すことが見込まれることから、為替相場の変動による期間損益への影響を緩和し、在外子会
社の業績をより適切に連結財務諸表に反映させるため、期中平均為替相場により円貨に換算する方法に変更してお
ります。
⑤
原材料費の変動への対応
原料価格やエネルギーコストのみならず、人件費の高騰を加味した原材料費の変動により、当社グループの営業
利益が低下する局面では、状況を見極めながら必要に応じて、購買及び生産体制の効率化によるコストダウン、売
価への反映等の措置を講じ、変動の影響を緩和してまいります。
⑥
サステナビリティの推進
企業活動が環境や社会に与える影響が益々増大する中、地球規模の環境破壊や温暖化、人権などの社会的問題へ
の対応を強化してまいります。当社は「人々の安心を支え、社会の豊かさに貢献できる企業であり続ける」ことを
理念に掲げ、「くらし」「ものづくり」「エネルギー」「いのち」「レジャー」をはじめとする様々な分野で社会
を支え、持続可能な社会の実現及び持続的な企業価値の向上を目指すことを「基本方針」とし、サステナビリティ
の更なる推進を図ってまいります。
イ.気候変動対応
気候変動がもたらす事業への影響・脅威等のリスクを特定し、管理することで、全社リスクマネジメントプ
ロセスにも連携してまいります。
ロ.人的資本
従業員及びその家族が、安心して働ける企業を目指します。その実現のため人材育成施策の刷新、社内環境
整備など、健全な事業経営、品質向上、人権尊重及び健康経営を推進します。
⑦
デジタルトランスフォーメーション(DX)への対応
当社グループは働き方改革、生産性向上・業務の変革を目的とした業務改革推進プロジェクトを設置し、デジタ
ルトランスフォーメーション(DX)等への投資を積極的に進めております。
⑧
その他
当社グループは、その他として以下の課題を掲げ取組んでまいります。
7/97
EDINET提出書類
藤倉コンポジット株式会社(E01094)
有価証券報告書
イ.グループ全社の内部統制の継続を推進します。
ロ.データヘルス・健康経営を進めるためのコラボヘルスを推進します。
ハ.多様な価値観を有する社員それぞれが、自らの能力を発揮できる企業を目指します。
ニ.女性がいきいきと働き続けられ、また活躍できる環境及び機会を整備します。
2 【サステナビリティに関する考え方及び取組】
当社グループのサステナビリティに対する考え方および取組みは、次のとおりです。
なお、文中の将来に関する事項は、当連結会計年度末現在において、当社グループが判断したものであります。
(1)気候変動への対応(TCFD提言に沿った気候変動関連の情報開示)
イニシアチブへの賛同表明
当社は気候変動関連情報の開示検討に伴い、「気候変動関連財務情報開示タスクフォース(TCFD)」提言への賛
同を表明、合わせてGXフューチャー・コンソーシアムに参画しています。
当社グループは持続可能な社会の実現を目指し、社会的責任を果たすとともに、ESG経営を通じて企業の価値向上
および持続的な成長に向けて取組んでまいります。
①
ガバナンス
サステナビリティに関する重要決議事項については、社長直轄組織である「サステナビリティ統括室」が各種経
営課題について経営会議における報告、審議及び決議を経て、取締役会が監督及び監視を行う体制となっておりま
す。
サステナビリティ統括室の主な役割としては、サステナビリティ情報の一元管理と開示、サステナビリティ目標
(KPI)の策定と進捗管理、経営会議及び取締役会への報告(半期に一回)、そして当統括室の直下に設置されている
サステナビリティ戦略委員会、各事業部および各事業所への指示や協議等を行なっております。
サステナビリティ統括室は、各事業部長、各拠点長、経営企画室、管理部門、施設部門、技術開発部門、営業部
門の各部門長を中心に構成しています。
また従来設置していた「中央省エネ・環境管理委員会」及び「リスクマネジメント委員会」を2026年3月で廃
止、以降はその機能をサステナビリティ統括室に組み入れました。これによりサステナビリティ全般に対する課題
および対応を一元管理し、より迅速に解決を図ります。
8/97
EDINET提出書類
藤倉コンポジット株式会社(E01094)
有価証券報告書
ガバナンス体制図
②
戦略
当社グループは、TCFD提言で示されたリスク・機会の項目を参考に、気候変動が当社グループの事業に与え
るリスク・機会に関して、1.5℃シナリオと4℃シナリオの2つの温度帯の側面から以下の項目を抽出し、対応
策を立案しております。
気候変動がもたらす影響
影
響
度
時
間
軸
対応方針
法
規
制
・
政
策
・輸出および販売規制の導入による対応
工数増
・製品の脱炭素対策費用の発生
・開発活動の制限もしくは中止
大
中
期
・法規制に対する定期的な情報収集および
迅速な対応
・現地調達化の推進
技
術
・脱炭素技術に対応した原材料調達コス
ト高騰および開発/設備投資コストの増
大
・イノベーション欠如からの新規開発遅
れそれにとももなう機会損失
大
中
期
・省エネ投資戦略の適正化
・新規設備導入におけるICP(インターナ
ルカーボンプライシング)の検討
市
場
・サプライヤーからの現行原材料の廃番
および環境対応原材料の活用にともなう
材料コスト増
中
中
期
評
判
・気候変動対応遅延による開発ストップ
や現行品の他社への転注
・気候対応要請に対する対応遅延により
投資家および顧客からの信頼低下
大
短
期
・サプライチェーンにおけるBCP対策の確立
・代替材料の確立
・高効率な空調機器の導入
・品質管理体制の強化
・コンポジット技術によるゴム品質の向上
区分
移
行
1
・
リ
5
ス
℃
ク
シ
ナ
リ
オ
リ
ス
ク
物
理
4
℃
シ
ナ
リ
オ
急
性
・サプライヤー被災による自社での生産
停止、納期の大幅遅延
大
短
期
〜
長
期
慢
性
・社内およびサプライヤーの作業者の熱
中症対策
・製造過程のゴム品質悪化に対する顧客
からの信頼低下
・製造プロセスにおける水リスク
中
長
期
9/97
・持続可能なサプライチェーンの構築
・サプライヤーとの積極的なコミュニケー
ション
・代替材料および製法の確立
・環境対応製品開発や再生可能エネルギー
および省エネルギー対応設備の導入など、
GHG削減活動の積極的な開示
・気候関連の外部格付機関(CDP等)によ
る評価の向上
EDINET提出書類
藤倉コンポジット株式会社(E01094)
有価証券報告書
中
中
期
〜
長
期
・BEV/FCEV車向けアイテムの開発促進
・積極的な営業活動による新規顧客獲得
中
短
期
〜
長
期
・気候変動リスクを考慮した製品開発企画
の促進
・積極的な営業活動による新規顧客獲得
・生産性の向上
中
中
期
・製品に占める再生材の比率向上(EUエ
コデザイン規則、日本リサイクル法)
・循環経済に積極的な企業と評価され、
企業価値向上
小
中
期
・風力発電機用ブレード保護シートの需
要拡大(GX推進法)
・蓄電および関連部材の需要拡大
中
短
期
・顧客ニーズに合った製造体制の強化
・長期安定的な供給体制の構築
・蓄電設備の充実化
・太陽光発電設備の導入
大
中
期
・BCPをはじめとした適正な情報開示の継続
・災害対策製品(救命筏、非常用電池)の
拡販および改良
・気候関連の外部格付機関(CDP等)による
評価の向上
・BEV,FCV向け製品開発の促進および周
辺、関連機器製品の開発促進
市
場
1
・
5
℃
/
機
資
源
効
率
4
会
℃
シ
エ
ネ
ル
ギ
❘
源
レ
ジ
リ
エ
ン
ス
ナ
リ
オ
・水害リスク増大による対応製品市場の
拡大
・温室効果ガスを回収するための「CO2回
収ガスバッグ」の需要が増加
・アウトドアレジャーが増え、移動手段
としての自動車需関連要の増加が見込ま
れる
・気候変動対応の充実によるステークホ
ルダーからの信頼度向上および資金調達
費用の低減
・信頼を基にした開発機会の創出
(影響度の定義)
・省エネの見える化活動による適時状況把
握と低減活動の推進
・生産効率の向上
・不良低減、エネルギー使用量の削減
・バイオマス素材やリサイクル材を活用し
た製品開発
・廃棄材の再資源化への製品設計の取り組
み
大(会社経営に大きな影響を与える)> 中 > 小(財務報告に影響を与える)
(時間軸の定義)短期(3年未満で対応)、中期(3年以上10年未満で対応)、長期(10年以上で対応)
③
リスク管理
当社グループにおける気候関連リスクの識別・評価はサステナビリティ統括室において年に一回の頻度で代表取
締役社長執行役員を責任者として推進しており、リスク評価については影響度と発生度の二つを用いて実施してお
ります。また、予防策や対応方針は当統括室において協議し、経営会議に報告された後、関連する事業部、事業所
にて実行されます。また、以前より設置されていたリスクマネジメント委員会を廃止、その機能をサステナビリ
ティ統括室に集約しました。旧委員会で実施していた全社のリスク管理への統合プロセスに気候関連リスクも取り
込み、より実践的なリスクマネジメントプロセスを構築していきます。
④
指標と目標
当社グループは、気候関連問題が経営に及ぼす影響を評価・管理するため、GHGプロトコルの基準に基づきGHG
(温室効果ガス)排出量算定を実施しております。2024年度よりScope3についても算定しました。また、その他の
気候変動指標として、廃棄物最終処分率も考慮しており、2025年度の実績値と今後の目標値は次のとおりです。
2024年度
気候変動指標
目標
2025年度実績
評価
[参考]
GHG(温室効果ガス)排出量
[国内のみ]
<Scope1及び2>
・基準年:2013年
・目標年:2030年
・削減率:46%
(注)1
2
活動実施中
Scope1: 6,844
Scope2: 21,586
合計:28,430
[t‐CO2]
削減率:25%
削減率:41%
―
産業廃棄物の最終処分率
Scope1: 6,798
Scope2: 15,613
合計: 22,411
[t‐CO2]
Scope3: 59,381
[t‐CO2]
―
Scope3: 44,911
[t‐CO2]
0.54%
○
0.92%
最終処分率:1%以下
VOC排出削量については、既に目標達成しているため、指標としては除外しております。
継続して排出量管理およびVOC排出量の集計は実施しております。
10/97
EDINET提出書類
藤倉コンポジット株式会社(E01094)
有価証券報告書
(2) 人的資本
①
ガバナンス
人的資本に関するガバナンス体制は「(1)気候変動への対応①ガバナンス」に含まれております。詳細につい
ては同項目をご参照下さい。
②
戦略
イ
人材育成方針
当社グループは、職位・職能ごとに求められる能力・専門知識の習得を目的とした研修制度だけではなく、従業
員一人ひとりが積極的かつ創造的に行動し、自らに期待される成果をあげることができる人材を育成する研修制度
を実施しております。
また、2023年度から組織改革に着手しており、従業員のキャリア開発支援を進めてまいります。
(主な取組み)
人材育成の強化
評価・処遇の刷新
ロ
エンゲージメントを高める取り組み、高度専門職の採用・育成、複線型人事制度(マネジメ
ント・専門性の強化、海外経験の機会拡充)、次世代リーダー育成
評価・昇級制度の刷新、スキルマトリックス管理、退職金インセンティブ制度の拡充
社内環境整備方針
a.
多様な人材が活躍できる環境の整備
・高齢者や育児・介護等の就労制限がある方への配慮
・障がい者雇用(特例子会社の活用)
b.
従業員の健康、働きやすい職場
・健康経営として従業員の健康活動を推進
・テレワーク勤務への対応
③
リスク管理
当社における人的資本・多様性に関するリスク管理は「(1)気候変動への対応③リスク管理」に含まれており
ます。詳細については「(1)気候変動への対応③リスク管理」をご参照下さい。
④
指標と目標
当社では、上記「②戦略」において記載した、人材の育成に関する方針および社内環境の整備について次の指標
を用いております。なお、当社においては、関連する指標のデータ管理とともに、具体的な取組みが行われている
ものの、連結グループに属する全ての会社では行われていないため、連結グループにおける記載が困難でありま
す。このため、次の指標に関する目標及び実績は、連結グループにおける主要な事業を営む提出会社のものを記載
しております。なお、すでに開示している「女性活躍推進法に基づく一般事業主行動計画」から、よりガバナンス
を強化すべく、目標の見直しを行っております。
指標
目標
実績(当連結会計年度)
女性採用比率
30.0%
11.1%
新卒者の女性採用比率
30.0%
11.1%
管理職に占める女性の割合
10.0%
2.0%
男性社員の育児休業取得率
40.0%
50.0%
障がい者雇用率/法定雇用率以上の雇用人数拡大
(特例子会社の有効活用を含む)
2.5%
2.7%
健康診断の2次受診率
100.0%
95.3%
コンプライアンス研修実施率
100.0%
100.0%
教育研修実施率
100.0%
25.4%
11/97
EDINET提出書類
藤倉コンポジット株式会社(E01094)
有価証券報告書
3 【事業等のリスク】
(1) リスクマネジメント体制
当社グループのリスクマネジメントは、サステナビリティ統括室内のリスクマネジメント会議にて行います。同
会議は、年に一度の事業部門によるリスクアセスメントの結果を受け、リスクを集約・評価して全社重要リスクを
選定することにより、全社的なリスクマネジメントを実施します。
また、管理部門などのモニタリング部門は、事業部門が行ったリスクマネジメントをモニタリングし必要に応じ
て助言や情報提供を行います。これに対して内部監査室は、独立した客観的な立場から当社のリスクマネジメント
活動の有効性に関して監査を行います。モニタリングや監査の結果はリスクマネジメント会議に共有され、同会議
によるリスクマネジメント体制の継続的な改善に役立てます。
最終的にこれらのリスクマネジメントの結果は取締役会に報告され、取締役会による当社のリスクマネジメント
体制の構築に対する監督および監視が適切に行われる体制となっております。
なお、従来のリスクマネジメント委員会は、権限と責任を明確にするために、その機能をリスクマネジメント会
議に移管することで2026年3月に廃止を決定いたしました。
リスクマネジメント体制図
(2) 全社重点リスク
当社グループは、有価証券報告書に記載した事業の状況、経理の状況等に関する事項のうち、投資家の判断に重要
な影響を及ぼす可能性のある事項を全社重点リスクとして選定しております。
事業部門は、全社重点リスクについて定期的に対応策の実施状況を確認しリスクマネジメント会議に報告すると共
に、年度末にレビューを行いその改善内容を次年度の事業目標に反映させます。
全社重点リスクは以下のようなものがあります。なお、文中の将来に関する事項は、当連結会計年度末現在におい
て当社グループが判断したものであります。
12/97
EDINET提出書類
藤倉コンポジット株式会社(E01094)
有価証券報告書
No.
リスク事象
リスクシナリオ
対応策
1
サイバー攻撃等によるシス
テム機器・ネットワークの
異常、故障
メールの利用不能、業務システム
利用不能による業務停止や情報漏
洩をもたらす可能性がある。
重要情報の保管状況の確認、情報漏洩時
のマニュアルの策定
2
DX化、生成AI等利用の遅れ
3
イノベーションの欠如によ
る新製品開発遅れ
4
(コア)人員数不足、業務の
属人化
5
エネルギー費、原材料高騰
6
(環境規制の強化や仕入先
の廃業等による)材料の供
給停止、入手難
7
ハラスメント・差別
8
法令違反
9
自然災害の激甚化
10
サステナビリティ対応への
遅れ
11
品質
技術革新や業務効率の改善が行わ
れず、市場のニーズに即した製品
を供給できないことにより、顧客
満足度や当社の市場競争力が低下
する可能性がある。
適時に新製品の市場投入が遅れる
ことによる機会損失や、既存の製
品の受注数の減少、特定顧客・産
業への依存度が高まりその生産動
向によって売上高が左右されると
いった可能性がある。
労働時間の増加やモチベーション
の低下、人材流出、また技術の継
承不足をもたらし、企業活動を停
滞させる可能性がある。
調達先変更や海外生産移行等によ
る利益減少をもたらす可能性があ
る。
原材料の入手が困難となり、最終
的には当該材料を用いる製品の生
産ができなくなる可能性がある。
労働時間の増加やモチベーション
の低下、人材流出をもたらし、重
大な事案は、刑事問題、社会的信
用失墜、訴訟問題にまで発展する
可能性がある。
取適法や競争法に違反した取引を
行うこと等による刑事罰、行政
罰、社会的信用失墜による売上減
少の可能性がある。
甚大な自然災害が発生すること
で、工場設備の損壊による生産停
止や従業員の死傷、避難勧告・退
避命令による操業不能、機密情報
の破損流出、有毒物の流出などの
影響を受ける可能性がある。
材料の代替,省エネルギー製法,
再生可能エネルギーへの代替が遅
れ、または具体的行動計画に落と
し込まれていないことにより、最
終的に付加価値のある製品を供給
できなくなる可能性がある。
品質不良が発生することで顧客に
よる当社製品のイメージダウン、
市場クレームの発生や補償、訴訟
問題の発生の可能性がある。
13/97
当社指定の生成AI利用促進、ガイドライ
ン策定
オープンイノベーションの活用推進、専
門人材育成・登用のための人事制度構築
労働時間の適正管理、人事ローテーショ
ンの実施
顧客への価格転嫁の推進
環境規制に適合する代替材料の検討
ハラスメント防止研修の全社実施
法改正情報の周知、取適法対象取引の監
視
BCPの更新、BCP訓練の実施
第7次中計データを網羅したGHG排出量予
測と対応策の提案
月次品質保証統括会議でのレビュー、及
びディスカッション、是正処置の妥当性
確認
EDINET提出書類
藤倉コンポジット株式会社(E01094)
有価証券報告書
4 【経営者による財政状態、経営成績及びキャッシュ・フローの状況の分析】
当連結会計年度における当社グループの財政状態、経営成績及びキャッシュ・フロー(以下「経営成績等」とい
う。)の状況の概要は次のとおりであります。
なお、文中の将来に関する事項は、当連結会計年度末現在において判断したものであります。
(1)財政状態及び経営成績の状況
当連結会計年度における世界経済は、依然として沈静化の兆しが見えない地政学的リスクを背景に、各国の関税
政策の影響や輸出規制なども加わり、サプライチェーンへの影響が増しております。
当連結会計年度の売上高は402億3千8百万円(前年同期比0.9%減)、営業利益は48億3千8百万円(前年同期
比4.7%増)、経常利益は51億4百万円(前年同期比5.1%増)、親会社株主に帰属する当期純利益は39億8千7百
万円(前年同期比6.7%増)となりました。
なお、当連結会計年度の期首より、在外子会社の収益及び費用については、各社の決算日の直物為替相場により
円貨に換算する方法から、期中平均為替相場により円貨に換算する方法に変更したため、遡及適用後の数値で前年
同期比較を行っております。
セグメントごとの経営成績は次のとおりであります。
<産業用資材>
工業用品部門は、中国において自動車市場に加え住宅設備市場が依然として低調に推移しており、また北米にお
いて汎用エンジン等を扱うローカル企業の受注が振るわず、減収となりました。一方で、国内の自動車関連部品及
び住宅設備関連部品は受注が回復傾向にあり、増収増益となりました。制御機器部門は、リチウムイオン電池製造
装置関連部品は設備投資の回復が見られましたが、台湾向けAI半導体製造装置への設備投資が一巡し、中国向け液
晶製造装置への設備投資も低調に推移しました。また、一部中国向け医療関連部品の減産により、減収減益となり
ました。
この結果、売上高は231億7千8百万円(前年同期比0.9%減)、営業利益は7億2千7百万円(前年同期比
264.9%増)となりました。
<引布加工品>
引布部門は、電気・電子向けの部材や自動車関連部品の受注が好調に推移したことにより、増収増益となりまし
た。加工品部門は、舶用品において小型船舶用救命浮器の受注が好調に推移したことや救命胴衣の交換需要が増加
した他、防衛関連製品の追加受注などもあり、前期の営業損失から営業利益に転じました。
この結果、売上高は38億9千3百万円(前年同期比14.0%増)、営業利益は1億6千5百万円(前年同期は1億
3千2百万円の損失)となりました。
<スポーツ用品>
ゴルフ用カーボンシャフト部門は、国内市場では物価高騰による影響、アジア地域では韓国市場を中心に景気の
低迷、そして北米市場においては米国の物価高騰による消費減退の影響などもあり、減収減益となりました。この
ような環境の中、当社は『VENTUS』ブランドの最新モデル『26 VENTUS TR シリーズ』をすべての地域においてグ
ローバルに展開しております。アウトドア用品部門は、主力シューズ及び冬物商材の販売が伸び悩み、さらに円安
の影響等による仕入れ価格高騰の影響により、引き続き低調に推移しました。
この結果、売上高は128億2千2百万円(前年同期比4.7%減)、営業利益は47億4百万円(前年同期比11.1%
減)となりました。
<その他>
運送部門は、産業用資材の輸送が減少し、また燃料費の高騰等により、減収減益となりました。
この結果、売上高は3億4千5百万円(前年同期比0.1%減)、営業利益は2千2百万円(前年同期比37.2%減)
となりました。
14/97
EDINET提出書類
藤倉コンポジット株式会社(E01094)
有価証券報告書
当期の財政状況は次のとおりであります。
(資産)
当連結会計年度末の資産は、投資その他の資産の増加により、前連結会計年度末に比べ28億6千2百万円増加
の506億9千万円となりました。
(負債)
当連結会計年度末の負債は、流動負債の減少により、前連結会計年度末に比べ13億8百万円減少の120億8千5
百万円となりました。
(純資産)
当連結会計年度末の純資産は、親会社株主に帰属する当期純利益を計上したことにより、前連結会計年度末に
比べ41億7千万円増加の386億4百万円となりました。
この結果、自己資本比率は前連結会計年度末の72.0%から76.2%となりました。
以上の結果、当社グループが企業価値の安定的、かつ着実な成長を示す指標(以下、「目標数値」という)と比
べると、売上高営業利益率は12.0%(目標数値10%以上)、自己資本比率は76.2%(目標数値60%以上)、ROEは
10.3%(目標数値10%以上)となりました。
当社グループの経営成績に重要な影響を与える要因として、「3
「1
事業等のリスク」に掲げたリスクに対して、
経営方針、経営環境及び対処すべき課題等」に掲げた取組みを進めています。引き続き、リスクに対する取
組みを進めてまいります。
(2)キャッシュ・フローの状況
①
キャッシュ・フローの状況の分析・検討内容
当連結会計年度末における「現金及び現金同等物」(以下「資金」という)は、前連結会計年度末に比べ10億1
百万円増加(前年同期比9.2%増)し、118億7千9百万円となりました。
当連結会計年度における各キャッシュ・フローの状況とその主な要因は、以下のとおりであります。
(営業活動によるキャッシュ・フロー)
営業活動の結果得られた資金は57億3千8百万円となりました。これは主として、「税金等調整前当期純利
益」を52億3千3百万円計上したことによるものであります。
(投資活動によるキャッシュ・フロー)
投資活動の結果使用した資金は19億1百万円となりました。これは主として、「有形固定資産の取得による
支出」16億8千2百万円によるものであります。
(財務活動によるキャッシュ・フロー)
財務活動の結果使用した資金は28億9千8百万円となりました。これは主として、「配当金の支払額」12億
6千4百万円によるものであります。
営業活動によるキャッシュ・フローから投資活動によるキャッシュ・フローを差し引いた当期のフリー・
キャッシュ・フローは38億3千6百万円となり、前連結会計年度末に比べ1億3千万円増加いたしました。
②
資本の財源及び資金の流動性に係る情報
当社グループの主な資金需要は、原材料費、製造費、人件費、販売費及び一般管理費等の営業費用並びに固定
資産等にかかる投資であり、主に自己資金により賄い、必要に応じ銀行借入等により対応しております。
当連結会計年度末の現金及び現金同等物は118億7千9百万円であり、流動性は十分な水準であると考えており
ます。
15/97
EDINET提出書類
藤倉コンポジット株式会社(E01094)
有価証券報告書
(3)生産、受注及び販売の実績
①
生産実績
当連結会計年度の生産実績をセグメントごとに示すと、次のとおりであります。
(単位 : 千円)
当連結会計年度
(自 2025年4月1日
至 2026年3月31日)
セグメントの名称
前年同期比(%)
産業用資材
23,026,275
97.3
引布加工品
4,374,092
111.2
スポーツ用品
3,330,543
81.9
30,730,911
97.0
合計
(注) 金額は販売価格によっております。
②
受注実績
当連結会計年度の受注実績をセグメントごとに示すと、次のとおりであります。
(単位 : 千円)
セグメントの名称
受注高
前年同期比(%)
受注残高
前年同期比(%)
産業用資材
23,428,422
98.8
2,885,559
109.5
引布加工品
3,788,652
106.5
1,105,767
91.4
スポーツ用品
13,675,927
105.9
1,021,558
609.1
345,586
99.9
―
―
41,238,588
102.6
5,012,885
124.9
その他
合計
(注) セグメント間の取引については、相殺消去しております。
③
販売実績
当連結会計年度の販売実績をセグメントごとに示すと、次のとおりであります。
(単位 : 千円)
当連結会計年度
(自 2025年4月1日
至 2026年3月31日)
セグメントの名称
前年同期比(%)
産業用資材
23,178,035
99.1
引布加工品
3,893,092
114.0
スポーツ用品
12,822,094
95.3
345,586
99.9
40,238,809
99.1
その他
合計
(注) セグメント間の取引については、相殺消去しております。
(4)重要な会計上の見積り及び当該見積りに用いた仮定
当社グループの連結財務諸表は、わが国において一般に公正妥当と認められる会計基準に基づき作成されており
ます。この連結財務諸表の作成においては、経営者による会計上の見積りを行なっております。経営者はこれらの
見積りについて過去の実績や現状等を勘案し合理的に判断しておりますが、実際の結果は見積り特有の不確実性が
あるため、これらの見積りと異なる場合があります。
連結財務諸表の作成にあたって用いた会計上の見積り及び仮定のうち、重要なものについては「第5
況
1
連結財務諸表等
(1) 連結財務諸表
注記事項
経理の状
(連結財務諸表作成のための基本となる重要な事項)」に
記載しておりますが、特に以下の項目については、連結財務諸表に大きな影響を及ぼすと考えております。
なお、中東情勢の影響につきましては、連結財務諸表作成時点で入手可能な情報をもとに将来の見積りに反映さ
16/97
EDINET提出書類
藤倉コンポジット株式会社(E01094)
有価証券報告書
せております。
(固定資産の減損処理)
当社グループは固定資産の減損会計の適用に際し、独立したキャッシュ・フローを生み出す最小単位でグルー
ピングし、各グループ単位で将来キャッシュ・フローを見積り、将来キャッシュ・フローが帳簿価額を下回った
場合、回収可能価額まで帳簿価額を減額することとしております。この見積りに変動があった場合、減損損失が
発生し、利益に影響を及ぼす可能性があります。
5 【重要な契約等】
該当事項はありません。
6 【研究開発活動】
当社グループは、「くらし」「ものづくり」「エネルギー」「いのち」「レジャー」の5つをキーテーマとして、
基礎技術を発展させ、自然環境の保全、省エネルギーに貢献する製品や心の豊かさに繋がる製品の開発に注力してお
ります。
コーポレートにおける研究開発活動としては、2024年に社長直轄として、従来の技術開発部門を発展させた先進技
術戦略室を設置いたしました。技術企画の機能を充実させ、イノベーション創出のための活動を行っており、その一
環として2025年にはセンサービジネスの事業化に向け、IoTスタートアップとの資本業務提携を行いました。さらに、
2026年4月1日付で先進技術戦略室内に新事業開拓部を設置し、マーケティングを強化してまいります。
当連結会計年度の研究開発費の総額は1,493百万円であります。
当連結会計年度におけるセグメント別の主な研究開発活動は次のとおりであります。
(1) 産業用資材
工業用品部門の自動車事業では、カーボンニュートラルの動きに呼応して、電気自動車をはじめ、燃料電池自動
車やハイブリッド車に搭載される、電池、流体制御機器、軽量化部品、熱マネジメント部品に対応した製品開発に
注力しております。車載用リチウムイオンバッテリーの熱暴走対策として、防爆弁と熱膨張耐火断熱材『フレガー
ド(R)』を上市するとともに、蓄積した熱マネジメント技術を応用し、データセンター向けの発熱対策・難燃材料な
ど新たな用途開発にも取り組んでおります。さらに、次世代燃料として期待される水素、アンモニア、e-fuel、バ
イオ燃料(アルコール燃料含む)に加え、新たな低環境負荷燃料であるrDME(再生ジメチルエーテル)について
も、その使用環境に対応した耐溶解性・耐劣化性を有する材料開発を推進しております。また、住宅設備機器事業
では、永く安定して機能部品を供給してきた実績を背景に、環境負荷の少ないエネルギーに対応した製品の開発
や、サステナビリティを志向した新材料の開発、ゴムと樹脂等の複合品開発を促進し、新たな価値創造を図ってお
ります。さらには災害対策分野にも注力し、火災被害を抑制する熱膨張断熱材料や非常用マグネシウム空気電池な
ど、くらしの安全・安心に貢献する製品を展開しております。今後も、自動車分野で培った材料技術や熱制御技術
を基盤に、エネルギー・インフラ分野を含む新たな市場への展開を進めてまいります。
制御機器部門では、精密な流体制御を要する半導体製造装置向け機器や医療機器向け製品の拡充に取組んでおり
ます。半導体分野では、エアベアリングやダイヤフラム方式を軸に新たな精密シリンダや、広い温度範囲で使用で
きる特殊シリンダについて開発を進めており、これらの要素機器にソフト技術を加え、位置や荷重を精密に制御す
るユニット製品の標準品開発に取り組んでおります。また、半導体製造に使用される各種ガス・液体を精密制御す
る機器の開発にも力を入れております。その他、高い精度を要求される大型金属加工品の内製化及び大型ユニット
製品の開発を進めており、お客様の利便性に寄与する製品及びユニット開発を進めてまいります。バイオ医薬品製
造プロセスで需要が高まるシングルユース製品の構成部材においては、これまでの開発成果をもとに本格的な市場
投入を進めております。さらに、最先端の生命維持管理装置等に使用される次世代コンポーネントについては、医
療機器メーカーとの共同開発を深化させてリソースの最適化を図るとともに、外部リソースの活用やアライアンス
も視野に入れ、開発の加速化を推進しております。
当セグメントにかかる研究開発費は1,060百万円であります。
17/97
EDINET提出書類
藤倉コンポジット株式会社(E01094)
有価証券報告書
(2) 引布加工品
引布部門では、当社の基盤技術で強みである特殊機械設備を駆使した加工技術と、繊維やゴム配合の材料技術、
これらを組み合わせた複合化技術を主軸に高機能ゴムシート及びゴム引布の開発を行っております。特に厚さ0.1〜
0.3mmの極薄ゴムシートや耐熱材料を用いたゴム引布は、医療、自動車、半導体、建築材料分野など幅広い分野で
採用されております。近年では、自動車の電動化や半導体需要の拡大を背景に、高機能材料に対する要求が高まっ
ており、当社においても高付加価値製品の開発を推進しております。
加工品部門では、引布部門で製造されたゴム引布を主材料とし、高度な設計・製造技術を活用した高機能加工製
品を展開しております。なかでも、世界市場でシェアを有する救命いかだを代表とする救命設備関連製品について
は、海上安全や防災意識の高まりを背景に、機能向上に注力しております。国内向けでは、小型船舶等に対する安
全設備の義務化に対応した改良型内部収容型救命浮器の設計・開発が完了し、生産及び出荷を開始しております。
産業資材関連分野では、希少ガスであるヘリウムや窒素、SF6、バイオガス(メタン)、二酸化炭素、アルゴン、ブ
タンを再利用、回収するために一時貯蔵するガスバッグを展開しております。これらの製品は、カーボンニュート
ラル・環境負荷低減への対応を背景として需要が拡大しており、エネルギー関連分野や物流分野など、多様な市場
要求に対応した製品開発に取り組んでおります。
当セグメントにかかる研究開発費は148百万円であります。
(3) スポーツ用品
ゴルフ用カーボンシャフト部門では、米国モデル『VENTUS』シリーズ及び日本モデル『SPEEDER NX』シリーズを
中核製品として、グローバルに展開しております。これらの製品は、米国PGAツアーならびに国内男女主要ツアーに
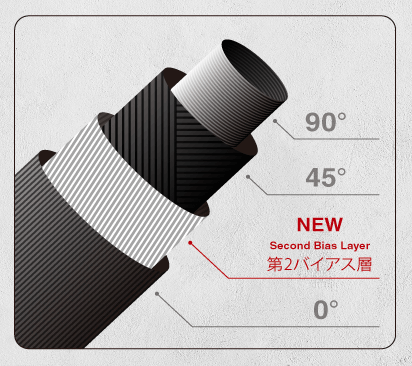
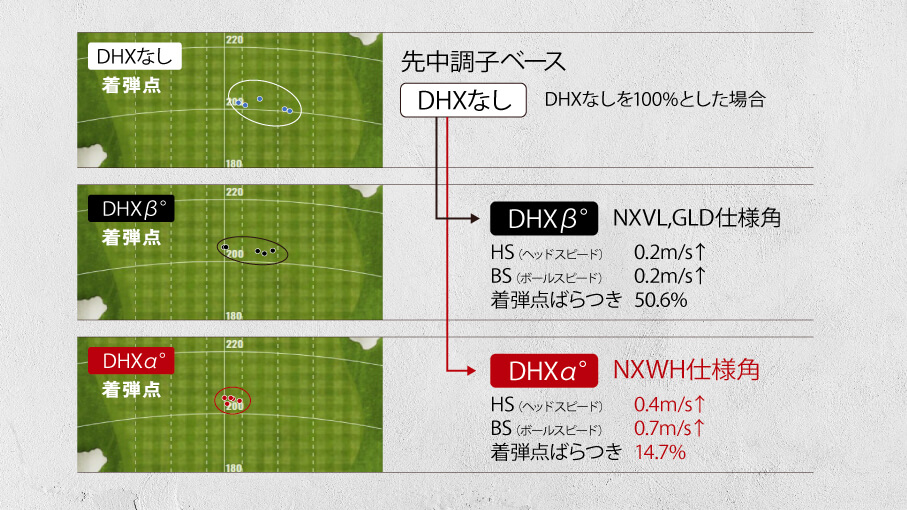
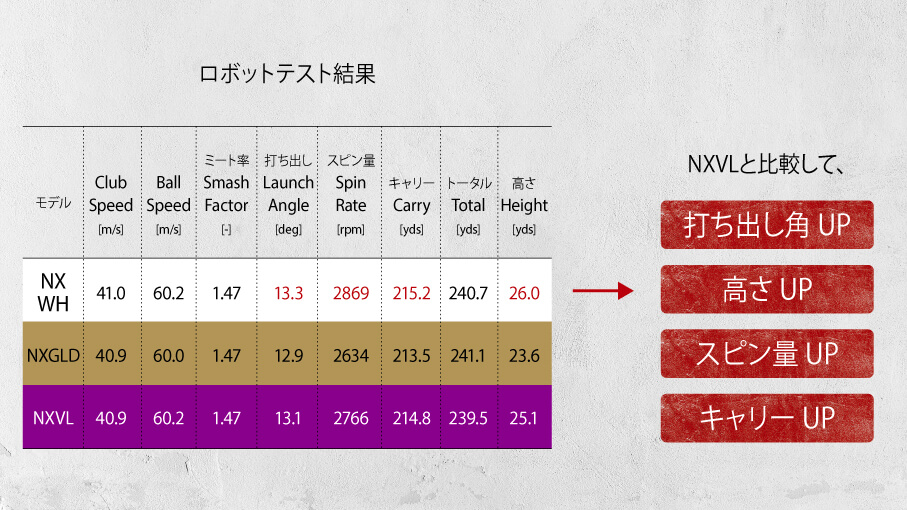
おいてそれぞれ使用率No.1を獲得するなど、高い市場評価を得ております。『SPEEDER NX』シリーズは、最新の設
計テクノロジー『DHX(R)』の採用により、ヘッドスピード向上を通じた飛距離性能の向上を実現しております。一
方、『VENTUS』シリーズでは、インパクト時のエネルギーロス低減を目的とした『VeloCoreテクノロジー』をさら
に高度化した『VeloCore Plusテクノロジー』を展開し、競技志向のゴルファーを中心に評価を拡大しております。
カーボンアイアンシャフト分野においては、2025年にモデルチェンジを実施したメタルコンポジットアイアン
シャフト『MCI』が市場で支持を獲得しております。また、2023年に発売した薄肉ゴムシートを複合した『TRAVIL』
と合わせ、カーボンアイアンのアフターマーケット領域における市場拡大に寄与しております。これらの製品は、
当社の事業理念であります「設計技術」「複合化技術」「加工技術」を融合し開発されたものであり、50g台から
100g台まで一貫した振り心地を実現する設計により、幅広い顧客層への対応を可能としております。
当社のコア技術は、各種カーボンプリプレグを活用した設計技術に加え、金属複合化特許技術及びゴム複合化技
術を組み合わせた異素材の複合・接合技術にあります。さらに、自社開発の三次元モーションキャプチャシステム
『enso(R)』を活用し、シャフト挙動がスイングに与える影響を定量的に解析することで、製品開発の高度化を進め
ております。2026年中には、既存の屋外テストフィールドに加えインドア環境への導入を拡大し、開発プロセスの
効率化及び高度化を図る計画です。
加えて、ゴルフシャフトで培った技術を応用し、CFRP(炭素繊維強化プラスチック)製品の産業用途への展開も推
進しております。高強度・高剛性と軽量性を兼ね備えるCFRP技術に加え、優れた振動減衰特性を有するゴム複合化
技術を組み合わせることで、軽量化、防振、熱マネジメントといったニーズに対応した高機能部品の供給を行って
おります。
当セグメントにかかる研究開発費は284百万円であります。
(4) その他
該当事項はありません。
18/97
EDINET提出書類
藤倉コンポジット株式会社(E01094)
有価証券報告書
第3 【設備の状況】
1 【設備投資等の概要】
当社グループは、長期的に成長が期待できる分野を中心に研究開発、生産性向上、自動化、省人化、合理化及び信
頼性向上を目的とした設備投資を継続的に実施しております。
当連結会計年度の設備投資の総額は1,771百万円であり、その主なものは、産業用資材セグメントにおける、当社小
高工場の生産設備の新設であります。
2 【主要な設備の状況】
当社グループにおける主要な設備は、次のとおりであります。
(1) 提出会社
2026年3月31日現在
(単位 : 千円)
事業所名
(所在地)
セグメント
の名称
帳簿価額
設備の内容
建物及び
構築物
機械装置
土地
リース資産
及び運搬具 (面積千㎡)
その他
合計
従業員数
(人)
岩槻工場
(さいたま市岩槻区)
産業用資材
引布加工品
産業用資材、
引布加工品
生産設備
400,307
553,024
1,560,652
(51.6)
[2.2]
21,546
207,764
2,743,295
264
[96]
原町工場
(福島県南相馬市)
産業用資材
産業用資材
生産設備
887,165
703,086
206,983
(29.1)
[16.5]
―
64,762
1,862,175
207
[58]
小高工場
(福島県南相馬市)
産業用資材
スポーツ用品
産業用資材、
スポーツ用品
生産設備
1,614,912
709,983
0
(137.6)
4,024
441,629
2,770,549
64
[22]
加須工場
(埼玉県加須市)
産業用資材
産業用資材
生産設備
414,534
218,160
812,031
(28.8)
―
34,872
1,479,599
98
[27]
その他設備
345,375
―
―
12,016
10,869
368,261
110
[22]
本社
(東京都品川区)
―
(2) 国内子会社
2026年3月31日現在
(単位 : 千円)
帳簿価額
会社名
(所在地)
セグメント
の名称
設備の内容
㈱キャラバン
(東京都豊島区)他
スポーツ用品
スポーツ用品
の仕入販売設
備
208,488
0
331,792
(12.2)
―
5,187
545,468
33
[1]
藤栄運輸㈱
(さいたま市岩槻区)
その他
保管運搬設備
104
70,749
3,772
(1.7)
―
1,651
76,277
41
[2]
建物及び
構築物
機械装置
土地
リース資産
及び運搬具 (面積千㎡)
19/97
その他
合計
従業員数
(人)
EDINET提出書類
藤倉コンポジット株式会社(E01094)
有価証券報告書
(3) 在外子会社
2026年3月31日現在
(単位 : 千円)
帳簿価額
会社名
(所在地)
セグメント
の名称
設備の内容
Fujikura
Composite
America,Inc.
(米国カリフォルニ
ア州)
スポーツ用品
スポーツ用品
の仕入販売設
備
189,658
7,985
杭州藤倉橡膠有限
公司(中国浙江省)
産業用資材
産業用資材
生産設備
9,111
234,639
産業用資材
引布加工品
スポーツ用品
産業用資材、
引布加工品、
スポーツ用品
生産設備
734,367
136,233
産業用資材
産業用資材
生産設備
214,160
246,063
産業用資材
産業用資材
生産設備
918,618
328,619
FUJIKURA
COMPOSITES
HAIPHONG,INC.
(ベトナム
ハイフォン市)
IER Fujikura,Inc.
(米国オハイオ州)
安吉藤倉橡膠有限
公司(中国浙江省)
建物及び
構築物
機械装置
土地
リース資産
及び運搬具 (面積千㎡)
―
―
[12.2]
―
[43.2]
64,659
(26.3)
―
[66.7]
従業員数
(人)
その他
合計
―
19,692
217,336
25
[8]
6,251
78,511
328,514
317
[9]
―
5,814
876,416
769
[―]
―
60,641
585,525
72
[8]
4,636
41,911
1,293,785
252
[4]
(注) 1 現在休止中の主要な設備はありません。
2 建物及び土地の一部を賃借しております。年間賃借料は246,266千円であります。
なお、賃借している土地の面積は[ ]で外書をしております。
3 帳簿価額のうち「建物及び構築物」は、建物、建物付属設備、構築物及び資産除去債務に関する除去費用の
合計であります。
4 帳簿価額のうち「その他」は、工具器具及び備品及び建設仮勘定の合計であります。
5 上記、帳簿価額には使用権資産は含まれておりません。
6 従業員数の[ ]は、年間平均人員の臨時従業員数を外書しております。
3 【設備の新設、除却等の計画】
該当事項はありません。
20/97
EDINET提出書類
藤倉コンポジット株式会社(E01094)
有価証券報告書
第4 【提出会社の状況】
1 【株式等の状況】
(1) 【株式の総数等】
① 【株式の総数】
種類
発行可能株式総数(株)
普通株式
90,000,000
計
90,000,000
② 【発行済株式】
事業年度末現在
発行数(株)
(2026年3月31日)
提出日現在
発行数(株)
(2026年6月24日)
普通株式
20,074,968
20,074,968
東京証券取引所
プライム市場
計
20,074,968
20,074,968
―
種類
上場金融商品取引所名又は
登録認可金融商品取引業協会名
内容
単元株式数100株
―
(2) 【新株予約権等の状況】
① 【ストックオプション制度の内容】
該当事項はありません。
② 【ライツプランの内容】
該当事項はありません。
③ 【その他の新株予約権等の状況】
該当事項はありません。
(3) 【行使価額修正条項付新株予約権付社債券等の行使状況等】
該当事項はありません。
(4) 【発行済株式総数、資本金等の推移】
年月日
発行済株式
総数増減数
(株)
発行済株式
総数残高
(株)
資本金増減額
(千円)
資本金残高
(千円)
資本準備金
増減額
(千円)
資本準備金
残高
(千円)
2025年11月28日
△3,371,241
20,074,968
―
3,804,298
―
3,207,390
(注) 2025年11月10日開催の取締役会決議により、自己株式を消却いたしました。
21/97
EDINET提出書類
藤倉コンポジット株式会社(E01094)
有価証券報告書
(5) 【所有者別状況】
2026年3月31日現在
株式の状況(1単元の株式数100株)
区分
政府及び
地方公共
団体
金融機関
金融商品
取引業者
その他の
法人
外国法人等
個人以外
個人
個人
その他
計
単元未満
株式の状況
(株)
株主数
―
10
25
127
81
49
13,507
13,799
―
(人)
所有株式数
―
37,626
3,132
26,440
52,828
136
80,070
200,232
51,768
(単元)
所有株式数
―
18.791
1.564
13.204
26.383
0.067
39.988
100.0
―
の割合(%)
(注)1 自己株式349,734株は「個人その他」に3,497単元、「単元未満株式の状況」に34株含まれております。
2 上記「その他の法人」には、証券保管振替機構名義の株式30単元が含まれております。
3 「株式付与ESOP信託」の信託財産として日本マスタートラスト信託銀行株式会社(株式付与ESOP信託口・
80014口)が保有する当社株式872,172株は、「金融機関」に8,721単元、「単元未満株式の状況」に72株含
まれております。「役員向け株式交付信託」の信託財産として株式会社日本カストディ銀行(信託口)が保
有する当社株式34,600株は、「金融機関」に346単元含まれております。
(6) 【大株主の状況】
氏名又は名称
2026年3月31日現在
発行済株式
(自己株式を
所有株式数
除く。)の
(株)
総数に対する
所有株式数
の割合(%)
住所
日本マスタートラスト信託銀行
株式会社(信託口)
NOMURA PB NOMINESS LIMITED
OBNIBUS-MARGIN (CASHPB)(常任
代理人野村證券株式会社)
東京都港区赤坂1−8−1
ティAIR
株式会社フジクラ
赤坂インターシ
1,871,000
9.49
1 ANGEL LANE, LONDON, EC4R 3AB,
UNITED KINGDOM
1,535,100
7.78
東京都江東区木場1−5−1
1,000,000
5.07
872,172
4.42
55 PATERSON RD #02-02 PATERSON SUITES
SINGAPORE 238550
762,600
3.87
藤倉化成株式会社
東京都板橋区蓮根3−20−7
569,840
2.89
藤倉航装株式会社
東京都品川区荏原2−4−46
515,210
2.61
60 LIVINGSTON AVE ST. PAUL, MN 55107
U.S.A
500,900
2.54
東京都中央区晴海1−8−12
493,800
2.50
484,329
2.46
8,604,951
43.63
日本マスタートラスト信託銀行
株式会社 ( 株式付与 ESOP 信託
口・80014口)
MURAKAMI TAKAT
ERU(常任代理人三田証券
株式会社)
US BANK NATIONAL ASSOCIATION
JP ACCTS TS(常任代理人株式
会社三菱UFJ銀行)
株式会社日本カストディ銀行(信
託口)
藤倉コンポジット従業員持株会
計
(注)
東京都港区赤坂1−8−1
ティAIR
赤坂インターシ
東京都品川区西五反田8−4−13
Pビルディング
−
五反田J
1 上記のほか当社保有の自己株式349,734株があります。
2 2026年3月25日付で公衆の縦覧に供されている大量保有報告書において、ひびき・パース・アドバイザー
ズ・エスピーシーが2026年3月25日現在で以下の株式を所有している旨が記載されているものの、当社と
して2026年3月31日現在における実質所有株式数の確認ができませんでしたので、上記大株主の状況には
含めておりません。なお、大量保有報告書の内容は以下のとおりであります。
22/97
EDINET提出書類
藤倉コンポジット株式会社(E01094)
有価証券報告書
氏名又は名称
住所
保有株券等の割合(株)
ケイマン諸島、KY1-1104、
グランド・ケイマン島、ア
グランド・ハウス、私書箱
ひびき・パース・アドバイ 309番
ザーズ・エスピーシー
(PO Box 309, Ugland House,
Grand Cayman, KY1-1104,
Cayman Islands)
株券等保有割合(%)
1,488,400
7.41
(7) 【議決権の状況】
① 【発行済株式】
2026年3月31日現在
区分
株式数(株)
議決権の数(個)
内容
無議決権株式
―
―
―
議決権制限株式(自己株式等)
―
―
―
議決権制限株式(その他)
―
―
―
完全議決権株式(自己株式等)
(自己保有株式)
普通株式
349,700
―
―
完全議決権株式(その他)
普通株式 19,673,500
単元未満株式
普通株式
196,735
51,768
―
発行済株式総数
20,074,968
―
総株主の議決権
―
―
1単元(100株)未満の株式
―
196,735
―
(注) 1
「完全議決権株式(その他)」の欄には証券保管振替機構名義の株式が3,000株含まれております。また、
「議決権の数」欄には、同機構名義の完全議決権株式に係る議決権の数30個が含まれております。
2 「単元未満株式」欄の普通株式には、当社所有の自己株式34株が含まれております。
3 「完全議決権株式(その他)」欄の普通株式には、「株式付与ESOP信託」の信託財産として日本マスタート
ラスト信託銀行株式会社(株式付与ESOP信託口・80014口)が保有する株式872,100株(議決権の数8,721
個)が含まれております。「役員向け株式交付信託」の信託財産として株式会社日本カストディ銀行(信託
口)が保有する株式34,600株(議決権の数346個)が含まれております。
4 「単元未満株式」欄の普通株式には、「株式付与ESOP信託」の信託財産として日本マスタートラスト信託銀
行株式会社(株式付与ESOP信託口・80014口)が保有する株式72株が含まれております。
② 【自己株式等】
自己名義
所有株式数
(株)
他人名義
所有株式数
(株)
2026年3月31日現在
発行済株式
所有株式数
総数に対する所
の合計
有株式数
(株)
の割合(%)
所有者の氏名
又は名称
所有者の住所
藤倉コンポジット株式会社
東京都品川区西五反田八
丁目4番13号五反田JP
ビルディング
349,700
―
349,700
1.74
計
―
349,700
―
349,700
1.74
(注)1 上記自己保有株式には、単元未満株式34株は含まれておりません。
2 日本マスタートラスト信託銀行株式会社(株式付与ESOP信託口・80014口)が保有する当社株式872,172株
及び株式会社日本カストディ銀行(信託口)が保有する株式34,600株は含まれておりません。
(8) 【役員・従業員株式所有制度の内容】
①
従業員インセンティブ・プラン「株式付与ESOP信託」
イ.
株式付与ESOP信託の概要
当社は、当社従業員への帰属意識の醸成と経営参画意識を持たせ、中長期的な業績向上や株価上昇に対する
意識を高めることにより、中長期的な企業価値向上を図ることを目的として、従業員インセンティブ・プラン
「株式付与ESOP信託」を導入しています。
株式付与ESOP(Employee Stock Ownership Plan)信託(以下、「ESOP信託」といいます。)とは、米国の
23/97
EDINET提出書類
藤倉コンポジット株式会社(E01094)
有価証券報告書
ESOP制度を参考にした従業員インセンティブ・プランであり、ESOP信託が取得した当社株式を、予め定める株
式交付規定に基づき、一定の要件を充足する従業員に交付するものです。なお、当該信託が取得する当社株式
の取得資金は全額当社が拠出するため、従業員の負担はありません。
本制度の導入により、従業員は当社株式の株価上昇による経済的な利益を収受することができるため、株価
を意識した従業員の業務遂行を促すとともに、従業員の勤労意欲を高める効果が期待できます。また、ESOP信
託の信託財産に属する当社株式に係る議決権行使は、受益者候補である従業員の意思が反映される仕組みであ
り、従業員の経営参画を促す企業価値向上プランとして有効です。
ロ.
従業員に取得させる予定の株式の総数
2024年2月13日開催の取締役会決議により293,836株を拠出及び2025年11月10日開催の取締役会により追加拠
出が決議されたため、当社が保有する自己株式より594,300株を拠出しております。
ハ.
当該従業員株式所有制度による受益権その他の権利を受けることができる者の範囲
当社従業員のうち受益者要件を充足する者
②
役員向け株式交付信託
イ.
取締役等に対する株式報酬制度の概要
当社は、取締役(監査等委員である取締役及び社外取締役を除く)の報酬と当社の株式価値との連動性をよ
り明確にし、取締役が株価の変動による利益・リスクを株主の皆様と共有することで、中長期的な業績の向上
と企業価値の増大に貢献する意識を高めることを目的とし、信託を用いた株式報酬制度を導入しています。
本制度は、当社が金銭を拠出することにより設定する信託が当社株式を取得し、当社が当該取締役に付与す
るポイントの数に相当する数の当社株式が信託を通じて当該取締役に対して交付される、という株式報酬制度
です。本制度に基づく当社株式の交付は、2026年3月末日で終了する事業年度から2028年3月末日で終了する
事業年度までの3事業年度の間に在任する取締役に対して行います。なお、取締役が当社株式の交付を受ける
時は、原則として取締役の退任時です。
ロ.
取締役等に取得させる予定の株式の総数
1事業年度あたり45,300ポイントを上限とします。
ハ.
当該従業員株式所有制度による受益権その他の権利を受けることができる者の範囲
取締役のうち受益者要件を満たす者
24/97
EDINET提出書類
藤倉コンポジット株式会社(E01094)
有価証券報告書
2 【自己株式の取得等の状況】
【株式の種類等】
会社法第155条第3号及び会社法第155条第7号による普通株式の取得
(1) 【株主総会決議による取得の状況】
該当事項はありません。
(2) 【取締役会決議による取得の状況】
会社法第165条第3項の規定により読み替えて適用される同法第156条の規定にもとづく取得
区分
株式数(株)
取締役会(2025年12月25日)での決議状況
(取得期間2026年1月5日〜2026年7月31日)
価額の総額(円)
1,300,000
2,000,000,000
―
―
当事業年度における取得自己株式
349,600
830,537,579
残存決議株式の総数及び価額の総額
950,400
1,169,462,421
73.11
58.47
当期間における取得自己株式
248,800
624,067,584
提出日現在の未行使割合(%)
53.97
27.27
当事業年度前における取得自己株式
当事業年度の末日現在の未行使割合(%)
(注)
当期間とは、当事業年度の末日の翌日から有価証券報告書提出日までの期間であります。当期間における取得
自己株式には、2026年6月1日からこの有価証券報告書提出日までに取得した株式は含まれておりません。
(3) 【株主総会決議又は取締役会決議に基づかないものの内容】
区分
株式数(株)
価額の総額(円)
当事業年度における取得自己株式
239
491,706
当期間における取得自己株式
―
―
(注)
当期間とは、当事業年度の末日の翌日から有価証券報告書提出日までの期間であります。当期間における取得
自己株式には、2026年6月1日からこの有価証券報告書提出日までの単元未満株式の買取りによる株式は含ま
れておりません。
(4) 【取得自己株式の処理状況及び保有状況】
当事業年度
区分
処分価額の総額
(円)
株式数(株)
引き受ける者の募集を行った
取得自己株式
消却の処分を行った取得自己株式
合併、株式交換、株式交付、
会社分割に係る移転を行った
取得自己株式
その他(従業員ESOP信託及び役員向け
株式交付信託への自己株式処分)
保有自己株式数
(注) 1
2
当期間
処分価額の総額
(円)
株式数(株)
―
―
―
―
3,371,241
4,723,125,209
―
―
―
―
―
―
628,900
1,209,374,700
―
―
349,734
―
598,534
―
当期間とは、当事業年度の末日の翌日から有価証券報告書提出日までの期間であります。当期間における保
有自己株式数には、2026年6月1日からこの有価証券報告書提出日までに取得した株式及び単元未満株式の
買取りによる株式は含まれておりません。
日本マスタートラスト信託銀行株式会社(株式付与ESOP信託口・80014口)が保有する当社株式872,172株及
び株式会社日本カストディ銀行(信託口)が保有する株式34,600株は上記保有自己株式数には含めておりま
せん。
25/97
EDINET提出書類
藤倉コンポジット株式会社(E01094)
有価証券報告書
3 【配当政策】
当社グループは株主の皆様への利益還元について、以下のとおり定めております。
(1)株主資本配当率
株主資本配当率(DOE)4.0%以上を目途とし配当を実施します。安定的・継続的な配当という観点から一株当
たり年間配当額は54円を下限とします。
(2)配当
中間配当と期末配当の年2回の剰余金の配当を行います。
(3)自己株式取得
自己株式の取得については、市場環境や資本効率等を勘案し適切な時期に機動的に実施いたします。
(4)株主優待
日頃よりご支援・ご理解賜っております株主の皆様への感謝の気持ちを込めて、引き続き株主優待制度を実施
してまいります。現在当社はゴルフシャフトのリシャフト及びアウトドア用品をそれぞれ優待販売しておりま
す。また、500株以上を3年以上保有の株主様を対象に、長期保有優待制度を実施しております。
これらの剰余金の配当の決定機関は、期末配当については株主総会、中間配当については取締役会となってお
ります。当事業年度の配当金については、上記方針に基づき1株につき中間配当として33円、期末配当として43
円とすることを2026年6月25日開催予定の第147回定時株主総会で決議する予定であります。
内部留保資金の使途については、今後の事業展開への備え、設備投資資金及び研究開発費用として投入してい
く予定であります。
その結果、連結純資産配当率は、3.9%となる予定です。
当社は、「取締役会の決議により毎年9月30日を基準日として中間配当をすることができる。」旨を定款に定
めております。
なお、当事業年度に係る剰余金の配当は以下のとおりです。
決議年月日
配当金の総額(千円)
2025年11月10日
取締役会決議
2026年6月25日
定時株主総会決議(予定)
1株当たり配当額(円)
641,720
33
848,185
43
4 【コーポレート・ガバナンスの状況等】
(1) 【コーポレート・ガバナンスの概要】
①
コーポレート・ガバナンスに関する基本的な考え方
多様な価値観を有するステークホルダーとの適切、かつ継続的な協力関係のもとで、中長期にわたって企業を
存続させ、価値を持続的に向上させていく上でのコーポレート・ガバナンスの重要性については、当社において
も認識しており、当社及び子会社からなる企業集団(以下、「当社グループ」という。)は、経営理念、事業理
念、定款、「FUJIKURA
COMPOSITES コーポレート・ガバナンス方針」、CSR・コンプライアンスについての行動
規範である「FUJIKURA
COMPOSITES 行動規範」を柱として、コーポレート・ガバナンスの充実に努め、公正で健
全な経営、適正・迅速な意思決定と事業の運営、ステークホルダーとの良好な関係、法令順守を進めてまいりま
した。引き続き、当社グループの規模と性質に適した迅速な意思決定、取締役会から権限を移譲された業務執行
者によるきめ細かな業務執行、事業の別や取締役・監査等委員といった職務の枠にとらわれない幅広い観点から
の業務状況の把握と監督、一層の経営資源の有効活用といった形で経営の効率性、透明性を高めてまいります。
②
企業統治の体制の概要及び当該体制を採用する理由
当社は、取締役の職務執行の監査等を担う監査等委員を取締役会の構成員とすることにより、取締役会の監督
機能を強化することで、より一層のコーポレート・ガバナンスの充実を図るとともに、取締役会が業務執行の決
定権限を取締役に委任することが可能となることで、経営の意思決定の迅速化を図り、更なる企業価値の向上を
目指すため、2023年6月29日開催の定時株主総会における承認を得て、監査役会設置会社から監査等委員会設置
会社へ移行いたしました。
有価証券報告書提出日現在、当社は、会社の規模等に鑑み取締役(監査等委員である取締役を除く。)4名及
び監査等委員である取締役4名を選任しております。
そのうち、社外取締役(監査等委員である取締役を除く。)は1名、監査等委員である社外取締役は3名であ
ります。
26/97
EDINET提出書類
藤倉コンポジット株式会社(E01094)
有価証券報告書
取締役会は、代表取締役社長執行役員である森田健司氏を議長として原則月1回定期的に開催しており、監査
等委員である取締役も出席しております。取締役(監査等委員である取締役を除く。)は経営及び内部統制の基
本方針に基づき、また法令及び定款に違反なきよう審議しております。職責が異なる取締役(監査等委員である
取締役を除く。)と監査等委員である取締役は、それぞれの立場から経営のチェックを行っております。
監査等委員会は、4名で構成されており、監査等委員4名の内3名は社外取締役であります。常勤監査等委員
の髙橋秀剛氏を中心に、取締役会における議決権を有する事により、監視・監督機能を充実・強化し、経営の透
明性・公平性を高めております。
指名報酬諮問委員会は、取締役(監査等委員である取締役を除く。)の選任や報酬等について審議し、取締役
会に答申を行うことで、指名・報酬のプロセスの客観性を高めます。
なお当社は、2026年6月25日開催予定の定時株主総会の議案(決議事項)として「取締役(監査等委員である
取締役を除く。)4名選任の件」及び「監査等委員である取締役1名選任の件」を提案しており、当該議案が承
認可決された場合の各構成員の氏名及び社外役員の状況については後記「(2)役員の状況」をご参照ください。
・当社のコーポレート・ガバナンス体制の模式図は次のとおりであります。
会計監査人については、2026年6月25日開催予定の第147回定時株主総会にて太陽有限責任監査法人が留任する
予定です。総会終了後に監査契約を結び、正しい経営情報を提供し、公正不偏な立場から監査が実施される環境
を整備する予定であります。
顧問弁護士には、法律上の判断を必要とする場合に適時アドバイスを受けております。
③
企業統治に関するその他の事項
・内部統制に関する基本的な考え方及びその整備状況
内部統制システムは、企業の存続と価値の向上に重要であり、当社グループの状況に即して、業務の効率性・
透明性・公正性において適切なシステムの構築と運用に努めており、現在の当社グループの内部統制システムの
状況は以下のとおりであります。
イ.
取締役及び使用人の職務が効率的に行われることを確保するための体制及び当社及び子会社から成る企業集
団の業務の適正を確保するための体制
a.効率的な事業体制
当社グループの業務の執行にあたっては、内部統制の基本方針に基づいて予め定められた職務権限及び妥
27/97
EDINET提出書類
藤倉コンポジット株式会社(E01094)
有価証券報告書
当な意思決定ルールを規定して各部門(グループ会社含む。)に権限を委譲し、各責任者は経営の方針及び計
画等に従って事業計画を策定し、その権限に基づいて実施します。
業務執行にあたって生じる設備投資・要員の異動については、取締役会で決定した基本方針に基づいて、
常勤取締役と重要な各部門の責任者が構成する経営会議において、取締役会で決定した内部統制の基本方
針、経営方針及び計画等に則し、全社的な観点から詳細かつ充分に検討して決定します。
目標を明確にし、効率のよい事業運営を行うため、予算管理規定に基づき全社及び各事業の年度予算を定
め、それに基づいた業績管理を徹底しており、事業ヒアリング(四半期)、経営会議(月次)等を通じて、常
時、状況を把握し、必要な修正を加えます。
b.妥当性、透明性、公正性を確保しつつ、意思決定における積極的なリスクテイクと効率的で適正な業務執
行を可能とする体制
・取締役会等における付議事項(決議事項及び報告事項)、職務権限と業務分掌の明確化を行う。
・業務執行取締役の業績評価、報酬決定、候補指名など特に妥当性、透明性、公正性に配慮する必要があ
る事項の決定に際しては、指名報酬諮問委員会へ諮問、協議する。
・取締役会の有効性について定期的な評価を行う。
・監査等委員以外の社外取締役に対し、適切な職務執行に必要な体制を整備し、支援を行う。
ロ.
資産の保全が適正に行われるための体制
当社グループにおける資産の取得、使用及び処分は、当社及びグループ会社の社内規定に定める手続及び承
認の下に実施されております。また、適切なリスク管理によって顕在化した、または、予見される損失に対し
て、資産への影響を限定しております。
ハ.
情報の保存及び管理に関する体制
当社グループにおける取締役の職務執行に係る情報(電子情報を含む。)の保存及び管理は、社内規定に定め
られた方法で行います。
ニ.
損失の危険の管理に係る体制
当社グループでは、事業リスク、災害リスク、品質・環境リスク、安全衛生リスク、不正リスク等リスクの
種類に応じて設ける管掌部門及び専門委員会がリスクを内包する部門と協力してリスクの継続的な識別、分
析、評価、対応策の検討及び検証を行うほか、グループ全体にかかる重要なリスクの継続的な識別、分析、評
価、対応策の検討及び検証を社長直轄であるサステナビリティ統括室内のリスク機会マネジメントチームの管
理下において、リスク管理をグループ横断的かつ統合的に行っております。
ホ.
取締役及び使用人の職務の執行が法令及び定款に適合することを確保するための体制
a.「FUJIKURA COMPOSITES 行動規範」
当社グループにおける法令及び社会倫理の遵守の柱として「FUJIKURA COMPOSITES 行動規範」を制定し、
これを全役職員が遵守することとしており、これを基礎としてコンプライアンス体制を構築しております。
b.コンプライアンス推進委員会
取締役を委員長とするコンプライアンス推進委員会を置き、「FUJIKURA COMPOSITES 行動規範」に基づい
て、グループ横断的なコンプライアンス体制の整備と問題点の把握、コンプライアンス上のリスクの分析・
評価、再発防止策の立案にあたっております。
c.複線的な内部通報経路
内部通報制度により複線的な情報伝達経路を定めており、外部の弁護士事務所の他、社内においては代表
取締役社長執行役員、常勤監査等委員、管理本部統括、コンプライアンス推進委員長、人事総務部長、各事
業所を管掌する人事担当チームの責任者、健康管理室員、労働組合委員長の中から通報者の意思により選択
して、職制を経由しない直接的情報伝達が可能となっております。
また、当社及び当社グループに重要な影響を及ぼす、またはその懼れのある内部通報による情報は、コン
プライアンス推進委員長に加え、それ以外の監査等委員以外の取締役・監査等委員である取締役のいずれか
らも取締役会への報告事項となっております。
d.モニタリング
内部監査室は子会社の内部監査室と連携し、コンプライアンス体制の整備・運用の状況を監査して内部統
制の有効性を評価し、必要に応じて是正を要求するとともに、是正処置による有効性の回復を確認します。
ヘ.
財務報告の信頼性を確保するための体制
内部統制室を設置し、当社グループの内部統制の整備と運用を統一的かつ網羅的に進め、企業会計審議会の
「財務報告に係る内部統制の評価及び監査の基準並びに財務報告に係る内部統制の評価及び監査に関する実施
基準の改訂について」等内部統制の実施基準に定めるところに沿って体制を整備しております。
ト.
監査等委員会を補助する使用人に関する体制
監査等委員会は管理本部統括の所属員に監査等委員会の事務を補助させることができます。またこれとは別にそ
28/97
EDINET提出書類
藤倉コンポジット株式会社(E01094)
有価証券報告書
の職務の執行に必要な場合、監査等委員以外の取締役から独立して監査等委員会の指揮下で監査業務の補助を行
うための補助者を要請できるものとしております。
監査等委員会が補助者を要請した場合、当社は監査等委員会と協議の上、補助者となる外部専門家・従業員
等の人選、契約条件・監査等委員会を補助している間の補助者の処遇等を決定します。
チ.
前項の使用人の監査等委員以外の取締役からの独立性に関する事項
前項の補助者の選任・解任・処遇の変更等は、監査等委員会と協議の上、決定します。
リ.
監査等委員会を補助する使用人に対する指示の実効性の確保に関する事項
選任された補助者は、監査等委員会の直接の指揮下におき、その指示によりその職務を行います。
ヌ.
取締役及び使用人が監査等委員会に報告するための体制その他の監査等委員会への報告に関する体制及び子
会社の取締役、監査役、使用人から報告を受けた者が監査等委員会に報告するための体制
監査等委員は取締役会その他重要な会議に出席し、当社及びグループ会社の取締役及び重要な使用人から事
業に影響する重要事項について報告を受けます。取締役及び使用人は、監査等委員の要請に応じて、経営上の
重要事項の報告を行います。
また、内部通報規程において、通報内容と調査結果の監査等委員会への報告が規定されているほか、窓口と
して直接情報提供を受け、自ら調査し、取締役会規程に基づき、取締役会へ報告、是正措置を勧告できる体制
となっております。
ル.
前項で報告した者が、報告したことを理由として不利な取扱いを受けないことを確保するための体制
内部通報規程における通報者保護に準じて取り扱います。
ヲ.
監査等委員の職務の執行(監査等委員会の職務の執行に関するものに限る。)について生ずる費用の前払ま
たは償還の手続その他の当該職務の執行について生ずる費用または債務の処理に係る方針に関する事項
当社においては、監査等委員の請求に基づき、費用及び債務の全額を負担します。
ワ.
その他監査等委員会の監査が実効的に行われることを確保するための体制
監査等委員会は、取締役及び会計監査人と定期的な会合を持ち意見交換を行うほか、グループ会社を含む当
該責任者等に直接ヒアリングを行う等、監査の強化を図っております。また、必要に応じて、会計監査人、内
部監査部門、その他外部の専門家と連携して情報の収集と監査内容の充実に努めるとともに、内部監査部門に
指揮命令を行います。
カ.
反社会的勢力排除に係る体制
当社は、自らの企業価値を守り、当社の社会的責任を果たす観点から反社会的勢力との関係遮断を
「FUJIKURA COMPOSITES 行動規範」に規定し、人事総務部を対応統括部署として、地域の警察と連絡を取りな
がら、従業員への研修、契約書モデルへの反社会的勢力排除条項の追加等、被害予防体制の強化を進めており
ます。
29/97
EDINET提出書類
藤倉コンポジット株式会社(E01094)
有価証券報告書
④
取締役会の活動状況
当事業年度において当社は取締役会を原則月1回開催しており、個々の取締役の出席状況については次のとお
りであります。
役職名
氏名
取締役会開催回数
出席回数
代表取締役社長執行役員
森田
健司
16回
16回
取締役執行役員
渡邊
貴史
16回
16回
取締役執行役員
樋口
昭康
16回
16回
社外取締役
長浜
洋一
16回
15回
取締役常勤監査等委員
髙橋
秀剛
16回
16回
社外取締役監査等委員
細井
和昭
16回
16回
社外取締役監査等委員
田中
響子
16回
16回
社外取締役監査等委員
鶴見
真利子
16回
16回
取締役会においては、経営上重要な事項について審議を行うとともに、業務執行に関する事項について適時、
適切に報告を行っております。
⑤
取締役の定数
当社の取締役(監査等委員である取締役を除く。)は8名以内、監査等委員である取締役は5名以内とする旨
を定款に定めております。
⑥
取締役の選任の決議要件
当社は、取締役の選任決議について、議決権を行使することができる株主の議決権の3分の1以上を有する株
主が出席し、その議決権の過半数をもって行う旨を定款に定めております。また、取締役の選任決議は、累積投
票によらないものとする旨を定款に定めております。
⑦
株主総会決議事項を取締役会で決議することができることとした事項
イ.
自己の株式の取得の決定要件
当社は、会社法第165条第2項の規定により、取締役会決議によって自己の株式を取得することができる旨定
款に定めております。これは、機動的な自己の株式の取得を可能にすることを目的とするものであります。
ロ.
中間配当の決定機関
当社は、取締役会の決議によって、毎年9月30日を基準日として中間配当をすることができる旨定款に定め
ております。これは、株主への機動的な利益還元を行うことを目的とするものであります。
⑧
株主総会の特別決議要件
当社は、会社法第309条第2項に定める株主総会の特別決議要件について、議決権を行使することができる株主
の議決権の3分の1以上を有する株主が出席し、その議決権の3分の2以上をもって行う旨定款に定めておりま
す。これは、株主総会における特別決議の定足数を緩和することにより、株主総会の円滑な運営を行うことを目
的とするものであります。
⑨
取締役の責任免除
当社は、会社法第426条第1項の規定により、取締役会の決議をもって同法第423条第1項の行為に関する取締
役(取締役であった者を含む。)の責任を法令の限度において免除することができる旨定款に定めております。こ
れは、取締役が職務を遂行するにあたり、その能力を十分に発揮して、期待される役割を果たしうる環境を整備
することを目的とするものであります。
なお、監査等委員会設置会社への移行に伴い、取締役会の決議によって、第144回定時株主総会終結前の行為に
関する監査役(監査役であった者を含む。)の責任を法令の限度において免除することができる旨の経過措置を
定款に定めております。
⑩
役員等賠償責任保険契約の内容の概要
当社は、会社法第430条の3第1項に規定する役員等賠償責任保険契約を保険会社との間で締結しています。当
該役員等賠償責任保険契約の被保険者の範囲は、当社及び当社子会社の取締役、監査役及び当該従業員であり、
その保険料の全額を当社が負担しております。
当該保険契約により、被保険者がその業務執行に起因して法律上負担することとなる損害賠償金及び訴訟費用
が填補されることとなります。
なお、当該保険契約は、役員等の職務執行の適正性が損なわれないようにする措置のため、被保険者による犯
罪行為等に起因する損害等については補填されず、被保険者である役員等の自己負担としております。
30/97
EDINET提出書類
藤倉コンポジット株式会社(E01094)
有価証券報告書
(2) 【役員の状況】
①
役員一覧
a.2026年6月24日(有価証券報告書提出日)現在の当社の役員の状況は、以下のとおりであります。
男性6名
女性
役職名
2名
(役員のうち女性の比率25%)
氏名
生年月日
略歴
1981年4月
2008年4月
2016年4月
当社入社
当社管理本部長
同経理部長
大阪支店長
当社取締役
当社管理本部長
同経理部長
内部統制室長
当社管理本部長
同人事総務部長
内部統制室長
当社常務取締役
営業本部長
大阪支店長
当社代表取締役社長
2024年4月
当社代表取締役社長執行役員(現)
1993年4月
当社入社
2016年4月
2021年4月
当社営業本部スポーツ用品営業部
(現ACP事業部営業部)長
当社先端複合材事業部(現ACP事業
部)長
Fujikura Composite America,Inc. CEO
2022年5月
Fujikura Composite America,Inc.
2008年6月
2010年4月
代表取締役
社長執行役員
森田
健司
1958年5月30日生
2011年4月
2012年4月
2020年4月
取締役執行役員
兼事業部統括
兼引布加工品事業部長
渡邊
貴史
1971年2月25日生
2023年4月
2023年6月
2024年4月
2025年4月
1994年4月
取締役執行役員
兼管理本部統括
兼同情報セキュリティ推
進室長
樋口
昭康
1973年12月6日生
2014年4月
2019年4月
2023年4月
当社執行役員
2024年6月
当社取締役執行役員(現)
2025年4月
当社管理本部統括(現)
同情報セキュリティ推進室長(現)
当社管理本部統括知的財産室長
2025年6月
1973年4月
社外取締役
長浜
洋一
1950年1月1日生
2003年6月
2006年4月
2009年4月
2016年4月
2018年6月
2019年6月
2019年8月
31/97
所有株式数
(株)
(注)3
97,800
(注)3
8,012
(注)3
15,973
(注)3
1,000
会長
当社副事業部統括
当社取締役
当社取締役執行役員(現)
事業部統括(現)
当社引布加工品事業部長(現)
当社入社
FUJIKURA COMPOSITES HAIPHONG,
INC.取締役社長
IER Fujikura Inc. CTO
当社経営企画室長
2007年4月
任期
藤倉電線株式会社
(現株式会社フジクラ)入社
同社取締役
同社取締役常務執行役員
同社代表取締役社長
同社代表取締役会長
同社相談役
藤倉化成株式会社社外取締役(現)
当社社外取締役(現)
EDINET提出書類
藤倉コンポジット株式会社(E01094)
有価証券報告書
役職名
氏名
生年月日
略歴
2000年4月
2015年4月
2015年6月
2017年4月
髙橋
秀剛
社外取締役
監査等委員
細井
田中
和昭
響子
1948年1月2日生
監査法人千代田事務所入所
公認会計士登録
新光監査法人社員
中央監査法人代表社員
税理士登録
細井会計事務所開業(現)
当社社外監査役
当社社外取締役(監査等委員)(現)
(注)4
―
2011年12月
弁護士登録(第一東京弁護士会)
阿部・田中法律事務所入所
当社監査役
(注)4
阿部・田中法律事務所共同経営弁護
士(現)
当社社外取締役(監査等委員)(現)
―
商工組合中央金庫(現株式会社商工
組合中央金庫)入庫
新日本監査法人(現EY新日本有限責
任監査法人)入所
公認会計士登録
鶴見真利子公認会計士事務所設立
(現)
株式会社カーセブンデジフィールド
(注)5
社外監査役
ユーソナー株式会社社外監査役
ユーソナー株式会社社外取締役(監
査等委員)
株式会社エーアンドエーマテリアル
社外監査役(現)
当社社外取締役(監査等委員)(現)
つみき監査法人社員(現)
―
2023年6月
1995年4月
2008年12月
2011年9月
2022年2月
社外取締役
監査等委員
鶴見
真利子
2022年9月
1971年6月22日生
2022年12月
2024年3月
2024年6月
2024年6月
2025年10月
計
(注) 1
2
3
4
5
6
34,615
1975年11月
1979年3月
1987年1月
1993年9月
2005年3月
2006年10月
2007年6月
2023年6月
2019年8月
2021年1月
1983年12月15日生
(注)4
当社入社
当社技術製造本部副本部長
同技術統括部長
加須工場長
当社取締役
2023年4月
2024年4月
2025年4月
2025年6月
1963年3月23日生
2021年4月
社外取締役
監査等委員
所有株式数
(株)
当社技術製造本部副本部長
同技術統括部長
当社技術製造本部副本部長
当社技術製造統括
事業開発統括部長
事業所統括部長
杭州藤倉橡膠有限公司董事長
安吉藤倉橡膠有限公司董事長
当社常務取締役
同管理本部統括
管理本部長
内部統制室長
当社サステナビリティ統括室長
当社取締役常務執行役員
当社取締役執行役員特命担当
当社取締役常勤監査等委員(現)
2019年4月
2020年4月
取締役
常勤監査等委員
任期
156,600
取締役長浜洋一氏、細井和昭氏、田中響子氏及び鶴見真利子氏は、社外取締役であります。
当社の監査等委員会の体制は次のとおりであります。
委員髙橋秀剛氏、委員細井和昭氏、委員田中響子氏、委員鶴見真利子氏
なお、髙橋秀剛氏は常勤の監査等委員です。情報収集その他監査の実効性を高め、監査・監督機能を強化す
るために、常勤の監査等委員を置いております。
任期につきましては、2025年6月26日開催の定時株主総会選任後1年以内に終了する事業年度のうち最終の
ものに関する定時株主総会の終結の時までとなっております。
任期につきましては、2025年6月26日開催の定時株主総会選任後2年以内に終了する事業年度のうち最終の
ものに関する定時株主総会の終結の時までとなっております。
任期につきましては、2024年6月27日開催の定時株主総会選任後2年以内に終了する事業年度のうち最終の
ものに関する定時株主総会の終結の時までとなっております。
取締役の金井浩一氏、弓削千賀志氏、植松克夫氏及び社外取締役の佐々木聡氏は2025年6月26日の定時株主
総会の終結を以って退任いたしました。
32/97
EDINET提出書類
藤倉コンポジット株式会社(E01094)
有価証券報告書
b.2026年6月25日開催予定の定時株主総会の議案(決議事項)として「取締役(監査等委員である取締役を除
く。)4名選任の件」及び「監査等委員である取締役1名選任の件」を提案しており、当該議案が承認可決され
ると当社の役員の状況は、以下のとおりとなる予定です。
なお、当該定時株主総会の直後に開催が予定されている取締役会の決議事項の内容(役職等)も含めて記載して
います。
男性6名
女性
2名
役職名
(役員のうち女性の比率25%)
氏名
生年月日
略歴
1981年4月
2008年4月
代表取締役
社長執行役員
森田
健司
1958年5月30日生
2008年6月
2010年4月
2011年4月
2012年4月
2016年4月
2024年4月
当社代表取締役社長執行役員
(現)
1993年4月
当社入社
2016年4月
2021年4月
当社営業本部スポーツ用品営業部
(現ACP事業部営業部)長
当社先端複合材事業部(現ACP事業
部)長
Fujikura Composite America,Inc. CEO
2022年5月
Fujikura Composite America,Inc.
2020年4月
常務取締役執行役員
事業部統括
同引布加工品事業部長
渡邊
貴史
1971年2月25日生
2023年6月
2024年4月
2025年4月
2026年6月
1994年4月
社外取締役
樋口
長浜
昭康
洋一
1973年12月6日生
2014年4月
2019年4月
2023年4月
当社執行役員
2024年6月
当社取締役執行役員
2025年4月
2025年6月
当社管理本部統括(現)
同情報セキュリティ推進室長(現)
当社知的財産室長
2026年6月
当社常務取締役執行役員(現)
1973年4月
藤倉電線株式会社
(現株式会社フジクラ)入社
同社取締役
同社取締役常務執行役員
同社代表取締役社長
同社代表取締役会長
同社相談役
藤倉化成株式会社社外取締役(現)
1950年1月1日生
2003年6月
2006年4月
2009年4月
2016年4月
2018年6月
2019年6月
2019年8月
33/97
所有株式数
(株)
(注)3
97,800
(注)3
8,012
(注)3
15,973
(注)3
1,000
会長
当社取締役
当社取締役執行役員
事業部統括(現)
当社引布加工品事業部長(現)
当社常務取締役執行役員(現)
当社入社
FUJIKURA COMPOSITES HAIPHONG,
INC.取締役社長
IER Fujikura Inc. CTO
当社経営企画室長
2007年4月
常務取締役執行役員
管理本部統括
同情報セキュリティ推進室長
当社入社
当社管理本部長
同経理部長
大阪支店長
当社取締役
当社内部統制室長
当社人事総務部長
当社常務取締役
同営業本部長
当社代表取締役社長
任期
当社社外取締役(現)
EDINET提出書類
藤倉コンポジット株式会社(E01094)
有価証券報告書
役職名
氏名
生年月日
略歴
2000年4月
2015年4月
2015年6月
2017年4月
髙橋
秀剛
社外取締役
監査等委員
細井
田中
和昭
響子
1948年1月2日生
監査法人千代田事務所入所
公認会計士登録
新光監査法人社員
中央監査法人代表社員
税理士登録
細井会計事務所開業(現)
当社社外監査役
当社社外取締役監査等委員(現)
(注)4
―
2011年12月
弁護士登録(第一東京弁護士会)
阿部・田中法律事務所入所
当社社外監査役
(注)4
阿部・田中法律事務所共同経営弁護
士(現)
当社社外取締役監査等委員(現)
―
商工組合中央金庫(現株式会社商工
組合中央金庫)入庫
新日本監査法人(現EY新日本有限責
任監査法人)入所
公認会計士登録
鶴見真利子公認会計士事務所設立
(現)
株式会社カーセブンデジフィールド
(注)5
社外監査役
ユーソナー株式会社社外監査役
ユーソナー株式会社社外取締役(監
査等委員)
株式会社エーアンドエーマテリアル
社外監査役(現)
当社社外取締役監査等委員(現)
つみき監査法人社員(現)
―
2023年6月
1995年4月
2008年12月
2011年9月
2022年2月
社外取締役
監査等委員
鶴見
真利子
2022年9月
1971年6月22日生
2022年12月
2024年3月
2024年6月
2024年6月
2025年10月
計
(注) 1
2
3
4
5
34,615
1975年11月
1979年3月
1987年1月
1993年9月
2005年3月
2006年10月
2007年6月
2023年6月
2019年8月
2021年1月
1983年12月15日生
(注)4
当社入社
当社技術製造本部副本部長
同技術統括部長
加須工場長
当社取締役
2023年4月
2024年4月
2025年4月
2025年6月
1963年3月23日生
2021年4月
社外取締役
監査等委員
所有株式数
(株)
当社技術製造本部副本部長
同技術統括部長
当社技術製造本部副本部長
当社技術製造統括
事業開発統括部長
事業所統括部長
杭州藤倉橡膠有限公司董事長
安吉藤倉橡膠有限公司董事長
当社常務取締役
管理本部統括兼管理本部長
内部統制室長
当社サステナビリティ統括室長
当社取締役常務執行役員
当社取締役執行役員特命担当
当社取締役常勤監査等委員(現)
2019年4月
2020年4月
取締役
常勤監査等委員
任期
156,600
取締役長浜洋一氏、細井和昭氏、田中響子氏及び鶴見真利子氏は、社外取締役であります。
当社の監査等委員会の体制は次のとおりであります。
委員髙橋秀剛氏、委員細井和昭氏、委員田中響子氏、委員鶴見真利子氏
なお、髙橋秀剛氏は常勤の監査等委員です。情報収集その他監査の実効性を高め、監査・監督機能を強化す
るために、常勤の監査等委員を置いております。
任期につきましては、2026年6月25日開催の定時株主総会選任後1年以内に終了する事業年度のうち最終の
ものに関する定時株主総会の終結の時までとなっております。
任期につきましては、2025年6月26日開催の定時株主総会選任後2年以内に終了する事業年度のうち最終の
ものに関する定時株主総会の終結の時までとなっております。
任期につきましては、2026年6月25日開催の定時株主総会選任後2年以内に終了する事業年度のうち最終の
ものに関する定時株主総会の終結の時までとなっております
34/97
EDINET提出書類
藤倉コンポジット株式会社(E01094)
有価証券報告書
②
社外役員の状況
2026年6月24日(有価証券報告書提出日)現在、当社の社外取締役は4名であります。
社外取締役長浜洋一氏は、当社に出資しており、所有株式数は1,000株であります。同氏は藤倉化成株式会社の
社外取締役でもあり、同社と当社はお互いに出資しあうとともに、製品売買の一般的商取引があります。
監査等委員である社外取締役細井和昭氏は、細井会計事務所の代表であります。当社と兼職先との間には特別
な関係はありません。
監査等委員である社外取締役田中響子氏は、阿部・田中法律事務所の共同経営弁護士であります。同所と当社
との間には法律顧問契約を締結しておりますが、その金額は2百万円であります。
監査等委員である社外取締役鶴見真利子氏は、鶴見真利子公認会計士事務所の代表であり、公認会計士の資格
を有する者であります。同所と当社との間に人的関係、資本的関係または取引関係その他利害関係はありませ
ん。同氏は株式会社エーアンドエーマテリアルの社外監査役及びつみき監査法人社員を兼任しておりますが、当
社との間には特別な利害関係はありません。
当社は、社外取締役を選任するための基準及び独立性の基準を定め、それに基づいて株主総会において選任さ
れた社外取締役は、当社の事業への理解の深さ、これまでの経験と実績を活かし、役員による相互監視や法令及
び定款に基づく社内規程に則した意思決定の徹底等と併せて、当社の意思決定の妥当性、公正性、透明性の向上
に寄与していると当社は考えております。
なお、当社における社外役員及び独立役員の選定基準の概要については、以下のとおりであります。
(社外役員選定基準)
・企業経営、または会計監査など専門的分野において、広い見識と十分な経験を有している。
・当社の業務を理解し、当社の意思決定や業務執行に関する客観的かつ経験に根差したご意見をいただける。
・親会社等の取締役、執行役等会社法における社外役員欠格者でない。
(独立役員選定基準)
東京証券取引所が定める独立性の要件及び当社が定める以下の基準に該当する場合を独立役員の適格者とす
る。
・当社の社外役員としての要件を満たしている。
・議決権10%以上(含間接保有)を保有している大株主(当該会社の取締役、監査役、会計参与、執行役、執行
役員を含む)でない。
・重要な取引関係(当社連結売上高の2%以上の取引が当社及び当社子会社との間にある場合をいう)のある
企業の業務執行取締役、執行役、執行役員でない。
・主要借入先の取締役、監査役、会計参与、執行役または執行役員でない。
・役員報酬以外に当社から多額(年額10百万円以上)の報酬を得ている公認会計士、税理士、弁護士、コンサ
ルタントまたは監査法人、税理士法人、法律事務所等(社員、パートナー、従業員等を含む)でない。
・以上の基準に該当する者の子会社、関連会社、親会社の大株主、それらの取締役、監査役、会計参与、執行
役、執行役員やその近親者(配偶者または二親等内の親族もしくは同居の親族)でない。
③
社外取締役による監督又は監査と内部監査、監査等委員会監査及び会計監査との相互連携並びに内部統制部門
との関係
社外取締役(監査等委員である取締役を除く。)と監査等委員である社外取締役は、取締役会において情報を
共有してその監督や監査の精度をより高めます。また、内部監査室が子会社を含む当社グループ全部門に対して
定期的に実施している内部監査に関する報告書は、代表取締役社長執行役員及び監査等委員会に対して提出いた
します。
35/97
EDINET提出書類
藤倉コンポジット株式会社(E01094)
有価証券報告書
(3) 【監査の状況】
①
監査等委員会監査の状況
(組織・人員)
当社は、2023年6月29日開催の第144回定時株主総会において定款の変更が決議されたことにより、同日付を
もって、監査役会設置会社から監査等委員会設置会社に移行いたしました。
監査等委員は、法律もしくは会計に関する高度な専門性、企業経営に関する高い見識を有する者を選定するこ
ととしております。
有価証券報告書提出日現在、当社の監査等委員会は4名であり、常勤の監査等委員である取締役1名と、非常
勤の監査等委員である社外取締役3名から構成されています。また、監査等委員である取締役の略歴について
は、「(2)役員の状況」を参照ください。
なお当社は、2026年6月25日開催予定の定時株主総会の議案(決議事項)として、「監査等委員である取締役
1名選任の件」を提案しており、当該議案が承認可決されますと、監査等委員会は引き続き4名の監査等委員
(うち3名は監査等委員である社外取締役)で構成されることになります。
・監査等委員である取締役細井和昭氏は、公認会計士・税理士の資格を有しており、財務及び会計に関する相当
程度の知見を有しております。
・監査等委員である取締役田中響子氏は、弁護士の資格を有しており、企業法務及びコンプライアンスに関する
相当程度の知見を有しております。
・監査等委員である取締役鶴見真利子氏は、公認会計士の資格を有しており、財務及び会計に関する相当程度の
知見を有しております。
(監査等委員会の活動状況)
a.監査等委員会の開催回数と出席状況
当事業年度においては、監査等委員会を18回開催しており、個々の出席状況は次の通りとなっております。
役職名
氏名
監査等委員会開催回数
出席回数(出席率)
取締役常勤監査等委員
髙橋
秀剛
18回
18回(100%)
社外取締役監査等委員
細井
和昭
18回
18回(100%)
社外取締役監査等委員
田中
響子
18回
18回(100%)
社外取締役監査等委員
鶴見
真利子
18回
18回(100%)
b.監査等委員会の主な活動及び具体的な検討事項
監査等委員会は年間を通じ、常勤監査等委員月次活動状況の報告、監査等委員会監査方針及び活動計画の立
案と年間活動の振り返り、監査等委員会監査報告書、取締役会議案の事前確認、会計監査人の監査計画等に関
して協議及び報告をいたしました。
c.監査等委員会の活動状況
監査等委員会監査の状況としては、年度監査計画を立案し、監査等委員会規程に則り監査を実施しておりま
す。具体的には、全監査等委員は取締役会に出席し、議事運営、決議内容等を監査し、必要に応じ意見表明を
行っています。また、常勤監査等委員については経営会議の他、コンプライアンス推進委員会、中央省エネ・
環境管理委員会、中央安全衛生委員会等の重要な委員会にも出席して意見を述べています。社外監査等委員は
工場巡視を行い、品質や製品に関する説明を受け個々の知見にもとづく提言や助言を行っています。
②
内部監査の状況
・独立した内部監査室(4名)が、当社グループの全部門に対して、定期的な内部監査を実施しております。ま
た、一部の連結子会社には個々に内部監査室を設置し、当社の内部監査室と連携して監査にあたっておりま
す。
・内部監査室は監査等委員会及び監査法人と常時密接に連絡を取って監査にあたるほか、監査等委員会と内部監
査室は互いの監査状況について適宜情報を交換します。また、内部監査室が子会社を含む当社グループ全部門
に対して定期的に実施している内部監査に関する報告書は、代表取締役社長執行役員及び監査等委員会に対し
て提出します。
・内部監査室から取締役会に対して直接報告を行う仕組みはありませんが、監査法人と監査等委員会及び代表取
締役社長執行役員との定期的なミーティングを行い、監査チェックの強化を図っております。
③
会計監査の状況
a.監査法人の名称
太陽有限責任監査法人
36/97
EDINET提出書類
藤倉コンポジット株式会社(E01094)
有価証券報告書
b.継続監査期間
2021年以降
c.業務を執行した公認会計士
和田
磨紀郎
堤
康
d.監査業務に係る補助者の構成
監査業務に係る補助者の構成は、公認会計士8名、その他16名となっております。
e.監査法人の選定方針と理由
「f.監査等委員会による監査法人の評価」において記載をしている内容をもとに選定を行っております。
f.監査等委員会による監査法人の評価
監査等委員会による監査法人の評価について、公益財団法人日本監査役協会会計委員会が公表した「会計監
査人の評価及び選定基準策定に関する監査役等の実務指針」を参考に評価しております。定期的に会計監査人
と情報交換し、会計監査人の業務遂行状況を確認しております。
監査等委員会は、会計監査人が会社法第340条第1項各号のいずれかに該当すると認めたときは、監査等委員
の全員の同意により、その会計監査人の解任の決定を行うものとしております。また、会計監査人の継続監査
年数を考慮して、監査等委員会の決議により、その会計監査人の解任または不再任を株主総会の目的とするこ
とを請求する決定を行うものとしております。
④
監査報酬の内容等
a.監査公認会計士等に対する報酬の内容
(単位:千円)
前連結会計年度
区分
監査証明業務に
基づく報酬
当連結会計年度
非監査業務に
基づく報酬
監査証明業務に
基づく報酬
非監査業務に
基づく報酬
提出会社
39,500
―
41,000
―
連結子会社
―
―
―
―
39,500
―
41,000
―
計
b. 監査公認会計士等と同一のネットワーク(Grant Thornton)に対する報酬(a.を除く)
(単位:千円)
前連結会計年度
区
分
監査証明業務に
基づく報酬
当連結会計年度
非監査業務に
基づく報酬
監査証明業務に
基づく報酬
非監査業務に
基づく報酬
提出会社
―
―
―
―
連結子会社
15,600
800
14,353
2,989
計
15,600
800
14,353
2,989
連結子会社における非監査業務の内容
(前連結会計年度)
FUJIKURA COMPOSITES HAIPHONG, INC.
国際税務に係る業務
(当連結会計年度)
FUJIKURA COMPOSITES HAIPHONG, INC.
国際税務に係る業務等
c.その他重要な監査証明業務に基づく報酬の内容
該当事項はありません。
d.監査報酬の決定方針
監査報酬を決定するにあたっての特段の方針は定めておりませんが、年間の監査計画に基づき見積書を精査
し、他社事例を参考にして監査報酬の額の妥当性を判断しております。
e.監査等委員会が会計監査人の報酬等に同意した理由
日本監査役協会が公表する「会計監査人との連携に関する実務指針」を踏まえ、前年度における監査の状況
及び当年度の監査計画の内容について確認を行い、監査時間及び監査報酬の見積もりの妥当性を検討した結
果、監査報酬等の額につき、会社法第399条第1項及び同条第4項の同意を行っております。
37/97
EDINET提出書類
藤倉コンポジット株式会社(E01094)
有価証券報告書
(4) 【役員の報酬等】
①
役員の報酬等の額又はその算出方法の決定の方針にかかる事項
当社は、2025年6月26日に行われました第146回定時株主総会において、「取締役に対する株式報酬等の額及び内
容決定の件」を決議いたしました。よって、2025年4月〜6月の役員報酬と、2025年7月以降の役員報酬で方針、
支払金額が異なっております。
2025年4月〜6月
a.
取締役報酬にかかる株主総会決議の内容
取締役(監査等委員である取締役を除く。)の報酬限度額は、2023年6月29日開催の第144回定時株主総会におい
て定額部分として年額300百万円以内(うち社外取締役分年額40百万円以内)、業績連動部分として220百万円以内
と決議されています(ただし、使用人分給与は含まない)。当該定時株主総会終結時点の取締役(監査等委員であ
る取締役を除く。)の員数は6名(うち社外取締役は2名)、終結後7名(うち社外取締役は2名)です。
また、監査等委員である取締役の報酬限度額は、2023年6月29日開催の第144回定時株主総会において年額60百万円
以内と決議されております。当該定時株主総会終結後の監査等委員である取締役は3名でした。
b.
金銭報酬の額又はその算定方法の決定方針
2024年3月27日開催の取締役会において決定された、取締役の個人別報酬の決定方針の概要は以下のとおりで
す。
取締役(監査等委員である取締役及び社外取締役を除く。)については、職位に応じた固定報酬を中心としつつ、
取締役の業績に対する意識の向上を目的として、連結当期純利益を指標として算出する業績連動報酬を設けてお
り、業績連動報酬は前年度の連結当期純利益の一定割合(全ての取締役に共通の係数を乗じ、さらに対象となる取
締役の職位に基づく係数の総和を乗じたもの)を総額として、取締役の職位に基づき配分しております。当社は、
業績連動報酬の40%を株式取得目的の報酬として位置づけ、原則として株式累積投資に拠出して当社の株式を取得
するために充てることとしており、投資家と株式価値の向上について一体感を保つためのインセンティブを与えて
おります。なお、社外取締役については、独立性を重視することから、固定報酬のみとしております。当社は、役
員の賞与および退職慰労金制度を廃止して年度報酬のみとし、年度支給額を12分割し毎月支給しております。
取締役(監査等委員である取締役を除く。)の個人別報酬の決定については、株主総会において決定された報酬
の限度額の範囲内で、取締役会が、任意の諮問機関である指名報酬諮問委員会(構成員の過半数は社外取締役)の
意見を徴することを条件に、当社代表取締役社長執行役員に委任することとしており、代表取締役社長執行役員は
個人別の報酬原案を作成し、指名報酬諮問委員会の答申を経て、個人別報酬を決定することとしております。
c.
非金銭報酬等の内容及びその額もしくは数又は算定方法の決定方針
非金銭報酬はありません。
d.
取締役の個人別の報酬等の決定についての委任に関する事項
取締役会は、指名報酬諮問委員会の意見を徴することを条件に、取締役の個人別報酬の決定を、会社全体の業
績・状況を俯瞰する立場にある代表取締役社長執行役員森田健司氏に委任しており、同氏は株主総会において決定
された報酬の限度額の範囲内で個人別の報酬原案を作成し、指名報酬諮問委員会の答申の結果を踏まえて、個人別
報酬を決定していることから、取締役会はその内容が決定方針に沿うものであると判断しております。
38/97
EDINET提出書類
藤倉コンポジット株式会社(E01094)
有価証券報告書
2025年7月以降
a.
取締役報酬にかかる株主総会決議の内容
2023年6月29日に株主総会で承認を受けた報酬枠とは別枠で、2025年6月26日の第146回定時株主総会において、
新たに信託を用いた株式報酬制度の導入について承認を受けております。制度の概要は以下のとおりです。
本制度の対象となった、第146回定時株主総会終結後の取締役(監査等委員である取締役を除く。)の人数は3名で
した。
当社取締役(監査等委員である取締役及び社外取締
役を除きます。)
2026年3月末日に終了する事業年度から2028年3月
末日に終了する事業年度まで
①
本制度の対象者
②
対象期間
③
②の対象期間3事業年度において、①の対象者に
交付するために必要な当社株式の取得資金として
当社が拠出する金銭の上限
合計金90百万円
④
当社株式の取得方法
自己株式の処分による方法又は取引所市場(立会外
取引を含みます。)から取得する方法
⑤
①の対象者に付与されるポイント総数の上限
1事業年度あたり45,300ポイント
⑥
取締役に付与される株式の数
1ポイントにつき当社株式1株を付与
⑦
ポイント付与基準
役位等に応じたポイントを付与
⑧
①の対象者に対する当社株式の交付時期
原則として退任時
b.
取締役の個人別の決定方針の内容の概要
2025年5月12日開催の取締役会において、第146回定時株主総会第4号議案「取締役に対する株式報酬等の額及び
内容決定の件」の承認可決を条件として、取締役(監査等委員である取締役を除く。)の個人別報酬の決定方針の
内容を変更することを決議しました。変更後の方針の概要は以下のとおりです。
イ.
金銭報酬等及び非金銭報酬等の内容及びその額もしくは数又は算定方法の決定方針
当社の取締役(社外取締役を除く。)の個人別の報酬は、役位ごとに定めた固定報酬及び業績連動報酬を金銭
で支給する。これらに加え、中長期的な業績の向上と企業価値の増大に貢献する意識を高めることを目的とし
て、株式交付信託を利用した株式報酬を支給する。業績連動報酬は、最終利益に対する取締役の意識の向上を目
的として前年度の連結当期純利益を指標として算出する。前年度の連結当期純利益に対して、全ての取締役に共
通する固定係数0.03を乗じ、さらに支給の対象となる取締役の役位ごとに定めた役位係数を乗じ、報酬額を決定
する。
株式報酬は、株式交付信託を利用し、株主総会において決定された内容及び別途取締役会において定める株式
交付規程に基づき、原則として当社が金銭を拠出することにより設定する信託が、当社株式を取得し、当社が対
象取締役の役位に応じて付与するポイントの数に相当する数の当社株式を、当該信託を通じて対象取締役に交付
する。
ロ.
報酬等の種類ごとの割合の決定方針
固定報酬・業績連動報酬・株式報酬の割合は、役位・業績等により変動するが、連結当期純利益38億円の場
合、固定報酬割合60〜70%、変動報酬(業績連動報酬および株式報酬)割合40〜30%を目安とする。変動報酬の
内訳は、業績連動報酬額の45%を株式報酬の目安とする。
当社の社外取締役の報酬は、独立性を重視することから、固定報酬のみを支給する。
ハ.
取締役に対し報酬等を与える時期又は条件の決定方針
報酬の支給時期については、金銭報酬(固定報酬および業績連動報酬)については、報酬の年間支給額を12分
割して、これを毎月支給する。非金銭報酬(株式報酬)は、対象となる取締役の在任時に役位等に応じたポイン
トを付与し、当該ポイントの数に応じた株式を、原則として退任時に交付する。
ニ.
取締役の個人別報酬の決定の委任に関する事項
取締役の個人別報酬の決定にあたっては、株主総会において決定された報酬の限度額の範囲内で、取締役会
が、任意の諮問機関である指名報酬諮問委員会の意見を徴することを条件に、当社代表取締役社長執行役員に個
人別報酬額の決定を委任するものとする。なお、指名報酬諮問委員会はその過半数を社外取締役で構成し、委員
長は社外取締役とする。
委任をする場合、代表取締役社長執行役員は、個人別報酬の原案を作成し、指名報酬諮問委員会の答申を経た
上で、個人別報酬を決定する。
39/97
EDINET提出書類
藤倉コンポジット株式会社(E01094)
有価証券報告書
c.
取締役の個人別の報酬等の決定についての委任に関する事項
取締役会は、指名報酬諮問委員会の意見を徴することを条件に、取締役の個人別報酬の決定を、会社全体の業
績・状況を俯瞰する立場にある代表取締役社長執行役員森田健司氏に委任しており、同氏は株主総会において決定
された報酬の限度額の範囲内で個人別の報酬原案を作成し、指名報酬諮問委員会の答申の結果を踏まえて、個人別
報酬を決定していることから、取締役会はその内容が決定方針に沿うものであると判断しております。
②
役員区分ごとの報酬等の総額、報酬等の種類別の総額及び対象となる役員の員数
役員区分
報酬等の種類別の総額(千円)
報酬等の総額
(千円)
取締役
(監査等委員及び社外取
締役を除く)
監査等委員
(社外取締役を除く)
社外役員
固定
報酬
業績連動
報酬
株式報酬
(非金銭報酬等)
対象となる
役員の員数
(名)
142,002
89,595
42,129
10,278
6
19,170
19,170
―
―
2
38,250
38,250
―
―
5
(注)1.対象となる役員の員数ならびに報酬等の総額には、当期中に退任した監査等委員でない取締役4名分及び監
査等委員である取締役1名分を含んでおります。
2.株式報酬欄に記載の金額は株式報酬制度に係る当事業年度中の株式給付引当金の当期繰入額であります。
③ 役員ごとの連結報酬等の総額等
連結報酬等の総額が1億円以上である者が存在しないため、記載しておりません。
(5) 【株式の保有状況】
①
投資株式の区分の基準及び考え方
当社は、保有目的が純投資目的である投資株式と純投資目的以外の目的である投資株式の区分について、当該
株式の保有で企業間の連携が企業価値向上に必要と考える場合に限り、純投資目的以外の目的である投資株式と
する方針です。
②
保有目的が純投資目的以外の目的である投資株式
a.保有方針及び保有の合理性を検証する方法並びに個別銘柄の保有の適否に関する取締役会等における検証
の内容
当社は、当該保有株式の保有の適否を個別に精査し、経済合理性の上から保有が適切でないと判断する場
合は当該保有株式の縮減を検討します。ただし、株式の保有目的が経済合理性による評価に適さない場合
は、他の適切な観点で判断することがあります。
b.銘柄数及び貸借対照表計上額
銘柄数
(銘柄)
貸借対照表計上額の
合計額(千円)
非上場株式
11
162,263
非上場株式以外の株式
15
4,121,089
(当事業年度において株式数が増加した銘柄)
銘柄数
(銘柄)
株式数の増加に係る取得
価額の合計額(千円)
非上場株式
1
99,960
非上場株式以外の株式
1
317
(当事業年度において株式数が減少した銘柄)
銘柄数
(銘柄)
株式数の減少に係る売却
価額の合計額(千円)
非上場株式
―
―
非上場株式以外の株式
―
―
40/97
株式数の増加の理由
資本業務提携による株式の取得
持株会加入による増加
EDINET提出書類
藤倉コンポジット株式会社(E01094)
有価証券報告書
c.特定投資株式及びみなし保有株式の銘柄ごとの株式数、貸借対照表計上額等に関する情報
特定投資株式
銘柄
当事業年度
前事業年度
株式数(株)
株式数(株)
貸借対照表計上額
(千円)
貸借対照表計上額
(千円)
㈱フジクラ
藤倉化成㈱
㈱三井住友フィナ
ンシャルグループ
MS&ADイン
シュアランスグ
ループホールディ
ングス㈱
㈱武蔵野銀行
660,000
110,000
2,699,400
593,780
606,500
606,500
694,442
310,528
37,800
37,800
189,226
143,451
38,700
38,700
156,038
124,807
55,428
18,476
115,456
60,231
55,000
55,000
100,980
115,280
㈱三菱UFJフィ
ナンシャル・グ
ループ
28,060
28,060
72,956
56,428
㈱りそなホール
ディングス
12,300
12,300
21,186
15,830
㈱めぶきフィナン
シャルグループ
14,157
14,157
16,889
10,273
102,000
102,000
16,034
14,759
愛三工業㈱
NTT㈱
㈱ニッキ
三井住友トラスト
グループ㈱
オカモト㈱
デンヨー㈱
㈱朝日ラバー
(注)1
3,530
3,412
15,959
8,700
2,580
2,580
12,647
9,597
800
800
4,744
4,048
1,000
1,000
3,430
2,440
2,000
2,000
1,698
1,132
保有目的、業務提携等の概要、
定量的な保有効果
及び株式数が増加した理由
関係の維持・強化(注)1
式数の増加
株式分割による株
当社の株
式の保有
の有無
有
関係の維持・強化(注)1
有
財務等に係る金融取引関係の維持・強化(注)
1
無
財務等に係る金融取引関係の維持・強化(注)
1
無
財務等に係る金融取引関係の維持・強化(注)
1 株式分割による株式数の増加
無
産業用資材における営業取引関係の維持・強
化(注)1
無
財務等に係る金融取引関係の維持・強化(注)
1
無
財務等に係る金融取引関係の維持・強化(注)
1
無
財務等に係る金融取引関係の維持・強化(注)
1
無
産業用資材における営業取引関係の維持・強
化(注)1
無
産業用資材における営業取引関係の維持・強
化。持株会加入による増加(注)1
無
財務等に係る金融取引関係の維持・強化(注)
1
無(注)2
関係の維持・強化(注)1
無
産業用資材における営業取引関係の維持・強
化。(注)1
無
引布加工品における営業取引関係の維持・強
化。(注)1
無
当社は、特定投資株式における定量的な保有効果の記載が困難であるため、保有の合理性を検証した方法に
ついて記載いたします。当社は、毎期、個別の政策保有株式について政策保有の意義を検証しております。
2
三井住友トラストグループ㈱は当社株式を保有しておりませんが、同社子会社である三井住友信託銀行㈱は
当社株式を保有しております。
みなし保有株式
該当事項はありません。
③
保有目的が純投資目的である投資株式
該当事項はありません。
④
当事業年度に投資株式の保有目的を純投資目的から純投資目的以外の目的に変更したもの
該当事項はありません。
⑤
当事業年度の前4事業年度及び当事業年度に投資株式の保有目的を純投資目的以外の目的から純投資目的に
変更したもの
該当事項はありません。
41/97
EDINET提出書類
藤倉コンポジット株式会社(E01094)
有価証券報告書
5 【従業員の状況等】
(1) 【人材戦略に関する基本方針等】
社員一人ひとりと、経営理念を共有し、多様な価値観・仲間・環境などの要素を掛け合わせることで相乗効果を生
み出します。
1901年の創業以来、当社の製品の原点は「働く人」です。当社で働く多様な人材が個々の能力を最大限発揮し、い
きいきと働き続けられる環境づくりを推進しています。働き甲斐のある職場を基盤に、人々の安心をささえる製品を
いつまでもお客様に提供し続けられるよう、ワークスタイルや人材教育などにおいて新たな制度の導入や現行制度の
見直しを行っています。
上記方針の実現に向け、当社では「人材育成・キャリア支援」「エンゲージメント向上・評価」「ダイバーシ
ティ&インクルージョン」の3つの軸から具体的な取組みを行っております。
人材育成とキャリア支援におきましては、社員の自律的な成長と次世代の経営人材育成を目的として、職位ごとに
求められる専門知識およびスキルの体系的な習得を支援する階層別・目的別研修を実施しております。また、組織の
壁を越えた連携と次世代リーダーの育成を推進する部門横断型研修の実施に加え、海外派遣をはじめとする経験機会
の提供により、グローバルに活躍できる人材の育成と積極的な組織改革に努めております。
エンゲージメント向上と評価・報酬制度におきましては、社員が働きがいを感じ、中長期的な企業価値向上にコ
ミットできる環境を整備しております。定期的にエンゲージメント調査を実施し、組織の現状を可視化、定量的に把
握した上で具体的な改善策の策定・実行に繋げているほか、評価制度の見直しに伴い、会社の成長と個人の報償を連
動させる新たな分配制度として従業員株式報酬制度を導入いたしました。さらに、従業員持株会における奨励金比率
の引き上げなどを通じた資産形成の促進や、ウェブサービス等のデジタルツールを活用した心身の健康増進など、働
きやすい職場環境と健康経営の両立を図っております。
ダイバーシティ&インクルージョンにおきましては、多様な価値観を掛け合わせる組織づくりを推進するため、女
性社員のキャリア形成および登用を積極的に推進するとともに、育児や介護などライフステージの変化に直面した社
員がキャリアを中断することなく働けるよう、短時間勤務制度や各種休暇制度をはじめとする両立支援制度の拡充を
図っております。加えて、特例子会社の有効活用を通じて、障がい者雇用制度の拡充と誰もが能力を発揮できる適材
適所の雇用環境の整備を進めております。
(2) 【従業員の状況】
①
連結会社の状況
2026年3月31日現在
セグメントの名称
従業員数(人)
1,642
〔206〕
125
引布加工品
〔10〕
410
スポーツ用品
〔31〕
41
その他
〔2〕
34
全社(共通)
〔8〕
2,252
合計
〔257〕
(注)1 従業員数は就業人員であり、臨時従業員数は〔〕内に年間の平均人員を外数で記載しております。
2 臨時従業員には、季節工、パートタイマー及び嘱託契約の従業員を含み、派遣社員は除いております。
3 全社(共通)として記載されている従業員数は、管理部門に所属しているものであります。
産業用資材
42/97
EDINET提出書類
藤倉コンポジット株式会社(E01094)
有価証券報告書
②
提出会社の状況
従業員数(人)
平均年齢(歳)
743〔225〕
平均勤続年数(年)
平均年間給与(円)
15.6
5,679,960
42.1
セグメントの名称
2026年3月31日現在
平均年間給与の対前
事業年度増減率(%)
△3.5
従業員数(人)
535
〔185〕
83
引布加工品
〔10〕
91
スポーツ用品
〔22〕
その他
〔-〕
34
全社(共通)
〔8〕
743
合計
〔225〕
(注) 1 従業員数は就業人員であり、臨時従業員数は〔〕内に年間の平均人員を外数で記載しております。
2 臨時従業員には、季節工、パートタイマー及び嘱託契約の従業員を含み、派遣社員は除いております。
3 平均年間給与は、賞与及び基準外賃金を含んでおります。
4 全社(共通)として記載されている従業員数は、管理部門に所属しているものであります。
産業用資材
③
労働組合の状況
国内における当社グループには、藤倉コンポジット労働組合が組織(組合員数673人)されており、日本ゴム産業労
働組合連合に属しております。労使関係は、概ね良好であります。
④
管理職に占める女性労働者の割合、男性労働者の育児休業取得率及び労働者の男女の賃金の差異
a. 提出会社
当事業年度
管理職に占める
女性労働者の割合(%)
(注)1
男性労働者の
育児休業取得率(%)
(注)2
2.0
50.0
労働者の男女の賃金の差異(%)(注)1、3
全労働者
正規雇用労働者
65.1
66.8
パート・
有期労働者
71.7
(注) 1「女性の職業生活における活躍の推進に関する法律」(2015年法律第64号)の規定に基づき算出したものであ
ります。
2「育児休業、介護休業等育児又は家族介護を行う労働者の福祉に関する法律」(1991年法律第76号)の規定に
基づき、「育児休業、介護休業等育児又は家族介護を行う労働者の福祉に関する法律施行規則」(1991年労
働省令第25号)第71条の6第1号における育児休業等の取得割合を算出したものであります。
3 男女の賃金格差については、男性の賃金に対する女性の賃金の割合を示しております。なお、同一労働の賃
金に差はなく、等級別人員構成の差によるものであります。
b. 連結子会社
連結子会社は、「女性の職業生活における活躍の推進に関する法律」(2015年法律第64号)及び「育児休業、介
護休業等育児又は家族介護を行う労働者の福祉に関する法律」(1991年法律第76号)の規定による公表義務の対象
ではないため、記載を省略しております。
⑤
使用人その他の従業員のみを対象とした役員・従業員株式所有制度の内容
当社は使用人その他の従業員のみを対象とした役員・従業員株式所有制度を導入しております。当該役員・従業
員株式所有制度の内容については「1
株式等の状況
(8) 役員・従業員株式所有制度の内容」に記載しておりま
す。
43/97
EDINET提出書類
藤倉コンポジット株式会社(E01094)
有価証券報告書
第5 【経理の状況】
1
連結財務諸表及び財務諸表の作成方法について
(1) 当社の連結財務諸表は、「連結財務諸表の用語、様式及び作成方法に関する規則」(昭和51年大蔵省令第28号)に
基づいて作成しております。
(2) 当社の財務諸表は、「財務諸表等の用語、様式及び作成方法に関する規則」(昭和38年大蔵省令第59号。以下「財
務諸表等規則」という。)に基づいて作成しております。
また、当社は、特例財務諸表提出会社に該当し、財務諸表等規則第127条の規定により財務諸表を作成しておりま
す。
2
監査証明について
当社は、金融商品取引法第193条の2第1項の規定に基づき、連結会計年度(2025年4月1日から2026年3月31日ま
で)の連結財務諸表及び事業年度(2025年4月1日から2026年3月31日まで)の財務諸表について、太陽有限責任監査法
人による監査を受けております。
3
連結財務諸表等の適正性を確保するための特段の取組について
当社は、連結財務諸表等の適正性を確保するための特段の取組を行っております。具体的には、会計基準等の内容
を適切に把握し、会計基準等の変更等について的確に対応することができる体制を整備するため、公益財団法人財務
会計基準機構へ加入し、適宜セミナーに参加しております。
44/97
EDINET提出書類
藤倉コンポジット株式会社(E01094)
有価証券報告書
1 【連結財務諸表等】
(1) 【連結財務諸表】
① 【連結貸借対照表】
(単位:千円)
前連結会計年度
(2025年3月31日)
資産の部
流動資産
現金及び預金
受取手形及び売掛金
電子記録債権
商品及び製品
仕掛品
原材料及び貯蔵品
その他
貸倒引当金
流動資産合計
固定資産
有形固定資産
建物及び構築物
減価償却累計額
建物及び構築物(純額)
機械装置及び運搬具
減価償却累計額
機械装置及び運搬具(純額)
土地
建設仮勘定
その他
減価償却累計額
その他(純額)
有形固定資産合計
無形固定資産
ソフトウエア
その他
無形固定資産合計
投資その他の資産
投資有価証券
長期貸付金
退職給付に係る資産
繰延税金資産
その他
貸倒引当金
※1
45/97
※1
11,879,001
6,691,593
3,273,335
4,077,248
2,857,882
968,377
567,075
△32,620
3,697,752
3,442,836
2,598,735
691,798
888,287
△20,464
29,973,548
29,869,541
14,527,592
△9,735,869
16,040,127
△10,082,305
4,791,722
5,957,822
16,738,393
△13,835,046
17,321,339
△14,091,851
2,903,346
3,229,487
3,066,470
2,149,964
5,137,390
△4,103,821
3,065,801
296,904
5,335,770
△4,116,584
1,033,569
13,945,072
1,219,185
13,769,200
192,284
115,706
164,582
286,973
307,991
451,556
※2
投資その他の資産合計
固定資産合計
資産合計
10,877,895
7,384,354
当連結会計年度
(2026年3月31日)
1,810,453
※2
4,560,214
223,900
854,834
143,104
2,247,104
△1,678,035
213,136
1,116,812
97,656
2,238,211
△1,626,186
3,601,361
17,854,425
47,827,974
6,599,844
20,820,601
50,690,143
EDINET提出書類
藤倉コンポジット株式会社(E01094)
有価証券報告書
(単位:千円)
前連結会計年度
(2025年3月31日)
負債の部
流動負債
買掛金
電子記録債務
1年内返済予定の長期借入金
未払法人税等
賞与引当金
事業撤退損失引当金
製品自主回収関連損失引当金
資産除去債務
その他
流動負債合計
固定負債
長期借入金
リース債務
繰延税金負債
環境対策引当金
製品自主回収関連損失引当金
株式給付引当金
役員株式給付引当金
退職給付に係る負債
資産除去債務
その他
固定負債合計
負債合計
純資産の部
株主資本
資本金
資本剰余金
利益剰余金
自己株式
株主資本合計
その他の包括利益累計額
その他有価証券評価差額金
為替換算調整勘定
退職給付に係る調整累計額
その他の包括利益累計額合計
純資産合計
負債純資産合計
1,863,583
1,195,805
※3
800,000
1,673,462
597,707
※3
800,000
267,108
556,230
15,234
252,700
60,000
2,913,577
170,244
516,761
―
207,666
―
2,280,284
7,924,239
6,246,126
※3
46/97
当連結会計年度
(2026年3月31日)
2,800,000
※3
2,000,000
450,135
605,308
9,283
201,700
201,155
―
726,156
424,254
51,902
577,252
1,555,136
9,283
134,700
352,283
10,278
718,008
430,478
51,982
5,469,897
13,394,136
5,839,404
12,085,530
3,804,298
3,455,379
28,612,960
△6,010,364
3,804,298
3,207,390
27,292,681
△2,430,252
29,862,274
31,874,118
730,000
3,386,459
455,102
2,542,217
3,564,474
623,802
4,571,562
34,433,837
47,827,974
6,730,494
38,604,612
50,690,143
EDINET提出書類
藤倉コンポジット株式会社(E01094)
有価証券報告書
② 【連結損益及び包括利益計算書】
売上高
売上原価
売上総利益
販売費及び一般管理費
荷造運送費
広告宣伝費
給料及び手当
福利厚生費
旅費及び通信費
減価償却費
保管賃借料
研究開発費
貸倒引当金繰入額
その他
販売費及び一般管理費合計
営業利益
営業外収益
受取利息
受取配当金
為替差益
受取賃貸料
受取補償金
その他
営業外収益合計
営業外費用
支払利息
シンジケートローン手数料
為替差損
賃貸収入原価
固定資産除却損
補償関連費用
その他
営業外費用合計
経常利益
特別利益
投資有価証券売却益
事業撤退損失引当金戻入額
補助金収入
関係会社清算益
特別利益合計
特別損失
固定資産廃棄損
減損損失
製品自主回収関連損失引当金繰入額
特別損失合計
税金等調整前当期純利益
法人税、住民税及び事業税
法人税等調整額
法人税等合計
当期純利益
前連結会計年度
(自 2024年4月1日
至 2025年3月31日)
※1
40,611,211
※2,※3
28,068,508
(単位:千円)
当連結会計年度
(自 2025年4月1日
至 2026年3月31日)
※1
40,238,809
※2,※3
27,709,296
12,542,703
12,529,512
562,025
911,915
2,788,749
635,325
271,374
203,590
320,944
※3
525,650
499,335
859,174
2,712,264
626,511
265,307
182,938
345,880
※3
509,196
1,680
1,699,929
745
1,689,655
7,921,186
4,621,517
7,691,010
4,838,502
83,406
165,617
7,680
13,423
―
142,788
74,933
138,144
―
14,158
40,242
177,984
412,916
445,463
39,260
70,666
―
2,124
4,258
50,858
1,000
8,901
2,102
29,935
※4
―
63,025
33,450
53,337
179,335
4,855,098
179,585
5,104,379
512,954
52,101
22,001
―
―
―
163,087
※7
5,339
587,057
168,427
※5
※6
※8
※9
※10
※4
159,231
93,552
454,400
※9
―
39,258
―
707,183
4,734,971
39,258
5,233,548
1,239,162
△240,005
1,178,172
67,895
999,156
3,735,814
1,246,067
3,987,481
(単位:千円)
47/97
EDINET提出書類
藤倉コンポジット株式会社(E01094)
有価証券報告書
前連結会計年度
(自 2024年4月1日
至 2025年3月31日)
(内訳)
親会社株主に帰属する当期純利益
その他の包括利益
その他有価証券評価差額金
為替換算調整勘定
退職給付に係る調整額
その他の包括利益合計
包括利益
(内訳)
親会社株主に係る包括利益
※11
48/97
当連結会計年度
(自 2025年4月1日
至 2026年3月31日)
3,735,814
3,987,481
△11,241
1,125,770
124,266
1,238,795
1,812,216
178,014
168,700
2,158,931
※11
4,974,610
6,146,412
4,974,610
6,146,412
EDINET提出書類
藤倉コンポジット株式会社(E01094)
有価証券報告書
③ 【連結株主資本等変動計算書】
前連結会計年度(自
2024年4月1日
至
2025年3月31日)
(単位:千円)
株主資本
資本金
当期首残高
会計方針の変更によ
る累積的影響額
会計方針の変更を反映
した当期首残高
資本剰余金
3,804,298
利益剰余金
3,455,379
26,487,403
自己株式
△413,427
△167,362
3,804,298
3,455,379
26,320,040
株主資本合計
33,333,654
△167,362
△413,427
33,166,291
当期変動額
剰余金の配当
親会社株主に帰属す
る当期純利益
△1,442,894
△1,442,894
3,735,814
3,735,814
自己株式の取得
△5,604,051
△5,604,051
自己株式の処分
7,113
7,113
自己株式の消却
―
利益剰余金から資本
剰余金への振替
連結子会社の清算に
よる増減
株主資本以外の項目
の当期変動額(純
額)
当期変動額合計
当期末残高
―
―
―
―
2,292,920
△5,596,937
△3,304,017
3,804,298
3,455,379
28,612,960
△6,010,364
29,862,274
その他の包括利益累計額
その他有価証券
評価差額金
当期首残高
会計方針の変更によ
る累積的影響額
会計方針の変更を反映
した当期首残高
741,242
為替換算調整勘定
退職給付に係る
調整累計額
2,093,327
330,835
167,362
741,242
2,260,689
330,835
その他の
包括利益
累計額合計
純資産合計
3,165,404
36,499,059
167,362
―
3,332,767
36,499,059
当期変動額
剰余金の配当
△1,442,894
親会社株主に帰属す
る当期純利益
3,735,814
自己株式の取得
△5,604,051
自己株式の処分
7,113
自己株式の消却
―
利益剰余金から資本
剰余金への振替
連結子会社の清算に
よる増減
株主資本以外の項目
の当期変動額(純
額)
―
―
△11,241
1,125,770
124,266
1,238,795
1,238,795
当期変動額合計
△11,241
1,125,770
124,266
1,238,795
△2,065,221
当期末残高
730,000
3,386,459
455,102
4,571,562
34,433,837
49/97
EDINET提出書類
藤倉コンポジット株式会社(E01094)
有価証券報告書
当連結会計年度(自
2025年4月1日
至
2026年3月31日)
(単位:千円)
株主資本
資本金
当期首残高
会計方針の変更によ
る累積的影響額
会計方針の変更を反映
した当期首残高
資本剰余金
3,804,298
利益剰余金
3,455,379
28,612,960
自己株式
株主資本合計
△6,010,364
29,862,274
―
3,804,298
3,455,379
28,612,960
△6,010,364
29,862,274
当期変動額
剰余金の配当
親会社株主に帰属す
る当期純利益
△1,263,997
△1,263,997
3,987,481
3,987,481
自己株式の取得
△2,040,403
△2,040,403
自己株式の処分
328,282
897,391
1,225,674
自己株式の消却
△4,723,125
4,723,125
―
利益剰余金から資本
剰余金への振替
連結子会社の清算に
よる増減
株主資本以外の項目
の当期変動額(純
額)
当期変動額合計
当期末残高
4,146,853
△4,146,853
―
103,090
103,090
―
△247,989
△1,320,279
3,580,112
2,011,844
3,804,298
3,207,390
27,292,681
△2,430,252
31,874,118
その他の包括利益累計額
その他有価証券
評価差額金
当期首残高
会計方針の変更によ
る累積的影響額
会計方針の変更を反映
した当期首残高
730,000
730,000
為替換算調整勘定
退職給付に係る
調整累計額
3,386,459
455,102
3,386,459
455,102
その他の
包括利益
累計額合計
純資産合計
4,571,562
34,433,837
―
―
4,571,562
34,433,837
当期変動額
剰余金の配当
△1,263,997
親会社株主に帰属す
る当期純利益
3,987,481
自己株式の取得
△2,040,403
自己株式の処分
1,225,674
自己株式の消却
―
利益剰余金から資本
剰余金への振替
連結子会社の清算に
よる増減
株主資本以外の項目
の当期変動額(純
額)
―
103,090
1,812,216
178,014
168,700
2,158,931
2,158,931
当期変動額合計
1,812,216
178,014
168,700
2,158,931
4,170,775
当期末残高
2,542,217
3,564,474
623,802
6,730,494
38,604,612
50/97
EDINET提出書類
藤倉コンポジット株式会社(E01094)
有価証券報告書
④ 【連結キャッシュ・フロー計算書】
前連結会計年度
(自 2024年4月1日
至 2025年3月31日)
営業活動によるキャッシュ・フロー
税金等調整前当期純利益
減価償却費
減損損失
貸倒引当金の増減額(△は減少)
賞与引当金の増減額(△は減少)
事業撤退損失引当金の増減額(△は減少)
事業撤退損失引当金戻入益(△は益)
製品自主回収関連損失引当金の増減額(△は減少)
株式給付引当金の増減額(△は減少)
退職給付に係る負債の増減額(△は減少)
退職給付に係る資産の増減額(△は増加)
受取利息及び受取配当金
支払利息
補助金収入
為替差損益(△は益)
投資有価証券売却損益(△は益)
固定資産廃棄損
固定資産除却損
売上債権の増減額(△は増加)
未収入金の増減額(△は増加)
棚卸資産の増減額(△は増加)
その他の流動資産の増減額(△は増加)
仕入債務の増減額(△は減少)
未払金の増減額(△は減少)
その他の流動負債の増減額(△は減少)
その他
小計
利息及び配当金の受取額
利息の支払額
法人税等の支払額
補助金の受取額
営業活動によるキャッシュ・フロー
投資活動によるキャッシュ・フロー
有形固定資産の取得による支出
無形固定資産の取得による支出
投資有価証券の売却による収入
投資有価証券の取得による支出
その他の投資による支出
その他の投資の回収による収入
貸付金の回収による収入
貸付けによる支出
投資活動によるキャッシュ・フロー
51/97
(単位:千円)
当連結会計年度
(自 2025年4月1日
至 2026年3月31日)
4,734,971
1,451,261
96,219
△19,683
6,323
△151,028
△52,101
454,400
201,155
136,120
△182,808
△249,024
39,260
△22,001
42,693
△512,954
159,231
4,258
△168,909
△77,330
△124,509
101,694
571,789
773,758
243,381
171,432
5,233,548
1,542,708
39,258
△121,188
△37,883
△5,339
―
△112,033
161,405
238,897
△261,978
△213,077
50,858
△163,087
65,923
―
―
29,935
314,077
△80,420
1,167,588
△143,054
△796,025
△547,823
82,390
234,279
7,627,603
6,678,959
248,976
△39,260
△982,450
22,001
212,943
△50,858
△1,265,478
163,087
6,876,870
5,738,655
△3,669,621
△174,001
573,389
△306
△1,240
17,270
84,296
―
△1,682,746
△197,171
―
△100,277
△4,617
62,125
22,264
△1,500
△3,170,214
△1,901,923
EDINET提出書類
藤倉コンポジット株式会社(E01094)
有価証券報告書
前連結会計年度
(自 2024年4月1日
至 2025年3月31日)
財務活動によるキャッシュ・フロー
長期借入金の返済による支出
長期借入れによる収入
自己株式の売却による収入
自己株式の取得による支出
配当金の支払額
リース債務の返済による支出
財務活動によるキャッシュ・フロー
現金及び現金同等物に係る換算差額
現金及び現金同等物の増減額(△は減少)
現金及び現金同等物の期首残高
現金及び現金同等物の期末残高
※1
52/97
(単位:千円)
当連結会計年度
(自 2025年4月1日
至 2026年3月31日)
△400,000
4,000,000
7,113
△5,604,051
△1,440,129
△12,416
△800,000
―
16,299
△831,029
△1,264,037
△19,532
△3,449,483
391,732
648,904
10,228,991
10,877,895
△2,898,298
62,673
1,001,106
10,877,895
11,879,001
※1
EDINET提出書類
藤倉コンポジット株式会社(E01094)
有価証券報告書
【注記事項】
(連結財務諸表作成のための基本となる重要な事項)
1
連結の範囲に関する事項
(1) 連結子会社の数
7社
連結子会社の名称
株式会社キャラバン
Fujikura Composite America,Inc.
杭州藤倉橡膠有限公司
藤栄運輸株式会社
IER Fujikura,Inc.
FUJIKURA COMPOSITES HAIPHONG,INC.
安吉藤倉橡膠有限公司
(注)FUJIKURA GRAPHICS,INC.は清算したため、連結の範囲から除いております。
(2) 主要な非連結子会社の名称等
主要な非連結子会社
株式会社藤加工所
株式会社藤光機械製作所
(連結の範囲から除いた理由)
非連結子会社9社は、いずれも小規模であり、合計の総資産、売上高、当期純損益(持分に見合う額)及び利益
剰余金(持分に見合う額)等は、いずれも連結財務諸表に重要な影響を及ぼしていないためであります。
2
持分法の適用に関する事項
非連結子会社(株式会社藤加工所他8社)及び関連会社(道藤ゴム工業株式会社)はいずれも、それぞれ当期純損益(持
分に見合う額)及び利益剰余金(持分に見合う額)等からみて、持分法の対象から除いても連結財務諸表に及ぼす影響が
軽微であり、かつ、全体としても重要性がないため、持分法の適用範囲から除外しております。
3
連結子会社の事業年度等に関する事項
連結子会社の決算日が連結決算日と異なる会社は、次のとおりであります。
会社名
決算日
Fujikura Composite America,Inc.
12月31日
杭州藤倉橡膠有限公司
12月31日
IER Fujikura,Inc.
12月31日
FUJIKURA COMPOSITES HAIPHONG,INC.
12月31日
安吉藤倉橡膠有限公司
12月31日
連結財務諸表の作成にあたっては、連結子会社の決算日の財務諸表を使用しております。ただし、連結決算日との
間に生じた重要な取引については、連結上必要な調整を行っております。
4
会計方針に関する事項
(1) 重要な資産の評価基準及び評価方法
①
有価証券
その他有価証券
市場価格のない株式等以外のもの
時価法(評価差額は全部純資産直入法により処理し、売却原価は移動平均法により算定)
市場価格のない株式等
移動平均法による原価法
②
棚卸資産
主として移動平均法による原価法(貸借対照表価額は収益性の低下による簿価切下げの方法により算定)
53/97
EDINET提出書類
藤倉コンポジット株式会社(E01094)
有価証券報告書
(2) 重要な減価償却資産の減価償却の方法
①
有形固定資産(リース資産を除く)
定額法を採用しております。
なお、主な耐用年数は以下のとおりであります。
②
建物及び構築物
3年から50年
機械装置及び運搬具
2年から9年
無形固定資産(リース資産を除く)
定額法を採用しております。
なお、使用するソフトウエアについては、社内における利用可能期間(5年)に基づいております。
③
リース資産
リース期間を耐用年数として、残存価額を零とする定額法を採用しております。
(3) 重要な引当金の計上基準
①
貸倒引当金
債権の貸倒による損失に備えるため、一般債権については貸倒実績率により、貸倒懸念債権等特定の債権につ
いては個別に回収可能性を検討し、回収不能見込額を計上しております。
②
賞与引当金
従業員の賞与支給に備えるため、賞与支給見込額のうち当連結会計年度に負担すべき額を計上しております。
③
製品自主回収関連損失引当金
膨脹式救命いかだの部品または一部製品の無償交換に伴い発生する費用の見積額を計上しております。
④
環境対策引当金
「ポリ塩化ビフェニル廃棄物の適正な処理の推進に関する特別措置法」によって処理することが義務付けられ
ているPCB廃棄物の処理費用見積額に基づき計上しております。
⑤
株式給付引当金
株式交付規定に基づく従業員への当社株式の交付に備えるため、当連結会計年度末における株式給付債務の見
込額に基づき計上しております。
⑥
役員株式給付引当金
株式交付規程に基づく当社取締役等への当社株式の交付に備えるため、当連結会計年度末における株式給付債
務の見込額に基づき計上しております。
(4) 退職給付に係る会計処理の方法
①
退職給付見込額の期間帰属方法
退職給付債務の算定にあたり、退職給付見込額を当連結会計年度末までの期間に帰属させる方法については、
給付算定式基準によっております。
②
数理計算上の差異及び過去勤務費用の費用処理方法
過去勤務費用については、その発生時における従業員の平均残存勤務期間以内の一定の年数(主として10年)に
よる定額法により費用処理しております。
数理計算上の差異については、各連結会計年度の発生時における従業員の平均残存勤務期間以内の一定の年数
(10年)による定額法により按分した額をそれぞれ発生の翌連結会計年度から費用処理しております。
③
小規模企業等における簡便法の採用
一部の連結子会社は、退職給付に係る負債及び退職給付費用の計算に、退職一時金制度については、退職給付
に係る期末自己都合要支給額を退職給付債務とし、企業年金制度については、直近の年金財政計算上の数理債務
をもって退職給付債務とする方法を用いた簡便法を適用しております。
(5) 重要な収益及び費用の計上基準
当社及び連結子会社の重要な収益及び費用の計上基準は以下のとおりであります。
①
製品販売収益
当社及び連結子会社では、原則として製品の納入時点において支配が顧客に移転して履行義務が充足されると
判断していることから、当時点において収益を認識しております。ただし、国内製品販売においては出荷から着
荷までの期間が3日以内でほぼ100%となっていることから「収益認識に関する会計基準の適用指針第98項」に定
める代替的な計上基準として出荷基準を採用しております。また、輸出製品販売においては船積時点で危険負担
と費用負担が顧客に移転することから船積基準を採用しております。
②
金型収益
顧客に支配が移転するものについては、支配移転時に売上を一括で計上しております。
54/97
EDINET提出書類
藤倉コンポジット株式会社(E01094)
有価証券報告書
③
救命器具等整備業務収益
整備サービスの完了時点で収益を計上しております。
④
アウトドア製品販売収益
製品販売時において、値引きにより返金が生じない可能性が高いと見込まれる部分に限り取引価格として売上
を計上しております。
(6) 連結キャッシュ・フロー計算書における資金の範囲
手許現金、随時引き出し可能な預金及び容易に換金可能であり、かつ、価値の変動について僅少なリスクしか負
わない取得日から3ヶ月以内に償還期限の到来する短期投資からなっております。
(7) その他連結財務諸表作成のための重要な事項
該当事項はありません。
(重要な会計上の見積り)
固定資産の減損に係る見積り
(1) 藤倉コンポジット株式会社
①
当連結会計年度の連結財務諸表に計上した金額
(単位 : 千円)
当連結会計年度
(2026年3月31日)
前連結会計年度
(2025年3月31日)
②
有形固定資産
9,396,660
9,352,447
無形固定資産
152,548
320,159
識別した項目に係る重要な会計上の見積りの内容に関する情報
当社の産業用資材セグメントの一部事業について、加須工場の閉鎖が決定したことに伴い回収可能価額を
著しく低下させる可能性がある事象が発生したため、当該工場の資産グループに減損の兆候があると判断
し、固定資産の減損損失の認識が必要であるかを検討しました。
その結果、割引前将来キャッシュ・フロー総額がその帳簿価額を上回っていたことから、減損損失を認識
しておりません。
工場閉鎖までに生じる割引前将来キャッシュ・フロー総額の見積りは、当該工場の閉鎖時点における正味
売却価額をもとに算定しております。当該固定資産の正味売却価額については、外部の専門家による不動産
鑑定評価額(過去に取得した不動産鑑定評価額を調整する方法を含む)に基づいて算定しております。
不動産鑑定評価額には原価法が適用され、主要な仮定は土地の更地価格、建物の再調達原価等でありま
す。
なお、市場環境の変化等により見積りの前提とした条件に変更が生じた場合には、翌連結会計年度の連結
財務諸表に重要な影響を与える可能性があります。
(2) 株式会社キャラバン
①
当連結会計年度の連結財務諸表に計上した金額
(単位 : 千円)
当連結会計年度
(2026年3月31日)
前連結会計年度
(2025年3月31日)
②
有形固定資産
556,940
545,468
無形固定資産
97,313
80,788
識別した項目に係る重要な会計上の見積りの内容に関する情報
同社は、事業環境の変化に伴い収益性が低下し減損の兆候があるため、減損損失の認識が必要であるかを
検討しました。
その結果、当該資産グループから見込まれる正味売却価額が、その帳簿価額を上回っていたことから、減
損損失の認識は不要と判断しました。当該固定資産の正味売却価額については外部の専門家の不動産鑑定評
価額等に基づいて算定しております。
不動産鑑定評価額には原価法が適用され、主要な仮定は土地の更地価格、建物の再調達原価等でありま
す。
なお、市場環境の変化等により見積りの前提とした条件に変更が生じた場合には、翌連結会計年度の連結
財務諸表に重要な影響を与える可能性があります。
(3) IER Fujikura,Inc.
①
当連結会計年度の連結財務諸表に計上した金額
(単位 : 千円)
55/97
EDINET提出書類
藤倉コンポジット株式会社(E01094)
有価証券報告書
前連結会計年度
(2025年3月31日)
②
当連結会計年度
(2026年3月31日)
有形固定資産
633,354
599,594
無形固定資産
13,022
12,652
識別した項目に係る重要な会計上の見積りの内容に関する情報
同社は、事業環境の変化に伴い収益性が低下し減損の兆候があるため、減損損失の認識が必要であるかを
検討しました。
その結果、当該資産グループから見込まれる正味売却価額が、その帳簿価額を上回っていたことから、減
損損失の認識は不要と判断しました。当該固定資産の正味売却価額については外部の専門家の不動産鑑定評
価額等に基づいて算定しております。
不動産鑑定評価額には取引事例比較法が適用され、周辺の取引事例が参考にされております。
なお、市場環境の変化等により見積りの前提とした条件に変動が生じた場合には、翌連結会計年度の連結
財務諸表に重要な影響を与える可能性があります。
(会計方針の変更)
(在外子会社の収益及び費用の換算方法の変更)
在外子会社の収益及び費用については、従来、決算日の直物為替相場により円貨に換算しておりましたが、為替
相場が著しく変動する中で在外子会社の業績の重要性が増しており、今後もその重要性が増すことが見込まれるこ
とから、一時的な為替相場の変動による期間損益への影響を緩和し、在外子会社の業績をより適切に連結財務諸表
に反映させるため、当連結会計年度の期首より期中平均為替相場により円貨に換算する方法に変更しております。
なお、当社における決算関係資料の文書保存期間は10年と規定されているため、第137期(2016年3月期)まで遡
及適用することは可能ですが、第142期(2021年3月期)以前の期間については会計方針の変更による影響額が軽微
であるため、2021年4月1日より期中平均為替相場により円貨に換算する方法を適用しております。当該会計方針
の変更は遡及適用され、前連結会計年度については遡及適用後の連結財務諸表となっております。
この結果、遡及適用を行う前と比べて、前連結会計年度の売上高は714,020千円、営業利益は186,439千円、経常
利益は195,460千円、税金等調整前当期純利益は192,793千円、親会社株主に帰属する当期純利益は152,277千円、1
株当たり当期純利益は7円76銭それぞれ減少しております。また、前連結会計年度の期首の純資産に累積的影響額
が反映されたことにより、利益剰余金の前期首残高は167,362千円減少し、為替換算調整勘定の前期首残高は同額増
加しております。
(未適用の会計基準等)
・「リースに関する会計基準」(企業会計基準第34号
2024年9月13日)
・「リースに関する会計基準の適用指針」(企業会計基準適用指針第33号
2024年9月13日)
ほか、関連する企業会計基準、企業会計基準適用指針、実務対応報告及び移管指針の改正
(1)概要
国際的な会計基準と同様に、借手のすべてのリースについて資産・負債を計上する等の取扱いを定めるもの。
(2)適用予定日
2028年3月期の期首より適用予定であります。
(3)当該会計基準等の適用による影響
「リースに関する会計基準」等の適用による連結財務諸表に与える影響額については、現時点で評価中であり
ます。
56/97
EDINET提出書類
藤倉コンポジット株式会社(E01094)
有価証券報告書
(表示方法の変更)
(連結貸借対照表関係)
前連結会計年度において、「流動負債」の「短期借入金」に含まれていた「1年内返済予定の長期借入金」は、
明瞭性を高める観点から区分掲記することとしました。この表示方法の変更を反映させるため、前連結会計年度の
連結財務諸表の組替えを行っております。
この結果、前連結会計年度の連結貸借対照表において、「流動負債」の「短期借入金」に表示していた800,000千
円は、「1年内返済予定の長期借入金」800,000千円として組替えております。
(追加情報)
(従業員等に信託を通じて自社の株式を交付する取引)
当社は、従業員への福利厚生制度の拡充と当社の中長期的な企業価値を高めることを目的として、従業員インセ
ンティブ・プラン「株式付与ESOP信託制度」を、2024年2月に導入しております。
(1) 取引の概要
当社は、予め定めた株式交付規定に基づき、一定の要件を充足する従業員にポイントを付与し、当該付与ポイ
ントに相当する当社株式を交付します。従業員に交付する株式については、当社が予め信託設定した金銭により
将来分も含め取得し、信託財産として分別管理するものとします。
(2) 信託に残存する自社の株式
信託に残存する当社株式を、信託における帳簿価額(付随費用の金額を除く。)により、純資産の部に自己株
式として計上しております。当該自己株式の帳簿価額及び株式数は、前連結会計年度末において406,313千円、
288,780株であり、当連結会計年度末において1,532,852千円、872,172株であります。
(役員向け株式交付信託)
当社は、当社の取締役(監査等委員である取締役及び社外取締役を除く。)及び執行役員(以下総称して「取締
役等」といいます。)を対象とする株式報酬制度「役員向け株式交付信託」を、2025年6月に導入しております。
当該信託契約に係る会計処理については、「従業員等に信託を通じて自社の株式を交付する取引に関する実務上の
取り扱い」(実務対応報告第30号
2015年3月26日)に準じて、総額法を適用しております。
(1) 取引の概要
本制度は、当社が金銭を拠出することにより設定する信託(以下「本信託」といいます。)が株式を取得し、
予め定めた株式交付規程に基づき、各取締役等に付与するポイントの数に相当する数の当社株式が、本信託を通
じて交付される株式報酬制度となります。
(2) 信託に残存する自社の株式
信託に残存する当社株式を、信託における帳簿価額(付随費用の金額を除く。)により、純資産の部に自己株
式として計上しております。当該自己株式の帳簿価額及び株式数は、当連結会計年度末において66,535千円、
34,600株であります。
(連結貸借対照表関係)
※1
※2
受取手形及び売掛金のうち、顧客との契約から生じた債権の金額は、それぞれ以下のとおりであります。
(単位 : 千円)
前連結会計年度
当連結会計年度
(2025年3月31日)
(2026年3月31日)
受取手形
564,846
33,667
売掛金
6,819,508
6,657,926
非連結子会社及び関連会社に対するものは、次のとおりであります。
投資有価証券(株式)
前連結会計年度
(2025年3月31日)
276,861
57/97
(単位 : 千円)
当連結会計年度
(2026年3月31日)
276,861
EDINET提出書類
藤倉コンポジット株式会社(E01094)
有価証券報告書
※3
財務制限条項
前連結会計年度(2025年3月31日)
当連結会計年度末の借入金は、当社が2024年7月26日付で取引銀行と締結したシンジケートローン契約(契約総
額4,000百万円)によるものです。
この契約には、以下の財務制限条項が付されております。
①2026年3月期末日及びそれ以降の各事業年度末日及び第2四半期会計期間の末日における連結及び単体の貸借
対照表に記載される純資産の部の合計金額を、2025年3月期末日における連結および単体の貸借対照表に記載され
る純資産の部の合計金額75%に相当する金額、又は直近の事業年度末日における連結及び単体の貸借対照表に記載
される純資産の部の合計金額の75%に相当する金額のうち、いずれか高いほうの金額以上に維持すること。
②2025年3月期末日及びそれ以降の各事業年度末日及び第2四半期会計期間の末日における連結及び単体の損益
計算書に記載される経常損益を2回連続して損失としないこと。
当連結会計年度(2026年3月31日)
前連結会計年度に記載したシンジケートローン契約について財務制限条項の内容を含め重要な変更はありませ
ん。
(連結損益及び包括利益計算書関係)
※1
顧客との契約から生じる収益
売上高については、顧客との契約から生じる収益及びそれ以外の収益を区分して記載しておりません。顧客との
契約から生じる収益の金額は、連結財務諸表「注記事項(収益認識関係) 1
顧客との契約から生じる収益を分解し
た情報」に記載しております。
※2
期末棚卸高は収益性の低下に伴う簿価切下後の金額であり、次の棚卸資産評価損が売上原価に含まれておりま
す。
(単位 : 千円)
当連結会計年度
(自 2025年4月1日
至 2026年3月31日)
8,848
前連結会計年度
(自 2024年4月1日
至 2025年3月31日)
55,010
※3
一般管理費及び当期製造費用に含まれる研究開発費の総額
(単位 : 千円)
当連結会計年度
(自 2025年4月1日
至 2026年3月31日)
1,493,766
前連結会計年度
(自 2024年4月1日
至 2025年3月31日)
1,495,279
※4
営業外費用の固定資産除却損は、毎期経常的に発生する除却損であり、その内容は次のとおりであります。
(単位 : 千円)
前連結会計年度
当連結会計年度
(自 2024年4月1日
(自 2025年4月1日
至 2025年3月31日)
至 2026年3月31日)
建物及び構築物
3,022
13
機械装置及び運搬具
724
28,514
その他
511
1,406
計
4,258
29,935
※5
投資有価証券売却益の内容は、次のとおりであります。
その他有価証券
計
前連結会計年度
(自 2024年4月1日
至 2025年3月31日)
512,954
512,954
58/97
(単位 : 千円)
当連結会計年度
(自 2025年4月1日
至 2026年3月31日)
―
―
EDINET提出書類
藤倉コンポジット株式会社(E01094)
有価証券報告書
※6
事業撤退損失引当金戻入額
前連結会計年度(自
2024年4月1日
至
2025年3月31日)
オフセット印刷機用ブランケット事業からの撤退に伴い発生した設備撤去費用が確定したことから、確定額との
差額を事業撤退損失引当金戻入額として計上しております。
当連結会計年度(自
2025年4月1日
至
2026年3月31日)
至
2025年3月31日)
至
2026年3月31日)
該当事項はありません。
※7
関係会社清算益
前連結会計年度(自
2024年4月1日
該当事項はありません。
当連結会計年度(自
2025年4月1日
FUJIKURA GRAPHICS,INC.の清算に伴い発生した収益を計上しております。
※8
固定資産廃棄損の内容は、次のとおりであります。
前連結会計年度
(自 2024年4月1日
至 2025年3月31日)
159,231
159,231
建物及び構築物
計
(単位 : 千円)
当連結会計年度
(自 2025年4月1日
至 2026年3月31日)
―
―
小高工場の再稼働に伴い、建屋改修工事に付随する廃棄費用として、前連結会計年度の特別損失に計上しており
ます。
なお、毎期経常的に発生する固定資産の廃棄費用については、営業外費用の「その他」に含まれております。
※9
減損損失
前連結会計年度(自
2024年4月1日
至
2025年3月31日)
当社グループは以下の資産について減損損失を計上しました。
場所
用途
種類
安吉藤倉橡膠有限公司
(中国)
遊休資産
機械装置及び運搬具
(単位 : 千円)
減損損失
93,552
当社グループは、事業用資産につきましては、管理会計上の区分を基礎としてグルーピングを行っております。
ただし、遊休資産につきましては、個別の資産単位ごとに把握しております。
遊休資産におきましては、帳簿価額を回収可能価額まで減額し、当期減少額を減損損失として計上しておりま
す。
なお、遊休資産の回収可能価額は、正味売却価額を使用しており、将来の使用が見込まれないため、零としてお
ります。
当連結会計年度(自
2025年4月1日
至
2026年3月31日)
当社グループは以下の資産について減損損失を計上しました。
場所
用途
種類
安吉藤倉橡膠有限公司
(中国)
遊休資産
機械装置及び運搬具
(単位 : 千円)
減損損失
39,258
当社グループは、事業用資産につきましては、管理会計上の区分を基礎としてグルーピングを行っております。
ただし、遊休資産につきましては、個別の資産単位ごとに把握しております。
遊休資産におきましては、帳簿価額を回収可能価額まで減額し、当期減少額を減損損失として計上しておりま
す。
なお、遊休資産の回収可能価額は、正味売却価額を使用しており、将来の使用が見込まれないため、零としてお
ります。
59/97
EDINET提出書類
藤倉コンポジット株式会社(E01094)
有価証券報告書
※10
製品自主回収関連損失引当金繰入額
前連結会計年度(自
2024年4月1日
至
2025年3月31日)
膨脹式救命いかだの部品または一部製品の無償交換に伴い発生する費用の見積額を計上しております。
当連結会計年度(自
2025年4月1日
至
2026年3月31日)
該当事項はありません。
※11
その他の包括利益に係る組替調整額並びに法人税等及び税効果額
前連結会計年度
(自 2024年4月1日
至 2025年3月31日)
その他有価証券評価差額金:
当期発生額
組替調整額
法人税等及び税効果調整前
法人税等及び税効果額
その他有価証券評価差額金
為替換算調整勘定:
当期発生額
退職給付に係る調整額:
当期発生額
組替調整額
法人税等及び税効果調整前
法人税等及び税効果額
退職給付に係る調整額
その他の包括利益合計
当連結会計年度
(自 2025年4月1日
至 2026年3月31日)
△18,766千円
―
△18,766
7,525
△11,241
2,649,482千円
―
2,649,482
△837,266
1,812,216
1,125,770
178,014
207,290
△28,592
178,698
△54,431
124,266
1,238,795
363,783
△116,959
246,824
△78,124
168,700
2,158,931
(連結株主資本等変動計算書関係)
前連結会計年度(自
1
2024年4月1日
至
2025年3月31日)
発行済株式の種類及び総数並びに自己株式の種類及び株式数に関する事項
当連結会計年度
期首株式数
当連結会計年度
増加株式数
当連結会計年度
減少株式数
(単位 : 株)
当連結会計年度末
株式数
発行済株式
普通株式
合計
23,446,209
―
―
23,446,209
23,446,209
―
―
23,446,209
293,836
4,000,136
5,156
4,288,816
293,836
4,000,136
5,156
4,288,816
自己株式
普通株式
(注)
合計
(注)1.自己株式の株式数の増加は、東京証券取引所の自己株式立会外買付取引(ToSTNeT-3)による取得4,000,000
株、株式付与ESOP信託の信託元本解約の取消による増加100株、単元未満株式の買取りによる増加36株であり
ます。
2.自己株式の株式数の減少は、株式付与ESOP信託による株式給付5,156株によるものであります。
3.当連結会計年度末の自己株式の株式数には、「株式付与ESOP信託」の信託財産として、日本マスタートラス
ト信託銀行株式会社(株式付与ESOP信託口・80014口)が保有する当社株式288,780株が含まれております。
60/97
EDINET提出書類
藤倉コンポジット株式会社(E01094)
有価証券報告書
2
配当に関する事項
(1) 配当金支払額
(決議)
2024年6月27日
定時株主総会
2024年11月8日
取締役会
株式の種類
配当金の総額
(千円)
普通株式
820,617
普通株式
622,277
1株当たり
配当額(円)
基準日
効力発生日
35
2024年3月31日
2024年6月28日
32
2024年9月30日
2024年12月2日
(注)1.2024年6月27日定時株主総会決議による配当金の総額に含まれる信託が保有する自社の株式に対する配当金
額
10,284千円
2.2024年11月8日取締役会決議による配当金の総額に含まれる信託が保有する自社の株式に対する配当金額
9,329千円
(2) 基準日が当連結会計年度に属する配当のうち、配当の効力発生日が翌連結会計年度となるもの
(決議)
株式の種類
配当金の総額
(千円)
配当の原資
1株当たり
配当額(円)
2025年6月26日
定時株主総会
普通株式
622,277
利益剰余金
32
基準日
効力発生日
2025年3月31日
2025年6月27日
(注)2025年6月26日定時株主総会決議による配当金の総額に含まれる信託が保有する自社の株式に対する配当金額
9,240千円
3
新株予約権等に関する事項
該当事項はありません。
当連結会計年度(自
1
2025年4月1日
至
2026年3月31日)
発行済株式の種類及び総数並びに自己株式の種類及び株式数に関する事項
当連結会計年度
期首株式数
当連結会計年度
増加株式数
当連結会計年度
減少株式数
(単位 : 株)
当連結会計年度末
株式数
発行済株式
普通株式
合計
23,446,209
―
3,371,241
20,074,968
23,446,209
―
3,371,241
20,074,968
4,288,816
978,739
4,011,049
1,256,506
4,288,816
978,739
4,011,049
1,256,506
自己株式
普通株式
(注)
合計
(注)1.発行済株式の株式数の減少は、取締役会決議に基づく自己株式の消却3,371,241株によるものであります。
2.自己株式の株式数の増加は、株式付与ESOP信託の取得594,300株、役員向け株式交付信託の取得34,600株、取
締役会決議に基づく自己株式の取得349,600株、単元未満株式の買取り239株によるものであります。
3.自己株式の株式数の減少は、株式付与ESOP信託への処分594,300株、役員向け株式交付信託への処分34,600
株、株式付与ESOP信託による株式給付10,908株、取締役会決議に基づく自己株式の消却3,371,241株によるも
のであります。
4.当連結会計年度末の自己株式の株式数には、「株式付与ESOP信託」の信託財産として、日本マスタートラス
ト信託銀行株式会社(株式付与ESOP信託口・80014口)が保有する当社株式872,172株、役員向け株式交付信
託の信託財産として、株式会社日本カストディ銀行(信託口)が保有する当社株式34,600株が含まれており
ます。
61/97
EDINET提出書類
藤倉コンポジット株式会社(E01094)
有価証券報告書
2
配当に関する事項
(1) 配当金支払額
(決議)
2025年6月26日
定時株主総会
2025年11月10日
取締役会
株式の種類
配当金の総額
(千円)
1株当たり
配当額(円)
普通株式
622,277
普通株式
641,720
基準日
効力発生日
32
2025年3月31日
2025年6月27日
33
2025年9月30日
2025年12月1日
(注)1.2025年6月26日定時株主総会決議による配当金の総額に含まれる信託が保有する自社の株式に対する配当金
額
9,240千円
2.2025年11月10日取締役会決議による配当金の総額に含まれる信託が保有する自社の株式に対する配当金額
9,348千円
(2) 基準日が当連結会計年度に属する配当のうち、配当の効力発生日が翌連結会計年度となるもの
(決議予定)
株式の種類
配当金の総額
(千円)
配当の原資
1株当たり
配当額(円)
2026年6月25日
定時株主総会
普通株式
848,185
利益剰余金
43
基準日
効力発生日
2026年3月31日
2026年6月26日
(注)2026年6月25日定時株主総会決議(予定)による配当金の総額に含まれる信託が保有する自社の株式に対する配
当金額
3
38,991千円
新株予約権等に関する事項
該当事項はありません。
(連結キャッシュ・フロー計算書関係)
※1 現金及び現金同等物の期末残高と連結貸借対照表に掲記されている科目の金額との関係
(単位 : 千円)
当連結会計年度
(自 2025年4月1日
至 2026年3月31日)
前連結会計年度
(自 2024年4月1日
至 2025年3月31日)
現金及び預金勘定
預入期間が3か月を超える定期預金
現金及び現金同等物
10,877,895
11,879,001
―
―
10,877,895
11,879,001
(リース取引関係)
1
ファイナンス・リース取引
所有権移転外ファイナンス・リース取引
(1) リース資産の内容
有形固定資産
主として、生産設備(機械装置及び運搬具)であります。
(2) リース資産の減価償却の方法
「連結財務諸表作成のための基本となる重要な事項「4 会計方針に関する事項 (2) 重要な減価償却資産の
減価償却の方法」」に記載のとおりであります。
2
使用権資産
米国会計基準を適用している在外連結子会社のリースに関しては、米国会計基準ASU第2016-02号「リース」を適
用しており、オペレーティング・リース取引はリース期間にわたるリース料の現在価値に基づいて使用権資産及び
リース債務を計上し、リース費用はリース期間にわたって定額法で認識しております。主な使用権資産の内容は、
賃貸オフィスであります。
62/97
EDINET提出書類
藤倉コンポジット株式会社(E01094)
有価証券報告書
(金融商品関係)
1
金融商品の状況に関する事項
(1) 金融商品に対する取組方針
当社グループは、設備投資資金及び運転資金においては、主に銀行借入にて調達する方針であります。また、一
時的な余剰資金は、主に流動性の高い金融商品で運用する方針であります。デリバティブ取引は、後述するリスク
を回避するために利用しており、投機的な取引は行わない方針であります。
(2) 金融商品の内容及びそのリスク
営業債権である受取手形及び売掛金、電子記録債権は、顧客の信用リスクに晒されております。また、海外で事
業を行うにあたり生じる外貨建営業債権は、為替の変動リスクに晒されておりますが、同じ外貨建買掛金の残高の
範囲内にあるものを除き、必要に応じて先物為替予約または外貨建借入金によりヘッジしております。
外貨建預金及び海外子会社に対する外貨建貸付金等の債権は、為替の変動リスクに晒されておりますが、必要に
応じて外貨建借入金によりヘッジしております。
投資有価証券は、主に業務上の関係を有する企業の株式であり、市場価格の変動リスクに晒されております。
営業債務である買掛金、電子記録債務は、そのほとんどが4ヶ月以内の支払期日であります。一部外貨建てのも
のについては、為替の変動リスクに晒されております。
(3) 金融商品に係るリスク管理体制
①
信用リスク(取引先の契約不履行等に係るリスク)の管理
当社は、債権管理規定に従い、営業債権について、各営業部門が主要な取引先の状況を定期的にモニタリング
し、取引相手ごとに期日及び残高を管理するとともに、財務状況等の悪化等による回収懸念の早期把握や軽減を
図っております。連結子会社についても、当社の債権管理規定に準じて、同様の管理を行っております。
②
市場リスク(為替や金利等の変動リスク)の管理
当社は、外貨建営業債権債務について、通貨別月別に把握された為替の変動リスクに対して、必要に応じて先
物為替予約または外貨建借入金によりヘッジしております。
投資有価証券については、定期的に時価や発行体(取引先企業)の財務状況等を把握しております。
デリバティブ取引の執行・管理については、取引権限及び取引限度額等を定めた管理規定に従い、担当部署が
決裁担当者の承認を得て行っております。
③
資金調達に係る流動性リスク(支払期日に支払いを実行できなくなるリスク)の管理
当社は、各部署からの報告に基づき担当部署が適時に資金繰計画を作成・更新するとともに、手許流動性の維
持などにより流動性リスクを管理しております。
(4) 金融商品の時価等に関する事項についての補足説明
金融商品の時価の算定においては変動要因を織り込んでいるため、異なる前提条件等を採用することにより、当
該価額が変動することもあります。
2
金融商品の時価等に関する事項
連結貸借対照表計上額、時価及びこれらの差額については、次のとおりであります。
前連結会計年度(2025年3月31日)
(単位 : 千円)
連結貸借対照表計上額
時価
差額
(1) 投資有価証券
その他有価証券
資産計
(1) 長期借入金
負債計
1,471,288
1,471,288
―
1,471,288
1,471,288
―
3,600,000
3,600,000
―
3,600,000
3,600,000
―
(注) 1
現金及び預金、受取手形及び売掛金、電子記録債権、買掛金、電子記録債務については、現金であること、
及び短期間で決済されるため時価が帳簿価額に近似するものであることから、記載を省略しております。
2
(1)長期借入金については、連結決算日後1年以内に返済期限が到来するものを含めて表示しております。
63/97
EDINET提出書類
藤倉コンポジット株式会社(E01094)
有価証券報告書
3
市場価格のない株式等は、(1)投資有価証券には含まれておりません。当該金融商品の連結貸借対照表計上
額は以下のとおりであります。
(単位:千円)
区分
前連結会計年度
非上場株式
339,165
当連結会計年度(2026年3月31日)
(単位 : 千円)
連結貸借対照表計上額
時価
差額
(1) 投資有価証券
その他有価証券
資産計
(1) 長期借入金
負債計
4,121,089
4,121,089
―
4,121,089
4,121,089
―
2,800,000
2,800,000
―
2,800,000
2,800,000
―
(注) 1
現金及び預金、受取手形及び売掛金、電子記録債権、買掛金、電子記録債務については、現金であること、
及び短期間で決済されるため時価が帳簿価額に近似するものであることから、記載を省略しております。
2
(1)長期借入金については、連結決算日後1年以内に返済期限が到来するものを含めて表示しております。
3
市場価格のない株式等は、(1)投資有価証券には含まれておりません。当該金融商品の連結貸借対照表計上
額は以下のとおりであります。
(単位:千円)
区分
当連結会計年度
非上場株式
4
439,125
金銭債権及び満期のある有価証券の連結決算日後の償還予定額
前連結会計年度(2025年3月31日)
(単位 : 千円)
10,877,895
1年超
5年以内
―
受取手形
564,846
―
―
―
売掛金
6,819,508
―
―
―
電子記録債権
3,273,335
―
―
―
21,535,584
―
―
―
11,879,001
1年超
5年以内
―
5年超
10年以内
―
33,667
―
―
―
売掛金
6,657,926
―
―
―
電子記録債権
3,697,752
―
―
―
22,268,346
―
―
―
1年以内
現金及び預金
合計
5年超
10年以内
―
10年超
―
当連結会計年度(2026年3月31日)
(単位 : 千円)
1年以内
現金及び預金
受取手形
合計
5
10年超
―
長期借入金及びその他の有利子負債の連結決算日後の返済予定額
前連結会計年度(2025年3月31日)
(単位 : 千円)
1年以内
長期借入金
合計
800,000
800,000
1年超
2年以内
800,000
800,000
2年超
3年以内
800,000
800,000
3年超
4年以内
800,000
800,000
4年超
5年以内
400,000
400,000
1年超
2年以内
800,000
800,000
2年超
3年以内
800,000
800,000
3年超
4年以内
400,000
400,000
4年超
5年以内
―
―
5年超
―
―
当連結会計年度(2026年3月31日)
(単位 : 千円)
1年以内
長期借入金
合計
800,000
800,000
64/97
5年超
―
―
EDINET提出書類
藤倉コンポジット株式会社(E01094)
有価証券報告書
3
金融商品の時価のレベルごとの内訳等に関する事項
金融商品の時価を、時価の算定に係るインプットの観察可能性及び重要性に応じて、以下の3つのレベルに分類し
ております。
レベル1の時価:同一の資産又は負債の活発な市場における(無調整の)相場価格により算定した時価
レベル2の時価:レベル1のインプット以外の直接又は間接的に観察可能なインプットを用いて算定した時価
レベル3の時価:重要な観察できないインプットを使用して算定した時価
時価の算定に重要な影響を与えるインプットを複数使用している場合には、それらのインプットがそれぞれ属する
レベルのうち、時価の算定における優先順位が最も低いレベルに時価を分類しております。
(1) 時価をもって連結貸借対照表計上額とする金融資産
前連結会計年度(2025年3月31日)
(単位 : 千円)
区分
投資有価証券
資産計
時価
レベル1
レベル2
レベル3
合計
1,471,288
―
―
1,471,288
1,471,288
―
―
1,471,288
当連結会計年度(2026年3月31日)
(単位 : 千円)
区分
投資有価証券
資産計
時価
レベル1
レベル2
レベル3
合計
4,121,089
―
―
4,121,089
4,121,089
―
―
4,121,089
(2) 時価をもって連結貸借対照表計上額としない金融負債
前連結会計年度(2025年3月31日)
(単位 : 千円)
区分
時価
レベル1
レベル2
レベル3
合計
長期借入金
(1年以内返済予定を含む)
―
3,600,000
―
3,600,000
負債計
―
3,600,000
―
3,600,000
当連結会計年度(2026年3月31日)
(単位 : 千円)
区分
時価
レベル1
レベル2
レベル3
合計
長期借入金
(1年以内返済予定を含む)
―
2,800,000
―
2,800,000
負債計
―
2,800,000
―
2,800,000
(注) 時価の算定に用いた評価技法及びインプットの説明
投資有価証券
上場株式は相場価格を用いて評価しております。上場株式は活発な市場で取引されているため、その時価をレベル
1の時価に分類しております。
長期借入金
長期借入金は変動金利のため市場金利を反映し、信用状態が借入後大きく変化していないことから時価簿価が近似
していると考えられるため当該帳簿価額によっております。当該借入金はレベル2の時価に分類しております。
65/97
EDINET提出書類
藤倉コンポジット株式会社(E01094)
有価証券報告書
(有価証券関係)
1
その他有価証券
前連結会計年度(2025年3月31日)
(単位 : 千円)
連結貸借対照表
計上額
種類
連結貸借対照表計上額が
取得原価を超えるもの
株式
連結貸借対照表計上額が
取得原価を超えないもの
株式
小計
(注)
差額
1,471,288
481,122
990,166
1,471,288
481,122
990,166
―
―
―
―
―
―
1,471,288
481,122
990,166
小計
合計
取得原価
非上場株式(連結貸借対照表計上額 62,303千円)については、市場価格がなく、時価を把握することが極めて
困難と認められることから、上表の「その他有価証券」には含めておりません。
当連結会計年度(2026年3月31日)
(単位 : 千円)
連結貸借対照表
計上額
種類
連結貸借対照表計上額が
取得原価を超えるもの
株式
連結貸借対照表計上額が
取得原価を超えないもの
株式
小計
(注)
2
差額
4,121,089
481,440
3,639,648
4,121,089
481,440
3,639,648
―
―
―
―
―
―
4,121,089
481,440
3,639,648
小計
合計
取得原価
非上場株式(連結貸借対照表計上額 162,263千円)については、市場価格がなく、時価を把握することが極めて
困難と認められることから、上表の「その他有価証券」には含めておりません。
売却したその他有価証券
前連結会計年度(自
2024年4月1日
至
2025年3月31日)
(単位 : 千円)
種類
売却額
株式
合計
当連結会計年度(自
売却益の合計額
売却損の合計額
573,389
512,954
−
573,389
512,954
−
2025年4月1日
至
2026年3月31日)
該当事項はありません。
66/97
EDINET提出書類
藤倉コンポジット株式会社(E01094)
有価証券報告書
(退職給付関係)
1
採用している退職給付制度の概要
当社、国内連結子会社及び一部の海外連結子会社は、確定給付企業年金制度、退職一時金制度、及び確定拠出年金
制度を設けております。また、従業員の退職等に際して割増退職金を支払う場合があります。
2
確定給付制度
(1) 退職給付債務の期首残高と期末残高の調整表((3)に掲げられた簡便法を適用した制度を除く)
前連結会計年度
2024年4月1日
2025年3月31日)
(自
至
退職給付債務の期首残高
勤務費用
利息費用
数理計算上の差異の発生額
退職給付の支払額
退職給付債務の期末残高
当連結会計年度
2025年4月1日
2026年3月31日)
(自
至
2,855,711千円
127,745
35,604
△211,985
△162,731
2,644,343
2,644,343千円
114,604
51,951
△194,258
△142,485
2,474,154
(2) 年金資産の期首残高と期末残高の調整表((3)に掲げられた簡便法を適用した制度を除く)
前連結会計年度
2024年4月1日
2025年3月31日)
(自
至
年金資産の期首残高
期待運用収益
数理計算上の差異の発生額
事業主からの拠出額
退職給付の支払額
年金資産の期末残高
当連結会計年度
2025年4月1日
2026年3月31日)
(自
至
2,831,607千円
48,137
△4,695
94,688
△124,951
2,844,786
2,844,786千円
47,001
89,522
95,286
△117,136
2,959,459
(3) 簡便法を適用した制度の、退職給付に係る負債の期首残高と期末残高の調整表
前連結会計年度
2024年4月1日
2025年3月31日)
(自
至
退職給付に係る負債の期首残高
退職給付費用
退職給付の支払額
退職給付に係る負債の期末残高
66,796千円
20,064
△15,094
71,765
当連結会計年度
2025年4月1日
2026年3月31日)
(自
至
71,765千円
16,316
△9,581
78,500
(4) 退職給付債務及び年金資産の期末残高と連結貸借対照表に計上された退職給付に係る負債及び退職給付に係る資
産の調整表
積立型制度の退職給付債務
年金資産
前連結会計年度
(2025年3月31日)
2,063,877千円
△2,918,712
当連結会計年度
(2026年3月31日)
1,923,213千円
△3,040,026
非積立型制度の退職給付債務
連結貸借対照表に計上された負債と資産の純額
△854,834
726,156
△128,677
△1,116,812
718,008
△398,804
退職給付に係る負債
退職給付に係る資産
連結貸借対照表に計上された負債と資産の純額
726,156
△854,834
△128,677
718,008
△1,116,812
△398,804
67/97
EDINET提出書類
藤倉コンポジット株式会社(E01094)
有価証券報告書
(5) 退職給付費用及びその内訳項目の金額
前連結会計年度
2024年4月1日
2025年3月31日)
(自
至
当連結会計年度
2025年4月1日
2026年3月31日)
(自
至
勤務費用
127,745千円
114,604千円
利息費用
35,604
51,951
期待運用収益
△48,137
△47,001
数理計算上の差異の費用処理額
△41,103
△28,955
過去勤務費用の費用処理額
12,510
―
簡便法で計算した退職給付費用
20,064
16,316
確定給付制度に係る退職給付費用
106,683
106,915
(注)上記の他、退職給付費用として割増退職金等の支払額が、前連結会計年度に2,626千円ございます。
(6) 退職給付に係る調整額
退職給付に係る調整額に計上した項目(法人税等及び税効果控除前)の内訳は次のとおりであります。
前連結会計年度
2024年4月1日
2025年3月31日)
(自
至
過去勤務費用
数理計算上の差異
合
12,510千円
166,187
178,698
計
当連結会計年度
2025年4月1日
2026年3月31日)
(自
至
―千円
246,824
246,824
(7) 退職給付に係る調整累計額
退職給付に係る調整累計額に計上した項目(法人税等及び税効果控除前)の内訳は次のとおりであります。
未認識数理計算上の差異
合計
前連結会計年度
(2025年3月31日)
△654,830千円
△654,830
当連結会計年度
(2026年3月31日)
△909,655千円
△909,655
(8) 年金資産に関する事項
①
年金資産の主な内訳
年金資産合計に対する主な分類ごとの比率は、次のとおりであります。
前連結会計年度
(2025年3月31日)
債券
株式
一般勘定
その他
合
②
44%
32
20
4
100
計
当連結会計年度
(2026年3月31日)
43%
30
19
8
100
長期期待運用収益率の設定方法
年金資産の長期期待運用収益率を決定するため、現在及び予想される年金資産の配分と、年金資産を構成する
多様な資産からの現在及び将来期待される長期の収益率を考慮しております。
(9) 数理計算上の計算基礎に関する事項
主要な数理計算上の計算基礎(加重平均で表わしております。)
割引率
長期期待運用収益率
予想昇給率
3
前連結会計年度
(2025年3月31日)
1.8〜2.0%
1.7%
9.8%
当連結会計年度
(2026年3月31日)
2.7〜3.0 %
1.7%
9.8%
確定拠出制度
当社の確定拠出制度への要拠出額は、前連結会計年度95,329千円、当連結会計年度98,918千円であります。
68/97
EDINET提出書類
藤倉コンポジット株式会社(E01094)
有価証券報告書
(税効果会計関係)
1
繰延税金資産及び繰延税金負債の発生の主な原因別の内訳
(単位 : 千円)
当連結会計年度
(2026年3月31日)
前連結会計年度
(2025年3月31日)
繰延税金資産
貸倒引当金限度超過額
253,708
262,251
未払事業税否認
48,924
55,117
賞与引当金
183,859
188,026
製品自主回収関連損失引当金
140,214
107,349
ゴルフ会員権評価損否認
44,614
44,614
減損損失
11,813
9,207
株式給付引当金
63,072
110,459
退職給付に係る負債
34,433
241,692
一括償却資産損金算入限度超過額
4,909
3,780
減価償却超過額
7,509
18,991
無形固定資産償却超過額
3,812
2,640
未払費用損金否認
12,818
14,582
投資有価証券評価損否認
98,532
92,219
米国子会社試験研究費資産計上
144,559
38,976
リース債務
105,444
143,844
―
169,043
税務上の繰越欠損金(注)
273,297
248,813
小計
税務上の繰越欠損金にかかる評価性引当額
(注)
将来減算一時差異等の合計に係る評価性引当
金
評価性引当額小計
1,431,527
1,751,610
―
△99,999
△412,887
△440,073
△412,887
△540,073
計
1,018,639
1,211,537
その他有価証券評価差額金
260,165
1,097,431
固定資産圧縮積立金
554,932
539,918
退職給付に係る資産
88,855
381,017
海外子会社減価償却費
208,331
253,136
使用権資産
96,247
120,272
その他
繰延税金負債
その他
計
繰延税金資産の純額
272,310
277,240
1,480,843
2,669,016
△462,203
△1,457,479
(注)税務上の繰越欠損金及びその繰延税金資産の繰越期限別の金額
当連結会計年度(2026年3月31日)
1年超
2年超
3年超
4年超
1年以内
2年以内 3年以内 4年以内 5年以内
税務上の繰越欠
―
―
―
24,715
9,462
損金(※1)
(単位 : 千円)
5年超
合計
134,865
169,043
評価性引当額
―
―
―
△24,715
△9,462
△65,821
△99,999
繰延税金資産
―
―
―
―
―
69,043
(※2)69,043
(※1)税務上の繰越欠損金は、法定実効税率を乗じた額であります。
(※2)税務上の繰越欠損金に係る繰延税金資産については、将来の課税所得の見込み等により、回収可能
と判断しております。
69/97
EDINET提出書類
藤倉コンポジット株式会社(E01094)
有価証券報告書
2
法定実効税率と税効果会計適用後の法人税等の負担率との間に重要な差異があるときの、当該差異の原因となった
主要な項目別の内訳
前連結会計年度
(2025年3月31日)
30.5%
法定実効税率
(調整)
評価性引当額純増減
住民税均等割
交際費等永久に損金に算入されない項目
受取配当金等永久に益金に算入されない項目
試験研究費等税額控除
海外子会社税率差異
税務上の繰越欠損金
その他
税効果会計適用後の法人税等の負担率
当連結会計年度
(2026年3月31日)
30.5%
0.7
0.4
0.8
△0.8
△2.6
△2.0
―
△5.9
2.4
0.4
0.6
△0.5
△1.2
△1.8
△3.2
△3.4
21.1
23.8
(資産除去債務関係)
資産除去債務のうち連結貸借対照表に計上しているもの
(1) 当該資産除去債務の概要
土地建物の不動産賃貸借契約に伴う原状回復義務等であります。
(2) 当該資産除去債務の金額の算定方法
使用見込期間は不動産賃貸借契約の契約期間と見積もっており、1年から38年であります。
割引率は0%から2.6%を使用して資産除去債務の金額を計算しております。
(3) 当該資産除去債務の総額の増減
前連結会計年度
2024年4月1日
2025年3月31日)
(自
至
期首残高
267,878千円
有形固定資産の取得に伴う増加額
188,483
時の経過による調整額
6,367
資産除去債務の履行による減少額
―
その他増減額(△は減少)
21,526
期末残高
484,254 千円
(注) 「その他増減額(△は減少)」は、主に為替変動によるものであります。
70/97
当連結会計年度
2025年4月1日
2026年3月31日)
(自
至
484,254千円
―
8,416
△60,000
△2,192
430,478 千円
EDINET提出書類
藤倉コンポジット株式会社(E01094)
有価証券報告書
(収益認識関係)
1
顧客との契約から生じる収益を分解した情報
前連結会計年度(自
2024年4月1日至
2025年3月31日)
(単位:千円)
報告セグメント
スポーツ
用品
合計
産業用資材
引布加工品
日本
13,588,247
2,576,523
5,475,368
345,956
21,986,095
米国
1,873,698
12,571
7,060,229
―
8,946,499
中国
4,440,823
53,787
38,651
―
4,533,262
その他
3,489,731
772,030
883,591
―
5,145,353
顧客との契約から生じる収益
23,392,501
3,414,912
13,457,841
345,956
40,611,211
外部顧客への売上高
23,392,501
3,414,912
13,457,841
345,956
40,611,211
当連結会計年度(自
2025年4月1日至
その他
2026年3月31日)
(単位:千円)
報告セグメント
スポーツ
用品
合計
産業用資材
引布加工品
その他
日本
14,099,222
3,099,176
5,292,203
345,586
22,836,189
米国
1,805,269
15,432
6,892,364
―
8,713,066
中国
4,243,078
31,269
22,810
―
4,297,157
その他
3,030,465
747,213
614,716
―
4,392,395
顧客との契約から生じる収益
23,178,035
3,893,092
12,822,094
345,586
40,238,809
外部顧客への売上高
23,178,035
3,893,092
12,822,094
345,586
40,238,809
(注) 在外子会社の収益及び費用は、従来、各社の決算日の直物為替相場により円貨に換算しておりましたが、当
連結会計年度の期首より期中平均為替相場により円貨に換算する方法に変更したため、前連結会計年度につ
いては、当該会計方針の変更を反映した遡及適用後の数値を記載しております。
2
顧客との契約から生じる収益を理解するための基礎となる情報
「注記事項(連結財務諸表作成のための基本となる重要な事項) 4 会計方針に関する事項 (5) 重要な収益及び費用
の計上基準」に記載のとおりであります。
3
顧客との契約に基づく履行義務の充足と当該契約から生じるキャッシュ・フローとの関係並びに当連結会計年度末
において存在する顧客との契約から翌連結会計年度以降に認識すると見込まれる収益の金額及び時期に関する情報
(1) 契約資産及び契約負債の残高等
当社グループでは、契約資産及び契約負債については、残高に重要性が乏しいため、記載を省略しております。
(2) 残存履行義務に配分した取引価格
当社グループでは、当初に予想される顧客との契約期間が1年以内であるため、残存履行義務に配分した取引価
格の総額及び収益の認識が見込まれる期間の記載を省略しております。
71/97
EDINET提出書類
藤倉コンポジット株式会社(E01094)
有価証券報告書
(セグメント情報等)
【セグメント情報】
1
報告セグメントの概要
当社の報告セグメントは、当社の構成単位のうち分離された財務情報が入手可能であり、取締役会が、経営資源の
配分の決定及び業績を評価するために、定期的に検討を行う対象となっているものであります。
当社グループの報告セグメントの区分方法は、製造方法・製造過程並びに使用目的及び販売方法の類似性を考慮し
て区分しており、「産業用資材」、「引布加工品」、「スポーツ用品」及び「その他」の4つを報告セグメントとし
ております。
「産業用資材」は、工業用精密ゴム部品、空圧制御機器、電気絶縁材料及び電気接続材料等を製造販売しておりま
す。「引布加工品」は、各種加工品及び各種ゴム引布を製造販売しております。「スポーツ用品」は、ゴルフ用カー
ボンシャフトの製造販売及びシューズ、ウェアなどのアウトドア用品の販売をしております。「その他」は、物品の
輸送及び保管サービスをしております。
2
報告セグメントごとの売上高、利益又は損失、資産、負債その他の項目の金額の算定方法
報告されている事業セグメントの会計処理の方法は、「連結財務諸表作成のための基本となる重要な事項」におけ
る記載と概ね同一であります。
報告セグメントの利益は、営業利益をベースとした数値であります。
セグメント間の内部収益及び振替高は市場実勢価格に基づいております。
「会計方針の変更」に記載のとおり、在外子会社の収益及び費用は、従来、各社の決算日の直物為替相場により円
貨に換算しておりましたが、当連結会計年度より期中平均為替相場により円貨に換算する方法に変更したため、前連
結会計年度については、当該会計方針の変更を反映した遡及適用後の数値を記載しております。この結果、遡及適用
前と比べて、前連結会計年度の外部顧客への売上高は、産業用資材で347,771千円、引布加工品で6,664千円、スポー
ツ用品で359,583千円それぞれ減少しております。また、セグメント利益は、産業用資材で20,632千円、スポーツ用品
で165,027千円それぞれ減少し、引布加工品はセグメント損失が779千円増加しております。
3
報告セグメントごとの売上高、利益又は損失、資産、負債その他の項目の金額に関する情報
前連結会計年度(自
2024年4月1日
至
2025年3月31日)
(単位:千円)
報告セグメント
産業用資材
引布加工品
スポーツ用品
その他
合計
売上高
外部顧客への売上高
セグメント間の
内部売上高又は振替高
23,392,501
3,414,912
13,457,841
345,956
40,611,211
―
―
―
107,688
107,688
23,392,501
3,414,912
13,457,841
453,645
40,718,900
199,363
△132,344
5,295,041
36,433
5,398,493
セグメント資産
24,637,679
2,997,814
9,309,962
199,401
37,144,857
その他の項目
減価償却費
有形固定資産及び
無形固定資産の増加額
1,103,917
70,631
223,533
21,911
1,419,993
1,548,018
126,022
670,382
44,318
2,388,741
計
セグメント利益又は損失(△)
72/97
EDINET提出書類
藤倉コンポジット株式会社(E01094)
有価証券報告書
当連結会計年度(自
2025年4月1日
至
2026年3月31日)
(単位:千円)
報告セグメント
産業用資材
引布加工品
スポーツ用品
その他
合計
売上高
外部顧客への売上高
セグメント間の
内部売上高又は振替高
23,178,035
3,893,092
12,822,094
345,586
40,238,809
―
―
―
107,677
107,677
計
23,178,035
3,893,092
12,822,094
453,264
40,346,486
セグメント利益
727,431
165,068
4,704,886
22,885
5,620,272
セグメント資産
24,897,022
2,812,634
8,310,831
190,266
36,210,755
1,172,177
67,500
221,718
28,003
1,489,400
888,011
78,516
839,895
31,339
1,837,764
その他の項目
減価償却費
有形固定資産及び
無形固定資産の増加額
4
報告セグメント合計額と連結財務諸表計上額との差額及び当該差額の主な内容(差異調整に関する事項)
(単位:千円)
利益又は損失(△)
前連結会計年度
報告セグメント計
当連結会計年度
5,398,493
5,620,272
552
552
全社費用(注)
△777,528
△782,322
連結財務諸表の営業利益
4,621,517
4,838,502
セグメント間取引消去
(注)
全社費用は、主に当社の総務部門、人事部門、経理部門にかかる費用であります。
(単位:千円)
資産
前連結会計年度
当連結会計年度
報告セグメント計
37,144,857
36,210,755
セグメント間取引消去
△346,095
△344,629
全社資産(注)
11,029,211
14,824,016
連結財務諸表の資産合計
47,827,974
50,690,143
(注)
全社資産は、主に報告セグメントに帰属しない土地建物であります。
(単位:千円)
報告セグメント計
その他の項目
減価償却費(注1)
調整額
連結財務諸表計上額
前連結
会計年度
当連結
会計年度
前連結
会計年度
当連結
会計年度
前連結
会計年度
当連結
会計年度
1,419,993
1,489,400
31,268
53,308
1,451,261
1,542,708
有形固定資産及び
2,388,741
1,837,764
1,105,497
△42,747
3,494,239
1,795,016
無形固定資産の増加額(注2)
(注) 1 減価償却費の調整額は、主に当社の建物及び機械装置の減価償却費であります。
2 有形固定資産及び無形固定資産の増加額の調整額は、主に当社の建物及び機械装置の設備投資額でありま
す。
73/97
EDINET提出書類
藤倉コンポジット株式会社(E01094)
有価証券報告書
【関連情報】
前連結会計年度(自
1
2024年4月1日
至
2025年3月31日)
製品及びサービスごとの情報
製品・サービスの区分の外部顧客への売上高は「セグメント情報」に記載の金額と同額のため、記載を省略してお
ります。
2
地域ごとの情報
(1) 売上高
(単位:千円)
日本
米国
21,986,095
(注)
中国
8,946,499
その他
4,533,262
5,145,353
合計
40,611,211
売上高は顧客の所在地を基礎とし、国又は地域に分類しております。
(2) 有形固定資産
日本
米国
10,026,422
3
中国
1,077,891
ベトナム
1,908,297
932,461
(単位:千円)
合計
13,945,072
主要な顧客ごとの情報
外部顧客への売上高のうち、連結損益計算書の売上高の10%以上を占める相手先がないため、記載はありません。
当連結会計年度(自
1
2025年4月1日
至
2026年3月31日)
製品及びサービスごとの情報
製品・サービスの区分の外部顧客への売上高は「セグメント情報」に記載の金額と同額のため、記載を省略してお
ります。
2
地域ごとの情報
(1) 売上高
(単位:千円)
日本
22,836,189
(注)
米国
8,713,066
中国
その他
4,297,157
4,392,395
合計
40,238,809
売上高は顧客の所在地を基礎とし、国又は地域に分類しております。
(2) 有形固定資産
日本
9,974,193
3
米国
1,291,559
中国
ベトナム
1,622,300
881,148
(単位:千円)
合計
13,769,200
主要な顧客ごとの情報
外部顧客への売上高のうち、連結損益計算書の売上高の10%以上を占める相手先がないため、記載はありません。
74/97
EDINET提出書類
藤倉コンポジット株式会社(E01094)
有価証券報告書
【報告セグメントごとの固定資産の減損損失に関する情報】
前連結会計年度(自
2024年4月1日
至
2025年3月31日)
(単位:千円)
産業用資材
引布加工品
スポーツ用品
93,552
―
―
減損損失
当連結会計年度(自
2025年4月1日
至
その他
全社・消去
―
―
合計
93,552
2026年3月31日)
(単位:千円)
産業用資材
引布加工品
スポーツ用品
39,258
―
―
減損損失
その他
全社・消去
―
―
合計
39,258
【報告セグメントごとののれんの償却額及び未償却残高に関する情報】
該当事項はありません。
【報告セグメントごとの負ののれん発生益に関する情報】
該当事項はありません。
【関連当事者情報】
関連当事者との取引
連結財務諸表提出会社と関連当事者との取引
連結財務諸表提出会社の親会社及び主要株主(会社等の場合に限る。)等
前連結会計年度(自
2024年4月1日
至
2025年3月31日)
㈱フジクラは、2024年5月13日付けで実施された自己株式立会外買付取引(ToSTNeT-3)による自己株式の取得に伴
い、議決権等の被所有割合が減少したことで当社の主要株主に該当しないこととなりました。
当連結会計年度(自
2025年4月1日
至
2026年3月31日)
該当事項はありません。
(1株当たり情報)
前連結会計年度
2024年4月1日
2025年3月31日)
(自
至
当連結会計年度
2025年4月1日
2026年3月31日)
(自
至
1株当たり純資産額
1,797円42銭
2,051円42銭
1株当たり当期純利益
190円46銭
208円61銭
(注) 1
2
3
潜在株式調整後1株当たり当期純利益については、潜在株式が存在しないため記載しておりません。
株式付与ESOP信託の信託財産として日本マスタートラスト信託銀行株式会社(株式付与ESOP信託口・80014
口)が保有する当社株式及び役員向け株式交付信託の信託財産として、株式会社日本カストディ銀行(信託
口)が所有している当社株式を、「1株当たり純資産額」の算定上、期末発行済株式総数から控除する自己
株式数に含めております(前連結会計年度288,780株、当連結会計年度906,772株)。
また、「1株当たり当期純利益」の算定上、期中平均株式数の計算において控除する自己株式に含めており
ます(前連結会計年度291,491株、当連結会計年度492,270株)。
1株当たり当期純利益の算定上の基礎は、以下のとおりであります。
75/97
EDINET提出書類
藤倉コンポジット株式会社(E01094)
有価証券報告書
前連結会計年度
2024年4月1日
2025年3月31日)
当連結会計年度
2025年4月1日
2026年3月31日)
(自
至
親会社株主に帰属する
当期純利益(千円)
(自
至
3,735,814
3,987,481
―
―
普通株式に係る親会社株主に
帰属する当期純利益(千円)
3,735,814
3,987,481
普通株式の期中平均株式数(株)
19,614,959
19,114,395
普通株主に帰属しない金額(千円)
(重要な後発事象)
生産拠点集約に伴う工場の閉鎖
当社は、2026年5月22日開催の取締役会において、生産拠点の一つである加須工場を閉鎖し、他の生産拠点へ集約
することを決議いたしました。
(1) 生産拠点集約の背景
当社は、これまで国内4つの生産拠点(岩槻、原町、加須、小高)で効率的な製造に努めてまいりました。し
かしながら、昨今の原材料・エネルギー価格等の高騰、および将来的な国内需要の変化への対応、また中長期的
な収益力を維持・強化するためには、生産体制の再編が不可欠であると判断いたしました。
(2) 閉鎖する工場の概要
工場名
加須工場
所在地
埼玉県加須市新利根1丁目4番4・4番5・4番6
事業内容
工業用ゴム部品及び空圧制御機器の製造
工場閉鎖予定日
2029年3月31日
(3) 従業員の処遇
当該事業の従業員につきましては、他事業所への配置転換を行います。
(4) 業績に与える影響
当社の中長期的な企業価値向上に資するものと判断しておりますが、現時点では、当連結会計年度の業績に与
える影響は軽微であります。今後大幅な影響が見込まれた場合には速やかに開示いたします。
76/97
EDINET提出書類
藤倉コンポジット株式会社(E01094)
有価証券報告書
⑤ 【連結附属明細表】
【社債明細表】
該当事項はありません。
【借入金等明細表】
当期首残高
(千円)
区分
当期末残高
(千円)
平均利率
(%)
返済期限
1年以内に返済予定の長期借入金
800,000
800,000
1.51
―
1年以内に返済予定のリース債務
67,587
65,559
4.25
―
2,800,000
2,000,000
1.51
2027年〜2029年
450,135
577,252
4.20
2027年〜2037年
4,117,722
3,442,812
―
―
長期借入金
(1年以内に返済予定のものを除く。)
リース債務
(1年以内に返済予定のものを除く。)
合計
(注) 1
2
リース債務の平均利率については、リース料総額に含まれる利息相当額を控除する前の金額でリース債務を
連結貸借対照表に計上しているリース債務を除き計算した「平均利率」を記載しております。
長期借入金及びリース債務(1年以内に返済予定のものを除く。)の連結決算日後5年間の返済予定額は以下
のとおりであります。
(単位 : 千円)
1年超2年以内
2年超3年以内
3年超4年以内
4年超5年以内
長期借入金
800,000
800,000
400,000
―
リース債務
55,366
45,190
40,773
41,344
当期首残高
(千円)
当期増加額
(千円)
【資産除去債務明細表】
区分
当期減少額
(千円)
当期末残高
(千円)
不動産賃貸借契約に伴う原状回復義務
463,454
6,224
60,000
409,678
石綿障害予防規則に基づくアスベスト
除去費用
20,800
―
―
20,800
合計
484,254
6,224
60,000
430,478
(2) 【その他】
当連結会計年度における半期情報等
売上高(千円)
税金等調整前
中間(当期)純利益(千円)
親会社株主に帰属する
中間(当期)純利益(千円)
1株当たり
中間(当期)純利益(円)
中間連結会計期間
当連結会計年度
20,230,472
40,238,809
3,025,315
5,233,548
2,199,008
3,987,481
114.77
208.61
77/97
EDINET提出書類
藤倉コンポジット株式会社(E01094)
有価証券報告書
2 【財務諸表等】
(1) 【財務諸表】
① 【貸借対照表】
(単位:千円)
前事業年度
(2025年3月31日)
資産の部
流動資産
現金及び預金
受取手形
売掛金
電子記録債権
商品及び製品
仕掛品
原材料及び貯蔵品
短期貸付金
その他
流動資産合計
固定資産
有形固定資産
建物
構築物
機械及び装置
土地
建設仮勘定
その他
有形固定資産合計
無形固定資産
ソフトウエア
その他
無形固定資産合計
投資その他の資産
投資有価証券
関係会社株式
関係会社出資金
長期貸付金
その他
貸倒引当金
投資その他の資産合計
固定資産合計
資産合計
※1
78/97
5,965,257
527,068
3,943,170
当事業年度
(2026年3月31日)
※1
6,998,685
29,277
3,668,042
2,966,482
1,882,379
2,454,500
47,029
※1
2,771,146
※1
352,517
3,275,352
1,530,058
2,248,507
46,369
※1
2,037,450
※1
367,223
20,909,552
20,200,967
2,383,354
137,343
1,703,111
2,665,577
2,086,807
420,466
3,561,330
121,982
2,182,786
2,665,577
237,924
582,847
9,396,660
9,352,447
38,244
114,304
34,372
285,786
152,548
320,159
1,533,592
707,340
1,837,762
※1
313,900
4,283,352
707,340
1,837,762
※1
279,136
529,065
△109,292
514,386
―
4,812,368
14,361,577
35,271,130
7,621,978
17,294,585
37,495,552
EDINET提出書類
藤倉コンポジット株式会社(E01094)
有価証券報告書
(単位:千円)
前事業年度
(2025年3月31日)
負債の部
流動負債
買掛金
電子記録債務
短期借入金
1年内返済予定の長期借入金
未払法人税等
賞与引当金
製品自主回収関連損失引当金
資産除去債務
その他
流動負債合計
固定負債
長期借入金
退職給付引当金
株式給付引当金
役員株式給付引当金
繰延税金負債
資産除去債務
環境対策引当金
製品自主回収関連損失引当金
その他
固定負債合計
負債合計
純資産の部
株主資本
資本金
資本剰余金
資本準備金
その他資本剰余金
資本剰余金合計
利益剰余金
利益準備金
その他利益剰余金
固定資産圧縮積立金
別途積立金
繰越利益剰余金
利益剰余金合計
自己株式
株主資本合計
評価・換算差額等
その他有価証券評価差額金
評価・換算差額等合計
純資産合計
負債純資産合計
※1
1,107,078
※1,※2
1,191,970
1,644,830
※1
800,000
70,147
511,791
252,700
60,000
2,192,511
当事業年度
(2026年3月31日)
※1
※1,※2
592,406
1,439,100
※1
800,000
75,132
500,600
207,666
―
1,460,278
7,831,028
※2
79/97
2,800,000
852,598
5,927,781
※2
2,000,000
737,771
201,155
―
100,626
210,258
9,283
201,700
86,904
753,369
352,283
10,278
945,360
213,201
9,283
134,700
78,184
4,347,701
12,178,729
4,496,661
10,424,442
3,804,298
3,804,298
3,207,390
247,989
3,207,390
―
3,455,379
3,207,390
328,105
328,105
1,069,894
3,000,000
16,715,086
1,021,611
3,000,000
15,597,738
21,113,086
△6,010,364
22,362,400
19,947,455
△2,430,252
24,528,892
730,000
2,542,217
730,000
23,092,401
35,271,130
2,542,217
27,071,109
37,495,552
EDINET提出書類
藤倉コンポジット株式会社(E01094)
有価証券報告書
② 【損益計算書】
売上高
売上原価
売上総利益
販売費及び一般管理費
荷造運送費
広告宣伝費
給料及び手当
賞与引当金繰入額
退職給付費用
福利厚生費
減価償却費
その他
販売費及び一般管理費合計
営業利益
営業外収益
受取利息
受取配当金
受取賃貸料
その他
営業外収益合計
営業外費用
支払利息
シンジケートローン手数料
為替差損
賃貸料原価
固定資産廃棄損
補償関連費用
その他
営業外費用合計
経常利益
特別利益
投資有価証券売却益
事業撤退損失引当金戻入額
補助金収入
特別利益合計
特別損失
固定資産廃棄損
製品自主回収関連損失引当金繰入額
関係会社清算損
特別損失合計
税引前当期純利益
法人税、住民税及び事業税
法人税等調整額
法人税等合計
当期純利益
前事業年度
(自 2024年4月1日
至 2025年3月31日)
※1
24,119,714
※1
19,510,024
(単位:千円)
当事業年度
(自 2025年4月1日
至 2026年3月31日)
※1
23,797,590
※1
18,934,130
4,609,689
4,863,460
※1
423,518
495,893
1,279,488
※1
377,487
426,938
1,185,044
※1
123,443
82,606
348,117
79,948
1,632,038
※1
117,040
73,103
331,513
54,008
1,496,845
4,465,053
144,635
17,556
2,682,436
※1
13,975
※1
37,855
4,061,981
801,478
※1
※1
37,471
3,679,263
※1
14,710
※1
53,009
※1
※1
2,751,824
121,634
※1
3,784,455
110,773
※1
70,666
14,179
2,124
3,405
―
29,983
241,994
214,858
2,654,465
4,371,075
512,954
52,101
※2
※3
※4
※5
22,001
―
―
163,087
587,057
163,087
159,231
454,400
―
―
5,942
―
80/97
―
22,522
2,102
17,252
33,450
28,757
※6
613,631
2,627,890
5,942
4,528,220
209,994
△188,654
275,532
7,468
21,339
2,606,550
283,001
4,245,219
EDINET提出書類
藤倉コンポジット株式会社(E01094)
有価証券報告書
③ 【株主資本等変動計算書】
前事業年度(自
2024年4月1日
至
2025年3月31日)
(単位:千円)
株主資本
資本剰余金
資本金
資本準備金
当期首残高
3,804,298
利益剰余金
その他
資本剰余金
利益準備金
資本剰余金
合計
3,207,390
247,989
3,455,379
328,105
その他利益剰余金
固定資産
別途積立金
圧縮積立金
繰越利益
剰余金
1,107,555
15,513,769
3,000,000
利益剰余金
合計
19,949,430
当期変動額
剰余金の配当
△1,442,894 △1,442,894
当期純利益
固定資産圧縮積立金
の取崩
△37,660
2,606,550
2,606,550
37,660
―
自己株式の取得
自己株式の処分
自己株式の消却
利益剰余金から資本
剰余金への振替
株主資本以外の項目
の当期変動額(純
額)
当期変動額合計
当期末残高
―
―
―
―
―
△37,660
―
1,201,317
1,163,656
3,804,298
3,207,390
247,989
3,455,379
328,105
1,069,894
3,000,000
16,715,086
21,113,086
株主資本
当期首残高
評価・換算差額等
株主資本
合計
その他
有価証券
評価差額金
評価・換算
差額等合計
純資産合計
自己株式
△413,427
26,795,681
741,242
741,242
27,536,924
当期変動額
剰余金の配当
△1,442,894
△1,442,894
当期純利益
2,606,550
2,606,550
―
―
△5,604,051 △5,604,051
△5,604,051
固定資産圧縮積立金
の取崩
自己株式の取得
自己株式の処分
7,113
7,113
7,113
自己株式の消却
利益剰余金から資本
剰余金への振替
株主資本以外の項目
の当期変動額(純
額)
△11,241
△11,241
△11,241
当期変動額合計
△5,596,937 △4,433,281
△11,241
△11,241 △4,444,523
当期末残高
△6,010,364
730,000
730,000
22,362,400
81/97
23,092,401
EDINET提出書類
藤倉コンポジット株式会社(E01094)
有価証券報告書
当事業年度(自
2025年4月1日
至
2026年3月31日)
(単位:千円)
株主資本
資本剰余金
資本金
当期首残高
3,804,298
資本準備金
その他
資本剰余金
3,207,390
247,989
利益剰余金
資本剰余金
利益準備金
合計
3,455,379
328,105
その他利益剰余金
固定資産
別途積立金
圧縮積立金
繰越利益
剰余金
1,069,894
16,715,086
3,000,000
利益剰余金
合計
21,113,086
当期変動額
剰余金の配当
△1,263,997 △1,263,997
当期純利益
固定資産圧縮積立金
の取崩
△48,283
4,245,219
4,245,219
48,283
―
自己株式の取得
自己株式の処分
328,282
自己株式の消却
△4,723,125 △4,723,125
利益剰余金から資本
剰余金への振替
株主資本以外の項目
の当期変動額(純
額)
当期変動額合計
当期末残高
4,146,853
4,146,853
△4,146,853 △4,146,853
―
―
△247,989
△247,989
―
△48,283
3,804,298
3,207,390
―
3,207,390
328,105
1,021,611
株主資本
当期首残高
328,282
評価・換算差額等
株主資本
合計
その他
有価証券
評価差額金
評価・換算
差額等合計
純資産合計
自己株式
△6,010,364
22,362,400
730,000
730,000
23,092,401
当期変動額
剰余金の配当
△1,263,997
△1,263,997
当期純利益
4,245,219
4,245,219
―
―
△2,040,403 △2,040,403
△2,040,403
固定資産圧縮積立金
の取崩
自己株式の取得
自己株式の処分
897,391
1,225,674
1,225,674
自己株式の消却
4,723,125
―
―
―
―
利益剰余金から資本
剰余金への振替
株主資本以外の項目
の当期変動額(純
額)
当期変動額合計
当期末残高
1,812,216
1,812,216
1,812,216
3,580,112
2,166,492
1,812,216
1,812,216
3,978,708
△2,430,252
24,528,892
2,542,217
2,542,217
27,071,109
82/97
― △1,117,348 △1,165,631
3,000,000
15,597,738
19,947,455
EDINET提出書類
藤倉コンポジット株式会社(E01094)
有価証券報告書
【注記事項】
(重要な会計方針)
1
有価証券の評価基準及び評価方法
(1) 子会社株式及び関連会社株式
移動平均法による原価法
(2) その他有価証券
①
市場価格のない株式等以外のもの
時価法(評価差額は全部純資産直入法により処理し、売却原価は移動平均法により算定)
②
市場価格のない株式等
移動平均法による原価法
2
棚卸資産の評価基準及び評価方法
移動平均法による原価法(貸借対照表価額は収益性の低下による簿価切下げの方法により算定)
3
固定資産の減価償却の方法
(1) 有形固定資産(リース資産を除く)
定額法を採用しております。
なお、主な耐用年数は以下のとおりであります。
建物
3年から50年
機械及び装置
2年から9年
(2) 無形固定資産(リース資産を除く)
定額法を採用しております。
なお、使用するソフトウエアについては、社内における利用可能期間(5年)に基づいております。
(3) リース資産
リース期間を耐用年数とし、残存価額を零とする定額法を採用しております。
4
引当金の計上基準
(1) 賞与引当金
従業員の賞与支給に備えるため、賞与支給見込額のうち当事業年度に負担すべき額を計上しております。
(2) 製品自主回収関連損失引当金
膨脹式救命いかだの部品または一部製品の無償交換に伴い発生する費用の見積額を計上しております。
(3) 退職給付引当金
従業員の退職給付に備えるため、当事業年度末における退職給付債務及び年金資産の見込額に基づき計上してお
ります。
数理計算上の差異は、各事業年度の発生時における従業員の平均残存勤務期間以内の一定の年数(10年)による定
額法により按分した額を、それぞれ発生の翌事業年度から費用処理しております。
過去勤務費用は、その発生時の従業員の平均残存勤務期間以内の一定の年数(10年)による定額法により費用処理
しております。
(4) 株式給付引当金
株式交付規定に基づく従業員への当社株式の交付に備えるため、当事業年度末における株式給付債務の見込額に
基づき計上しております。
(5) 役員株式給付引当金
株式交付規程に基づく当社取締役等への当社株式の交付に備えるため、当事業年度末における株式給付債務の見
込額に基づき計上しております。
(6) 環境対策引当金
「ポリ塩化ビフェニル廃棄物の適正な処理の推進に関する特別措置法」によって処理することが義務付けられて
いるPCB廃棄物の処理費用見積額に基づき計上しております。
83/97
EDINET提出書類
藤倉コンポジット株式会社(E01094)
有価証券報告書
5
収益及び費用の計上基準
当社の重要な収益及び費用の計上基準は以下の通りであります。
(1) 製品販売収益
国内製品販売においては出荷から着荷までの期間が3日以内でほぼ100%となっていることから「収益認識に関す
る会計基準の適用指針第98項」に定める代替的な計上基準として出荷基準を採用しております。輸出製品販売にお
いては船積時点で危険負担と費用負担が顧客に移転することから船積基準を採用しております。
(2) ライセンス料収益
海外子会社の技術支援料、知財、製造ノウハウ等に係る収入として、ロイヤリティに係る収益を計上しておりま
す。金額的重要性や事務処理面の実行可能性を考慮し、海外子会社での実際販売時の翌月に収益を計上しておりま
す。
(3) 金型収益
顧客に支配が移転するものについては、支配移転時に売上を一括で計上しております。
(4) 救命器具等整備業務収益
整備サービスの完了時点で収益を計上しております。
6
その他財務諸表作成のための基本となる重要な事項
退職給付に係る会計処理
退職給付に係る未認識数理計算上の差異及び未認識過去勤務費用の未処理額の会計処理の方法は、連結財務諸表
におけるこれらの会計処理の方法と異なっております。
(重要な会計上の見積り)
固定資産の減損に係る見積り
(1) 当事業年度の財務諸表に計上した金額
前事業年度
(2025年3月31日)
(単位 : 千円)
当事業年度
(2026年3月31日)
有形固定資産
9,396,660
9,352,447
無形固定資産
152,548
320,159
(2) 識別した項目に係る重要な会計上の見積りの内容に関する情報
連結財務諸表「注記事項(重要な会計上の見積り)
固定資産の減損に係る見積り
(1)藤倉コンポジット株式会
社」に同一の内容を記載しているため、注記を省略しております。
(表示方法の変更)
貸借対照表関係
前事業年度において、「流動負債」の「短期借入金」に含まれていた「1年内返済予定の長期借入金」は、明瞭
性を高める観点から区分掲記することとしました。この表示方法の変更を反映させるため、前事業年度の財務諸表
の組替えを行っております。
この結果、前事業年度の貸借対照表において、「流動負債」の「短期借入金」に表示していた2,444,830千円は、
「短期借入金」1,644,830千円、「1年内返済予定の長期借入金」800,000千円として組替えております。
(追加情報)
(従業員等に信託を通じて自社の株式を交付する取引)
連結財務諸表「注記事項(追加情報)
従業員等に信託を通じて自社の株式を交付する取引」に同一の内容を記載
しているため、注記を省略しております。
(役員向け株式交付信託)
連結財務諸表「注記事項(追加情報)
役員向け株式交付信託」に同一の内容を記載しているため、注記を省略し
ております。
84/97
EDINET提出書類
藤倉コンポジット株式会社(E01094)
有価証券報告書
(貸借対照表関係)
※1
関係会社に対する資産及び負債
区分表示されたもの以外で当該関係会社に対する金銭債権又は金銭債務の金額は、次のとおりであります。
(単位 : 千円)
前事業年度
当事業年度
(2025年3月31日)
(2026年3月31日)
短期金銭債権
3,150,074
2,398,550
※2
長期金銭債権
313,900
277,900
短期金銭債務
1,982,106
1,614,279
財務制限条項
「1 連結財務諸表等 (1)連結財務諸表注記事項(連結貸借対照表関係)3 財務制限条項」に同一の内容を記載
しているため、注記を省略しています。
(損益計算書関係)
※1
関係会社との営業取引及び営業取引以外の取引の取引高の総額
前事業年度
(自 2024年4月1日
至 2025年3月31日)
(単位 : 千円)
当事業年度
(自 2025年4月1日
至 2026年3月31日)
営業取引による取引高
売上高
1,654,423
1,120,778
仕入高
3,246,090
2,860,376
2,737,802
3,720,982
営業取引以外の取引による取引高
※2
投資有価証券売却益
連結財務諸表「注記事項(連結損益及び包括利益計算書関係)
投資有価証券売却益」に同一の内容を記載している
ため、注記を省略しております。
※3
事業撤退損失引当金戻入額
連結財務諸表「注記事項(連結損益及び包括利益計算書関係)
事業撤退損失引当金戻入額」に同一の内容を記載し
ているため、注記を省略しております。
※4
固定資産廃棄損
連結財務諸表「注記事項(連結損益及び包括利益計算書関係)
固定資産廃棄損」に同一の内容を記載しているた
め、注記を省略しております。
※5
製品自主回収関連損失引当金繰入額
連結財務諸表「注記事項(連結損益及び包括利益計算書関係)
製品自主回収関連損失引当金繰入額」に同一の内容
を記載しているため、注記を省略しております。
※6
関係会社清算損の注記
前事業年度(自
2024年4月1日
至
2025年3月31日)
至
2026年3月31日)
該当事項はありません。
当事業年度(自
2025年4月1日
FUJIKURA GRAPHICS,INC.の清算に伴い発生した費用を計上しております。
85/97
EDINET提出書類
藤倉コンポジット株式会社(E01094)
有価証券報告書
(有価証券関係)
子会社株式及び関連会社株式(当事業年度の貸借対照表計上額は子会社株式705,390千円、関連会社株式1,950千
円、前事業年度の貸借対照表計上額は子会社株式705,390千円、関連会社株式1,950千円)は、市場価格のない株式等
のため、子会社株式及び関連会社株式の時価を記載しておりません。
(税効果会計関係)
1
繰延税金資産及び繰延税金負債の発生の主な原因別の内訳
前事業年度
(2025年3月31日)
(単位 : 千円)
当事業年度
(2026年3月31日)
繰延税金資産
未払事業税否認
18,355
22,280
賞与引当金
155,888
156,964
製品自主回収関連損失引当金
140,214
107,349
ゴルフ会員権評価損否認
44,614
44,614
貸倒引当金
34,268
―
退職給付引当金
230,837
236,220
株式給付引当金
63,072
110,459
一括償却資産損金算入限度超過額
4,731
3,626
投資有価証券評価損
43,771
43,771
関係会社株式評価損
334,706
334,706
関係会社出資金評価損
82,277
82,277
関係会社出資金有償減資
48,900
48,900
有形固定資産償却超過額
12,487
26,266
無形固定資産償却超過額
3,812
2,640
環境対策引当金
2,910
2,910
減損損失
9,059
6,355
資産除去債務
84,202
66,849
その他
153,461
128,333
1,467,573
1,424,526
△606,573
△575,527
861,000
848,999
その他有価証券評価差額金
260,165
1,097,431
固定資産圧縮積立金
554,932
539,918
前払年金費用
88,855
103,164
資産除去債務に対応する除去費用
57,673
53,845
961,626
1,794,360
△100,626
△945,360
小計
評価性引当額
計
繰延税金負債
計
繰延税金資産の純額
86/97
EDINET提出書類
藤倉コンポジット株式会社(E01094)
有価証券報告書
2
法定実効税率と税効果会計適用後の法人税等の負担率との間に重要な差異があるときの、当該差異の原因となっ
た主要な項目別の内訳
前事業年度
(2025年3月31日)
当事業年度
(2026年3月31日)
30.5%
30.5%
△0.0
△0.7
住民税均等割
0.6
0.4
交際費等永久に損金に算入されない項目
1.3
0.7
受取配当金等永久に益金に算入されない項目
△29.2
△23.2
試験研究費等税額控除
△2.6
△2.8
その他
0.2
1.4
税効果会計適用後の法人税等の負担率
0.8
6.3
法定実効税率
(調整)
評価性引当額純増減
(収益認識関係)
顧客との契約から生じる収益を理解するための基礎となる情報は、「注記事項(重要な会計方針) 5 収益及び費
用の計上基準」に記載のとおりであります。
(重要な後発事象)
生産拠点集約に伴う工場の閉鎖
生産拠点集約に伴う工場の閉鎖は、連結財務諸表「注記事項(重要な後発事象)」に同一内容を記載しているため、
記載を省略しております。
87/97
EDINET提出書類
藤倉コンポジット株式会社(E01094)
有価証券報告書
④ 【附属明細表】
【有形固定資産等明細表】
(単位 : 千円)
当期首
残高
当期
増加額
当期
償却額
当期末
残高
減価償却
累計額
建物
2,383,354
1,437,739
0
259,763
3,561,330
4,956,671
構築物
137,343
―
―
15,361
121,982
594,702
機械及び装置
1,703,111
878,850
1,666
396,774
2,182,786
7,990,465
土地
2,665,577
―
―
―
2,665,577
―
建設仮勘定
2,086,807
849,415
2,698,298
―
237,924
―
420,466
363,776
710
201,419
582,847
2,769,148
9,396,660
3,529,781
2,700,675
873,319
ソフトウエア
38,244
9,962
―
13,834
34,372
―
その他
114,304
183,528
9,962
2,083
285,786
―
152,548
193,491
9,962
15,917
320,159
―
区分
資産の種類
有形固定
資産
その他
計
無形固定
資産
計
(注)
当期
減少額
9,352,447 16,310,988
「当期増加額」欄のうち、主なものは次のとおりであります。
建
物
1,411,564千円小高工場 CMC棟(Control equipment Manufacturing Center)改修費
機械及び装置
184,000千円小高工場平面研削盤
機械及び装置
134,500千円小高工場 5面加工機
【引当金明細表】
(単位 : 千円)
科目
当期首残高
当期増加額
当期減少額
当期末残高
貸倒引当金
109,292
―
109,292
―
賞与引当金
511,791
500,600
511,791
500,600
製品自主回収関連損失
引当金
454,400
―
112,033
342,366
株式給付引当金
201,155
167,427
16,299
352,283
―
10,278
―
10,278
9,283
―
―
9,283
役員株式給付引当金
環境対策引当金
(2) 【主な資産及び負債の内容】
連結財務諸表を作成しているため、記載を省略しております。
(3) 【その他】
該当事項はありません。
88/97
EDINET提出書類
藤倉コンポジット株式会社(E01094)
有価証券報告書
第6 【提出会社の株式事務の概要】
事業年度
4月1日から3月31日まで
定時株主総会
6月中
基準日
3月31日
剰余金の配当の基準日
9月30日
3月31日
1単元の株式数
100株
単元未満株式の買取り
取扱場所
株主名簿管理人
取次所
買取手数料
公告掲載方法
株主に対する特典
(注)
(特別口座)
東京都千代田区丸の内一丁目4番1号
三井住友信託銀行株式会社証券代行部
(特別口座)
東京都千代田区丸の内一丁目4番1号
三井住友信託銀行株式会社
──────
株式の売買の委託に係る手数料相当額として別途定める金額
当会社の公告方法は、電子公告となっております。ただし、事故その他やむを得ない
事由によって電子公告による公告をすることができない場合の公告方法は、東京都に
おいて発行する日本経済新聞に掲載することとなっております。
当社のホームページ(https://www.fujikuracomposites.jp/)
株主優待制度
対象株主
(1)毎年9月末日現在、及び3月末日現在の株主名簿及び実質株主名簿に記載または
記録された1単元(100株)以上保有の株主。
優待内容
① アウトドア商品の割引販売(3月及び9月)
・子会社㈱キャラバンの通信販売による。
② ゴルフクラブリシャフト40%割引券2枚(3月及び9月)
・子会社㈱アールアンドアールフジクラのゴルフクラブ相談室での店頭販売に
よる。
(2)500株以上を継続3年以上保有株主に対し、3年毎に実施。
優待内容
フジクラブランドのリシャフト1本無料またはキャラバンシューズ1足無料の
どちらかを選択可能な優待券
当社の定款の定めにより、単元未満株主は、会社法第189条第2項各号に掲げる権利、会社法第166条第1項の
規定による請求をする権利並びに株主の有する株式数に応じて募集株式の割当及び募集新株予約権の割当を受
ける権利を有しておりません。
89/97
EDINET提出書類
藤倉コンポジット株式会社(E01094)
有価証券報告書
第7 【提出会社の参考情報】
1 【提出会社の親会社等の情報】
当社は、金融商品取引法第24条の7第1項に規定する親会社等はありません。
2 【その他の参考情報】
当事業年度の開始日から有価証券報告書提出日までの間に、次の書類を提出しております。
(1) 有価証券報告書及びその添付書類並びに確認書
事業年度(第146期)(自
2024年4月1日
至
2025年3月31日)
2025年6月25日
関東財務局長に提出
至
2025年3月31日)
2025年6月25日
関東財務局長に提出
(2) 内部統制報告書及びその添付書類
事業年度(第146期)(自
2024年4月1日
(3) 半期報告書及び確認書
(第147期中)(自
2025年4月1日
至
2025年9月30日)
2025年11月10日
関東財務局長に提出
(4) 臨時報告書
2025年6月27日
関東財務局長に提出
金融商品取引法第24条の5第4項及び企業内容等の開示に関する内閣府令第19条第2項第9号の2(株主総会
における議決権行使の結果)の規定に基づく臨時報告書であります。
(5) 有価証券届出書(参照方式)及びその添付書類
2025年11月10日
関東財務局長に提出
株式付与ESOP信託の継続に伴う第三者割当による自己株式処分
(6) 自己株券買付状況報告書
2026年1月9日、2026年2月6日、2026年3月6日、2026年4月7日、2026年5月12日、2026年6月5日関東財
務局長に提出。
90/97
EDINET提出書類
藤倉コンポジット株式会社(E01094)
有価証券報告書
第二部【提出会社の保証会社等の情報】
該当事項はありません。
91/97
EDINET提出書類
藤倉コンポジット株式会社(E01094)
有価証券報告書
独立監査人の監査報告書及び内部統制監査報告書
2026年6月24日
藤倉コンポジット株式会社
取締役会御中
太陽有限責任監査法人
東京事務所
指定有限責任社員
業務執行社員
公認会計士
和田
磨紀郎
指定有限責任社員
業務執行社員
公認会計士
堤
康
<連結財務諸表監査>
監査意見
当監査法人は、金融商品取引法第193条の2第1項の規定に基づく監査証明を行うため、「経理の状況」に掲げられて
いる藤倉コンポジット株式会社の2025年4月1日から2026年3月31日までの連結会計年度の連結財務諸表、すなわち、
連結貸借対照表、連結損益及び包括利益計算書、連結株主資本等変動計算書、連結キャッシュ・フロー計算書、連結財
務諸表作成のための基本となる重要な事項、その他の注記及び連結附属明細表について監査を行った。
当監査法人は、上記の連結財務諸表が、我が国において一般に公正妥当と認められる企業会計の基準に準拠して、藤
倉コンポジット株式会社及び連結子会社の2026年3月31日現在の財政状態並びに同日をもって終了する連結会計年度の
経営成績及びキャッシュ・フローの状況を、全ての重要な点において適正に表示しているものと認める。
監査意見の根拠
当監査法人は、我が国において一般に公正妥当と認められる監査の基準に準拠して監査を行った。監査の基準におけ
る当監査法人の責任は、「連結財務諸表監査における監査人の責任」に記載されている。当監査法人は、我が国におけ
る職業倫理に関する規定(社会的影響度の高い事業体の財務諸表監査に適用される規定を含む。)に従って、会社及び
連結子会社から独立しており、また、監査人としてのその他の倫理上の責任を果たしている。当監査法人は、意見表明
の基礎となる十分かつ適切な監査証拠を入手したと判断している。
監査上の主要な検討事項
監査上の主要な検討事項とは、当連結会計年度の連結財務諸表の監査において、監査人が職業的専門家として特に重
要であると判断した事項である。監査上の主要な検討事項は、連結財務諸表全体に対する監査の実施過程及び監査意見
の形成において対応した事項であり、当監査法人は、当該事項に対して個別に意見を表明するものではない。
92/97
EDINET提出書類
藤倉コンポジット株式会社(E01094)
有価証券報告書
藤倉コンポジット株式会社の固定資産(加須工場)に係る減損の認識判定
監査上の主要な検討事項の
内容及び決定理由
藤倉コンポジット株式会社(以下「会社」という。)
は、2026年3月31日現在、連結貸借対照表上、有形固定
資産13,769,200千円及び無形固定資産451,556千円を計
上しており、そのうち【注記事項】(会計上の見積りに
関する注記)に記載されているとおり、会社の有形固定
資産9,352,447千円及び無形固定資産320,159千円が計上
されている。
【注記事項】(重要な後発事象)に記載されているとお
り、取締役会において、生産拠点の一つである加須工場
を閉鎖し、他の生産拠点へ集約することを決議した。ま
た、【注記事項】(会計上の見積りに関する注記)に記
載されているとおり、会社の産業用資材セグメントの一
部事業について、加須工場の閉鎖決定に伴い回収可能価
額を著しく低下させる可能性がある事象が発生したとし
て、当該工場の資産グループに減損の兆候があると判断
し、固定資産の減損損失の認識の判定を行っている。
会社の工場閉鎖までに生じる割引前将来キャッシュ・
フロー総額の見積りは、工場閉鎖時点における正味売却
価額をもとに算定しているが、当該見積額が資産グルー
プの帳簿価額を上回ったため、会社は減損損失を認識し
ていない。
会社が判断の基礎とした割引前将来キャッシュ・フ
ロー総額の見積りは、工場閉鎖予定日までのキャッ
シュ・フローの見積りと外部の専門家から入手した不動
産鑑定評価に基づくものであり、主要な仮定は土地の更
地価格、建物の再調達原価等である。
減損の認識判定における割引前将来キャッシュ・フ
ロー総額の見積り及び当該見積りに使用された仮定は経
営者による主観的な判断を伴い、不確実性があることか
ら、当監査法人は当該事項を監査上の主要な検討事項に
該当すると判断した。
監査上の対応
当監査法人は、会社の固定資産(加須工場)に係る減損
の認識判定を検討するに当たり、主として以下の監査手
続を実施した。
・減損の兆候の把握及び減損損失の認識の判定に関連
する会社の内部統制を理解した。
・使用範囲又は方法について回収可能価額を著しく低
下させる可能性についての経営者の認識及び翌期以降
の損益の見通しを把握するために、経営者等と協議を
行うとともに、取締役会等の会議体の議事録を閲覧し
た。
・工場閉鎖予定日までのキャッシュ・フローの見積り
について、会社が作成した減損検討資料を閲覧すると
ともに、割引前将来キャッシュ・フロー総額の見積り
に与える影響を検討した。
・正味売却価額の合理性を評価するため、当該見積り
の基礎とされた不動産鑑定評価額に関して、経営者の
利用する外部の専門家である不動産鑑定士の適正、能
力及び客観性を評価した。
・不動産鑑定評価書を閲覧し、鑑定評価額算定の前
提、採用した鑑定評価手法及び評価額決定に至る判断
過程を把握するとともに、工場閉鎖時点における将来
キャッシュ・フローの見積りに合理的に調整されてい
ることを確かめた。
・評価に影響する事象を把握するため、経営者等に対
して質問を実施し、工場閉鎖までのスケジュール、減
損検討の対象となる固定資産の今後の処分方針等につ
いて検討した。
株式会社キャラバン及びIER Fujikura,Inc.の固定資産に係る減損
監査上の主要な検討事項の
内容及び決定理由
監査上の対応
会社は、2026年3月31日現在、連結貸借対照表上、有
形固定資産13,769,200千円及び無形固定資産451,556千
円を計上している。
これには、【注記事項】(重要な会計上の見積り)に記
載されているとおり、連結子会社である株式会社キャラ
バンの有形固定資産545,468千円、無形固定資産80,788
千円及び海外連結子会社であるIER Fujikura,Inc.の有
形固定資産599,594千円、無形固定資産12,652千円が含
まれている。
いずれも事業環境の変化に伴い収益性が低下し、減損
の兆候があると判断したが、当該資産グループから見込
まれる正味売却価額が帳簿価額を上回っていたことか
ら、減損損失を認識していない。
会社が判断の基礎とした正味売却価額は、外部の専門
家から入手した不動産鑑定評価額等に基づくものであ
り、株式会社キャラバンの正味売却価額の主要な仮定は
土地 の 更地価格、建物 の 再調達原価等、 IER
Fujikura,Inc.の正味売却価額については取引事例比較
法に基づいている。
当該正味売却価額の算定には専門的な判断を伴うこと
から、当監査法人は当該事項を監査上の主要な検討事項
に該当すると判断した。
当監査法人 は 、株式会社 キ ャ ラ バ ン 及 び IER
Fujikura,Inc.の固定資産に係る減損について検討する
に当たり、主として以下の監査手続を実施した。
・経営環境の著しい悪化に係る経営者の認識及び翌期
以降の損益の見通しを把握するために、経営者等と協
議を行うとともに、取締役会等の会議体の議事録を閲
覧した。
・正味売却価額の基礎となる不動産鑑定評価額の妥当
性を評価するに当たり、以下の手続を実施した。
- 経営者が利用した専門家の適性、能力及び客観
性
を評価して、作業結果を監査証拠として利用する
ことの妥当性について検討した。
- 経営者の利用する専門家の作成した不動産鑑定評
価書を閲覧して、不動産鑑定評価額の前提条件や
採用した評価手法、評価額決定に至る判断過程を
把握した。
- 外部の不動産鑑定評価の専門家を関与させ、経営
者の利用する専門家の前提条件や評価手法の合理
性を評価するとともに、不動産鑑定評価額が近隣
の取引事例等の利用可能な外部データに基づいて
算定されていることを確かめた。
その他の記載内容
その他の記載内容は、有価証券報告書に含まれる情報のうち、連結財務諸表及び財務諸表並びにこれらの監査報告書
以外の情報である。経営者の責任は、その他の記載内容を作成し開示することにある。また、監査等委員会の責任は、
その他の記載内容の報告プロセスの整備及び運用における取締役の職務の執行を監視することにある。
当監査法人の連結財務諸表に対する監査意見の対象にはその他の記載内容は含まれておらず、当監査法人はその他の
記載内容に対して意見を表明するものではない。
連結財務諸表監査における当監査法人の責任は、その他の記載内容を通読し、通読の過程において、その他の記載内
容と連結財務諸表又は当監査法人が監査の過程で得た知識との間に重要な相違があるかどうか検討すること、また、そ
のような重要な相違以外にその他の記載内容に重要な誤りの兆候があるかどうか注意を払うことにある。
93/97
EDINET提出書類
藤倉コンポジット株式会社(E01094)
有価証券報告書
当監査法人は、実施した作業に基づき、その他の記載内容に重要な誤りがあると判断した場合には、その事実を報告
することが求められている。
その他の記載内容に関して、当監査法人が報告すべき事項はない。
連結財務諸表に対する経営者及び監査等委員会の責任
経営者の責任は、我が国において一般に公正妥当と認められる企業会計の基準に準拠して連結財務諸表を作成し適正
に表示することにある。これには、不正又は誤謬による重要な虚偽表示のない連結財務諸表を作成し適正に表示するた
めに経営者が必要と判断した内部統制を整備及び運用することが含まれる。
連結財務諸表を作成するに当たり、経営者は、継続企業の前提に基づき連結財務諸表を作成することが適切であるか
どうかを評価し、我が国において一般に公正妥当と認められる企業会計の基準に基づいて継続企業に関する事項を開示
する必要がある場合には当該事項を開示する責任がある。
監査等委員会の責任は、財務報告プロセスの整備及び運用における取締役の職務の執行を監視することにある。
連結財務諸表監査における監査人の責任
監査人の責任は、監査人が実施した監査に基づいて、全体としての連結財務諸表に不正又は誤謬による重要な虚偽表
示がないかどうかについて合理的な保証を得て、監査報告書において独立の立場から連結財務諸表に対する意見を表明
することにある。虚偽表示は、不正又は誤謬により発生する可能性があり、個別に又は集計すると、連結財務諸表の利
用者の意思決定に影響を与えると合理的に見込まれる場合に、重要性があると判断される。
監査人は、我が国において一般に公正妥当と認められる監査の基準に従って、監査の過程を通じて、職業的専門家と
しての判断を行い、職業的懐疑心を保持して以下を実施する。
・不正又は誤謬による重要な虚偽表示リスクを識別し、評価する。また、重要な虚偽表示リスクに対応した監査手続
を立案し、実施する。監査手続の選択及び適用は監査人の判断による。さらに、意見表明の基礎となる十分かつ適切
な監査証拠を入手する。
・連結財務諸表監査の目的は、内部統制の有効性について意見表明するためのものではないが、監査人は、リスク評
価の実施に際して、状況に応じた適切な監査手続を立案するために、監査に関連する内部統制を検討する。
・経営者が採用した会計方針及びその適用方法の適切性、並びに経営者によって行われた会計上の見積りの合理性及
び関連する注記事項の妥当性を評価する。
・経営者が継続企業を前提として連結財務諸表を作成することが適切であるかどうか、また、入手した監査証拠に基
づき、継続企業の前提に重要な疑義を生じさせるような事象又は状況に関して重要な不確実性が認められるかどうか
結論付ける。継続企業の前提に関する重要な不確実性が認められる場合は、監査報告書において連結財務諸表の注記
事項に注意を喚起すること、又は重要な不確実性に関する連結財務諸表の注記事項が適切でない場合は、連結財務諸
表に対して除外事項付意見を表明することが求められている。監査人の結論は、監査報告書日までに入手した監査証
拠に基づいているが、将来の事象や状況により、企業は継続企業として存続できなくなる可能性がある。
・連結財務諸表の表示及び注記事項が、我が国において一般に公正妥当と認められる企業会計の基準に準拠している
かどうかとともに、関連する注記事項を含めた連結財務諸表の表示、構成及び内容、並びに連結財務諸表が基礎とな
る取引や会計事象を適正に表示しているかどうかを評価する。
・連結財務諸表に対する意見表明の基礎となる、会社及び連結子会社の財務情報に関する十分かつ適切な監査証拠を
入手するために、連結財務諸表の監査を計画し実施する。監査人は、連結財務諸表の監査に関する指揮、監督及び査
閲に関して責任がある。監査人は、単独で監査意見に対して責任を負う。
監査人は、監査等委員会に対して、計画した監査の範囲とその実施時期、監査の実施過程で識別した内部統制の重要
な不備を含む監査上の重要な発見事項、及び監査の基準で求められているその他の事項について報告を行う。
監査人は、監査等委員会に対して、独立性についての我が国における職業倫理に関する規定を遵守したこと、並びに
監査人の独立性に影響を与えると合理的に考えられる事項、及び阻害要因を除去するための対応策を講じている場合又
は阻害要因を許容可能な水準にまで軽減するためのセーフガードを適用している場合はその内容について報告を行う。
監査人は、監査等委員会と協議した事項のうち、当連結会計年度の連結財務諸表の監査で特に重要であると判断した
事項を監査上の主要な検討事項と決定し、監査報告書において記載する。ただし、法令等により当該事項の公表が禁止
されている場合や、極めて限定的ではあるが、監査報告書において報告することにより生じる不利益が公共の利益を上
回ると合理的に見込まれるため、監査人が報告すべきでないと判断した場合は、当該事項を記載しない。
94/97
EDINET提出書類
藤倉コンポジット株式会社(E01094)
有価証券報告書
<内部統制監査>
監査意見
当監査法人は、金融商品取引法第193条の2第2項の規定に基づく監査証明を行うため、藤倉コンポジット株式会社の
2026年3月31日現在の内部統制報告書について監査を行った。
当監査法人は、藤倉コンポジット株式会社が2026年3月31日現在の財務報告に係る内部統制は有効であると表示した
上記の内部統制報告書が、我が国において一般に公正妥当と認められる財務報告に係る内部統制の評価の基準に準拠し
て、財務報告に係る内部統制の評価結果について、全ての重要な点において適正に表示しているものと認める。
監査意見の根拠
当監査法人は、我が国において一般に公正妥当と認められる財務報告に係る内部統制の監査の基準に準拠して内部統
制監査を行った。財務報告に係る内部統制の監査の基準における当監査法人の責任は、「内部統制監査における監査人
の責任」に記載されている。当監査法人は、我が国における職業倫理に関する規定(社会的影響度の高い事業体の財務
諸表監査に適用される規定を含む。)に従って、会社及び連結子会社から独立しており、また、監査人としてのその他
の倫理上の責任を果たしている。当監査法人は、意見表明の基礎となる十分かつ適切な監査証拠を入手したと判断して
いる。
内部統制報告書に対する経営者及び監査等委員会の責任
経営者の責任は、財務報告に係る内部統制を整備及び運用し、我が国において一般に公正妥当と認められる財務報告
に係る内部統制の評価の基準に準拠して内部統制報告書を作成し適正に表示することにある。
監査等委員会の責任は、財務報告に係る内部統制の整備及び運用状況を監視、検証することにある。
なお、財務報告に係る内部統制により財務報告の虚偽の記載を完全には防止又は発見することができない可能性があ
る。
内部統制監査における監査人の責任
監査人の責任は、監査人が実施した内部統制監査に基づいて、内部統制報告書に重要な虚偽表示がないかどうかにつ
いて合理的な保証を得て、内部統制監査報告書において独立の立場から内部統制報告書に対する意見を表明することに
ある。
監査人は、我が国において一般に公正妥当と認められる財務報告に係る内部統制の監査の基準に従って、監査の過程
を通じて、職業的専門家としての判断を行い、職業的懐疑心を保持して以下を実施する。
・内部統制報告書における財務報告に係る内部統制の評価結果について監査証拠を入手するための監査手続を実施す
る。内部統制監査の監査手続は、監査人の判断により、財務報告の信頼性に及ぼす影響の重要性に基づいて選択及び
適用される。
・財務報告に係る内部統制の評価範囲、評価手続及び評価結果について経営者が行った記載を含め、全体としての内
部統制報告書の表示を検討する。
・内部統制報告書における財務報告に係る内部統制の評価結果に関する十分かつ適切な監査証拠を入手するために、
内部統制の監査を計画し実施する。監査人は、内部統制報告書の監査に関する指揮、監督及び査閲に関して責任があ
る。
監査人は、単独で監査意見に対して責任を負う。
監査人は、監査等委員会に対して、計画した内部統制監査の範囲とその実施時期、内部統制監査の実施結果、識別し
た内部統制の開示すべき重要な不備、その是正結果、及び内部統制の監査の基準で求められているその他の事項につい
て報告を行う。
監査人は、監査等委員会に対して、独立性についての我が国における職業倫理に関する規定を遵守したこと、並びに
監査人の独立性に影響を与えると合理的に考えられる事項、及び阻害要因を除去するための対応策を講じている場合又
は阻害要因を許容可能な水準にまで軽減するためのセーフガードを適用している場合はその内容について報告を行う。
<報酬関連情報>
当監査法人及び当監査法人と同一のネットワークに属する者に対する、会社及び子会社の監査証明業務に基づく報酬
及び非監査業務に基づく報酬の額は、「提出会社の状況」に含まれるコーポレート・ガバナンスの状況等(3)【監査の
状況】に記載されている。
利害関係
会社及び連結子会社と当監査法人又は業務執行社員との間には、公認会計士法の規定により記載すべき利害関係はな
い。


 外国為替及び外国貿易法上の届出制度に関するご案内