2026年第3四半期 決算説明会
Bull 5
Bear 0
Results
|
Bridgestone Corporation is a tire and rubber products manufacturer operating through four main business segments: Tire, Solutions, Chemicals, and Diversification. The company produces passenger car, truck and bus, and specialty tires for mining, construction, agriculture, and motorcycles, alongside B2B solutions for mining, aviation, and trucking sectors. Its chemicals division manufactures hydraulic hoses, rubber crawlers, resin piping, and seismic isolation rubber, while the diversification segment includes air springs, golf equipment, and bicycles. Key subsidiaries include Bridgestone Americas, Inc., Bridgestone Europe NV/SA, Bridgestone Asia Pacific Pte. Ltd., and Firestone Industrial Products Company, LLC. The company serves markets in Japan, Asia-Pacific, the Americas, and Europe, Middle East, and Africa. Summarised from the annual report, fiscal year ended Dec 2025 |
Industry Auto Parts | Homepage bridgestone.co.jp |
| Sector Consumer Cyclical | IR page bridgestone.co.jp/ir | |
|
Tags
passenger car tires, truck and bus tires, mining tires, construction tires, agricultural tires, motorcycle tires, hydraulic hoses, seismic isolation rubber, air springs, golf equipment, bicycles, retail services, Bridgestone Tire Solution Japan, Bridgestone Specialty Tire Manufacturing (Thailand) Co. Ltd., Bridgestone Mining Solutions Australia Pty. Ltd., Bridgestone Chemicals Japan, Bridgestone Sports, Bridgestone Cycle, Bridgestone Asia Pacific Pte. Ltd., Bridgestone (China) Investment Co. Ltd., Bridgestone (Tianjin) Tire Co. Ltd., Bridgestone (Wuxi) Tire Co. Ltd., Bridgestone India Private Ltd., Thai Bridgestone Co. Ltd., Bridgestone Tire Manufacturing (Thailand) Co. Ltd., PT Bridgestone Tire Indonesia, Bridgestone Americas Inc., Bridgestone Americas Tire Operations LLC, Bridgestone Canada Inc., Bridgestone de Mexico S.A. DE C.V., Bridgestone do Brasil Industria e Comercio LTDA, Bridgestone Retail Operations LLC, Firestone Polymers LLC, Firestone Industrial Products Company LLC, Bridgestone Europe NV/SA, Bridgestone Poznan Sp. z o.o., Bridgestone Stargard Sp. z o.o., Bridgestone Tatabanya Kft., Bridgestone Hispania Manufacturing S.L.U., Bridgestone Middle East & Africa FZE, Bridgestone Singapore Pte. Ltd., Bridgestone Treasury Singapore Pte. Ltd., BLIZZAK WZ-1 ENLITEN
|
Press page bridgestone.co.jp/corporate/news/index.html |
Metrics
| Valuation | |
|---|---|
| Market cap | ¥ 4.92T |
| Market cap (USD) | $ 30.863B |
| P/E | 11.12 |
| PEG | 3.83 |
| P/BV | 1.32 |
| P/S | 1.04 |
| P/OCF | 7.45 |
| P/FCF | 13.18 |
| Dividend yield | 6.0% |
| Turnover / mcap | — |
| Returns | |
|---|---|
| ROE | 8.7% |
| ROI | 7.8% |
| ROIC | 8.3% |
| Profit margin | 7.4% |
| Growth | |
|---|---|
| Revenue growing | No |
| Profits growing | No |
| Revenue up 3y | No |
| Revenue up 5y | No |
| Earnings growth 3y (net profit CAGR) | 2.9% |
| Quality | |
|---|---|
| Profitable | Yes |
| Margin expanding | No |
| Buying back stock | No |
| Diluting (TTM) | Yes |
| Debt/Equity | — |
| Podcast bulls (TTM) | Sign up |
| Podcast bears (TTM) | Sign up |
| Podcast sentiment (TTM) | Sign up |
| Podcast sentiment % (TTM) | Sign up |
| News sentiment (TTM) | 40 |
| Quality score | -5.6% |
| Insiders | |
|---|---|
| Buys, 1w | Sign up |
| Buys, 1m | Sign up |
| Buys, 1y | Sign up |
| Sells, 1w | Sign up |
| Sells, 1m | Sign up |
| Sells, 1y | Sign up |
Sign up to see this company's insider trades
| Figure | FY 2025 | FY 2024 | FY 2023 | FY 2022 | FY 2021 | FY 2020 | FY 2019 | FY 2018 | FY 2017 | FY 2016 | FY 2015 | FY 2014 | FY 2013 | FY 2012 |
|---|---|---|---|---|---|---|---|---|---|---|---|---|---|---|
| Revenue | 4.429T | 4.43T | 4.314T | 4.11T | 3.246T | 2.995T | 3.526T | 3.65T | 3.643T | 3.337T | 3.79T | 3.674T | 3.568T | 3.04T |
| Net profit | 327.264B | 284.989B | 331.305B | 300.367B | 394.037B | -23.301B | 292.598B | 291.642B | 288.275B | 265.55B | 284.294B | 300.589B | 202.053B | 171.605B |
| Free cash flow | 373.287B | 211.551B | 318.496B | 13.757B | 96.547B | 308.834B | 184.533B | 97.654B | 213.555B | 251.821B | 294.721B | — | — | — |
| Figure | FY 2025 | FY 2024 | FY 2023 | FY 2022 | FY 2021 | FY 2020 | FY 2019 | FY 2018 | FY 2017 | FY 2016 | FY 2015 | FY 2014 | FY 2013 | FY 2012 |
|---|---|---|---|---|---|---|---|---|---|---|---|---|---|---|
| Share price | 3.512K | 5.341K | 5.855K | 4.698K | 4.941K | 3.38K | 4.062K | 4.234K | 5.229K | 4.205K | 4.173K | 4.19K | 3.975K | 2.218K |
| Price performance 12m | -0.34 | -0.09 | 0.25 | -0.05 | 0.46 | -0.17 | -0.04 | -0.19 | 0.24 | 0.01 | -0 | 0.05 | 0.79 | — |
Filed figures
Lines the statements and their notes report beside the headline figures, read from the filings' XBRL as filed (no restatement applied), with figures computed from one filing's own lines. Cash-flow lines carry their cash direction: an outflow is negative. Each period links to its filing; a figure's period, report date and tag are in its tooltip.
| Figure | Dec 2016 | Dec 2017 | Dec 2018 | Dec 2019 | Dec 2020 | Dec 2021 | Dec 2022 | Dec 2023 | Dec 2024 | Dec 2025 |
|---|---|---|---|---|---|---|---|---|---|---|
| Balance sheet detail | ||||||||||
| Trade receivables (JPY) | 455B | 503B | 601B | 755B | 668B | 742B | 947B | 952B | 1.04T | 1.09T |
| ↳ YoY growth | -6.9% | +10.6% | +19.5% | -11.6% | +11.1% | +27.6% | +0.6% | +8.9% | +5.4% | |
| ↳ 5y CAGR | +6.6% | +10.4% | ||||||||
| Borrowings, current (JPY) | 175B | 145B | 192B | 135B | 294B | 150B | 108B | 258B | 139B | 95B |
| Borrowings, non-current (JPY) | 160B | 272B | 188B | 406B | 412B | 357B | 346B | 240B | 239B | 392B |
| Bonds payable (JPY) | 90B | 240B | 220B | 350B | — | — | — | — | — | — |
| Lease liabilities (JPY) | 7.63B | 42.7B | 28.9B | 304B | 300B | 304B | 314B | 332B | 349B | 340B |
| Cash and deposits (JPY) | 483B | 512B | 440B | 433B | 811B | 788B | 519B | 725B | 707B | 714B |
| Intangible assets (JPY) | 73.1B | 105B | 101B | 114B | 117B | 135B | 160B | 201B | 205B | 203B |
| Right-of-use assets (JPY) | — | — | — | 299B | 290B | 294B | 301B | 319B | 329B | 313B |
| Net debt (borrowings + leases - cash) (JPY) | -140B | -52.9B | -31.9B | 108B | 196B | 23.6B | 248B | 106B | 21B | 113B |
| Cash flow detail | ||||||||||
| Operating cash flow (JPY) | 445B | 418B | 361B | 505B | 527B | 282B | 268B | 661B | 549B | 660B |
| Purchases of property, plant and equipment (JPY) | -187B | -198B | -258B | -271B | -201B | -161B | -221B | -282B | -299B | -251B |
| Purchases of intangible assets (JPY) | -5.9B | -6.3B | -5.75B | -11.3B | -17.4B | -24B | -33.4B | -60.5B | -38B | -36.1B |
| Change in receivables (cash effect) (JPY) | 9.6B | -93.9B | -57.4B | 21.9B | 56.9B | -69.9B | -140B | 56.8B | -29.5B | -41.6B |
| Change in inventories (cash effect) (JPY) | -16B | -26.1B | -55.8B | 7.29B | 129B | -140B | -195B | 85.3B | -16.3B | 79.2B |
| Change in payables (cash effect) (JPY) | 22.7B | 35.1B | 15.3B | -40.8B | -7.52B | 91.6B | 52.5B | -55.3B | -2.21B | -21.7B |
| Dividends paid (cash effect) (JPY) | -109B | -109B | -120B | -118B | -91.5B | -102B | -119B | -130B | -140B | -149B |
| Share buybacks (cash effect) (JPY) | -4M | -150B | -8M | -200B | -3M | -10M | -100B | — | -11M | -300B |
| Interest paid (cash effect) (JPY) | -10.1B | -12.1B | -12.3B | -15.1B | -14B | -13.4B | -14.6B | -17.8B | -24B | -24.3B |
| Income taxes paid (cash effect) (JPY) | -129B | -67.3B | -144B | -79.7B | — | — | — | — | — | — |
| Operating cash flow before change in receivables (JPY) | 435B | 512B | 418B | 483B | 470B | 351B | 408B | 605B | 578B | 702B |
| Free cash flow (OCF - PPE - intangibles) (JPY) | 252B | 214B | 97.7B | 223B | 309B | 96.5B | 13.8B | 318B | 212B | 373B |
| Income detail | ||||||||||
| Research and development expense (JPY) | 95.4B | 99.8B | 104B | 106B | 95.2B | 95.5B | 112B | 122B | 126B | 126B |
| ↳ 5y CAGR | +3.5% | +5.8% | ||||||||
| Total comprehensive income (JPY) | 191B | 326B | 162B | 236B | -109B | 592B | 565B | 526B | 530B | 386B |
| Comprehensive income to owners (JPY) | 184B | 317B | 157B | 228B | -108B | 582B | 557B | 516B | 517B | 378B |
| Segments | ||||||||||
| Asia Pacific India And China · Segment revenue (JPY) | — | — | — | — | — | — | — | 551B | 530B | 518B |
| ↳ YoY growth | -3.9% | -2.3% | ||||||||
| Asia Pacific India And China · Segment operating income (JPY) | — | — | — | — | — | — | — | 55.2B | 58.5B | 59.6B |
| China Asia Pacific · Segment revenue (JPY) | — | — | — | 463B | 395B | 387B | 457B | 461B | — | — |
| ↳ YoY growth | -14.7% | -2.0% | +18.1% | +0.9% | ||||||
| Europe Middle East And Africa · Segment revenue (JPY) | — | — | — | — | — | — | — | 819B | 836B | 853B |
| ↳ YoY growth | +2.0% | +2.1% | ||||||||
| Europe Middle East And Africa · Segment operating income (JPY) | — | — | — | — | — | — | — | 11.7B | 29.8B | 42.4B |
| Europe Russia Middle East India And Africa · Segment revenue (JPY) | — | — | — | 640B | 564B | 694B | 870B | 909B | — | — |
| ↳ YoY growth | -11.8% | +23.0% | +25.4% | +4.4% | ||||||
| Japan · Segment revenue (JPY) | — | — | — | 918B | 763B | 873B | 1.04T | 1.24T | 1.23T | 1.27T |
| ↳ YoY growth | -16.9% | +14.5% | +18.7% | +19.9% | -1.3% | +3.2% | ||||
| Japan · Segment operating income (JPY) | — | — | — | — | — | — | — | 206B | 187B | 198B |
| The Americas · Segment revenue (JPY) | — | — | — | 1.66T | 1.41T | 1.45T | 1.99T | 2.08T | 2.18T | 2.13T |
| ↳ YoY growth | -15.3% | +3.3% | +36.7% | +4.6% | +4.8% | -2.3% | ||||
| The Americas · Segment operating income (JPY) | — | — | — | — | — | — | — | 212B | 180B | 202B |
| Reported | Mar 23, 2018 | Mar 23, 2018 | Mar 24, 2020 | Mar 26, 2021 | Mar 26, 2021 | Mar 28, 2023 | Mar 28, 2023 | Mar 25, 2025 | Mar 18, 2026 | Mar 18, 2026 |
Sign up to see institutional holdings
Sign UpPodcast Mentions
Sign up to see podcast mentions and sentiment
Sign UpTimely disclosures published on TDnet, newest first, titles as filed in Japanese. The link opens the disclosure on TDnet. Filings with EDINET (periodic reports, extraordinary reports, offerings, holding and buy-back reports), newest first, titles as filed in Japanese. The link opens the filing on EDINET. Press releases from the company's own website, newest first.
2026年12月期 第3四半期決算短信〔IFRS〕(連結)
Bull 5
Bear 0
Results
トラック・バス用タイヤ「ECOPIA M803A」が日野自動車の新型「日野プロフィア」に新車装着
Bull 1
Bear 0
Order/contract
転がり抵抗係数最高ランク「A」達成によって、車両燃費向上に貢献
2026年11月05日
株式会社ブリヂストン(以下、ブリヂストン)は、日野自動車株式会社(以下、日野自動車)の大型トラック、新型「日野プロフィア」の新車装着用タイヤとして、「ECOPIA M803A」(エコピア エムハチマルサンエー)を納入します。
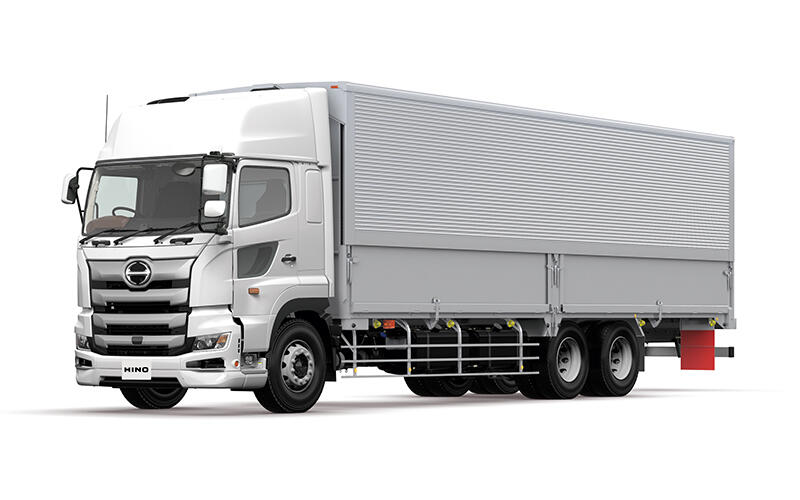
新型「日野プロフィア」※1
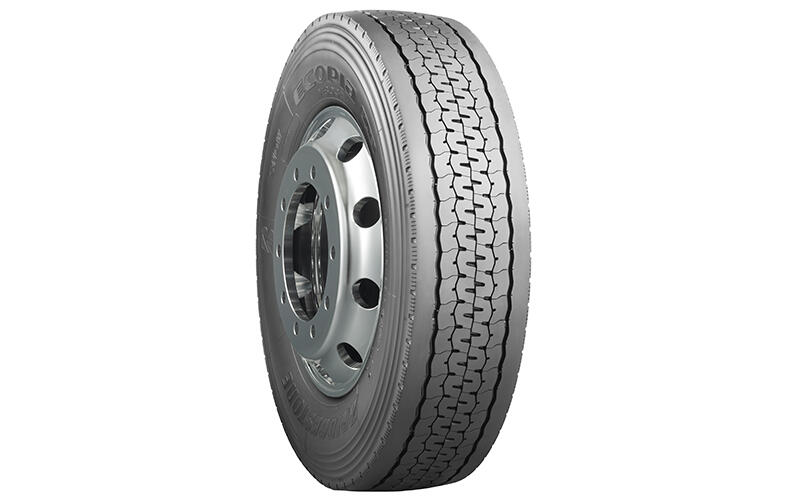
納入する新車装着用タイヤ「ECOPIA M803A」
「日野プロフィア」は、安全・快適・環境性能を備え、日本の長距離・大量輸送を支える日野自動車大型トラックのフラッグシップモデルです。新型「日野プロフィア」は、物流業界で深刻化する高齢化や長時間労働に伴うドライバー不足の課題に応えるため、安全運転支援機能と運転負荷軽減機能をさらに強化しています。また、パワーと燃費性能を高水準に両立させたエンジンをはじめとした環境性能が、輸送能力の向上や燃料消費量の削減に貢献しています。※2
「日野プロフィア」に装着される「ECOPIA M803A」は、ブロックを密集させることでブロック同士が支え合い、変形を抑制する最新のパタンを搭載しています。さらに、当社独自のコンパウンド技術をトレッドゴムとタイヤ骨格を形成するケース部分に採用することによって、転がり抵抗を低減させています。これにより、2025年度重量車燃費基準(JH25モード)※3の燃費計算に用いる転がり抵抗係数最高ランク「A」※4を達成しており、車両の燃費向上と燃料費やCO2排出量の削減に貢献しています。加えて、大型トラックの運行に求められる軽量化・操安性・摩耗ライフ・走行時のノイズ低減といった高い走行性能と快適性も兼ね備えています。
今回の新車装着タイヤの納入は、「ECOPIA M803A」が当社の高い技術力によって、低転がり抵抗をはじめとしたトラック・バス用タイヤに求められる基本性能を高い次元で両立させ、車両燃費向上など「日野プロフィア」の性能向上に貢献する点が評価され、実現しました。今後も、日野自動車が展開していく様々な車両の提供する価値の実現に、タイヤ開発・納入を通じて貢献してまいります。
ブリヂストンは、トラック・バス用の新車装着タイヤの供給を通じ、安心・安全な社会の物流を支え、企業コミットメント「Bridgestone E8 Commitment」で掲げる「Energy カーボンニュートラルなモビリティ社会の実現を支えること」、「Extension人とモノの移動を止めず、さらにその革新を支えていくこと」にコミットしていきます。
-
※1車両画像は、本ニュースリリース用に当社が日野自動車株式会社より利用許諾を得たものとなります。転載、転用を一切禁じます。
-
※2日野自動車、大型トラック・トラクター「日野プロフィア」を一部改良し発売 | ニュース・お知らせ | 日野自動車株式会社
-
※3自動車の省エネルギー化と地球温暖化対策のさらなる推進を目的に策定された、2025年度を目標年度とする重量車(車両総重量3.5トン超、トラック・バス等)の新たな燃費基準。 報道発表資料:トラック、バス等の燃費基準が強化されます~2025年度を目標年度とする重量車の新しい燃費基準を策定~ - 国土交通省
-
※4欧州連合(EU)の政策執行機関である欧州委員会が定めたタイヤラベリング制度における「タイヤ転がり抵抗係数」A~Eの5段階のグレーディングの最高ランク「A」相当の低転がり抵抗を実現。 Tyres - European Commission
本件に関するお問い合わせ先
<報道関係> 広報部 TEL:03-6836-3333 <お客様> お客様相談室 TEL:0120-39-2936

































Prompts
Click prompts to add them under the company line, click again to take one out, then copy the result into your AI chat. Shared by Asian Century Stocks and Uncovered Thai Stocks. Thank you.
Bridgestone Corporation (ticker 5108), listed in Japan.
Copied
ETFs Holding Bridgestone Corporation
Exchange-traded funds whose newest published daily portfolio holds one of the company's listings, largest weight first.
| ETF | Weight in ETF | Shares | Market value | As of |
|---|---|---|---|---|
| IVAL | 2.23% | 176,889 | $ 4.91M | Nov 18, 2026 |
| AIVI | 1.70% | 47,600 | $ 998.714K | Jun 30, 2026 |
| BINV | 1.52% | 355,200 | $ 7.449M | Jun 30, 2026 |
| DTAN | 1.27% | 9,942 | $ 275.777K | Nov 17, 2026 |
| DSTX | 1.08% | 24,300 | $ 509.848K | Jun 30, 2026 |
| AVIV | 0.39% | 291,500 | $ 8.019M | Nov 16, 2026 |
| AVSD | 0.31% | 42,100 | $ 1.158M | Nov 16, 2026 |
| IVSI | 0.26% | 996 | $ 20.888K | Jun 30, 2026 |
| DFIV | 0.25% | 2,099,900 | $ 56.72M | Nov 12, 2026 |
| NTSI | 0.17% | 41,000 | $ 860.237K | Jun 30, 2026 |
| DIHP | 0.17% | 407,200 | $ 10.999M | Nov 12, 2026 |
| AVDE | 0.14% | 1,018,600 | $ 28.022M | Nov 16, 2026 |
| DFAI | 0.13% | 872,900 | $ 23.578M | Nov 12, 2026 |
| DXIV | 0.13% | 11,500 | $ 310.622K | Nov 12, 2026 |
| DFIC | 0.11% | 627,700 | $ 16.955M | Nov 12, 2026 |
| DFAX | 0.07% | 322,300 | $ 8.706M | Nov 12, 2026 |