2026年度第3四半期決算説明資料
Bull 0
Bear 1
Results
|
Toyo Tire Corporation is a tire and automotive parts manufacturer operating through two main business segments. The tire segment involves the production and sale of passenger car, light truck, and truck/bus tires under the TOYO TIRES and NITTO brands. The automotive parts segment focuses on manufacturing and selling vibration control components, such as anti-vibration rubber, for vehicles. The company serves domestic and international markets, with key subsidiaries including Toyo Tire U.S.A. Corp., TOYO TYRE AUSTRALIA PTY LTD, and Toyo Tire Canada Inc. for sales, and Toyo Tire North America Manufacturing Inc., Toyo Tyre Malaysia Sdn. Bhd., and Toyo Tire Serbia d.o.o. for manufacturing. Additional group entities include Toyo Tire Holdings of Americas Inc., Toyo Tire Holdings of Europe GmbH, and Toyo Tire North America OE Sales LLC. The company also engages in related services such as equipment and mold supply, maintenance, and financial operations. Summarised from the annual report, fiscal year ended Dec 2025 |
Industry Auto Parts | Homepage toyotires.co.jp |
| Sector Consumer Cyclical | IR page toyotires.co.jp/ir/news | |
|
Tags
tires, passenger car tires, light truck tires, truck and bus tires, automotive parts, vibration control, anti-vibration rubber, airless tires, tire manufacturing, tire distribution, TOYO TIRES, NITTO, Toyo Tire U.S.A. Corp., TOYO TYRE AUSTRALIA PTY LTD, Toyo Tire Canada Inc., Nitto Tire U.S.A. Inc., Toyo Tire North America Manufacturing Inc., Toyo Tyre Malaysia Sdn. Bhd., Toyo Tire Serbia d.o.o., Toyo Tire Holdings of Americas Inc., Toyo Tire Holdings of Europe GmbH, Toyo Tire North America OE Sales LLC, Toyo Retreaded Co. Ltd., Fukushima Rubber Co. Ltd., Toyo Rubber Chemicals Co. Ltd., Ayabe Toyo Rubber Co. Ltd., Toyo Rubber & Plastic (Guangzhou) Co. Ltd.
|
Press page — |
Metrics
| Valuation | |
|---|---|
| Market cap | ¥ 467.71B |
| Market cap (USD) | $ 2.934B |
| P/E | 9.52 |
| PEG | 0.96 |
| P/BV | 1.07 |
| P/S | 0.78 |
| P/OCF | 5.03 |
| P/FCF | 7.10 |
| Dividend yield | 3.4% |
| Turnover / mcap | — |
| Returns | |
|---|---|
| ROE | 12.8% |
| ROI | 11.2% |
| ROIC | 12.2% |
| Profit margin | 10.7% |
| Growth | |
|---|---|
| Revenue growing | Yes |
| Profits growing | No |
| Revenue up 3y | Yes |
| Revenue up 5y | Yes |
| Earnings growth 3y (net profit CAGR) | 9.9% |
| Quality | |
|---|---|
| Profitable | Yes |
| Margin expanding | No |
| Buying back stock | No |
| Diluting (TTM) | No |
| Debt/Equity | — |
| Podcast bulls (TTM) | Sign up |
| Podcast bears (TTM) | Sign up |
| Podcast sentiment (TTM) | Sign up |
| Podcast sentiment % (TTM) | Sign up |
| News sentiment (TTM) | 0 |
| Quality score | 50.0% |
| Insiders | |
|---|---|
| Buys, 1w | Sign up |
| Buys, 1m | Sign up |
| Buys, 1y | Sign up |
| Sells, 1w | Sign up |
| Sells, 1m | Sign up |
| Sells, 1y | Sign up |
Sign up to see this company's insider trades
| Figure | FY 2025 | FY 2024 | FY 2023 | FY 2022 | FY 2021 | FY 2020 | FY 2019 | FY 2018 | FY 2017 | FY 2016 | FY 2015 | FY 2014 | FY 2013 | FY 2012 | FY 2011 |
|---|---|---|---|---|---|---|---|---|---|---|---|---|---|---|---|
| Revenue | 594.923B | 565.358B | 552.825B | 497.213B | 393.647B | 343.764B | 377.457B | 393.22B | 404.999B | 381.635B | 407.789B | 393.782B | 370.218B | 291.11B | 320.569B |
| Net profit | 63.614B | 74.81B | 72.273B | 47.956B | 41.35B | 11.682B | 24.482B | 10.553B | 15.476B | -12.26B | 1.674B | 31.24B | 11.596B | 13.218B | 6.704B |
| Free cash flow | 65.882B | 39.223B | 55.8B | -31.218B | -4.257B | 29.878B | -33.765B | -9.548B | -8.477B | 14.09B | -4.923B | — | — | — | — |
| Figure | FY 2025 | FY 2024 | FY 2023 | FY 2022 | FY 2021 | FY 2020 | FY 2019 | FY 2018 | FY 2017 | FY 2016 | FY 2015 | FY 2014 | FY 2013 | FY 2012 | FY 2011 |
|---|---|---|---|---|---|---|---|---|---|---|---|---|---|---|---|
| Share price | 4.334K | 2.445K | 2.359K | 1.498K | 1.795K | 1.568K | 1.575K | 1.375K | 2.328K | 2.405K | 2.405K | 2.385K | 1.198K | 511.83 | 461.89 |
| Price performance 12m | 0.77 | 0.04 | 0.57 | -0.17 | 0.14 | -0 | 0.15 | -0.41 | -0.03 | 0 | 0.01 | 0.99 | 1.34 | 0.11 | — |
Filed figures
Lines the statements and their notes report beside the headline figures, read from the filings' XBRL as filed (no restatement applied), with figures computed from one filing's own lines. Cash-flow lines carry their cash direction: an outflow is negative. Each period links to its filing; a figure's period, report date and tag are in its tooltip.
| Figure | Dec 2016 | Dec 2017 | Dec 2018 | Dec 2019 | Dec 2020 | Dec 2021 | Dec 2022 | Dec 2023 | Dec 2024 | Dec 2025 |
|---|---|---|---|---|---|---|---|---|---|---|
| Balance sheet detail | ||||||||||
| Trade receivables (JPY) | 84.9B | 79.4B | 81.6B | 75.4B | 72.6B | 83.3B | 219B | 216B | 261B | 273B |
| ↳ YoY growth | +3.7% | -6.5% | +2.8% | -7.5% | -3.8% | +14.7% | +162.9% | -1.5% | +20.9% | +4.7% |
| ↳ 5y CAGR | -2.4% | -0.4% | +22.5% | +21.4% | +28.1% | +30.3% | ||||
| Borrowings, current (JPY) | 58.1B | 43.5B | 49.1B | 39.6B | 22.2B | 40.2B | 67.8B | 11.7B | 20.4B | 18.4B |
| Borrowings, non-current (JPY) | 74.3B | 76.1B | 87.5B | 75.9B | 86B | 85.5B | 61.4B | 71B | 66.1B | 51.3B |
| Bonds payable (JPY) | 10B | 5B | — | — | — | 10B | 10B | 25B | 25B | 25B |
| Lease liabilities (JPY) | — | — | — | — | — | — | — | 15.2B | 15.5B | 15.8B |
| Cash and deposits (JPY) | 37.8B | 28.3B | 31.4B | 25.1B | 37.7B | 55.6B | 41.6B | 52.9B | 86.6B | 117B |
| Intangible assets (JPY) | 7.26B | 7.04B | 6.37B | 6.75B | 4.85B | 6.33B | 8.53B | 15.8B | 22.1B | 23.6B |
| Net debt (borrowings + leases - cash) (JPY) | 94.7B | 91.4B | 105B | 90.4B | 70.6B | 70.1B | 87.5B | 29.8B | 15.4B | -31.7B |
| Cash flow detail | ||||||||||
| Operating cash flow (JPY) | 38.9B | 13.4B | 19.1B | 11.2B | 53.8B | 34.5B | 15.2B | 86.5B | 67.1B | 93.1B |
| Purchases of property, plant and equipment (JPY) | -23.8B | -20.9B | -27.4B | -43.1B | -22.3B | -36.3B | -43B | -22.7B | -18.7B | -23.7B |
| Purchases of intangible assets (JPY) | -1.01B | -1.02B | -1.25B | -1.85B | -1.62B | -2.41B | -3.36B | -8.04B | -9.17B | -3.51B |
| Change in receivables (cash effect) (JPY) | -4.62B | -1.12B | -4.17B | 5.58B | 651M | -5.81B | -17.9B | 7.48B | -13.5B | -5.45B |
| Change in inventories (cash effect) (JPY) | 2.55B | -6.84B | -7.22B | -2.15B | 18.3B | -20.3B | -23.8B | 11.9B | -6.02B | -3.62B |
| Change in payables (cash effect) (JPY) | -2.25B | 1.95B | -774M | -25.4B | -2.72B | 3.57B | 7.57B | -5B | -1.45B | -4.32B |
| Dividends paid (cash effect) (JPY) | -5.71B | -5.71B | -5.71B | -6.25B | -6.92B | -6.92B | -13.2B | -10.8B | -20B | -20B |
| Interest paid (cash effect) (JPY) | -3.24B | -2.76B | -2.75B | -2.33B | -1.9B | -2.05B | -1.29B | -1.19B | -1.63B | -1.07B |
| Income taxes paid (cash effect) (JPY) | -5.54B | -5.19B | -4.36B | -7.7B | -4.31B | -5.86B | -16.1B | -24.4B | -35B | -27.1B |
| Operating cash flow before change in receivables (JPY) | 43.5B | 14.5B | 23.2B | 5.65B | 53.1B | 40.3B | 33.1B | 79B | 80.5B | 98.5B |
| Free cash flow (OCF - PPE - intangibles) (JPY) | 14.1B | -8.48B | -9.55B | -33.8B | 29.9B | -4.26B | -31.2B | 55.8B | 39.2B | 65.9B |
| Income detail | ||||||||||
| Research and development expense (JPY) | 10.5B | 10.9B | 10.9B | 11.1B | 10.4B | 11.2B | 11.3B | 12.7B | 13.6B | 13.8B |
| ↳ 5y CAGR | +0.5% | +1.3% | +0.7% | +3.2% | +4.1% | +5.7% | ||||
| Total comprehensive income (JPY) | -24B | 24.2B | -487M | 25.5B | 5.16B | 66.7B | 54B | 85.4B | 97.5B | 70B |
| Comprehensive income to owners (JPY) | -24.6B | 23.2B | -624M | 24.8B | 4.93B | 66.4B | 53.9B | 85.4B | 97.5B | 70B |
| Provision for credit losses (JPY) | 37M | 70M | 0.00 | 62M | -29M | -2M | -14M | -1M | 161M | 9M |
| Credit cost ratio (credit losses / average receivables) (%) | 0.0% | 0.1% | 0.0% | 0.1% | 0.0% | 0.0% | 0.0% | 0.0% | 0.1% | 0.0% |
| Segments | ||||||||||
| Automotive Parts Business · Segment revenue (JPY) | — | — | 51.5B | 44.6B | — | — | — | — | — | — |
| ↳ YoY growth | -13.4% | |||||||||
| Automotive Parts Business · Segment operating income (JPY) | — | — | -4.54B | -2.92B | — | — | — | — | — | — |
| Reported | Mar 30, 2017 | Mar 29, 2018 | Mar 28, 2019 | Mar 27, 2020 | Mar 30, 2021 | Mar 25, 2022 | Mar 29, 2023 | Mar 26, 2025 | Mar 26, 2025 | Mar 26, 2026 |
Sign up to see institutional holdings
Sign UpPodcast Mentions
Sign up to see podcast mentions and sentiment
Sign UpTimely disclosures published on TDnet, newest first, titles as filed in Japanese. The link opens the disclosure on TDnet. Filings with EDINET (periodic reports, extraordinary reports, offerings, holding and buy-back reports), newest first, titles as filed in Japanese. The link opens the filing on EDINET. Press releases from the company's own website, newest first.
配当予想の修正(増配)に関するお知らせ
Bull 3
Bear 0
Capital return
2026年12月期 第3四半期決算短信〔日本基準〕(連結)
Bull 0
Bear 1
Results










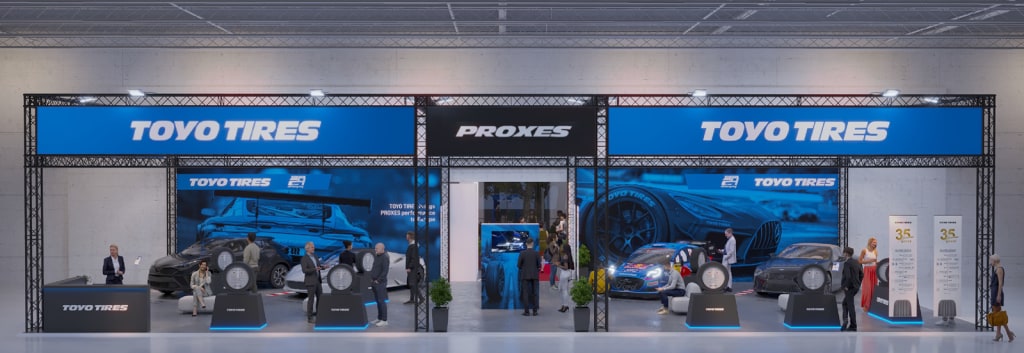 (ブースイメージ)



 (左:2027年ベオグラード国際博覧会日本館ロゴ・シンボルマーク/右:当社コーポレートブランドロゴ)
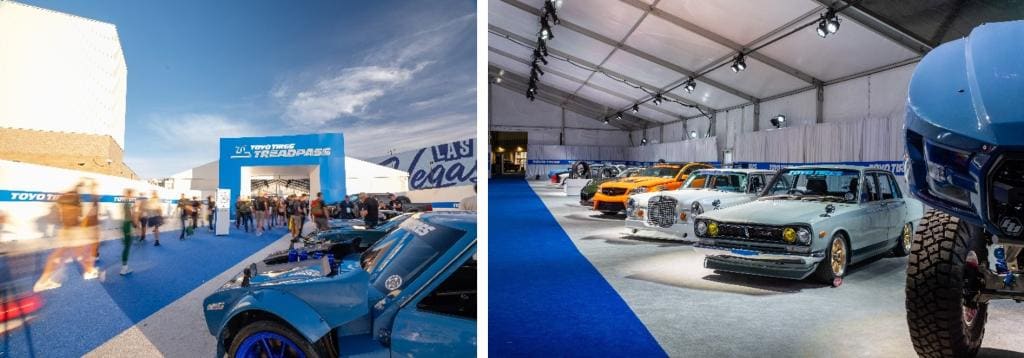
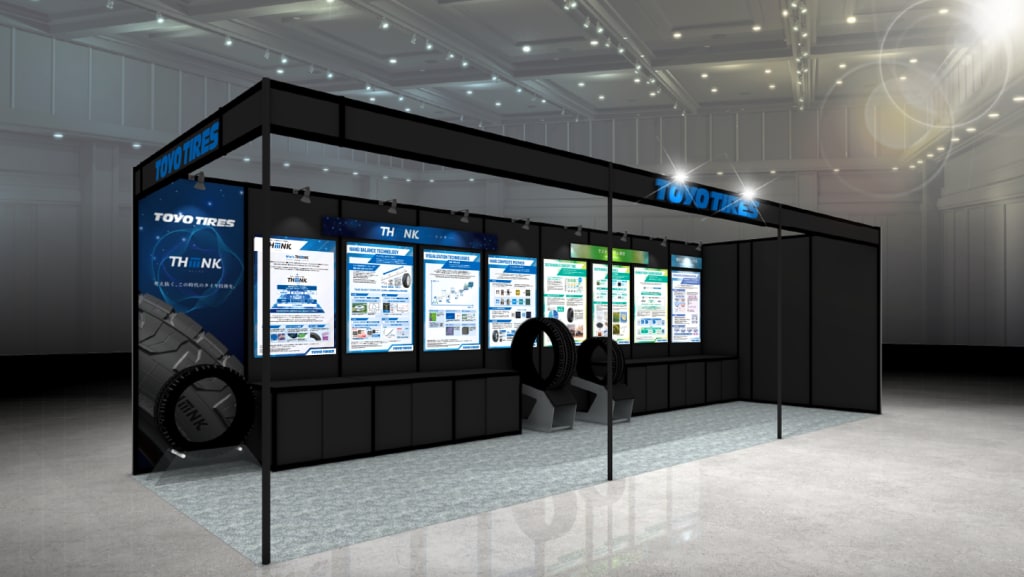 (ブースイメージ)
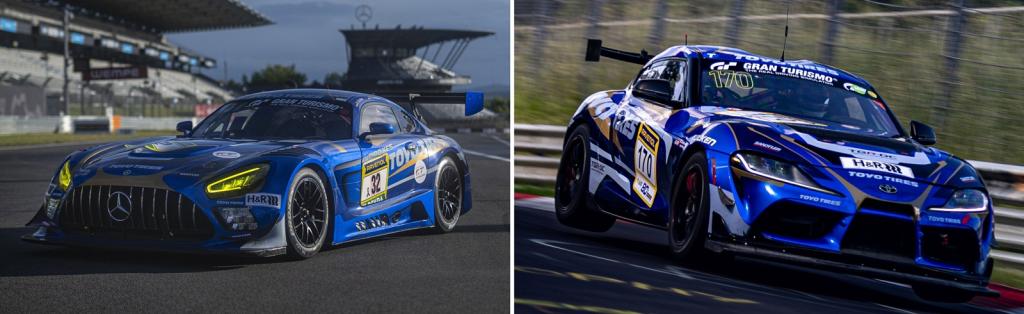
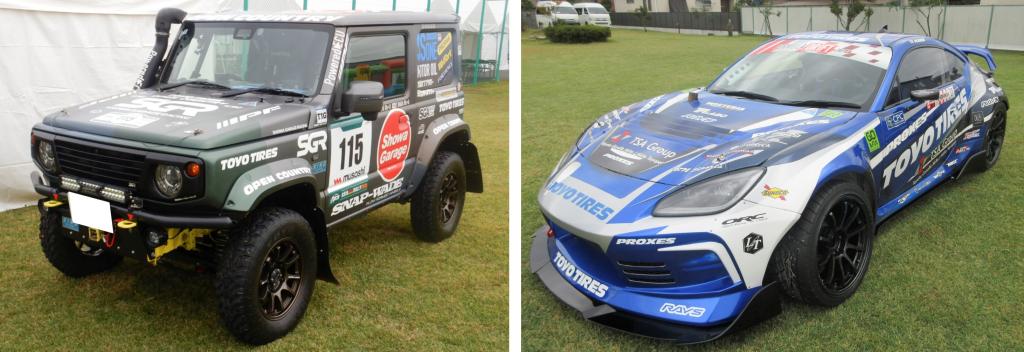
 ( 左:参戦車両ジムニーシエラ 右:High Bridge First with TOYO TIRES 坂本 誠選手/花田 圭一選手 )
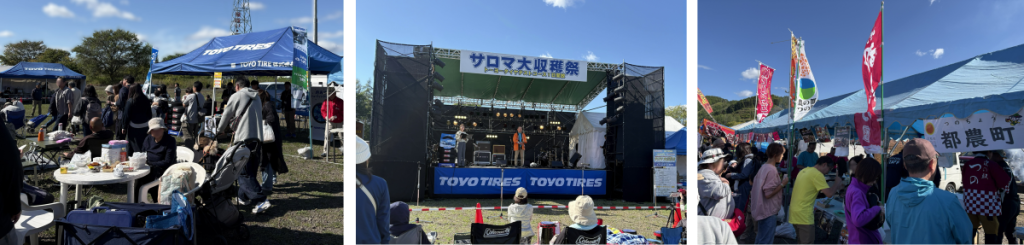 (サロマ大収穫祭の様子)
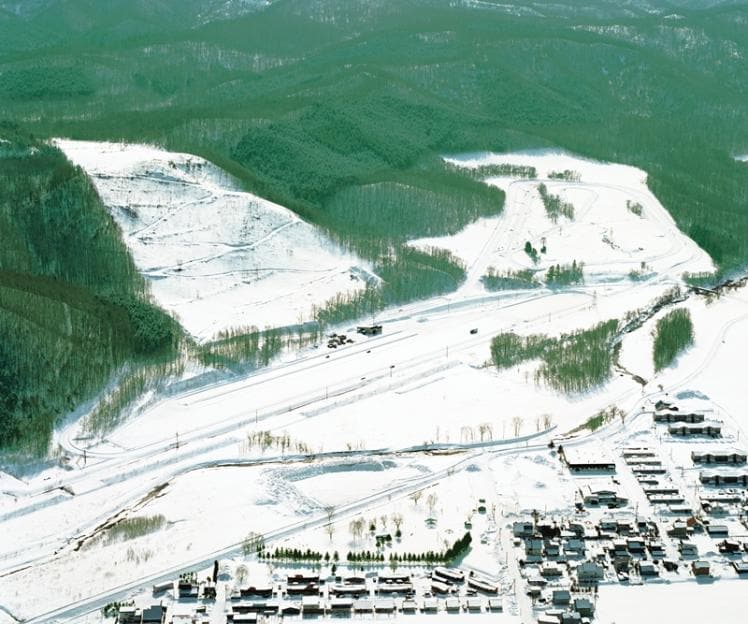 (冬期タイヤテストコース)
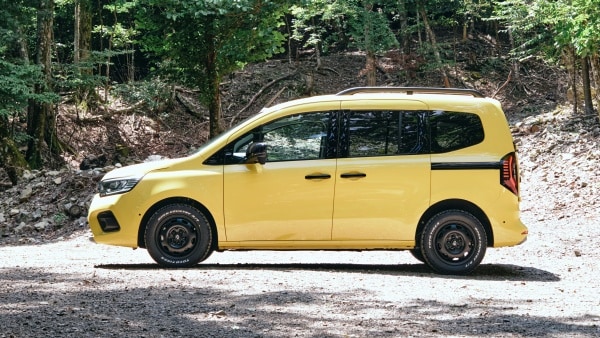
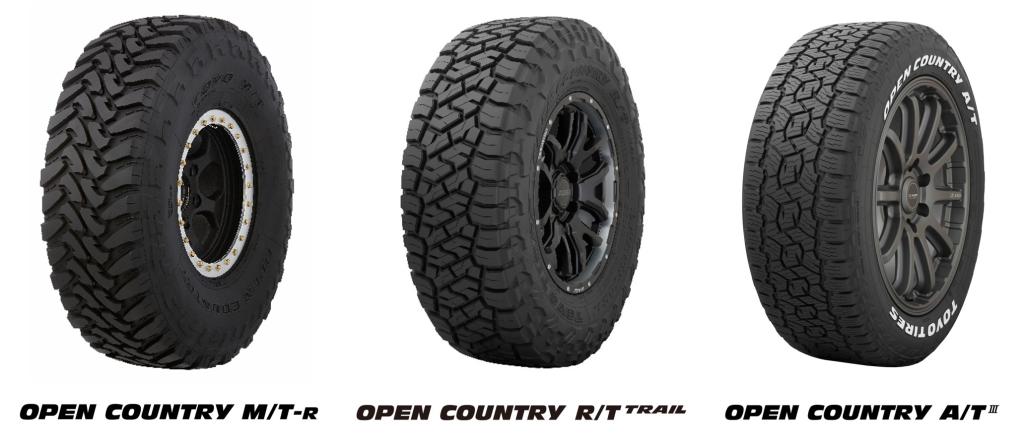
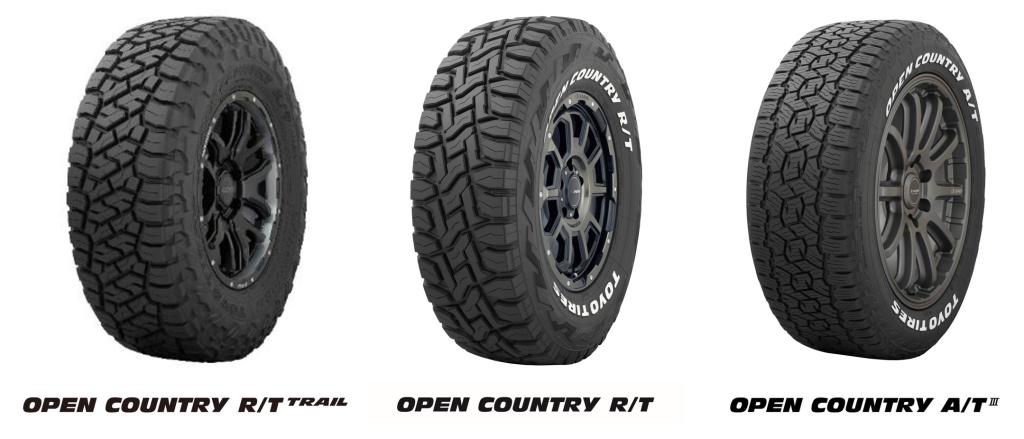
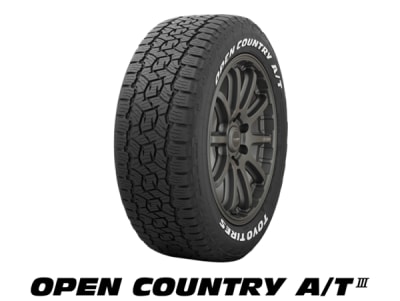
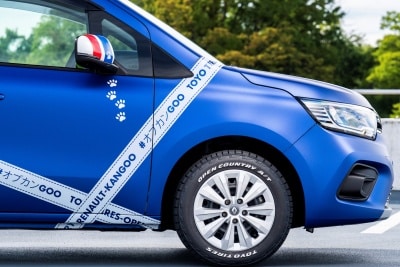
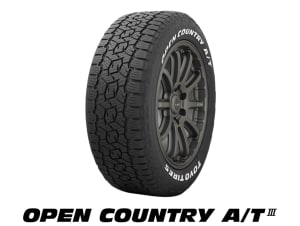 さまざまな気象条件や路面状況での走行にバランス良く対応したオールテレーンタイプの商品です。
トレッド部に大きなブロックを配置した力強いパターンデザインを採用し、一般道での操縦安定性と快適性を確保するとともに、キャンプ場や林道など凸凹のある路面環境でも安定した走行をサポートします。また、スノーフレーマーク※の要件を満たし、降雪時の性能を担保しているため、季節を問わず使用することが可能です。2023年には国内で人気を博しているホワイトレターのラインアップを追加しています。
※ 国連欧州経済委員会に規定されたシビアスノー要件を満たしたタイヤ
 日時:2026年9月27日(日)10:00~19:00
会場:二子玉川ライズ 中央広場
(東京都世田谷区玉川2-21-1)
内容:車両展示、ブランドトークセッション、フードトラック含むショップ出店、クイズラリーなど

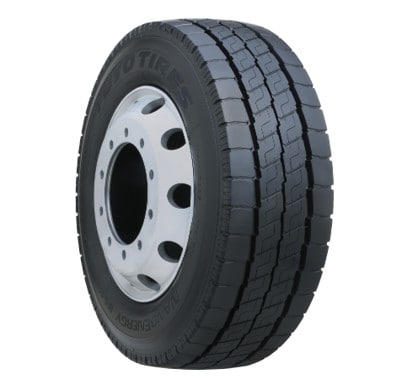
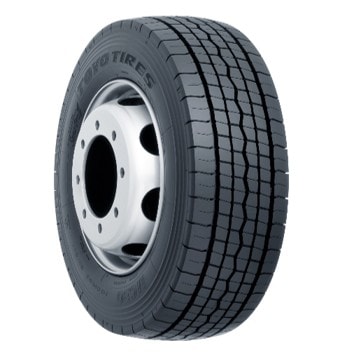
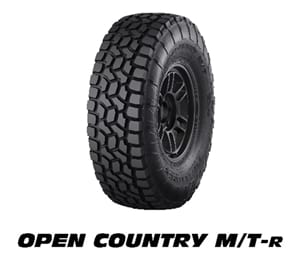 本製品はダカールラリーをはじめとする世界有数のラリーレイド競技における最上位クラスでの使用を想定して特別にチューンアップした製品です。これまでのラリーへの参戦を通じて得た知見を生かし、硬い岩場や柔らかい砂場、滑りやすいぬかるみなど路面状況がさまざまに変化する厳しい環境のなかを高速で駆け抜ける際の悪路走破性、耐外傷性などの性能を向上させています。
本製品には環境にも配慮したサステナブル素材※を使用しています。
※リサイクル原材料及びリニューアブル原材料をサステナブル素材と定義。再生ビードワイヤー、再生カーボンブラックなどを含み、製品重量の23.8%にサステナブル素材を使用。

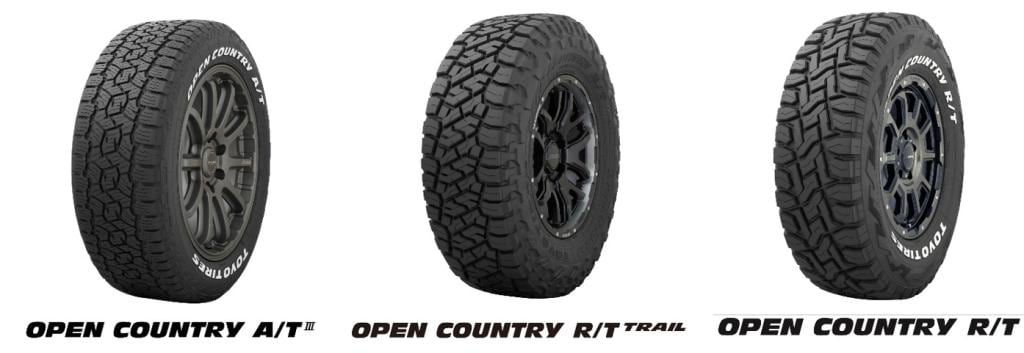

 本製品はアジアクロスカントリーラリー、BAJA1000、ダカールラリーなど世界有数のラリーレイド競技における使用を想定してチューンアップした製品です。
これまでのラリーへの参戦を通じて得た知見を生かし、硬い岩場や柔らかい砂場、滑りやすいぬかるみなど路面状況がさまざまに変化する厳しい環境のなかを高速で駆け抜ける際の悪路走破性、耐外傷性などの性能を向上させています。
なお、本製品には環境にも配慮したサステナブル素材を使用しています。
詳しい商品情報はこちらをご覧ください。
 (表紙)


Prompts
Click prompts to add them under the company line, click again to take one out, then copy the result into your AI chat. Shared by Asian Century Stocks and Uncovered Thai Stocks. Thank you.
Toyo Tire Corporation (ticker 5105), listed in Japan.
Copied
ETFs Holding Toyo Tire Corporation
Exchange-traded funds whose newest published daily portfolio holds one of the company's listings, largest weight first.
| ETF | Weight in ETF | Shares | Market value | As of |
|---|---|---|---|---|
| IVAL | 2.08% | 177,862 | $ 4.58M | Nov 18, 2026 |
| AVDV | 0.36% | 2,757,500 | $ 69.914M | Nov 16, 2026 |
| DISV | 0.27% | 515,112 | $ 13.682M | Nov 12, 2026 |
| AVDS | 0.10% | 14,100 | $ 357.491K | Nov 16, 2026 |
| DXIV | 0.08% | 7,500 | $ 199.203K | Nov 12, 2026 |
| DFIS | 0.08% | 179,900 | $ 4.778M | Nov 12, 2026 |
| AVDE | 0.05% | 374,800 | $ 9.503M | Nov 16, 2026 |
| AVSD | 0.05% | 7,700 | $ 195.225K | Nov 16, 2026 |
| DFIV | 0.05% | 390,600 | $ 10.374M | Nov 12, 2026 |
| AVIV | 0.04% | 35,800 | $ 907.671K | Nov 16, 2026 |
| DFIC | 0.04% | 231,300 | $ 6.143M | Nov 12, 2026 |
| DIHP | 0.04% | 89,900 | $ 2.388M | Nov 12, 2026 |
| DFAX | 0.02% | 103,200 | $ 2.741M | Nov 12, 2026 |
| DFAI | 0.02% | 132,300 | $ 3.514M | Nov 12, 2026 |