変更報告書(株式会社みずほ銀行)
Bull 0
Bear 0
Routine
|
The Yokohama Rubber Company, Limited is a manufacturer of tires and rubber products. The company operates through three main business segments: Tires, Other Rubber Products, and Sports Goods and Information Processing Services. Its tire division produces passenger, truck, bus, agricultural, industrial, and mining vehicle tires, tubes, and aluminum wheels. The Other Rubber Products segment manufactures conveyor belts, hoses, fenders, oil fences, marine hoses, and aerospace parts. The company serves global markets through a network of subsidiaries and affiliates, including Yokohama Tire Corporation, Alliance Tire Company Ltd., and Yokohama TWS S.p.A. It also offers sports goods and information processing services through entities such as ProGIA and Hamagomu Aicom. Summarised from the annual report, fiscal year ended Dec 2025 |
Industry Auto Parts | Homepage y-yokohama.com |
| Sector Consumer Cyclical | IR page y-yokohama.com | |
|
Tags
tires, passenger vehicle tires, truck tires, agricultural tires, industrial tires, conveyor belts, hoses, aerospace parts, sports goods, information processing services, Aichi Tire Industry Co. Ltd., Japan Giant Tire Co. Ltd., YTMMX Japan LLC, Yokohama Tire Retread Co. Ltd., Yokohama Tire Philippines Inc., Hangzhou Youke Haoma Tire Co. Ltd., Yokohama Tire Manufacturing (Thailand) Co. Ltd., Suzhou Youke Haoma Tire Co. Ltd., LLC Yokohama R.P.Z., Yokohama Tire Manufacturing Mississippi LLC, Yokohama Tire Vietnam Inc., Yokohama Tire Manufacturing Virginia LLC, Yokohama India Private Ltd., Alliance Tire Company Ltd., ATC Tires Private Ltd., ATC Tires AP Pvt. Ltd., Yokohama TWS S.p.A., Yokohama TWS Czech Republic a.s., Yokohama TWS North America Inc., Yokohama Tire Japan Co. Ltd., Yokohama Tire Corporation, Yokohama Off-Highway Tire Co. Ltd., Hamagomu Engineering Co. Ltd., Yokohama Corporation Of North America, Yokohama Industries Americas Inc., Yokohama Industries Americas Ohio Inc., Xieji Industrial Co. Ltd., Yokohama Rubber (Thailand) Co. Ltd., Hangzhou Youke Haoma Rubber Products Co. Ltd., Yokohama Industries Americas de Mexico S. de R.L. de C. V., PT.Yokohama Industrial Products Manufacturing Indonesia, Shandong Yokohama Rubber Industrial Products Co. Ltd., Yokohama Rubber MB Japan Co. Ltd., Shanghai Youke Haoma Rubber Products Trading Co. Ltd., Yokohama Aerospace America Inc., ProGIA Co. Ltd., Hamagomu Aicom Co. Ltd., Y.T. Rubber Co. Ltd.
|
Press page y-yokohama.com/ir/news |
Metrics
| Valuation | |
|---|---|
| Market cap | ¥ 1.083T |
| Market cap (USD) | $ 6.788B |
| P/E | 7.19 |
| PEG | 0.23 |
| P/BV | 0.96 |
| P/S | 0.84 |
| P/OCF | 10.67 |
| P/FCF | -52.17 |
| Dividend yield | 2.1% |
| Turnover / mcap | — |
| Returns | |
|---|---|
| ROE | 10.8% |
| ROI | 10.1% |
| ROIC | 10.0% |
| Profit margin | 8.5% |
| Growth | |
|---|---|
| Revenue growing | Yes |
| Profits growing | Yes |
| Revenue up 3y | Yes |
| Revenue up 5y | Yes |
| Earnings growth 3y (net profit CAGR) | 31.9% |
| Quality | |
|---|---|
| Profitable | Yes |
| Margin expanding | Yes |
| Buying back stock | Yes |
| Diluting (TTM) | No |
| Debt/Equity | — |
| Podcast bulls (TTM) | Sign up |
| Podcast bears (TTM) | Sign up |
| Podcast sentiment (TTM) | Sign up |
| Podcast sentiment % (TTM) | Sign up |
| News sentiment (TTM) | 26 |
| Quality score | 55.6% |
| Insiders | |
|---|---|
| Buys, 1w | Sign up |
| Buys, 1m | Sign up |
| Buys, 1y | Sign up |
| Sells, 1w | Sign up |
| Sells, 1m | Sign up |
| Sells, 1y | Sign up |
Sign up to see this company's insider trades
| Figure | FY 2025 | FY 2024 | FY 2023 | FY 2022 | FY 2021 | FY 2020 | FY 2019 | FY 2018 | FY 2017 | FY 2016 | FY 2015 | FY 2014 | FY 2013 | FY 2012 |
|---|---|---|---|---|---|---|---|---|---|---|---|---|---|---|
| Revenue | 1.235T | 1.095T | 985.333B | 860.477B | 670.809B | 570.572B | 650.462B | 650.239B | 668.05B | 596.193B | 629.856B | 625.245B | 601.629B | 559.7B |
| Net profit | 105.398B | 74.919B | 67.234B | 45.918B | 65.5B | 26.312B | 41.971B | 35.623B | 35.218B | 18.787B | 36.307B | 40.502B | 35.007B | 32.611B |
| Free cash flow | 24.004B | 16.706B | 101.015B | -15.661B | 32.373B | 47.013B | 25.179B | — | — | 43.324B | 3.925B | — | — | — |
| Figure | FY 2025 | FY 2024 | FY 2023 | FY 2022 | FY 2021 | FY 2020 | FY 2019 | FY 2018 | FY 2017 | FY 2016 | FY 2015 | FY 2014 | FY 2013 | FY 2012 |
|---|---|---|---|---|---|---|---|---|---|---|---|---|---|---|
| Share price | 6.016K | 3.4K | 3.234K | 2.059K | 1.843K | 1.534K | 2.132K | 2.065K | 2.763K | 2.096K | 1.872K | 2.21K | 1.033K | 619.93 |
| Price performance 12m | 0.77 | 0.05 | 0.57 | 0.12 | 0.2 | -0.28 | 0.03 | -0.25 | 0.32 | 0.12 | -0.15 | 1.14 | 0.67 | — |
Filed figures
Lines the statements and their notes report beside the headline figures, read from the filings' XBRL as filed (no restatement applied), with figures computed from one filing's own lines. Cash-flow lines carry their cash direction: an outflow is negative. Each period links to its filing; a figure's period, report date and tag are in its tooltip.
| Figure | Dec 2016 | Dec 2017 | Dec 2018 | Dec 2019 | Dec 2020 | Dec 2021 | Dec 2022 | Dec 2023 | Dec 2024 | Dec 2025 |
|---|---|---|---|---|---|---|---|---|---|---|
| Balance sheet detail | ||||||||||
| Trade receivables (JPY) | 164B | — | 170B | 165B | 152B | 170B | 194B | 243B | 281B | 334B |
| ↳ YoY growth | +1.1% | -2.8% | -7.8% | +11.5% | +14.1% | +25.6% | +15.5% | +18.8% | ||
| ↳ 5y CAGR | +7.4% | +11.2% | +17.0% | |||||||
| Borrowings, current (JPY) | 61.9B | — | 91.7B | 105B | 92B | 81.6B | 117B | 96.1B | 101B | 135B |
| Borrowings, non-current (JPY) | 275B | — | 169B | 135B | 116B | 95.6B | 121B | 373B | 337B | 401B |
| Bonds payable (JPY) | 50B | — | — | — | — | — | — | — | — | — |
| Cash and deposits (JPY) | 54.8B | 58.1B | 31.7B | 27.9B | 30.8B | 42.5B | 75.6B | 97.6B | 136B | 107B |
| Intangible assets (JPY) | 144B | — | 46.6B | 42.1B | 36.5B | 36.1B | 37.2B | 73B | 72.5B | 126B |
| Net debt (borrowings + leases - cash) (JPY) | 276B | — | 229B | 212B | 177B | 135B | 163B | 372B | 302B | 428B |
| Cash flow detail | ||||||||||
| Operating cash flow (JPY) | 75.4B | 59.6B | 82.8B | 75.4B | 78.3B | 68.3B | 39.2B | 160B | 94.5B | 136B |
| Purchases of property, plant and equipment (JPY) | -30.7B | — | -45.4B | -49.5B | -30.8B | -35.9B | -54.4B | -58.3B | -77B | -112B |
| Purchases of intangible assets (JPY) | -1.35B | — | -1.33B | -675M | -481M | -370M | -514M | -473M | -825M | -658M |
| Change in receivables (cash effect) (JPY) | 4.39B | — | — | — | — | — | — | — | — | — |
| Change in inventories (cash effect) (JPY) | 6.4B | — | -15.3B | -4.45B | 7.57B | -33.1B | -47.7B | 31.6B | -12.3B | -2.88B |
| Change in payables (cash effect) (JPY) | -2.49B | — | — | — | — | — | — | — | — | — |
| Dividends paid (cash effect) (JPY) | -8.34B | — | -9.94B | -9.95B | -10.4B | -10.3B | -10.6B | -10.8B | -15.4B | -15.9B |
| Share buybacks (cash effect) (JPY) | -2M | — | -3M | -3M | -11M | 76M | 108M | -4M | -3.92B | -6.01B |
| Interest paid (cash effect) (JPY) | -2.7B | — | -3.15B | -2.76B | -2.75B | -2.16B | -2.89B | -6.16B | -5.49B | -8.35B |
| Income taxes paid (cash effect) (JPY) | -12.6B | — | — | — | — | — | — | — | — | — |
| Operating cash flow before change in receivables (JPY) | 71B | — | — | — | — | — | — | — | — | — |
| Free cash flow (OCF - PPE - intangibles) (JPY) | 43.3B | — | 36.1B | 25.2B | 47B | 32B | -15.7B | 101B | 16.7B | 23.3B |
| Income detail | ||||||||||
| Research and development expense (JPY) | 14.5B | — | — | 15B | 14.1B | 15.3B | 16B | 18B | 19.8B | 21.4B |
| ↳ 5y CAGR | +5.7% | +8.6% | ||||||||
| Total comprehensive income (JPY) | 21.1B | 44.6B | 5.18B | 56.4B | 7.22B | 122B | 101B | 137B | 175B | 161B |
| Comprehensive income to owners (JPY) | 22.9B | 49.6B | 4.52B | 55.3B | 6.95B | 120B | 99.6B | 136B | 174B | 160B |
| Provision for credit losses (JPY) | 1.09B | — | — | — | — | — | — | — | — | — |
| Credit cost ratio (credit losses / average receivables) (%) | 0.7% | — | — | — | — | — | — | — | — | — |
| Segments | ||||||||||
| ATG · Segment revenue (JPY) | — | — | 68.7B | 70.8B | 65.3B | 108B | — | — | — | — |
| ↳ YoY growth | +3.0% | -7.7% | +65.5% | |||||||
| MB Multiple Business · Segment revenue (JPY) | — | — | 118B | 119B | 98.6B | 84.6B | 96.4B | 102B | 105B | 106B |
| ↳ YoY growth | +1.3% | -17.5% | -14.2% | +14.0% | +5.8% | +3.3% | +0.3% | |||
| Tires · Segment revenue (JPY) | — | — | 457B | 453B | 401B | 479B | 756B | 876B | 982B | 1.12T |
| ↳ YoY growth | -0.7% | -11.6% | +19.4% | +57.9% | +16.0% | +12.1% | +14.3% | |||
| Reported | Mar 29, 2018 | Mar 29, 2018 | Mar 27, 2020 | Mar 27, 2020 | Mar 30, 2021 | Mar 30, 2022 | Mar 30, 2023 | Mar 28, 2024 | Mar 28, 2025 | Mar 25, 2026 |
Sign up to see institutional holdings
Sign UpPodcast Mentions
Sign up to see podcast mentions and sentiment
Sign UpFilings with EDINET (periodic reports, extraordinary reports, offerings, holding and buy-back reports), newest first, titles as filed in Japanese. The link opens the filing on EDINET. Press releases from the company's own website, newest first.
当社利用のメール配信サービスにおける個人情報漏洩について
Bull 0
Bear 2
Legal
2026年11月03日
- 経営関連
このたび、当社がニュースリリースなどのメール配信に利用している「アララメッセージ」を提供するアララ株式会社(以下、アララ社)において、第三者による不正アクセスが発生し、当社が取り扱う個人情報が漏洩したとの連絡を受けましたので、お知らせいたします。
当社は2026年10月28日、メール配信業務を委託している事業者よりアララ社の一部サーバーが不正アクセスを受けたと連絡を受けました。当初アララ社からは当社に関連する情報漏洩は確認されていないとの報告を受けておりましたが、その後11月3日に情報が漏洩したとの連絡を受けました。
漏洩した個人情報
当社の「ニュースリリース配信」および「ニュースメール配信」に登録いただいている会社名およびメールアドレス
当社の対応状況
不正アクセスの連絡を受けた10月28日よりニュースリリース配信およびニュースメール配信を停止しているほか、個人情報保護委員会への報告を実施しています。
今後の対応
当社では引き続き、アララ社と連携し事実関係の確認を進めてまいります。今後、公表すべき新たな事実が判明した場合には速やかにお知らせいたします。
対象となる皆様へのお願い
当社やアララ社等を装った不審なメールが送信される可能性があります。心当たりのないメールには十分にご注意いただき、メールの開封や記載されたURLなどのクリックは行わず、メールを削除していただきますようお願い申し上げます。
アララ社の発表情報
【重要】アララ メッセージのサービス停止および個人情報流出に関するお詫びとご報告
https://am.arara.com/info/news/

Copyright © THE YOKOHAMA RUBBER CO., LTD. All rights reserved.
タイヤ関連 横浜ゴムの「ADVAN Sport V107」が日産の新型「フェアレディZ」に新車装着
Bull 1
Bear 0
Order/contract

==============================================================================================

会社情報

株主・投資家の皆さまへ
サステナビリティ
ニュースリリース
横浜ゴムの「ADVAN Sport V107」が日産の新型「フェアレディZ」に新車装着
2026年10月27日
- タイヤ関連
横浜ゴム(株)は日産自動車(株)が2026年8月より日本でマイナーチェンジして発売した新型「フェアレディZ」の新車装着(OE)用タイヤとして「ADVAN Sport V107(アドバン・スポーツ・ブイ・イチマルナナ)」の納入を開始しました。装着サイズは245/45R18 100Wです。
「ADVAN Sport V107」は、横浜ゴムのグローバルフラッグシップタイヤブランド「ADVAN」シリーズのウルトラハイパフォーマンスタイヤ。プレミアムカーカテゴリーをターゲットに、運動性能、快適性、安全性を高次元でバランスしながら、ドライ・ウェット性能と操縦安定性を実現しています。今回新型「フェアレディZ」に納入するタイヤは高速域での操縦安定性、高い応答性、それらとは本来背反する乗り心地性能の両立を達成しています。
「フェアレディZ」は初代モデルから受け継がれるヘリテージデザインと、伝統と最新のテクノロジーを融合したスタイリングを特長とするほか、「フェアレディZ」ならではの走行性能が高く評価されています。今回のマイナーチェンジでは受け継いできたヘリテージをさらに深化させるとともに、性能向上を図りました。
横浜ゴムは2024年度から2026年度までの中期経営計画「Yokohama Transformation 2026(YX2026)」(ヨコハマ・トランスフォーメーション・ニーゼロニーロク)のタイヤ消費財戦略において高付加価値品比率の最大化を掲げています。その一環として、グローバルフラッグシップタイヤブランド「ADVAN」、SUV・ピックアップトラック用タイヤブランド「GEOLANDAR(ジオランダー)」の新車装着を推進しています。
※写真をクリックすると印刷用高解像度画像がダウンロードできます。
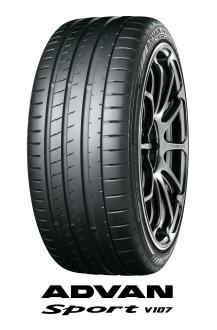
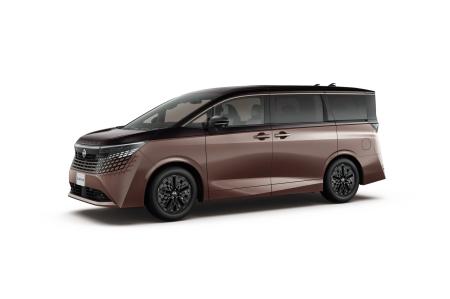
※画像は新型「フェアレディZ」の装着サイズとは異なります。(ホイールは純正装着品ではありません)
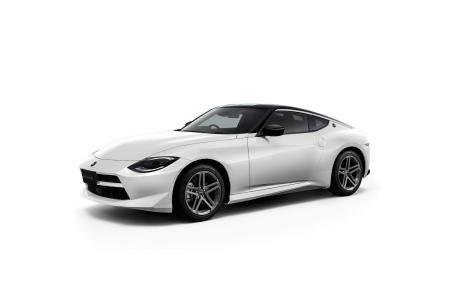
新型「フェアレディZ」※本画像は日産自動車(株)の許諾を受け掲載しております。本画像の他への転載、転用を一切禁止致します。
Copyright © THE YOKOHAMA RUBBER CO., LTD. All rights reserved.














Prompts
Click prompts to add them under the company line, click again to take one out, then copy the result into your AI chat. Shared by Asian Century Stocks and Uncovered Thai Stocks. Thank you.
The Yokohama Rubber Company, Limited (ticker 5101), listed in Japan.
Copied
ETFs Holding The Yokohama Rubber Company, Limited
Exchange-traded funds whose newest published daily portfolio holds one of the company's listings, largest weight first.
| ETF | Weight in ETF | Shares | Market value | As of |
|---|---|---|---|---|
| IVAL | 2.13% | 99,914 | $ 4.69M | Nov 18, 2026 |
| JPAN | 1.34% | 3,000 | $ 133.696K | Jun 30, 2026 |
| DFIV | 0.14% | 693,093 | $ 31.005M | Nov 12, 2026 |
| AVIV | 0.12% | 57,900 | $ 2.593M | Nov 16, 2026 |
| AVSD | 0.10% | 7,900 | $ 353.85K | Nov 16, 2026 |
| DXIV | 0.06% | 3,300 | $ 147.623K | Nov 12, 2026 |
| DFIC | 0.06% | 192,200 | $ 8.598M | Nov 12, 2026 |
| AVDE | 0.05% | 219,100 | $ 9.814M | Nov 16, 2026 |
| DFAX | 0.04% | 99,100 | $ 4.433M | Nov 12, 2026 |
| DFAI | 0.03% | 142,200 | $ 6.361M | Nov 12, 2026 |
| DIHP | 0.01% | 16,400 | $ 733.641K | Nov 12, 2026 |